1. Introduction
With the development of the offshore oil and gas fields, the long distance transportation of the untreated water bearing oil containing crude oil is key to the economic and efficient development of the offshore oil and gas fields. However, with the development of offshore oil and gas fields in the deep-sea and ultra deep-sea, the complex environment of deep-sea high pressure and the low temperature will cause frequent problems of submarine oil and gas mixed transportation pipeline. Among them, the formation and blockage by hydrates in the submarine pipeline is the focus in the study. Traditional methods of prevention and control mainly destroy hydrate formation by temperature, pressure, and other phase equilibrium conditions to completely inhibit hydrate formation, mainly including dehydration, heating, depressurization, and injection of thermodynamic inhibitors [
1,
2]. However, these conventional methods for inhibiting hydrate formation are costly or they reach their limit of action. Adding traditional hydrate inhibitors will bring the negative impact of environmental protection and cost [
3].
The key technology of deep-water hydrate technology as the flow assurance of risk control of hydrate slurry transportation, slurry flow calculation of the pressure drop is very important in engineering applications, and it is one of the most important topics in multiphase flow research field, and is an important basis of determining the flow pump system and related power equipment pipe and equipment design run time. As the fluid in the seabed pipe belongs to the oil-gas-water multiphase flow, and the existence of the hydrate particles, the complexity of the flow is more prominent. The researchers, starting with the study of the single phase of the hydrate slurry, gradually mastered the complex flow in the multiphase of the hydrate slurry. At present, no matter experimental or theoretical research, the research of hydrate flow resistance characteristics has achieved some research results [
4,
5], but there are still many microscopic mechanisms that still need to be explained.
Dholabhal [
6] was one of the early pioneers of hydrate slurry flow and gave a qualitative analysis of the effects of hydrate formation on fluid flow. Pauchard [
7], Peysson [
8], and Gainville [
9] conducted hydrate slurry flow experiments in the IFP-Lyon (The French oil and gas research center) multiphase flow loop to study the viscosity of hydrate slurry, the aggregation characteristics of hydrate solid particles, and the flow of friction, resistance coefficient and so on. Joshi [
10], Turner [
11], and Bexall [
12] studied hydrate slurry flow in the ExxonMobil, Delecase [
13] studied hydrate slurry flow in the Tulsa Flow Assurance Loop, Wang Wuchang, and Fan Shushi [
14] studied the hydrate slurry flow and the plugging experiments in the hydrated experimental circuit of the Guangzhou Institute of Energy Research, Chinese Academy of Sciences. The effects of different experimental conditions on the flow and plugging of hydrates were studied, and the conclusion was reached: high flow rate, low moisture content favor the flow of hydrates, and pressure drop was related to different factors.
Sinquin and other [
3] putted forward the calculation method of the scale distribution of hydrate particles, and obtained the distribution law of the particle size in the loop. Then, the pressure drop inside the tube was studied. It was found that, for the slurry turbulent flow, the formula for friction coefficient that was proposed by Nikuradse could be used to predict the pressure drop. P. Doron [
15] put forward the pressure and the flow regime prediction model of solid-liquid two-phase flow, the liquid-solid two-phase flow stress analysis, a two-layer model established pattern judgment model, and the critical sediment concentration distribution, velocity, bed height parameter calculation, model can be judged according to the accuracy of the hydrate slurry suspension flow and moving bed flow state. Rao Yongchao [
5] made a detailed review on the rheological properties of hydrate slurry rheological property law: the main types of Newton fluid and Bingham fluid and pseudoplastic fluid three, and the impact on the rheological properties of hydrate particle slurry review can be understood as the effect of low concentration of hydrate particles of rheological property was not, but with the hydrate concentration. Newton fluid began to transform to the Bingham fluid and the rheological behavior of slurry changes.
Sun Changyu [
16] and Yao Haiyuan [
17,
18] et al. focused on the problems of the pipeline transportation process to design technology that is encountered with the field application of new hydrate chemical inhibitors in offshore oil and gas fields. The diameter is 25.4 mm. On the 20 m length of horizontal transparent experiment ring road, for the first time in the field collection of offshore condensate oil and gas oil, water and gas in natural gas component configuration as experimental material, joining the domestic self-developed anti agglomerant of hydrate, the pressure drop experiment of hydrate slurry is carried out. The initial water content of the experiment was 5%, 15%, 20%, 25%, and 30%, respectively. The variation of the pressure drop parameters of the flow in the hydrate slurry under different experimental conditions was obtained. By analyzing the experimental results and by using the theory of liquid, solid two-phase flow, which is a method of calculating the pressure drop of the hydrates slurry pipe, is established. Based on the experimental data, this method can be used to calculate the pressure drop of the hydrate slurry flow in the actual pipeline. Wang and other [
19] studied the hydrate volume flow characteristics of CH
3CCl
2F hydrate slurry in 10–70%, the experimental results show that when the hydrate volume fraction reaches 30–40%, the pipeline resistance pressure began to show obvious change, therefore, the volume fraction is related to pipe flow safety. In the range of experiment, the Fanne coefficient of hydrate slurry is in 0.38–0.5. Peysson Y and other’s [
20] is also based on the IFP-Lyon experimental loop, observing the flow with a low liquid volume of light naphtha hydrate inhibitor in constant flow under the condition that the volume fraction of hydrate slurry is a constant. It can be assumed that the friction coefficient of quasi single phase of hydrate slurry flow is constant. According to the regression of experimental data, the friction coefficients of three moisture contents are 0.011 (10 wt %), 0.0105 (20 wt %), and 0.0130 (30 wt %), respectively, which are quite different from those that were calculated by Nikurade and Wood Colebrook. Li Wenqing [
21] had researched and analyzed the effect of particle size on the friction coefficient of gas hydrate slurry. The results show that when the water content is at 15–25%, the apparent diameter of the gas hydrate particles is 0.974 mm, and the friction coefficient is about 0.22. The research results provided an experimental basis of simulating the flow of natural gas hydrate slurry, and lay the foundation for designing and arranging the process of mixed pipeline correctly. Gong [
22,
23], Zhao Jiankui [
24], and Shi Bohui [
25] established a model that can describe gas hydrate slurry stratified flow based on gas-hydrate slurry two-phase flow of gas-liquid two-phase two-fluid theory. The coupling of thermodynamics and fluid dynamics can predict the liquid holdup and pressure drop under this flow condition. Zerpa [
26] and Rao [
27] established a slug flow model for gas-water system hydrates. The results showed that the slip between water and hydrate particles was the main cause of hydrate particle deposition, but due to differences between gas-water systems and gas-oil-water systems, the experimental results need further research. Tang [
28] et al. studied the pressure drop and the plugging regulation of hydrate slurry under different working conditions.
In the present work, a series of hydrates experiments were conducted in a spiral flow loop. The aim at this work was to describe the influence of spiral flow on hydrate formation process and hydrate slurry pressure drop. Firstly, the visualization experiment on the hydrate formation process was carried out to observe the formation properties. Furthermore, the influence of twist rate on hydrate slurry pressure was put forward. Finally, the pressure drop model of hydrate slurry in a spiral flow loop was established.
2. Experiments
2.1. Spiral Flow Loop
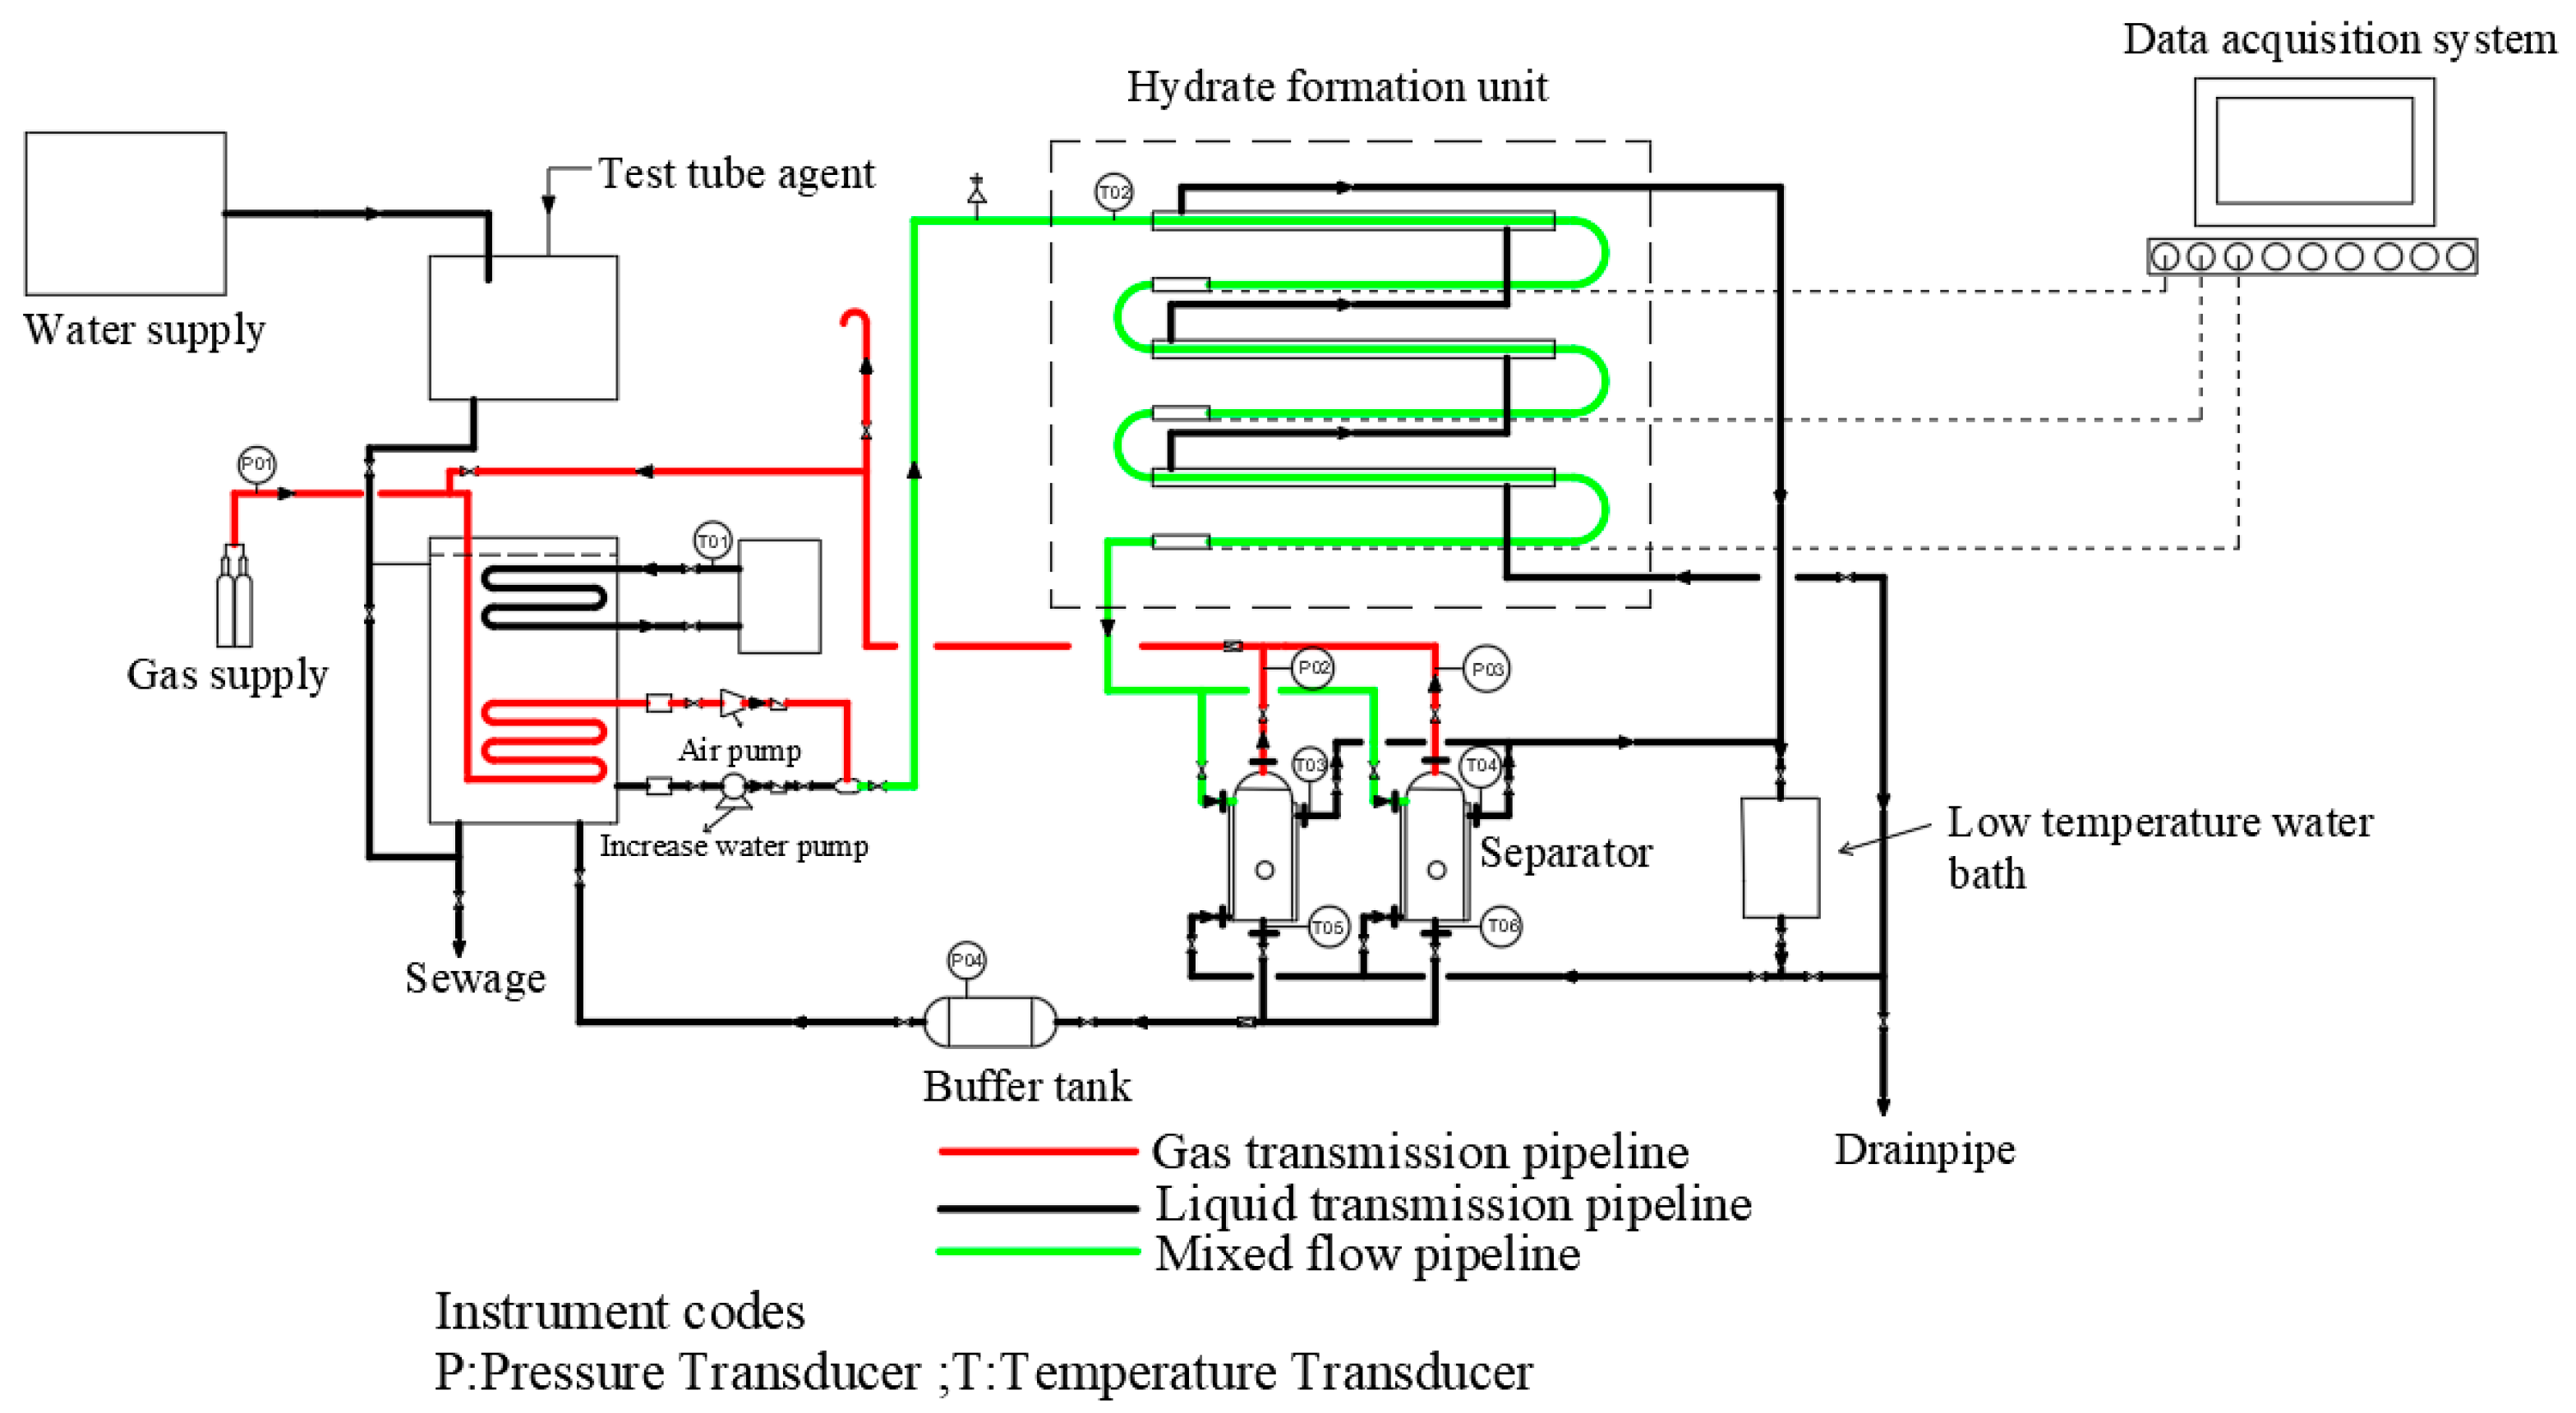
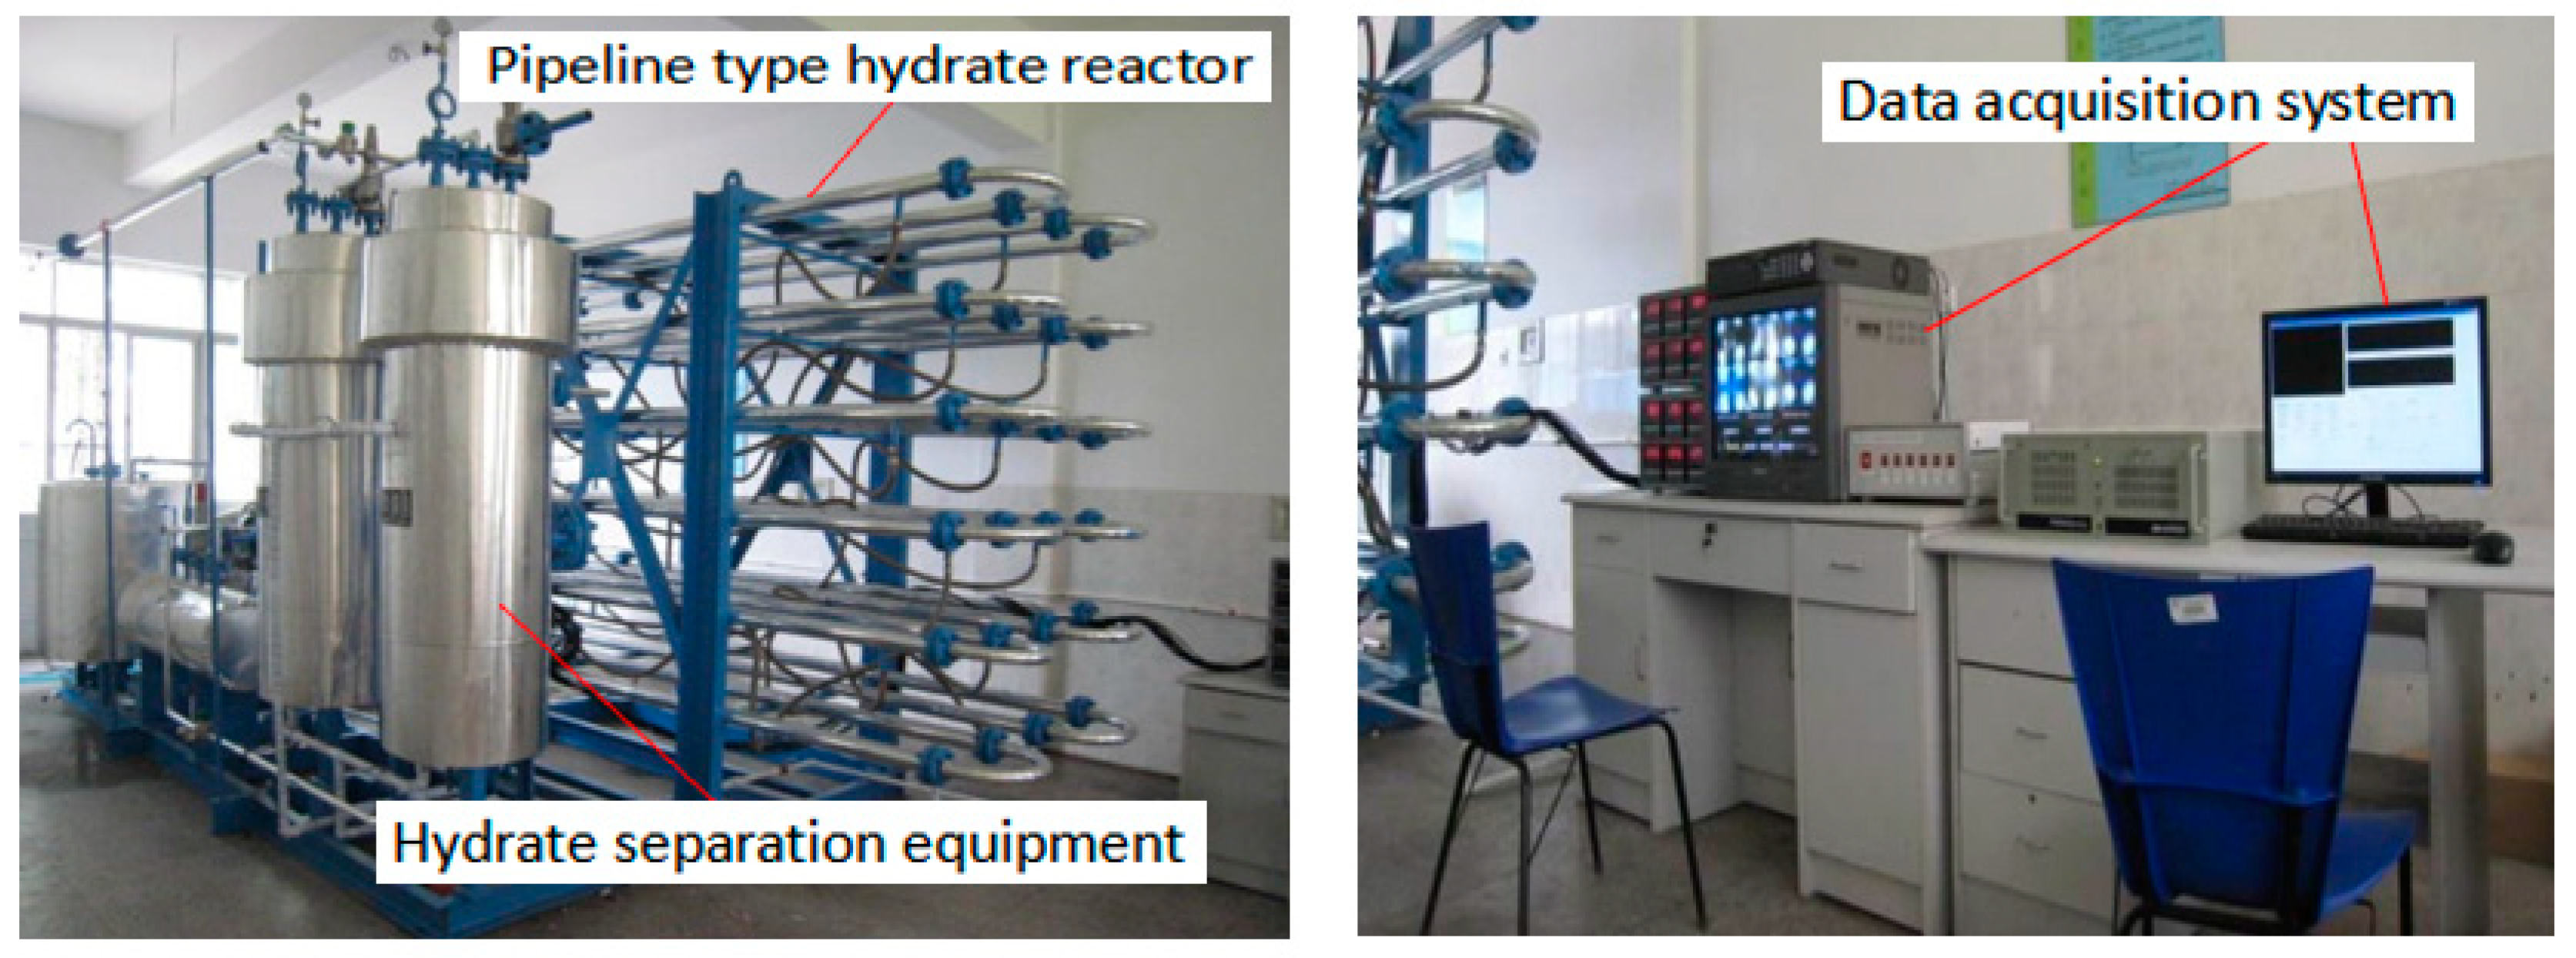
The experiments in this work are conducted in a spiral flow loop, which is constructed by the Jiangsu Key Laboratory of Oil-gas Storage and Transportation Technology. The loop is 97 m long and the internal diameter is 25 mm. The design pressure is 8 MPa and the design temperature ranges from −5 to 30 °C. The gas and liquid can be injected into the loop by a plunger compressor and a magnetic centrifugal pump, respectively. Flow parameters, such as pressure, temperature, flow rate, and pressure drop, can be collected by the sensors that are equipped on the loop. The hydrate formation unit is the core component of the hydrate spiral flow loop, and the sensors equipped are the core component of hydrate formation unit. The spiral flow loop is shown in
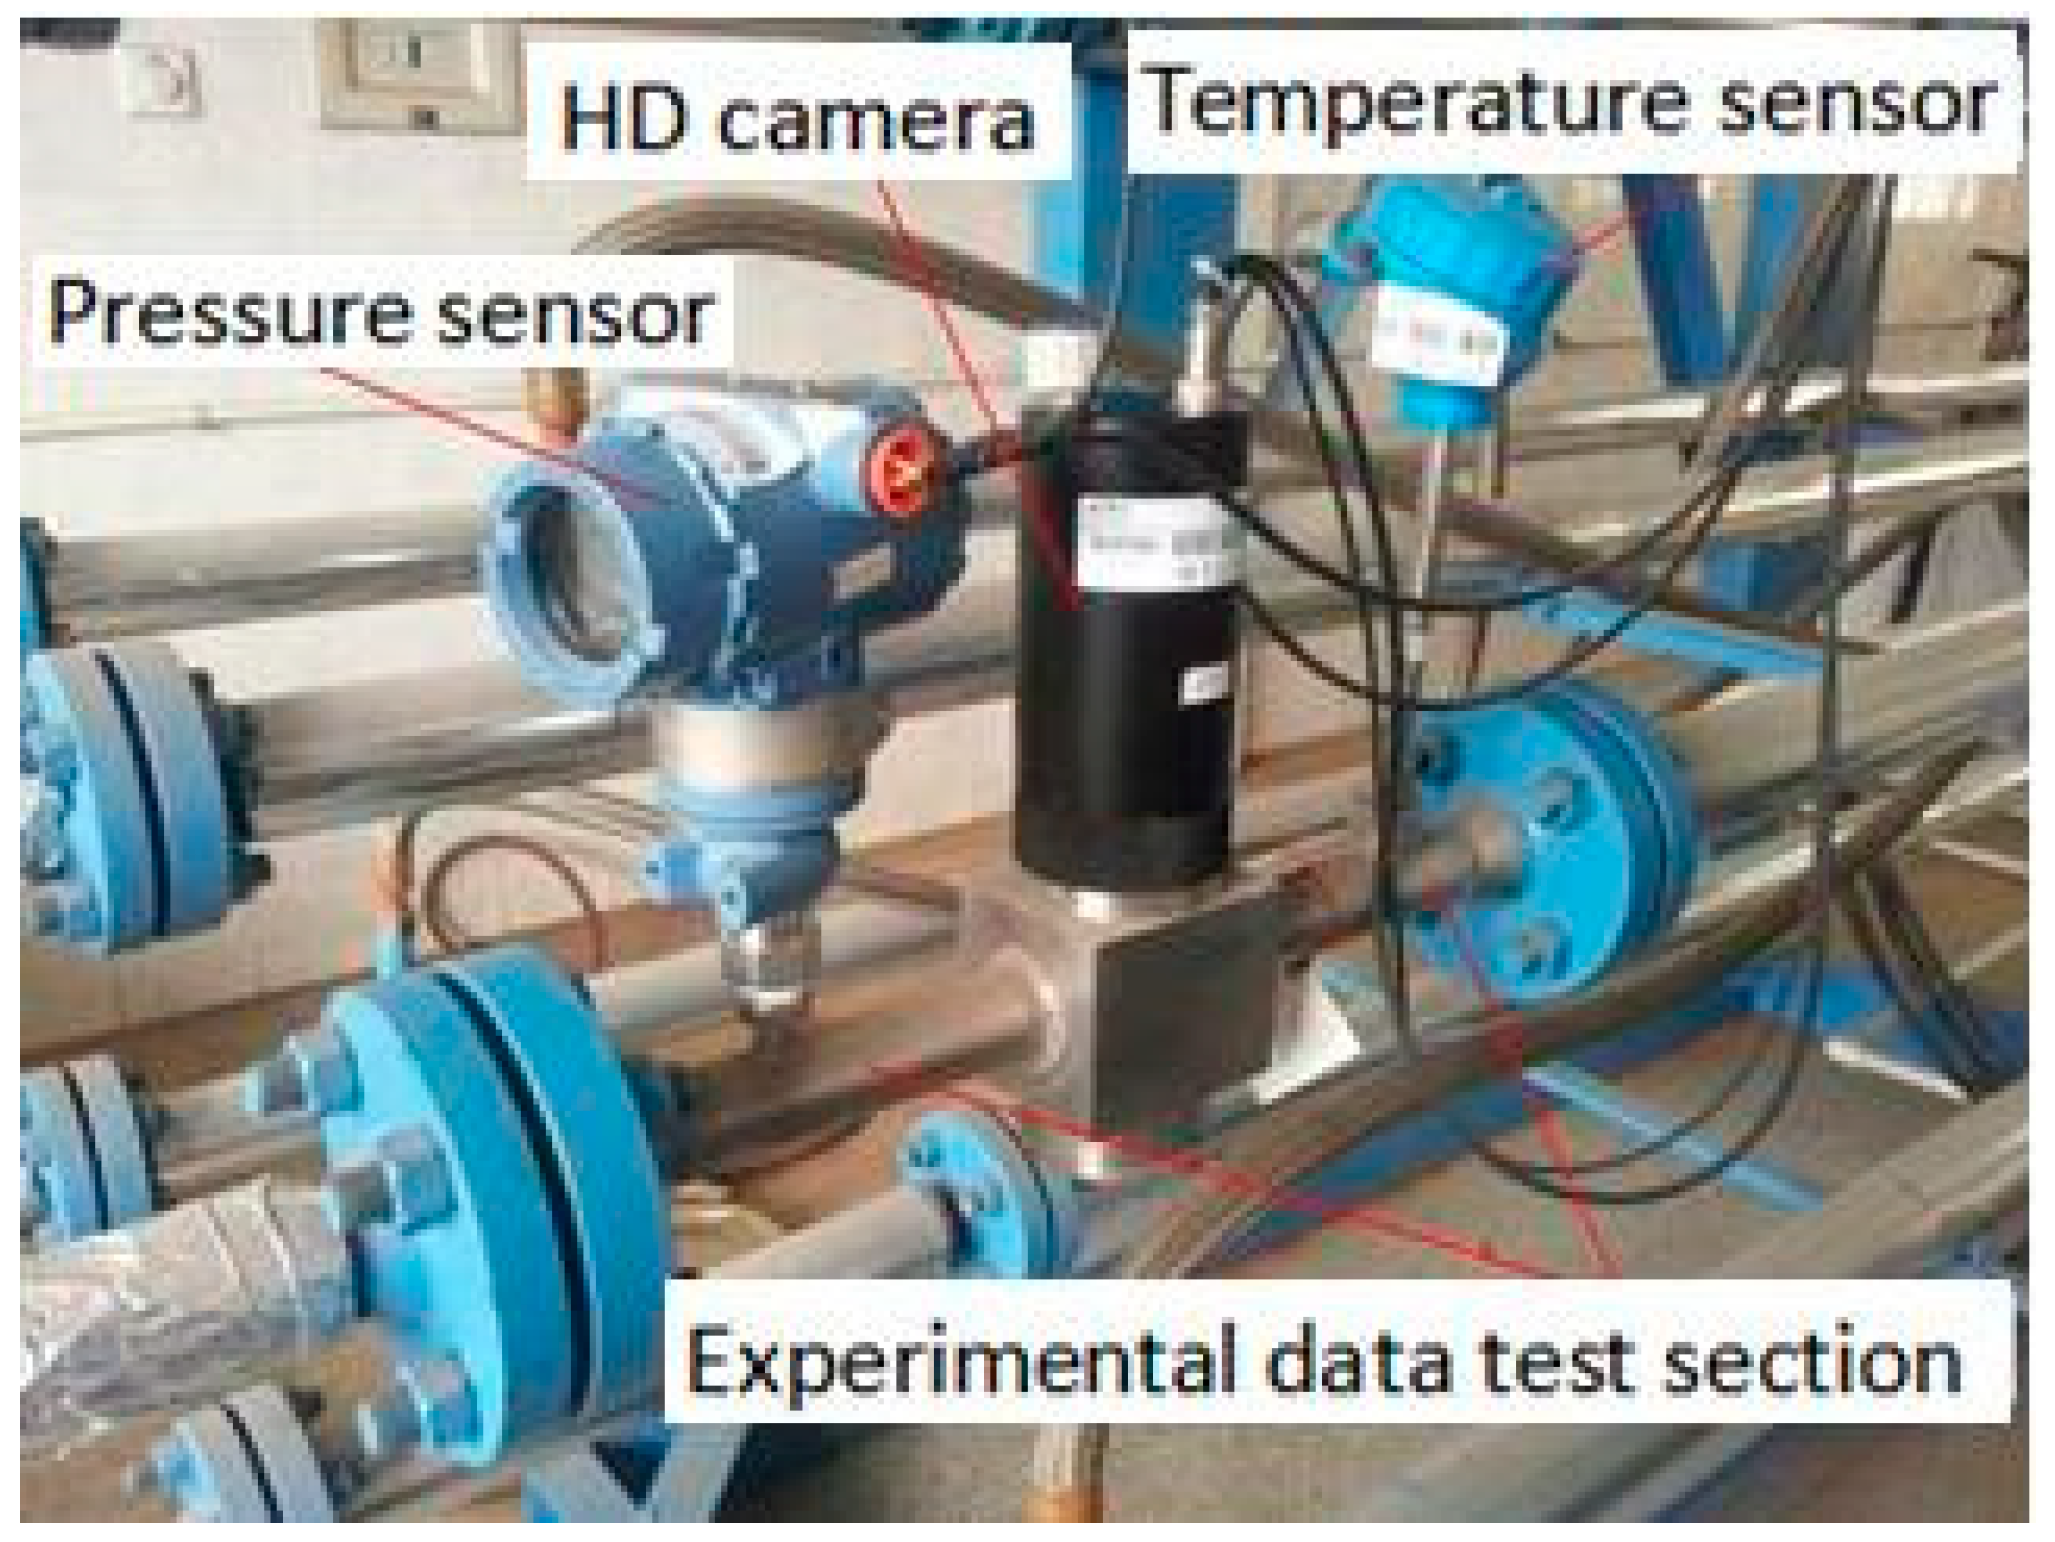
Figure 1, the sensors equipped are shown in
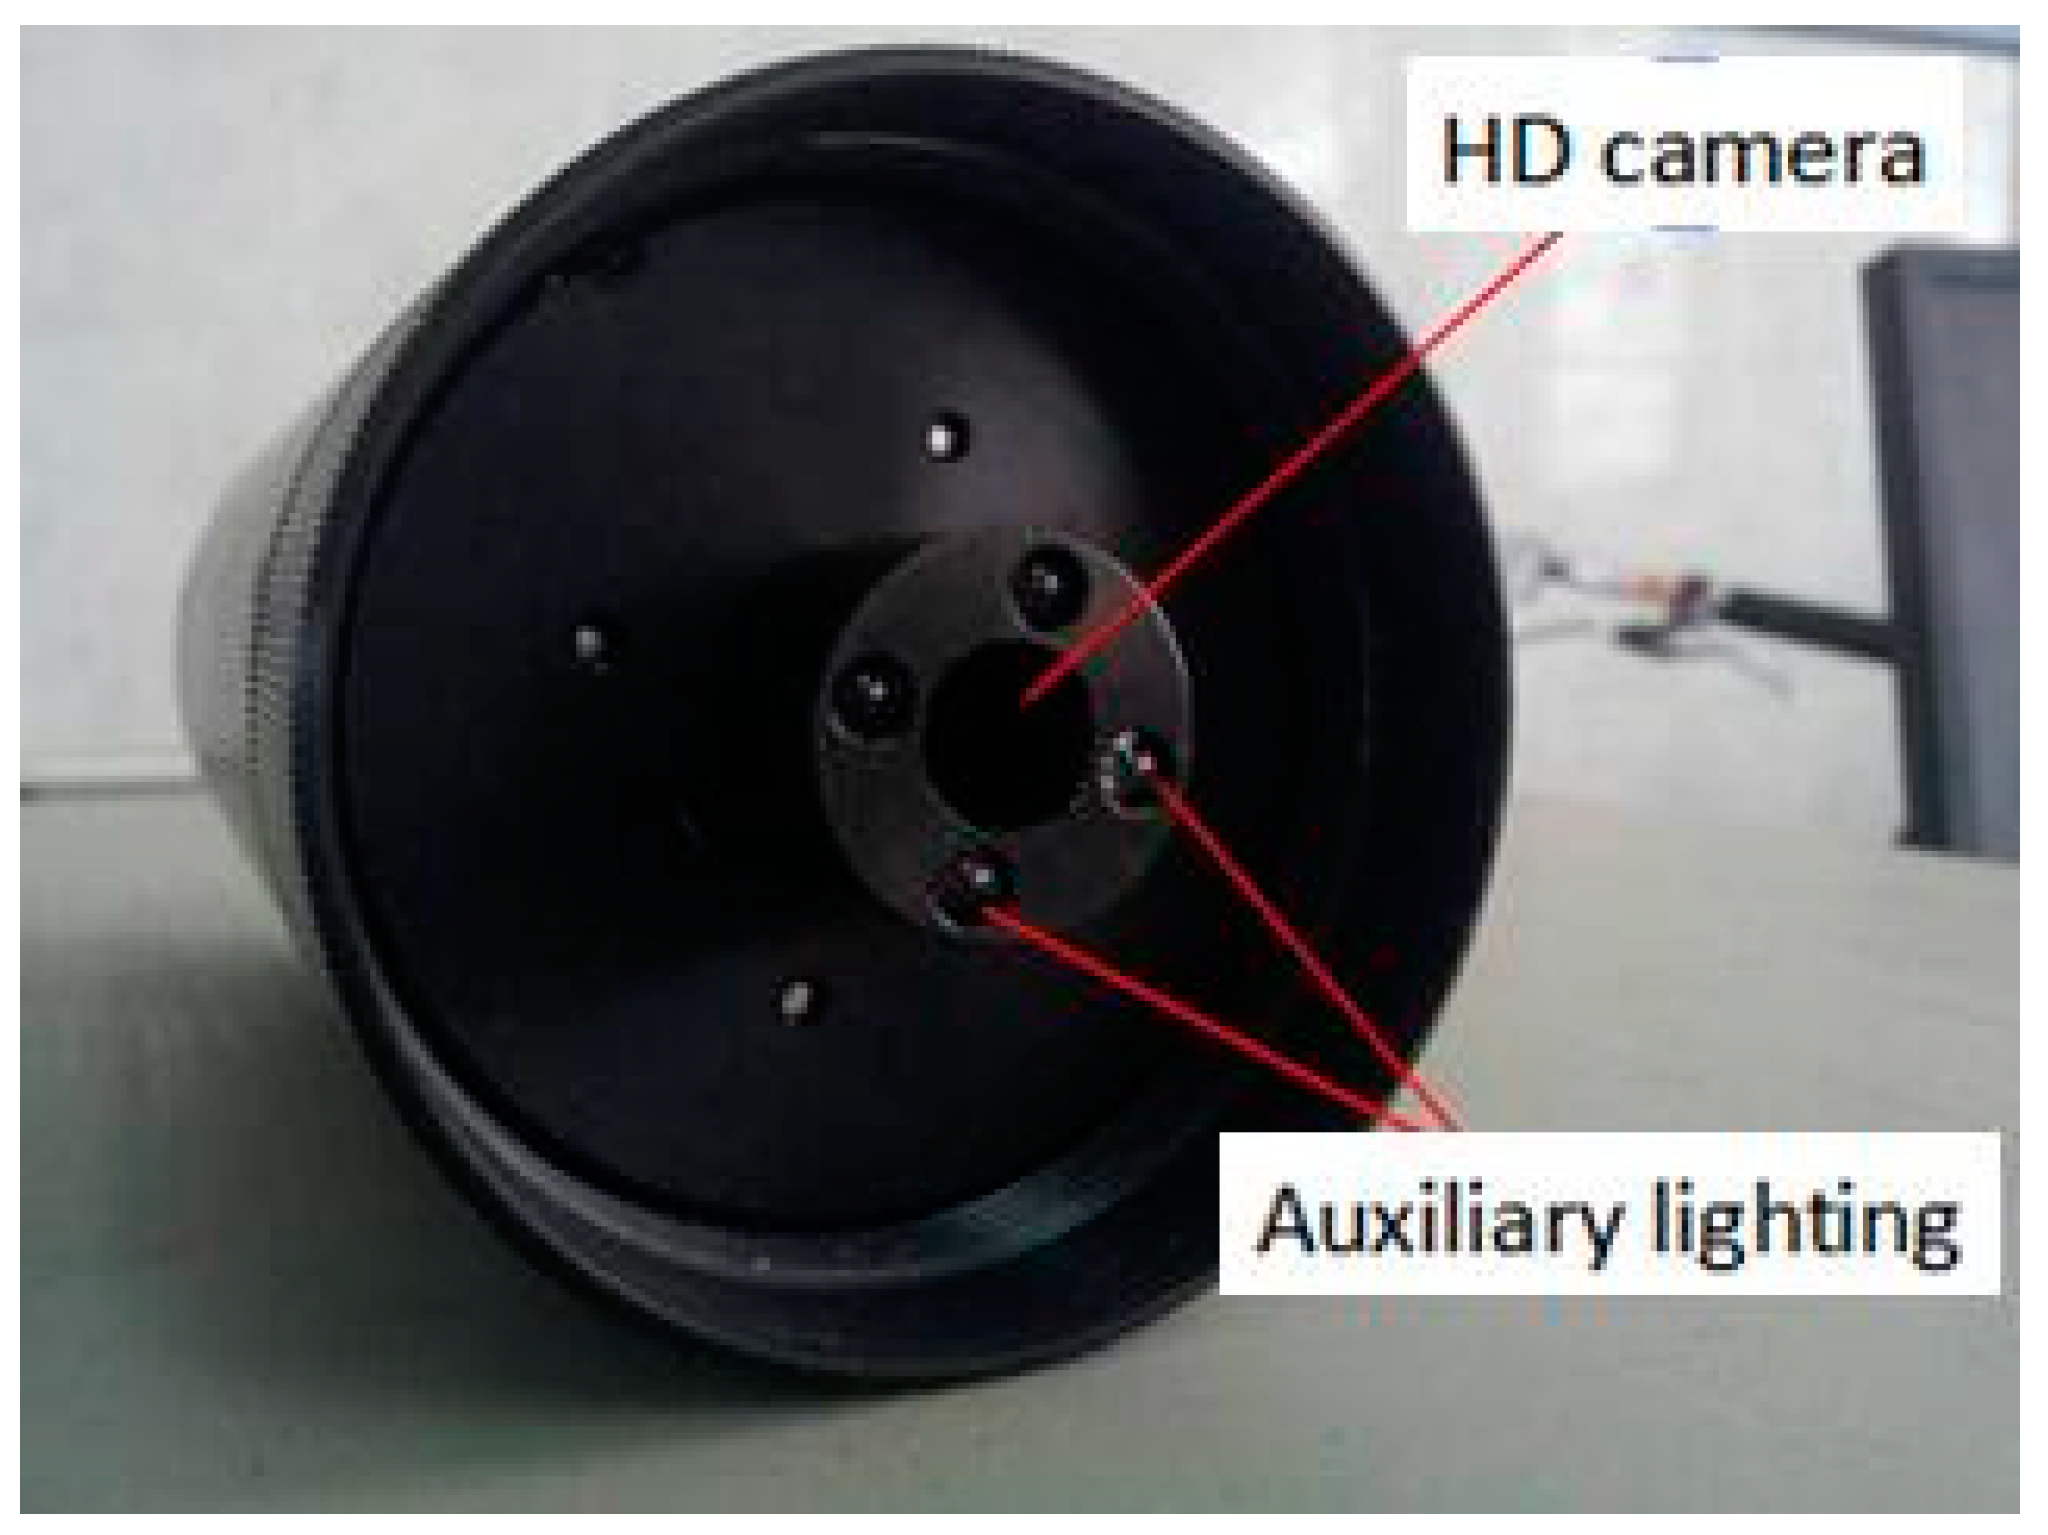
Figure 2, and the high-definition camera is shown in
Figure 3, and the Schematic diagram of the loop is shown in
Figure 4. There were six observation points, which were defined as VA1, VA2, VA3, VA4, VA5, and VA6, respectively. The six observation points and the data collection points in a spiral flow loop are distributed in unequal intervals. The origin of the pipeline is taken as the coordinate origin, and the coordinates of the various observation points and data collection points are shown in
Table 1.
2.2. Apparatus and Procedures
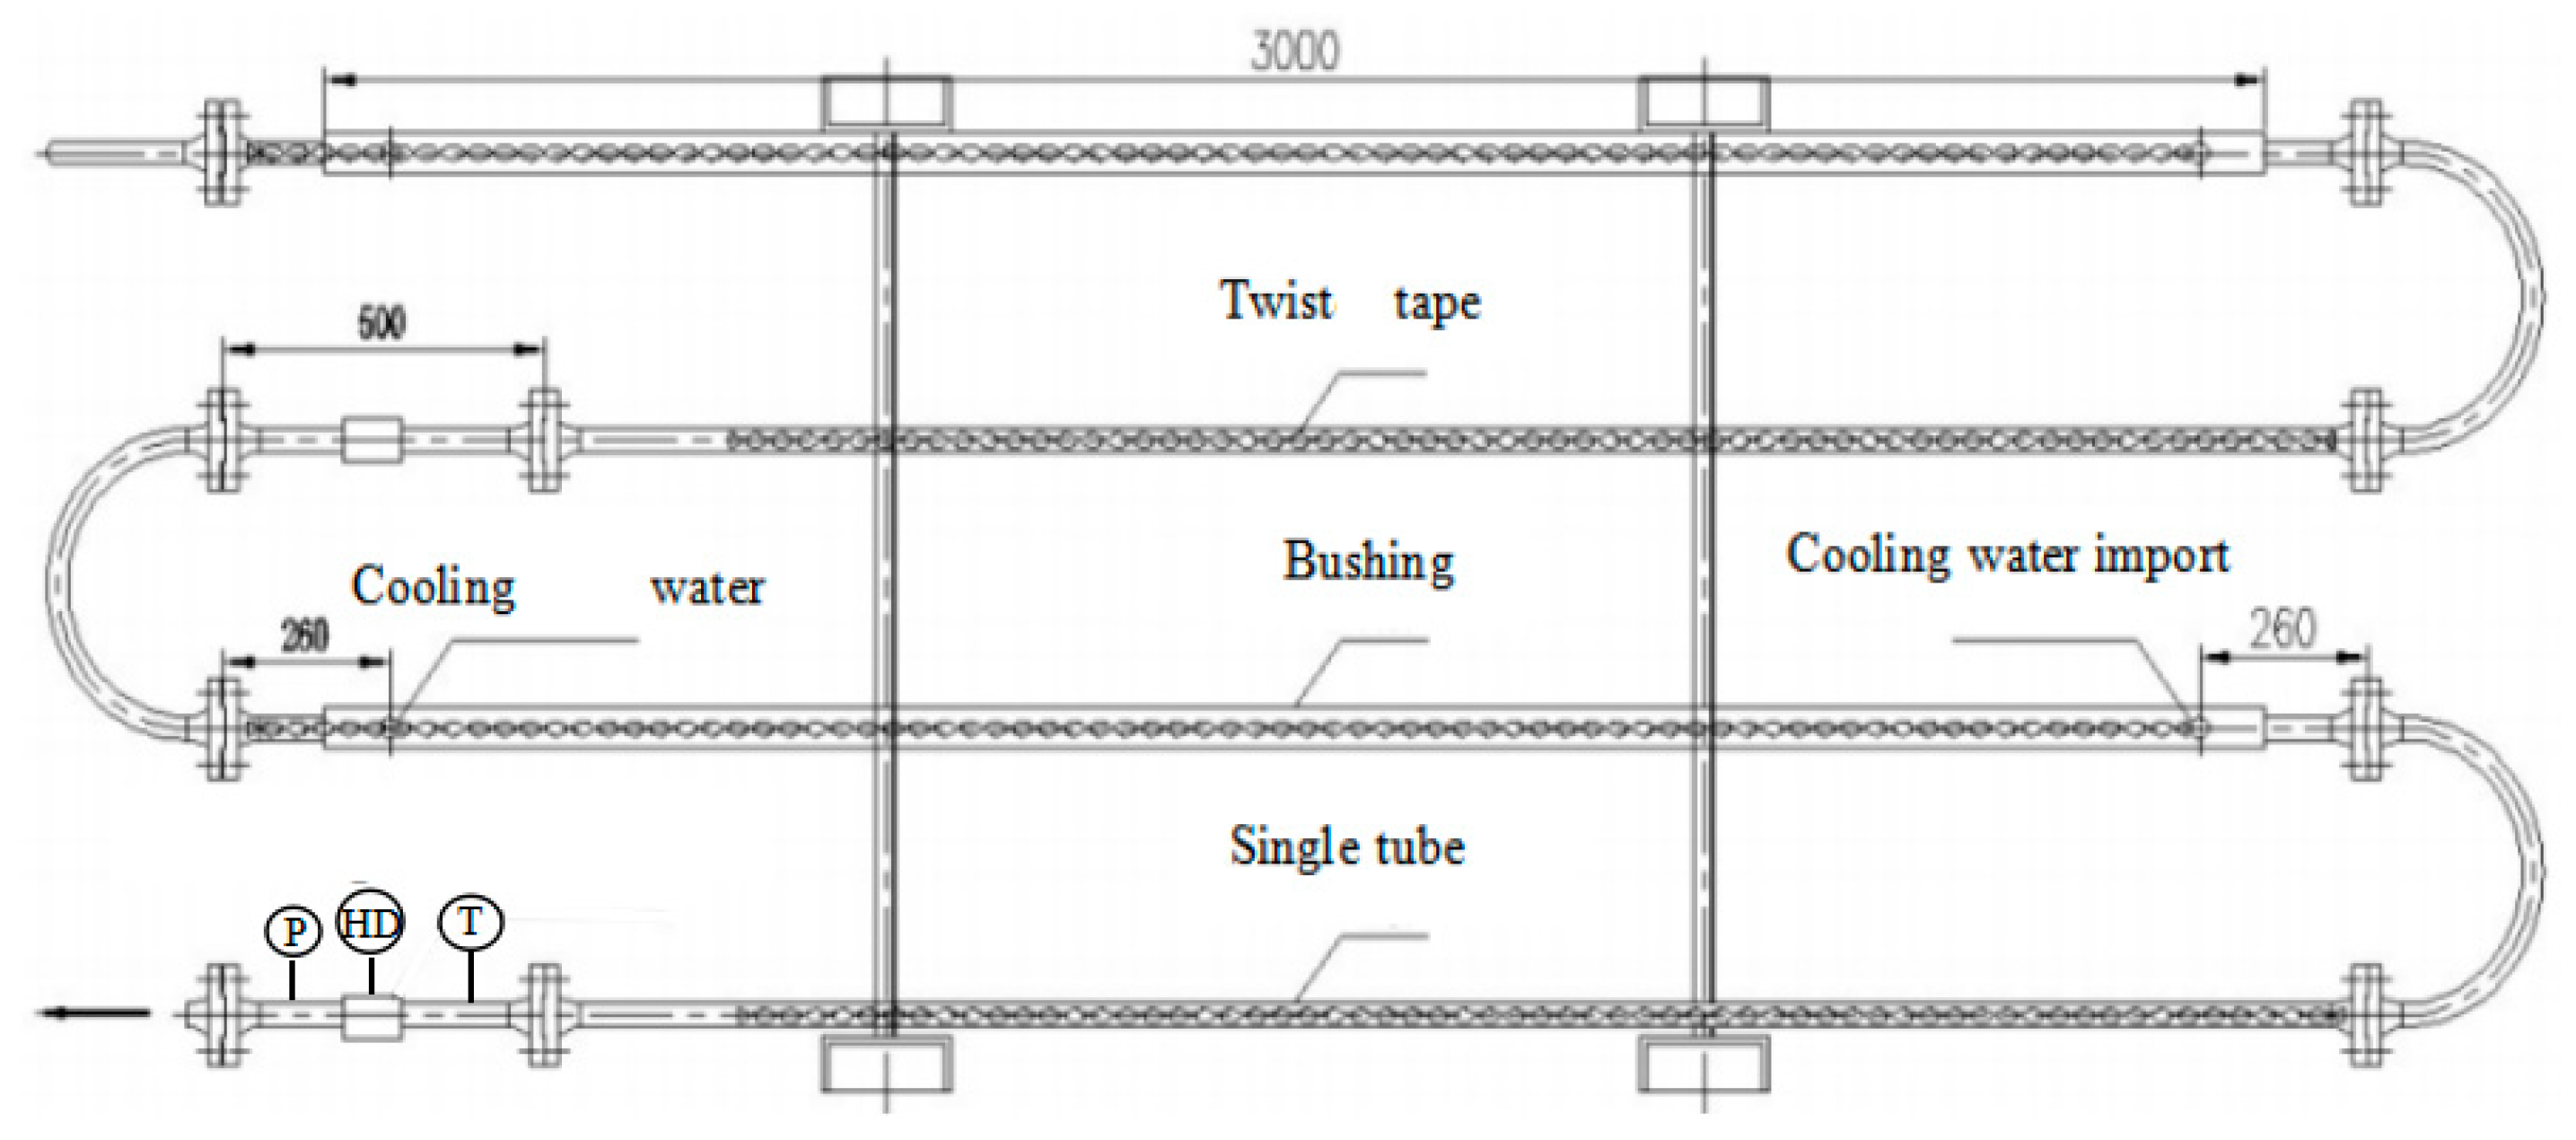
The hydrate formation unit was the core component of the hydrate spiral flow loop. It was the place of gas hydrate formation and flow. The schematic diagram of the hydrates formation unit was shown in
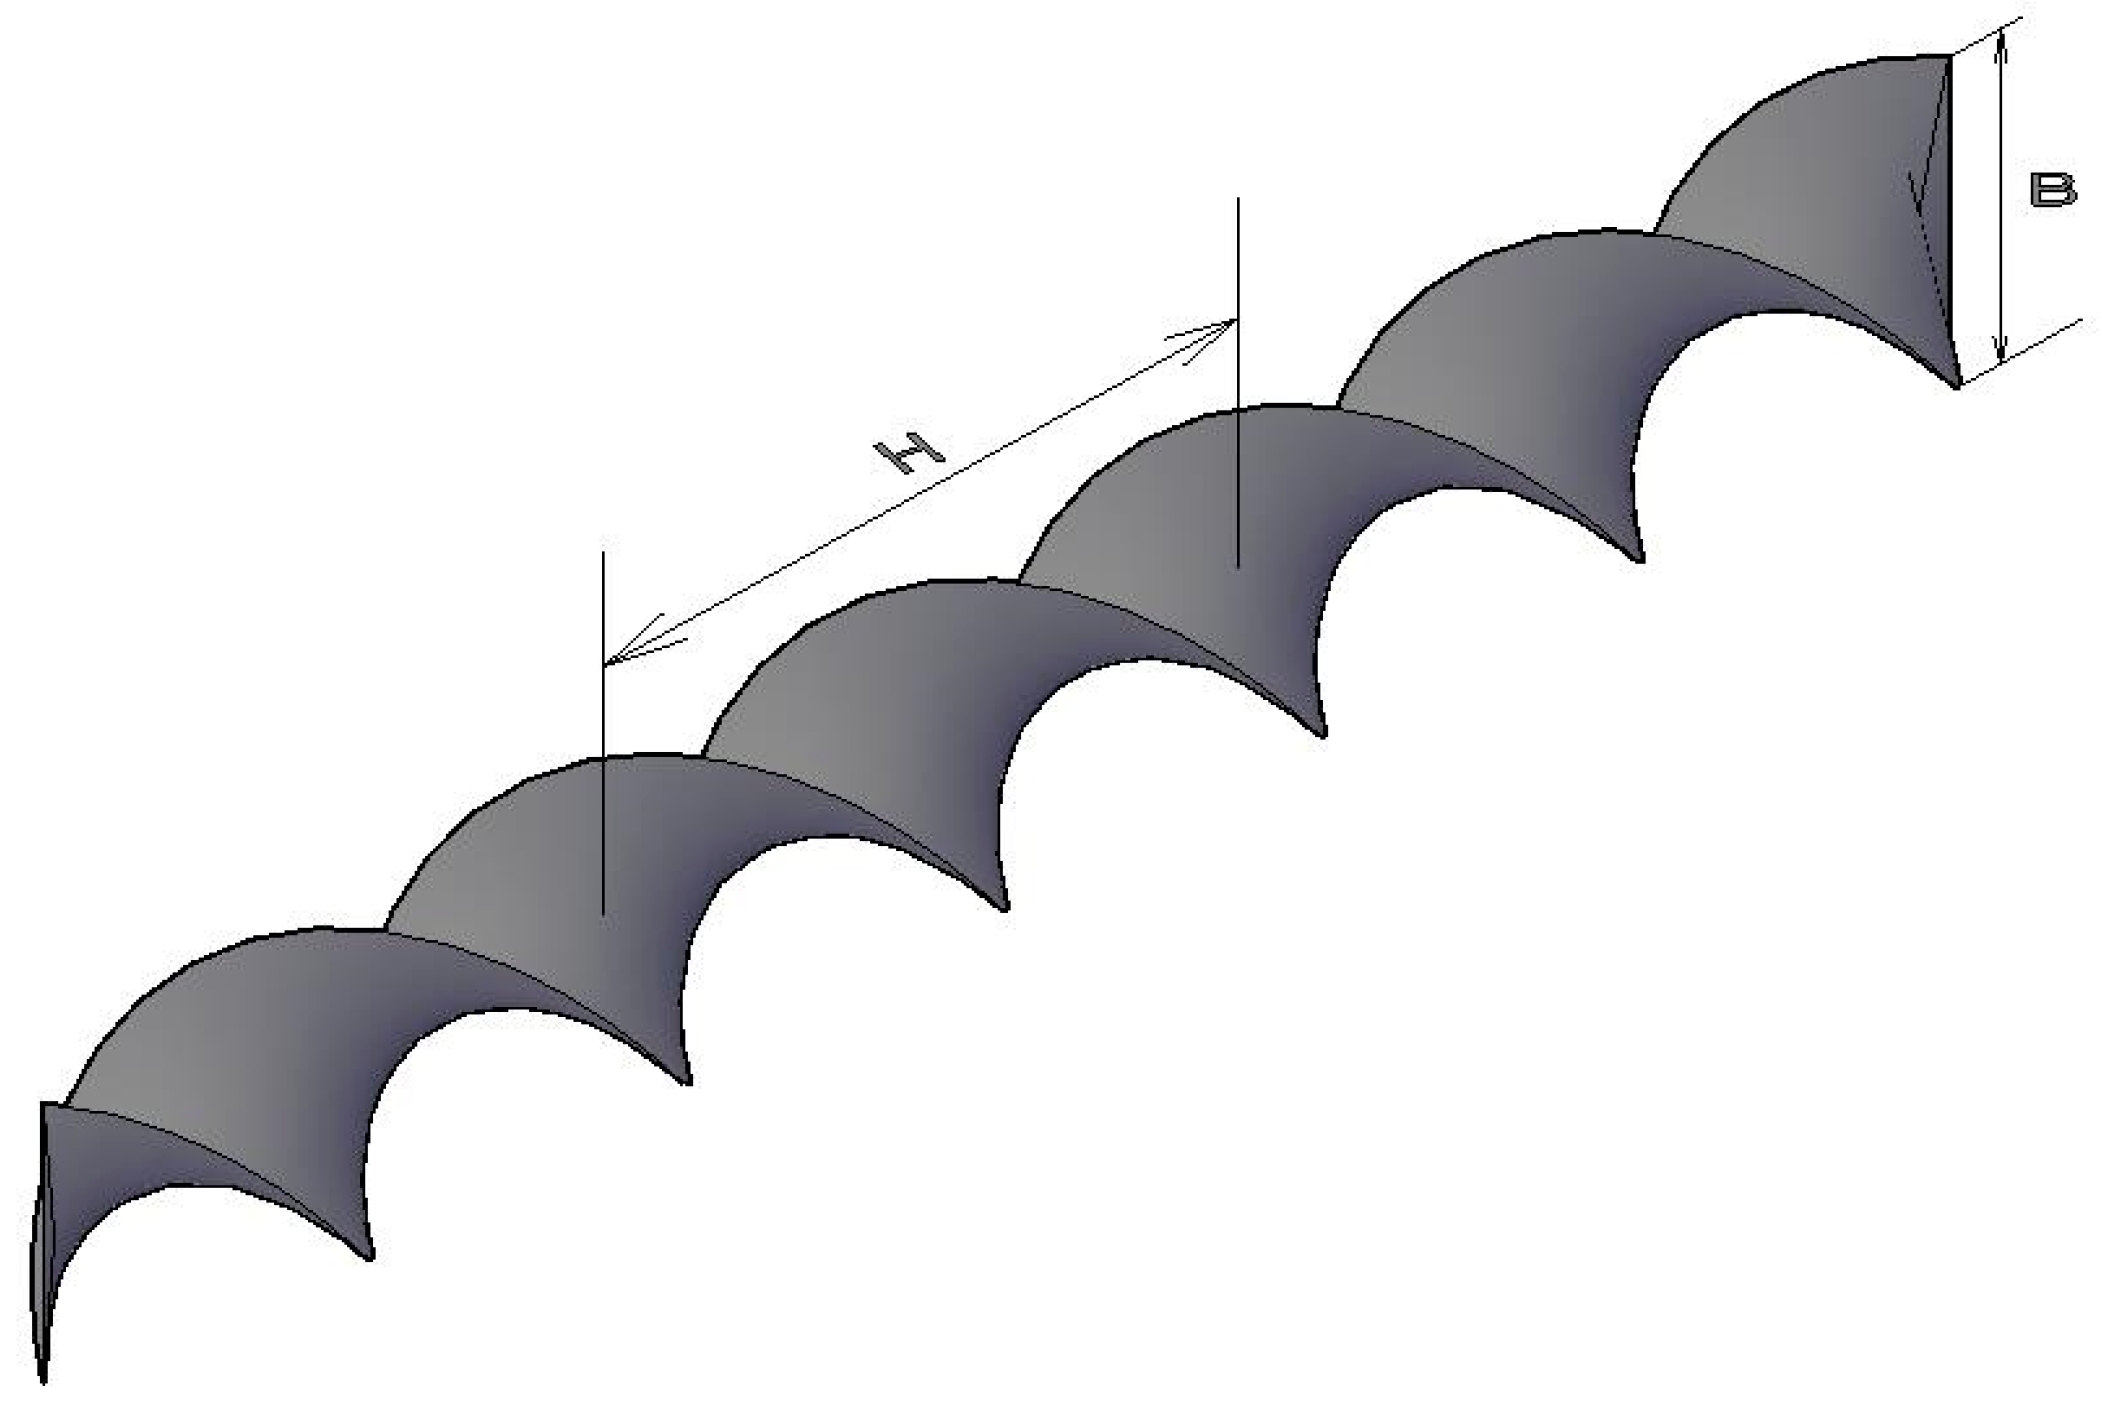
Figure 5. The gas hydrate formation loop was designed to be folded, consisting of 24 parallels folded pipes, each of which was 3 m. The design of gas hydrate experimental loop was a sleeve type structure, gas/water/gas hydrate mixture in a loop. The cool water jacket layer away from the low temperature cool water supply device was provided, and to control the temperature inside the loop, the loop insulation layer applied to avoid the loss of cool loop. The spiral flow was produced by the twist tape, which was shown in
Figure 6. In this experiment, three types of twist tapes were selected, and the
Y was 6.2, 7.4, and 8.8. The twist rate
Y is related to all pitch
H and twist tape width
B. The calculation formula of twist tape is as follows.
The monitoring and data acquisition system was mainly composed of high resolution monitor, cold light source, high pressure reactor precision controller, data acquisition card, digital hard disk video recorder, and so on. It was a miniature photoelectric detection system that can visualize real-time observation and record in the water environment with high pressure, low temperature, and narrow space structure. The visualization and quantitative simulation experiments of the state change and phase transition law in a spiral flow loop to enhance the hydrate formation can be realized.
The main technological parameters were as follows: (1) the initial pressure was from 3 to 6.5 MPa and the temperature was from 3.5 to 8.5 °C; (2) CO2 gas purity (mol) ≥ 99%; and, (3) the gas-liquid two-phase flow rate in the loop was from 10 to 90%. Six phenomena observations and data acquisition points were arranged in a spiral flow loop.
The experimental procedures: (1) Installed the twist tape and opened the low temperature cool water supply device, so that the temperature of hydrate formation and the temperature of transportation loop was controlled by cool water at 6.5–8.5 °C; (2) By controlling the gas flow, the CO2 gas entered the experimental loop at a steady flow velocity, so that the pressure in a spiral flow loop reached the predetermined value, and the continuous intake was maintained; (3) When the inlet volume of the loop reached the requirement, the liquid was released. By controlling the liquid flow, the liquid entered the hydrate formation loop at a constant flow rate and the spiral diffusion flow pattern was induced by the twisting zone. When the pressure in the hydrate formation loop reached the predetermined value, the continuous liquid intake was maintained; (4) The pressure in the hydrate formation loop reached the predetermined value. Under the condition of keeping continuous air intake and liquid injection, the formation and flow of CO2 hydrate in the loop was obtained by connecting hard disk display to the camera, and the temperature and pressure that were collected from each phenomenon observation and the data acquisition point were recorded. Then starting the computer monitoring system to search for CO2 hydrate induction time; (5) After the end of the experiment, in order to close the gas bottle valve, gas booster pump, liquid booster pump, air compressor, cool water circulation device, observation, and data acquisition device. The data of CO2 hydrate formation and flow process, such as video, temperature, and pressure, were collected and analyzed.
3. Results and Discussion
3.1. Hydrate Formation Process
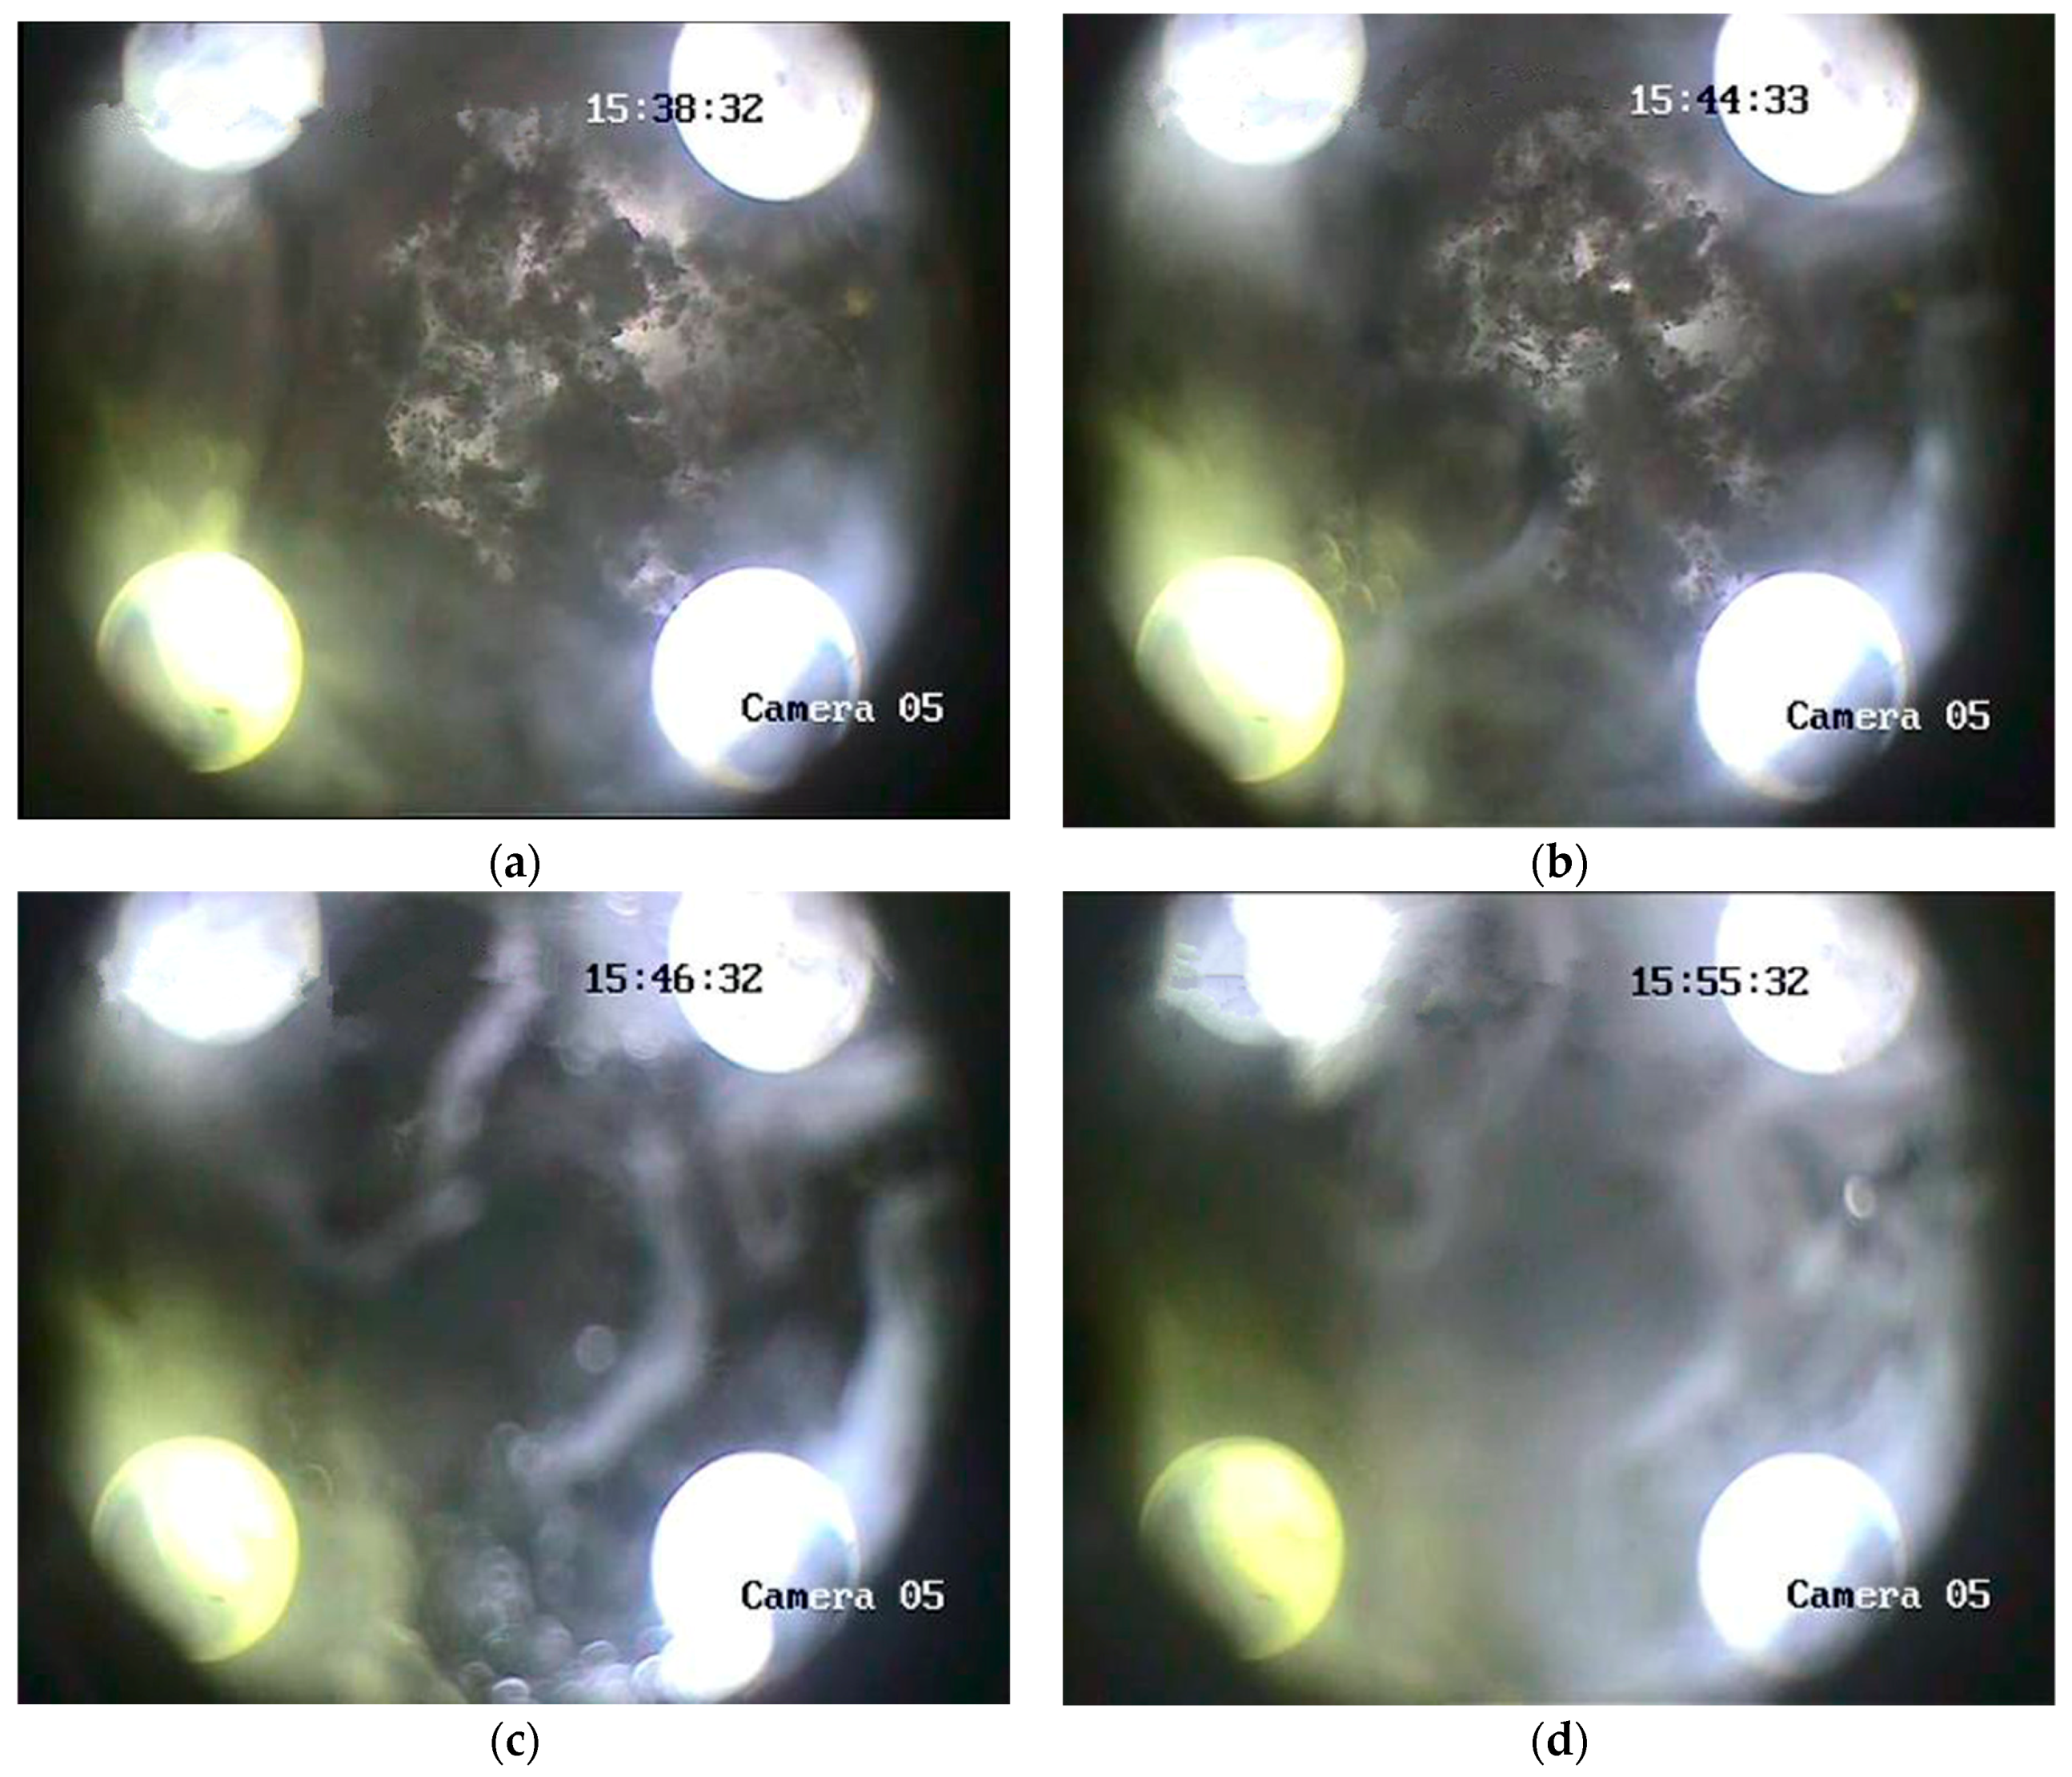
The camera that was installed on the hydrate formation loop transfers the immediate phenomenon of hydrate formation in the loop to the hard disk video recorder for video recording. At the same time, the immediate phenomenon of hydrate formation was displayed on the computer terminal display. There were observation points in the loop. The hydrate formation properties were described by the experimental phenomena of 5# window, and the hydrate formation process was shown in
Figure 7.
With the reaction, there were clumps of crystals in a spiral loop, and the light transmittance gradually decreased. Then, the clumps of crystals increased gradually, and the nucleation formation period finished. Subsequently, with the continuous coalescence of the nucleus, milky white cloud hydrates appeared in the loop, and as the reaction progressed, the white cloud hydrates gradually spread to the whole loop, and the hydrate formation finished.
3.2. Pressure
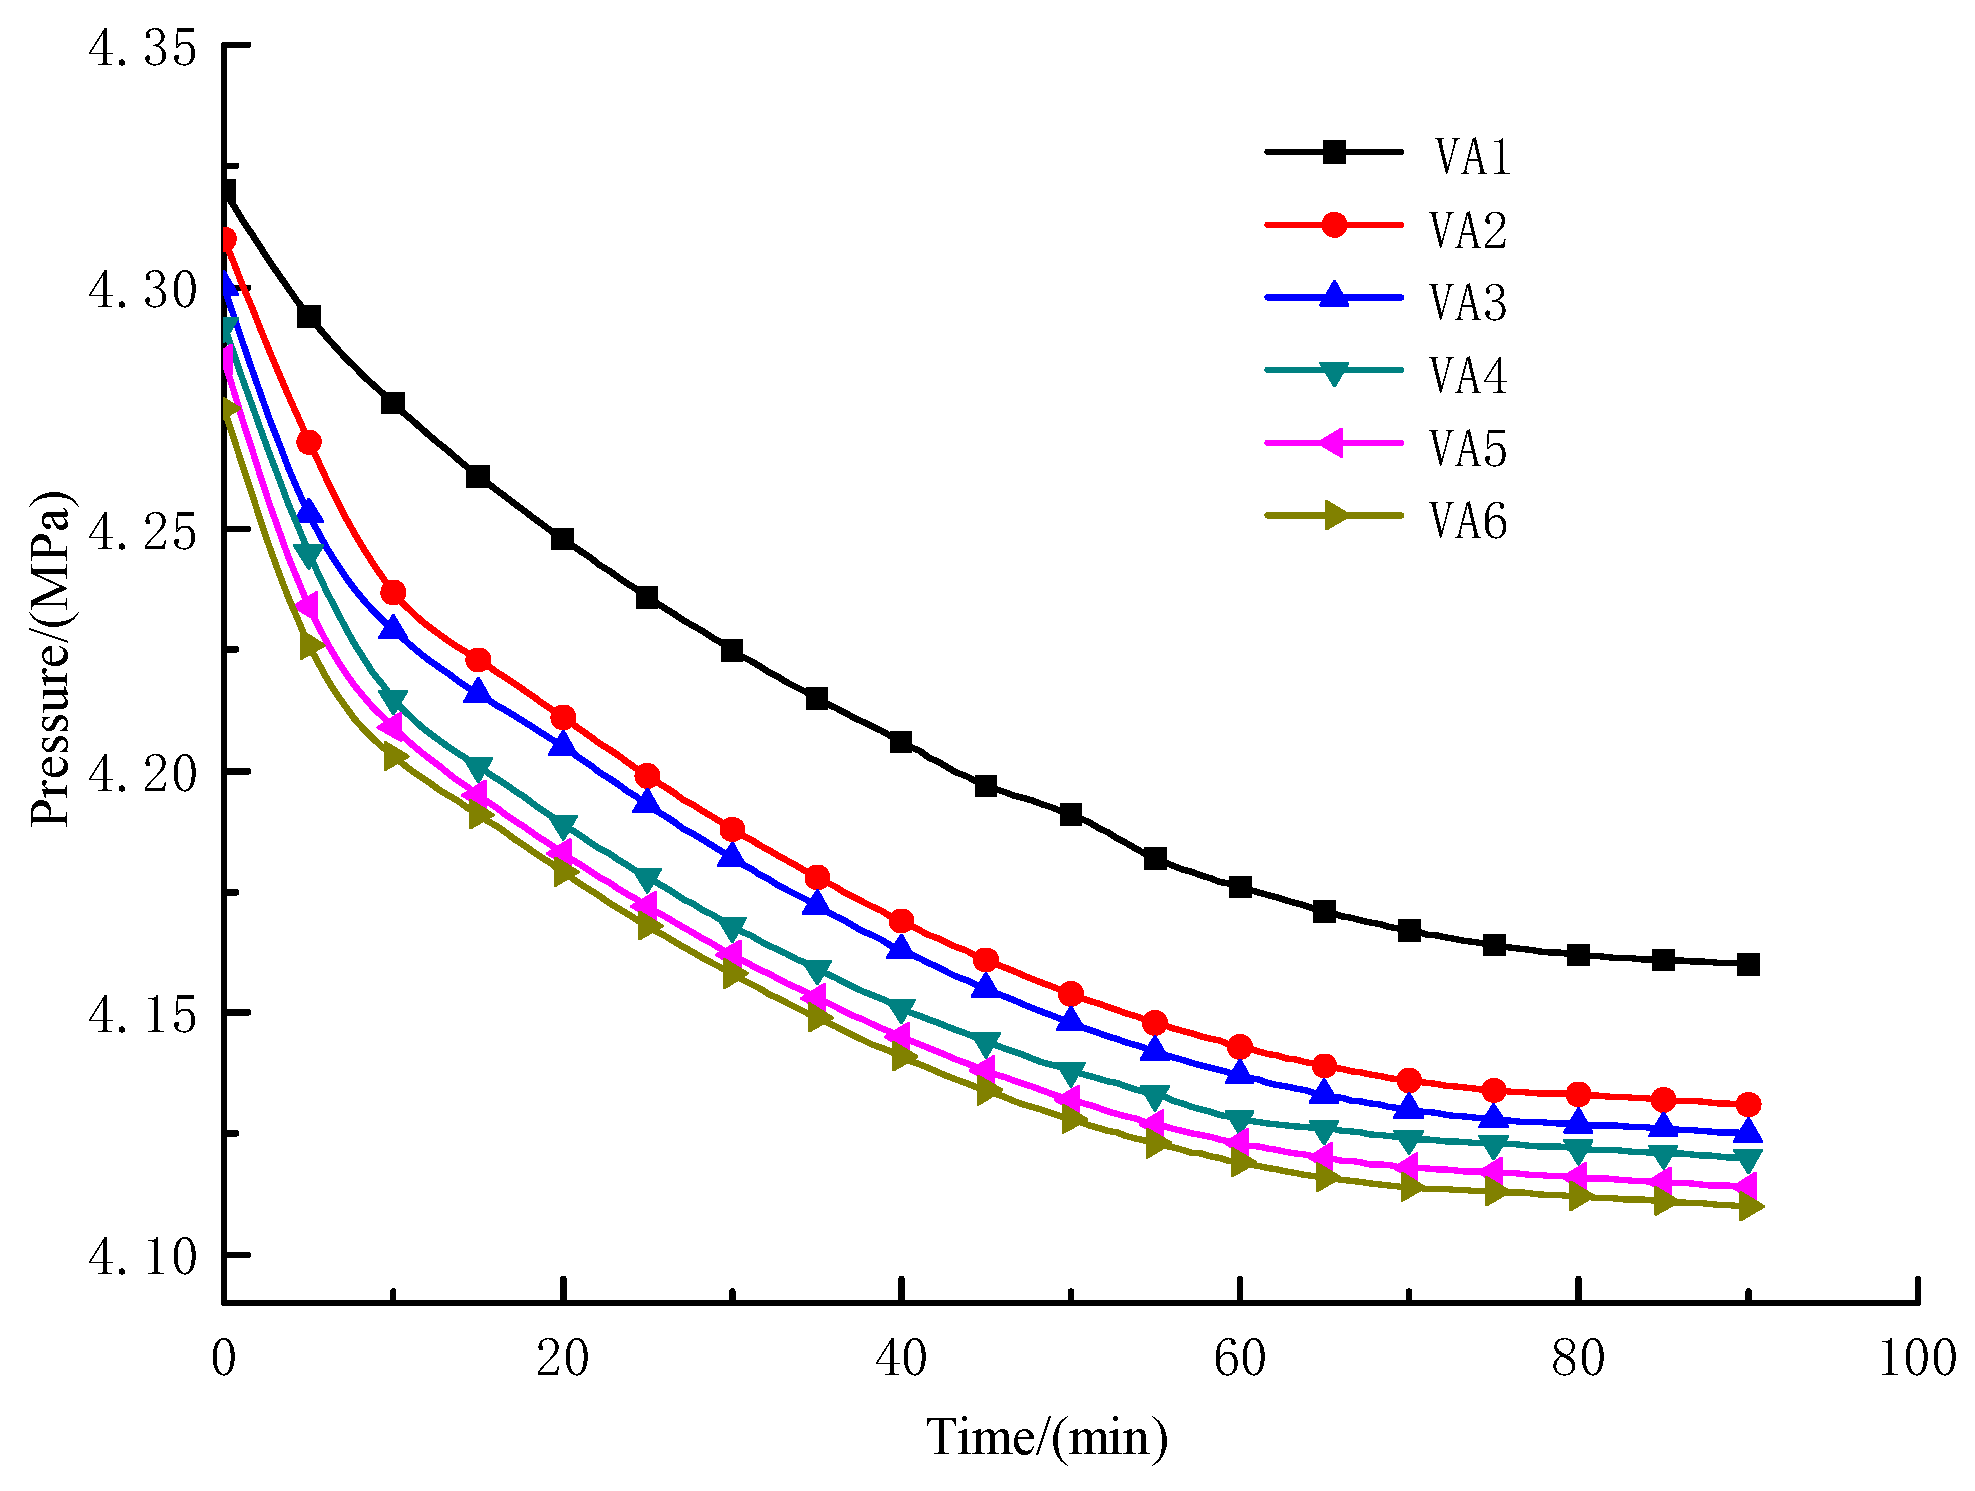
During gas hydrates forming processes, the pressure was obtained by six pressure sensors that were installed in the loop, which was shown in
Figure 8. As shown in
Figure 8, in the whole reaction process, the pressure drop in the loop showed the following characteristics: (1) The change trend of the pressure that was collected by each observation point is basically the same; (2) The pressure in the loop will drop rapidly after the injection was finished, because a large amount of CO
2 gas was dissolved in the liquid phase, and the process lasted about 10 min; (3) After the dissolution of CO
2 gas, the pressure drop in the loop slowed down, but after a certain period of time, the pressure that was collected at each observation point would drop suddenly, and there was a large amount of hydrate formation; (4) After the formation of CO
2 hydrate, the pressure drop in the loop was more slowly, and the pressure in the loop tended to be stable, and the formation of CO
2 hydrate was over.
3.3. Effect of Twist Rate on Pressure Drop
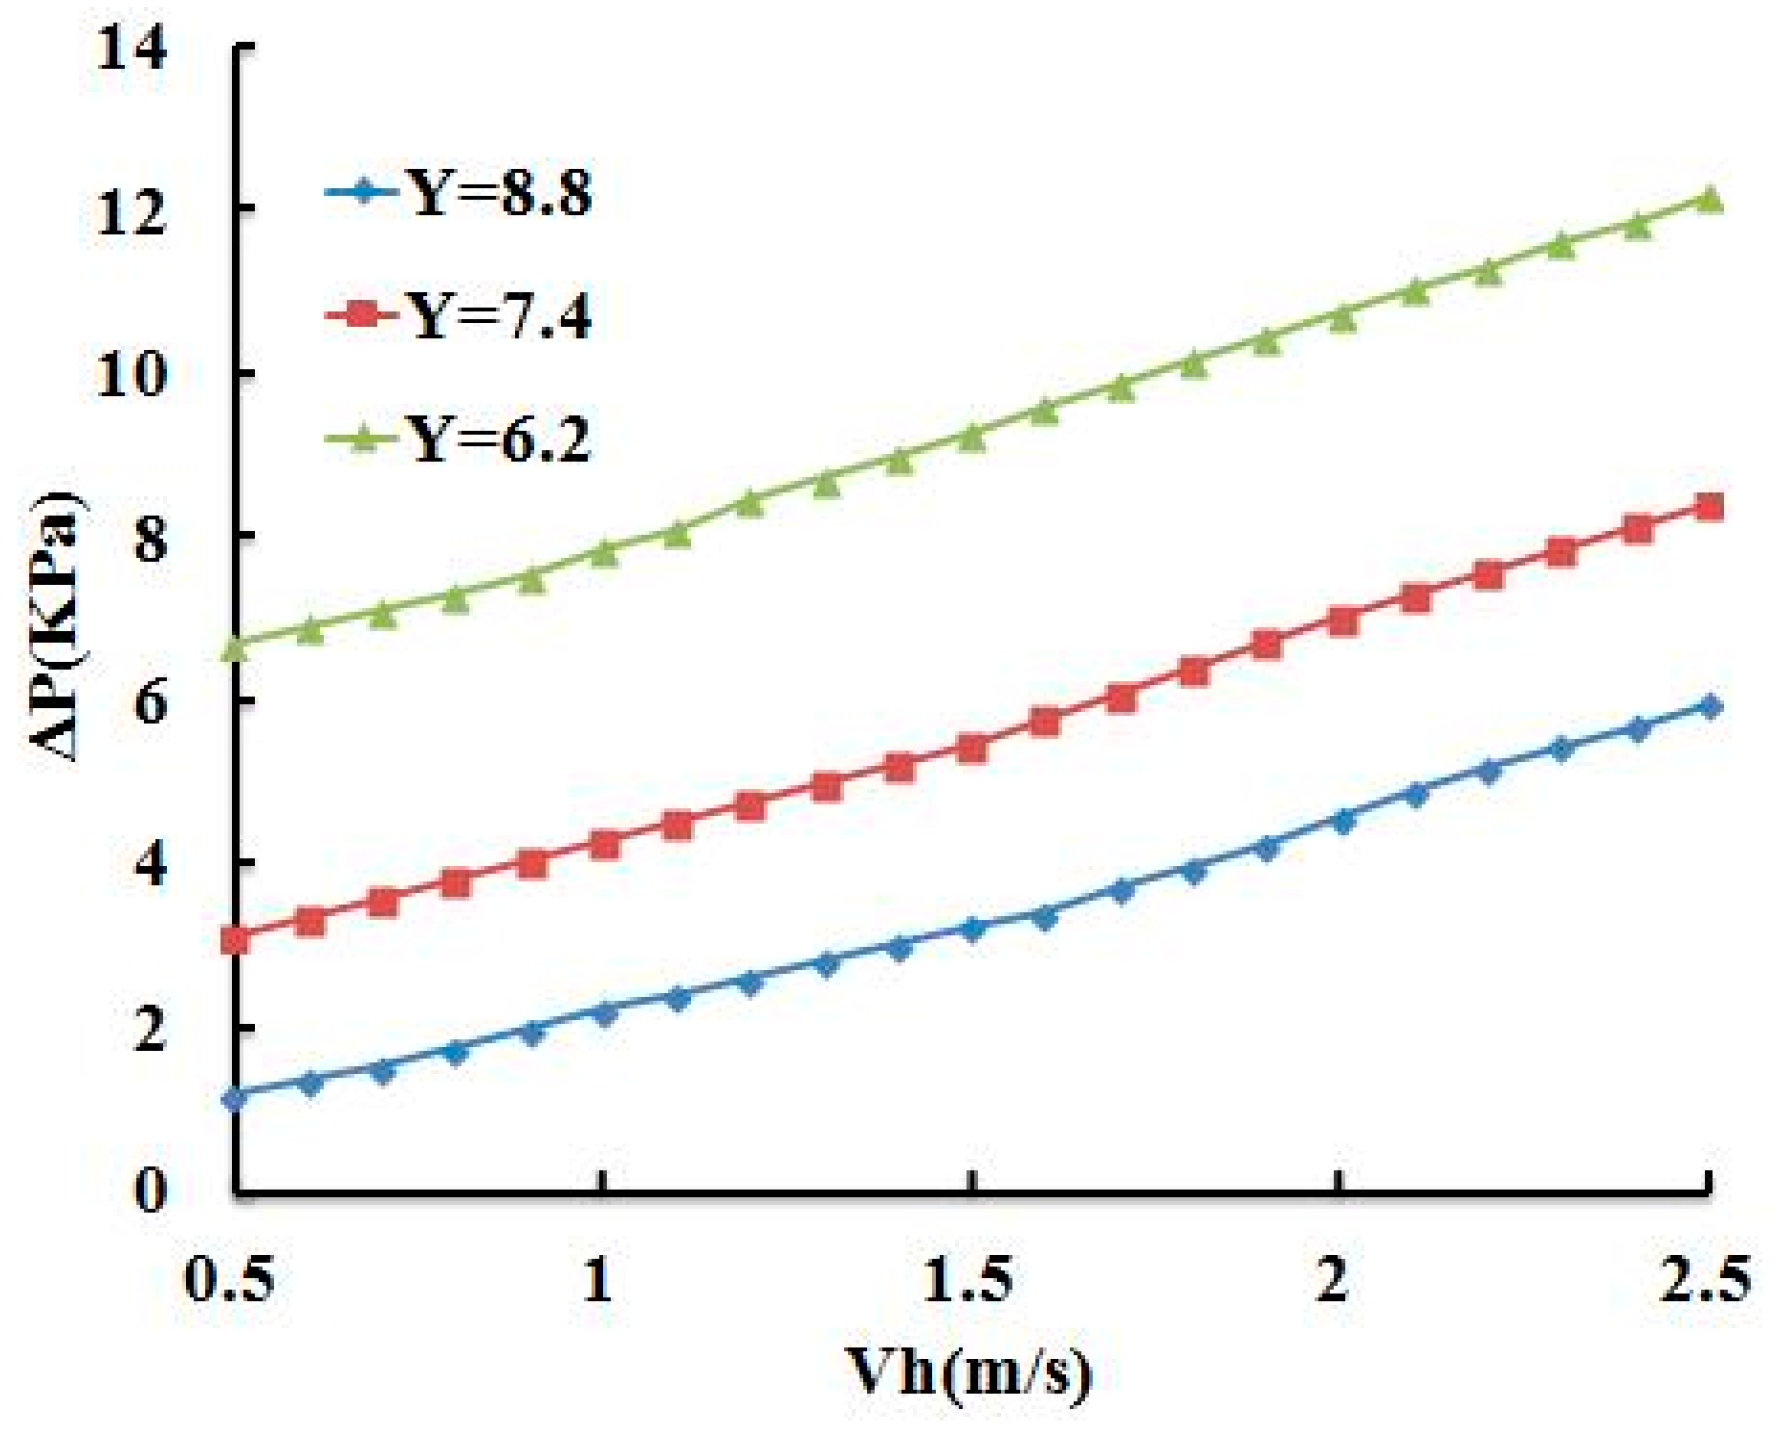
The effect of different twist rate on the hydrate slurry flow pressure drop was shown in
Figure 9. The hydrate slurry flow pressure drop gradually decreased with the increase of twist rate under the same conditions of temperature, pressure, and slurry velocity. The hydrate slurry flow can be regarded as single-phase flow, and the hydrate slurry total pressure drop was divided into frictional pressure drop, local resistance pressure drop, heavy pressure drop, and accelerating pressure drop. In view of the actual flow situation of this experiment, local resistance pressure drop, acceleration pressure drop and heavy pressure drop can be ignored, and the friction resistance pressure drop was mainly considered (according to the classical theory, total pressure drop was divided into frictional pressure drop, local resistance pressure drop, heavy pressure drop, and accelerating pressure drop. Because the loop in the experiment is a horizontal pipe, heavy pressure drop and local resistance pressure drop can be ignored. Accelerating pressure drop is the pressure drop due to the changes in fluid density or velocity. In this experiment, the density of hydrate slurry does not change. Therefore, the accelerating pressure drop is ignored). The influence of twist rate on hydrate slurry flow pressure drop act on the flow direction. When the twist rate increased gradually, the spiral effect of twist tape on hydrate slurry gradually decreased, and tangential velocity gradually decreased, and the friction degree between the hydrate slurry and loop wall gradually weakened, so the hydrate slurry flow pressure drop gradually decreased.
3.4. Pressure Drop Model
The flow of hydrate slurry is a complex liquid solid two phase flow. The research methods of frictional characteristics of liquid solid two phase flow can be roughly divided into two categories: one is based on experimental data, and the other is based on phenomenological model. Generally speaking, theoretical models are difficult for practical applications, because many of their governing equations are difficult to obtain, and empirical formulas have a certain range of applications, including flow regime and flow medium range. The three layer model of sand and water two phase flow is established in document [
29] and the document [
30] that were applied the model to the ice slurry flow in a loop. The reference documents are the per unit length of hydrate slurry flow friction calculation formula.
In the formula, ∆P0 is the flow resistance of the hydrate slurry, Pa; ∆X is the length of the loop, m; d is the loop diameter, m; is the average density of hydrate slurry kg/m3; is the average velocity of hydrate slurry, m/s; is the average friction coefficient of fluid flow in hydrate slurry; HI is the ratio of the mass of crystal particles to the total mass of hydrate slurry in the hydrate slurry; and, is a constant, as determined by the experiment.
For the average density of hydrate slurry
, the calculation formula is as follows:
In the formula, is the density of water solution, kg/m3; is the crystal density of hydrate, kg/m3.
is the average friction coefficient of the hydrate slurry flow and the formula is calculated, as follows:
In the formula, Re is Reynolds number, Re = sVd/ν; α and β are constants; and, ν is the viscosity coefficient of water solution, m2/s.
Backstepping from experimental data can be obtained, the constant ω is 1.17; the constants α and β are 1.95 and 0.13, respectively.
The flow of hydrate slurry under the spiral flow system is explained by the following conditions: ① During the whole experiment, some of the microhydrate particles were distributed evenly in the slurry due to the role of the spin generator, which was similar to the consistency of particles in hydrate slurry; ② According to the research of Wang and other [
7,
30], when the volume fraction of hydrate is at 10–70% and the hydrate volume fraction of CH
3CCl
2F hydrate slurry reaches 30–40%, there is a significant change in the pressure resistance in the loop. In this experiment, due to the long loop length, the content of hydrate particles is relatively low, generally below 10%, which is similar to hydrate particles and it does not affect the pressure drop characteristics of the main flow; ③ In the whole process of the experiment, the flow velocity of the slurry is generally low, which is generally in the laminar flow area; ④ As the content of hydrate particles is low and the flow velocity is slow, the flow of hydrate slurry is considered as Newtonian fluid; ⑤ In this experiment, the hydrate slurry flows along the tube in the state of spiral flow, and the flow resistance is closely related to the twist rate.
The model of the pressure drop of the spiral flow in the hydrate slurry is as follows:
In the formula, ∆Ph—the pressure drop of the spiral flow in the hydrate slurry; ∆P0—the pressure drop of the hydrate slurry flow; Y—the twist rate; a, b—the pressure drop coefficient, are determined by the experimental data.
According to the experimental data,
a and
b are 1.29 and 0.85, respectively. Therefore, the pressure drop formula of the spiral flow in the hydrate slurry in the horizontal tube can be expressed, as follows:
3.5. Model Verification
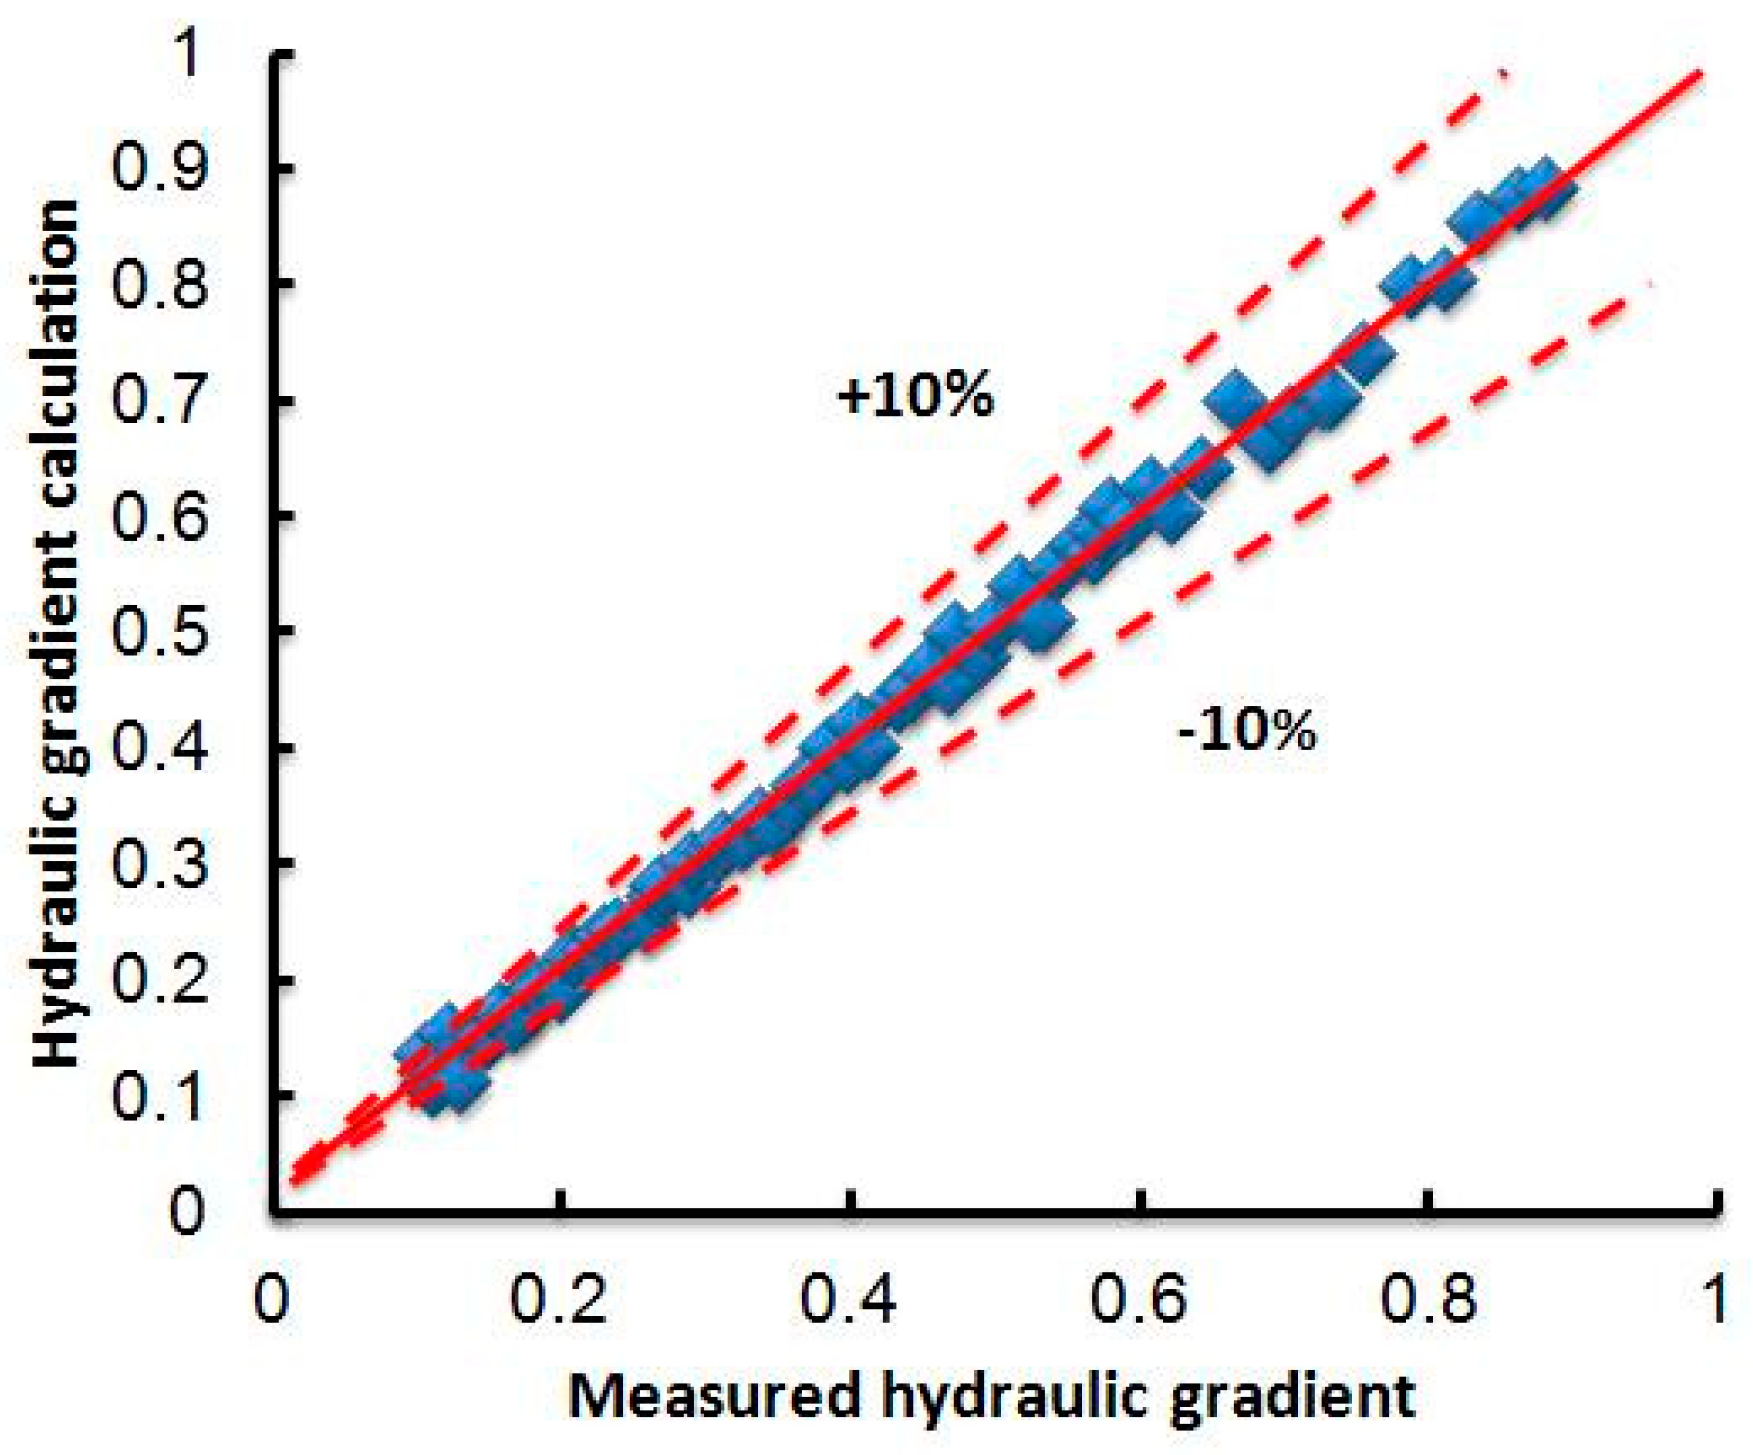
In order to facilitate the verification of pressure drop model, sorting out the expression for the hydraulic gradient:
In order to verify the accuracy of the model, the typical data points in the experiment are selected and the calculated values are compared with the measured values.
Figure 10 showed that the Equation (6) was used to calculate the error of the pressure drop model and the experimental value of the spiral flow in the hydrate slurry in the horizontal tube. Through the analysis, it was found that the average error between the calculated value and the actual measured value is within 10%. In a spiral flow loop, the flow resistance of hydrate slurry was closely related to its flow field and the concentration field in heterogeneous flow, so its flow resistance would be influenced by many factors. A pressure drop model for hydrate flow in a loop was established based on the sand water two phase flow model. It was limited by the experimental conditions in the modeling process, and it was difficult to consider the influence of multiple factors on the flow resistance of hydrate slurry. In general, the hydraulic drop model of the spiral flow slurry showed a stable prediction performance.


