Prospective Life Cycle Assessment of the Increased Electricity Demand Associated with the Penetration of Electric Vehicles in Spain


Abstract
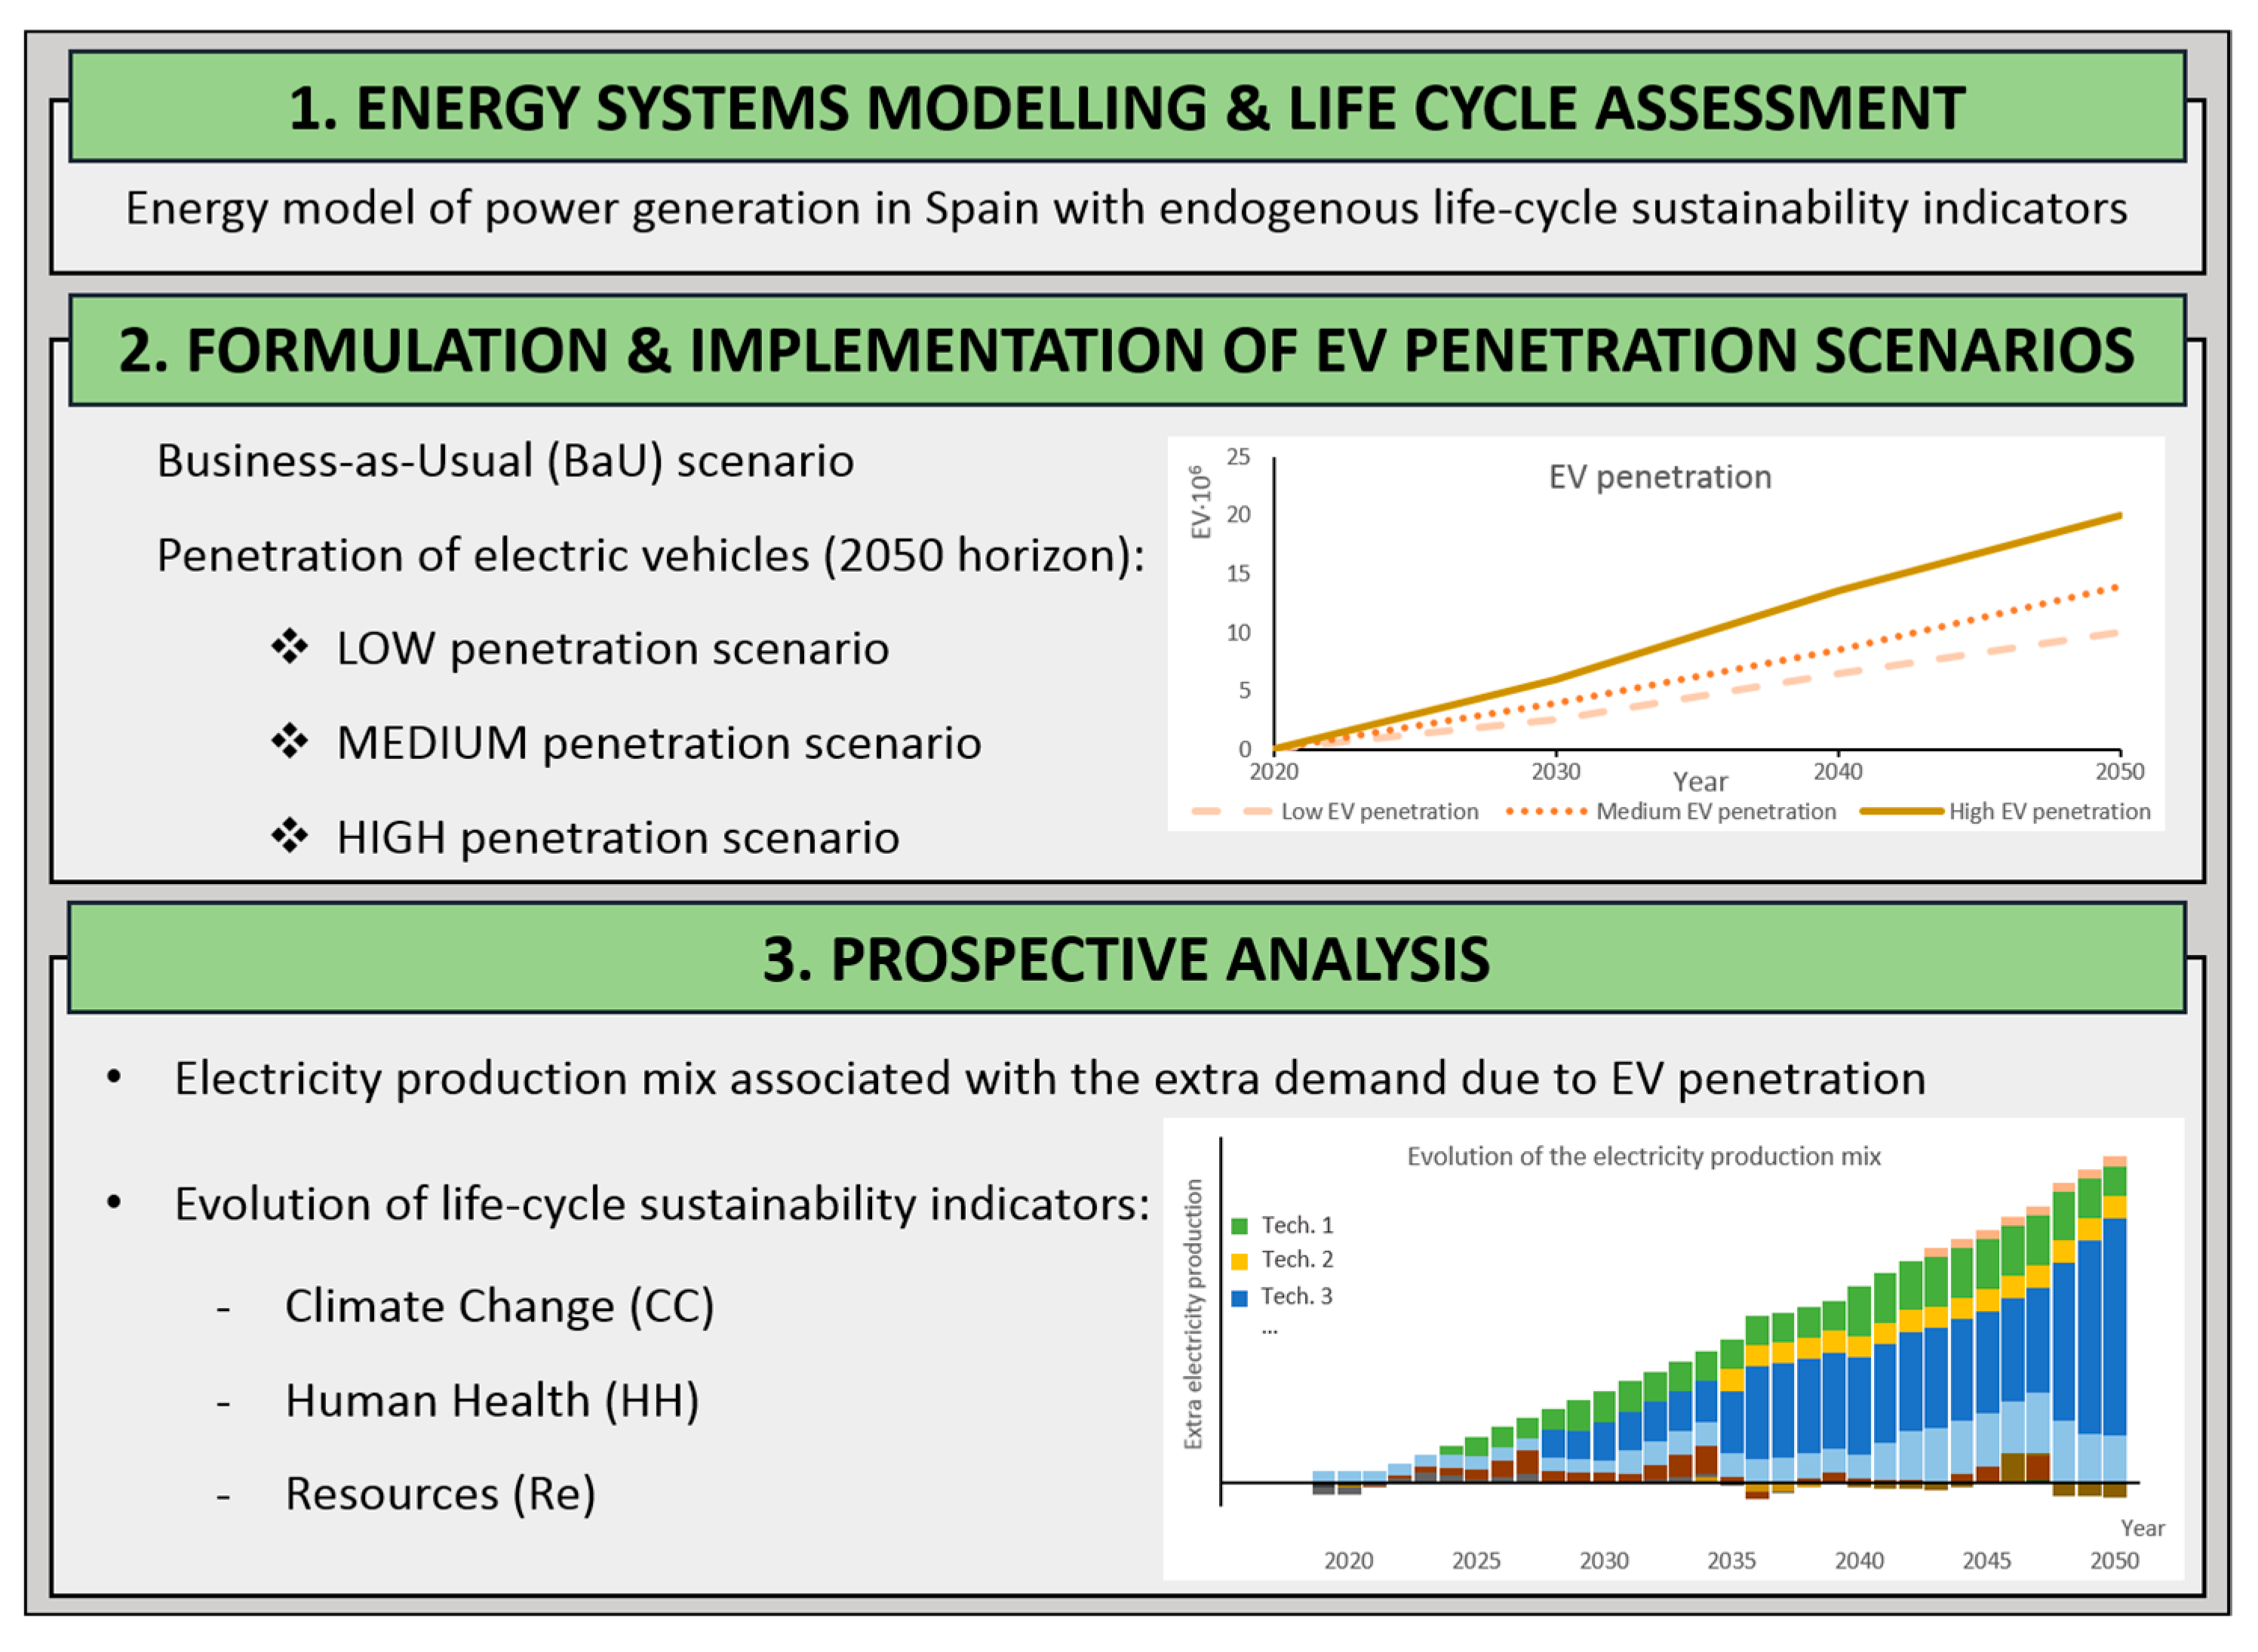
1. Introduction
2. Materials and Methods
3. Results and Discussion
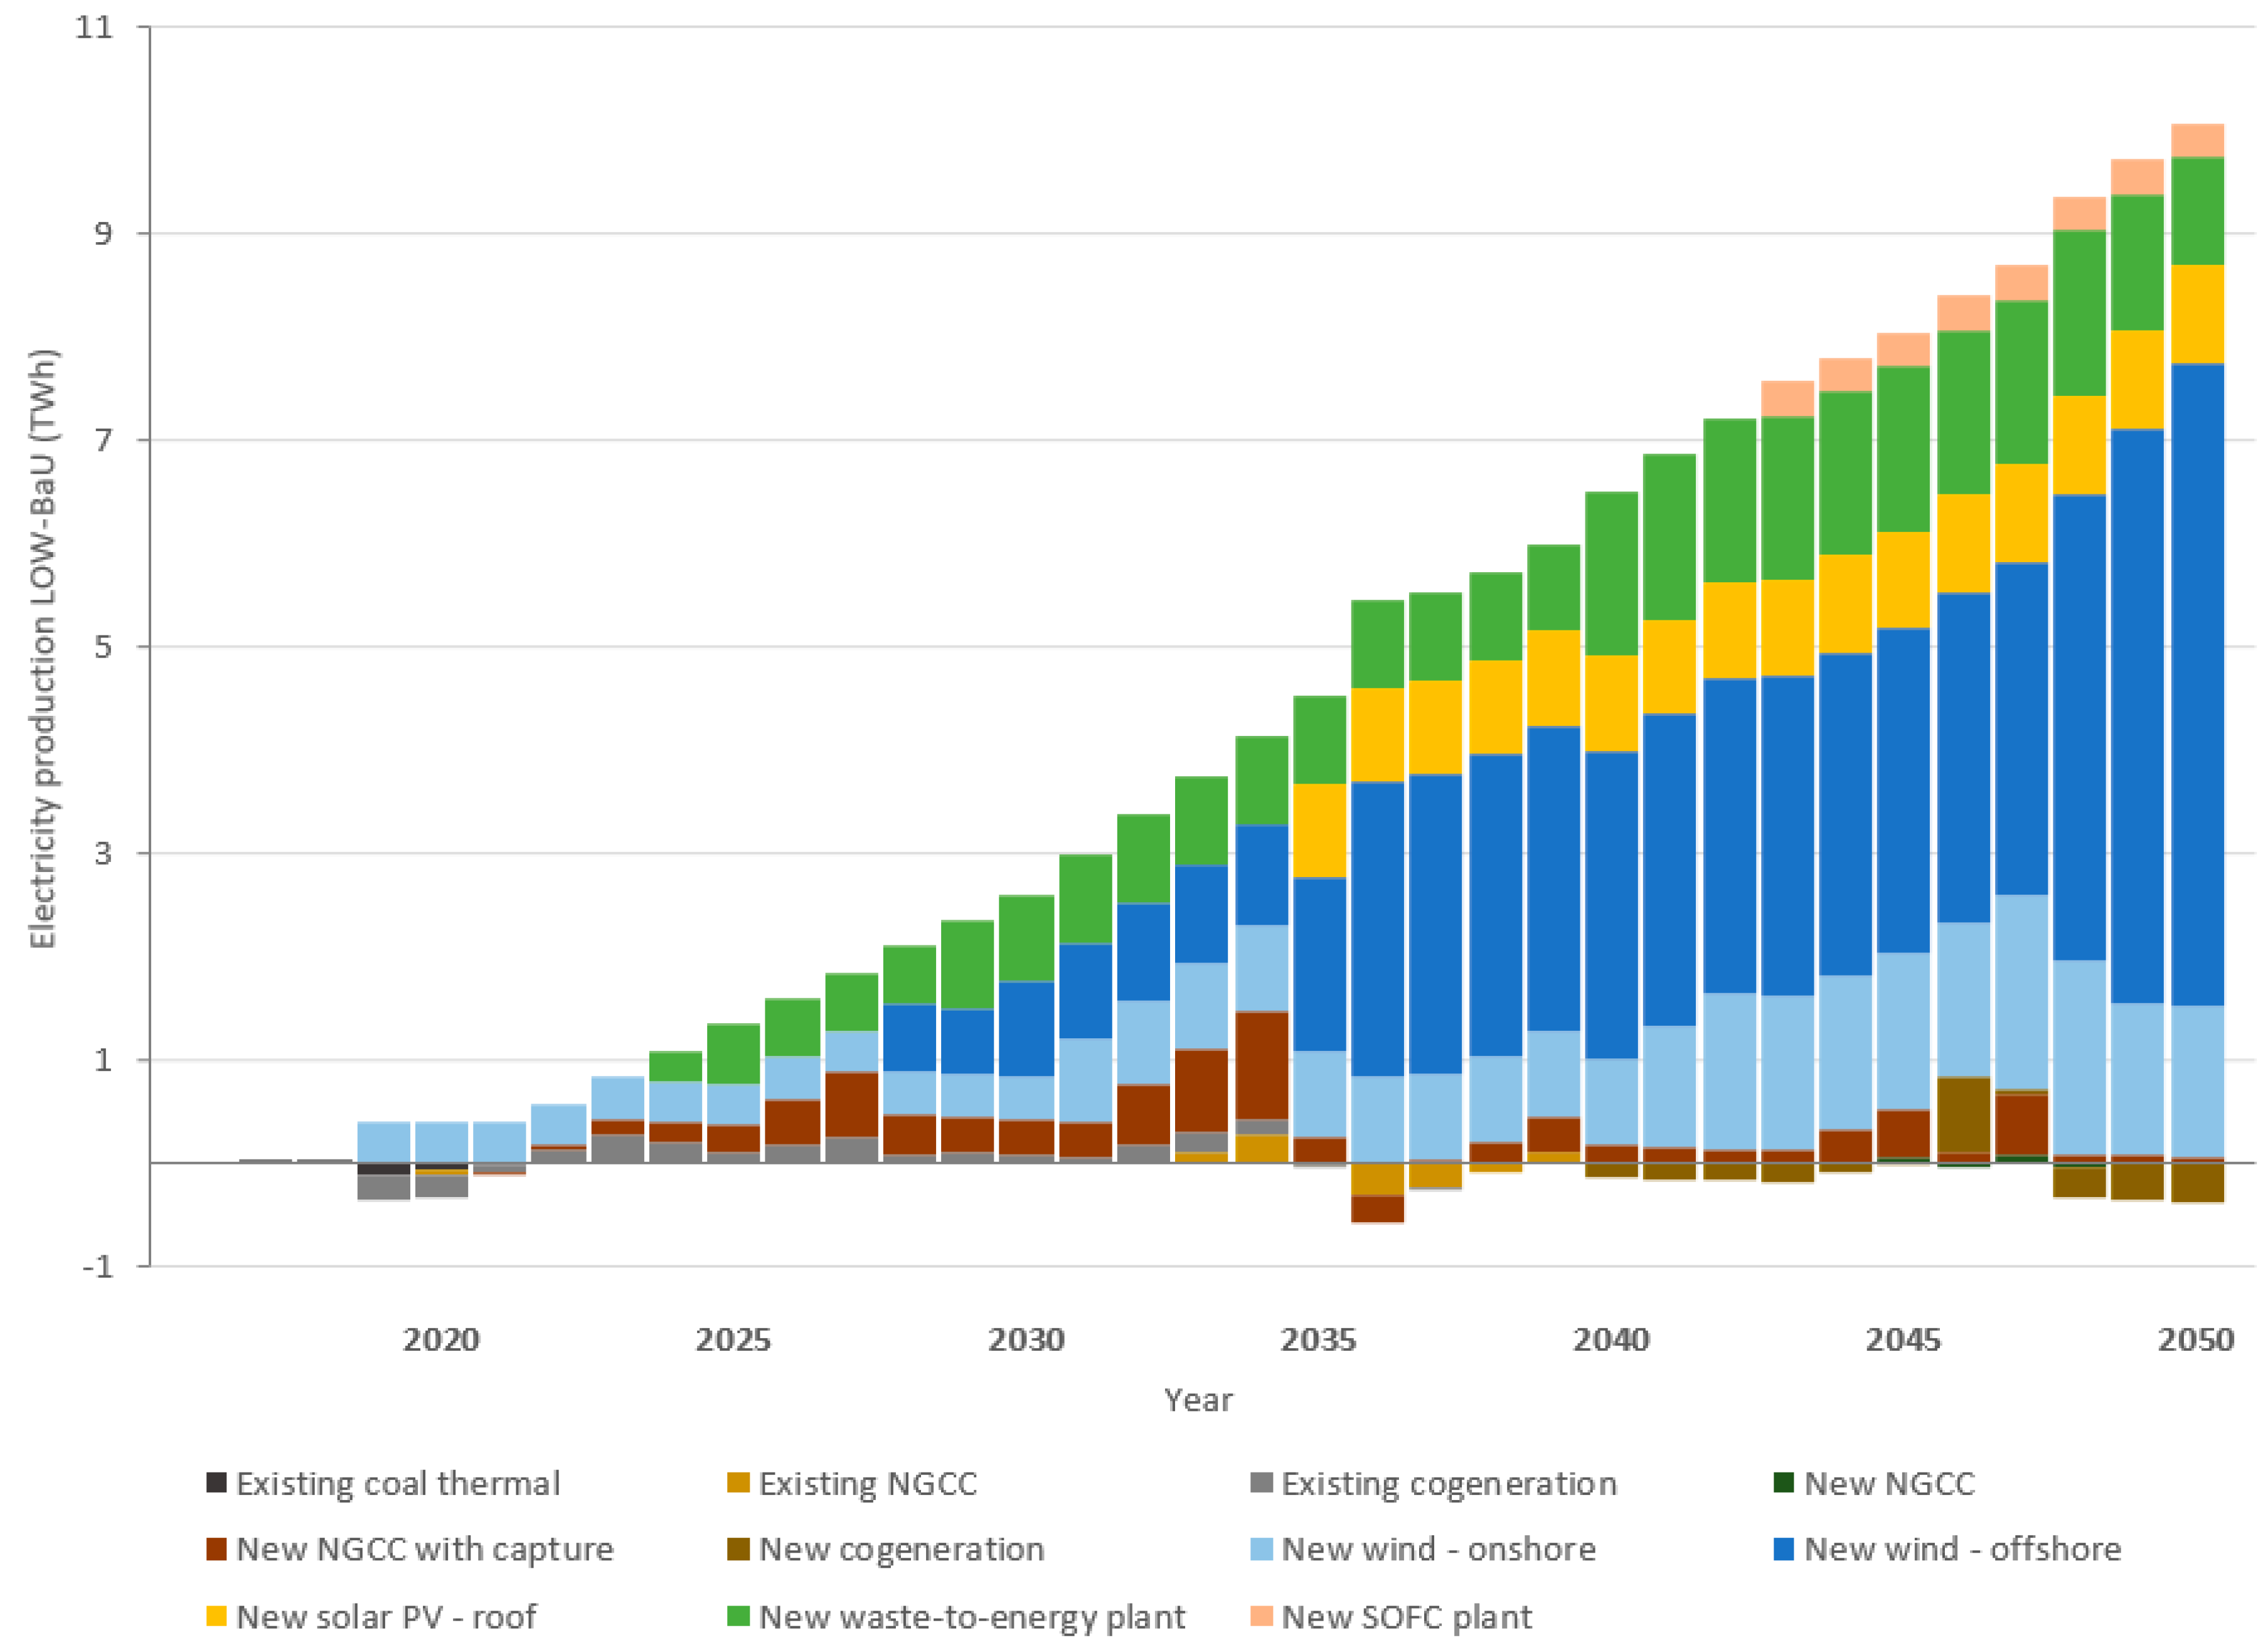
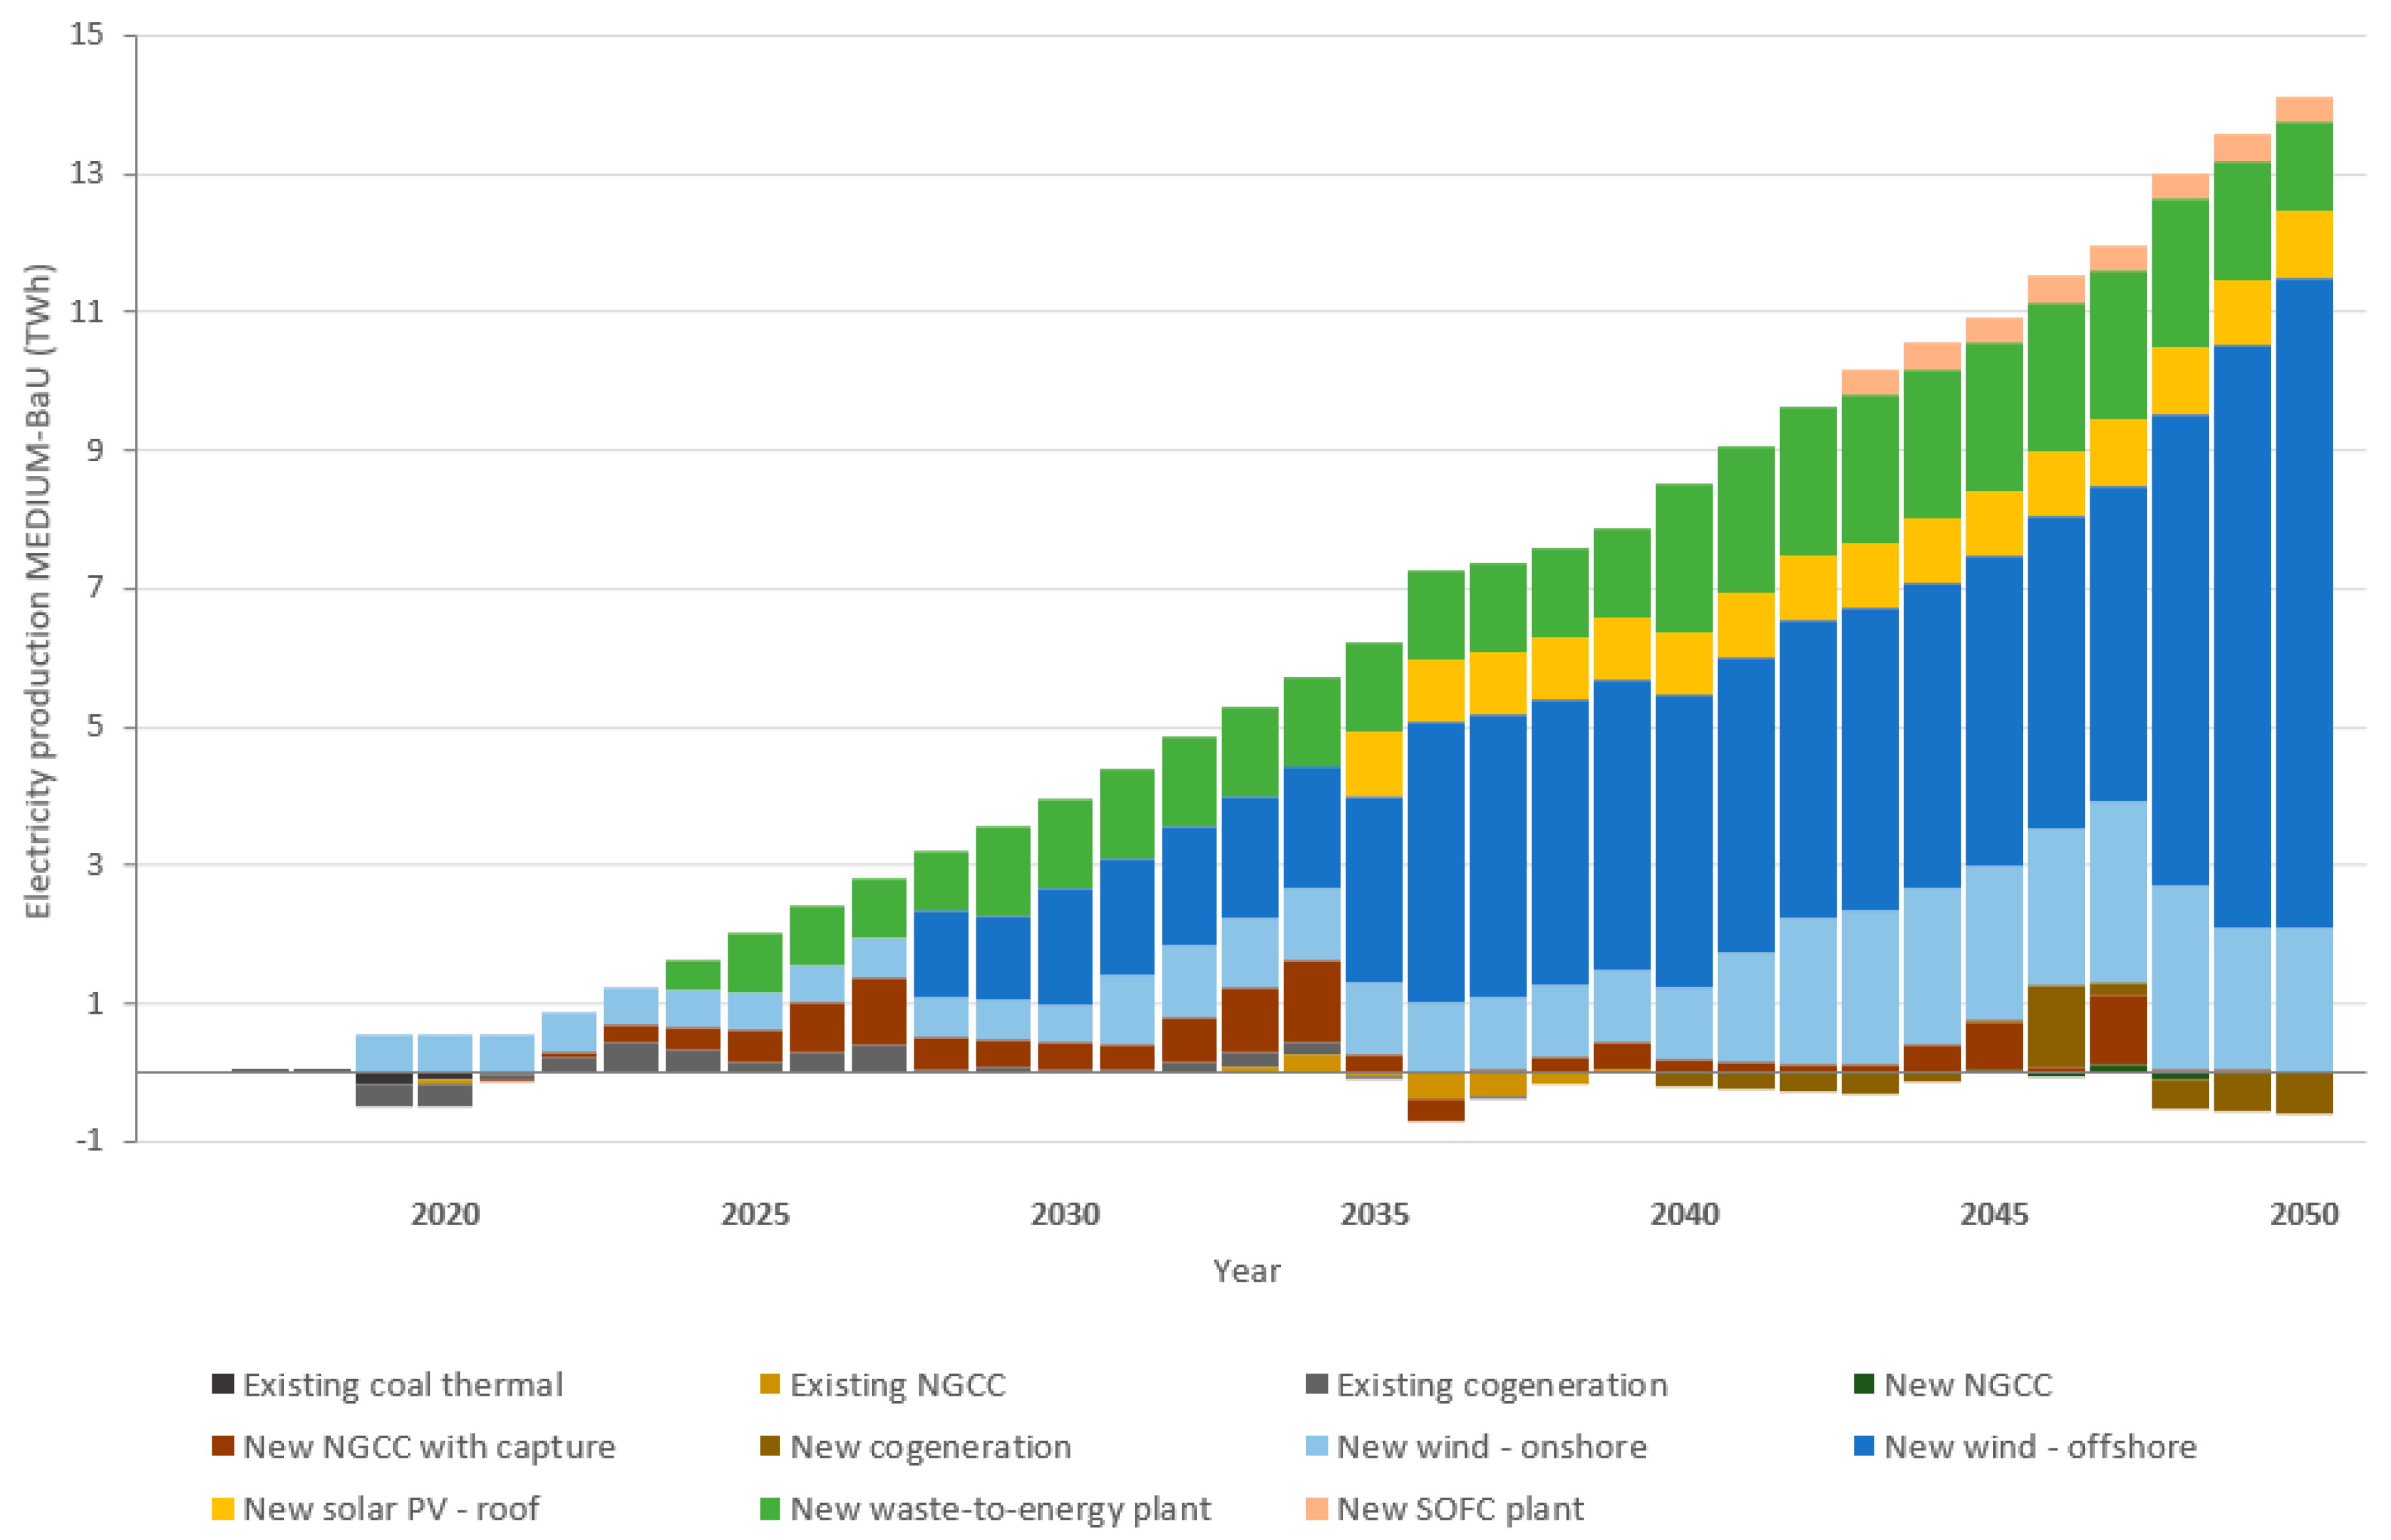
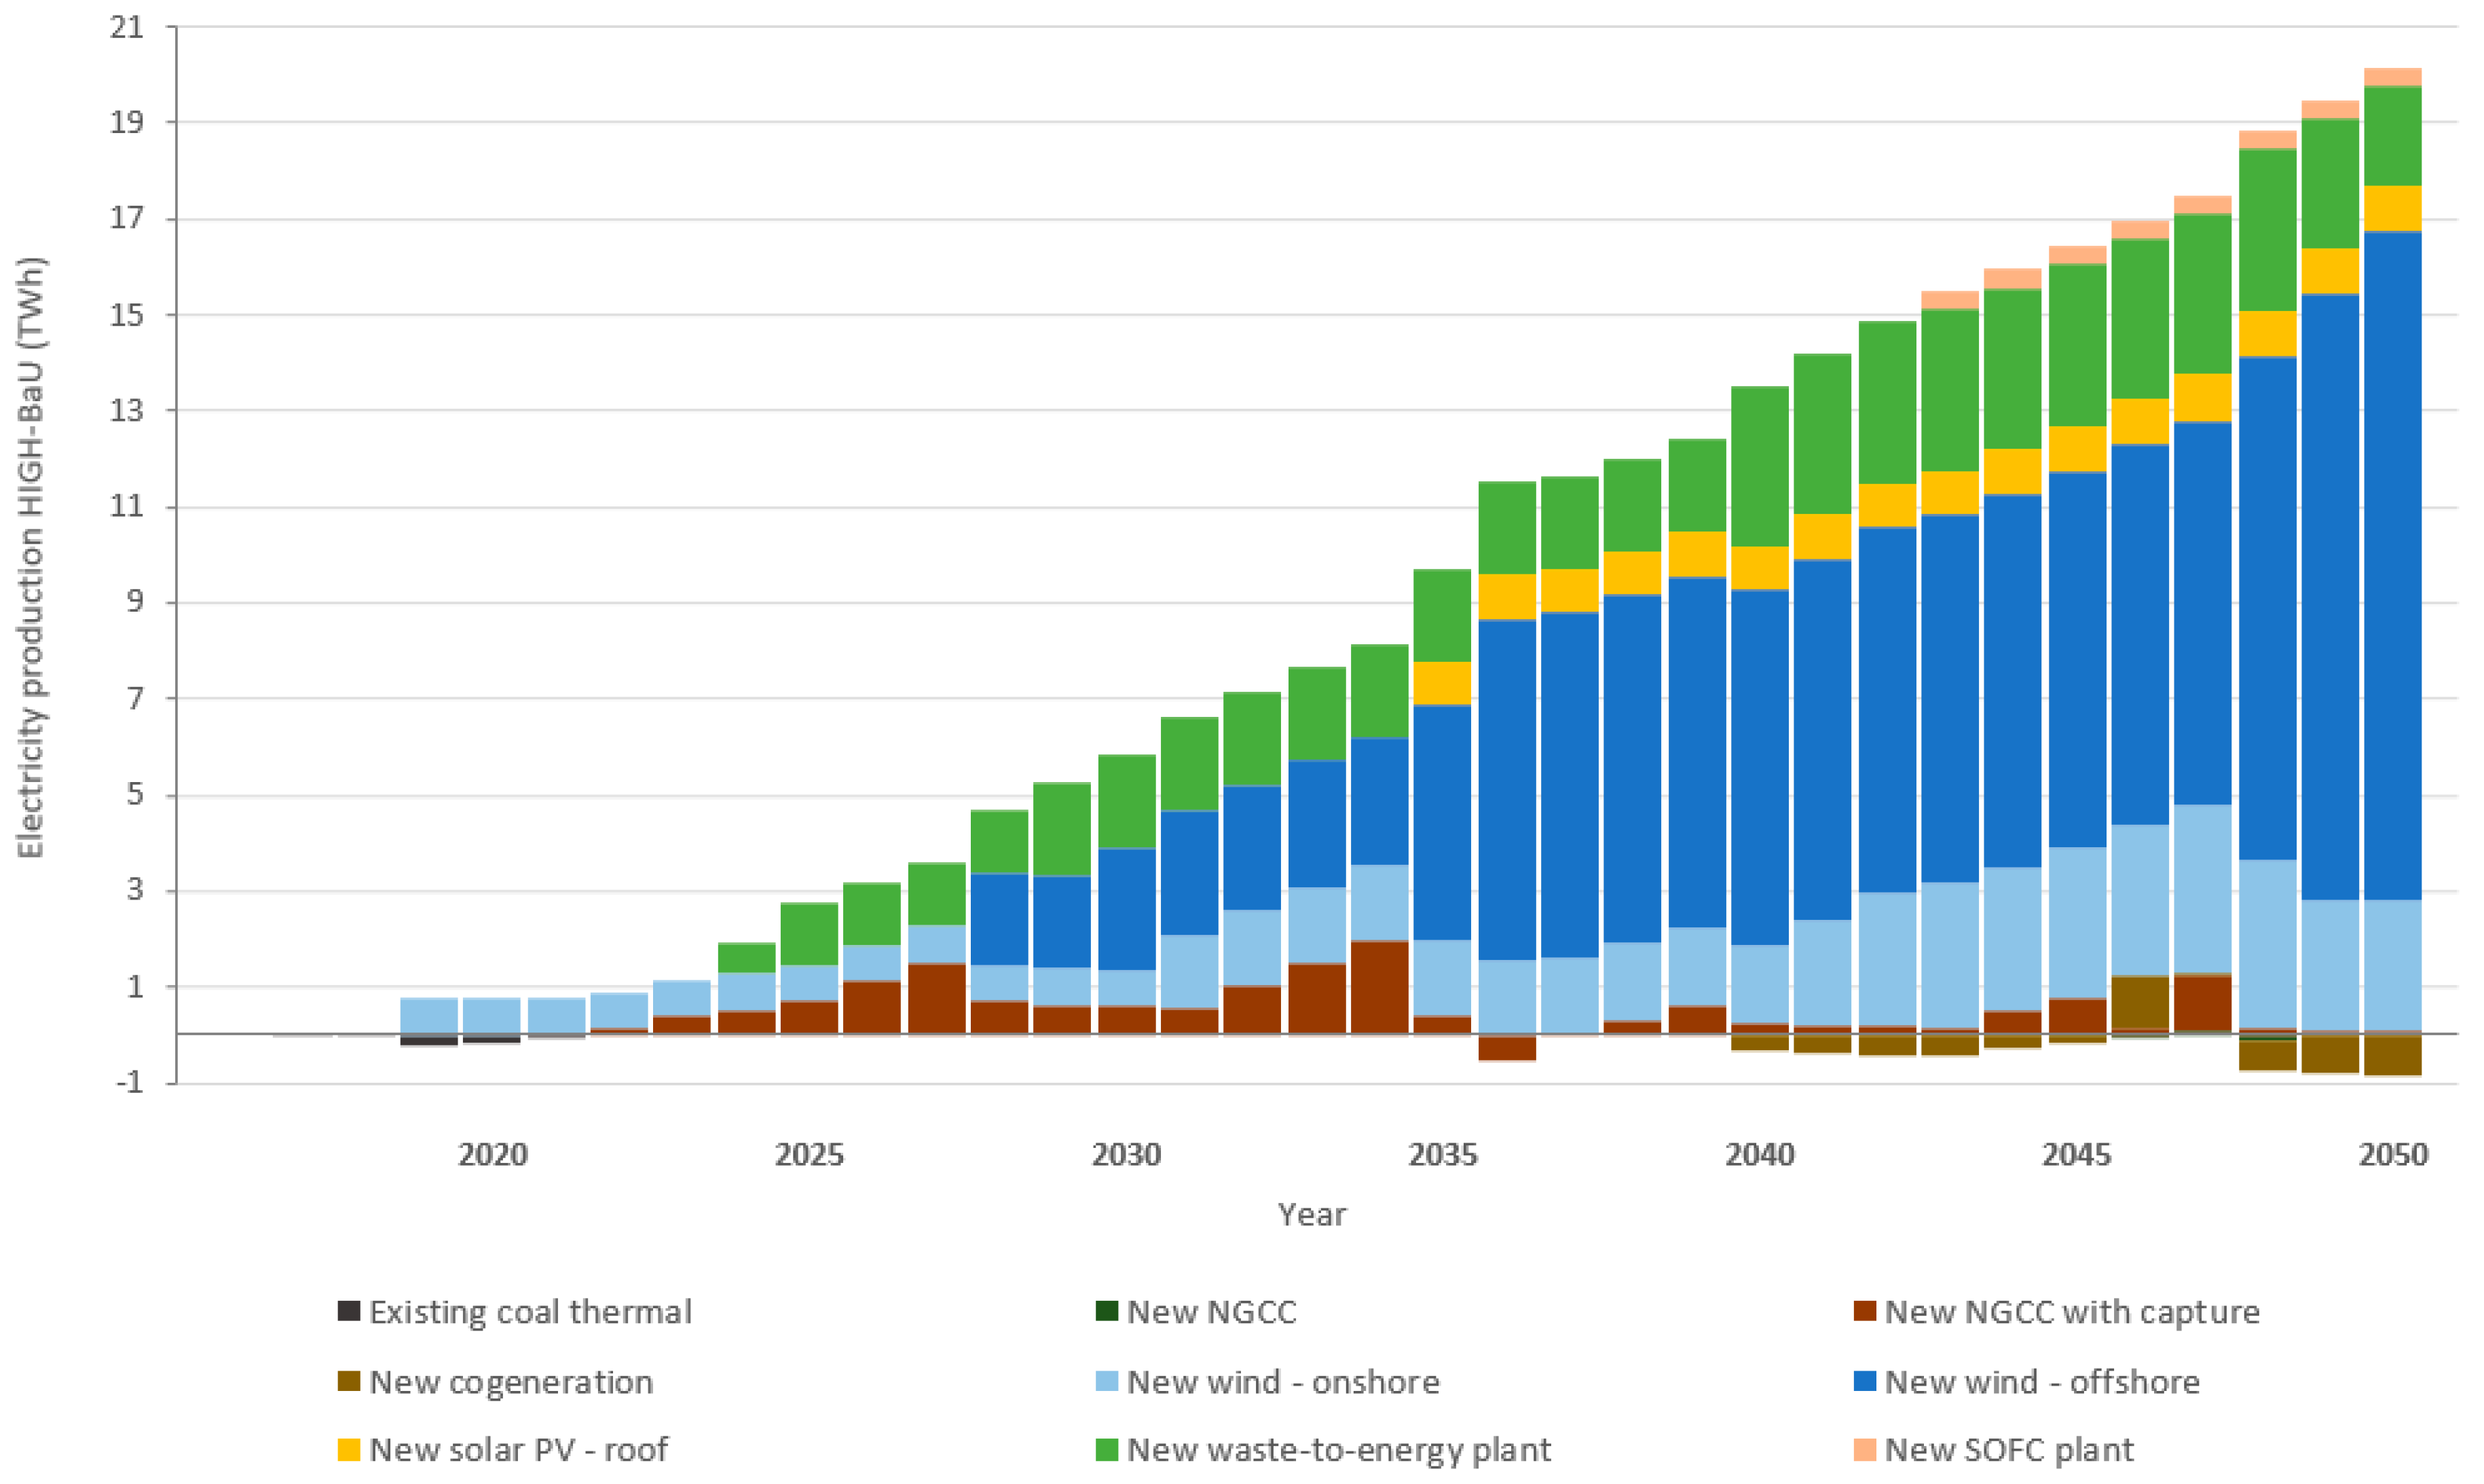
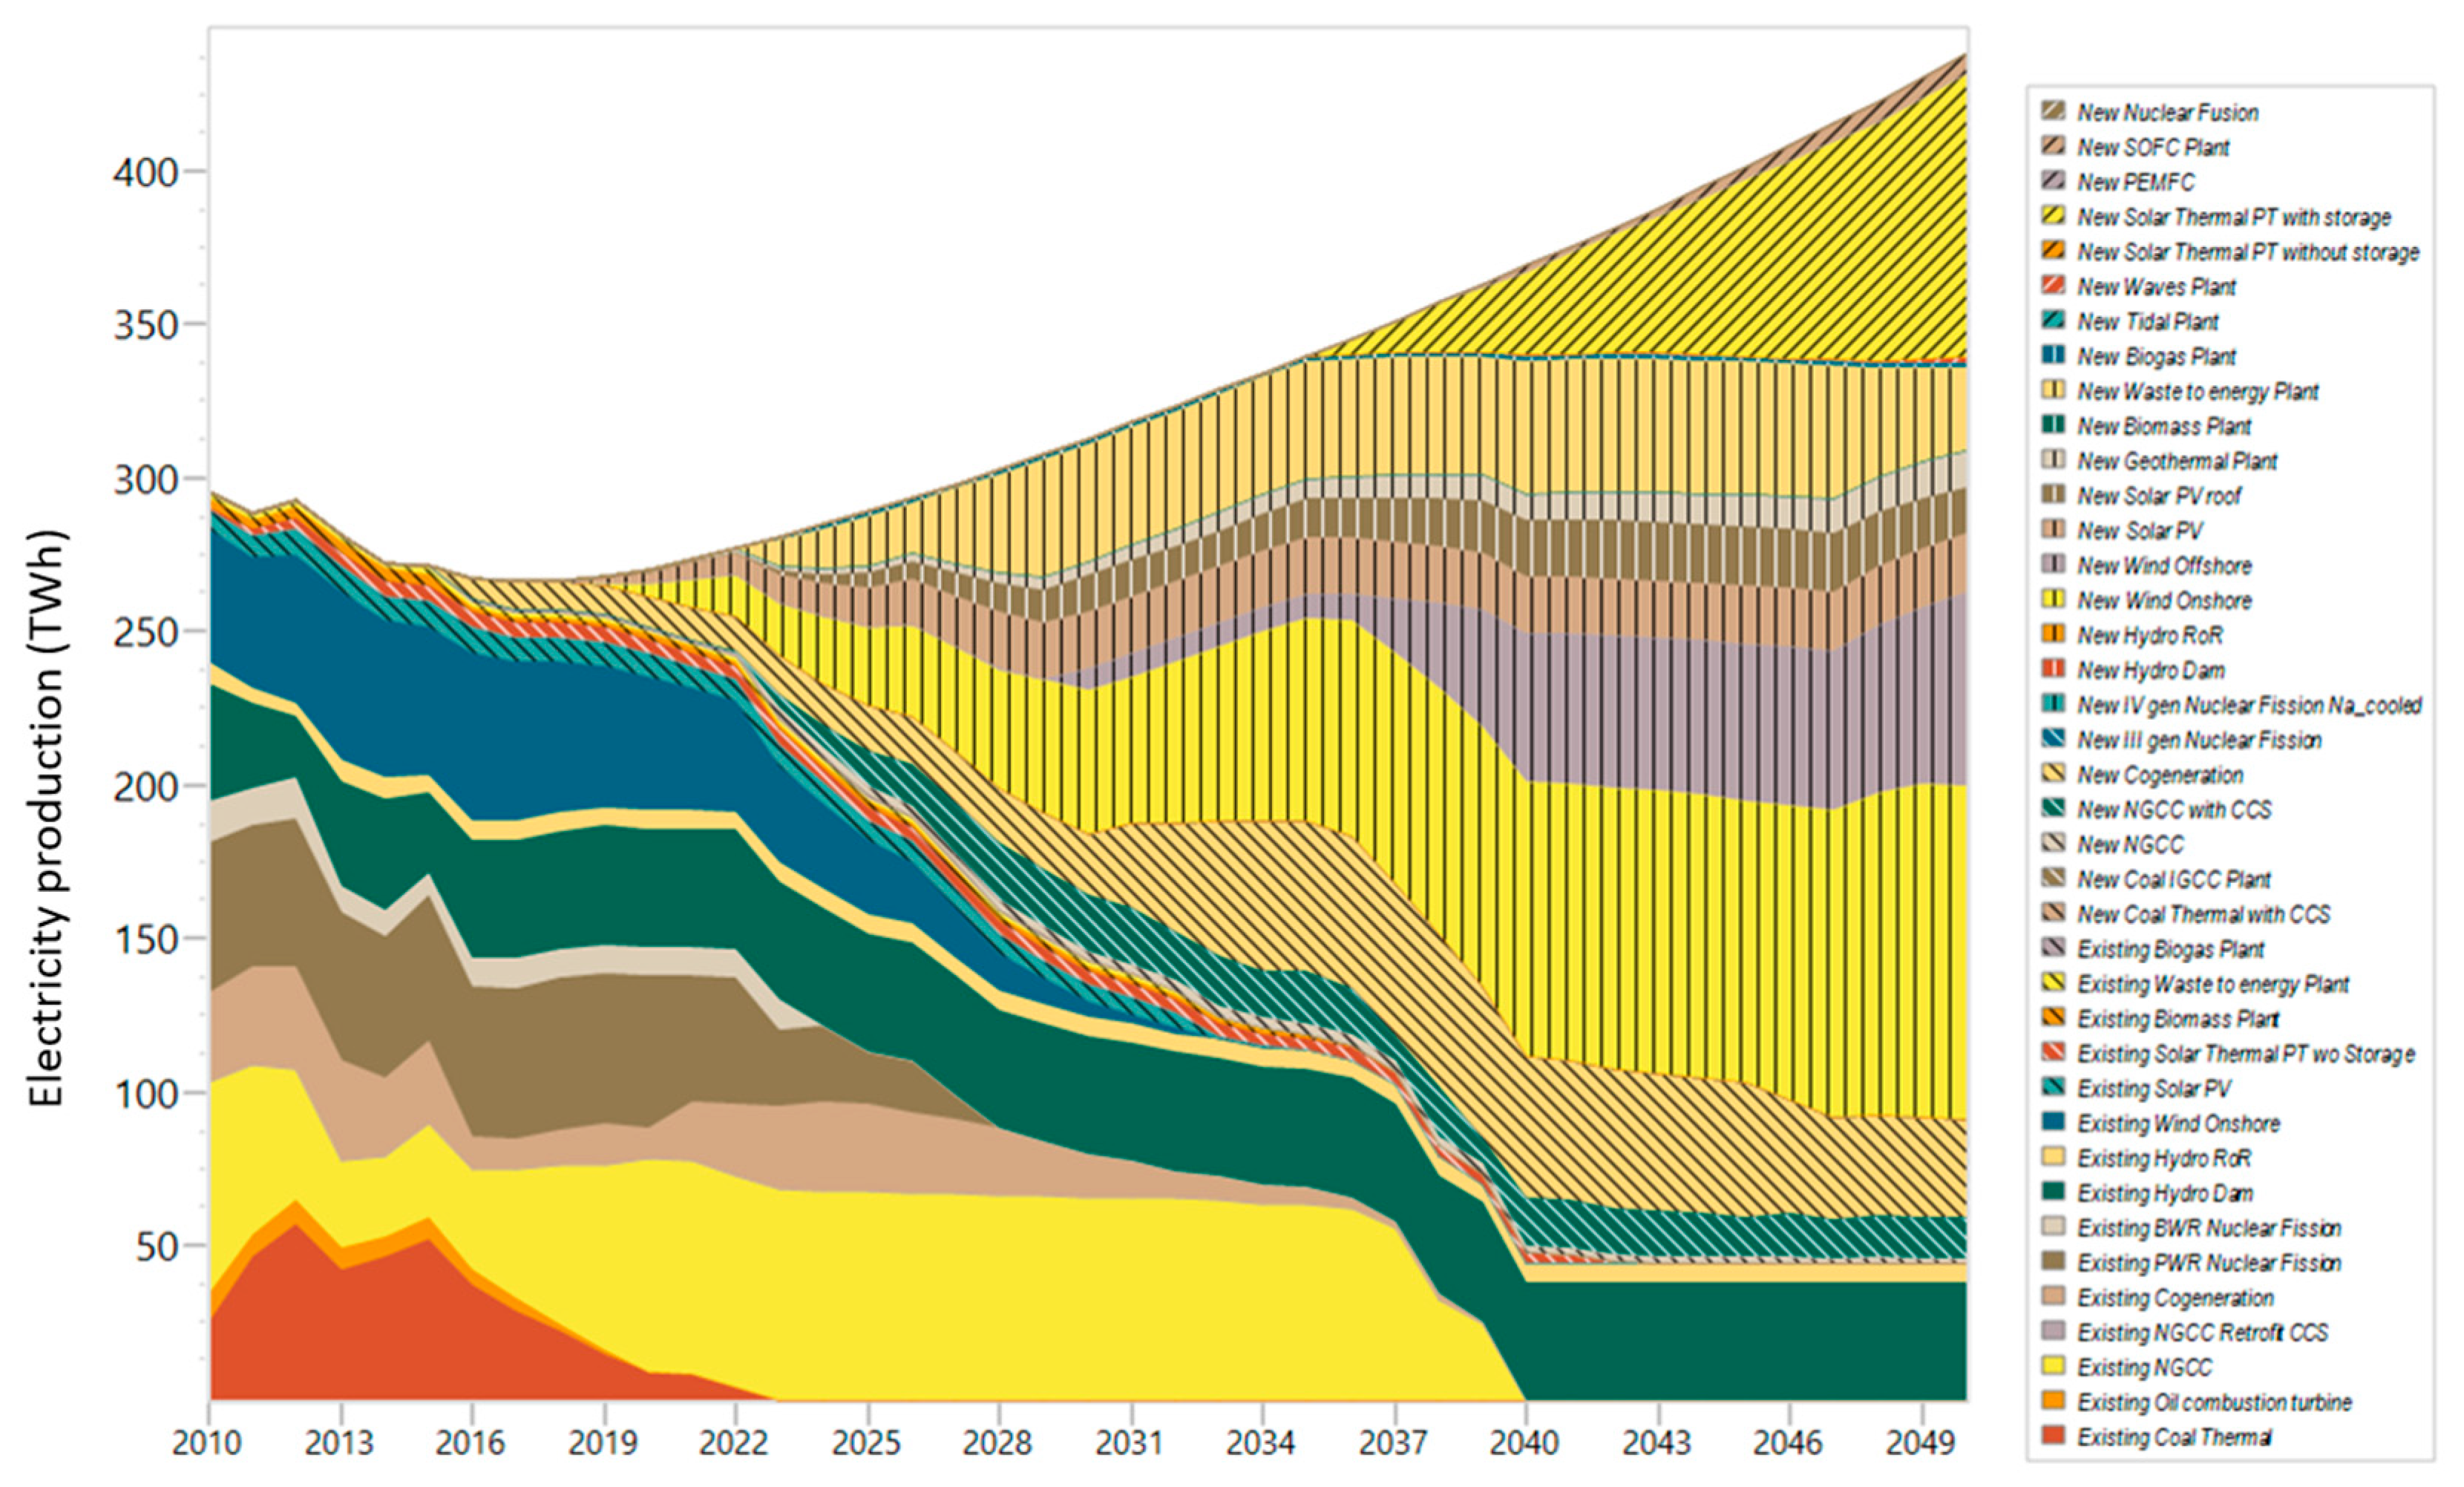
3.1. Prospective Electricity Production Mix
3.2. Prospective Life-Cycle Profile
3.3. Preliminary Comparison with Conventional Road Transport
4. Conclusions
Author Contributions
Acknowledgments
Conflicts of Interest
Appendix A


| Scenario | Year 2015 | Year 2020 | Year 2025 | Year 2030 | Year 2035 | Year 2040 | Year 2045 | Year 2050 |
|---|---|---|---|---|---|---|---|---|
| BaU | 94.10 | 57.16 | 63.55 | 59.16 | 67.42 | 32.44 | 32.77 | 29.61 |
| LOW | 94.10 | 56.93 | 63.67 | 59.31 | 67.53 | 32.48 | 33.12 | 29.69 |
| MEDIUM | 94.10 | 56.85 | 63.76 | 59.33 | 67.53 | 32.48 | 33.24 | 29.66 |
| HIGH | 94.10 | 56.74 | 63.88 | 59.41 | 67.58 | 32.48 | 33.22 | 29.64 |
| Scenario | Year 2015 | Year 2020 | Year 2025 | Year 2030 | Year 2035 | Year 2040 | Year 2045 | Year 2050 |
|---|---|---|---|---|---|---|---|---|
| BaU | 78.90 | 21.82 | 11.86 | 9.71 | 9.54 | 6.24 | 6.97 | 7.77 |
| LOW | 78.90 | 21.69 | 11.89 | 9.75 | 9.60 | 6.31 | 7.09 | 7.90 |
| MEDIUM | 78.90 | 21.65 | 11.91 | 9.77 | 9.61 | 6.33 | 7.13 | 7.95 |
| HIGH | 78.90 | 21.58 | 11.93 | 9.80 | 9.66 | 6.39 | 7.19 | 8.03 |
| Scenario | Year 2015 | Year 2020 | Year 2025 | Year 2030 | Year 2035 | Year 2040 | Year 2045 | Year 2050 |
|---|---|---|---|---|---|---|---|---|
| BaU | 1973 | 1666 | 1385 | 1157 | 1308 | 697 | 689 | 632 |
| LOW | 1973 | 1663 | 1389 | 1162 | 1311 | 699 | 698 | 634 |
| MEDIUM | 1973 | 1662 | 1392 | 1163 | 1312 | 699 | 702 | 633 |
| HIGH | 1973 | 1660 | 1396 | 1166 | 1313 | 699 | 702 | 633 |
References
- International Energy Agency. CO2 Emissions from Fuel Combustion 2017; OECD/IEA: Paris, France, 2017. [Google Scholar]
- European Commission. A Roadmap for Moving to a Competitive Low Carbon Economy in 2050; EC: Brussels, Belgium, 2011. [Google Scholar]
- Gielen, D.; Saygin, D.; Wagner, N. The Renewable Route to Sustainable Transport; IRENA: Abu Dhabi, UAE, 2016. [Google Scholar]
- International Energy Agency. Global EV Outlook 2017: Two Million and Counting; OECD/IEA: Paris, France, 2017. [Google Scholar]
- Linares, P.; Declercq, D. Scenarios for the Energy Sector in Spain 2030–2050; Economics for Energy: Vigo, Spain, 2017. [Google Scholar]
- CEPSA. CEPSA Energy Outlook 2030; CEPSA: Madrid, Spain, 2017. [Google Scholar]
- Government of Spain. National Action Framework for Alternative Energy in Transport; MINETAD: Madrid, Spain, 2016.
- Nieto, J.; Linares, P. Global Change Spain 2020/50—Energy, Economy and Society; CCEIM/CONAMA: Madrid, Spain, 2010.
- Amores, A.; Álvarez, L.; Chico, J.; Ramajo, G.; Sánchez, M.; Renobales, C. A Sustainable Energy Model for Spain in 2050—Policy Recommendations for the Energy Transition; Deloitte: Madrid, Spain, 2016. [Google Scholar]
- Ekvall, T. Cleaner production tools: LCA and beyond. J. Clean. Prod. 2002, 10, 403–406. [Google Scholar] [CrossRef]
- Lund, H.; Mathiesen, B.V.; Christensen, P.; Schmidt, J.H. Energy system analysis of marginal electricity supply in consequential LCA. Int. J. Life Cycle Assess. 2010, 15, 260–271. [Google Scholar] [CrossRef]
- Vandepaer, L.; Gibon, T. The integration of energy scenarios into LCA: LCM2017 Conference Workshop, Luxembourg, September 5, 2017. Int. J. Life Cycle Assess. 2018, 23, 970–977. [Google Scholar] [CrossRef]
- García-Gusano, D.; Iribarren, D.; Martín-Gamboa, M.; Dufour, J.; Espegren, K.; Lind, A. Integration of life-cycle indicators into energy optimisation models: The case study of power generation in Norway. J. Clean. Prod. 2016, 112, 2693–2696. [Google Scholar] [CrossRef]
- Liu, Z.; Wu, Q.; Nielsen, A.H.; Wang, Y. Day-ahead energy planning with 100% electric vehicle penetration in the Nordic region by 2050. Energies 2014, 7, 1733–1749. [Google Scholar] [CrossRef]
- Bohnes, F.A.; Gregg, J.S.; Laurent, A. Environmental impacts of future urban deployment of electric vehicles: Assessment framework and case study of Copenhagen for 2016–2030. Environ. Sci. Technol. 2017, 51, 13995–14005. [Google Scholar] [CrossRef]
- Zhang, Q.; Ou, X.; Yan, X.; Zhang, X. Electric vehicle market penetration and impacts on energy consumption and CO2 emission in the future: Beijing case. Energies 2017, 10, 228. [Google Scholar] [CrossRef]
- Höltl, A.; Macharis, C.; De Brucker, K. Pathways to decarbonise the European car fleet: A scenario analysis using the backcasting approach. Energies 2018, 11, 20. [Google Scholar] [CrossRef]
- García-Gusano, D.; Martín-Gamboa, M.; Iribarren, D.; Dufour, J. Prospective analysis of life-cycle indicators through endogenous integration into a national power generation model. Resources 2016, 5, 39. [Google Scholar] [CrossRef]
- Jolliet, O.; Margni, M.; Charles, R.; Humbert, S.; Payet, J.; Rebitzer, G.; Rosenbaum, R. IMPACT 2002+: A new life cycle impact assessment methodology. Int. J. Life Cycle Assess. 2003, 8, 324–330. [Google Scholar] [CrossRef]
- Government of Spain. Annual Report of the Observatory for Transport and Logistics in Spain; OTLE: Madrid, Spain, 2017.
- Doka, G. Life Cycle Inventories of Waste Treatment Services; Swiss Centre for Life Cycle Inventories: Dübendorf, Switzerland, 2003. [Google Scholar]
- Weidema, B.P.; Bauer, C.; Hischier, R.; Mutel, C.; Nemecek, T.; Reinhard, J.; Vadenbo, C.O.; Wernet, G. Overview and Methodology—Data Quality Guideline for the ecoinvent Database Version 3; The Ecoinvent Centre: St. Gallen, Switzerland, 2013. [Google Scholar]
- European Environment Agency. EMEP/EEA Air Pollutant Emission Inventory Guidebook 2016; EEA: Luxembourg, 2016. [Google Scholar]
- Historical Records—Vehicle Fleet. Available online: http://www.dgt.es/es/seguridad-vial/estadisticas-e-indicadores/parque-vehiculos/series-historicas (accessed on 4 April 2018).
- Del Duce, A.; Gauch, M.; Althaus, H.J. Electric passenger car transport and passenger car life cycle inventories in ecoinvent version 3. Int. J. Life Cycle Assess. 2016, 21, 1314–1326. [Google Scholar] [CrossRef]
- Simons, A. Road transport: New life cycle inventories for fossil-fuelled passenger cars and non-exhaust emissions in ecoinvent v3. Int. J. Life Cycle Assess. 2016, 21, 1299–1313. [Google Scholar] [CrossRef]


| Year 2020 | Year 2030 | Year 2040 | Year 2050 | Source |
|---|---|---|---|---|
| - | 3,138,968 | - | - | [5] |
| - | 15,694,842 | - | - | [6] |
| 150,000 | 2,600,000 | - | - | [7] |
| 2,500,000 | 5,000,000 | - | 15,000,000 | [8] |
| 200,000 | 4,400,000 | 8,200,000 | 12,280,000 | [9] |
| 300,000 | 6,000,000 | 15,400,000 | 21,900,000 | [9] |
| Vehicle Category | Distribution 1 (%) | Energy Consumption 2 (kWh/100 km) | Annual Mileage 2 (km) |
|---|---|---|---|
| Motorcycles | 0.65 | 5 | 5000 |
| Cars | 79.74 | 18 | 10,000 |
| Vans | 6.33 | 14 | 10,000 |
| Trucks | 12.21 | 110 | 50,000 |
| Buses | 1.07 | 100 | 70,000 |
| Year 2020 | Year 2030 | Year 2040 | Year 2050 | |||||
| Scenario | Total Electricity (GWh) | Total Electricity (GWh) | Total Electricity (GWh) | Total Electricity (GWh) | ||||
| BaU | 269,982 | 312,688 | 368,875 | 437,666 | ||||
| Number of EV | Δ Electricity Demand (GWh) | Number of EV | Δ Electricity Demand (GWh) | Number of EV | Δ Electricity Demand (GWh) | Number of EV | Δ Electricity Demand (GWh) | |
| Low EV penetration | 50,000 | 45 | 2,600,000 | 2337 | 6,500,000 | 5842 | 10,000,000 | 8988 |
| Medium EV penetration | 75,000 | 67 | 4,000,000 | 3595 | 8,500,000 | 7640 | 14,000,000 | 12,584 |
| High EV penetration | 100,000 | 90 | 6,000,000 | 5393 | 13,500,000 | 12,134 | 20,000,000 | 17,976 |
© 2018 by the authors. Licensee MDPI, Basel, Switzerland. This article is an open access article distributed under the terms and conditions of the Creative Commons Attribution (CC BY) license (http://creativecommons.org/licenses/by/4.0/).
Share and Cite
Navas-Anguita, Z.; García-Gusano, D.; Iribarren, D. Prospective Life Cycle Assessment of the Increased Electricity Demand Associated with the Penetration of Electric Vehicles in Spain. Energies 2018, 11, 1185. https://doi.org/10.3390/en11051185
Navas-Anguita Z, García-Gusano D, Iribarren D. Prospective Life Cycle Assessment of the Increased Electricity Demand Associated with the Penetration of Electric Vehicles in Spain. Energies. 2018; 11(5):1185. https://doi.org/10.3390/en11051185
Chicago/Turabian StyleNavas-Anguita, Zaira, Diego García-Gusano, and Diego Iribarren. 2018. "Prospective Life Cycle Assessment of the Increased Electricity Demand Associated with the Penetration of Electric Vehicles in Spain" Energies 11, no. 5: 1185. https://doi.org/10.3390/en11051185
APA StyleNavas-Anguita, Z., García-Gusano, D., & Iribarren, D. (2018). Prospective Life Cycle Assessment of the Increased Electricity Demand Associated with the Penetration of Electric Vehicles in Spain. Energies, 11(5), 1185. https://doi.org/10.3390/en11051185