


Abstract
A novel dedicated outdoor air system (DOAS) comprising a multi-stage direct expansion coil to produce extra-low temperature (XT) outdoor air to handle the entire space cooling demand has been confirmed more efficient than conventional systems. To further enhance the performance of XT-DOAS, the optimum number of cooling stages and treated outdoor air temperature need to be determined. This process requires the development of a coil performance model that takes into account the extra-high and extra-low entering air temperatures at the first and the last cooling stages. In this study, factory test data and field measurement data were used to develop such a performance model. Different statistical analyses were employed to validate the developed model. Based on the developed model, energy and exergy analyses were conducted to evaluate use of XT-DOAS for space cooling of a typical office building in Hong Kong. EnergyPlus was employed for the energy analysis. The laws of thermodynamics were used for the exergy analysis. Their combined results indicate that for better energy efficiency and performance for air-conditioning of office buildings in subtropical region, the optimum configuration for XT-DOAS is two cooling stages with a treated outdoor air temperature of 7 °C. The model developed and the energy and exergy analyses described will contribute significantly to future research in this area.
1. Introduction
The use of a dedicated outdoor air system (DOAS) for air-conditioning of office buildings has been widely investigated in recent years for better indoor air quality and energy efficiency [1]. A conventional DOAS often comprises two systems: an outdoor air (OA) system dedicated to produce high quantities of OA that handles the entire latent loads and part of the space sensible loads; and a terminal system to handle the remaining space sensible loads. As such, OA flow rate is higher and return air (RA) does not need to be circulated across different zones to enhance the indoor air quality. The OA system often uses active-desiccant technology; whilst the terminal system can be chilled beams/ceilings [2]. Energy savings can be derived from reheating and dehumidification energy reductions. However, there are concerns with such a system configuration. The use of active-desiccant technology to produce OA, despite it is energy effective [3], is space intensive to hinder its popular use in land scarcity cities like Hong Kong [4]. The use of chilled beams/ceilings as a terminal system will cause condensation problem, especially in subtropical regions where summers are long, hot and humid [2]. To solve the condensation problem, previous works proposed to keep beam/ceiling surface temperature above the indoor dew-point temperature by using different control methods [5] and system configurations [6] and to limit the indoor humidity gain [7]. However, the proposed methods will unavoidably introduce constraints on the cooling capacity [5] and operation of the terminal system [8].
To address the concerns, research studies have been done to investigate into using other system configurations. A series of studies have been done to investigate the use of chilled water system to treat OA and the use of dry fan-coil unit as the terminal system. However, it was found that the potential energy benefit is not significant and the condensation problem still exists [9,10,11]. Another study investigated the use of fan-coil unit as the OA system and chilled ceiling as the terminal system. However, it was found that condensate-free can only be achieved on the provision of a surface temperature control [12].
Hong Kong is a subtropical city where summers are hot and humid which increases the latent load significantly. Using treated outdoor air at extra-low temperature to handle the entire space load can take advantage of the use of deep coils to reduce the by-pass factor [13] for more efficient operation of the central cooling system. In this regard, a novel DOAS has been proposed [14]. The proposed DOAS system is a cold air distribution system that consists of a DOAS central system to produce extra-low temperature (XT) OA to handle the entire space cooling load and a mixing chamber as the terminal system for XT OA and RA. With this configuration, no cooling is required at the conditioned space to avoid condensation problems.
The central system is a variable speed multi-stage direct expansion (DX) unit. A DX unit is used because of its ability to operate at low evaporator temperatures to achieve the intended cooling and dehumidification objectives [15]. Energy savings are associated with the use of XT OA, variable speed system and multi-stage configuration. Dry XT OA enables the use of high-temperature and low-humidity indoor design condition to save energy [16]. Variable-speed system capable of regulating its motor speed to modulate output is considered more energy efficient [17]. The multi-stage configuration, which is a novel concept, enables improved equipment performance associated with working under higher evaporator temperatures (1st stage) and smaller temperature lifts (between evaporator and condenser) [18]. It also enables the use of different control strategies to have further energy benefits [19].
A series of studies have been conducted by the authors to confirm the effective usage of the proposed XT-DOAS in a Hong Kong office environment. Based on the use of different system configurations, it was found that the proposed system, as compared to the conventional system, can reduce the annual indoor discomfort hours by 16.2% to 69.4%, the annual air-conditioning energy use by 12% to 22.6%, and the condensation risk to almost zero [14,20,21]. The desired indoor relative humidity can also be better achieved [14]. However, in these studies, the analyses were focused on performance comparison with conventional system and were done based on a conventional coil performance model. This is acceptable for previous studies, but for optimizing the system configuration to achieve desirable air conditions and better energy efficiency, it is not desirable because XT-DOAS receives hot and humid OA at the first cooling stage and handles extra-low temperature air at the last cooling stage to introduce substantial influence on the DX coil’s performance [22]. Unfortunately, a performance curve that takes into account the extra-high temperature range is lacking in the public literature.
Using parallel-connected units to meet cooling demand is commonly seen in central chilled water systems. A lot of studies have been done to investigate the influence of different designs on the system’s overall performance including heat rejection mediums [23], ambient conditions [24], compressor efficiencies [25], unit capacities [26] and part load performances [27]. However, for the series-connected multi-stage DX system, the overall performance is not only affected by the above factors, but also affected by the entering air thermodynamic states at different part load conditions. Previous work is virtually none.
As for energy performance evaluation, previous studies rarely take into account the exergy efficiency [28]. Exergy analysis is based on the second law of thermodynamics. It can identify localized inefficiencies and thus is commonly used for the design, and performance evaluation of energy systems [29]. For the proposed XT-DOAS using series-connected multi-stage DX system, the moist air entering and leaving individual cooling stages is of different states to affect the available energy and thus the exergy efficiency [30]. Therefore, exergy analysis is essential for the optimum design of multi-stage DX system. Considering that both energy use and exergy loss are essential energy system characteristics, the authors had conducted an exergy analysis on XT-DOAS and confirmed that it was more energy efficient than conventional system [21]. However, in the previous study, the multi-stage DX system was regarded as an integral component. The multi-stage characteristic had not been considered.
Given the limitations of previous studies, this study aims to develop a realistic coil performance to optimize the system configuration of XT-DOAS aiming to achieve desirable air conditions and better energy efficiency. The energy efficiency evaluations will be based on energy as well as exergy analyses to take into account the combined influence of the thermodynamic states of moist air entering and leaving individual cooling stages and the corresponding part load conditions on the overall performance of XT-DOAS. The multi-stage characteristics of the DX coil will be considered in the exergy analysis.
2. System Description
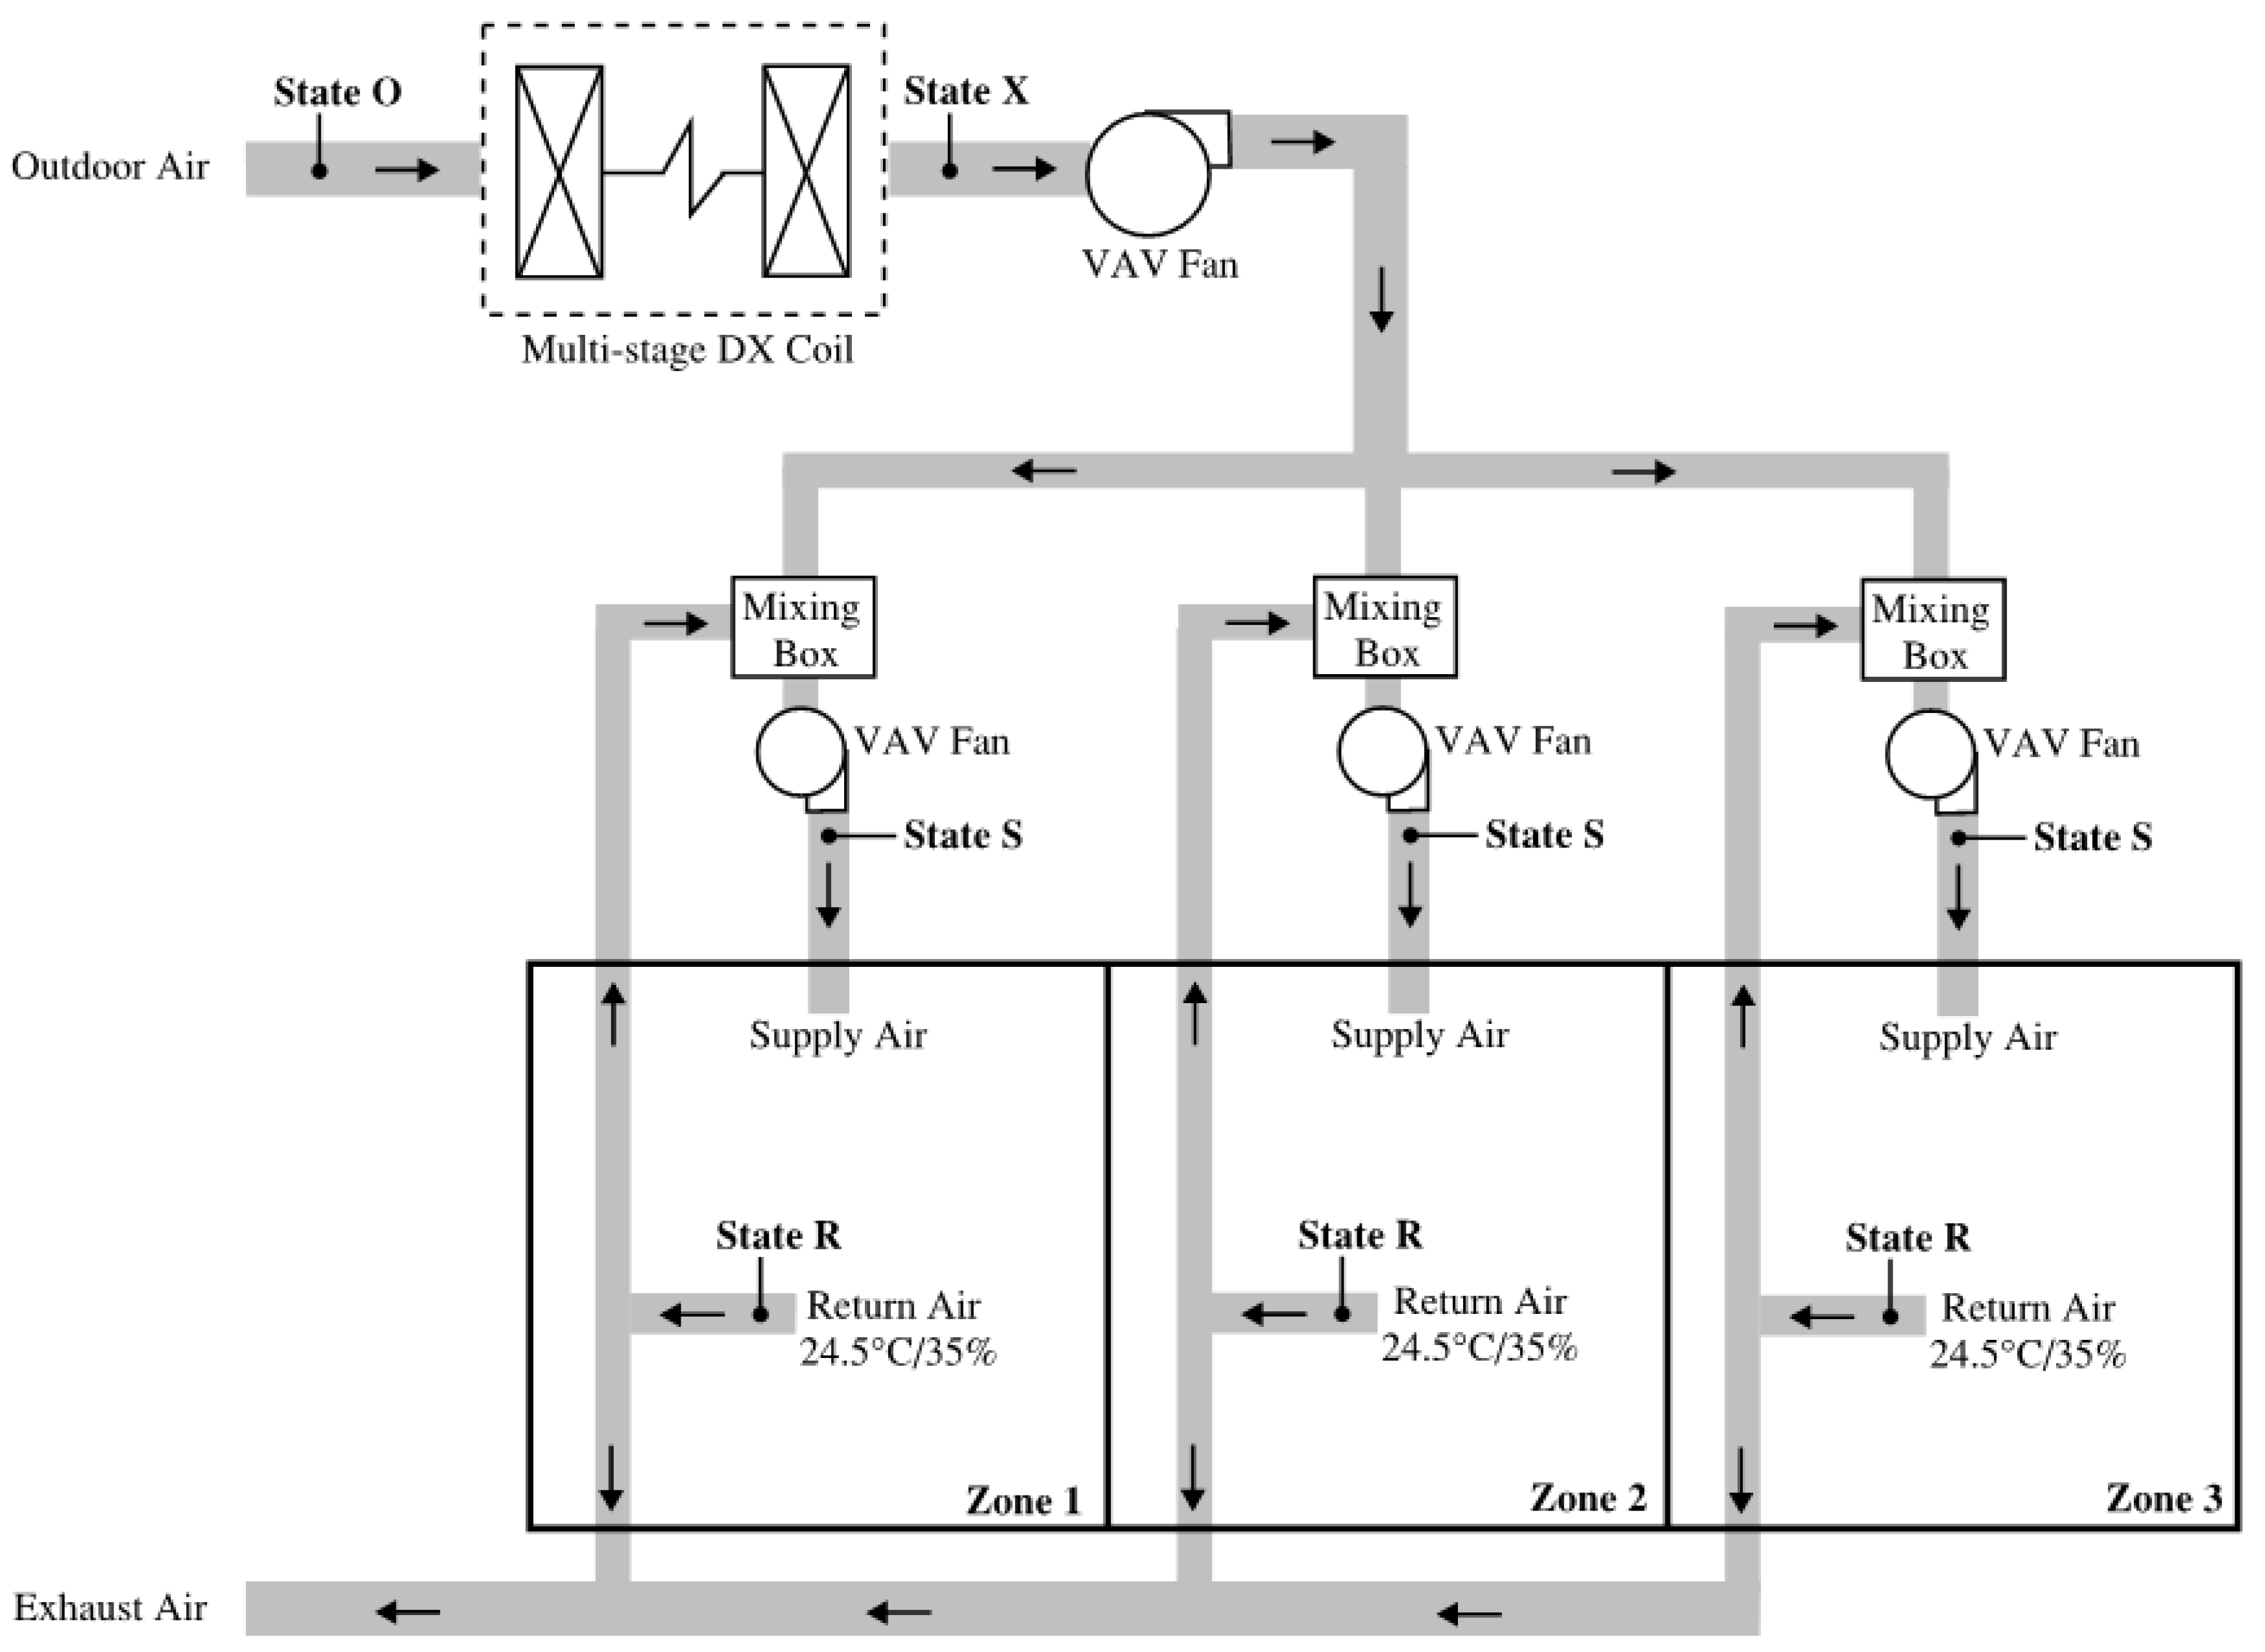
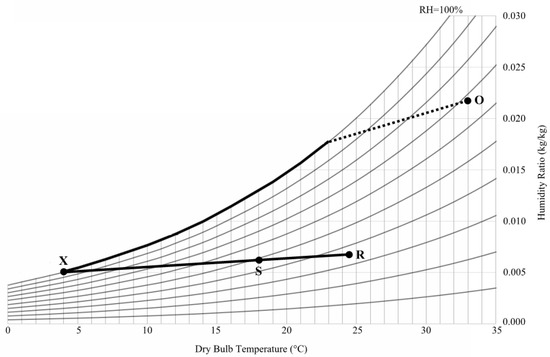
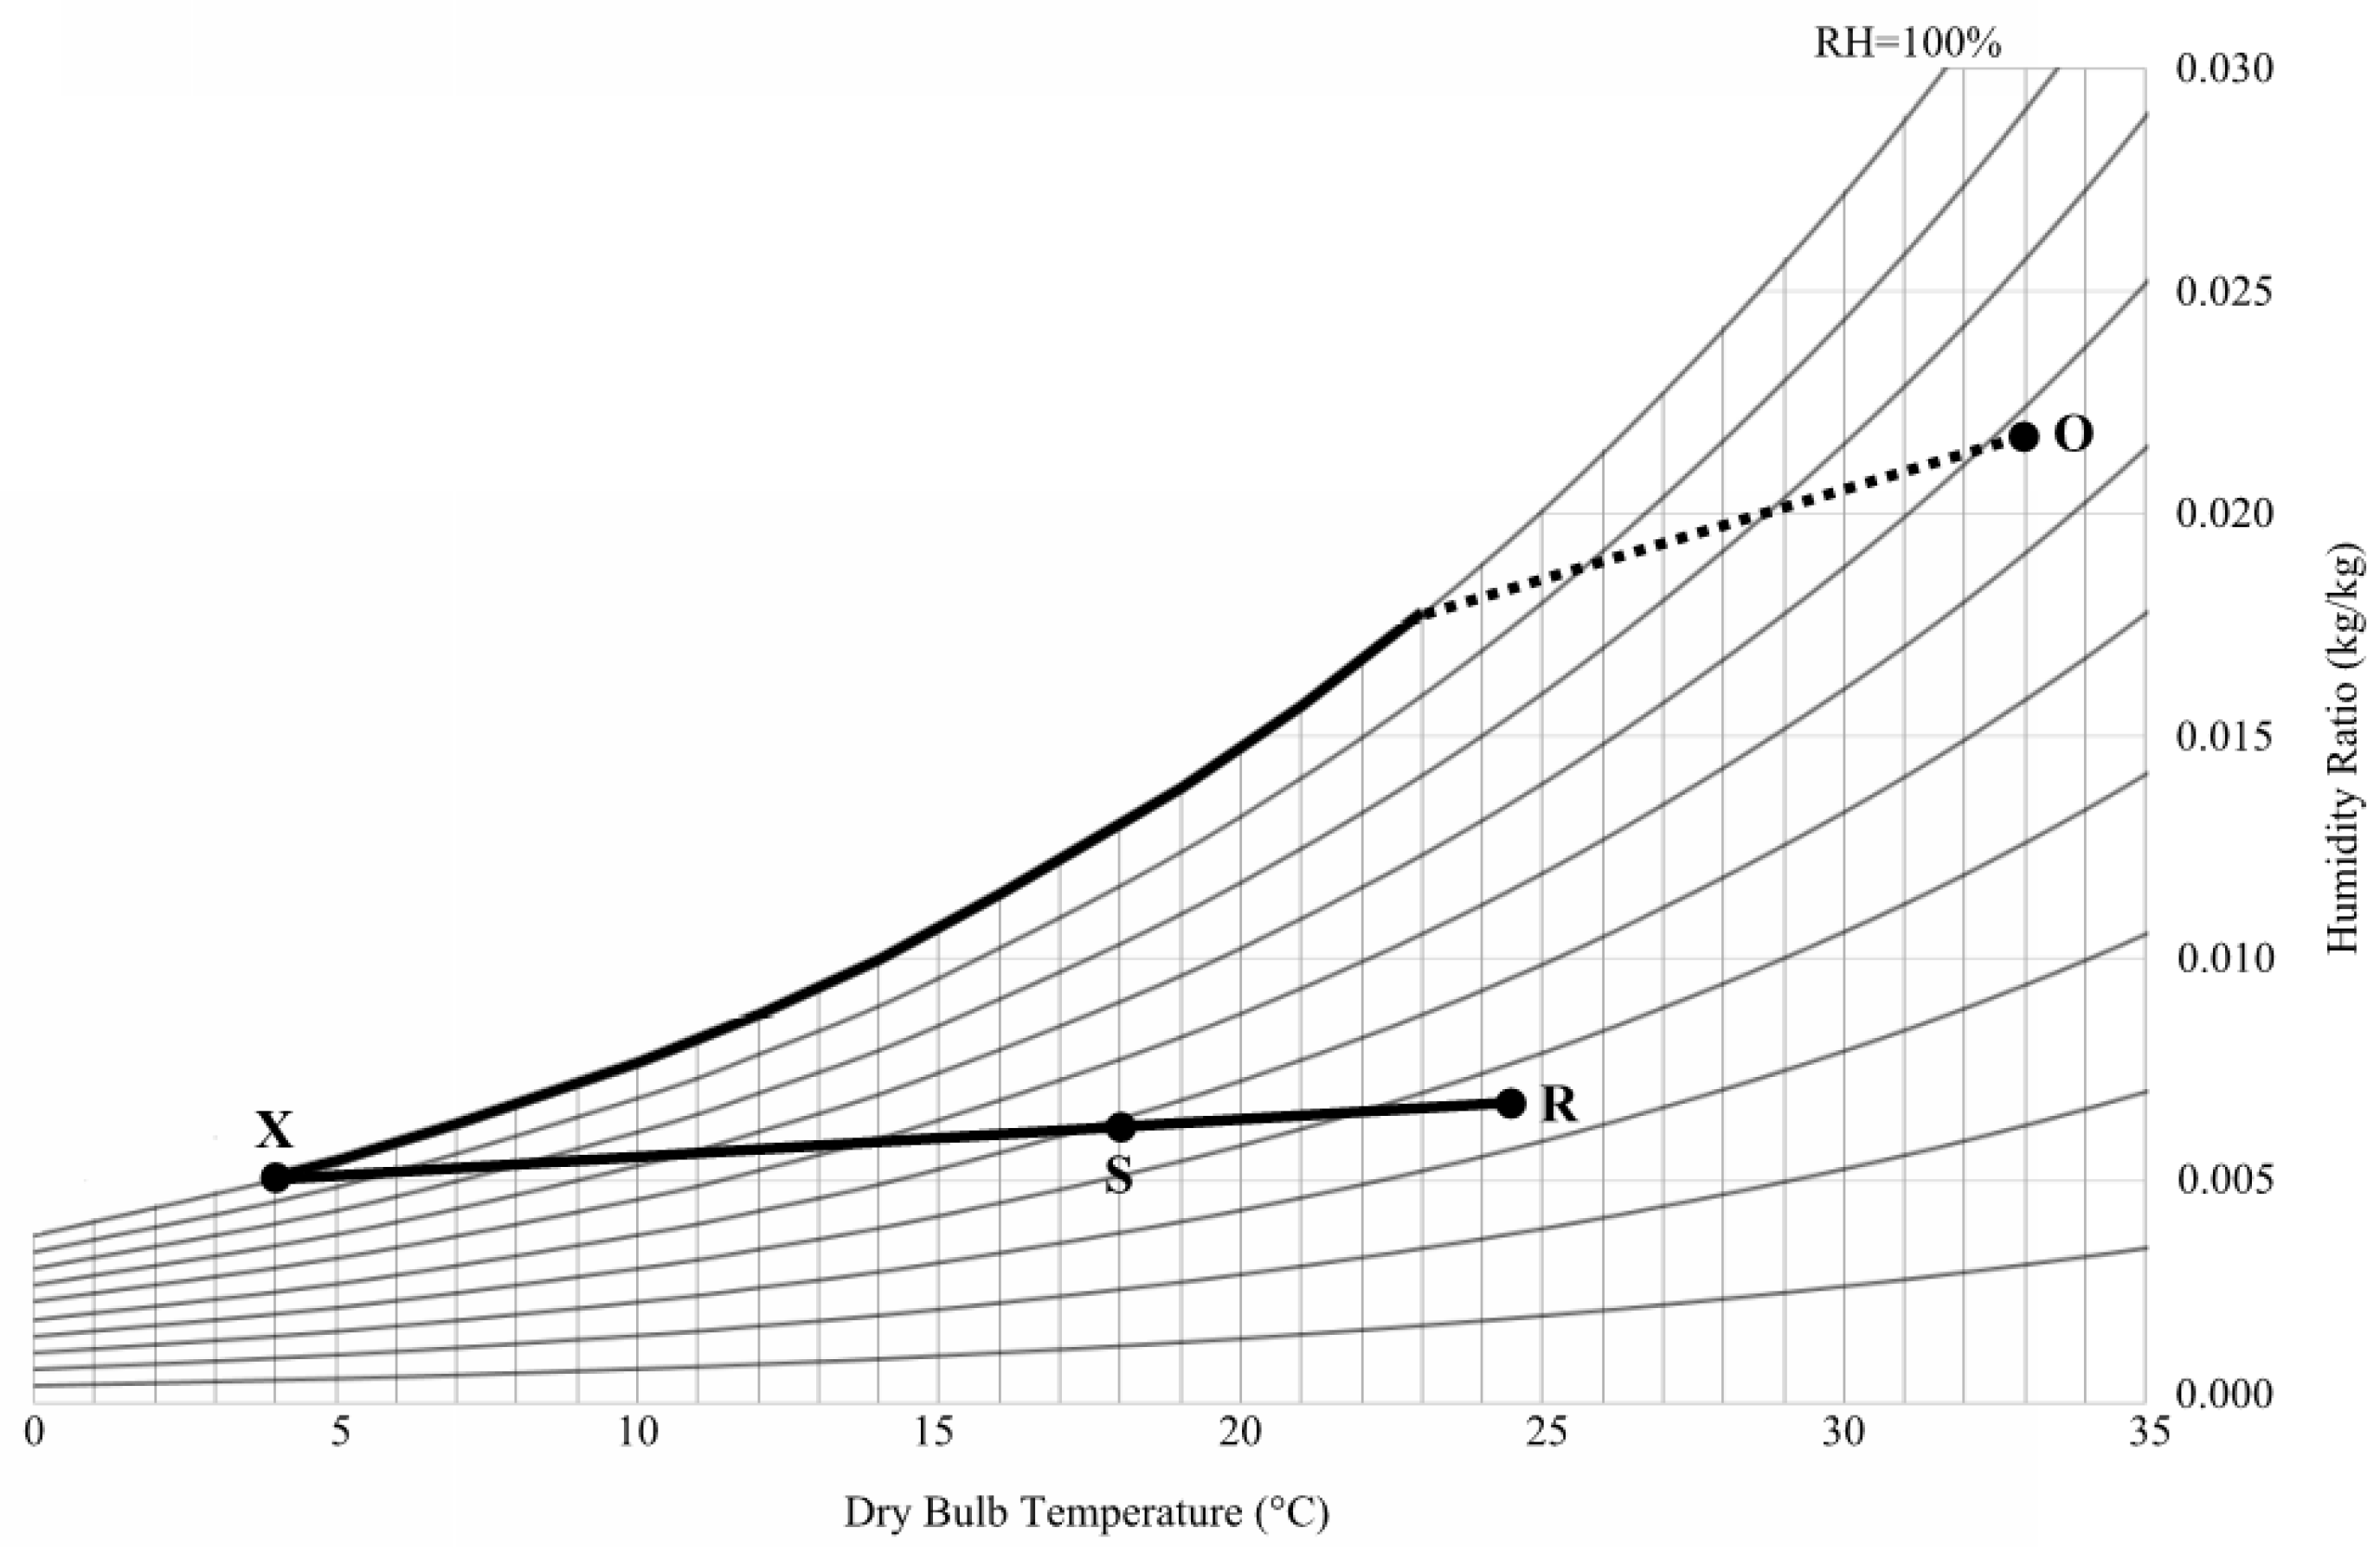
The proposed XT-DOAS system consists of a central OA system and a mixing box as the terminal system. They both are assumed provided with variable air volume (VAV) control because Hong Kong office buildings typically adopt VAV systems [31]. Figure 1 and Figure 2 show the schematic diagram and the psychrometric process of the proposed XT-DOAS system. The central system uses a multi-stage DX coil to generate a variable volume of OA (State O) with minimum flow setting to a saturated and XT state (State X) and subsequently delivers to the mixing box of individual zones to mix with the space return air (State R) to become supply air (State S). A variable volume of supply air successively delivers to the space to offset the instantaneous cooling demand to maintain the desired space conditions (State R). The minimum OA flow setting is to satisfy the minimum ventilation requirement of the occupied spaces [32].
Figure 1.
Schematic diagram of XT-DOAS.
Figure 2.
Psychrometric process of XT-DOAS.
The thermodynamic states in Figure 1 and Figure 2 and the associated airflow rates were preliminarily determined by common design practice. The design parameters are summarized in Table 1. It can be seen that the desired indoor conditions were set as 24.5 °C dry bulb (DB) and 35% relative humidity (RH), which according to a previous study, has the equivalent thermal comfort level as the common desired indoor condition in Hong Kong (24 °C DB/50% RH) [14]. A slightly higher indoor temperature helps reduce sensible cooling energy use to offset the additional latent cooling energy use [16]. Moreover, to avoid thermal discomfort caused by dumpling XT OA directly into the air-conditioned space, the XT OA is designed to mix with RA to become supply air at 18 °C (State S) for better thermal comfort [20]. The outdoor air conditions (State O) used in the simulation were referred to the hourly data of the Typical Meteorological Year file of Hong Kong.
Table 1.
Design conditions of XT-DOAS.
3. Methodology
The energy performance of XT-DOAS is dominated by the consumption of the multi-stage DX unit and VAV fans. Thus to optimize the system configuration aiming to achieve desirable air conditions and better energy efficiency, the focus is to determine the treated OA temperature (tX, the multi-stage DX coil leaving air temperature at State X) and the number of cooling stages (N), which correspondingly affect the thermodynamic states of moist air entering and leaving individual cooling stages and the associated part load conditions.
Energy simulations and exergy analysis were performed for the use of XT-DOAS in a case study building based upon a realistic coil performance model developed to account for the extra-high and extra-low entering air temperatures. EnergyPlus Version 8.1 was employed for the energy simulations.
3.1. Case Study Building
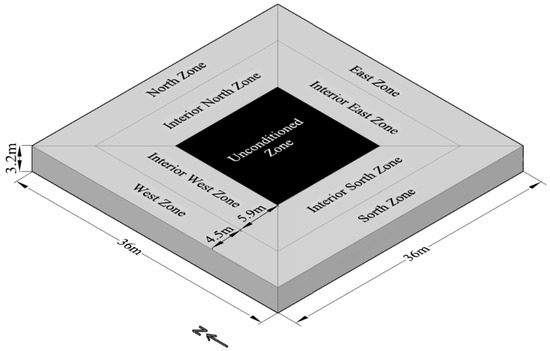
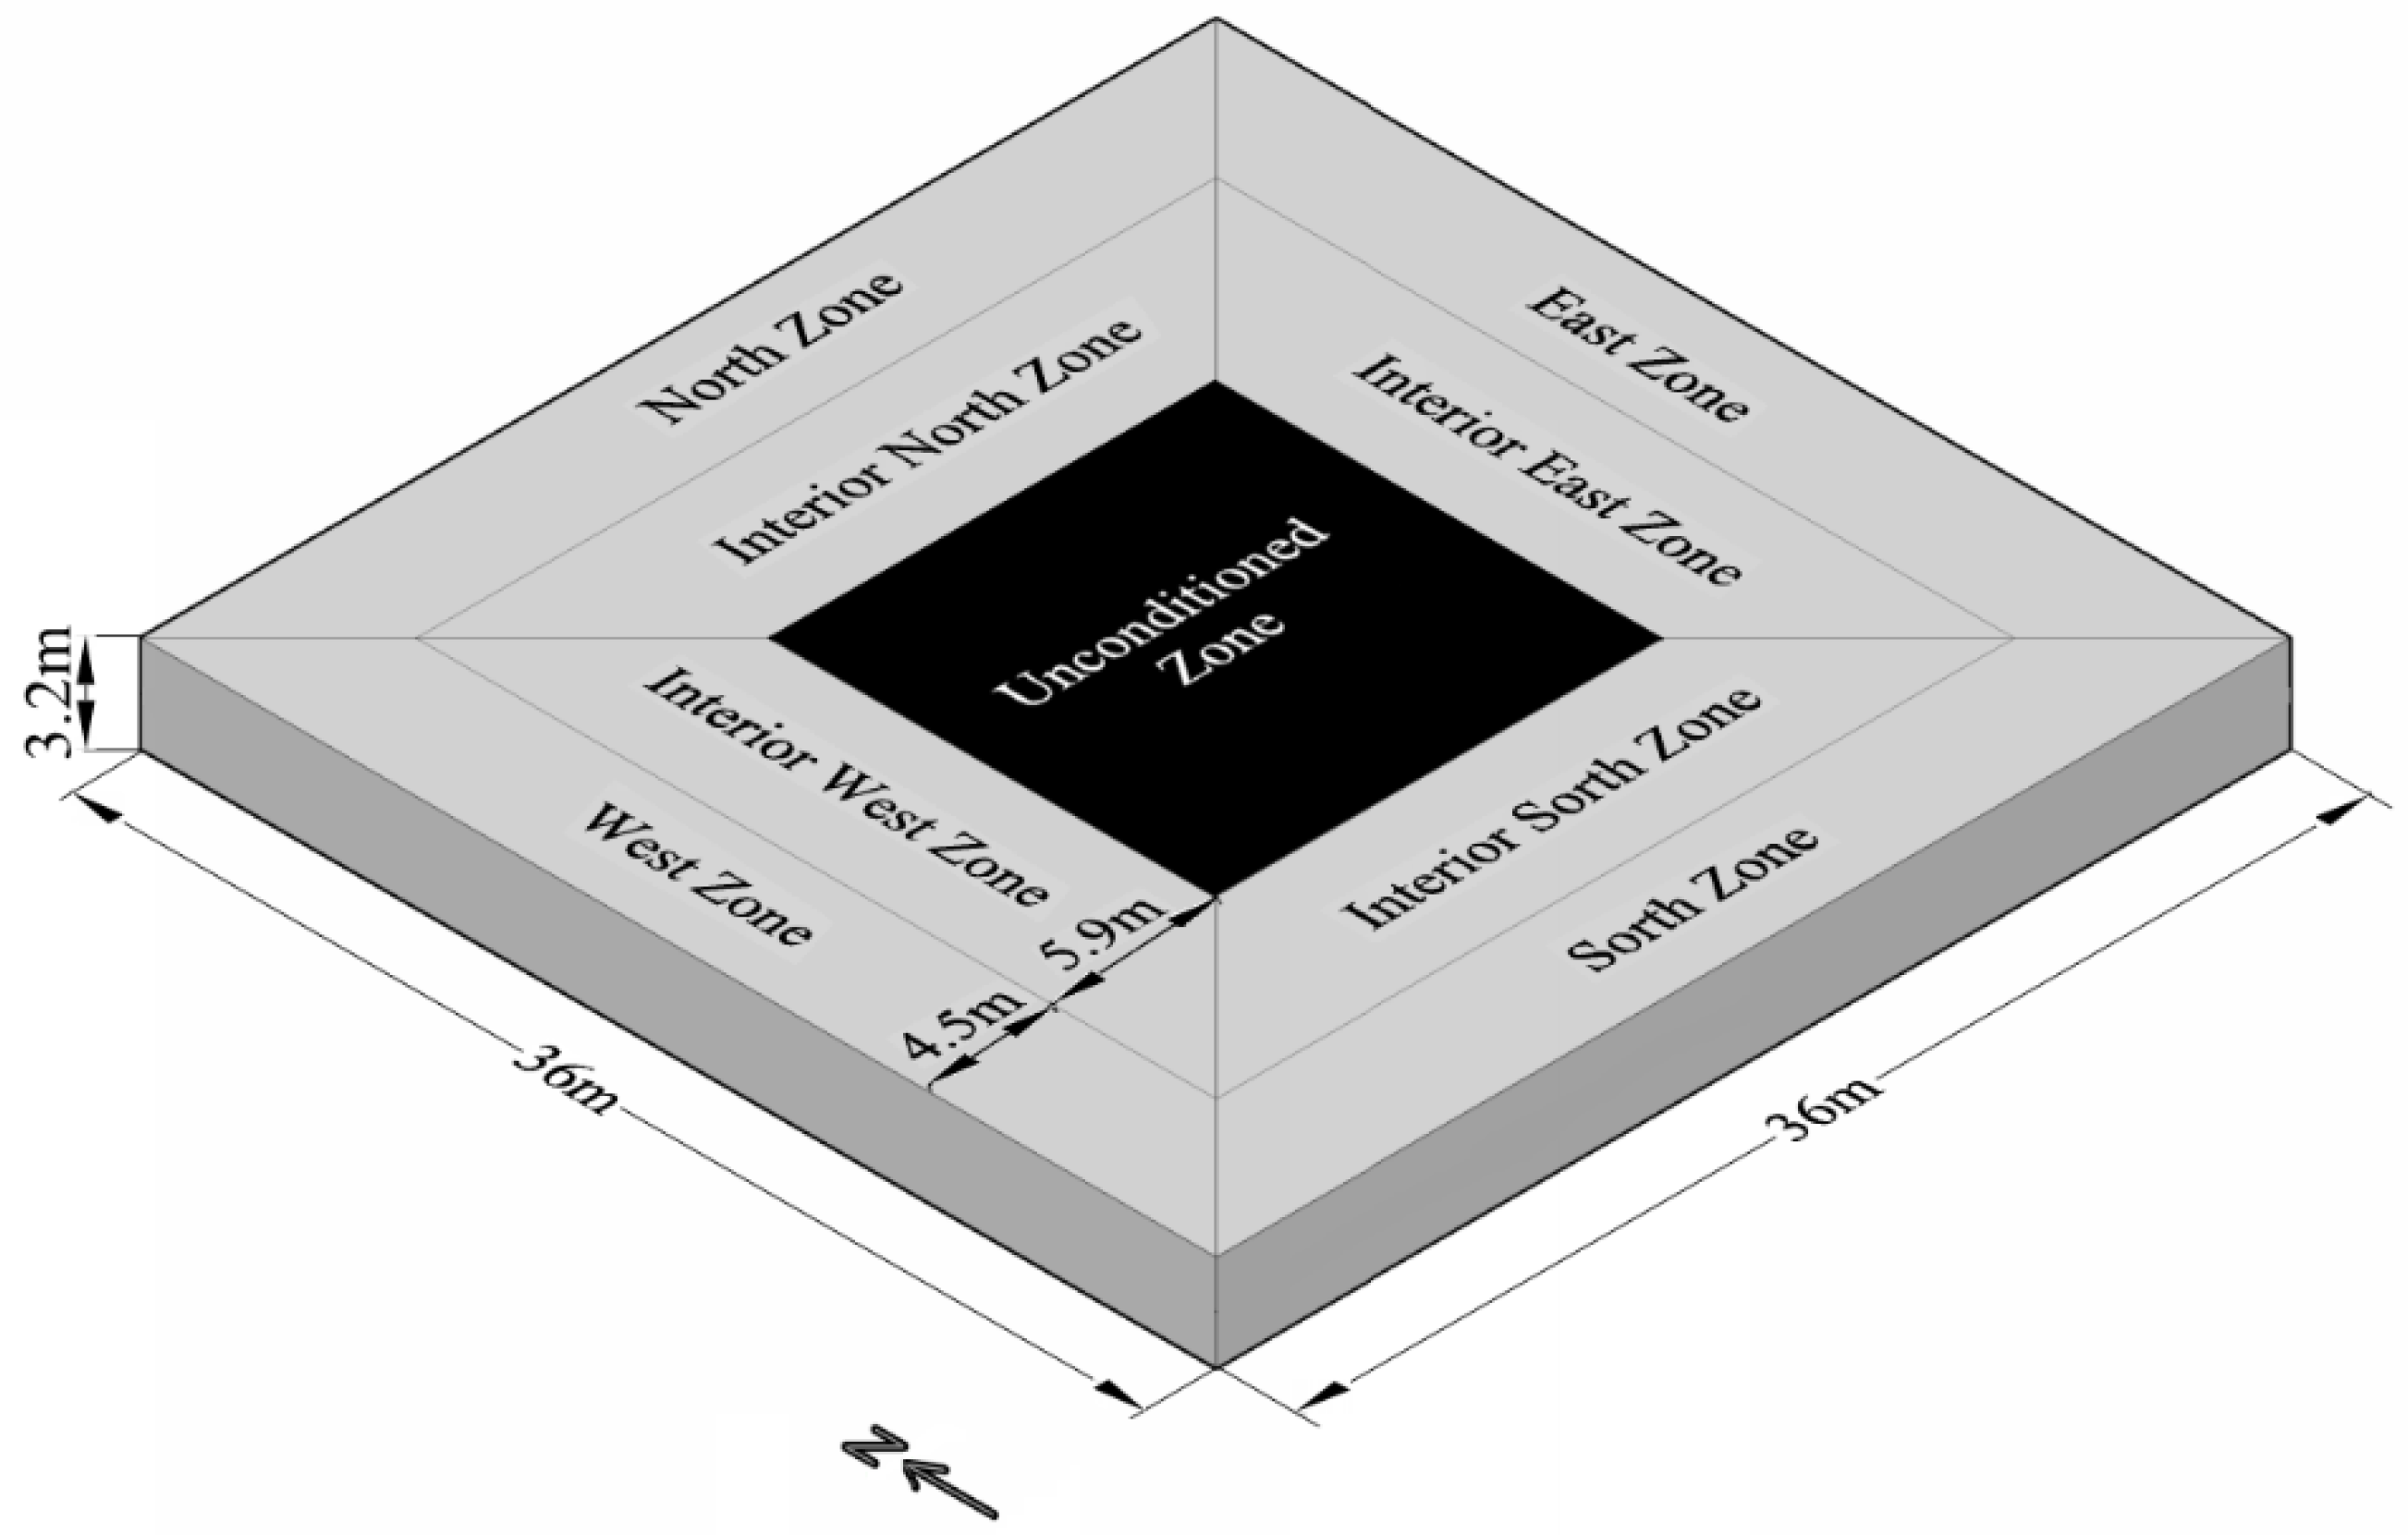
A typical office building in Hong Kong was selected as a case study building to facilitate this study. The building’s architectural, construction and services system characteristics were established based on findings of extensive surveys conducted in Hong Kong [10]. The usage patterns of the air-conditioning, occupants, lighting and appliances, etc. were by referenced to BEAMPlus [33]. The design parameters were determined according to local codes [34]. As the same case study building has been referenced for many previous studies [14,20,21,35,36], to avoid duplications, only the typical floor layout and building characteristics are given. They are shown in Figure 3 and Table 2, respectively.
Figure 3.
Typical floor layout of the studied building.
Table 2.
Building and design characteristics.
In deciding the range of values for the two studied parameters, reference was made to cold system design [15] and previous studies [14,20,21]. tX, was set as 4 °C to 10 °C (1 °C interval) and the number of cooling stage (N) was set as 2 to 4. Single cooling stage has been excluded to avoid operating at unfavourably high temperature differential [15] and to benefit from multi-stage characteristics.
3.2. Coil Performance Model Development
Owing to the high entering air temperature and extra-low leaving air temperature to affect the coil performance for XT-DOAS [22], two default performance curves in EnergyPlus (abbreviated as CAP-FT and EIR-FT) for total cooling output (CAP) and the energy input ratio (EIR), as a function of temperature (FT), need to be developed.
3.2.1. Performance Curve Formulation
According to EnergyPlus, the two performance curves to be developed are mathematically shown below [22]:
where CAP is the total cooling output, kW; CAPrated is the rated total cooling capacity, kW; EIRrated is the rated power input ratio, which is the inverse of the rated energy efficiency ratio; EIR is the operating power input ratio, which is the inverse of the operating energy efficiency ratio; WBei is the entering air wet bulb temperature at the DX coil (evaporator), °C; DBci is the entering air dry bulb temperature at the condenser, °C; and are empirical coefficients.
Regression analysis [37] was used to determine the empirical coefficients in CAP-FT and EIR-FT curves based on real data.
3.2.2. Data Collection
To formulate the performance curves that cover a much higher temperature range than that of a conventional system, performance data for DX unit operating at extra-high and extra-low temperature range needs to be collected.
Extra-Low Temperature Side
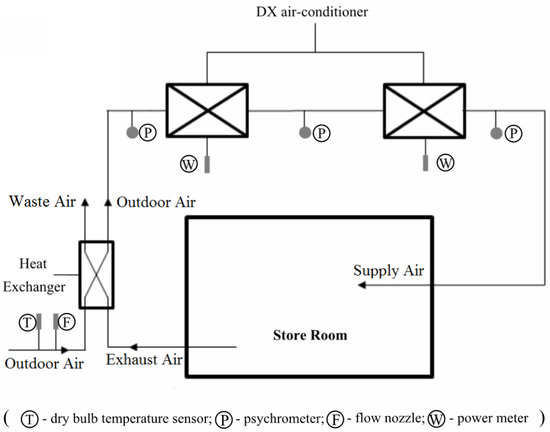
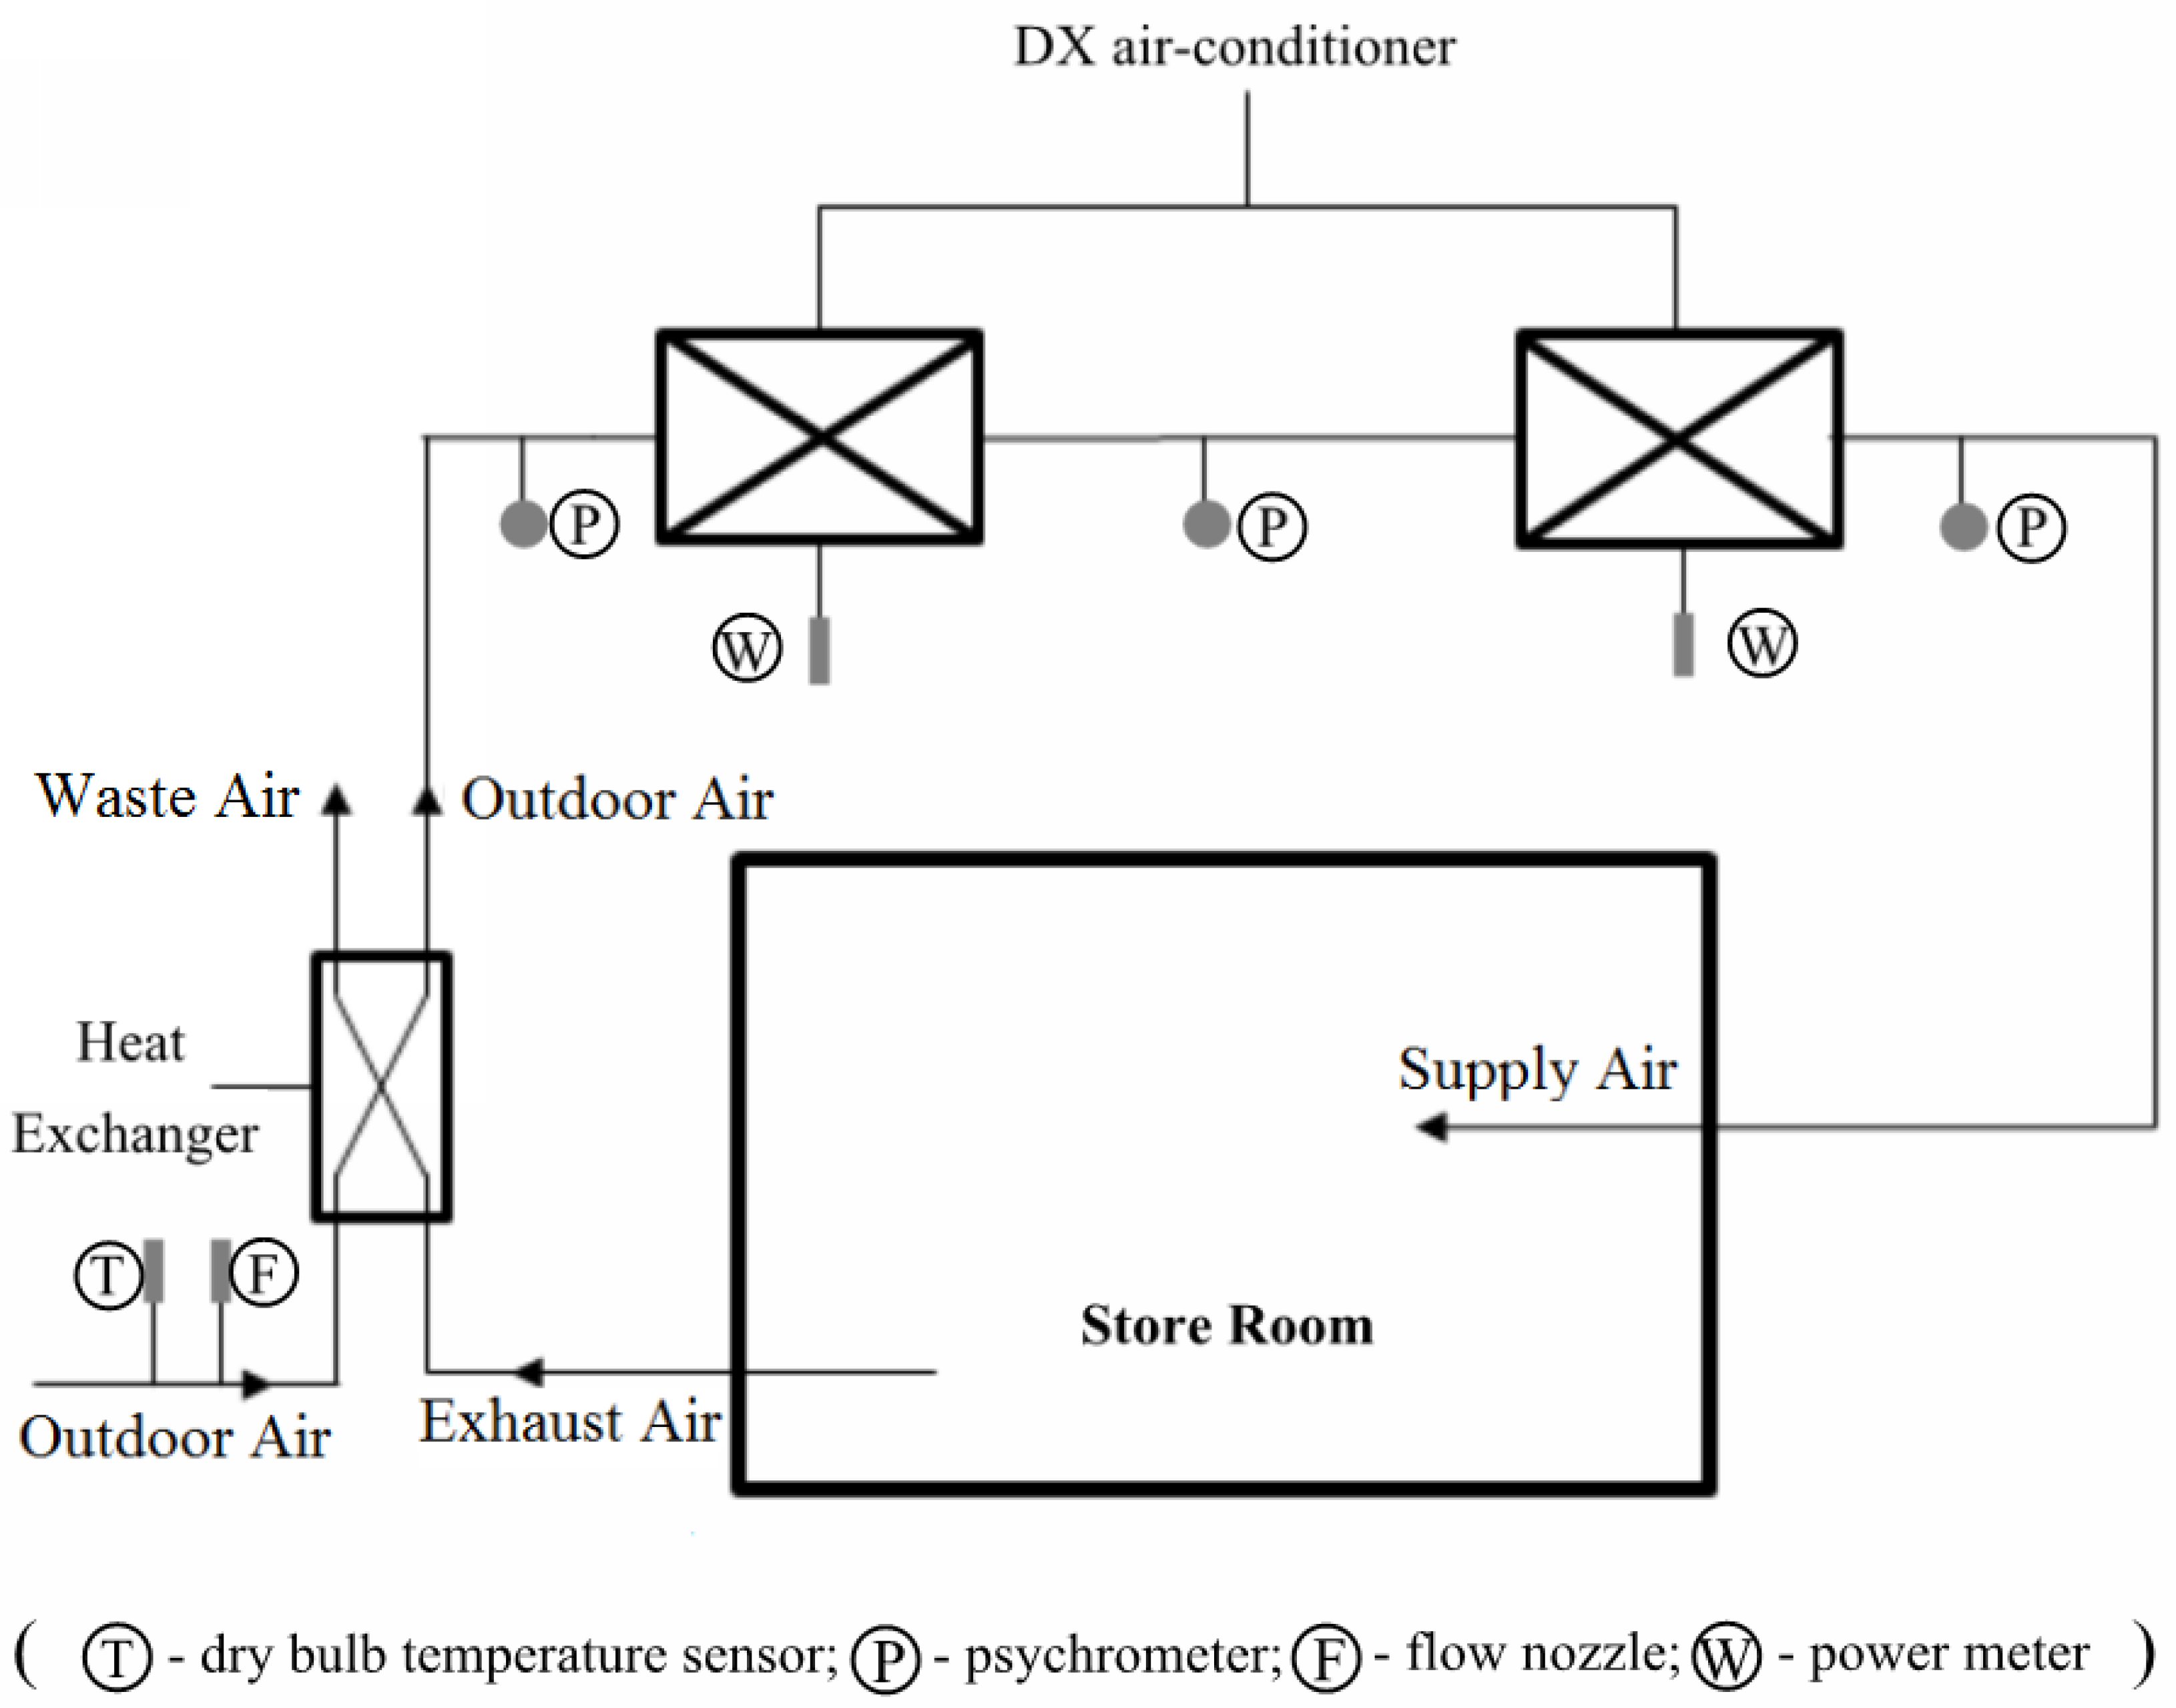
Performance data for the extra-low temperature side was obtained from a field measurement campaign. The field measurement was conducted at a pilot installation [38]. It comprises two DX air-conditioners each with a cooling capacity of 22.7 kW together with a total enthalpy heat exchanger. They were connected in series to generate supply air at 6 °C DB to maintain a 56 m2 store room at 10 °C DB. The store room is for dangerous goods. It requires to be maintained at around 10 °C DB year round. To reduce the explosion risk, no air recirculation is allowed, which resembles a DOAS configuration. The air-side operating conditions (outdoor air temperature, and the entering and leaving air dry bulb and wet bulb temperatures) and the power consumption of the two DX air-conditioners and the condenser fans in the pilot installation were monitored by a remote monitoring system. Given the two DX units were with different operating conditions and thus efficiencies, a sufficiently wide range of data were collected to develop the extra-low temperature part of CAP-FT and EIR-FT curves. Specifications of the DX air-conditioners and the configuration of the pilot installation are shown in Table 3 and Figure 4, respectively.
Table 3.
Specifications of the DX air-conditioners.
Figure 4.
Configuration of the pilot installation.
Extra-High Temperature Side
DX units that can handle high temperature OA are rare in the market. With enormous effort made to contact different manufacturers, factory test data of a series of brand new DX units dedicated for OA conditioning were collected [39]. The test data covers performance characteristics of DX units treating OA at a maximum of 35 °C DB and 32 °C WB to a discharge temperature of 18 °C DB. It includes the total cooling capacity and input power at various outdoor air conditions. The total cooling capacity is a gross value. The total input power includes the consumption of compressor, condenser fan and auxiliary equipment (e.g., control panel power) but excludes the supply air fan.
By normalizing the field measurement and factory test data into consistent format as summarized in Table 4, regression analysis was conducted to develop a standardized set of performance curves that covers the entire operation range of XT-DOAS. In Table 4, a normalized performance coefficient of 1 refers to the performance at AHRI standard rated test condition [40].
Table 4.
The normalized data sets.
3.2.3. Regression Models
Based on the data collected as detailed in Section 3.2.2, multiple regression analysis using SPSS [41] was conducted to determine the coefficients for the CAP-FT and EIR-FT curves (Equations (1) and (2)). The regressed coefficients and the resultant models are shown as follows:
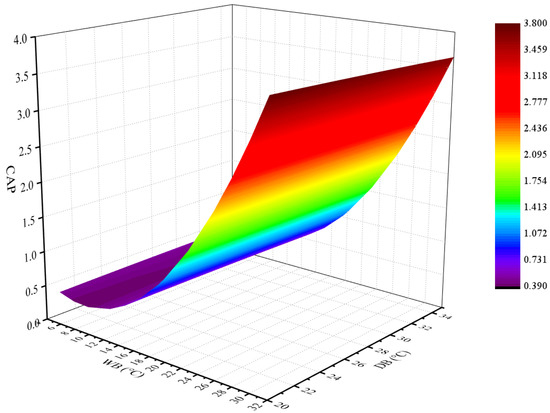
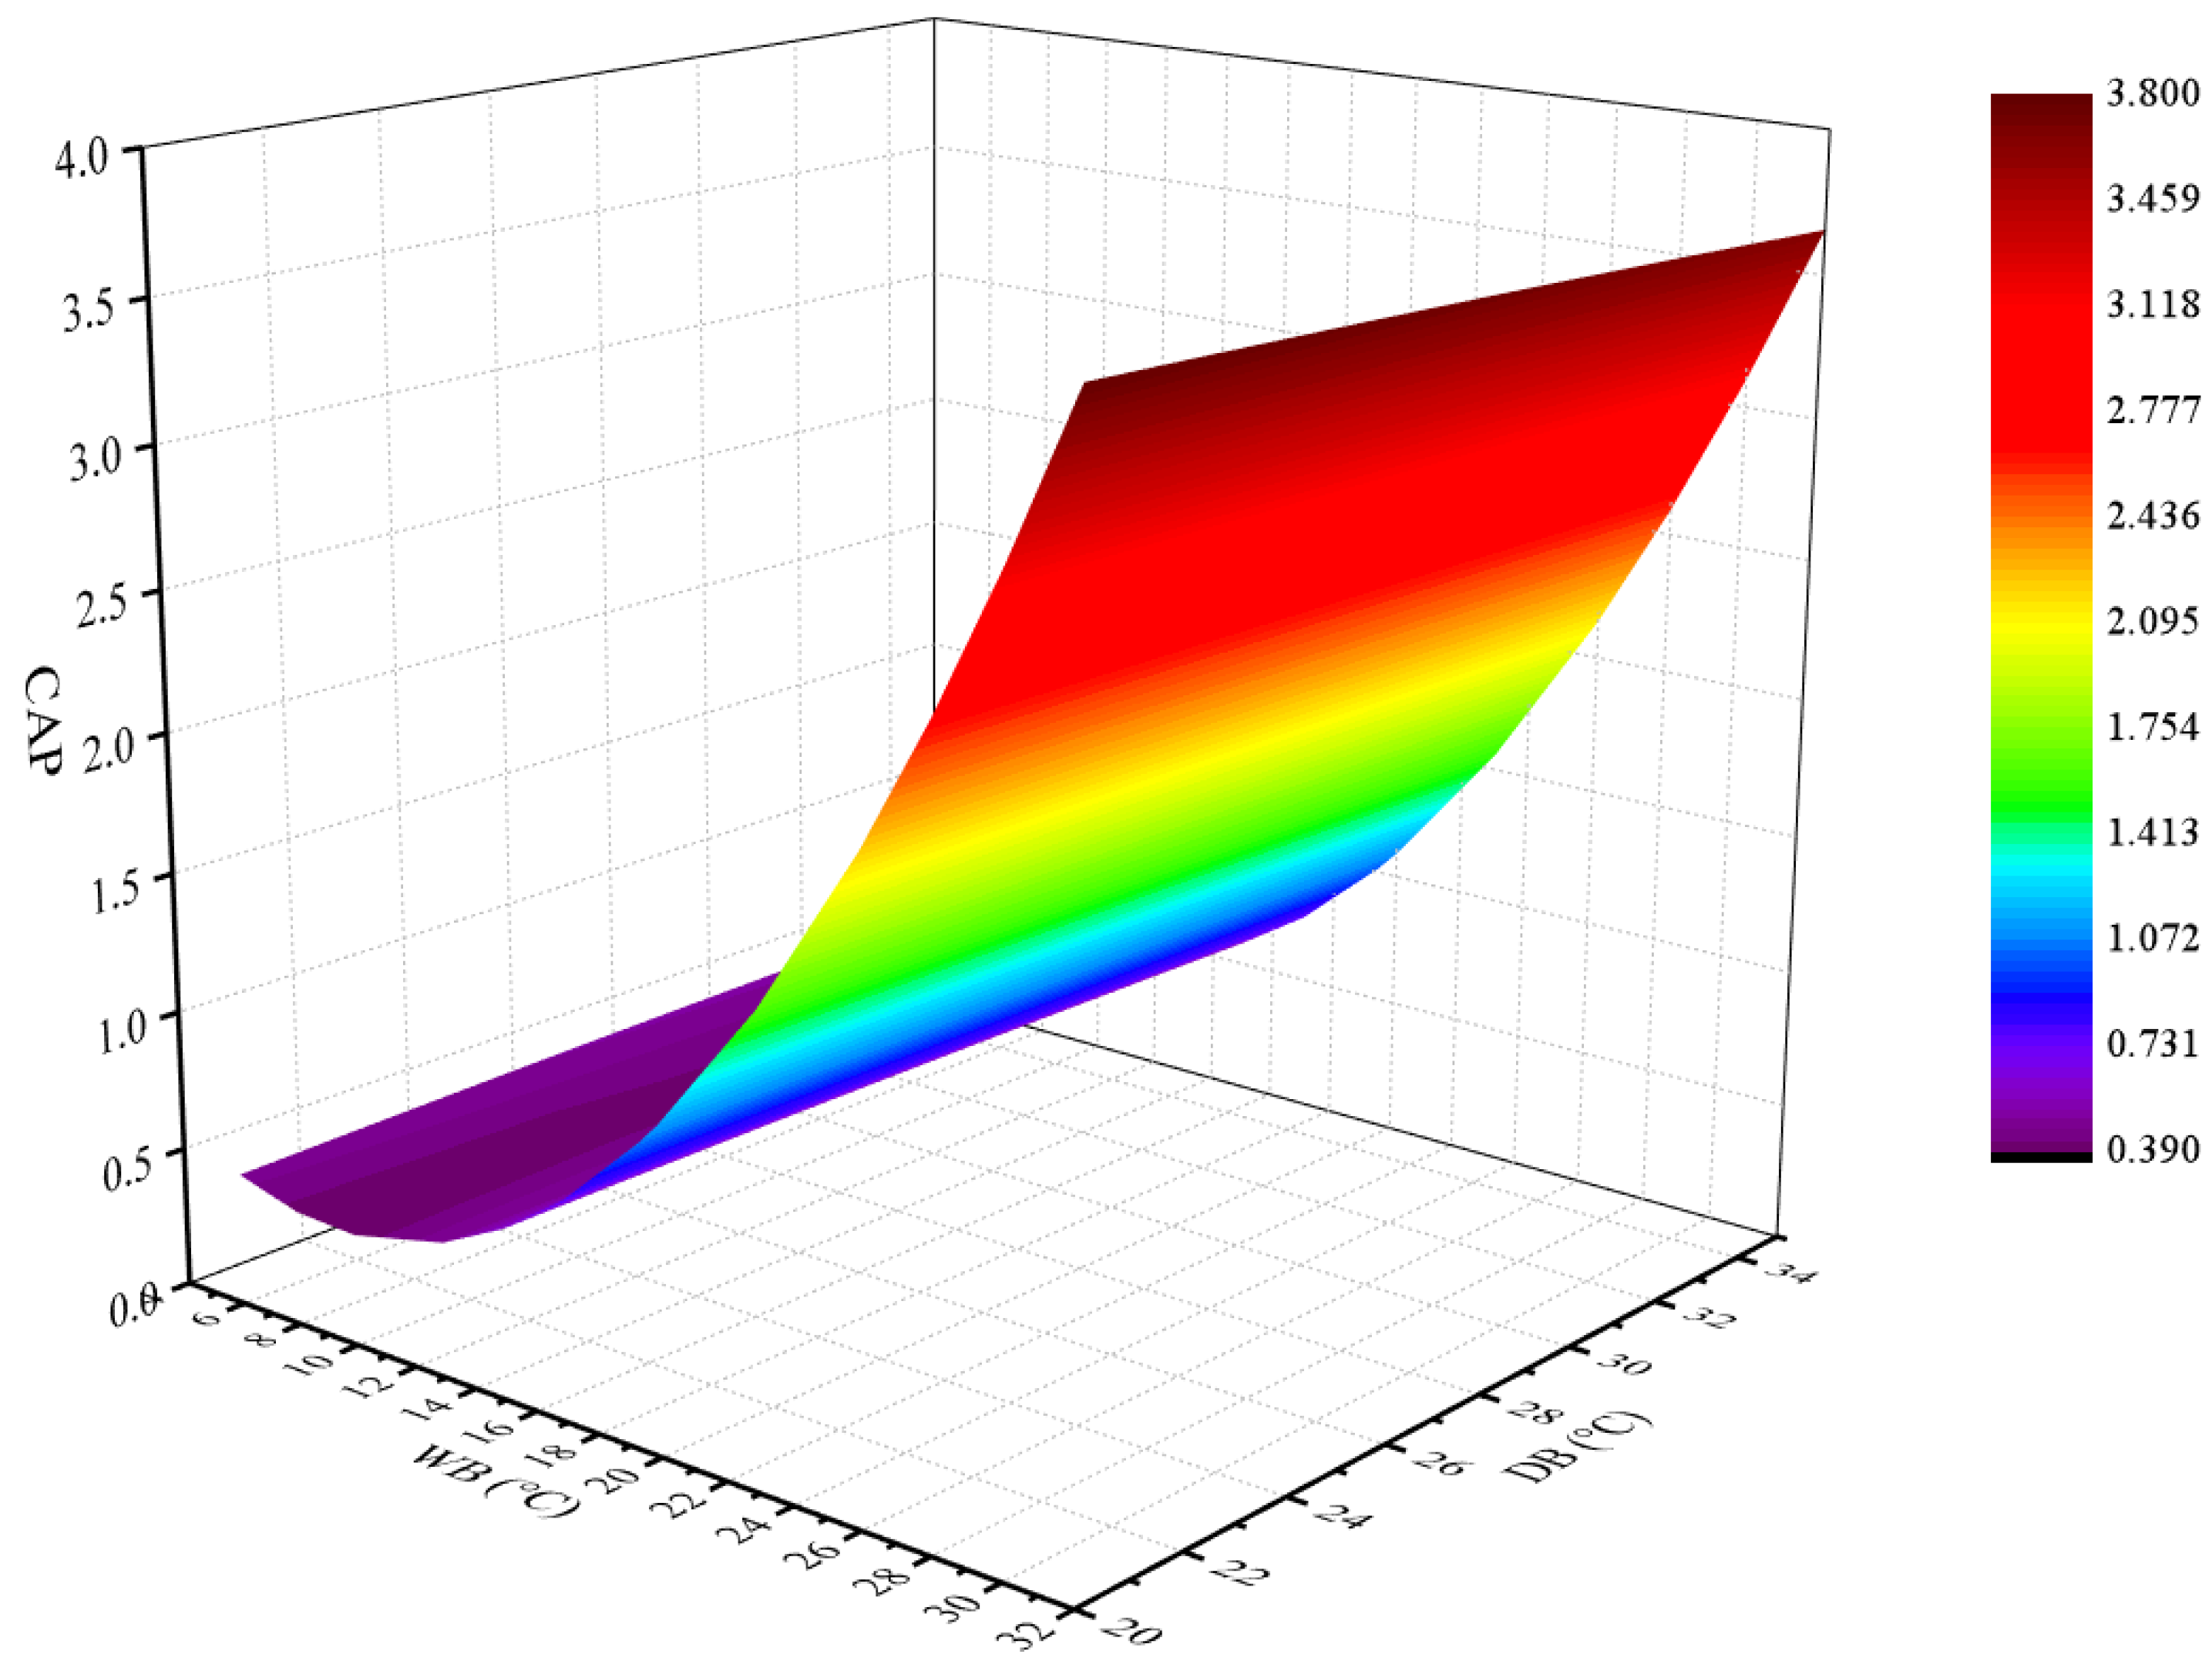
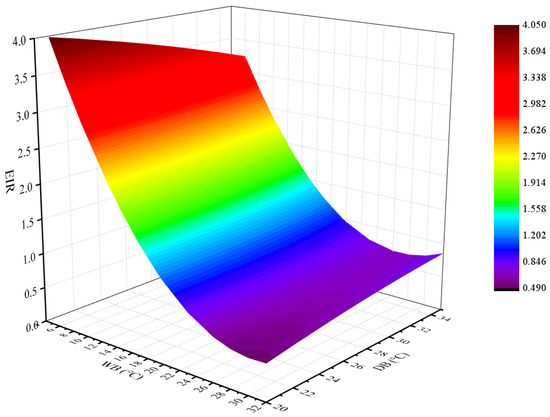
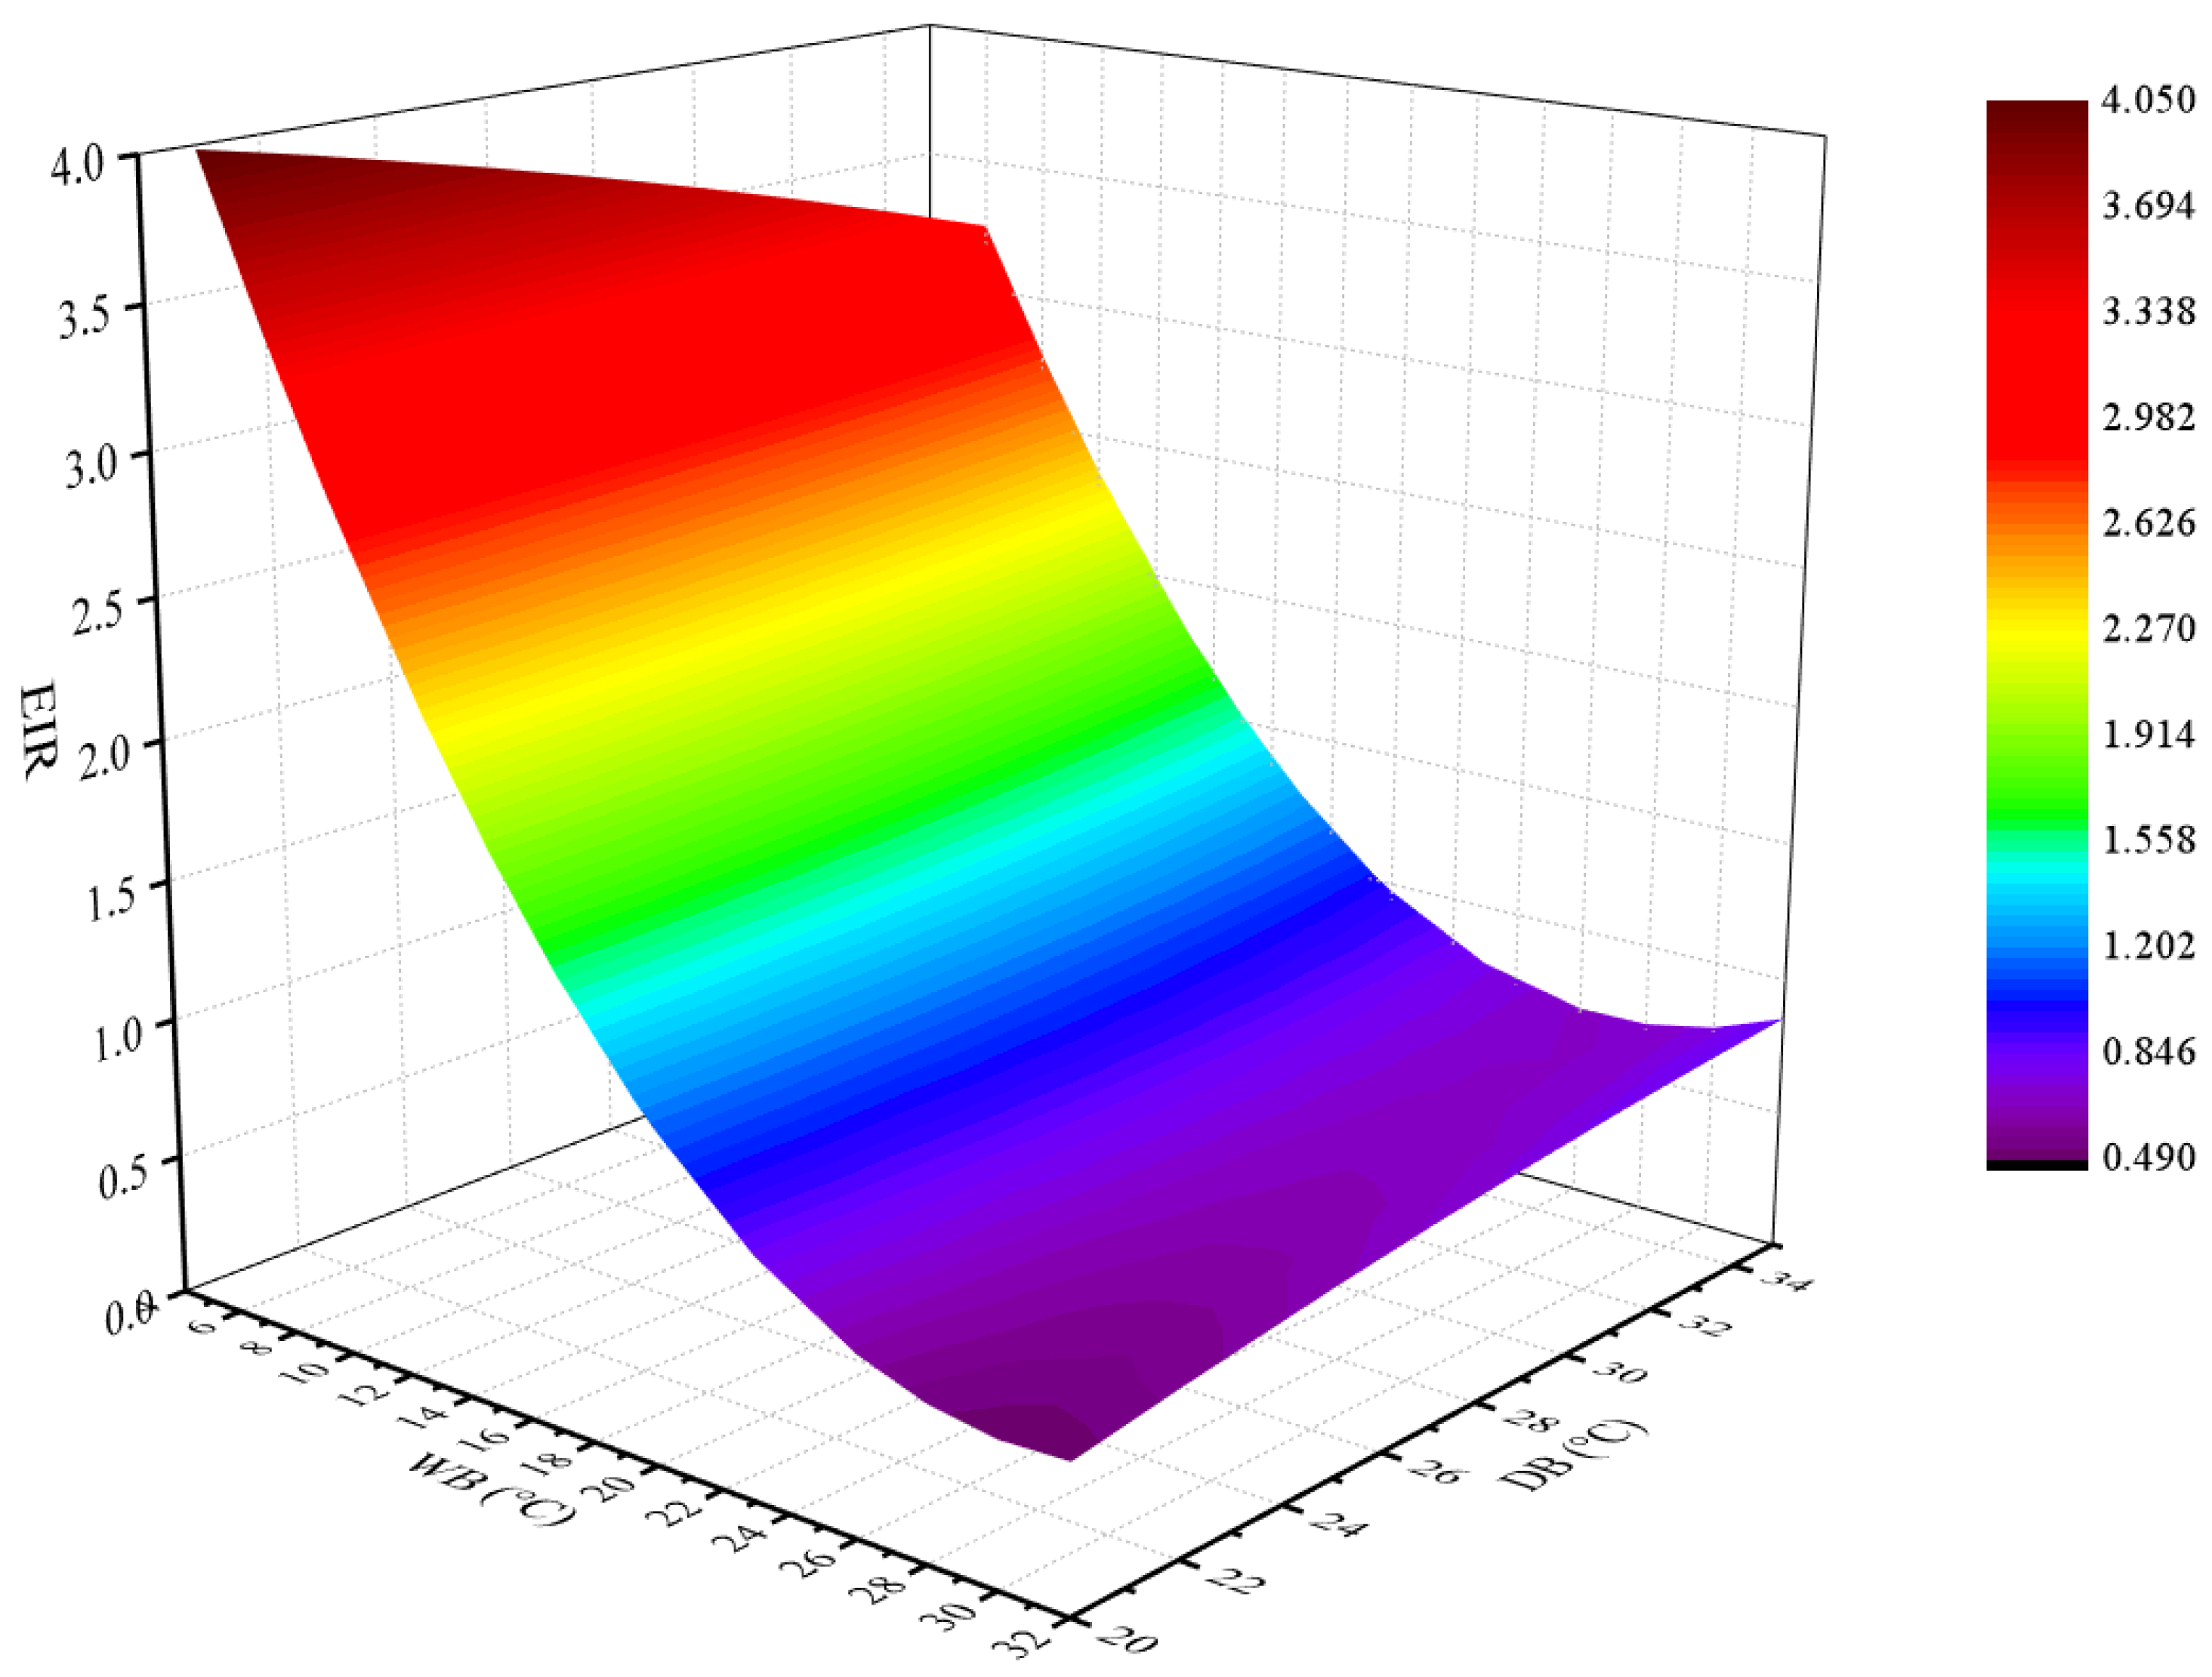
Verification of the regression models is summarized in Appendix A. Figure 5 and Figure 6 are visual representation of the CAP-FT and EIR-FT performance curves. The CAP-FT curve shows that the DX coil’s cooling output CAP increases with entering air WB temperature WBei but varies very little with the condenser entering air DB temperature DBci. The EIR-FT curve shows that the CAP increases primarily with WBei but the power input W decreases with both WBei and DBci. In other words, a lower WBei results in a higher EIR and thus lower COP.
Figure 5.
CAP-FT performance curve.
Figure 6.
EIR-FT performance curve.
3.3. Energy Analysis
Based on the developed coil performance model, EnergyPlus simulations were performed. The inputs to EnergyPlus include the hourly meteorological conditions in Hong Kong, the internal heat sources (occupants, lighting and equipment), the studied building’s architectural and construction details, the air-conditioning system adopted (XT-DOAS in this case), the system and equipment characteristics and the range of studied parameters. The result generated after the simulation run is extensive. It allows users to extract the desired data, which include temperatures, moisture contents, mass flow rates, coils’ cooling outputs, space sensible and latent loads and energy usage of the equipments. Based on the resultant space air conditions, the ability of the XT-DOAS operating under the pre-defined range of studied parameters to maintain the desirable air conditions was evaluated. The corresponding energy usage was also extracted for exergy analysis.
3.4. Exergy Analysis
Based on energy simulation results from EnergyPlus, exergy analysis was performed based on the laws of thermodynamics. Exergy analysis has been used to examine the optimum air states entering and leaving the multi-stage coil associated with the changes in tX and N, which includes the calculation of moist air exergy and exergy efficiency of different system configurations.
3.4.1. Moist Air Exergy
Air-conditioning systems handle moist air. The exergy level of moist air is therefore important. Moist air exergy is the maximum useful power when moist air is converted reversibly to the environment. Most exergy research regards the reference environment state as the dead state and assumes zero exergy to calculate the exergy change [42]. While considering the unsaturated moist air still has energy available, the dead state is suggested as the saturated moist air at the same temperature and pressure as the reference environment state [43]. However, given the reference environment state varies with outdoor conditions, in this study, the hourly energy and exergy analysis based on year-round outdoor conditions were considered. By treating the moist air encountered in an air conditioning system as an ideal gas, the moist air exergy transferred from the basic forms of relevant exergy can be represented by Equation (5) which is [44]:
where ex is the exergy of moist air per unit mass dry air, kJ/kg dry air; Cda is the specific heat of dry air, kJ/kg·K; Cwv is the specific heat of water vapour, kJ/kg·K; w is the humidity ratio of moist air, kg/kg dry air; is the humidity ratio of dead state, kg/kg dry air; T is the temperature of moist air, K; T0 is the reference environmental temperature, K; Rda is the ideal gas constant of dry air, kJ/kg·K; P is the pressure of moist air, kPa; P0 is the reference environmental barometric pressure (atmospheric pressure), kPa.
The total exergy of moist air (ex) can also be represented as the sum of thermal exergy (exth), mechanical exergy (exme) and chemical exergy (exch). Thermal exergy is the maximum useful work when moist air is transformed from the initial temperature state to the dead temperature state. Mechanical exergy is equal to the mechanical work itself. Chemical exergy represents the maximum useful work associated with the transition of moisture content of moist air from the initial state to the dead state. They are represented by Equations (6) to (8), which are derived from Equation (5):
Since w0s in Equations (5) and (8) cannot be output directly from EnergyPlus, it has to be calculated by the ideal gas law from the reference environmental barometric pressure (P0) and the saturation pressure of water vapour (Pws), as described in Equation (9):
The saturation pressure of water vapour can be determined by Equation (10), which is of sufficient accuracy between 273.15K (0 °C) and 646.15 K (373 °C) [45].
where Tc is the critical temperature, 647.096 K; Pc is the critical pressure, 22,064 kPa.
3.4.2. Exergy Flow
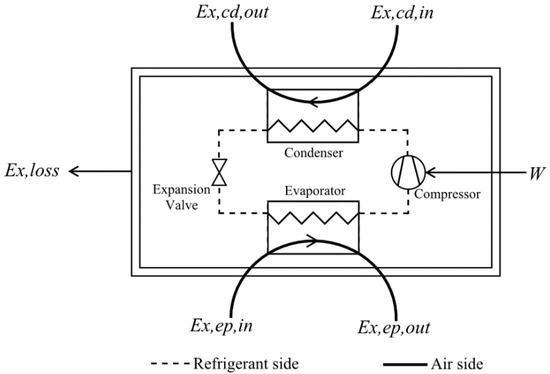
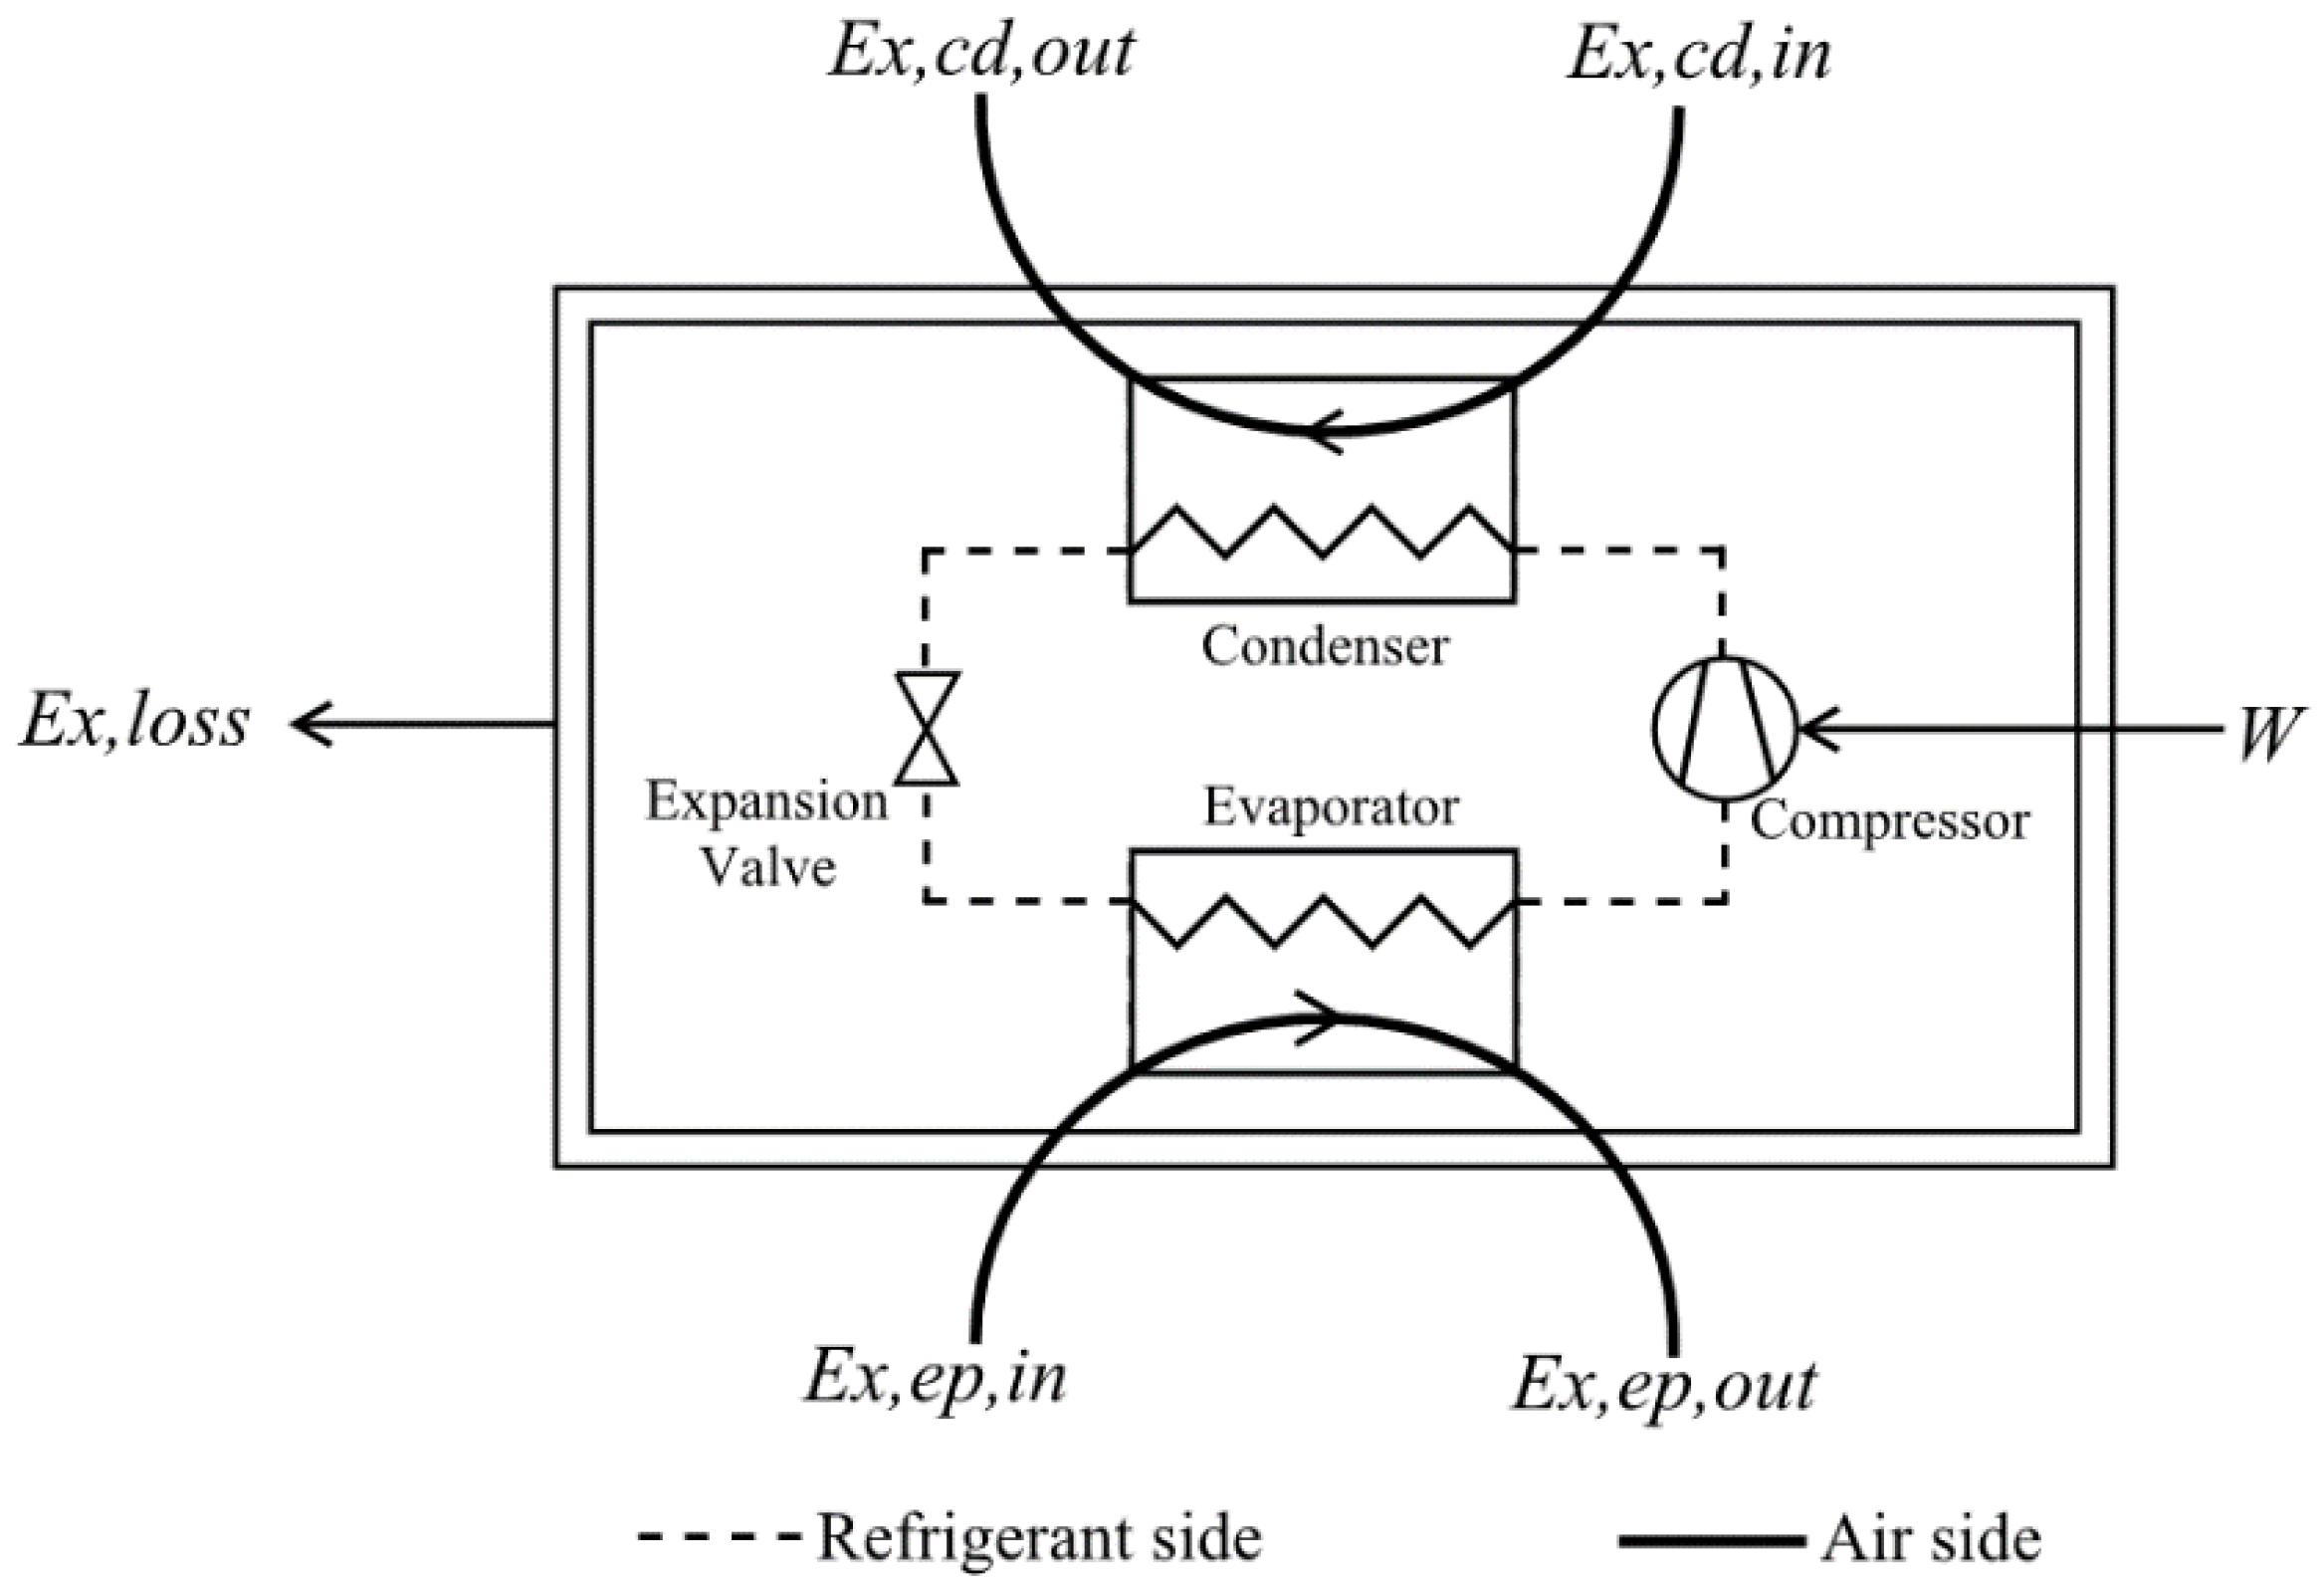
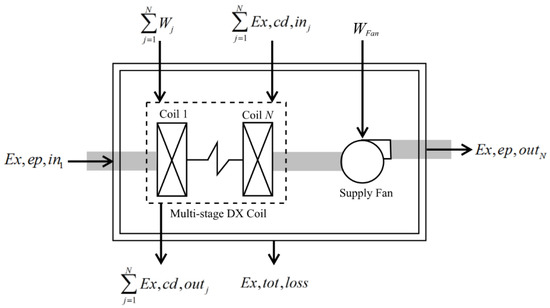
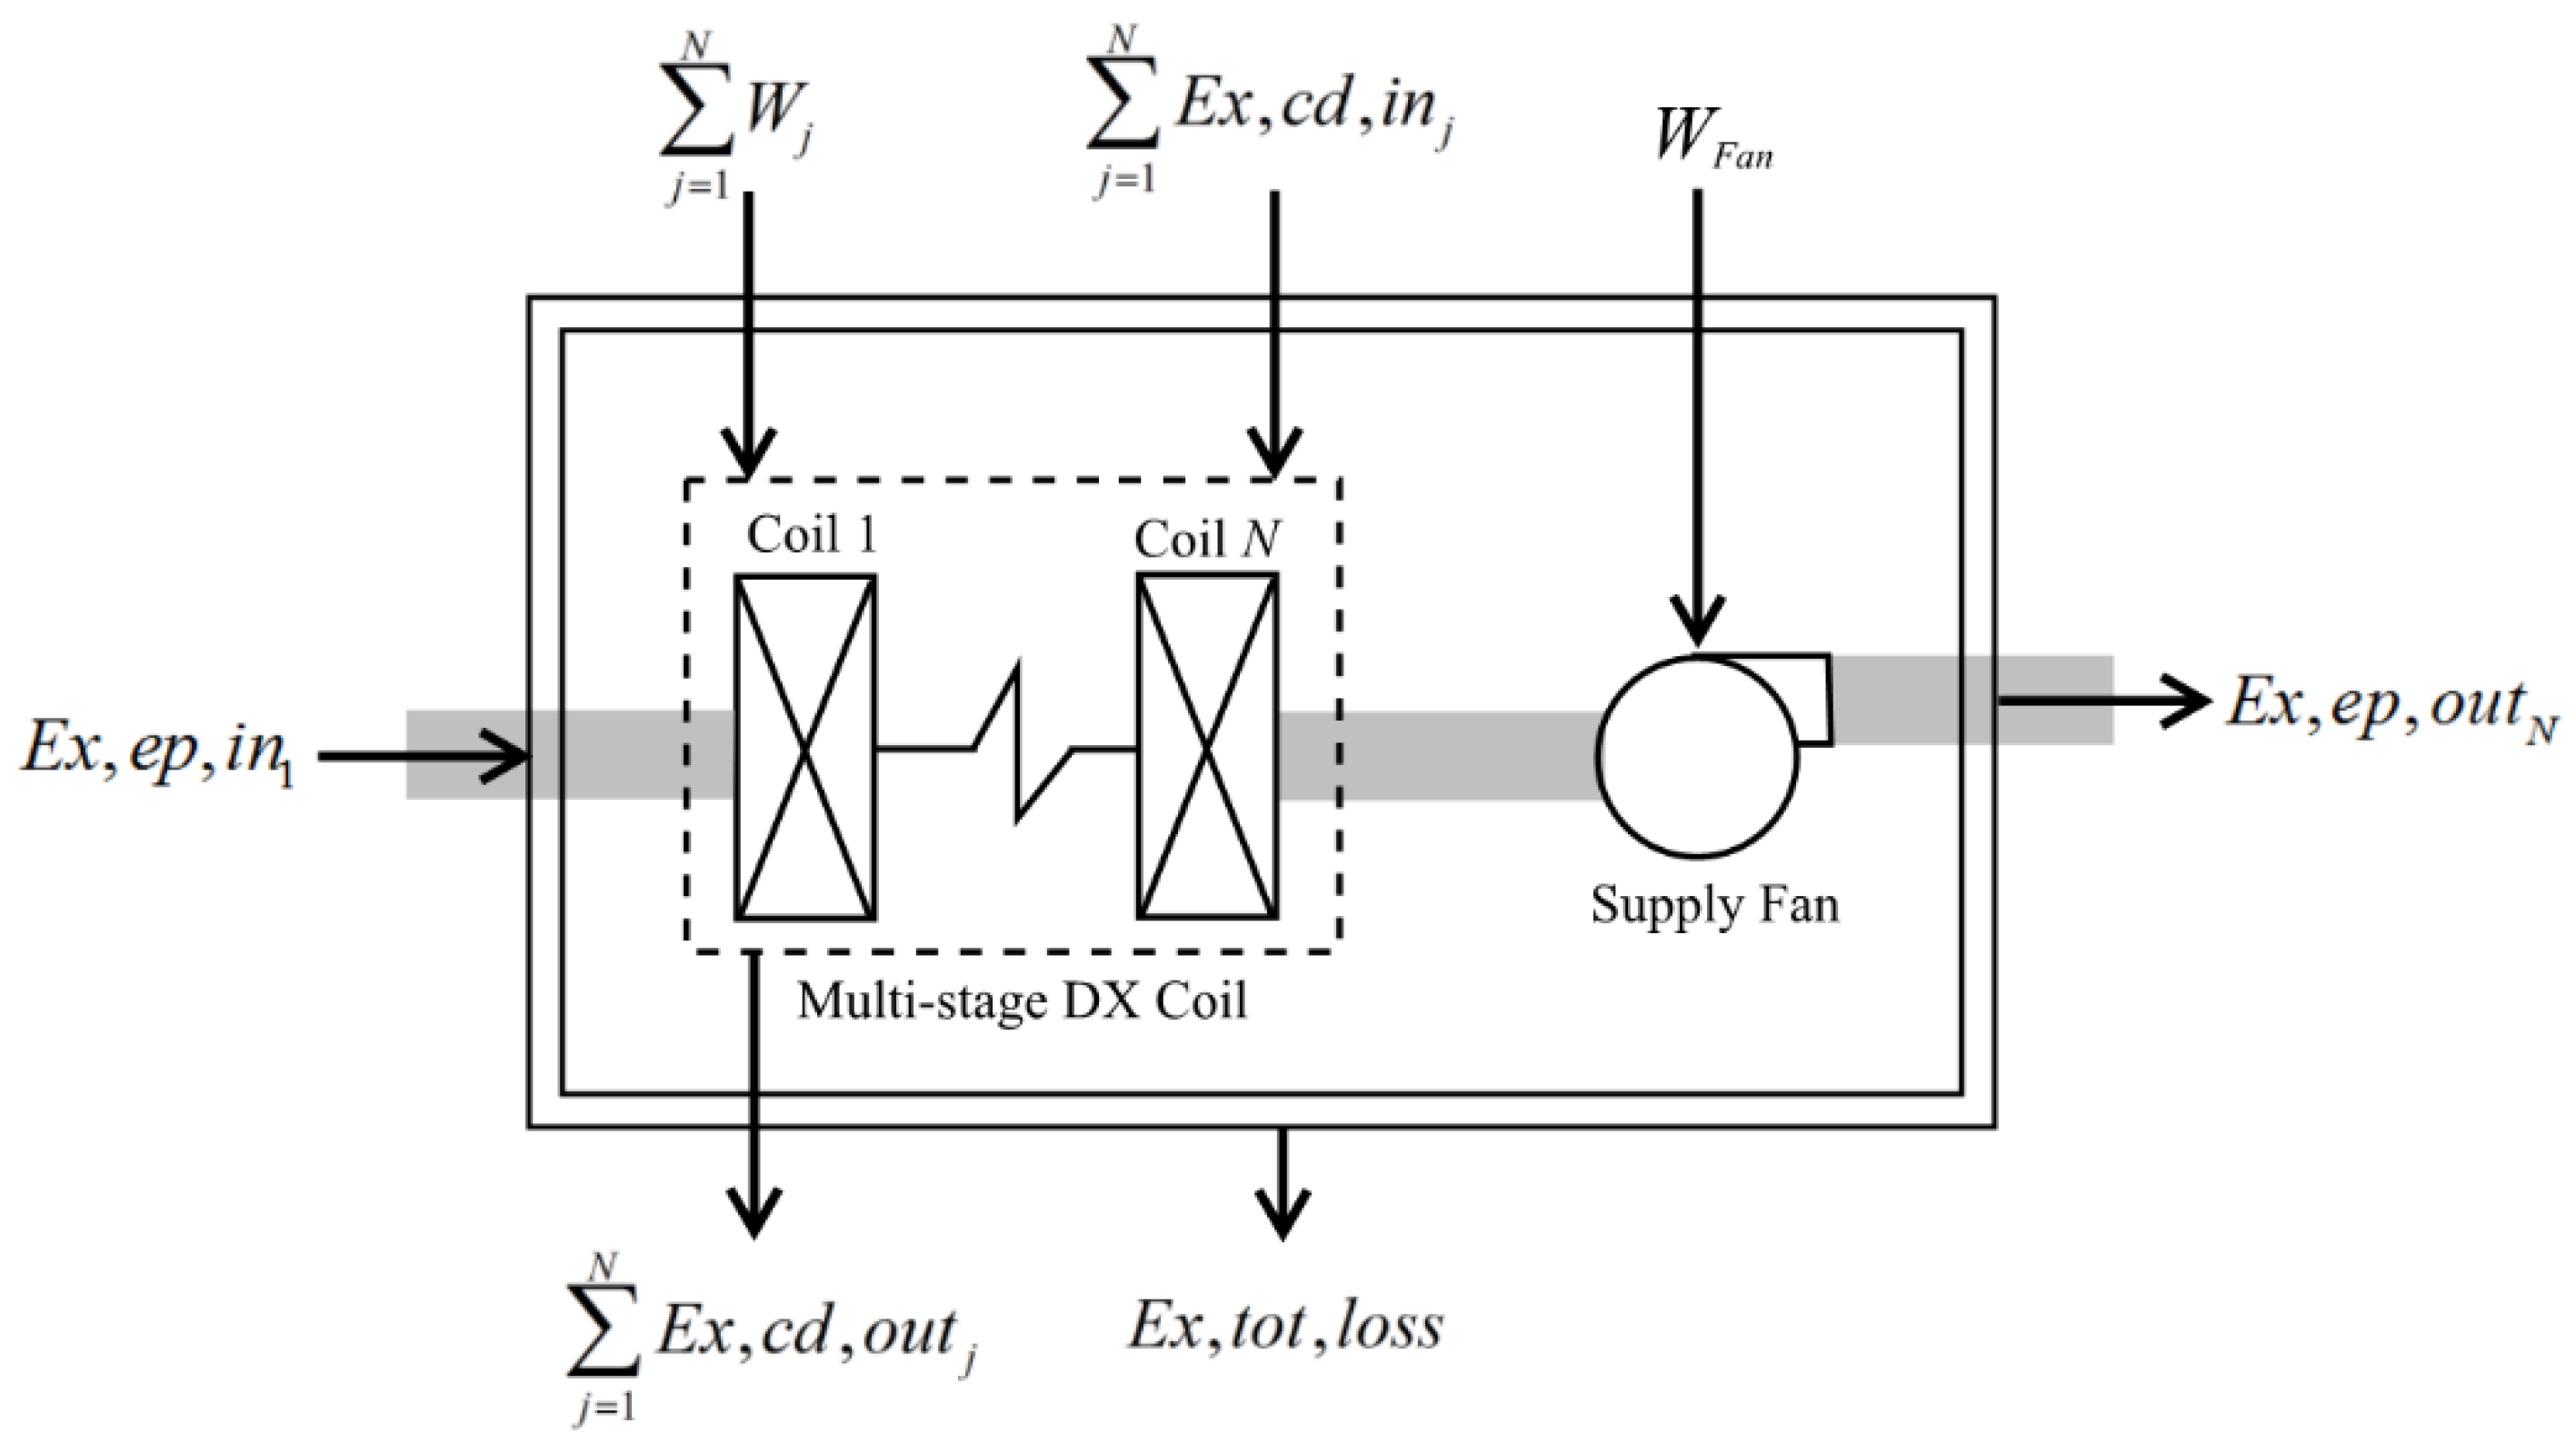
For calculation of the exergy efficiency of multi-stage DX system, the exergy flow and the exergy balance have to be defined. The exergy flow in a typical DX system is shown in Figure 7, and the exergy balance is represented in Equation (11). To address the multi-stage characteristics of DX system, the exergy flow and exergy balance have to be further defined as shown in Figure 8 and Equation (12) correspondingly:
where j is the j-th stage DX coil; is the exergy of moist air entering in the evaporator of first cooling stage, MWh; is the exergy of moist air out of the evaporator of last cooling stage, MWh; is the sum of moist air exergy entering in the all condensers, MWh; is the sum of moist air exergy out of all condensers, MWh; is the sum of input power to the whole system, MWh; WFan is the power input of supply fan, MWh; Ex,tot,loss is the total exergy loss of multi-stage DX system, MWh.
Figure 7.
Exergy flow of a typical DX unit. (Ex,ep,in—exergy of moist air entering in the evaporator; Ex,ep,out—exergy of moist air out of the evaporator; Ex,cd,in—exergy of moist air entering in the condenser; Ex,cd,out—exergy of moist air out of the condenser; W—Input power for DX unit; Ex,loss—exergy loss of DX unit.).
Figure 8.
Exergy flow of a multi-stage DX system. (—exergy of moist air entering in the evaporator of first cooling stage; —exergy of moist air out of the evaporator of last cooling stage; —the sum of moist air exergy entering in the all condensers; — the sum of moist air exergy out of all condensers; —the sum of input power to whole system; —the power input of supply fan; Ex,tot,loss —the total exergy loss of multi-stage DX system).
3.4.3. Exergy Efficiency
Exergy efficiency for a system is defined as the ratio of the exergy desired Ex,desired and the exergy needed for the desired effect Ex,needed [42]. A higher exergy efficiency means a more ideal system.
Based on the calculation results from Equations (5) to (12), for a multi-stage DX system where the exergy of moist air leaving the condenser is not recovered, the exergy efficiency can be determined by Equation (13)
4. Results and Discussion
To optimize the system configuration of XT-DOAS for maximum performance, based on the range of tX and N explained in Section 3 and assuming only one parameter was varied, 21 cases (seven tX, and three N) were generated for hour-by-hour EnergyPlus simulations and exergy analysis. The design conditions of the 21 cases, based on common practice to allow equal sharing of load amongst cooling stages [46], are summarized in Table 5. The cooling capacity at each cooling stage was automatically adjusted according to tX, N and OA mass flow rate.
Table 5.
Design conditions of 21 cases.
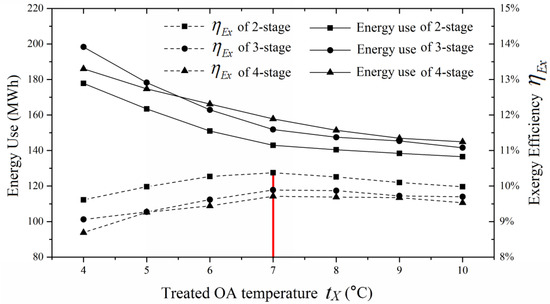
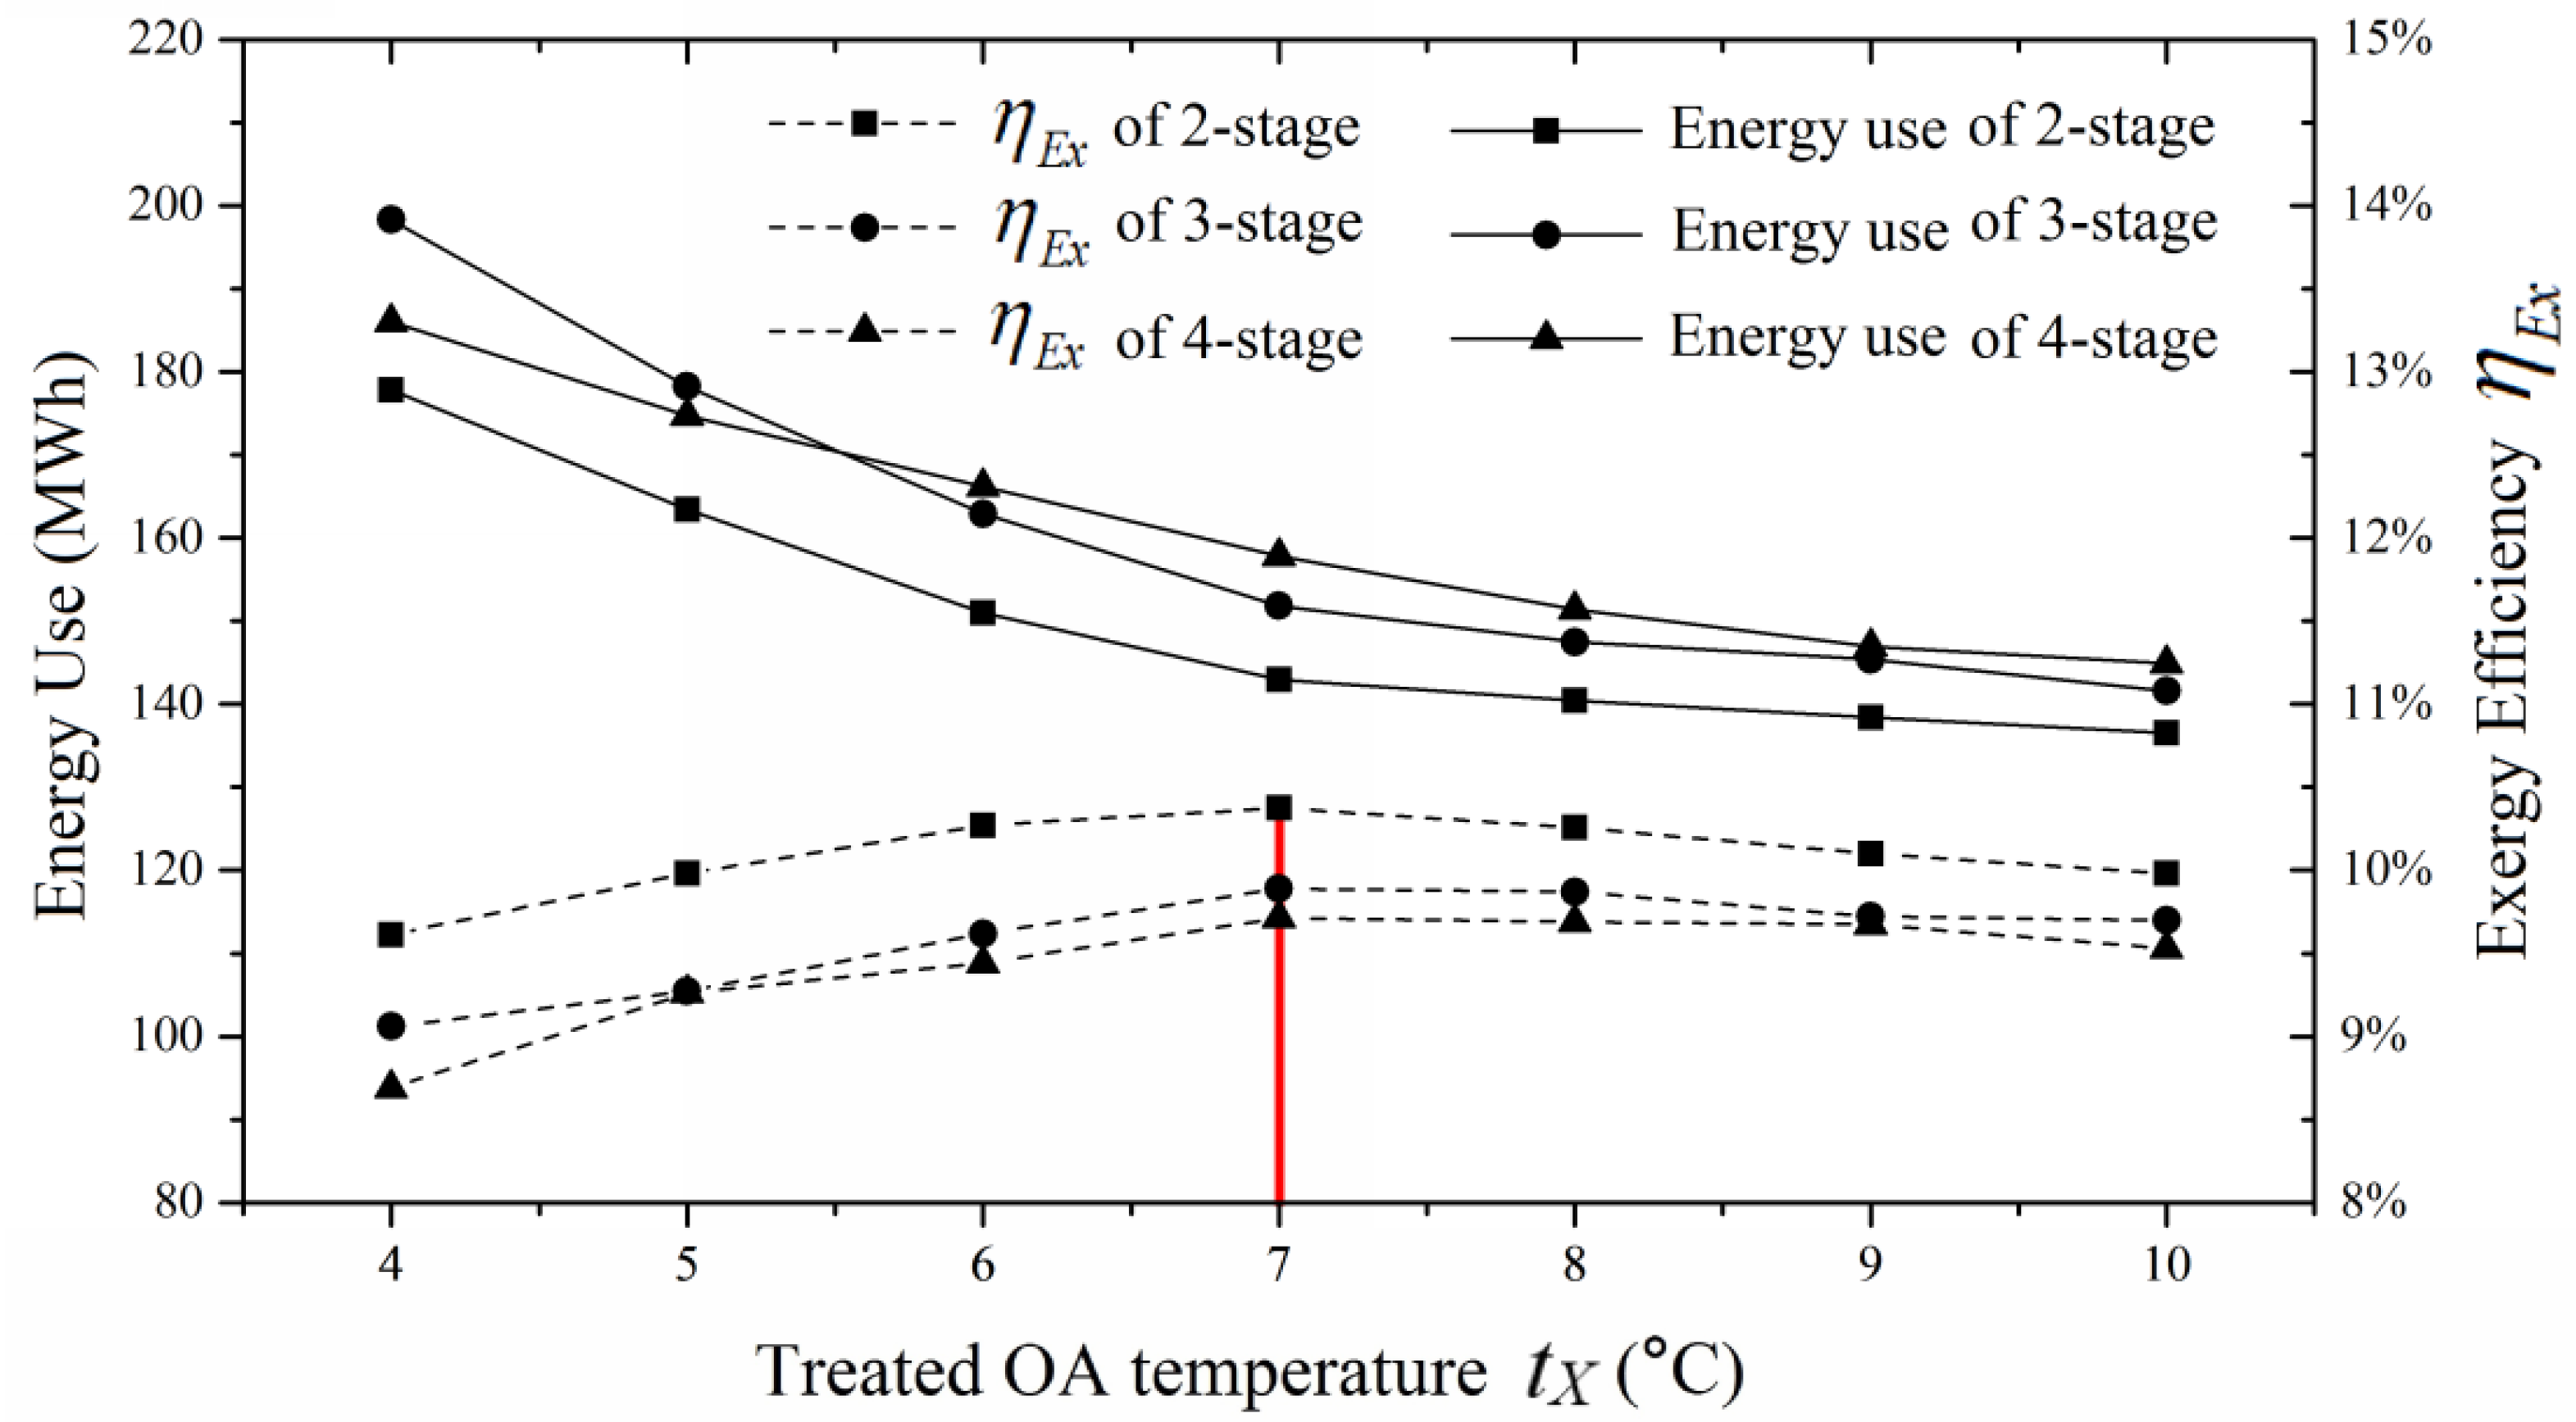
Based on the results of EnergyPlus simulations and the subsequent calculations, the year-round energy use and exergy efficiency of the 21 cases for different N and tX are presented in Figure 9, illustrating that in general, energy use (En) decreases with tX and increases with N, while exergy efficiency () peaks with tX at 7 °C and decreases with N. N equals 2 and thus always results in a lower energy use and higher exergy efficiency.
Figure 9.
Energy use and exergy efficiency of multi-stage DX system for different N and tX.
As far as tX is concerned, considering exergy efficiency () is a more meaningful indicator of efficiency that accounts for quantity and quality aspects of energy flows when compared to energy [47], the optimum tX for a 2-stage XT-DOAS is 7 °C for having the highest exergy efficiency (=10.37%).
Since tX affects also the achievement of the desirable air conditions, the achievable indoor conditions for different tX were also investigated. Given the indoor temperature can be controlled, the investigations are focused on the resultant indoor relative humidity (RH). Its achievement is one specific characteristic of XT-DOAS [14]. The Root-Mean-Square Error (RMSE) value was used to quantify the deviation between the hourly resultant space RH and the desired value (35%) for different tX. RMSE can be calculated by Equation (14). A smaller RMSERH means better humidity control:
where RMSERH is the RMSE of the space RH; RHspx is the resultant space RH; RHdesign is the desired space RH, 35%; n is the annual operating hour.
Table 6 presents the resultant space RH and calculated RMSERH for different tX. It can be seen that the smallest RMSERH occurs when tX is 7 °C (=3.38), which is accordant with the exergy analysis results.
Table 6.
The resultant indoor air conditions for different tX.
To explain the influence of N and tX on the energy use, exergy efficiency and achievable space RH and thus the concluded optimum N and tX, further energy and exergy analysis, as well space humidity condition evaluations were conducted.
4.1. Energy Analysis
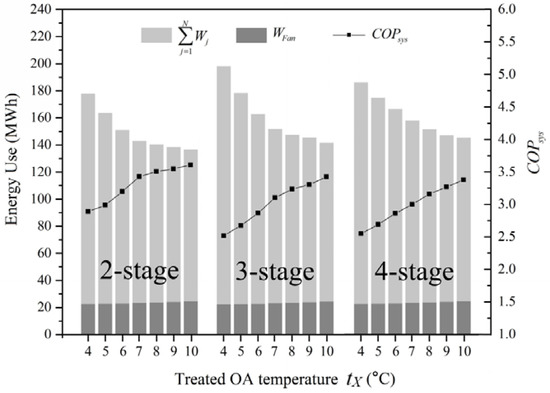
Figure 10 shows the annual energy use and COPsys for different N and tX which are basically determined by and .
Figure 10.
Energy use of multi-stage DX system for different N and tX.
It can be seen that, regardless of N, increases with tX but the rate of increase, as compared to the rate of drop in with tX, is far less significant. Thus COPsys also increases with tX. However, as for the influence of N on and thus COPsys, an analysis on the influential factors is needed. For a DX coil with defined performance curves (Section 3.2), the parameters affecting its COP, by reference to EnergyPlus, are summarized in Equations (15) through (22):
where is the entering and leaving air temperature difference across a DX coil, °C; RTF is the run time fraction; EIR-FF is a EIR modifier curve as a function of air flow fraction; m is the actual air mass flow rate, kg/s; mrated is the rated air mass flow rate, kg/s; are empirical coefficients.
In Equation (22), the CAPrated and EIRrated of each cooling stage are constant terms; EIR-FT is a function of WBei and DBci; EIR-FF is a function of air flow fraction which is the ratio of m entering the DX coil to a constant term mrated; CAP is a function of m and . DBci is affected by the outdoor air condition which is the same for all system configuration and therefore is not necessary to consider. m is determined by tX so it is not an independent variable. Thus, COP can be described as a function of and WBei as shown in Equation (23):
Equation (23) can then be postulated as [48]:
where d1, d2, d3, and d4 are constants.
Based on EnergyPlus simulation results, regression analysis was performed using the statistical package SPSS [41] to determine the coefficients for Equation (24). The resultant model is shown below:
The value of and indicate that WBei has a positive effect on COP while has a negative effect. The resultant model (Equation (25)) provides a convenient way to quantify the influences of WBei and on the COP of a DX coil. This can be done by taking partial derivative of COP with respect to WBei and as follows:
and:
Based on Equations (26) through (27), and also the average values for WBei, and COP, the sensitivities of WBei and were estimated to be 2.035 and 0.179 to show that WBei introduces much higher influence on a DX coil’s COP. The result is consistent with the visual representation in Section 3.2.3, Figure 5 and Figure 6.
To confirm the need of the developed model that takes into account the extra-high entering air temperature, the energy consumptions predicted based on the developed model and a conventional model [14], were compared. It was found that for different WBei, the difference was high ranging from 7.23% to 12.67%.
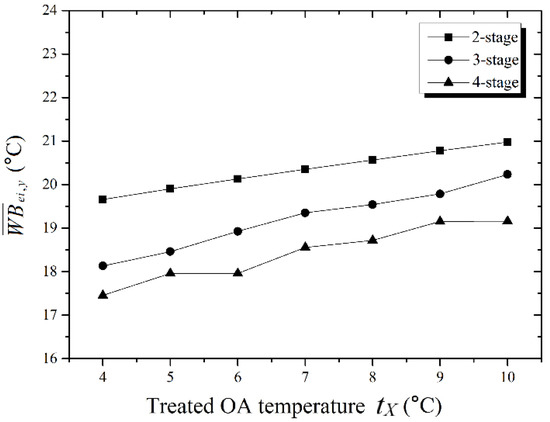
In addition, for XT-DOAS with different N, the system COP (COPsys) is related to individual cooling stage’s COP and thus is also related to WBei and . Therefore, a higher COPsys can be regarded as a function of the average () and WBei () of all cooling stages as expressed in Equation (28). A lower and a higher result in a higher COPsys:
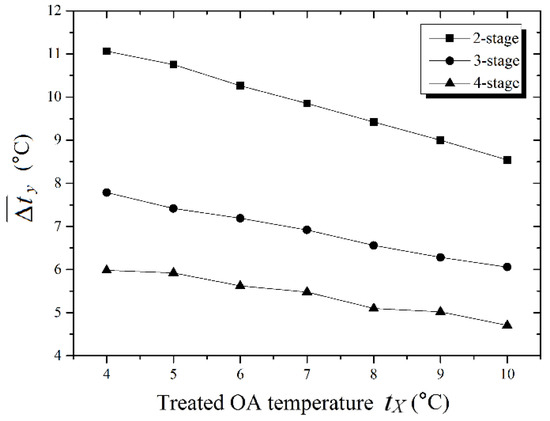
Figure 11 and Figure 12 show the variations of and for different N and tX, illustrating that decreases with tX and N, and increases with tX and N. With the higher influence of than on COPsys, the results explain the preference for a smaller N (2-stage over 4-stage) and a higher tX for better COPsys and thus smaller .
Figure 11.
for different N and tX.
Figure 12.
for different N and tX.
4.2. Exergy Analysis
Table 7 and Table 8 summarize the exergy flow for the 21 cases calculated based on Equations (11) through Equation (13). and are included because according to Equation (12), they also contribute to the exergy balance.
Table 7.
Annual exergy results for the same tX but different N (% changed in bracket) *.
Table 8.
Annual exergy results for the same N but different tX (% changed in bracket) #.
In Table 7, under the same tX but different N, , and are identical because they have the same entering and leaving air states (State O and State X). While for , as it is determined by the refrigerant pressures at the condenser, it decreases with N. However, its influence on (−2.39% to −5.90%), as compared to (4.61% to 15.10%), is far less significant. Given increases with N as confirmed earlier (Section 4.1), this can explain the percentage change in relative to N at 2 are always negative (−2.47% to −9.58%), and the highest occurs when N is 2.
In Table 8, under the same N but different tX, and increase with tX due to the corresponding increase in m of OA. On the contrary, decreases with tX due to the higher DB and higher treated OA humidity ratio of (State X). and also decrease with tX as explained earlier (Section 4.1). With the counter-effect of two positive and three negative variables on , the percentage change in relative to tX at 7 °C are always negative (−0.20 % to −10.52%), and the highest occurs when tX is 7 °C.
It is evident from the above that the energy and exergy analyses results are well explained and consistent to confirm that the optimum N is 2 and tX is 7 °C.
The results highlight the significant influence of the entering air conditions on the overall performance of the multi-stage DX system and the need of exergy analysis to determine the number of cooling N and the treated OA temperature tX.
4.3. Space Relative Humidity Control
To explain better relative humidity control as identified earlier for tX at 7 °C, the space sensible heat ratios (SHR) and the designed equipment SHR were reviewed. Given the space relative humidity is achieved by matching the equipment sensible heat ratio (SHRsys) and the space SHR (SHRspx) [49], to explain the better humidity control for tX at 7 °C, the divergence between SHRsys and SHRspx were reviewed. The hourly SHRspx are outputs of EnergyPlus. Two indices have been employed to review the divergence between SHRsys and SHRspx for different tX, they are the index of agreement (IA) and RMSE. IA is a dimensionless indicator that enables consistency comparison between models [50]. A higher IA (from 0 to 1) means a more consistent tendency of change [51].
RMSE, as explained earlier, is used to quantify the deviation between SHRsys and SHRspx. IASHR and RMSESHR are expressed in Equations (29) and (30).
where is the annual average SHR of all zones.
Calculation results for different tX are summarized in Table 9, illustrating that the highest IASHR (=0.6705) and the smallest RMSESHR (=0.0532) occurs when tX is at 7 °C.
Table 9.
Divergence results for different tX.
5. Conclusions
In this study, a realistic DX coil performance model that covers an exceptionally large entering air temperature range (from 6 °C DB to 35 °C DB), which is absent in the current literature, was developed for energy simulations and analyses. The model was developed based on a set of factory test and field measurement data. Its validity was verified by different statistical analyses. Based on the developed performance model, hour-by-hour simulations under varying outdoor conditions, together with exergy analyses for moist air at different entering and leaving states associated with variations in system configurations, were conducted for the use of a novel XT-DOAS in a typical office building. It was confirmed that the optimum configuration for XT-DOAS, taking into account the combined effect of the entering air states and part load conditions on the overall energy and exergy efficiency of the multi-stage DX system, is two cooling stage with a treated outdoor air temperature of 7 °C. The optimum treated OA temperature, through checking of divergence between equipment and space sensible heat ratios, was confirmed able to achieve a better space humidity control. The results of this study enable optimizing the configuration of XT-DOAS for better energy efficiency and performance of office buildings in subtropical region. The developed model, which is validated, will contribute significantly for future study of atypical systems. The energy and exergy analyses described in this study would become a reference protocol to enhance future research in this area.
Author Contributions
Conceptualization, Yani Bao and Wai Ling Lee; Methodology, Yani Bao; Validation, Yani Bao; Formal Analysis, Yani Bao and Jie Jia; Investigation, Yani Bao; Data Curation, Jie Jia; Writing-Original Draft Preparation, Yani Bao; Writing-Review & Editing, Wai Ling Lee.
Acknowledgments
This work was supported by the RGC funding No. B-Q42W.
Conflicts of Interest
The authors declare that there is no conflicts of interest.
Nomenclature
| i-th empirical coefficient | |
| i-th empirical coefficient | |
| CAP | total cooling capacity (kW) |
| Cda | dry air specific heat (kJ/kg·K) |
| i-th empirical coefficient | |
| COP | coefficient of performance |
| Cwv | water vapour specific heat (kJ/kg·K) |
| DB | dry bulb |
| DX | direct expansion |
| i-th empirical coefficient | |
| EIR | energy input ratio |
| e | residual |
| En | energy use (MWh) |
| ex | exergy of moist air (kJ/kg dry air) |
| Ex,cd,in | exergy of moist air entering in the condenser (MWh) |
| Ex,cd,out | exergy of moist air out of the condenser (MWh) |
| Ex,desired | exergy desired for a system (MWh) |
| Ex,ep,in | exergy of moist air entering in the evaporator (MWh) |
| Ex,ep,out | exergy of moist air out of the evaporator (MWh) |
| Ex,loss | exergy loss of DX unit (MWh) |
| Ex,needed | exergy needed for the desired effect of the system (MWh) |
| Ex,tot,loss | total exergy loss of multi-stage DX system (MWh) |
| FF | function of air flow fraction |
| FT | function of temperature |
| IA | index of agreement |
| m | air mass flow rate (kg/s) |
| N | cooling stage number of multi-stage DX system |
| OA | outdoor air |
| P | pressure (kPa) |
| PLF | part load fraction |
| PLR | part load ratio |
| RA | return air |
| Rda | the ideal gas constant of dry air (kJ/kg·K) |
| RH | relative humidity |
| RMSE | root-mean-square error |
| RTF | run time fraction |
| SHR | sensible heat ratio |
| T | temperature (K) |
| t | temperature (°C) |
| temperature difference between air in and out of DX coil (°C) | |
| WB | wet bulb |
| W | compressor power (MWh) |
| moist air humidity ratio (kg/kg dry air) | |
| XT | extra-low temperature |
| ZRE | standard residual |
| Greek symbols | |
| exergy loss ratio | |
| exergy efficiency | |
| Subscripts | |
| 0 | reference environmental state |
| 0s | dead state |
| c | critical state |
| ch | chemical |
| ci | condenser inlet |
| design | design condition |
| ei | evaporator (DX coil) inlet |
| Fan | fan |
| j | j-th stage DX coil |
| me | mechanical |
| rated | rated condition |
| spx | conditioned spaces |
| sys | multi-stage DX system |
| th | thermal |
| ws | saturated state of water vapour |
| X | state of outdoor air treated by the last cooling stage |
| y | annual value |
Appendix A
The acceptability of the regression models presented in Section 3.2.3 was verified by checking both goodness of fit and linearity as follows:
The goodness-of-fit indices, and the adjusted () were used to determine how well the regression models fit the observations and predictions. is more suitable for multiple regression in this study as it can adjust the goodness-of-fit for the additional variables. They are mathematically shown in Equations (A1) and (A2) [37]:
where is the i-th actual value of and based on different WBei and DBci in Equations (1) and (2); is the mean of actual values; is the i-th fitted value which can be calculated from the different WBei , DBci and regressed coefficients; n is total number of data pairs; p is the number of independent variables.
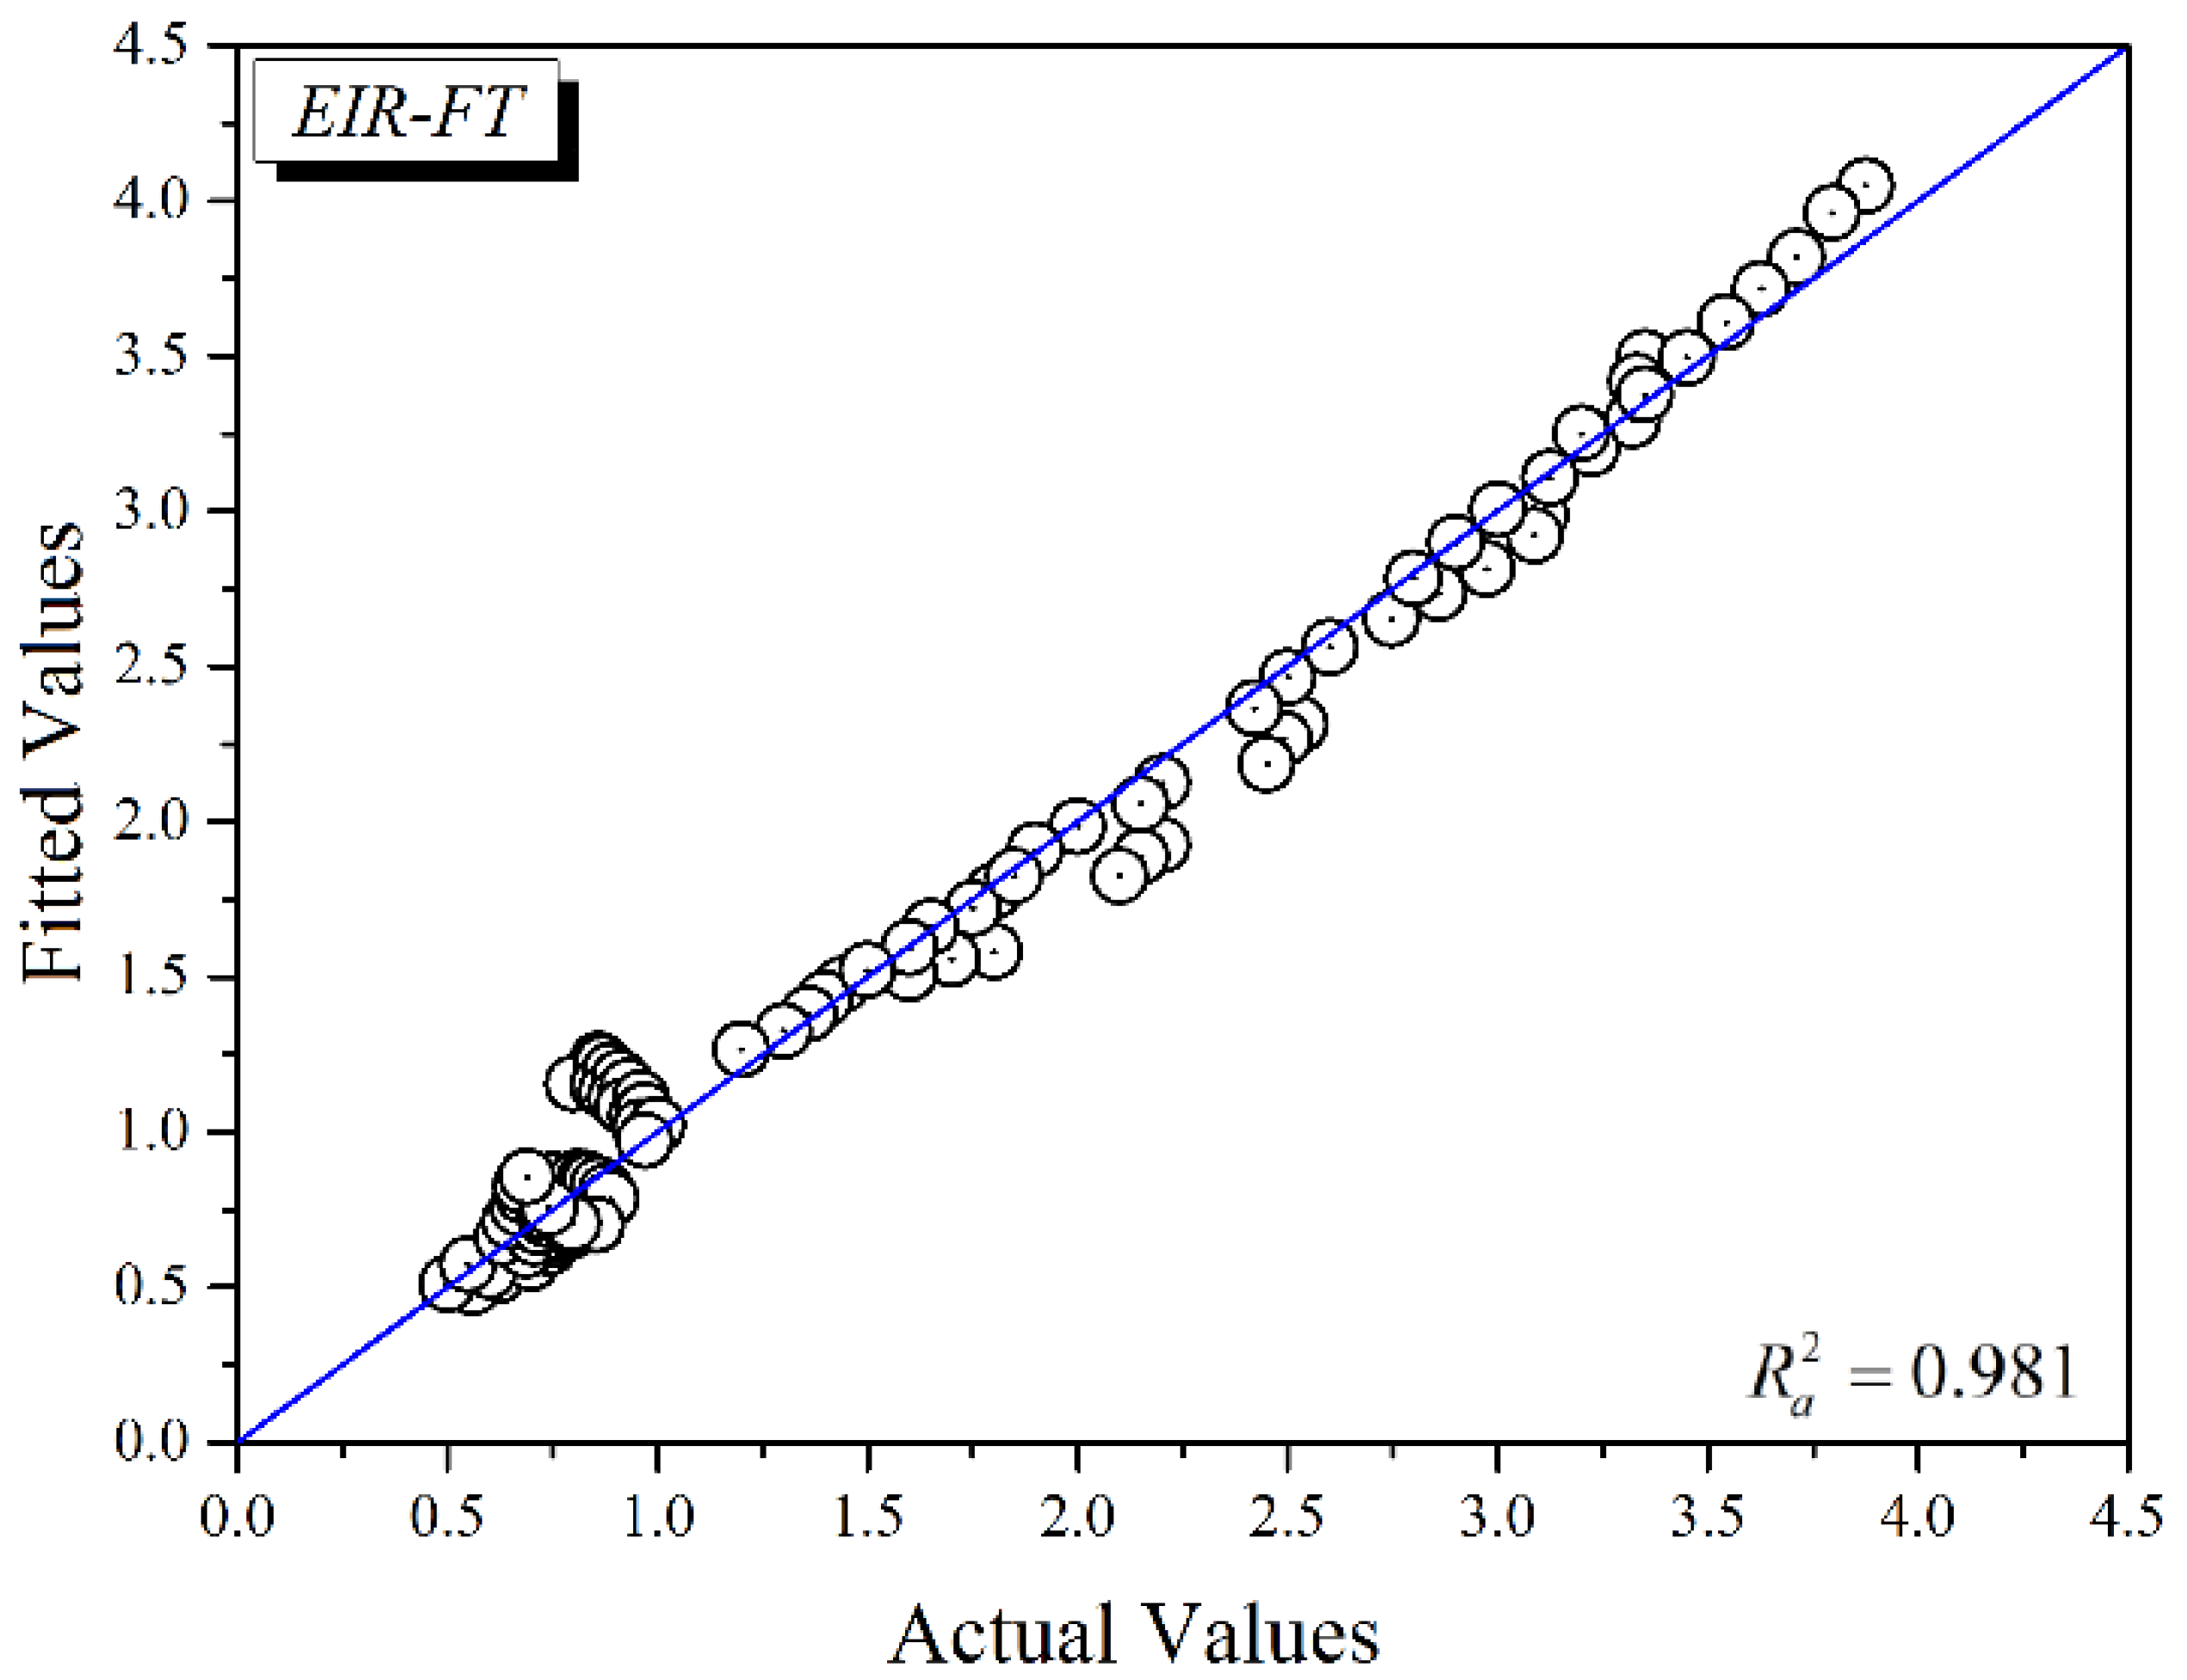
The results show that the and are 0.986 and 0.985 for the CAP-FT model and 0.982 and 0.981 for the EIR-FT model which are close to 1 to confirm their accuracy [37].
In addition to checking of goodness-of-fit, the linearity validation has been considered. In general, the validity of linear assumption can be confirmed by examining the scatter plot of the data pairs, but considering the large number of variables for the CAP-FT and EIR-FT models, the scatter plots of the standardized residuals and fitted values have been used instead. The i-th standardized residual ZREi has been introduced to standardize the ordinary least squares residual ei as shown in Equations (A3) to (A4), and the result of the scatter plots with a random distribution confirmed the validity of linear assumption [52].
Figure A1 and Figure A2 correspondingly show the deviation between the actual values and the fitted values for CAP-FT and EIR-FT. They reflect the distribution of the corresponding ordinary least squares residual ei and no obvious deviation is noted.
Consistent result from the goodness of fit and linearity checks confirmed the acceptability of the developed coil model.
Figure A1.
CAP-FT actual values Vs fitted values.
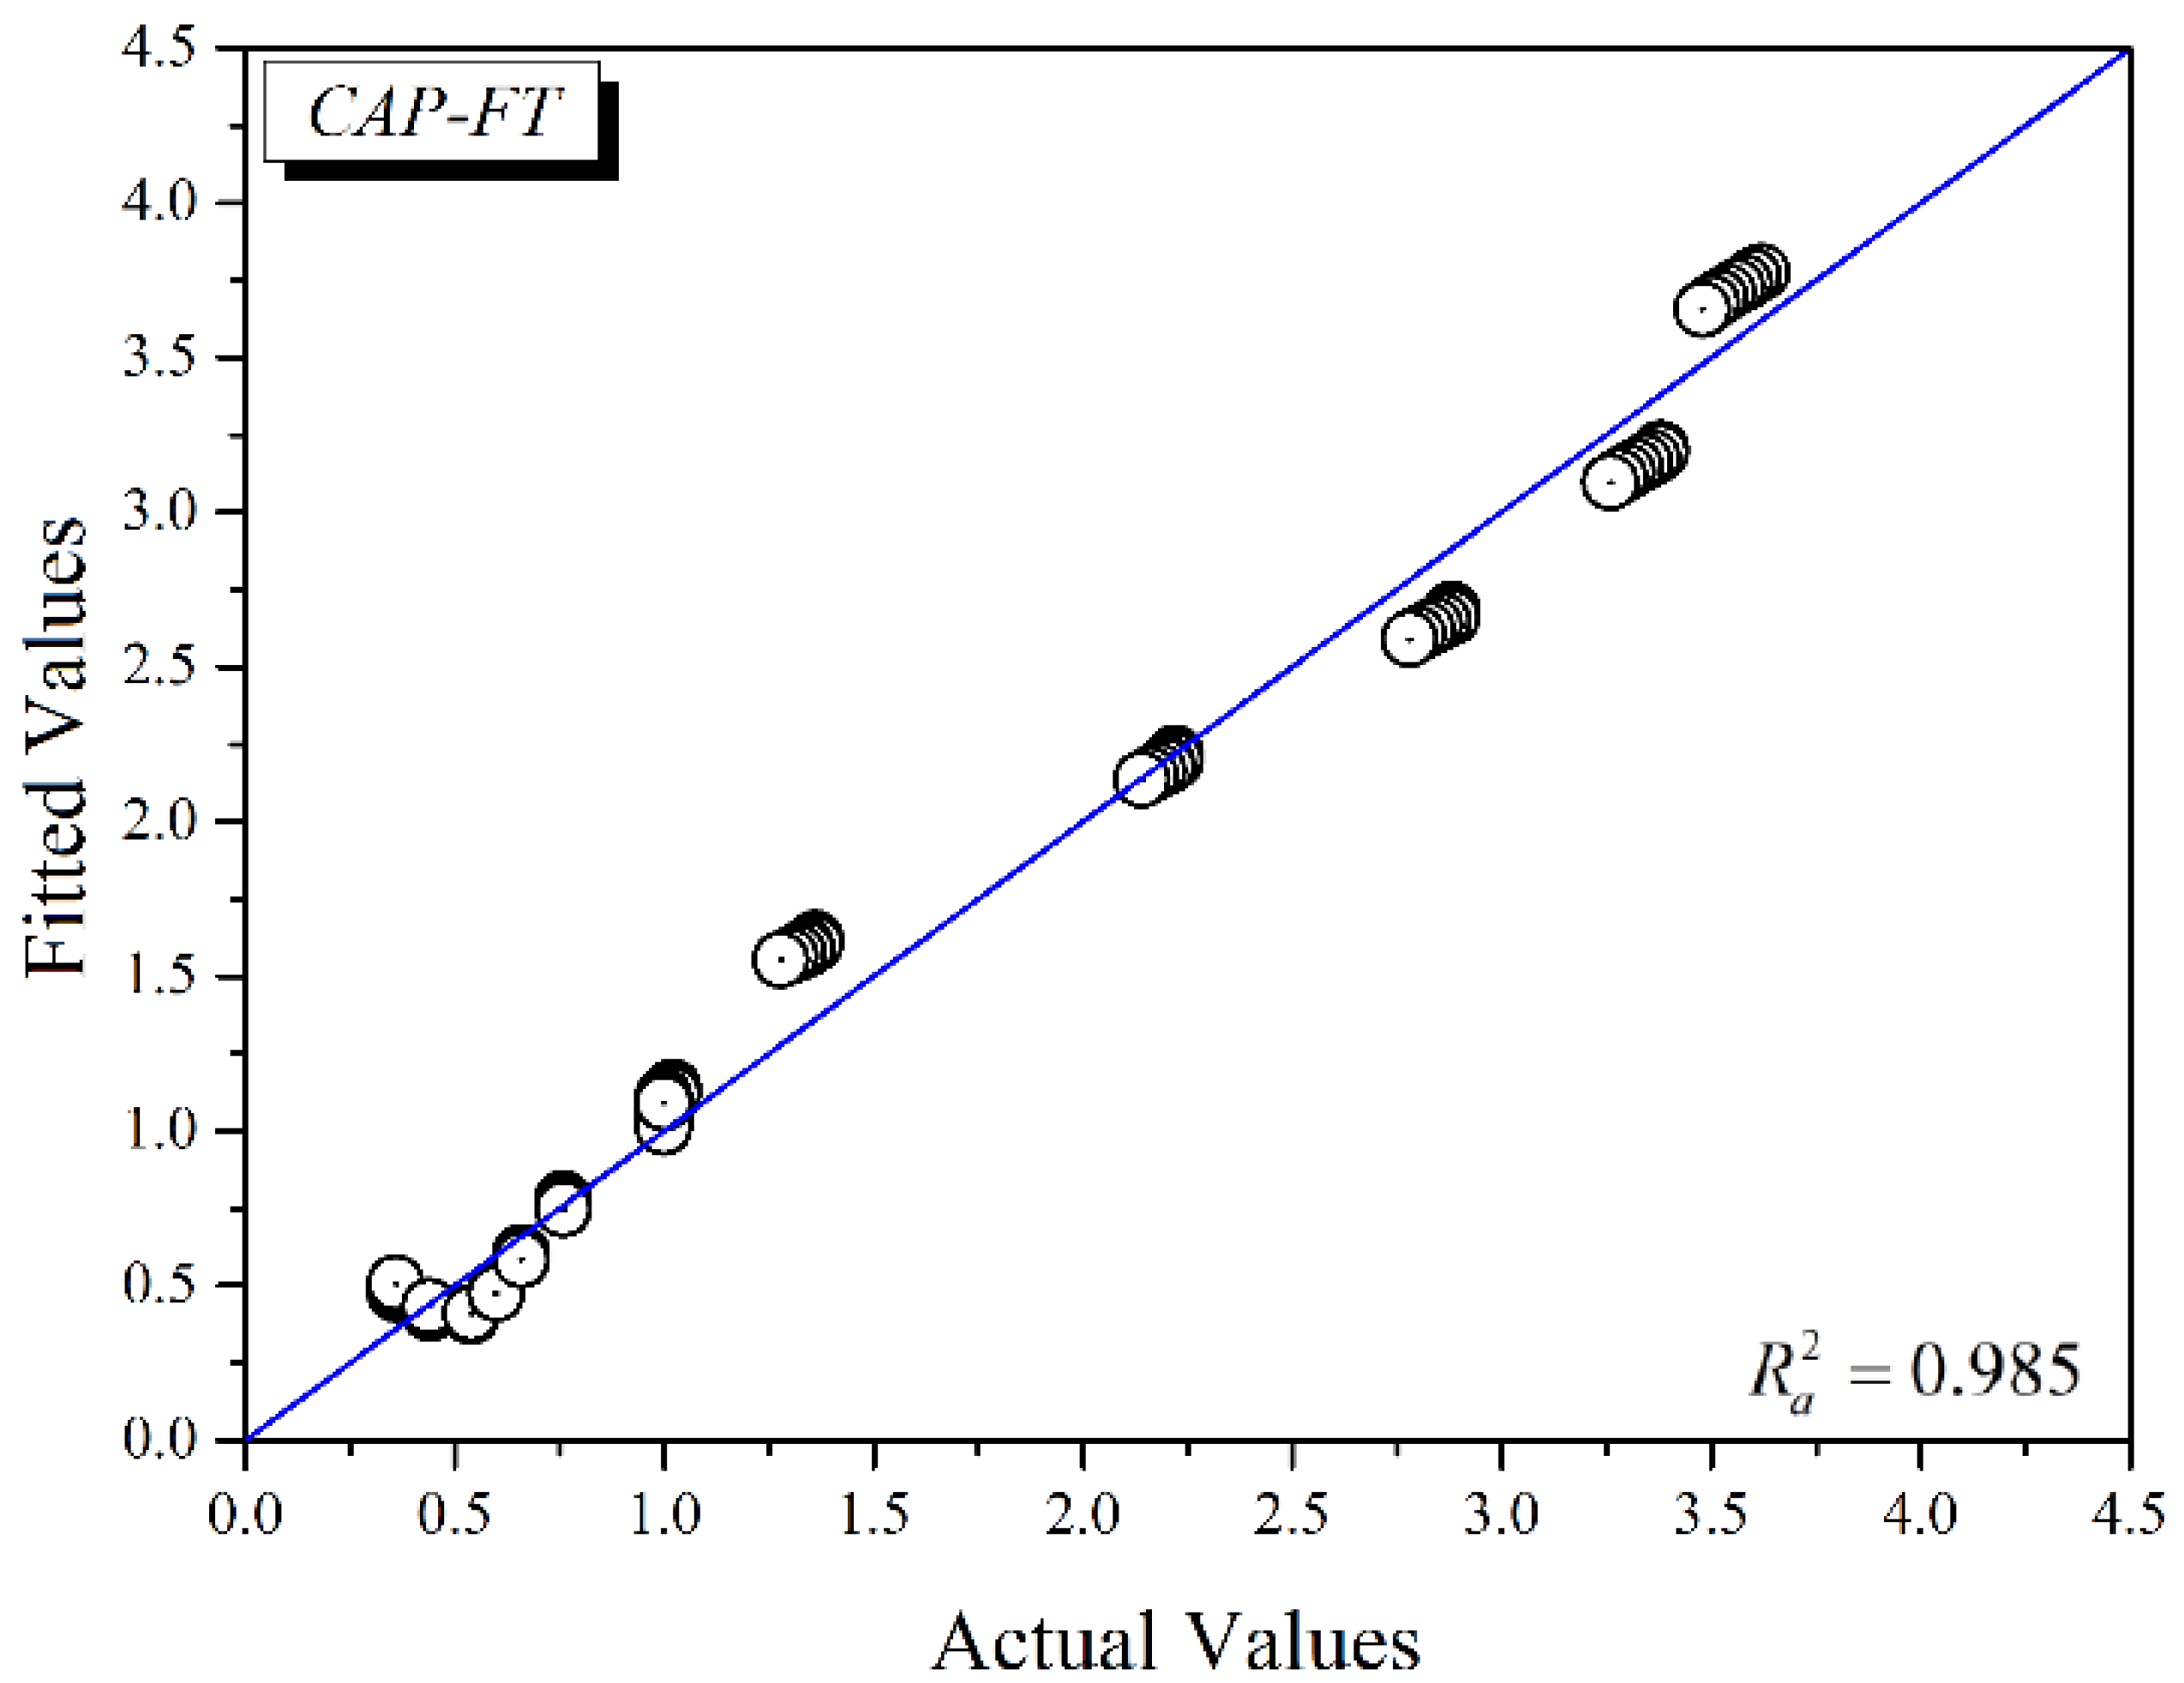
Figure A2.
EIR-FT actual values Vs fitted values.
References
- Inklab, N.; Chaiwiwatworakul, P.; Chuangchote, S.; Rakkwamsuk, P.; Chirarattananon, S. Performance Assessment of Dedicated Outdoorair Systems for Office Building in Thailand. Energy Procedia 2015, 79, 677–684. [Google Scholar] [CrossRef] [Scilit]
- Niu, J.L.; Zhang, L.Z.; Zuo, H.G. Energy savings potential of chilled-ceiling combined with desiccant cooling in hot and humid climates. Energy Build. 2002, 34, 487–495. [Google Scholar] [CrossRef] [Scilit]
- Fong, K.F.; Chow, T.T.; Lee, C.K.; Lin, Z.; Chan, L.S. Solar hybrid cooling system for high-tech offices in subtropical climate—Radiant cooling by absorption refrigeration and desiccant dehumidification. Energy Convers. Manag. 2011, 52, 2883–2894. [Google Scholar] [CrossRef] [Scilit]
- Lee, S.H.; Lee, W.L. Site verification and modeling of desiccant-based system as an alternative to conventional air-conditioning systems for wet markets. Energy 2013, 55, 1076–1083. [Google Scholar] [CrossRef] [Scilit]
- Mumma, S.A. Chilled ceilings in parallel with dedicated outdoor air systems: Addressing the concerns of condensation, capacity, and cost. ASHRAE Trans. 2002, 108, 220–231. [Google Scholar]
- Chen, C.; Cai, W.; Giridharan, K.; Wang, Y. A hybrid dynamic modeling of active chilled beam terminal unit. Appl. Energy 2014, 128, 133–143. [Google Scholar] [CrossRef] [Scilit]
- Kosonen, R.; Tan, F. A feasibility study of a ventilated beam system in the hot and humid climate: A case-study approach. Build. Environ. 2005, 40, 1164–1173. [Google Scholar] [CrossRef] [Scilit]
- Chen, C.; Cai, W.; Wang, Y.; Lin, C.; Wang, L. Operating characteristics of an active chilled beam terminal unit under variable air volume mode. Appl. Therm. Eng. 2015, 85, 71–79. [Google Scholar] [CrossRef] [Scilit]
- Lee, W.L.; Chen, H.; Leung, Y.C.; Zhang, Y. Decoupling dehumidification and cooling for energy saving and desirable space air conditions in hot and humid Hong Kong. Energy Convers. Manag. 2012, 53, 230–239. [Google Scholar] [CrossRef] [Scilit]
- Jia, J.; Lee, W.L. Condensation risk of DCDV system for hot and humid Hong Kong. Indoor Built Environ. 2013, 23, 814–822. [Google Scholar] [CrossRef] [Scilit]
- Jia, J.; Lee, W.L.; Chen, H. Experimental study of performance of a dry cooling and dedicated ventilation (DCDV) system under different space cooling load conditions. Energy Convers. Manag. 2013, 73, 158–166. [Google Scholar] [CrossRef] [Scilit]
- Nutprasert, N.; Chaiwiwatworakul, P. Radiant cooling with dehumidified air ventilation for thermal comfort in buildings in tropical climate. Energy Procedia 2014, 52, 250–259. [Google Scholar] [CrossRef] [Scilit]
- Sarkar, M. Simplified thermodynamic modeling of chilled water coils based on bypass factors. Energy Build. 2015, 103, 384–395. [Google Scholar] [CrossRef] [Scilit]
- Bao, Y.; Lee, W.L.; Jia, J. Applying a novel extra-low temperature dedicated outdoor air system for humidity control and energy efficiency. Sci. Technol. Built Environ. 2017, 23, 16–29. [Google Scholar] [CrossRef] [Scilit]
- Kirkpatrick, A.T.; Elleson, J.S. Cold Air Distribution System Design Guide; American Society of Heating, Refrigerating and Air-Conditioning Engineers: Atlanta, GA, USA, 1996; ISBN 1-883413-37-0. [Google Scholar]
- Berglund, L.G. Comfort benefits for summer air conditioning with ice storage. ASHRAE Trans. 1991, 97, 843–847. [Google Scholar]
- Li, Z.; Deng, S. An experimental study on the inherent operational characteristics of a direct expansion (DX) air conditioning (A/C) unit. Build. Environ. 2007, 42, 1–10. [Google Scholar] [CrossRef] [Scilit]
- Meggers, F.; Leibundgut, H. The potential of wastewater heat and exergy: Decentralized high-temperature recovery with a heat pump. Energy Build. 2011, 43, 879–886. [Google Scholar] [CrossRef] [Scilit]
- Liao, Y.; Sun, Y.; Huang, G. Robustness analysis of chiller sequencing control. Energy Convers. Manag. 2015, 103, 180–190. [Google Scholar] [CrossRef] [Scilit]
- Li, H.; Lee, W.L.; Ng, T.F. Developing a novel dedicated outdoor air system (DOAS) for energy efficiency and environmental health. In Proceedings of the Mainland–HongKong Jt Symp 2015 Build Technol—An Epoch Enlightenment, Harbin, China, 26–27 June 2015. [Google Scholar]
- Li, H.; Lee, W.L.; Jia, J. Applying a novel extra-low temperature dedicated outdoor air system in office buildings for energy efficiency and thermal comfort. Energy Convers. Manag. 2016, 121, 162–173. [Google Scholar] [CrossRef] [Scilit]
- U.S. Department of Energy. EnergyPlus Energy Simulation Software Version 8.1: EnergyPlus Engineering Reference; U.S. Department of Energy: Washington, DC, USA, 2015.
- Fan, B.; Jin, X.; Du, Z. Optimal control strategies for multi-chiller system based on probability density distribution of cooling load ratio. Energy Build. 2011, 43, 2813–2821. [Google Scholar] [CrossRef] [Scilit]
- Thangavelu, S.R.; Myat, A.; Khambadkone, A. Energy optimization methodology of multi-chiller plant in commercial buildings. Energy 2017, 123, 64–76. [Google Scholar] [CrossRef] [Scilit]
- Beghi, A.; Cecchinato, L.; Rampazzo, M. A multi-phase genetic algorithm for the efficient management of multi-chiller systems. Energy Convers. Manag. 2011, 52, 1650–1661. [Google Scholar] [CrossRef] [Scilit]
- Coelho, L.S.; Klein, C.E.; Sabat, S.L.; Mariani, V.C. Optimal chiller loading for energy conservation using a new differential cuckoo search approach. Energy 2014, 75, 237–243. [Google Scholar] [CrossRef] [Scilit]
- Chang, Y.C.; Chen, W.H. Optimal chilled water temperature calculation of multiple chiller systems using Hopfield neural network for saving energy. Energy 2009, 34, 448–456. [Google Scholar] [CrossRef] [Scilit]
- Fan, B.; Jin, X.; Fang, X.; Du, Z. The method of evaluating operation performance of HVAC system based on exergy analysis. Energy Build. 2014, 77, 332–342. [Google Scholar] [CrossRef] [Scilit]
- Zmeureanu, R.; Yu, W.X. Energy and exergy performance of residential heating systems with separate mechanical ventilation. Energy 2007, 32, 187–195. [Google Scholar] [CrossRef] [Scilit]
- Chengqin, R.; Nianping, L.; Guangfa, T. Principles of exergy analysis in HVAC and evaluation of evaporative cooling schemes. Build. Environ. 2002, 37, 1045–1055. [Google Scholar] [CrossRef] [Scilit]
- Mui, K.W. Energy policy for integrating the building environmental performance model of an air conditioned building in a subtropical climate. Energy Convers. Manag. 2006, 47, 2059–2069. [Google Scholar] [CrossRef] [Scilit]
- ASHRAE. ASHRAE Standard 62.1-2016, Ventilation for Acceptable Indoor Air Quality; ASHRAE: Atlanta, GA, USA, 2016. [Google Scholar]
- BEAM Society. BEAM Plus for New Buildings Version 1.2; BEAM Society: Hong Kong, China, 2012. [Google Scholar]
- Electrical and Mechanical Services Department. Code of Practice for Energy Efficiency of Building Services Installation; HKSAR: Hong Kong, China, 2012.
- Zhang, L.; Lee, W.L. Evaluating the use heat pipe for dedicated ventilation of office buildings in Hong Kong. Energy Convers. Manag. 2011, 52, 1983–1989. [Google Scholar] [CrossRef] [Scilit]
- Lee, W.L. Benchmarking energy use of building environmental assessment schemes. Energy Build. 2012, 45, 326–334. [Google Scholar] [CrossRef] [Scilit]
- Chatterjee, S.; Hadi, A.S. Regression Analysis by Example. Probab. Stat. 2006, 607, 375. [Google Scholar] [CrossRef] [Scilit]
- Lee, W.L. Evaluating the energy use of a store building. In Consultancy Report Submitted to Business Environment Council; Business Environment Council: Hong Kong, China, 13 November 2010. [Google Scholar]
- Daikin Airconditioning (Hong Kong) Ltd. Performance Data of ED34-845A; Daikin Airconditioning (Hong Kong) Ltd.: Hong Kong, China, 2016. [Google Scholar]
- AHRI. Standard 210/240-2008. Performance Rating of Unitary Air Conditioning and Air-Source Heat Pump Equipment; Air-Conditioning, Heating, and Refrigeration Institute: Arlington, VA, USA, 2008. [Google Scholar]
- Hayes, A.F.; Matthes, J. Computational procedures for probing interactions in OLS and logistic regression: SPSS and SAS implementations. Behav. Res. Methods 2009, 41, 924–936. [Google Scholar] [CrossRef] [Scilit] [PubMed]
- Wark, K. Advanced Thermodynamics for Engineers; McGraw-Hill: New York, NY, USA, 1995. [Google Scholar]
- Ren, C.Q.; Tang, G.F.; Li, N.P.; Zhang, L.; Yang, J. Discussion on principles of exergy analysis applied to HVAC systems. Energy Convers. Appl. 2001, 1, 103–107. [Google Scholar] [CrossRef] [Scilit]
- Ren, C.Q.; Tang, G.F.; Li, N.P.; Zhang, L.; Yang, J. Analysis of exergy of moist air and energy saving potential in HVAC by evaporative cooling energy recovery. Int. J. Archit. Sci. 2001, 2, 113–117. [Google Scholar]
- Wagner, W.; Pruβ, A. The IAPWS formulation 1995 for the thermodynamic properties of ordinary water substance for general and scientific use. J. Phys. Chem. Ref. Data 2002, 31, 387–535. [Google Scholar] [CrossRef] [Scilit]
- Yu, F.W.; Chan, K.T. Optimum load sharing strategy for multiple-chiller systems serving air-conditioned buildings. Build. Environ. 2007, 42, 1581–1593. [Google Scholar] [CrossRef] [Scilit]
- Dincer, I.; Rosen, M. Exergy as a Driver for Achieving Sustainability. Int. J. Green Energy 2004, 1, 1–19. [Google Scholar] [CrossRef] [Scilit]
- Aiken, L.S.; West, S.G.; Reno, R.R. Multiple Regression: Testin and Interpreting Interactions; SAGE Publications, Inc.: London, UK, 1991; ISBN 0-7619-0712-2. [Google Scholar]
- Li, Z.; Chen, W.; Deng, S.; Lin, Z. The characteristics of space cooling load and indoor humidity control for residences in the subtropics. Build. Environ. 2006, 41, 1137–1147. [Google Scholar] [CrossRef] [Scilit]
- Willmott, C.J.; Robeson, S.M.; Matsuura, K. A refined index of model performance. Int. J. Climatol. 2012, 32, 2088–2094. [Google Scholar] [CrossRef] [Scilit]
- Li, H.; You, S.; Zhang, H.; Zheng, W.; Zheng, X.; Jia, J.; Ye, T.; Zou, L. Modelling of AQI related to building space heating energy demand based on big data analytics. Appl. Energy 2017, 203, 57–71. [Google Scholar] [CrossRef] [Scilit]
- Baty, F.; Ritz, C.; Charles, S.; Brutsche, M.; Flandrois, J.; Delignette-Muller, M.L. A Toolbox for Nonlinear Regression in R : The Package nlstools. J. Stat. Softw. 2015, 66, 1–21. [Google Scholar] [CrossRef] [Scilit]

© 2018 by the authors. Licensee MDPI, Basel, Switzerland. This article is an open access article distributed under the terms and conditions of the Creative Commons Attribution (CC BY) license (http://creativecommons.org/licenses/by/4.0/).