Abstract
Although hydrogen sulfide (H2S) was always a negative factor leading to the reduction of hydrogen permeability of palladium (Pd) membranes, its proper application could result in a positive effect. In this study, pure Pd membranes were firstly reacted with H2S at 23–450 °C, and then treated by redox reactions. Afterwards, the hydrogen permeability was tested under different reaction conditions using a hydrogen penetrant testing device. Moreover, both products and morphology changes occurred on the Pd membrane surface were analyzed using XRD, XPS and SEM. The results showed that H2S was dissociated to produce sulfides at 23 °C. With a rise of temperature, a regular change took place in the reaction products, morphology of the Pd membrane surface and hydrogen permeability. Adsorbed impurities such as sulfides and free carbon on the Pd membrane surface were removed by the redox treatment. The hydrogen permeability was improved by about 80% for the Pd membrane material subjected to the treatment method stated the above against the untreated one.
1. Introduction
Hydrogen energy is a major clean energy source [1], widely used in new energy vehicles, aerospace and other fields [2]. The large-scale use of hydrogen energy is an effective way to solve the greenhouse effect caused by the current burning of traditional fossil fuels since the combustion of hydrogen does not release CO2 [3,4]. The development and application of new hydrogen production technology are expected to provide effective solutions for alleviating the global energy crisis and air pollution [5]. Hydrogen-rich syngas is commonly produced by steam-methanol reforming (SMR) in industry [6]. One of the most critical materials in the SMR process is the Pd membrane [7], which is used to generate hydrogen at low temperatures and greatly increase the conversion of the original gas [8]. However, the hydrogen permeation rate of Pd membrane was greatly affected in the effects on impurities as oil, sulfides and arsenides [9,10]. Especially, it showed the maximum fragility and sensibility in sulfides even if these sulfides were extremely low in content [11]. Though the sulfides could be desorbed using zinc oxide powder or high-temperature sulphur adsorbent [12,13], great damage was caused to the Pd membrane used in highly-pure hydrogen preparation [14]. Based on the development trend of the Pd membrane with sulfuration resistance, high hydrogen permeation and low cost [15,16,17,18,19,20,21,22], the study of the influence mechanisms of sulfides on the Pd membrane surface was necessary. Some valuable research results were obtained in the resistance of PdCu, PdCuAg and PdAu to hydrogen sulfide poisoning capacity in recent years [20,23,24,25,26,27]. For example, Peters [20] and Zhao [28] et al. found that the activity of a PdAgCu membrane could be restored after the source of sulfide pollution was cut off for 2.5 h by accurately balancing Cu/Ag contents. However, such sulfides as well as reaction principle and surface structure change of Pd membrane should be of concern [29,30].
This paper presents the detailed reaction process and phenomena of hydrogen sulfide and the Pd membrane surface, and further demonstrates an approach that the sulfides absorbed on palladium surface can be removed by the redox method. It was found by hydrogen permeation testing that this approach could not only restore the activity of Pd membrane, but also improve the hydrogen permeability of a Pd membrane to some extent. The research methodology developed and the results obtained are of an importance for further optimizing high-purity hydrogen preparation technology.
2. Experimental Procedures
2.1. Experimental Process
In the experiment, Pd membrane (99.95%, purity), which was 0.1 mm thick and prepared by China Northwest Institute for Non-ferrous Metal Research, was used as a raw material. It was polished and burnished first, and then cut into square pieces (each 15 mm × 15 mm) and washed under ultrasound conditions three times with acetone (99.95%, purity, Chengdu Kelong Chemical Reagent Co. Ltd., Chengdu, China), absolute ethyl alcohol (99.95%, purity, Chengdu Kelong Chemical Reagent Co. Ltd.) and secondary deionized water. Finally it was dried in the vacuum with ambient temperature. The surface reaction experiments were undertaken in a quartz pipe device [31], which could be filled with one of flowing gases of Ar, H2S, O2 and H2 (99.999%, purity, Chengdu Taiyu Gas Co. Ltd., Chengdu, China). In fact, these gases were added successively according to the experimental requirements. They were then reacted with Pd membrane at different temperatures. The experimental temperature fluctuation was controlled within ±0.3 °C, the gas-filling in the range of 10–15 mL/s, and the reaction duration was 5 min.
Figure 1 shows the experimental apparatus used in the gas reaction experiment, A small square section of the original Pd membrane (15 mm × 15 mm) was first placed into a silica tube (16.00 mm ID), which was filled with Ar to purge the air from the inside. The oven temperature was adjusted to the reaction temperature. The flow controller was adjusted to fill the tube with H2S, O2, H2 and the Ar flow controller was shut off at the same time. The Ar flow controller was opened to refill the tube with Ar after Pd membrane reacting with H2S, O2 and H2, while each of the gasflow controller was shut off gradually. The silica tube was removed from the oven and cooled in the air. After the tube had cooled to room temperature, the Pd membrane was removed from the oven.
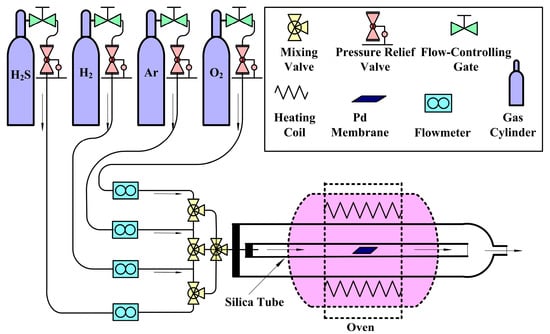
Figure 1.
Schematic of the apparatus used for the gas reactions.
2.2. Characterization
The sample surface micro-morphology was analyzed using the field emission scanning electron microscope (FESEM) (Quanta450 FEG, Thermo Fisher, Hillsboro, OR, USA). The matter phase of the sample was examined and analyzed using an X-ray diffractometer (XRD, DX2500, Haoyuan Scientific Inc., DanDong, China). The chemical state of the sample surface was analyzed using an X-ray photoelectron spectrometer with EX05 ion sputtering gun (Model 250, ESCALAB, Thermo Fisher, Hillsboro, OR, USA). The hydrogen permeability after the sample surface was treated was evaluated by the hydrogen penetration rate testing device made by China Academy of Engineering Physics (CAEP, MianYang, China) [31].
Figure 2 shows the hydrogen permeation experimental apparatus. Pd membranes were enclosed in a stainless steel tube (12 mmID) by laser welding. In the first step, the high vacuum pump and the valves No. 2, 3, 4, 5, 6, 7, and 8 were opened sequentially, before the system was pumped to 3 × 10⁻⁴ Pa and heated to 350 °C. In the second step, valves No. 2 and 3 were shut off sequentially, while valve no.1 was opened, allowing hydrogen gas to fill the chamber on the left side of the Pd membrane. Pressure loss data for the chamber were recorded using a pressure sensor and transmitted to a computer. The duration, temperature and the pressure of the hydrogen permeation experiment were 600 s, 623 K and 0.12 Mpa.
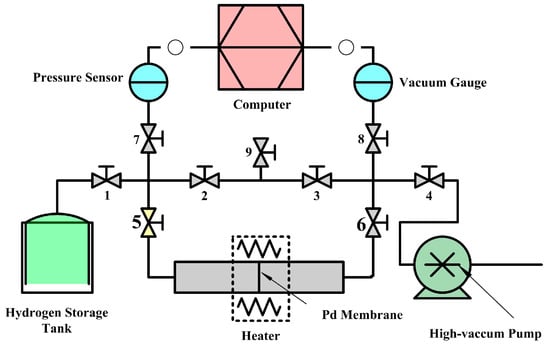
Figure 2.
General scheme for the hydrogen permeation experimental apparatus.
2.3. Calculation of Stable Permeation Flux
In order to examine the effect of Pd membrane hydrogen permeability after and before the surface treatment, hydrogen permeability tests were carried out for the Pd membrane material in different reaction conditions. Here, it was assumed that the stable permeation flux (J) of hydrogen in Pd membrane was of the hydrogen permeation efficiency of such membrane [32]. The term J was equal to the permeation rate (Π) times the driving force (D). As the Π means the hydrogen permeating ability through Pd membrane per unit area and time, it is mainly determined by a unit driving force (hydrogen pressure at permeating side). Thus, the J can be expressed by the following relationship:
In Equation (1), V is the gas volume at the Pd membrane air inlet end, which is expressed by the following formula:
here VP is the gas volume in pipeline, Vt is the volume of gas holder. R is a constant 8.31 J·mol−1·K−1, S is the area of Pd membrane 1.13 cm2. d is the inner diameter of pipeline (1.20 cm), T is the temperature in hydrogen permeation test which is 623 K, ΔP is the reduction amount of intensity of hydrogen pressure at Pd air inlet end per unit permeating time, and Δt is unit permeating time.
V = VP + Vt = 0.1 L + 4.9 L = 5 L
3. Results and Discussion
3.1. Effect of Hydrogen Sulfide (H2S) on Composition and Morphology of Pd Membrane Surface
Figure 3 shows the XRD testing results of Pd membrane surface under different reaction conditions. It can be seen from the figure that the two phases Pd16S7 and Pd4S are visible in the XRD diffraction peak at 150 °C. Their intensity was enhanced gradually from 150 °C to 350 °C first, and then went down rapidly at 450 °C. Though a characteristic PdS diffraction peak occurred at 350 °C or so, its intensity was not significant. However, it was enhanced rapidly at 450 °C, so that the characteristic diffraction peaks of Pd, Pd16S7 and Pd4S were barely detected.
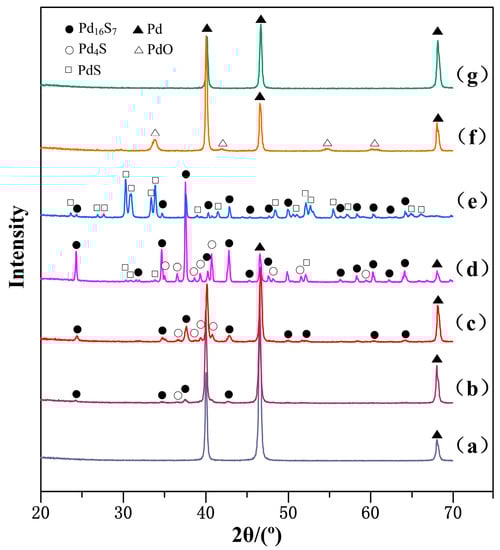
Figure 3.
The XRD spectra of Pd membranes on: (a) The surface after reacting with hydrogen sulfide at 23 °C; (b) The surface of Pd16S7 and Pd4S produced after reacting with hydrogen sulfide at 150 °C; (c) The surface of Pd16S7 and Pd4S produced after reacting with hydrogen sulfide at 250 °C; (d) The surface of Pd16S7, Pd4S and PdS produced after reacting with hydrogen sulfide at 350 °C; (e) The surface of PdS produced after reacting with hydrogen sulfide at 450 °C; (f) The surface of PdO produced after sample (e) was oxidized at 500 °C; (g) The surface after PdO in sample (f) was reduced by hydrogen at 23 °C.
The main products were produced by Pd membrane reacted with H2S were Pd16S7 and Pd4S between 150 °C and 350 °C, however the product was PdS at 450 °C. With the rise of temperature, H2S was reacted with Pd membrane and directly produced PdS. But in view of rapid reduction of Pd16S7 and Pd4S at 450 °C, both Pd16S7 and Pd4S were firmly changed into PdS at 450 °C. As 450 °C is the working temperature of Pd membrane, the following reactions likely coexist at this temperature:
Pd + H2S(g) → PdS + H2(g); Pd16S7 + 9H2S(g) → 16PdS + 9H2(g); Pd4S + 3H2S(g) → 4PdS + 3H2(g).
At the temperatures lower than 150 °C, the characteristic peak of sulfides could hardly be detected by XRD. However, the sulfide product might be lesser or quite thin, or could be below the amount of the matter phase required for XRD detection. For this reason, the XPS was used to study the Pd membrane surface reacting at 23 °C and 100 °C in order to understand the reaction results below 150 °C in this experiment. It can be found from Figure 4a that no other element existed but a little adsorbed carbon on the Pd membrane before the reaction. However, there are significant S characteristic peaks in Figure 4b,c, where the relative content of elemental S reaches 67.88% and 82.73%, respectively, by qualitative analysis and quantitative analysis of XPS. This indicates that at temperatures below 150 °C, hydrogen sulfide was also decomposed into S2− on the Pd surface and reacted with the Pd surface, and the amount of S2− also increased with the rise of the reaction temperature.
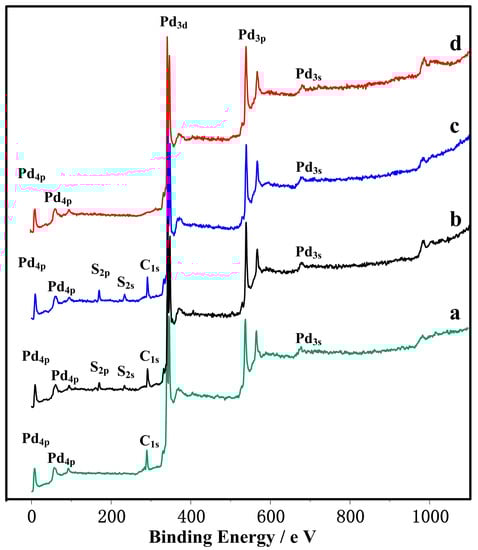
Figure 4.
The XPS spectra of samples on: (a) Pure Pd membrane surface; (b) The chemical element state on the Pd membrane surface after reacting with hydrogen sulfide at 23 °C; (c) The chemical element state on the Pd membrane surface after reacting with hydrogen sulfide at 100 °C; (d) The chemical element state on the Pd membrane surface after reacting with hydrogen sulfide at 450 °C and then by redox reaction.
The phase transformation of palladium sulfide mainly depends on amount of the S element on Pd surface and reaction rate between S and Pd, and both of them were determined by the reaction temperature. There for, any analysis of the reasons for morphology changes on the Pd membrane surface should focus on the reaction temperature. No significant morphology changes occurred on the Pd surface from 23 °C to 150 °C. However, when the temperature was above 150 °C, it can be seen from Figure 5a that the Pd surface clearly became roughened. This corresponds to the Pd4S and Pd16S7 morphology features detected by XRD. Both Pd4S and Pd16S7 crystal particles increased further in volume and came into contact at 250 °C. Figure 5b shows that the produced crystal particles presented quite striking morphological features, such as a clear crystal boundary and around 0.2–0.4 μm in crystal particle size. According to Figure 5c, an expansion of the crystal boundary was produced in Figure 5b at 350 °C, which looks like spider webs. This phenomenon indicates a possible occurrence of Pd4S according to the XRD spectrum analysis, indicating Pd16S7 appeared and accumulated more and more in the crystal locations of Pd4S and Pd16S7. Globular products occurred on the Pd surface with the rise of temperature above 400 °C, which became more and more in quantity and volume with the temperature rise. It can be seen from Figure 5d that the Pd membrane surface was nearly covered with all these globular products at 450 °C. Based on XRD detection results, the globular product was PdS. After that, the composition and morphology of the Pd surface remained unchanged with the continuous rise of reaction temperature. Based on the fact the working temperature of the Pd membrane is around 450 °C, PdS may be produced over the Pd surface in its engineering applications. Thus, in order to have a better understanding of the generation and removal effect of such product, we conducted a surface redox treatment based on Figure 3c,d.
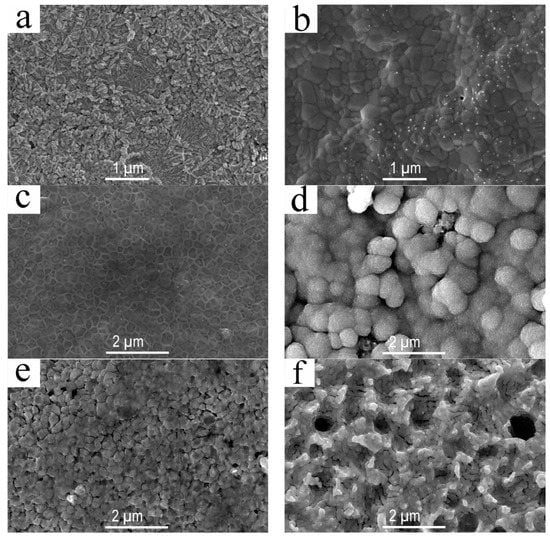
Figure 5.
The morphology of Pd membrane surface under different reaction conditions: (a) After the Pd membrane reacted with hydrogen sulfide at 150 °C; (b) After the Pd membrane reacted with hydrogen sulfide at 250 °C; (c) After the Pd membrane reacted with hydrogen sulfide at 350 °C; (d) After the Pd membrane reacted with hydrogen sulfide at 450 °C; (e) The Pd membrane underwent redox treatment after reacting with hydrogen sulfide at 350 °C; (f) The Pd membrane underwent redox treatment after reacting with hydrogen sulfide at 450 °C.
3.2. The Effect of Redox Reaction on the Pd Membrane Surface Affected by Hydrogen Sulfide
In this experiment, an oxidizing reaction was carried out for the aforementioned two kinds of surfaces at 500 °C using oxygen (O2). Then the reduction reaction was conducted in the 23 °C using hydrogen (H2) with a reacting duration of 5 min [31]. Figure 3f and Figure 1g show that all the characteristic sulfide diffraction peaks disappeared completely and the PdO characteristic diffraction peak appeared on the surface of Pd membrane that reacted with hydrogen sulfide at 450 °C and then was oxidized at 500 °C. This indicates that the Pd sulfides such as Pd16S7 and PdS were oxidized completely. However, after the sample was reacted with hydrogen at the 23 °C, it can be seen from Figure 3f that only the characteristic Pd diffraction peak appeared on the Pd surface. Also, the peak was the same as the surface characteristic diffraction peak of the Pd membrane material prior to reaction. This indicates that PdO was quite unstable in hydrogen, and it could be reduced to Pd completely. At the same time, it can be seen from Figure 4d that no other elements were found other than Pd element on the Pd membrane surface. In addition the free carbon adsorbed originally on Pd surface was also removed. This tells us that the redox reaction not only removed the sulfides on the Pd membrane surface, but also presented a good removal effect for other adsorbed impurities, especially the carbon-bearing ones. Figure 5e and Figure 3f show the Pd surface morphology after the reaction. By comparing Figure 5c and Figure 3e, one can find that the originally prominent Pd16S7 disappeared and a gap was subsequently formed, so that the Pd membrane surface presented a granulated surface as a whole. Similar phenomena and effects were found by comparison of Figure 5d and Figure 3f. The original globular PdS disappeared, and instead, round holes which were close to the original globular PdS in size appeared. Compared with the raw Pd membrane material, the Pd membrane surface became more roughened after such a series of reactions. After comparing the quantity of samples before and after the reaction, it was found that their quantity did not change significantly. This phenomenon indicates that the reaction to gases such as oxygen or hydrogen sulfide does not lead to any loss of palladium. However, the rough surface and the round holes might cause a decrease in the actual thickness of the palladium membrane, which leads to the enhancement of the hydrogen permeation ability.
3.3. Change of Pd Membrane Properties
The stable permeation flux (J) of Pd membrane can be expressed by the rate of Pd membrane high-pressure end, as shown in Figure 6. It can be found from the figure that the Pd membrane pressure at the high-pressure end decreases in an approximate straight line with the time extension, with being just a slope of this line, and the data of ~ and J1–J11 are obtained by calculations as shown in Table 1.
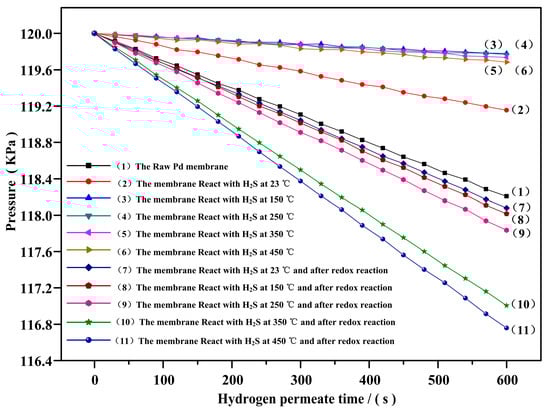
Figure 6.
Change of the Pd membrane pressure at the high-pressure end with the time.

Table 1.
The stable permeation flux (J) of Pd membranes.
Table 1 shows the changes of stable permeation fluxes (J) of Pd membrane under different reaction conditions. It was found from J2–J6 that the stable permeation flux of Pd membrane could be decreased by around 52.34% even if the hydrogen sulfide was reacted with Pd membrane at 23 °C. Also, the stable permeation flux was more slashed by 86.72% or so when the temperature rose to 150 °C. If the temperature continued to rise, the flux could not change greatly any more, indicating that a more compact sulfide layer came into being on the Pd membrane surface above 150 °C, which could result in the loss of H2S dissolution of the Pd membrane surface. A small quantity of hydrogen permeation might be produced as micro-cracks occurred in sulfides on the Pd membrane surface under hydrogen pressure. This led to a part of hydrogen coming into contact with the Pd surface that was not poisoned by hydrogen sulfide. It was found from J7–J11 that after the Pd membrane that had reacted with hydrogen sulfide at different temperatures reacted with oxygen at 500 °C, its stable permeation flux was not restored but rather exceeded the stable permeation flux of the Pd membrane which was not reacted chemically. Moreover, the higher the temperature was for the Pd membrane reactions with hydrogen sulfide, the more a stable hydrogen permeation flux was obtained by redox reaction. The flux increased by around 80% against the original Pd membrane when the temperature in the reaction with hydrogen sulfide was up to 450 °C.
It can be seen from Figure 7 that after reaction with hydrogen sulfide and redox reaction, no other clear changes occurred on the Pd membrane surface, except for that the surface became highly roughened due to a great number of holes, which are attribute to a different structure between Pd and PdO [33]. The carbon pollutants also were evidently removed, according to the XPS spectra in Figure 4d. The hydrogen permeating in Pd membrane mainly went through three processes, i.e., (1) hydrogen molecules were adsorbed and dissolved on the Pd membrane surface; (2) the hydrogen atoms after dissolution were diffused; (3) the hydrogen atoms were combined with one side of the Pd membrane to generate hydrogen molecules which were desorbed.
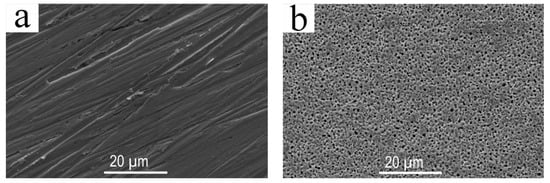
Figure 7.
Morphology of the Pd membrane surface: (a) Original Pd membrane surface where no reaction has occured; (b) Pd membrane surface reacted with 450 °C H2S and then treated by redox reaction.
There are three possible causes promoting a stable hydrogen permeation flux in Pd membrane material, i.e., (1) the rise of Pd membrane surface roughness resulted in an effective increase of the Pd membrane surface area after H2S erosion and redox reactions, so that there were more active sites to dissolve hydrogen and adsorb more hydrogen molecules on the Pd membrane surface. As the result, more protons could be dissolved and diffused on the Pd membrane; (2) the roughened surface phase, compared to the smooth one, could further improve the catalytic activity of the Pd membrane and accelerate the dissolution of hydrogen molecules on the Pd membrane surface; (3) the carbon pollutants were removed from the Pd membrane surface, which made the surface become cleaner. Furthermore, the dissolved sites that were occupied originally by carbon atoms could now be available for hydrogen molecules. As the result, the catalytic activity of the Pd membrane surface and dissolving capacity of the Pd membrane surface could be further improved.
4. Conclusions
Based on the research work presented, the following conclusions can be drawn:
- (1)
- Hydrogen sulfide (H2S) could be dissolved on the Pd membrane surface at 23 °C and contaminate the surface. Pd16S7, Pd4S and PdS were generated on the Pd membrane surface successively with the rise of temperature. The globular PdS product came into being on the Pd surface at temperatures over 350 °C. Temperature plays an important role in the change of Pd membrane surface morphology as well as the type and quantity of the products generated after H2S was reacted with Pd membrane.
- (2)
- The sulfides and carbon impurities on the Pd membrane surface could be removed completely by redox reactions, and at the same time, the Pd membrane surface became highly roughened and porous. The Pd membrane surface morphology could be controlled by controlling the temperature for the H2S corrosion and redox reactions.
- (3)
- After H2S corrosion and redox reactions, the hydrogen permeability of the Pd membrane could increase by around 80%compared to that of the pure Pd membrane before the reactions. The cause for such a permeability increase was that the catalytic and dissolving capacities of the Pd membrane were enhanced with the increase of Pd membrane surface roughness and reduction of carbon pollution.
Author Contributions
Conceptualization, W.F. and X.Z.; Methodology, Q.W.; Formal Analysis, W.F.; Investigation, W.F., Q.K. and X.Z.; Resources, W.F.; Data Curation, Q.K. and J.W.; Writing-Original Draft Preparation, W.F.; Writing-Review & Editing, X.Z.; Visualization, P.T.; Supervision, Q.W.; Project Administration, W.F.; Funding Acquisition, W.F.
Acknowledgments
The authors acknowledge the Applied Basic Research Programs of Sichuan province (Grant No. 2018JY0062) and the Natural Science and Technology Research Projects of Chengdu (Grant No. 2015-HM01-00385-SF) and the National Natural Science Research Foundation of China (Grant No. 11572057) and Open Research Subjectof Key Laboratory of Special material and preparation technology (Grant No. szjj2017-062) and The National College Students’ innovation and entrepreneurship training programs(Grant No. 201711079001).
Conflicts of Interest
The authors declare no conflict of interest.
References
- Sato, T.; Sato, S.; Itoh, N. Using a hydrogen-permeable palladium membrane electrode to produce hydrogen from water and hydrogenate toluene. Int. J. Hydrogen. Energy 2016, 41, 5419–5427. [Google Scholar] [CrossRef]
- Franzitta, V.; Curto, D.; Rao, D.; Viola, A. Hydrogen Production from Sea Wave for Alternative Energy Vehicles for Public Transport in Trapani (Italy). Energies 2016, 9, 850. [Google Scholar] [CrossRef]
- Koj, J.C.; Wulf, C.; Schreiber, A.; Zapp, P. Site-Dependent Environmental Impacts of Industrial Hydrogen Production by Alkaline Water Electrolysis. Energies 2017, 10, 860. [Google Scholar] [CrossRef]
- Didaskalou, C.; Buyuktiryaki, S.; Kecili, R.; Fonte, C.P.; Szekely, G. Valorisation of agricultural waste with an adsorption/nanofiltration hybrid process: From materials to sustainable process design. Green Chem. 2017, 19, 3116–3125. [Google Scholar] [CrossRef]
- Hafez, H.; Nakhla, G.; Naggar, H.E.I. Biological Hydrogen Production from Corn-Syrup Waste Usinga Novel System. Energies 2009, 2, 445–455. [Google Scholar] [CrossRef]
- Chen, W.H.; Hsia, M.H.; Chi, Y.H.; Lin, Y.L.; Yang, C.C. Polarization phenomena of hydrogen-rich gas in high-permeance Pd and Pd–Cu membrane tubes. Appl. Energy 2014, 113, 41–50. [Google Scholar] [CrossRef]
- Fernandez, E.; Helmi, A.; Medrano, J.A.; Coenen, K.; Arratibel, A.; Melendez, J.; de Nooijer, N.C.A.; Spallina, V.; Viviente, J.L.; Zuñiga, J.; et al. Palladium based membranes and membranereactors for hydrogen production and purification: An overview of research activities at Tecnalia and TU/e. Int. J. Hydrogen. Energy 2017, 42, 13763–13776. [Google Scholar] [CrossRef]
- Ali, A.; Drioli, E.; Macedonio, F. Membrane Engineering for Sustainable Development: A Perspective. Appl. Sci. 2017, 7, 1026. [Google Scholar] [CrossRef]
- Montesinos, H.; Julián, I.; Herguido, J.; Menéndez, M. Effect of the presence of light hydrocarbon mixtures on hydrogen permeance through Pd-Ag alloyed membranes. Int. J. Hydrogen. Energy 2015, 40, 3462–3471. [Google Scholar] [CrossRef]
- Kurokawa, H.; Yakabe, H.; Yasuda, I.; Peters, T.; Bredesen, R. Inhibition effect of CO on hydrogen permeability of Pd-Ag membrane applied in a microchannel module configuration. Int. J. Hydrogen. Energy 2014, 39, 17201–17209. [Google Scholar] [CrossRef]
- Gabitto, J.F.; Tsouris, C. Sulfur Poisoning of Metal Membranes for Hydrogen Separation. Int. Rev. Chem. Eng. 2009, 1, 394–411. [Google Scholar]
- Mundschau, M.V.; Xie, X.; Evenson, C.R., IV; Sammells, A.F. Dense inorganic membranes for production of hydrogen from methane and coal with carbon dioxide sequestration. Catal. Today 2006, 118, 12–23. [Google Scholar] [CrossRef]
- Slimane, R.B.; Abbasian, J. Copper-Based Sorbents for Coal Gas Desulfurization at Moderate Temperatures. Ind. Eng. Chem. Res. 2000, 39, 1338–1344. [Google Scholar] [CrossRef]
- Cheah, S.; Carpenter, D.L.; Magrini-Bair, K.A. Review of Mid-to High-Temperature Sulfur Sorbents for Desulfurization of Biomass-and Coal-derived Syngas. Energy Fuel. 2009, 23, 5291–5307. [Google Scholar] [CrossRef]
- Tarditi, A.M.; Imhoff, C.; Braun, F.; Miller, J.B.; Gellman, A.J.; Cornaglia, L. PdCuAu ternary alloy membranes: Hydrogen permeation properties in the presence of H2S. J. Membr. Sci. 2015, 479, 246–255. [Google Scholar] [CrossRef]
- Nayebossadri, S.; Speight, J.; Book, D. Novel Pd-Cu-Zr hydrogen separation membrane with a high tolerance to sulphur poisoning. Chem. Commun. 2015, 51, 15842–15845. [Google Scholar] [CrossRef] [PubMed]
- Lewis, A.E.; Zhao, H.B.; Syed, H.; Wolden, C.A.; Douglas Way, J. PdAu and PdAuAg composite membranes for hydrogen separation from synthetic water-gas shift streams containing hydrogen sulfide. J. Membr. Sci. 2014, 465, 167–176. [Google Scholar] [CrossRef]
- Guerreiro, B.H.; Martin, M.H.; Roué, L.; Guay, D. Hydrogen solubility in PdCuAu alloy thin films prepared by electrodeposition. Int. J. Hydrogen. Energy 2014, 39, 3487–3497. [Google Scholar] [CrossRef]
- Braun, F.; Tarditi, A.M.; Miller, J.B.; Cornaglia, L.M. Pd-based binary and ternary alloy membranes: Morphological and perm-selective characterization in the presence of H2S. J. Membr. Sci. 2014, 450, 299–307. [Google Scholar] [CrossRef]
- Peters, T.A.; Kaleta, T.; Stange, M.; Bredesen, R. Development of ternary Pd-Ag-TM alloy membranes with improved sulphur tolerance. J. Membr. Sci. 2013, 429, 448–458. [Google Scholar] [CrossRef]
- Coulter, K.E.; Way, J.D.; Gade, S.K.; Chaudhari, S.; Alptekin, G.O.; DeVoss, S.J.; Paglieri, S.N.; Pledger, B. Sulfur tolerant PdAu and PdAuPt alloy hydrogen separation membranes. J. Membr. Sci. 2012, 405–406, 11–19. [Google Scholar] [CrossRef]
- Braun, F.; Miller, J.B.; Gellman, A.J.; Tarditi, A.M.; Fleutot, B.; Kondratyuk, P.; Cornaglia, L.M. PdAgAu alloy with high resistance to corrosion by H2S. Int. J. Hydrogen. Energy 2012, 37, 18547–18555. [Google Scholar] [CrossRef]
- Pati, S.; Jat, R.A.; Mukerjee, S.K.; Parida, S.C. Hydrogen Isotope Effect on Thermodynamic and Kinetics of Hydrogen/Deuterium Absorption−Desorption in Pd0.77Ag0.10Cu0.13 Alloy. J. Phys. Chem. C. 2015, 119, 10314–10320. [Google Scholar] [CrossRef]
- Zhao, L.; Goldbach, A.; Bao, C.; Xu, H. Structural and Permeation Kinetic Correlations in PdCuAg Membranes. ACS Appl. Mater. Interfaces 2014, 6, 22408–22416. [Google Scholar] [CrossRef] [PubMed]
- Tosques, J.; Martin, M.H.; Roué, L.; Guay, D. Hydrogen solubility in PdCuAg ternary alloy films prepared by electro deposition. Int. J. Hydrogen. Energy 2014, 39, 15810–15818. [Google Scholar] [CrossRef]
- Nayebossadri, S.; Speight, J.; Book, D. Effects of Low Ag Additions on the Hydrogen Permeability of Pd-Cu-Ag Hydrogen Separa-tion Membranes. J. Membr. Sci. 2013, 451, 216–225. [Google Scholar] [CrossRef]
- Tarditi, A.M.; Braun, F.; Cornaglia, L.M. Novel PdAgCu ternary alloy: Hydrogen permeation and surface properties. Appl. Surf. Sci. 2011, 257, 6626–6635. [Google Scholar] [CrossRef]
- Zhao, L.; Goldbach, A.; Xu, H. Tailoring palladium alloy membranes for hydrogen separation from sulfur contaminated gas streams. J. Membr. Sci. 2016, 507, 55–62. [Google Scholar] [CrossRef]
- Rahman, M.A.; García-García, F.R.; Li, K. Development of a catalytic hollow fibre membrane microreactor as a Microreformer unit for automotive application. J. Membr. Sci. 2011, 390–391, 68–75. [Google Scholar] [CrossRef]
- Dijkstra, J.W.; Pieterse, J.A.; Hui, L.; Boon, J.; Delft, Y.C.; Raju, G.; Peppink, G.; Brink, R.W.; Jansen, D. Development of membrane reactor technology for power production with pre-combustion CO2 capture. Energy Procedia 2011, 4, 715–722. [Google Scholar] [CrossRef]
- Feng, W.; Liu, Y.; Lian, L.; Peng, L.; Li, J. Effect of surface oxidation on the surface condition and deuterium permeability of a palladium membrane. Appl. Surf. Sci. 2011, 257, 9852–9857. [Google Scholar] [CrossRef]
- Andrew, P.L.; Peacock, A.T.; Pick, M.A. Interpretation of deuterium pumping by plasma-facing beryllium surfaces. J. Nucl. Mater. 1992, 4, 196–198. [Google Scholar] [CrossRef]
- Yokosawa, T.; Tichelaar, F.D.; Zandbergen, H.W. In-situ TEM on epitaxial and non-epitaxial oxidation of Pd and reduction of PdO at P = 0.2–0.7 bar and T = 20–650 °C. Eur. J. Inorg. Chem. 2016, 2016, 3094–3102. [Google Scholar] [CrossRef]
© 2018 by the authors. Licensee MDPI, Basel, Switzerland. This article is an open access article distributed under the terms and conditions of the Creative Commons Attribution (CC BY) license (http://creativecommons.org/licenses/by/4.0/).