Abstract
This paper compares the annual performance of Integrated Solar Combined Cycles (ISCCs) using different solar concentration technologies: parabolic trough collectors (PTC), linear Fresnel reflectors (LFR) and central tower receiver (CT). Each solar technology (i.e. PTC, LFR and CT) is proposed to integrate solar energy into the combined cycle in two different ways. The first one is based on the use of solar energy to evaporate water of the steam cycle by means of direct steam generation (DSG), increasing the steam production of the high pressure level of the steam generator. The other one is based on the use of solar energy to preheat the pressurized air at the exit of the gas turbine compressor before it is introduced in the combustion chamber, reducing the fuel consumption. Results show that ISCC with DSG increases the yearly production while solar air heating reduces it due to the incremental pressure drop. However, air heating allows significantly higher solar-to-electricity efficiencies and lower heat rates. Regarding the solar technologies, PTC provides the best thermal results.
1. Introduction
At the short and medium terms, concentrating solar power (CSP) will share the scenario with conventional thermal power plants. In such a context, integrated solar combined cycles (ISCC) are an interesting choice for power generation because hybridisation provides a good use of fossil and solar resources, obtaining higher efficiency than using solar dedicated and conventional combined cycles separately.
Solar combined cycles have been studied since the late 90 s. The concept was initially proposed by Luz Solar International (Johansson et al. [1]). Early studies were based on the PTC technology of SEGS (Solar Energy Generating Systems) plants installed in California [2,3,4]. At the beginning of the century, the research in the field spread out as a result of the installation of some plants thanks to subsidies provided by the agency Global Environment Facility to countries such as Egypt, Morocco, India and Mexico [5,6,7,8]. These studies deal mainly with the economic feasibility of the different choices and the production. In recent years, interest in these plants has grown considerably, as it is concluded in [9,10], and novel forms of integration [11] and optimization [12,13,14] are common in the technical literature.
To date, there are only a small number of solar plants based on a combined cycle. Some of them are Ain Beni Mathar (Morocco), Hassi R’Mel (Algeria), Kuraymat (Egypt), Martin Next Generation Solar Energy Center (USA), Agua Prieta II (Mexico), Archimede (Italy) and Yazd (Iran). There are others planned, such as Ningxia (China), Palmdale Hybrid Power Plant and Victorville 2 Hybrid Power Plant (USA), Abdaliya (Kuwait) or Duba 1 ISCC (Saudi Arabia) [9,15]. Many of the above plants include multiple gas turbines and HRSGs and a steam turbine [9] (N × 1 configurations) and a solar field in parallel to the heat recovery steam generators (HRSG). Solar energy is collected using PTC and it is transferred to the steam cycle using an intermediate heat transfer fluid (HTF). HTF is usually thermal oil except in Archimede power plant that uses molten salts [5,9]. Besides, solar energy is used to evaporate the water of the high pressure level (for example, Hassi R’Mel [5,9] and Yazd [6,9]), although some plants include a slight degree of solar steam superheating (Ain Beni Mathar [9,16], Kuraymat [9,17]), water preheating (Victorville 2 [18]) or even preheating and superheating (Archimede [8]).
Thus, it may be considered that the state-of-the-art in solar combined cycles consists of a conventional combined cycle in which solar energy is integrated into the steam cycle, usually at the high pressure level. As it is known, such a hybridisation provides some synergies during the yearly operation. The main reason for those synergies is that the most demanding conditions for combined cycle gas turbines (CCGT) (high ambient temperatures) correlate well with the optimal conditions for CSP, which favour the integrated behaviour and efficiency of the ISCC [19,20,21]. The purpose of ISCC technology is either to increase of the power plant or, alternatively, to reduce the consumption of fossil fuel. This allows the use of solar resource while advancing in the learning curves of solar technology, with moderate investment and risk due to the hybridization.
As commented above, the use of thermal oil as HTF is the most conventional choice, although some other alternatives have been proposed, for example, molten salts [8], direct steam generation (DSG) [22,23], and CO2 [24].
Studies like [25] show the prevalence of PTC in the field of ISCC. However, like in the case of pure CSP, there are other choices to integrate solar energy, especially CT [26] and LFR [27]. The reasons to introduce these technologies are the same as in solar power plants: CT is considered as the technology with highest potential to reach high temperatures at industrial power rates and LFR, despite its late development compared to PTC, has some potential to reduce the levelized cost of energy.
In addition to the conventional ISCC (solar integration into the steam cycle), other possibilities have been proposed. For example, in Reference [28] solar energy is integrated into the gas turbine, preheating the air coming from the compressor before it is introduced in the combustion chamber. In this case, the technology used is again PTC. Other options are either the use of CT in parallel with the exhaust gas of a gas turbine [29], or the use of CT instead of PTC to preheat the air exiting from the compressor [30], similarly to [28]. All these configurations are less developed than the conventional ISCC.
In order to cover all these possibilities, the present paper compares the annual performance of fuel and solar hybrid combined cycles using these three different solar concentration technologies—PTC, LFR and CT—and each technology is proposed to integrate solar energy into the combined cycle in two different ways. The first one is based on the use solar energy for evaporating water of the steam cycle by means of DSG. Maximum working pressure and temperature are about 100 bar and 310 °C, respectively. The other one is based on the use solar energy to preheat the pressurized air at the exit of the compressor of the gas turbine before it is introduced in the combustion chamber, reducing the fuel consumption required for a given turbine inlet temperature. In these cases, maximum considered pressure and temperature are 20 bar and 500 °C (which is an optimistic value for LFR and even PTC technologies). The comparative analysis is made considering the thermal behaviour of the different technologies. Economic aspects are out of the scope of the present work, although some preliminary results are commented.
In the following sections, the proposed configurations are introduced, then the methodology and the figures of merit used for the comparisons are presented and finally the results and the conclusions are shown.
2. Studied Configurations
2.1. Reference CCGT
All the ISCC configurations are based on the same CCGT reference power plant. The reference CCGT includes two gas turbines of 72.6 MW, two dual pressure HRSGs and one steam turbine (2 × 1 configuration), resulting in a total power of 226 MW and achieving a thermal efficiency of 54.6%. Its main data are presented in Table 1.

Table 1.
Design parameters of the reference CCGT.
2.2. Configurations Using Parabolic Trough Collectors
Figure 1 shows the layouts of the solar hybrid combined cycles based on PTC. In the case of solar integration into the steam cycle (Figure 1a), namely PTC-DSG, the configuration corresponds to the conventional ISCCs. Solar energy is used to boil part of the water of the high pressure level in parallel with the corresponding evaporator of the HRSG (which is the optimum layout for solar integration into the steam cycle [31,32]).
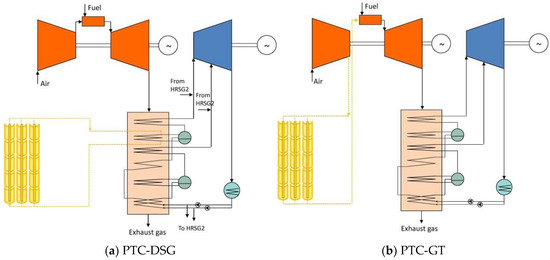
Figure 1.
Layout of the configuration based on PTC.
Besides, in the case of solar integration into the gas turbine (Figure 1b), namely PTC-GT, the air at the exit of the compressor is directed to the solar field, where it is pre-heated before entering to the combustion chamber. The steam cycle is not modified in this case.
2.3. Configurations Using Linear Fresnel Reflectors
Figure 2 shows the layouts of the solar hybrid combined cycles based on LFR. In the case of solar integration into the steam cycle (Figure 2a) the layout also corresponds to an ISCC in which the solar energy is used to evaporate part of the water at the high pressure level in parallel with the corresponding evaporator [33]. The configuration is named as LFR-DSG. In the case of solar integration into the gas turbine (Figure 2b), the air exiting the compressor is heated in the LFR system and then it is directed to the combustion chamber. The configuration is named LFR-GT.
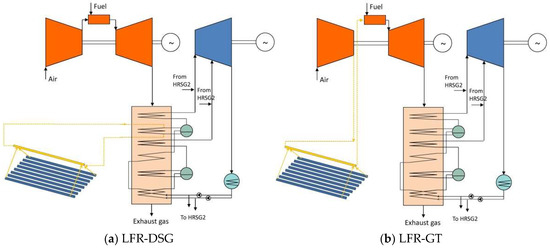
Figure 2.
Layout of the configuration based on LFR.
2.4. Configurations Using Central Tower Receivers
Figure 3 shows the layouts of the solar hybrid combined cycles based on CT. In this case, the solar heat flux impinging onto the receiver is higher than in the previous configurations and superheating might be advisable. However, such analysis has not been carried out yet and, as in previous cases and for comparative purposes, solar integration into the steam cycle (Figure 3a) is used to evaporate part of the water at the high pressure level. The configuration is named CT-DSG. In the case of solar integration to the gas turbine (Figure 3b), solar thermal energy preheats the air exiting the compressor before it is directed to the combustion chamber inlet. The configuration is named CT-GT.
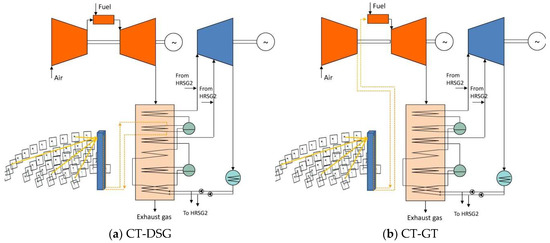
Figure 3.
Layout of the configuration based on CT.
3. Methodology
3.1. Simulation Models
3.1.1. Simulation of CCGT
The simulation models for the combined cycle and integration into ISCC were developed in previous works [19]. The on-design simulation of the CCGT is based on mass and energy balances applied to every component of the combined cycle. This simulation allows the calculation of the thermodynamic properties of the steam and the gas at every representative point of the cycle, as well as the power, efficiency and heat exchanged at each element of the HRSG. Main data for the on-design simulation were presented in Table 1.
Off-design simulation requires the calculation of the components at every operating condition. Once the on-design calculation has been done, the components can be characterised and the following data should be introduced or calculated:
- Characteristic curves of every turbomachine;
- The UA product (global coefficient of heat transfer by the heat transfer area) of each heat exchanger of the HRSG;
- Ambient conditions (pressure and temperature).
El-Gammal [34] and Stamatis et al. [35] provide dimensionless curves that can be used to extrapolate the performance of gas turbines. Characterisation of the heat exchangers and variation of the heat transfer coefficient, U, is described in [36]. Finally, Steam turbine at off-design operation is calculated using the Stodola Law and the efficiency prediction proposed by Cotton [37].
3.1.2. Simulation of PTC
The PTC-DSG is based on the Eurotrough-150 (Eurotrough consortium, Almeria, Spain), although the absorber tube thickness is higher because the working pressure is higher using water than using synthetic oil. The detailed data is presented in Table 2. The simulation model for the PTC using water-steam as heat transfer fluid was developed and validated in [38]. The model allows the calculation of the thermal power and thermal efficiency of the collector. The latter results a function of the temperature of the fluid inside the tubes [31]:
η (%) = −0.00013·Tsat2 (°C) + 0.0313·Tsat (°C) + 69.563.
Table 2.
Geometrical and optical parameters for the collector loop considered.
Like in Reference [19], the nominal solar thermal power is set to 50 MWth. For that, the ISCC configuration requires 82,632 m2 of reflectors in about 260,000 m2 of land [31]. In the case of PTC-GT, parabolic troughs were based again on the Eurotrough-150 design. The simulation models of PTC were adapted in order to work with pressurized air instead of boiling water, and the layout of the solar field was modified accordingly to the air performance. Specifically, in order to obtain 50 MWth, the configuration requires about 100,000 m2 of reflectors and about 315,000 m2 of land. The performance in this case is lower than in the case of DSG because the thermal-physical properties of air are worse and the average temperature during the heating is higher. Convective thermal losses are assessed through the Pethukov correlation, and radiation losses are estimated using an emissivity of 94%. The pressure drop of the air inside the troughs was assessed using the Colebrook equation.
3.1.3. Simulation of LFR
The simulation models for the LFR-DSG configuration were also developed in a previous work [33]. Again, the objective of these models is the simulation of the plant at on- and off-design conditions, as well as the sizing and characterisation of the equipment.
The number of degrees of freedom in the design of LFR is high. In order to simplify the analysis without carrying out an optimization, the geometrical layout of Fresdemo [39] was considered, both for the reflectors and the linear receiver, whose module length is 100 m. The main features are shown in Table 3.
Table 3.
Main parameters of the LFR.
The impinging thermal power is calculated by means of ray trace, using the Monte Carlo methodology and considering several Gaussian errors due to the manufacturing and tracking systems as well as a sunshape model (Buie et al. [40]). Ray trace allows the calculation of the concentration factor on the receiver as a function of the longitudinal and transversal angles of incidence, as it is shown in Figure 4.
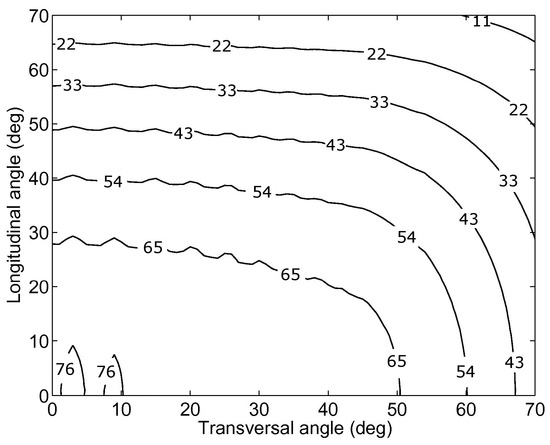
Figure 4.
Optical efficiency of the heliostat solar field.
Once the concentration is known at any moment, the incident thermal power is obtained as the product of this concentration factor and the modified DNI (including the incidence angle modifier), taking into account the absortivity of the tube and the transmisivity of the glass [39]:
where CF is the actual concentration factor, α the tube absorptivity (0.93), τ the transmissivity of the glass (0.94), CF’ the geometrical concentration factor and D and L the diameter and tube length.
The thermal power transferred to the steam is calculated with the power impinging on the tube and the thermal efficiency of the receiver. In this work, the following equation was used [39]:
To produce 50 MWth of steam with a quality of 30% at a suitable velocity inside the tube, 24 parallel loops of 3 modules of 100 m are required. The land requirement is 151,200 m2, and the reflective area of the mirrors is 90,720 m2.
For the LFR-GT configuration, the models were adapted to consider the air as working fluid, and the design of the solar field was reconsidered. As in the case of the PTC-DSG, convective heat losses were assessed through the Pethukov correlation, radiation losses were estimated using an emissivity of 94%, and pressure drop of the air inside the reflector was assessed using the Colebrook equation.
In this case, the length of the module was established in 25 m instead of 100 m, and the field required 235 loops in order to transfer 50 MWth. Therefore, the solar field size is of about 148,000 m2 of mirrors and 245,000 m2 of land. As in the case of PTC, the land requirements using air compared to the case of DSG are significantly higher.
3.1.4. Simulation of CT
In both cases, namely CT-DSG and CT-GT, the heliostat field layout is similar to that of Solar One project, so it consists of 1818 heliostats, 71,095 m2 of mirrors and 291,000 m2 of land. Optical model was described in References [41,42], which uses ray trace for the blocking and shadowing calculation and for the calculation of the interception efficiency. Like in [43], an efficiency matrix was used to estimate the optical efficiency at each operating condition, which is illustrated in Figure 5.
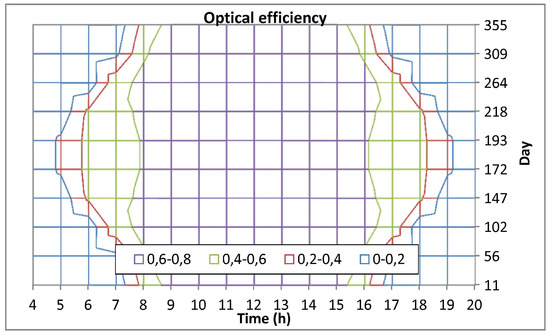
Figure 5.
Optical efficiency of the heliostat solar field.
In the case of the CT-DSG configuration, a central receiver with an aperture cavity of 121 m2 was considered. Heat losses were estimated as in Reference [44], considering convective, emissive and reflective losses. The net thermal power is 42.5 MWth at the design condition (close to the 50 MWth but not exactly this value due to the fixed size of the solar field).
In the case of the CT-GT configuration, a pressurized volumetric receiver of 50 m2 was considered. Pressure drop and thermal losses were estimated as in Reference [43]. The net thermal power supplied at the design condition resulted in 42.3 MWth (also due to the fixed size of the solar field).
3.2. Locations and Annual Simulation
The yearly production and fuel consumption were assessed in two locations, Almeria (Spain) and Las Vegas (USA). Selection of these locations is based on previous works and it has been maintained for comparative purposes. The sites have been used in a multitude of studies due to historical reasons during the concentrating solar power development. Early development of CSP technology took place in the Mojave Desert (close to Las Vegas), and much of European developments have been tested in the Plataforma Solar de Almería. Both locations have similar latitude and a favourable climatology for solar technologies, although Las Vegas presents harder climate in terms of solar insolation and temperature variation than Almeria.
Once all the components of the combined cycle and the solar fields have been characterised, the performance of the ISCC may be calculated. Usually, annual simulations are carried out on hourly basis, taking into account the ambient conditions (including solar time and direct normal irradiation) each hour of the typical meteorological year, which leads to 8760 calculating points. In the present work the methodology was changed in order to reduce the computation time. As it is described and validated in [31], this change involves the analysis of the climatic year and the discretisation of the ambient conditions with the objective of finding operating conditions systematically repeated over the year. The result of such a discretisation is a matrix of operating conditions and frequency.
In the case of the PTC configuration, the selected discretisation involves intervals of 2 °C of ambient temperature and 20 W/m2 of a modified direct normal irradiation (considering the different sources of losses), which leads to 538 calculation points in Almeria and 909 in Las Vegas. As an example, Figure 6 shows the frequency matrix used for PTC in Almeria.
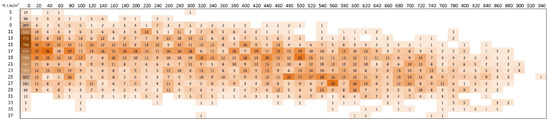
Figure 6.
Frequency matrix for PTC in Almeria: modified DNI-temperature.
In the case of the LFR configurations, discretisation involves intervals of 2 °C of ambient temperature and 2 kW/m2 of concentrated irradiation onto the receiver, leading to 393 calculation points in Almeria and 669 in Las Vegas. Matrix for Almeria is presented in Figure 7.
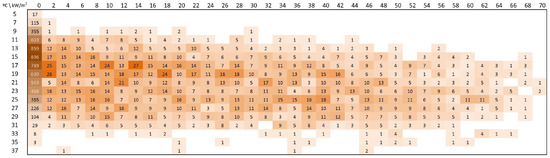
Figure 7.
Frequency matrix for LFR in Almeria: modified DNI·CF-temperature.
Finally, in the case of the CT configurations, the discretisation involves intervals of 2 °C of ambient temperature and 20 W/m2 of a modified irradiation (considering the different sources of losses), that leads to 386 calculation points in Almeria and 683 in Las Vegas (Figure 8).

Figure 8.
Frequency matrix for CT in Almeria: modified DNI-temperature.
3.3. Figures of Merit
The yearly production may be calculated as the power rate at each condition multiplied by an hour (since performance is calculated on hourly basis) and by the corresponding frequency. The global efficiency (η) of the power plant is the ratio of the yearly production to the total thermal energy supplied (both fossil and solar):
where n is the yearly frequency (in hour basis) of a determined operating condition, t is the time interval (1 hour), PGT and PSC are the gas turbine and steam cycle power, respectively, ṁf is the fuel mass flow rate, Hc is the lower heating value of the fuel and is the thermal power.
Thermal efficiency is not the best parameter to evaluate hybrid power plants, since it may decrease at high solar contributions. Instead, the fuel saved thanks to the solar contribution can be assessed using the heat rate (HR), which is the inverse of the efficiency for the CCGT configuration and it should decrease for ISCCs:
On the other hand, it is usual to define an incremental solar efficiency (ηinc, net, solar) [14], which compares the extra production due to the solar integration with the solar contribution, and allows the comparison with solar pure thermal power plants. Considering the annual operation, this conventional definition is given by the expression below:
This definition is useless for the cases of solar air heating, since the combined cycle works in fuel-saving mode and there is not any incremental energy production, leading to null incremental solar efficiency.
For that reason, the above conventional definition has been modified in order to take into account the solar fuel-saving mode. The modification consists on evaluating which part of the total production is due to the solar contribution, and this production should equal the product of the solar energy and the solar-to-electricity efficiency (ηsol-to-elec):
On the other side, the total power variation over the reference CCGT is formed by two terms: one is due to the solar contribution and the other is due to the fossil fuel consumption variation:
where is the thermal power supplied by the fuel (ṁf·HC) and ηinc,fuel is the incremental thermal efficiency due to the extra fuel contribution, which represents the power rate variation of the reference plant as the fossil fuel consumption increases. An increase in fuel supply conveys either higher power due to a corresponding higher air mass flow rate (a scale effect, maintaining the turbine inlet temperature) or higher power due to a higher turbine inlet temperature (maintaining the air mass flow). In the first case, the incremental efficiency of the reference configuration (ηinc,fuel) is exactly its thermal efficiency, as the contribution of the extra fuel supply is the same as the main fuel supply. In the second case, the incremental efficiency must be higher than the thermal efficiency because ηinc,fuel contributes to the increase of the thermal efficiency. Therefore, equation (8) becomes:
Thus, the minimum solar-to-electricity efficiency may be defined using equations (7) and (9):
The equation above is suitable for both the incremental production scenario and the fuel saving one, and agrees to the incremental solar efficiency when there is not variation of fossil fuel consumption.
4. Results and Discussion
Figure 9 shows the yearly production of the six configurations analysed and the reference CCGT. As it observed, configurations that introduce solar energy to the steam cycle through DSG increase the yearly production, since the solar energy is added to the fossil fuel resource. Comparing solar technologies, PTC is the best one while LFR presents the worst results. Regarding the location, the reference CCGT presents lower production in Las Vegas but, due to the hard climatology, ISCC configurations improve the results and become better than in Almeria.
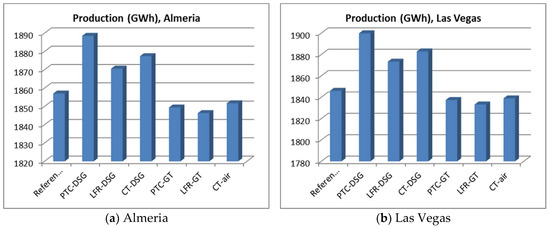
Figure 9.
Yearly production.
On the contrary, when the solar contribution is integrated into the gas turbine, the yearly production is very similar to the reference one because solar energy replaces the saved fossil fuel, although it slightly decreases due to the additional pressure drop introduced by the solar field. All solar technologies behave similarly although, in this case, the best one is CT. The behaviour is similar in both locations and the production is reduced roughly a 0.5% at both sites.
Figure 10 shows the gross solar energy contribution and the saved fuel in terms of energy. In the case of DSG technologies, solar contribution is higher using PTC than using other technologies, and it is also higher in Las Vegas than in Almeria. In the case of solar integration into the gas turbine, gross solar contribution is higher as consequence of the larger solar field. Finally, fuel consumption is not modified in configurations that integrate the solar energy to the steam cycle, and it decreases when solar energy is integrated into the gas turbine.
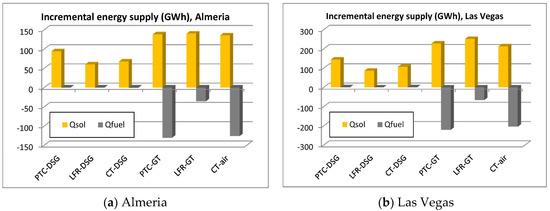
Figure 10.
Solar contribution and fuel saved.
Regarding the efficiencies, Figure 11 shows that DSG configurations lead to lower global efficiencies because the supplementary heat is integrated into the bottoming cycle, with lower efficiency than the combined cycle. Despite that fact, the global efficiency is high and the solar-to-electricity efficiency is higher than the thermal efficiency reached by conventional solar thermal power plants. Besides, Figure 11 also shows that PTC is the most suitable technology for DSG. Finally, due to the hard climatology of Las Vegas, that location presents better efficiency than Almeria.
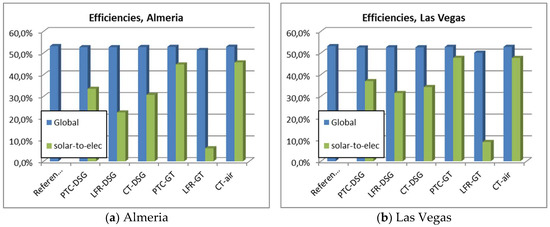
Figure 11.
Global and solar-to-electricity efficiencies.
In configurations with solar integration into the gas turbine, both the global efficiency and the solar-to-electricity efficiencies are higher than those obtained with DSG. The global efficiency is quite similar to that of the reference CCGT, although it is slightly lower due to the higher pressure drops. The solar-to-electricity efficiencies are significantly higher than that obtained by DSG configurations, except for LFR. Finally, efficiencies are higher in Las Vegas than in Almeria.
Besides, Figure 12 shows the heat rates reached by the different configurations. All configurations improve the performance over the reference CCGT, decreasing the heat rates. In the case of DSG, the best performance is reached by PTC and the best location is Las Vegas, accordingly to the previous results. In the case of air preheating of the gas turbine, heat rate decreases significantly except for LFR. Again, results in Las Vegas are better than in Almeria.
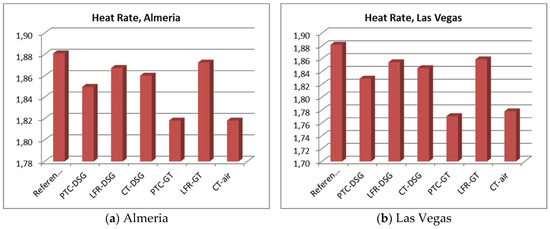
Figure 12.
Heat rates.
Although the economic assessment is compulsory for promoters and decision makers, an in-depth economic analysis is out of the scope of the paper. The main reason is that thermal behaviour and performance can advance moderately during the years but, nowadays, economic frame in CSP is rather variable (I.e. two years ago, generating cost of solar thermal power plant was above 15 c$/kWh while last year this value decreased to 6 c$/kWh.). In such circumstances, the use of costing models for all the technologies analysed in the paper should introduce high uncertainties that are avoided if the scope is limited to the thermal behaviour.
Nevertheless, in order to provide some information at this regard, Table 4 gives some economic results using a fixed economic scenario typical of several years ago. Taking into account that the generating cost of the reference CCGT results 8.82 c€/kWh in Almeria and 8.84 c€/kWh in Las Vegas (due to the lower annual yield), it is observed that PTC-DSG can be competitive in both sites, while LFR-DSG and CT-DSG improve the economic results in Las Vegas but not in Almeria. Given the proposed frame, economic results are better for solar integration into the gas turbine than for DSG configurations. PTC-GT and CT-GT show interesting results and feasibility of LFR-GT is questionable in Las Vegas not advisable in Almeria.
Table 4.
Economic results.
5. Conclusions
In this work six hybrid fuel-solar combined cycles have been analysed. Three concentrating solar technologies have been considered: namely parabolic trough collectors, linear Fresnel reflectors and central tower receiver. Each technology was analysed considering two ways of solar integration: direct steam generation in parallel with the high pressure evaporator of the heat recovery steam generator and air preheating at the exit of the compressor of the gas turbine.
The configurations were simulated in two different locations, Almeria and Las Vegas, obtaining as results the yearly production, the heat rate and the global and solar-to-electricity efficiencies. Regarding this last one, a new equation has been proposed.
It is important to point out that the analyses are focussed on the thermal behaviour of the plant without considering transient effects due to the climatology variation (for example, intermittent clouds). However, there should be some improvement potential in central tower configurations, since their designs have not been optimised for the selected locations, and substantial improvement potential in Fresnel ones, as they are the cheapest technology and the solar fields have not been optimised. Regarding the results, the following conclusions are obtained:
- Integrated solar combined cycles using direct steam generation improve the yearly production because solar contribution increases the steam generation. Conversely, solar air preheating allows saving fuel instead of increasing production and they reduce slightly the yearly production due to the incremental pressure drop.
- The solar-to-electricity efficiency is high in all configurations, particularly using air preheating.
- Performance is better in Las Vegas than in Almeria for all configurations, due to the desertic climatology.
- In terms of energy performance, parabolic trough is the best technology for direct steam generation. For air preheating, parabolic trough and central towers behave similarly, and linear Fresnel reflector is the worst.
Author Contributions
Antonio Rovira is the responsible of the design and preparation of the investigation. Consuelo Sánchez has contributed strongly to the definition of the solar-to-electricity parameter. Manuel Valdés has contributed to results interpretation and to the article writing. All other co-authors have contributed to the different numerical models of the sub-systems and, without their contribution, research would have not been possible.
Acknowledgments
Authors acknowledge the financial support of the Spanish Ministry of Economy and Competitiveness to ENE2015-70515-C2-1-R and ENE2015-70515-C2-2-R projects.
Conflicts of Interest
The authors declare no conflict of interest.
Nomenclature
| Abbreviations and Symbols | |
| C | Generating cost (€·kWh−1) |
| CCGT | Combined cycle gas turbine |
| CF | Concentration factor (-) |
| CSP | Concentrating solar power |
| CT | Central tower |
| D | Tube diameter (m) |
| DNI | Direct normal irradiation (W·m−2) |
| DSG | Direct steam generation |
| HC | Lower heating value of fuel (J·kg−1) |
| HR | Heat rate (-) |
| HRSG | Heat recovery steam generator |
| HTF | Heat transfer fluid |
| I | Investment (€) |
| ISCC | Integrated solar combined cycle |
| L | Tube length (m) |
| LFR | Linear Fresnel reflector |
| ṁ | Mass flow rate (kg·s−1) |
| n | Yearly frequency (-) |
| Thermal power from the fuel (W) | |
| Net solar thermal power (W) | |
| P | Power (W) |
| PTC | Parabolic trough collector |
| t | Time interval (s) |
| T | Temperature (K) |
| U | Overall heat transfer coefficient (W·m−2·K−1) |
| UA | Product of overall heat transfer coefficient and heat exchange surface (W·K−1) |
| Subscripts | |
| amb | Ambient |
| f | Fuel |
| GT | Gas turbine |
| inc | Incremental |
| opt | Optical |
| SC | Steam cycle |
| Sat | Saturation |
| sol | Solar |
| Greek Letters | |
| α | Absorptivity (-) |
| Δ | Increment |
| η | Efficiency (-) |
| τ | Transmissivity (-) |
References
- Johansson, T.B.; Reddy, A.K.N.; Kelly, H.; Williams, R.H.; Burnham, L. Renewable Energy, Sources for Fuels and Electricity; Island Press: Washington, DC, USA, 1993; ISBN 978-1559631389. [Google Scholar]
- Allani, Y.; Favrat, D.; von Spakovsky, M.R. CO2 mitigation through the use of hybrid solar-combined cycles. Energy Convers. Manag. 1997, 38, s661–s667. [Google Scholar] [CrossRef]
- Kane, M.; Favrat, D. Synthesis and optimization approach for integrated solar combined cycle systems based on pinch technology. Part I. Heat recovery pressure levels. Int. J. Therm. Sci. 1999, 38, 501–511. [Google Scholar] [CrossRef]
- Kane, M.; Favrat, D.; Ziegler, K.; Allani, Y. Thermoeconomic Analysis of Advanced Solar-Fossil Combined Power Plants. Int. J. Thermodyn. 2000, 3, 191–198. [Google Scholar]
- Behar, O.; Kellaf, A.; Mohamedi, K.; Belhamelet, M. Instantaneous performance of the first Integrated Solar Combined Cycle System in Algeria. Energy Procedia 2011, 6, 185–193. [Google Scholar] [CrossRef]
- Baghernejad, A.; Yaghoubi, M. Multi-objective exergoeconomic optimization of an Integrated Solar Combined Cycle System using evolutionary algorithms. Int. J. Energy Res. 2011, 35, 601–615. [Google Scholar] [CrossRef]
- Baghernejad, A.; Yaghoubi, M. Exergy analysis of an integrated solar combined cycle system. Renew Energy 2010, 35, 2157–2164. [Google Scholar] [CrossRef]
- Falchetta, M.; Mazzei, D.; Crescenzi, T.; Merlo, L. Design of the Archimede 5MW Molten Salt Parabolic Trough Solar Plant. In Proceedings of the SolarPACES 2009, Berlin, Germany, 15–18 September 2009. [Google Scholar]
- Behar, O.; Khellaf, A.; Mohammedi, K.; Ait-Kaci, S. A review of integrated solar combined cycle system (ISCCS) with a parabolic trough technology. Renew. Sustain. Energy Rev. 2014, 39, 223–250. [Google Scholar] [CrossRef]
- Alqahtani, B.J.; Patiño-Echeverri, D. Integrated Solar Combined Cycle Power Plants: Paving the way for thermal solar. Appl. Energy 2016, 169, 927–936. [Google Scholar] [CrossRef]
- Duan, L.; Qu, W.; Jia, S.; Feng, T. Study on the integration characteristics of a novel integrated solar combined cycle system. Energy 2017, 130, 351–364. [Google Scholar] [CrossRef]
- Li, Y.; Yang, Y. Impacts of solar multiples on the performance of integrated solar combined cycle systems with two direct steam generation fields. Appl. Energy 2015, 160, 673–680. [Google Scholar] [CrossRef]
- Mabrouk, M.T.; Kheiri, A.; Feidt, M. A Systematic procedure to optimize Integrated Solar Combined Cycle power plants (ISCCs). Appl. Therm. Eng. 2018, 136, 97–107. [Google Scholar] [CrossRef]
- Rodriıguez, J.; Bernardos, E.; Lopez, I.; Gonzalez, C. Thermoeconomic Evaluation of Integrated Solar Combined Cycle Systems (ISCCS). Entropy 2014, 16, 4246–4259. [Google Scholar] [CrossRef]
- Pramanik, S.; Ravikrishna, R.V. A review of concentrated solar power hybrid technologies. Appl. Therm. Eng. 2017, 127, 602–637. [Google Scholar] [CrossRef]
- El Jai, M.C.; Chalqui, F.Z. A modified model for parabolic trough solar receiver. Am. J. Eng. Res. 2013, 2, 200–211. [Google Scholar]
- Abdel Dayem, A.M.; Nabil Metwally, M.; Alghamdi, A.S.; Marzouk, E.M. Numerical Simulation and Experimental Validation of Integrated Solar Combined Power Plant. Energy Procedia 2014, 50, 290–305. [Google Scholar] [CrossRef]
- Griffin, P.; Huschka, K.; Morin, G. Software for design, simulation, and cost estimation of solar thermal power and heat cycles. In Proceedings of the SolarPACES 2009, Berlin, Germany, 15–18 September 2009. [Google Scholar]
- Montes, M.J.; Rovira, A.; Muñoz, M.; Martínez-Val, J.M. Performance analysis of an integrated solar combined cycle using direct steam generation in parabolic trough collectors. Appl. Energy 2011, 88, 3228–3238. [Google Scholar] [CrossRef]
- Antoñanzas, J.; Jimenez, E.; Blanco, J.; Antoñanzas-Torres, F. Potential solar thermal integration in Spanish combined cycle gas turbines. Renew. Sustain. Energy Rev. 2014, 37, 36–46. [Google Scholar] [CrossRef]
- Zhu, G.; Neises, T.; Turchi, C.; Bedilion, R. Thermodynamic evaluation of solar integration into a natural gas combined cycle power plant. Renew. Energy 2015, 74, 815–824. [Google Scholar] [CrossRef]
- Nezammahalleh, H.; Farhadi, F.; Tanhaemami, M. Conceptual design and techno-economic assessment of integrated solar combined cycle system with DSG technology. Sol. Energy 2010, 84, 1696–1705. [Google Scholar] [CrossRef]
- Li, Y.; Yang, Y. Thermodynamic analysis of a novel integrated solar combined cycle. Appl. Energy 2014, 122, 133–142. [Google Scholar] [CrossRef]
- Cau, G.; Cocco, D.; Tola, V. Performance and cost assessment of Integrated Solar Combined Cycle Systems (ISCCSs) using CO2 as heat transfer fluid. Sol. Energy 2012, 86, 2975–2985. [Google Scholar] [CrossRef]
- Dersch, J.; Geyer, M.; Herrmann, U.; Jones, S.A.; Kelly, B.; Kistner, R.; Ortmanns, W.; Pitz-Paal, R.; Price, H. Trough integration into power plants—a study on the performance and economy of integrated solar combined cycle systems. Energy 2004, 29, 947–959. [Google Scholar] [CrossRef]
- Franchini, G.; Perdichizzi, A.; Ravelli, S.; Barigozzi, G. A comparative study between parabolic trough and solar tower technologies in Solar Rankine Cycle and Integrated Solar Combined Cycle plants. Sol. Energy 2013, 98, 302–314. [Google Scholar] [CrossRef]
- Siva Reddy, V.; Kaushik, S.C.; Tyagi, S.K. Exergetic analysis of solar concentrator aided natural gas fired combined cycle power plant. Renew. Energy 2012, 39, 114–125. [Google Scholar] [CrossRef]
- Amelio, M.; Ferraro, V.; Marinelli, V.; Summaria, A. An evaluation of the performance of an integrated solar combined cycle plant provided with air-linear parabolic collectors. Energy 2014, 69, 742–748. [Google Scholar] [CrossRef]
- Jamel, M.S.; Abd Rahman, A.; Shamsuddin, A.H. Advances in the integration of solar thermal energy with conventional and non-conventional power plants. Renew. Sustain. Energy Rev. 2013, 20, 71–81. [Google Scholar] [CrossRef]
- Okoroigwe, E.; Madhlopa, A. An integrated combined cycle system driven by a solar tower: A review. Renew. Sustain. Energy Rev. 2016, 57, 337–350. [Google Scholar] [CrossRef]
- Rovira, A.; Montes, M.J.; Varela, F.; Gil, M. Comparison of Heat Transfer Fluid and Direct Steam Generation technologies for Integrated Solar Combined Cycles. Appl. Therm. Eng. 2013, 52, 264–274. [Google Scholar] [CrossRef]
- Manente, G.; Rech, S.; Lazzaretto, A. Optimum choice and placement of concentrating solar power technologies in integrated solar combined cycle systems. Renew. Energy 2016, 96, 172–189. [Google Scholar] [CrossRef]
- Rovira, A.; Barbero, R.; Montes, M.J.; Abbas, R.; Varela, F. Analysis and comparison of Integrated Solar Combined Cycles using parabolic troughs and linear Fresnel reflectors as concentrating systems. Appl. Energy 2016, 162, 990–1000. [Google Scholar] [CrossRef]
- El-Gammal, A.M. An algorithm and criteria for compressor characteristics real time modelling and approximation. J. Eng. Gas Turbines Power 1991, 113, 112–118. [Google Scholar] [CrossRef]
- Stamatis, A.; Mathioudakis, K.; Papailiou, K.D. Adaptative simulation of gas turbine performance. J. Eng. Gas Turbines Power 1990, 112, 168–175. [Google Scholar] [CrossRef]
- Valdés, M.; Rapún, J.L. Optimization of heat recovery steam generator for combined cycle gas turbine power plants. Appl. Therm. Eng. 2000, 21, 1149–1159. [Google Scholar] [CrossRef]
- Cotton, K.C. Evaluating and Improving Steam Turbine Performance, 2nd ed; Cotton Fact Inc.: Cary, NC, USA, 1998; ISBN 13:978-0963995513. [Google Scholar]
- Montes, M.J.; Abánades, A.; Martínez-Val, J.M. Thermofluidynamic model and comparative analysis of parabolic trough collectors using oil, water/steam, or molten salt as heat transfer fluids. J. Solar Energy Eng. 2010, 132. [Google Scholar] [CrossRef]
- Bernhard, R.; LaLaing, J.; Kistner, R.; Eck, M.; Eickhoff, M.; Feldhoff, J.F.; Heimsath, A.; Hülsey, H.; Morin, G. Linear Fresnel collector demonstration at the PSA—operation and investigation. In Proceedings of the SolarPACES—Electricity, fuels and clean water powered by the sun, Berlin, Germany, 15–18 September 2009. [Google Scholar]
- Buie, D.; Monger, A.; Dey, C. Sunshape distributions for terrestrial solar simulations. Sol. Energy 2003, 74, 113–122. [Google Scholar] [CrossRef]
- Ortega, G.; Rovira, A. Proposal and analysis of different methodologies for the shading and blocking efficiency in central receivers systems. Sol. Energy 2017, 144, 475–488. [Google Scholar] [CrossRef]
- Ortega, G. Transformaciones homográficas aplicadas a la simulación y optimización del subsistema óptico en centrales termosolares de torre. Ph.D. Thesis, Universidad Nacional de Educación a Distancia, Madrid, Spain, June 2017. (In Spanish). [Google Scholar]
- Spelling, J.; Laumert, B.; Fransson, T. Optimal Gas-Turbine Design for Hybrid Solar Power Plant Operation. J. Eng. Gas Turbines Power 2012, 134. [Google Scholar] [CrossRef]
- Montes, M.J.; Rovira, A.; Martínez-Val, J.M.; Ramos, A. Proposal of a fluid flow layout to improve the heat transfer in the active absorber surface of solar central cavity receivers. Appl. Therm. Eng. 2012, 35, 220–232. [Google Scholar] [CrossRef]
© 2018 by the authors. Licensee MDPI, Basel, Switzerland. This article is an open access article distributed under the terms and conditions of the Creative Commons Attribution (CC BY) license (http://creativecommons.org/licenses/by/4.0/).