1. Introduction
During the last decades, a shift towards natural gas consumption has been observed in the geopolitical areas of Europe and so-called Eurasia [
1]. Natural gas, as a cleaner burning source of fossil fuel compared to oil or coal, seems to be part of the solution to climate change. For an equivalent amount of heat, burning natural gas produces about 30% less CO
2 than burning petroleum and about 45% less than burning coal [
2]. Natural gas is, usually, been imported using pipelines between limited supply countries and their neighbors. In some cases, there is small-scale gas demand, where the pipelines might be technologically impossible or economically infeasible. Therefore, it is preferred to be transferred in liquid form, called liquified natural gas (LNG) by using dedicated vessels [
3,
4]. LNG trade is growing seven times faster than the pipeline gas trade, so by 2035 it is expected to account for around half of globally traded gas and will become the sustainable alternative to oil in the future [
5].
LNG-powered land based (islanded) electricity generation plants are expected to dominate in medium to long-term due to the expecting increase of fuel prices, the tightening of legislation requirements, concerning the efficiency and emissions of land (power plant) applications, and the discovery and extraction of new gas fields worldwide. In addition, natural gas power plants are more flexible in their operational profile than existing conventional plants and are able to allow higher penetration of renewable energy technologies into the electricity system, which is characterized by volatility influencing system stability.
So far, the majority of the LNG projects have concerned large size and capacity receiving terminals unsuitable for a “single gas consumer” applications. Recently, some small and medium scale LNG projects have been appeared, with regional storage hubs and direct gas supply, using highway LNG trucks or small LNG carriers. Such terminals can be used for receiving and storing LNG for a certain period. Their capacity ranges from a couple of hundred of m
3 to around 20,000 m
3. The LNG supply chain is a complicated and investment intensive business. There are several things to be considered in order to bring LNG to the final destination: loading the LNG carrier from an export terminal, the sea transport, unloading the LNG carrier to the receiving terminal and regasification or re-distribution of LNG. A small-scale LNG supply chain refers to the distribution of LNG to local users. The sea distribution tends to become more popular, especially for insular electricity systems. The question that arises, and this study attempts to answer, is whether a dedicated “Single Purpose Terminal” (SPT) and its supply chain would be feasible and sustainable for a local energy mix [
6].
The majority of small-scale projects are in China. In European Union there is lack of required infrastructure. The Netherlands has promoted small-scale LNG from 2007 with the realization of the first terminal in Rotterdam and implementing, in 2011, an optimal small-scale supply chain for the Rotterdam area. The promotion of small scale LNG for Spain started in 1970, using trucks. The country is now an international leader in this field with around 40,000 LNG trucks reloaded per year, supplying, also, France, Italy, Switzerland and Portugal. Norway is the larger LNG exporter in Europe. The country has developed a lot of satellite LNG import and regasification terminals, suppling local networks, as there are many regions in the country that are not connected to the pipelines [
7].
In Greece, the majority of islands is not connected to the mainland electricity grid and their basic electricity needs are covered almost exclusively by internal combustion engines (consuming heavy fuel oil—HFO). The alternative of converting the existing power engines or installing new power plants that will operate on natural gas instead of HFO, has been proved to be a very advantageous and sustainable option from a previous published research, as it has been evaluated for Lesvos Island in a multidimensional problem [
8]. As the islands, do not have the opportunity to be connected with the mainland (natural gas pipelines), they can, only, be fed with Liquefied Natural Gas (LNG), using LNG carriers.
Greece is dependent on natural gas imports from other countries, as three quarters of gas comes from Russia by pipelines and the remaining portion is imported in the form of LNG. The LNG imports, in 2016, were 1,307,000 m
3 and in 2017 they have increased sharply to 2,342,166 m
3 [
9]. The import LNG terminal in Greece, is in Revithoussa, and the cargoes are usually imported from Algeria. It is equipped with 2 × 65,000 m
3 tanks and a 95,000 m
3 tank is under construction. Greek authorities plan to develop an export bunkering reload facility (for trucks and small LNG carriers) in the near future, as the needs for LNG consumption will increase rapidly [
8]. At present, it is used as a peak shaving and storage facility. The diversification of natural gas supplies in the country will contribute to its energy independence and security. In present analysis, it is assumed that the terminal operates as export terminal, too.
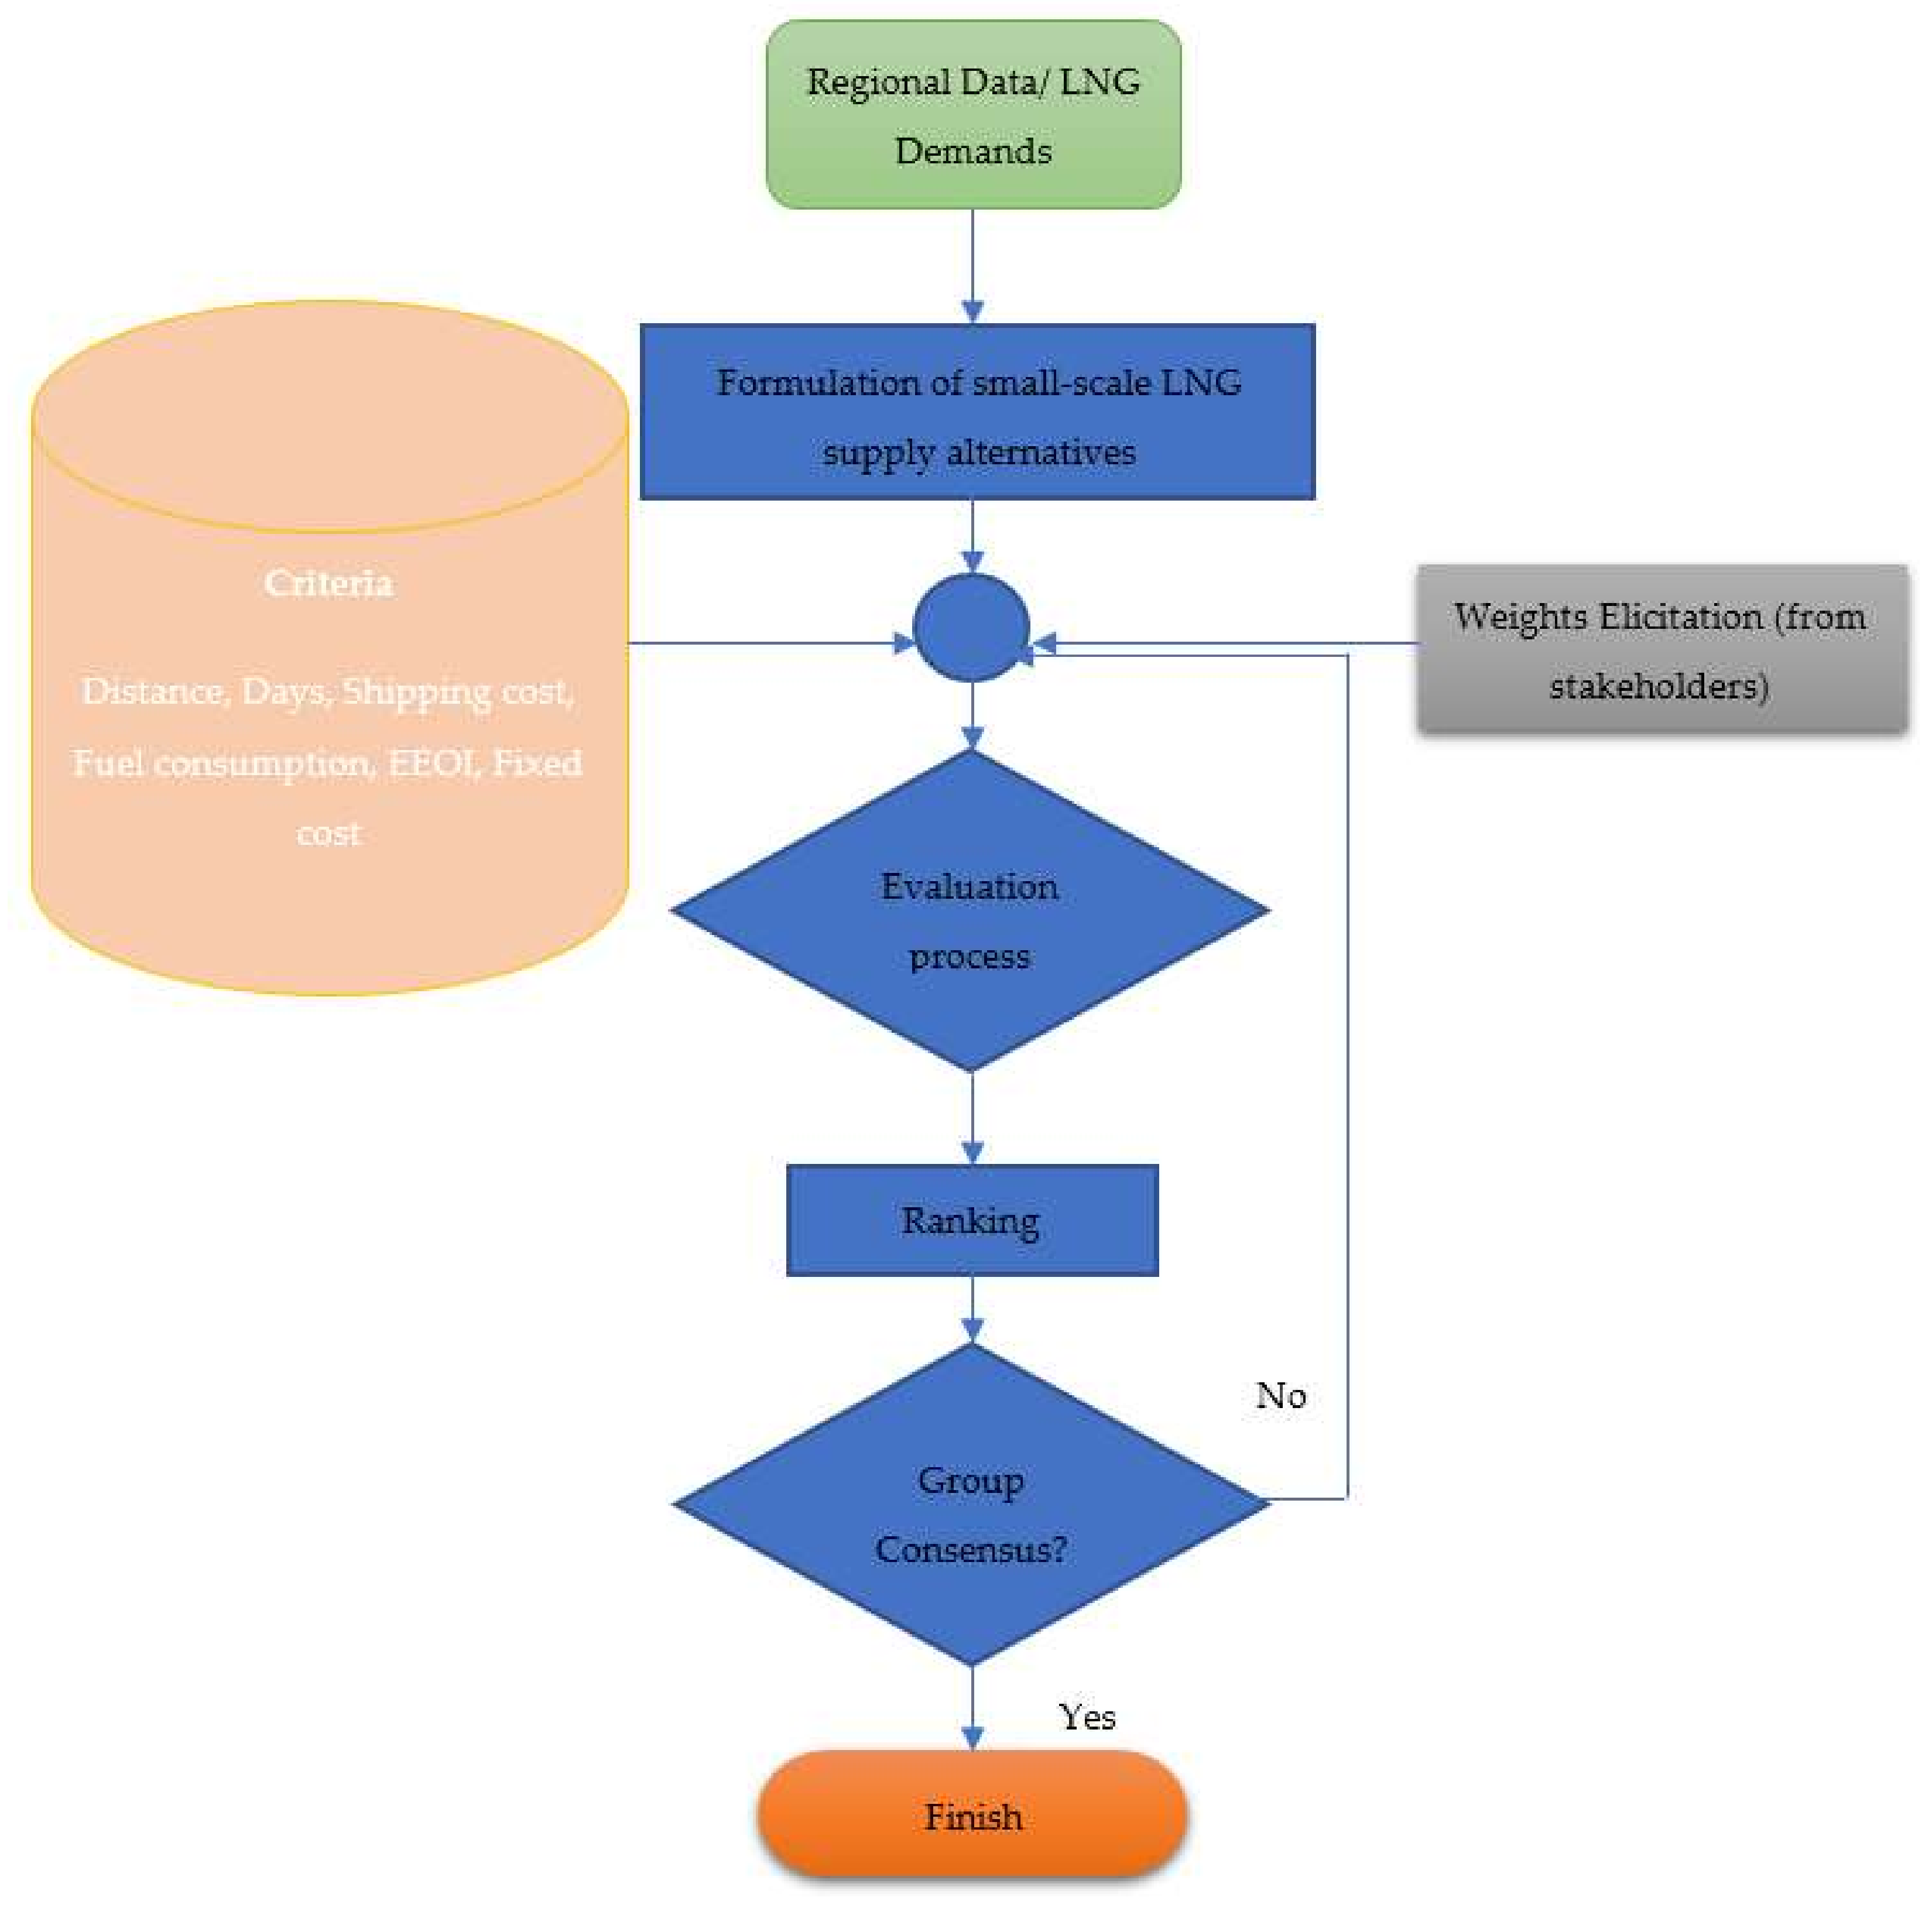
The paper focuses on a critical decision issue, relevant to the natural gas supply of insular electricity systems. The problem has multidimensional nature, as it is based on economics, security of supply, low environmental impact and sustainability. The economics of supply include all the variable and fixed costs. Security of supply is crucial in cases of consumption of the natural gas in isolated power plants so as to ensure the uninterrupted supply. The alternatives should, also, be assessed by environmental aspect, including the emissions produced by the transportation of LNG.
The authors developed a novel tool, in order to evaluate alternative LNG supply corridors, using the Additive Value Model, PROMETHEE and Simos approach to infer the criteria weights. The novelty of the proposed model consists of two parameters: the selected evaluation criteria and the examined case study. The evaluation of LNG supply chain includes features differentiating it from other general-purpose supplier selection models, so the adopted criteria focus on the nature of the problem. Due to the emerging nature of small-scale LNG market, there is no published research assessing alternative small-scale supply corridors. As per the authors’ knowledge, natural gas penetration in insular electricity systems has not been analyzed in literature either. A set of coherent criteria has been selected, that fall within the economic, technical and environmental dimensions. The proposed tool can be used for evaluation of small-scale LNG supply options for autonomous electricity production systems. Four indicative islands (Crete, Rhodes, Lesvos and Samos) and one power plant on the mainland (a combined cycle power plant in Korinthos) have been studied. Four alternative scenarios transferring LNG have been considered in order to be found the most suitable.
The main steps followed to solve the problem are:
- Step 1:
Initial recording of the annual electricity demand in the examined regions
- Step 2:
Specification of possible new power plants or conversions
- Step 3:
Estimation of the annual fuel volume (liquified natural gas) needed
- Step 4:
Determination of a novel set of criteria
- Step 5:
Weight assignment
- Step 6:
Development of a software tool
- Step 7:
Multicriteria assessment of the potential LNG supply chains and results
The rest of the paper is organized as follows:
Section 2 presents the proposed methodology including the multicriteria methods that have been used for the evaluation process, as well as the determination of the weights.
Section 3 describes the current situation in the electricity generation in Greek islands, the predicted annual natural gas demands, the analysis of the selected criteria and the alternatives adopted for the evaluation process.
Section 4, presents the developed decision support tool.
Section 5 analyses the obtained results, followed by
Section 6 that includes the conclusions and the future perspectives of the study.
3. The Case of Greece
3.1. Current Framework
Electricity consumption will continue to increase during the coming decades. At the same time, the share of renewable power production will grow rapidly. Power systems, and especially the isolated electricity system of an island, need to be sustainable, reliable, affordable and be able to respond to load variations resulting from the operation of the renewables, that are abundant on the islands. It is proved from a previous research that the alternative of a power plant with dual fuel combustion engines arises as the right compromise between costs, energy production capability, energy system stability and low environmental impact for the examined island of Lesvos [
8].
The dual fuel engines are able to consume either liquid fuel oils or gaseous fuel. The rating of these engines typically ranges from 1 MW to 23 MW per unit. Medium speed engines run at between 300 rpm to 1000 rpm [
1]. They are characterized by flexibility features such as:
They have good heat rate.
The engines can be brought online in less than a minute and reach full load in less than 5 min.
They have no maintenance impact from starts and stops.
Modularity: one engine is around 20 MW and each engine can be dispatched individually. This modularity gives a lot of flexibility to traders to maximize use of the asset while also providing hedge for the procurement [
17].
Their modularity makes them very compatible with renewables.
Islands, usually, are not connected to the mainland electricity grid and their electricity demand is covered by autonomous power stations that consume diesel. The stability of their electrical system is sensitive to rapid variations of the peak loads. Although they often have high RES potential, their sudden variations may lead to a break-down of local distribution grid. It has, already, been studied by the authors the alternative of consuming natural gas in combustion engines for electricity production in an insular system (the case study implemented in Lesvos Island) and it has been proved to be the most suitable sustainable alternative [
8]. However, it is also crucial to be investigated the natural gas supply options for the decentralized systems, and Greek islands are representative examples.
In the near future, the Public Power Corporation (PPC) and Public Gas Corporation (PGC) plan to convert the existing power engines or install new power plants that will operate on natural gas instead of HFO, that will be transferred there by LNG carriers. Four islands, those with the higher annual electricity demand, are the first goal: Crete, Rhodes (a new power plant with dual fuel engines has, already, been installed), Lesvos (procedures for the installation of two new dual fuel combustion engines are on the way) and Samos (the proposed MW come from the study of PPC plans). The total electricity demand, produced by conventional power plants, has been recorded for 2016, and it is shown in
Table 3.
Table 4 shows, in the first column the existing conventional power plants and in the second column the proposed new power plants or the conversion part of the existing power plants.
In addition to the four islands, a combined cycle power plant will also be included in the analysis. The examined power plant is located near Revithoussa, the Greek LNG importation terminal, and the potential ways of supplying it are studied. Korinthos Power is a combined cycle power plant of 437 MW, located in Agioi Theodoroi in Korinthos. Its distance from Revithoussa is 17 nm.
3.2. Annual Demand
As the annual electricity production from the existing conventional power plants has been recorded, the fuel needed for the new proposed power plants (natural gas consumption) should be calculated, in order to calculate the required annual fuel quantity, and the optimal time needed for refueling. It was assumed that the power plants run for 8000 h annually, at an average load 90% (except the case of Rhodes Island where 75% load of the new power plant covers the annual demand, and the case of Samos Island where with 57% load, the new engines cover the annual demand). In Lesvos Island, the electricity production of the new dual fuel engines covers 69% of the annual electricity demand, and in Crete the proposed power plant covers 33% of the annual demand. For the calculation of fuel consumption, it has been used the heat rate of an indicative commercial combustion engine:
Assumed Engine: Wartsila 12V50 DF [
20]
Fuel gas Consumption at 100% Load: 7258 kJ/kWh
Fuel gas Consumption at 75% Load: 7562 kJ/kWh
Fuel gas Consumption at 50% Load: 8153 kJ/kWh
For the case of “Korinthos Power”, the calculation of the heat rate has been based on electricity production during 2016 and the annual profile of natural gas delivery (8848.570 MWh/day) at the delivery points, published by DESFA for 2016 [
21]. Its fuel gas consumption has been calculated and it is 7438 kJ/kWh.
Table 5 shows the annual fuel (LNG) consumption in MJ, tn and m
3, per day and per 20 days. A plus heel requirement of 10% volume has been assumed, as a measure to keep cryo-temperature (−160 °C) low in the tank at all times avoiding in that way boil off gas creation on every refueling [
22]. It has, also, been assumed that in all islands exist a fill-up interval of 10 days with a safety inventory of 5 days.
The main assumptions considered for the calculation of LNG consumption are the following:
The minimum tank size for each power plant is determined by the gas consumption, the shipping information, the minimum safety inventory during transportation and the minimum tank reserves [
6]. Typically, the range of storage capacity for small-scale LNG storage tanks varies from 500 m
3 to 5000 m
3. The coverage of the electricity needs of Lesvos Island has been examined in previously published research [
8], with alternatives including combinations, like the use of wind energy, conventional power plants, conversion of a part of the existing to dual fuel combustion engines and a new power plant with dual fuel engines consuming natural gas. The results obtained by the evaluation process showed that the alternative of natural gas is the most sustainable, economic and environmental efficient solution for the insular electricity system of an island.
A problem that it has not been examined yet, is the refueling of the island with natural gas, as all the islands do not have access to the mainland pipelines. A small-scale LNG terminal could be built on the island and LNG carriers should feed the system periodically with the required amount of LNG. The evaluation process has been divided in two parts. The first part has been published on another previous research [
3], where the potential LNG export terminals for the supply of Revithoussa, have been evaluated and classified. Ten export countries, Algeria, Egypt, Norway, Qatar, Oman, Trinidad, Libya, Nigeria, Yemen and USA have been assessed, using a novel set of criteria: Methane Number (MN), Spot rate, Distance, Shipping cost, Fuel consumption, Energy Efficiency Operational Indicator (EEOI), Availability and Reserves to Production ratio (R/P ratio). Four different weighting scenarios have been assumed and the results obtained were similar. Algeria, Norway, Egypt, Libya and Qatar are the preferred supply alternatives for Greece.
In the second part (this study), different combinations of refueling time and transportation routes from Revithoussa to the islands and Korinthos are evaluated. Four different combinations of refueling time and transportation routes are evaluated, taking into consideration the obtained results from the previous part of analysis for the best LNG port.
3.3. Alternatives Modelling
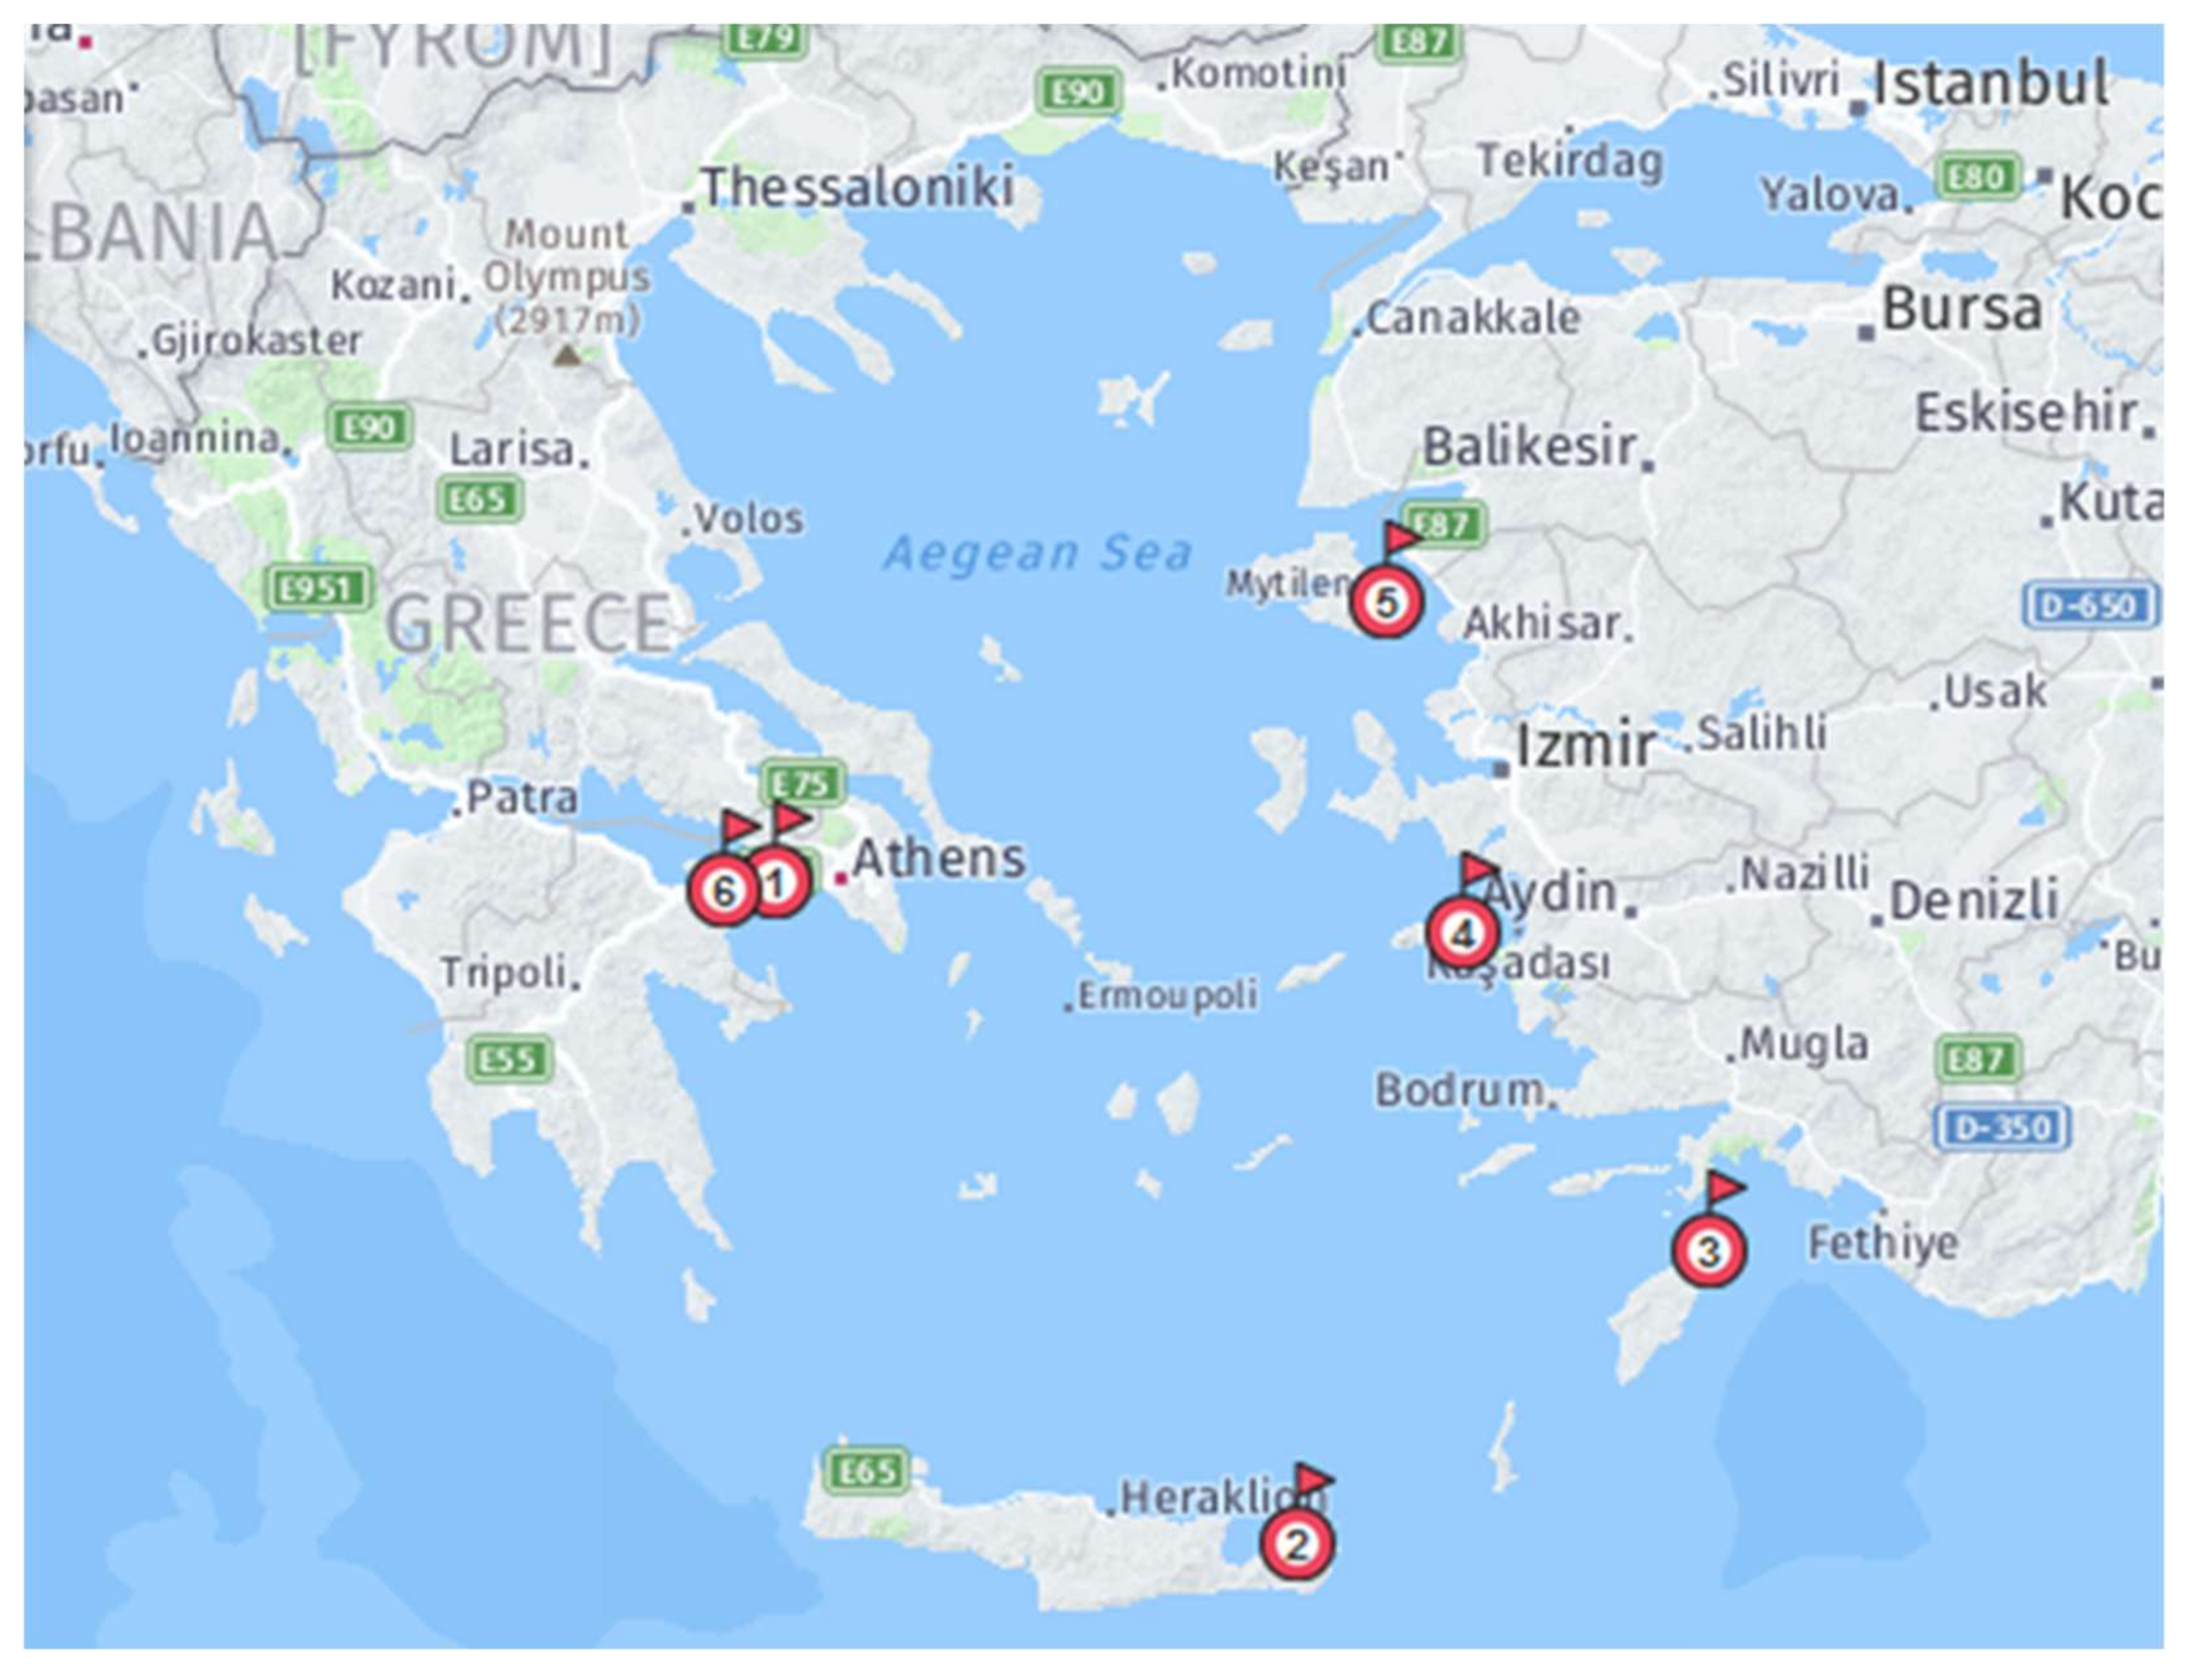
Figure 2 shows a map of Greece with the examined points of interest: (1) is Revithoussa, (2) is Crete, (3) is Rhodes, (4) is Samos, (5) is Lesvos and (6) is Korinthos. The alternative supply options are described analytically below. The refueling time presented in the selected alternatives, is relatively short, as the LNG fuel “ages” as it remains in a tank without being consumed and this is undesirable. It is difficult to store LNG longer than several weeks without liquefying it. As it warms, the lighter more volatile components will vaporize first, leaving behind the heavier components which remain in liquid form. This phenomenon increases the density of LNG and, also, changes the calorific value and quality. It is crucial to take into consideration these changes and propose refueling times in order to keep the stored LNG suitable for consumption [
23].
● 1st Alternative:
Transfer to Revithoussa (using a LNG carrier of 75,000 m3) per 20 days (unload). Islands and Korinthos Power will be fed by another or the same LNG carrier (75,000 m3) every 20 days. A “milk-run” around the islands is considered, starting from Crete-Rhodes-Samos-Lesvos and Korinthos, and concluding at Revithoussa.
● 2nd Alternative
Transfer from the export LNG terminal and go directly (without unloading at Revithoussa) to the roundtrip of the islands and Korinthos, and then, back to the export LNG terminal. A LNG carrier of 75,000 m3 per 20 days will be used (roundtrip: export terminal-Crete-Rhodes-Samos-Lesvos-Korinthos-export terminal).
● 3rd Alternative
Transfer to Revithoussa (with a LNG carrier of 75,000 m
3) per 20 days and unload. Each island and Korinthos Power will be fed separately by a LNG carrier of 20,000 m
3, according to the following timetable (
Table 6).
Only Lesvos and Samos will be fed together, due to their low needs. In that case, the transferred cargo is, approximately, 45% of the maximum transferred cargo of the carrier. The two islands should be refueled at short intervals, otherwise the storage turns to be technically and economically infeasible.
● 4th Alternative
Transfer to Revithoussa (LNG carrier 75,000 m3) per 20 days and unload. Islands will be fed per 10 days by a LNG carrier of 20,000 m3. Korinthos Power will be, also, bunkered every 10 days by the same LNG carrier (the transferred LNG cargo for 10 days is less than 20,000 m3, but it does not coincide with the supply of the islands).
For the export terminal-Revithoussa trip, one-day tolerance is assumed, due to possible unexpected delays or bad weather conditions, and a half day tolerance for the “milk-run” in islands.
The transferred cargos to Revithoussa and their unloading time has been recorded by the authors for a year, in order to be able to calculate the average unloading rate. It was found that the unloading time is 12 h and the unloading rate ranges between 5779 and 6111 m
3/h with maximum rate 7250 m
3/h, for a 75,000 m
3 carrier [
9]. For the examined 20,000 m
3 carrier, the unloading rate has been assumed 3000 m
3/h.
The alternative voyage plans, that have been described, are then evaluated in terms of the selected criteria. The basic assumption for all the alternatives is that the jetty, terminal facilities and the power plant infrastructure are located in the same area, in order to be excluded additional costs from the connection with pipelines of the power plant to the terminal [
6].
3.4. Criteria Analysis
This section presents the six selected criteria, together with their data sources or their calculation process. The criteria descriptions are given hereafter and the resulting evaluation values are summarized in Table 11.
3.4.1. Distance
The criterion of “Distance” includes the distance of the selected export terminal to Revithoussa and the distances from Revithoussa to the islands and between them. The values are analytically shown in
Table 7.
3.4.2. Time—Days
Based on the criterion of “Distance” and using the distance calculator in maritime [
24], the time needed for each scenario has been calculated. It has been assumed that the speed of the LNG carrier is 15 knots, as a typical speed.
3.4.3. LNG Shipping Cost
LNG shipping rates are usually expressed on a charter-day basis. The charter rate covers operating costs during the voyage, a contribution to the capital costs, and provide a return to the ship owner. Shipping costs are sensitive both to daily charter rates, and to the number of days in transport, the number of nautical miles from point of departure to point of destination [
25]:
Atlantic Day Rate (October 2016): 40,000 $/day = 37,600 €/day (conversion rate: 1 $ = 0.94 €, calculated for 2017).
Typical daily rate costs for small scale LNG carriers are 30.000
$/day (or 28,200 €/day) for a 15.000 m
3 cargo vessel and 35.000
$/day (or 32,900 €/day) for a 20.000 m
3 (excluding fuel cost) [
7].
Except from the time needed for the travel, in the calculation of the shipping cost, has, also, been included two extra days for the loading and unloading time on the ports and a tolerance in case of unexpected delays, so for the roundtrip of the islands, a small-scale LNG carrier of 20,000 m3 has been assumed, with daily rate 32,900 €/day.
Tanker availability has been remained high since 2014, as the build-up in LNG liquefaction capacity lags behind the influx of newbuilds to the market. Charter rates could start to recover, as spot and term fixtures increase, and as new liquefaction capacity is coming online [
26].
3.4.4. Fuel Consumption
According to the list of compatible vessels approved from the LNG terminal of Revithoussa, there are two LNG carriers with capacity 75,000 m
3, and during the last year, these two carriers were the most frequently used (according to the statistics of DESFA).
Table 8 shows their characteristics [
26]:
There are also small scale LNG carriers—3000 m
3, 6500 m
3, 10,000 m
3 and 20,000 m
3—available in the market. A 20,000 m
3 small scale LNG carrier, retrieved by online search [
27], has been assumed in the present analysis and
Table 9 shows its characteristics.
At the end of 2016, 56% of the fleet was under 10 years of age, a reflection of the newbuild order boom that accompanied liquefaction capacity growth in the mid-2000s, and again in the early 2010s. Generally, shipowners primarily consider safety and operating economics when considering whether to retire a vessel after it reaches the age of 35, although some vessels have operated for approximately 40 years. Around 6% of active LNG carriers were over 30 years of age in 2016; these carriers will continue to be pushed out of the market as the younger, larger, and more efficient vessels continue to be added to the existing fleet [
26].
For the 75,000 m
3 LNG carrier according to the IGU report 2017 [
28] the fuel consumption of a LNG carrier, with transferred cargo less than 150,000 m
3, is 175 ton/day. Engblom et al. [
29] presented fuel consumptions of 70 ton/day and 35 ton/day for 90,000 m
3 and 40,000 m
3 respectively. In the present analysis it is calculated (using interpolation and average value) 117 tn/day fuel consumption for a 75,000 m
3 LNG carrier.
3.4.5. ΕΕΟΙ-Energy Efficiency Operational Indicator
The EEOI is a representative value of the energy efficiency of the ship operation over a consistent period which represents the overall trading pattern of the vessel. The basic expression for EEOI for a voyage is defined as [
30]:
where
j is the fuel type;
FCj is the mass of consumed fuel
j;
CFj is a non-dimensional conversion factor between fuel consumption measured in gr and CO
2 emissions also measured in gr based on carbon content. For LNG,
CFj = 2.75 tn-CO
2/tn-fuel.
mcargo is cargo carried (tonnes) or work done (number of TEU or passengers) or gross tonnes for passenger ships and
D is the distance in nautical miles corresponding to the cargo carried or work done.
The unit of EEOI depends on the measurement of cargo carried or work done, e.g., tonnes CO2/(tonnes × nautical miles), tonnes CO2/(TEU × nautical miles), tonnes CO2/(person × nautical miles), etc.
3.4.6. Fixed Costs (Harbor Cost—Staff)
The fixed costs include the harbor cost per visit for the LNG carrier and the staff occupied during the docking of the carrier. These costs differ depending on the LNG carrier size.
Table 10 shows the values for the criterion. The cost of the staff is calculated using the unloading time (in hr) of the LNG carrier. The occupied staff for the unloading process, includes the captain of the ship, the pilot, the jetty manager, the unloading manager and the head of shift. The unloading process needs an extra time of 4 hours, at least, before the beginning of the unloading process [
21].
4. Software Implementation
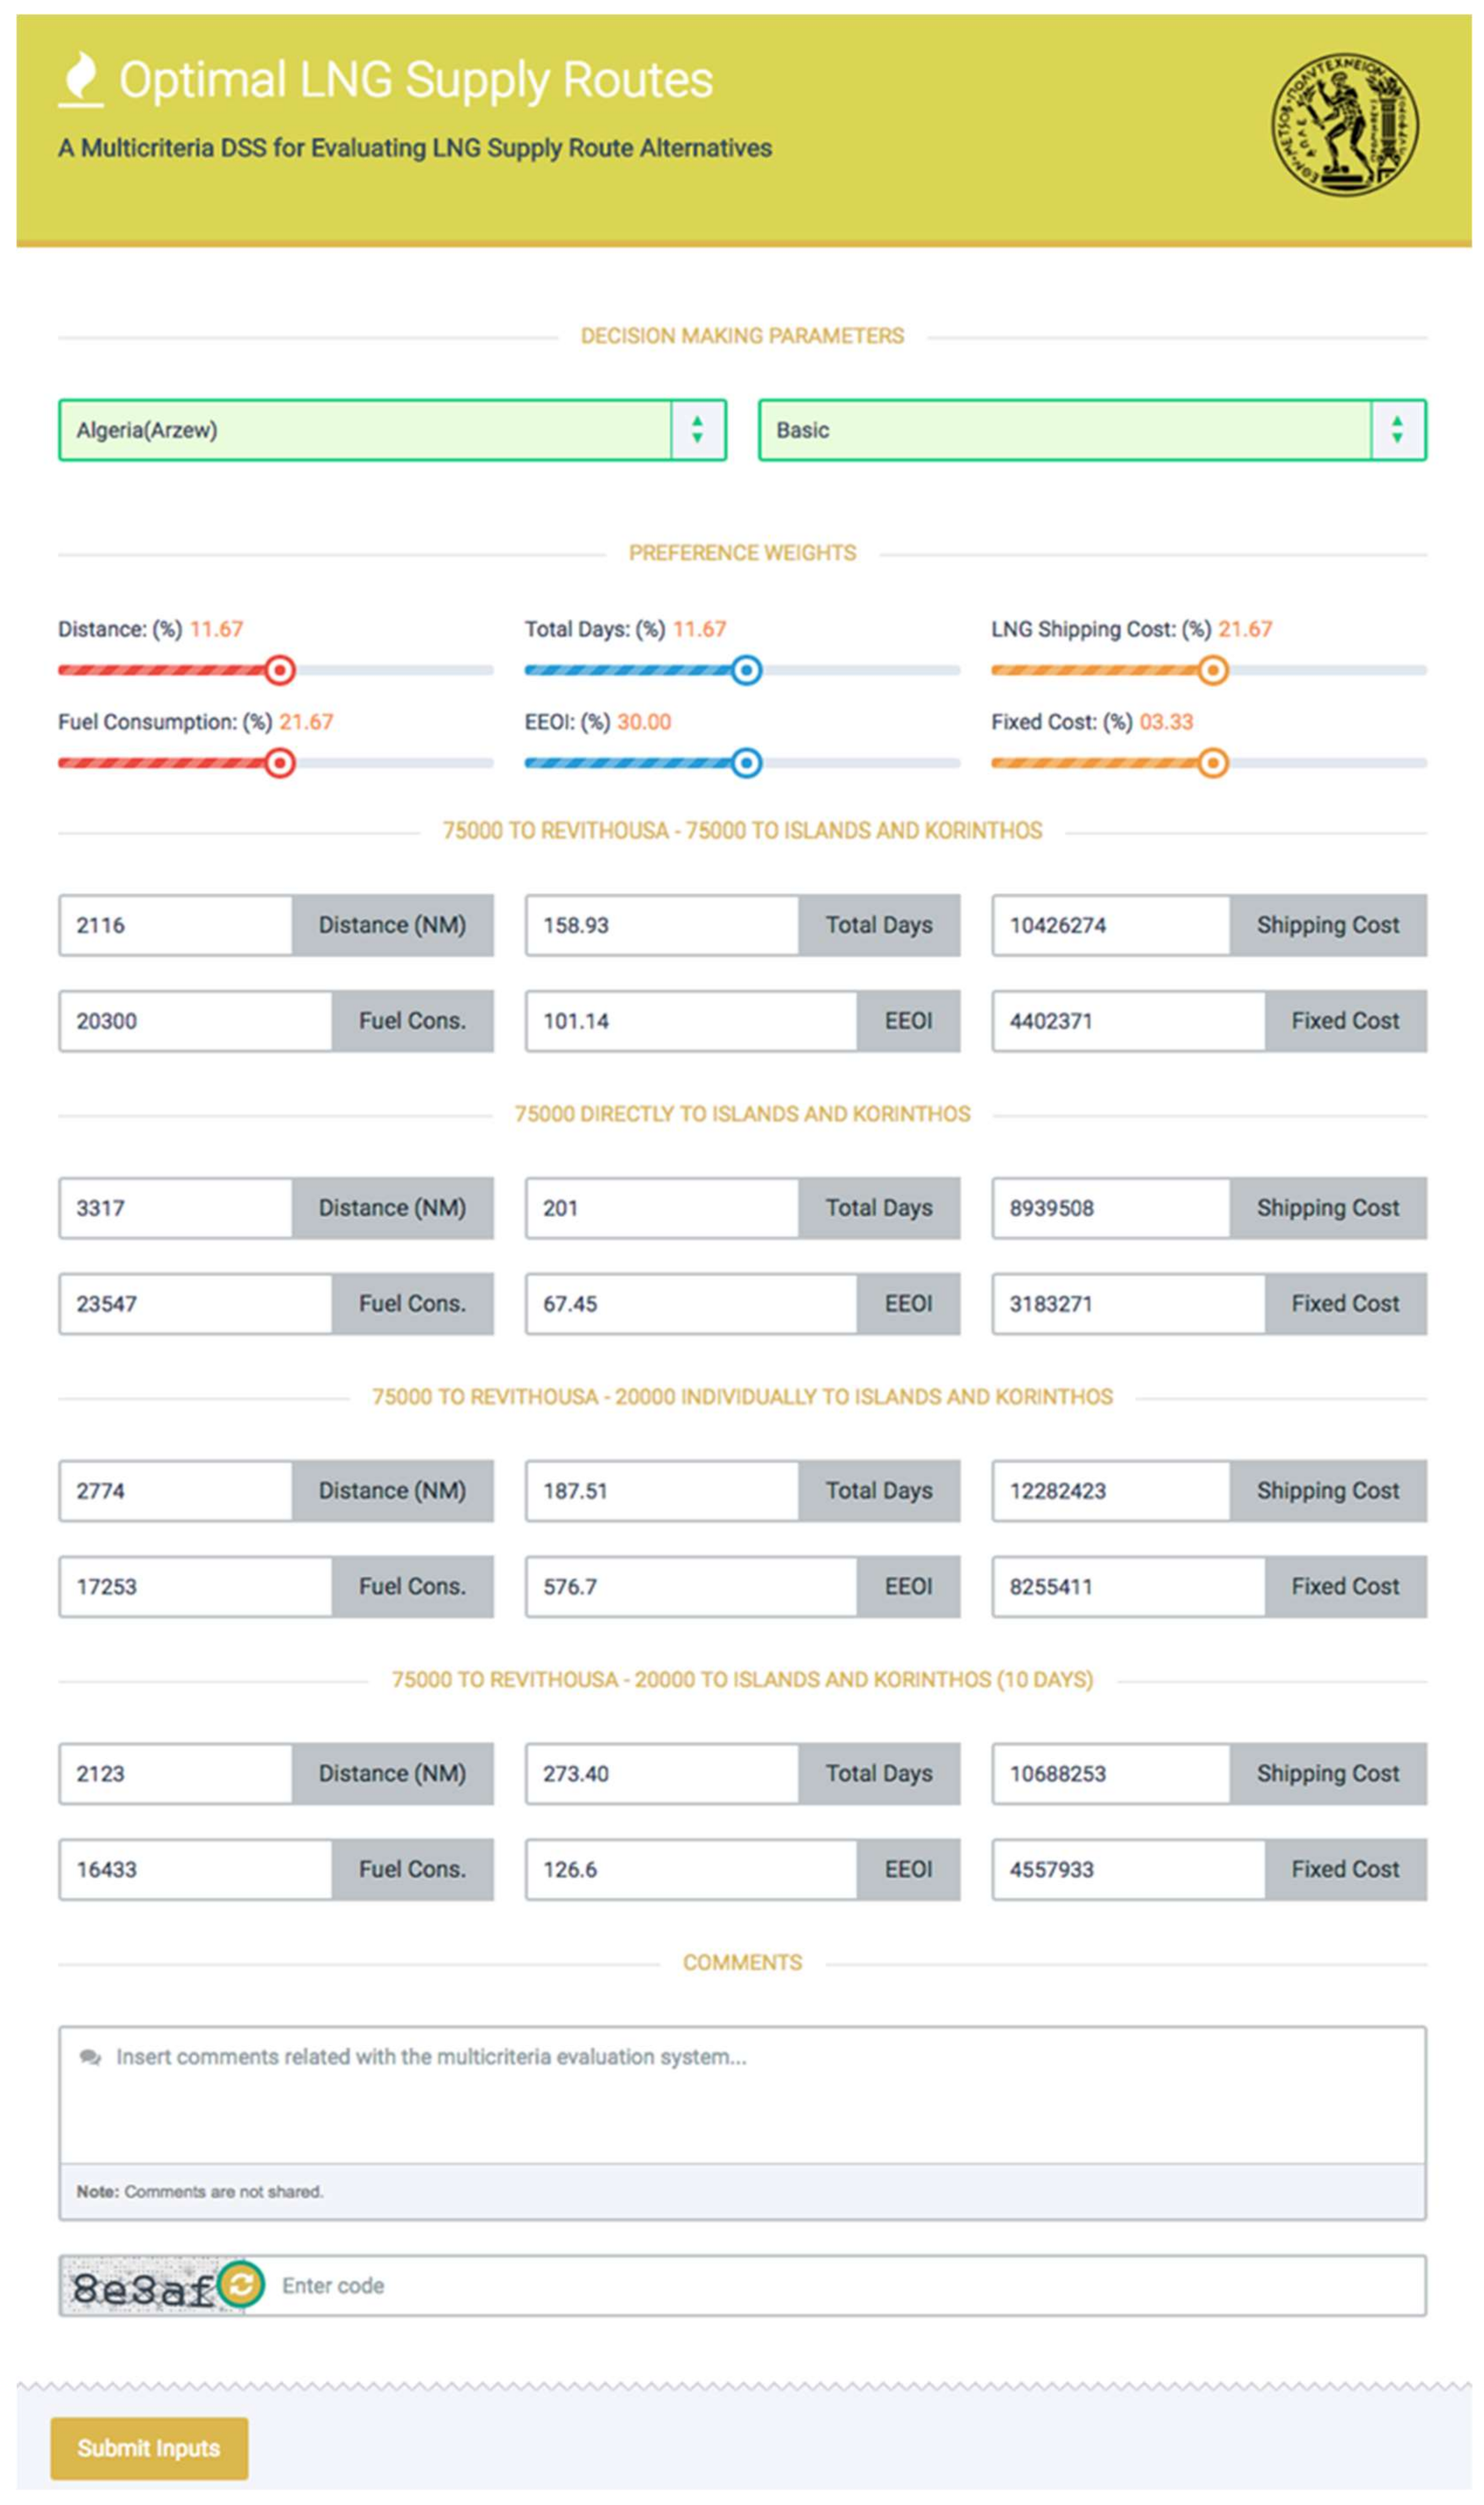
The software implementation is due to the necessity to provide a platform, with a user friendly interface, that will facilitate the decision making process. It is designed so that it can incorporate different trip routes, requiring only the values of the criteria as inputs, without needing deeper knowledge of the multicriteria method used. The user preferences described by the weights of the criteria, can be, also, be determined by the decision maker reflecting his preferences. Once all the inputs are provided the multicriteria method concludes to the final outcome, which consists of the ranking of the alternatives for the trip plans.
The four examined alternatives in the present study can be loaded in the program and the user can choose among the three weighting scenarios. The results of the methodology are shown, and they can be send to the user via email.
Figure 3 shows a screenshot of the developed decision support tool.
From a technical perspective, the software implementation consists of an online web tool developed using CSS3 and HTML5, enhanced with jQuery, AJAX and PHP. The frontend is based on a fully responsive, clean and consistent UI making the tool accessible from every device through a web browser and easy to use. In the background, calculations are performed using PHP engine and are based on the derived equations from the Additive Value Model. The followed approach considers the values of the criteria deterministic while the user of the software should take into account the potential uncertainty in the values of the criteria inserted. A sensitivity analysis of the obtained results can be carried out by giving different weights on the criteria in a relatively small range to check the robustness of the suggested optimal ranking of the alternatives.
6. Conclusions
Natural gas tends to be more and more often an advantageous fuel due to the low environmental impact and the strict legal framework. The study presented in this paper addresses the assessment of natural gas supply of insular electricity systems based on multiple criteria. A multicriteria model has been constructed to evaluate potential LNG supply alternative routes, implemented for four islands and one existing power plant of the mainland. As the examined islands now cover their electricity demand by internal combustion engines, using HFO, a novel study has been carried out, based on future national plans, proposing the use of natural gas, in order to cover all or a part of their electricity demand, and calculating their annual requirements in natural gas. Three evaluation scenarios have been indicated generated from the different weights given by the stakeholders. The multicriteria methods, Additive Value Model and PROMETHEE, have been selected for the evaluation process and a software tool has been developed based on additive value model.
The contribution of the research is indicated by two axes: the possibility of using natural gas in islands is examined and at the same time the possibility of their secure supply. The selected criteria fall into the most crucial points for the selection of the best alternative supply schedule and they are specialized in the nature of the problem. The necessity to use an efficient multicriteria model is demonstrated. From a methodological point of view, an important issue is the robustness of the model, as both the implemented methods conclude the same best route.
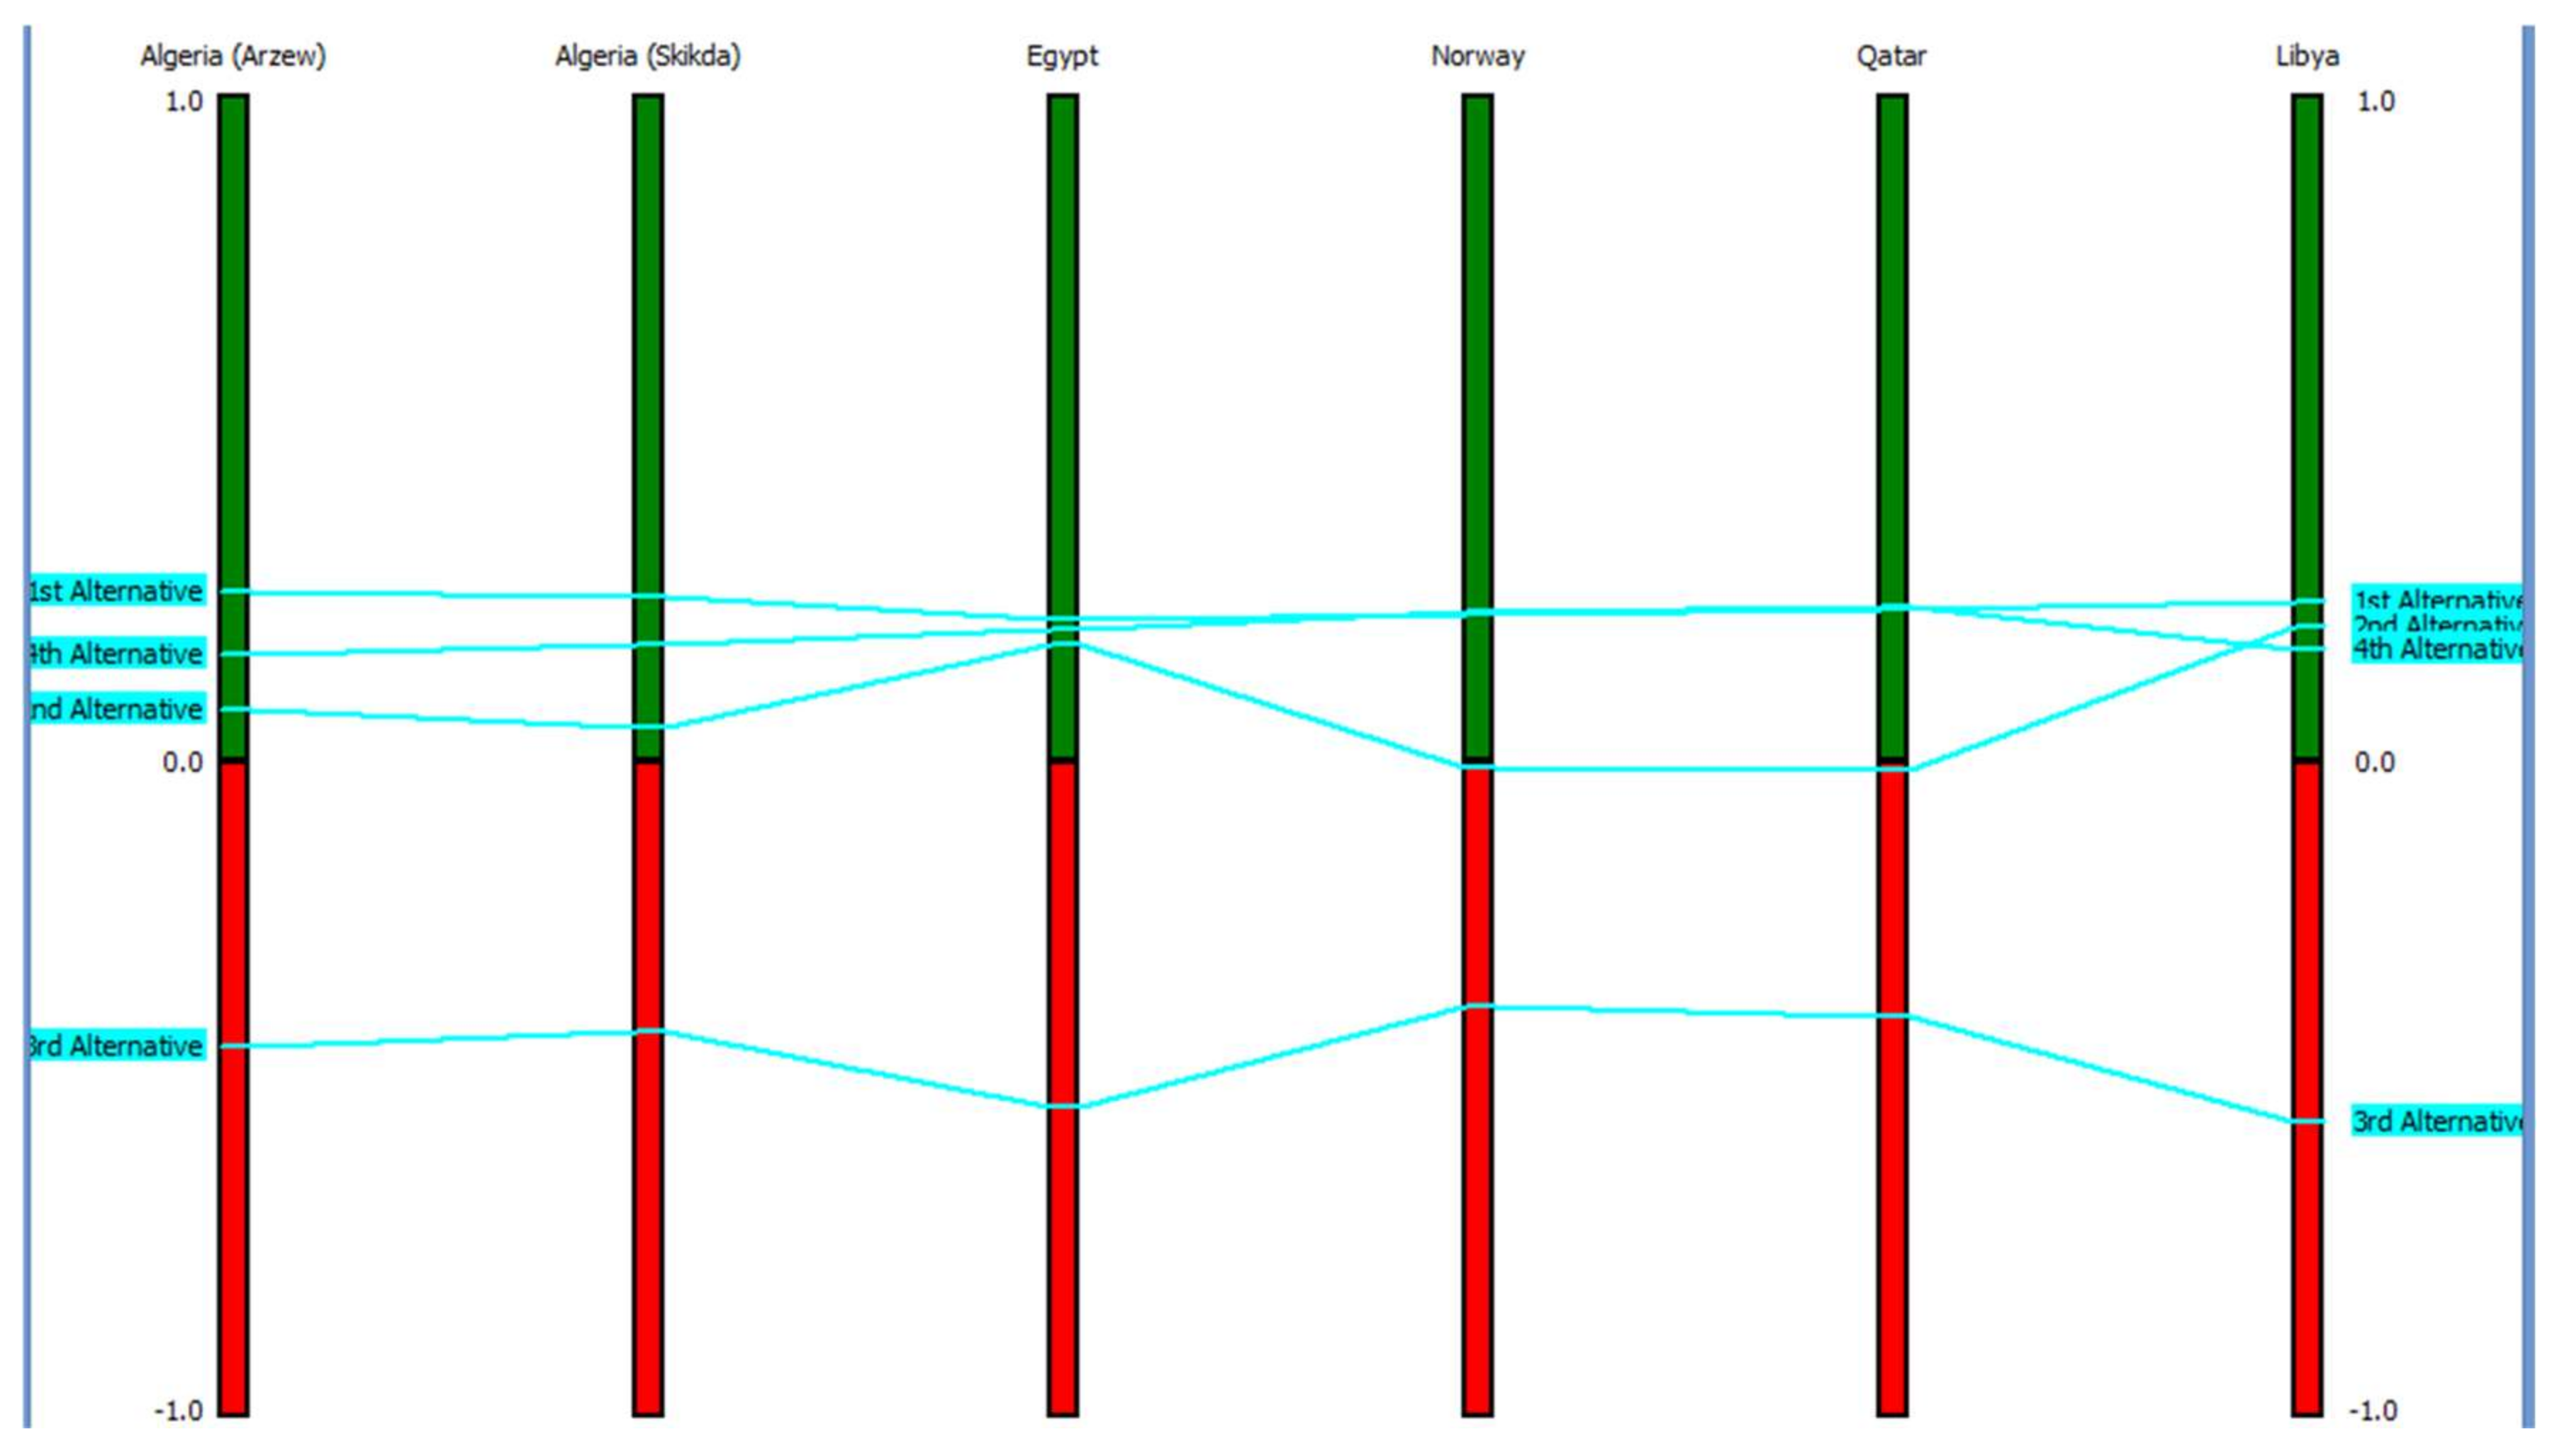
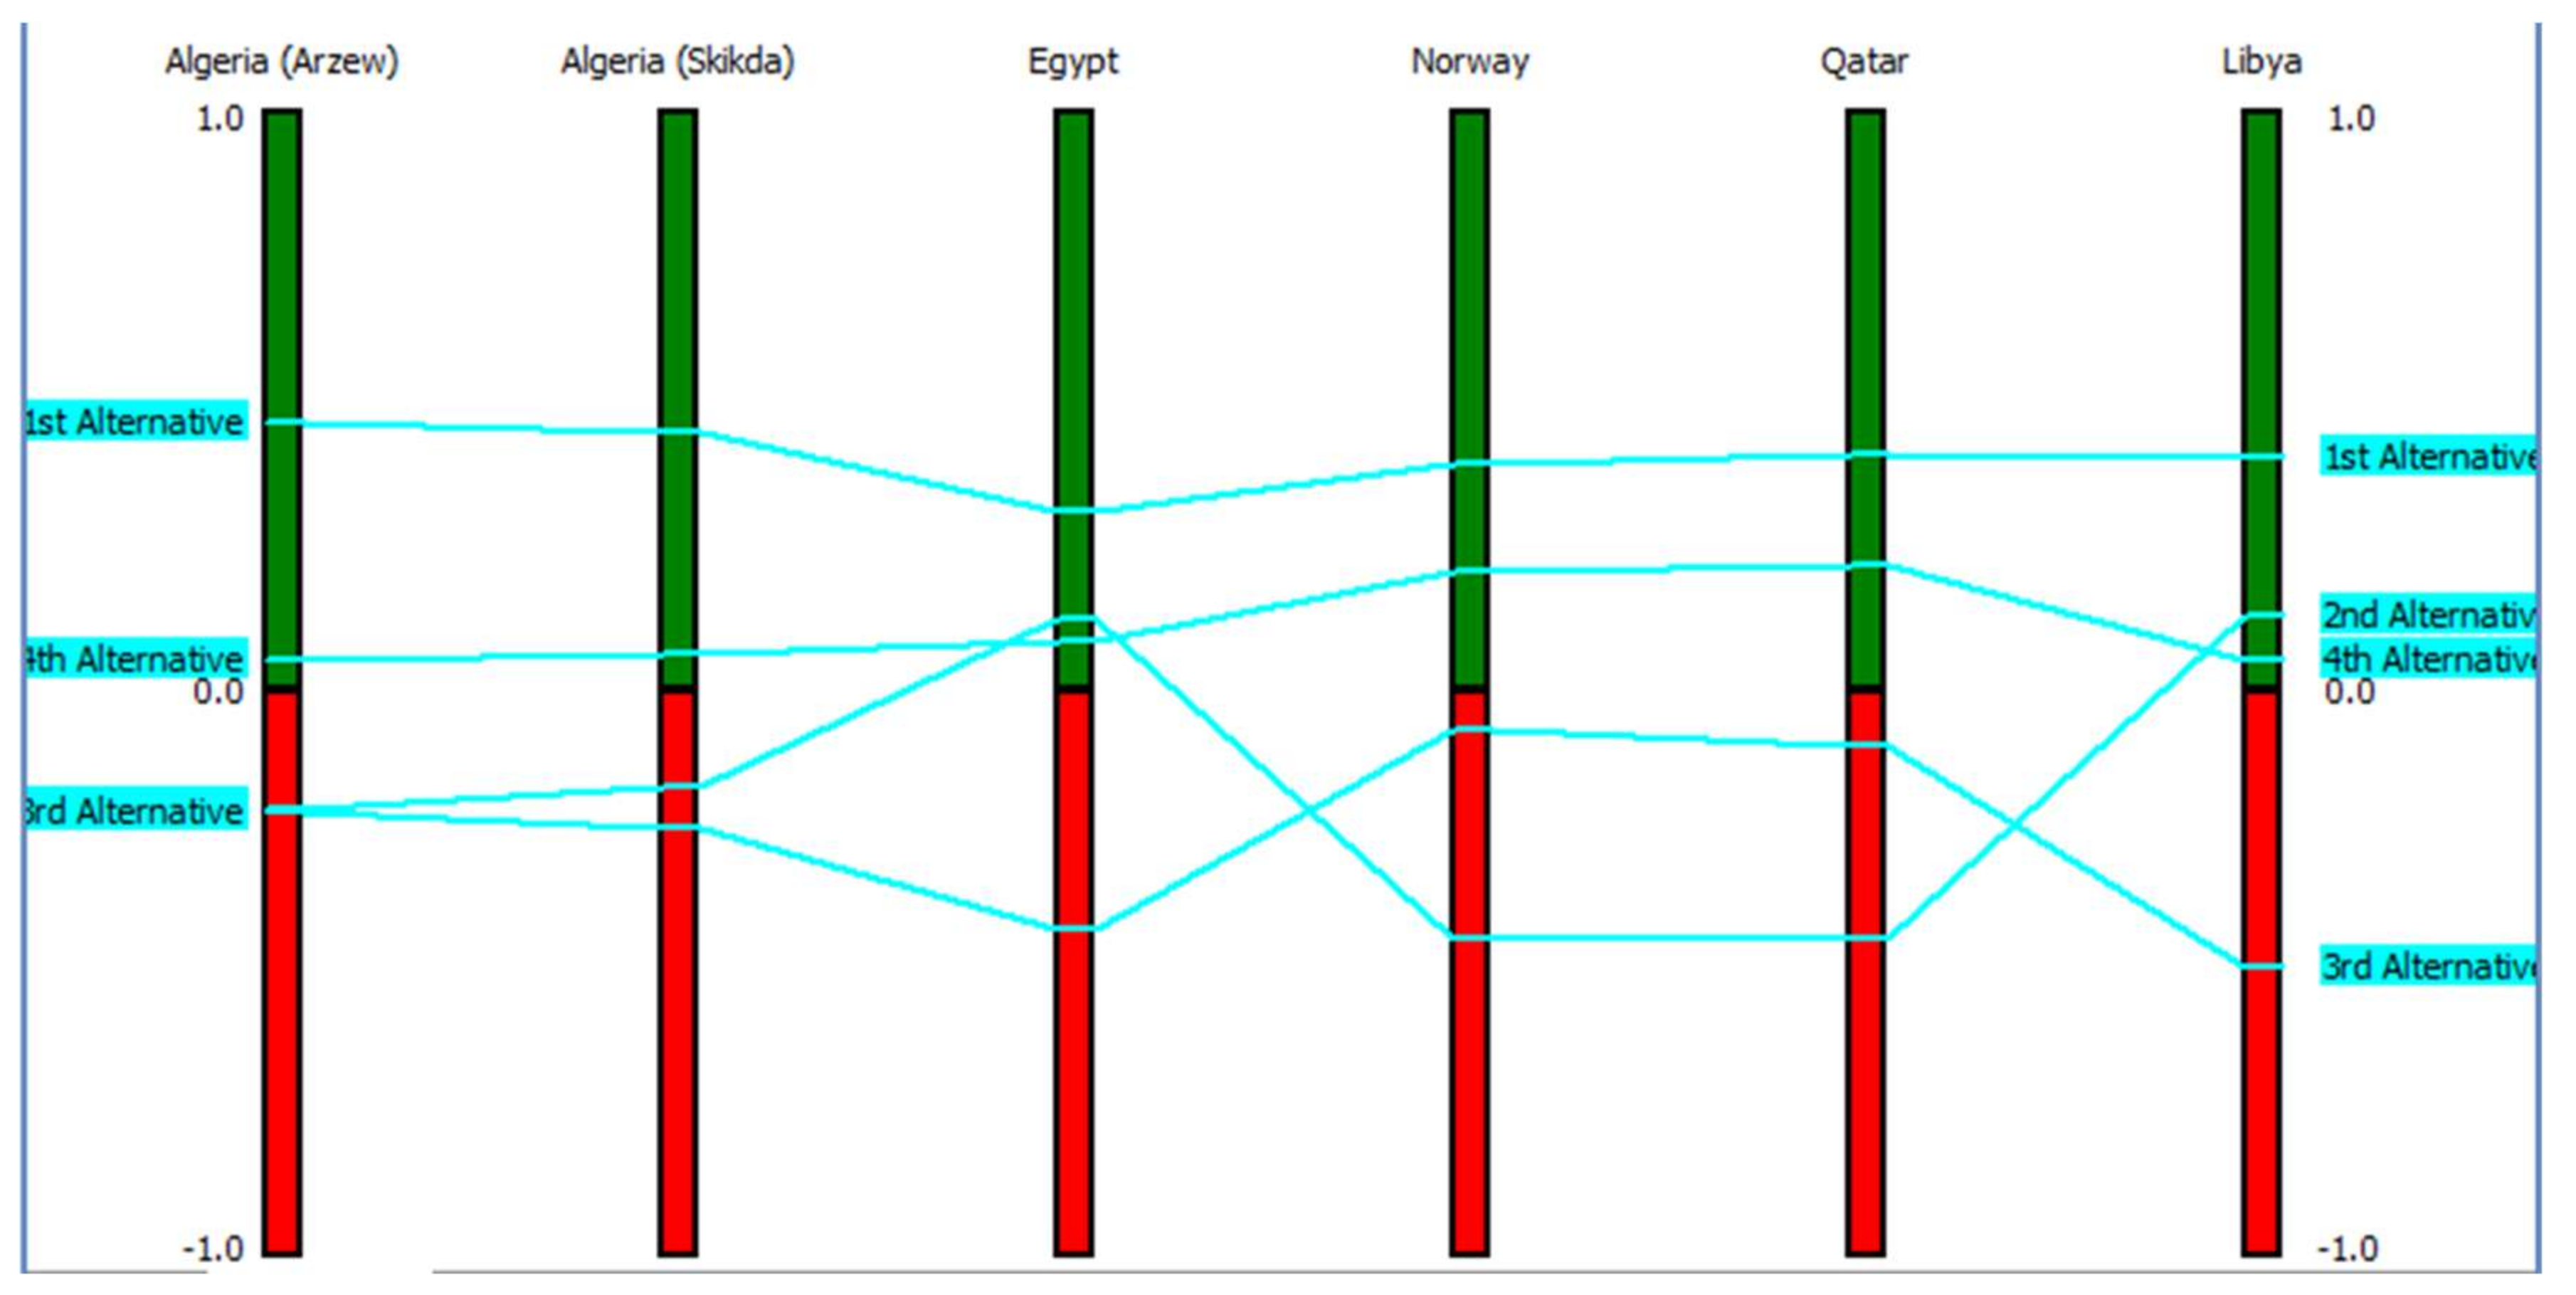
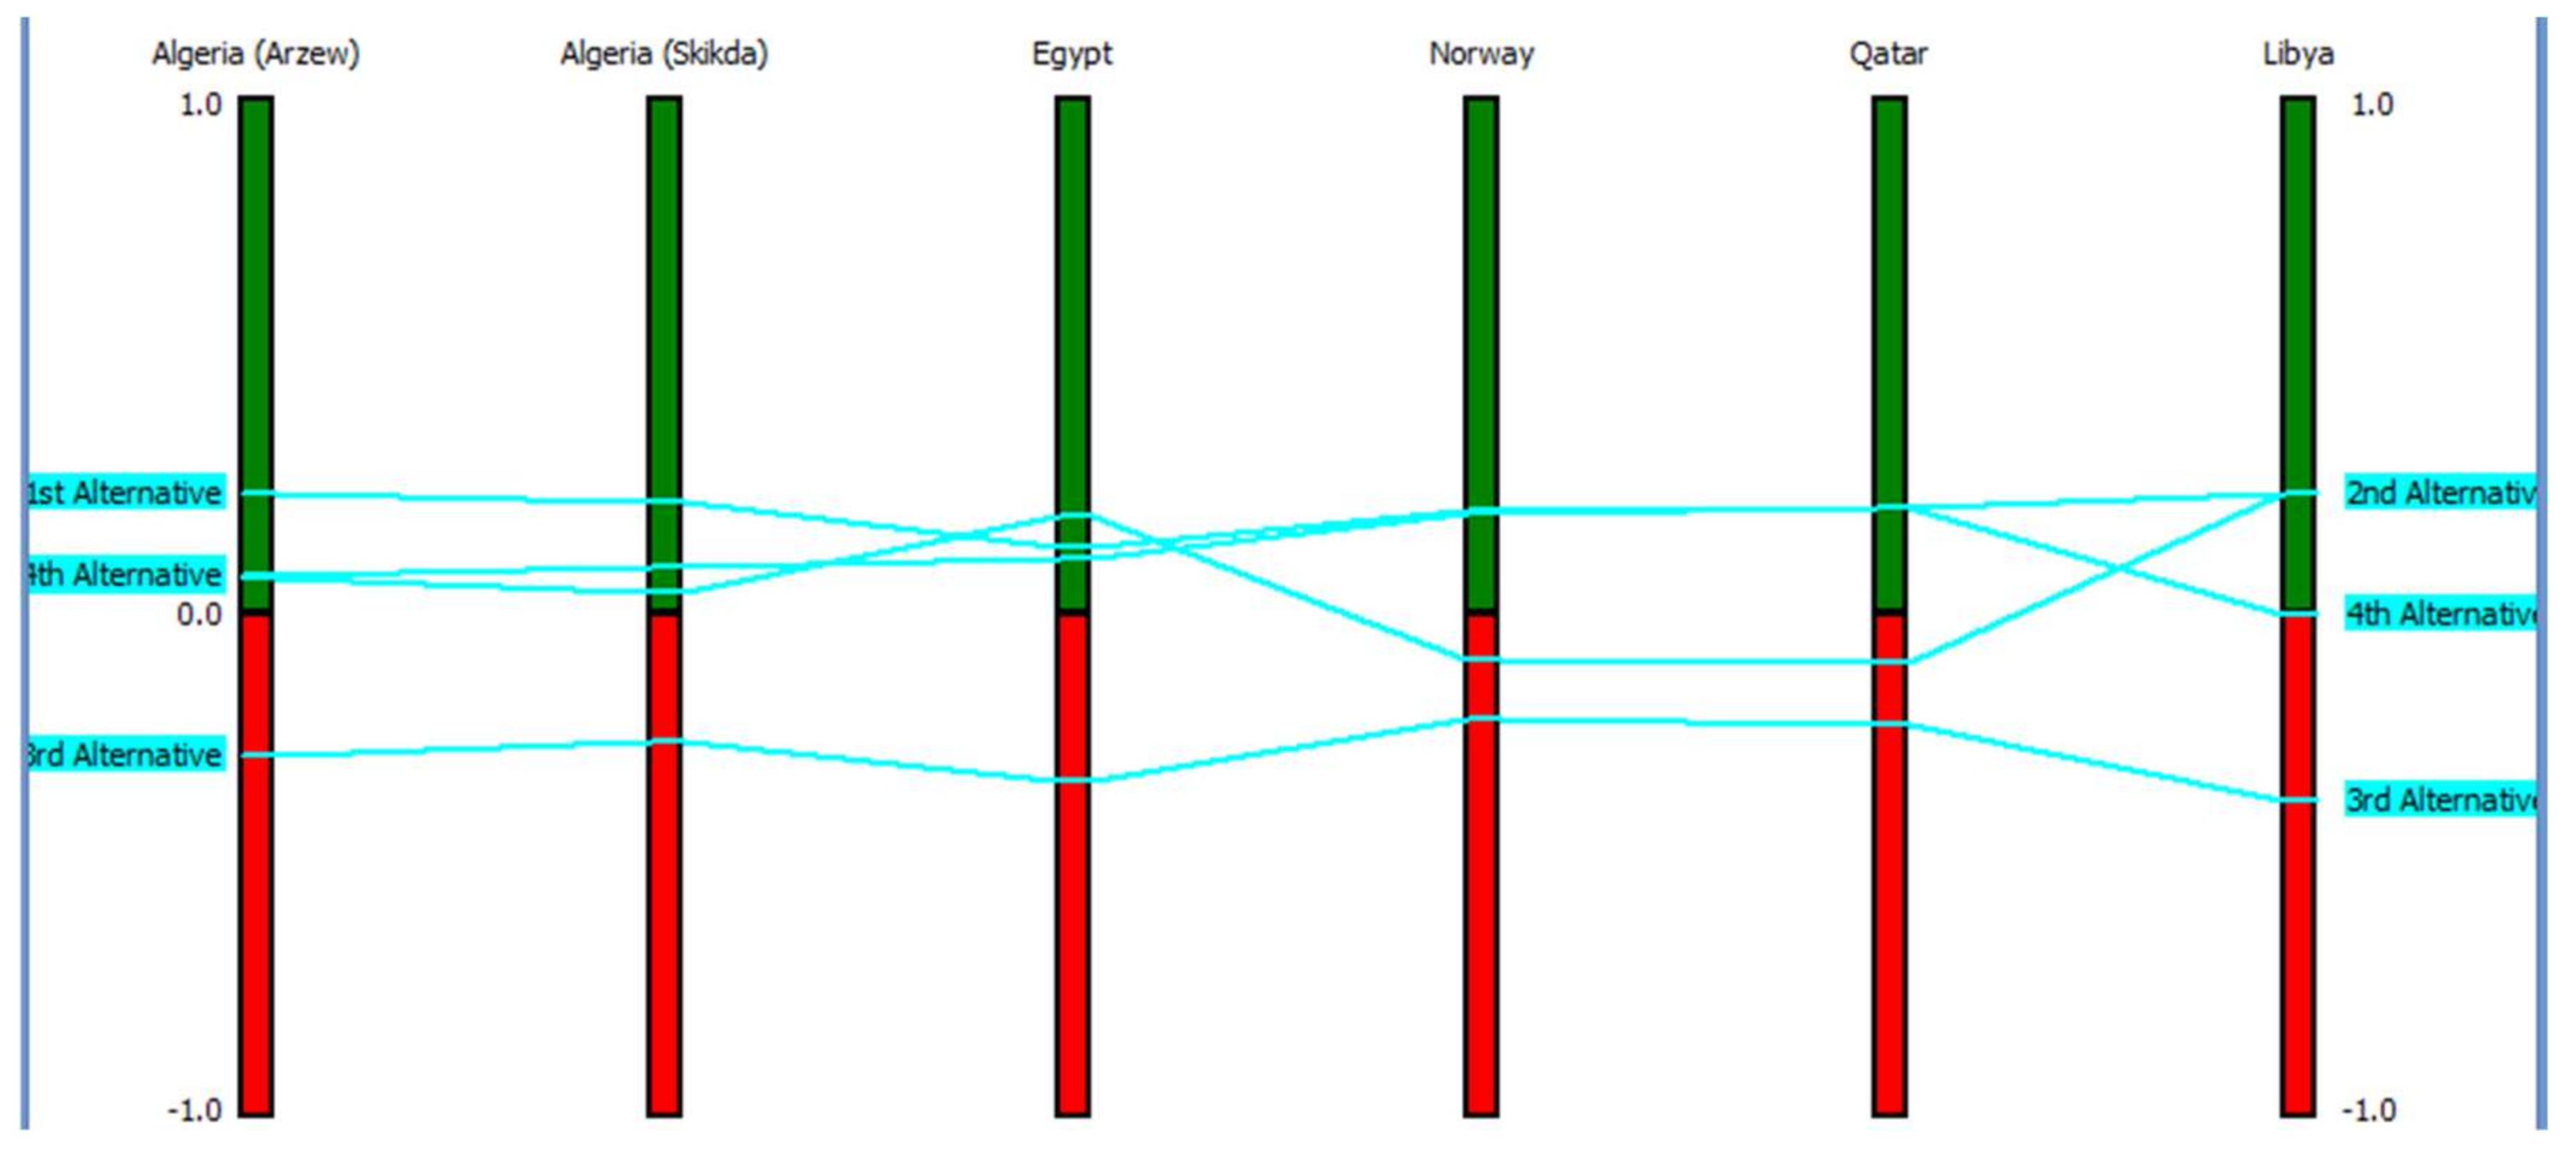
From the obtained results, the authors conclude that two supply alternatives are optimal. One case is the development of a network of small-scale import terminals (here associated with the power plants) supplied by a single small-scale LNG carrier, and the other case is the direct supply of the small-scale terminals, when the LNG export terminal is close to the examined supply chain. In both cases, it is preferable that the LNG carrier makes a roundtrip than suppling each import terminal separately.
The main limitation of using multicriteria analysis in this type of problem, is that only a definite number of alternative supply corridors could be assessed, fixed by the decision maker. The proposed methodology could be enhanced by optimization tools, which will give the ability of choosing the best ship route for an alternative supply option, including crucial factors like the speed of the vessel and the effect of wind on propulsion.
The presented model could be further enhanced with the incorporation of more islands and more alternative supply options or be implemented to cover small-scale LNG needs in multiple application areas. The developed software is user friendly and could be adjusted according to decision maker preferences. The timing of the study is very important, as PPC plans to convert existing conventional power engines with new engines consuming natural gas, and so their supply with liquified natural gas will be imperative need in the near future. The model may support national energy decision makers in such an important and crucial problem for Greece.


