Abstract
Reduction of CO2 from waste gases from various industries is now desired worldwide. As a technology for separating CO2 from mixed gases, Pressure Swing Adsorption (PSA) is one of the practical processes that are widely used at present owing to the simplicity of its gas separation mechanism. In order to reduce the cost of CO2 separation, a further reduction of the running cost of CO2-PSA operation is required. Among all the utilities used in CO2-PSA, electric power consumption has the greatest impact, especially in cases where the pressure swing range between gas adsorption and gas desorption is large. Electric power consumption increases significantly when the pressure loss inside the adsorber has reached a non-negligible level. Changing the adsorbent pellet size is a convenient method for reducing pressure loss, but its effect on CO2-PSA performance was unclear. Therefore, in this work, the effects of the size of the adsorbent pellets on both the gas adsorption behavior and the electric power consumption in CO2-PSA were evaluated experimentally. From the results of laboratory-scale CO2-PSA experiments and gas adsorption rate measurements, it was observed that the effect of the pellet size appeared only in the early stage of the gas adsorption step and was not dominant when the cycle time was sufficiently long. Subsequently, pilot-scale CO2-PSA experiments with the same CO2 throughput were also conducted, and as a result, the electric power consumption of a vacuum pump was lowered by 15% in case of using d = 3.0 mm larger adsorbent pellets compared to the results with d = 1.5 mm smaller adsorbent pellets.
1. Introduction
A large-scale CO2 separation process with higher cost efficiency is one of the key technologies for reducing CO2 emissions from various industries. Because the steel manufacturing process is a major CO2 source, accounting for about 15% of total CO2 emissions in Japan, a low cost process for separation of CO2 from the various exhaust gases in steel works would have a great impact on the reduction of total CO2 emissions. In these circumstances, the major Japanese steelmakers using the blast furnace route started the COURSE50 national project in FY2008 in order to achieve a 30% reduction of CO2 compared to the conventional steelmaking process [1,2,3,4]. Figure 1 shows the outline of the COURSE50 project. The COURSE50 project consists of two main technologies, “Hydrogen reduction in blast furnace” and “CO2 separation process from blast furnace gas” [5], as well as the other support technologies to facilitate these two processes [6,7]. The CO2 separation process is shown on the right in Figure 1. There are several types of gas separation processes that are already in actual use at present. In the COURSE50 project, both the chemical absorption process and the physical adsorption process have been developed, aiming at the separation of a huge amount of CO2 from blast furnace gas.
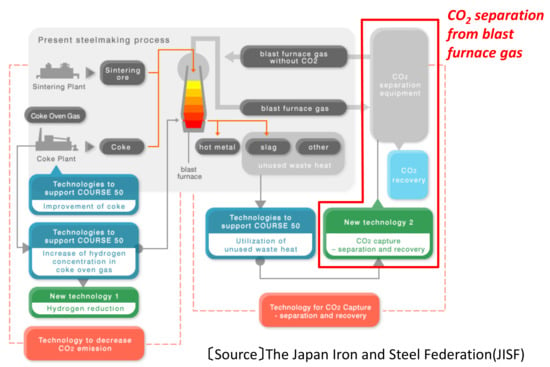
Figure 1.
Outline of the COURSE50 project.
The gas chemical absorption process is one of the practical processes that is already applied to separate CO2 from various waste gases in some industrial processes. An aqueous solution of an amine-based absorbent that can be regenerated easily by heat is used in this process [8,9,10,11]. This process is especially preferred at sites where waste heat is readily available because it requires a huge amount of thermal energy to regenerate the CO2 absorbent after CO2 loading.
The gas physical adsorption process with a gas adsorbent is another promising process for large-scale gas separation. This type of process is widely known as Pressure Swing Adsorption (hereafter “PSA”) and is sometimes called by other names such as Vacuum Swing Adsorption (VSA) or Vacuum Pressure Swing Adsorption (VPSA), especially in cases of operation under vacuumed conditions. In the plant design of the CO2-PSA process, the selection of the CO2 adsorbent is the most important issue for deciding the proper plant scale and its operating conditions. Many types of CO2 adsorbents have been introduced or investigated to date [12,13,14,15,16]. Most were certain types of zeolites or activated carbons, which possess a higher CO2 adsorption capacity per unit adsorbent weight. Among these adsorbents, Zeolite 13X (X type zeolite) is one of the most well-known adsorbents for its industrial availability and higher CO2 selectivity against other gases such as N2 and CO. McEwen et al. compared the CO2 isotherms of three types of adsorbents, ZIF-8, Zeolite 13X, and BPL activated carbon, and made the Ideal Adsorbed Solution Theory (IAST) calculations to estimate their CO2 selectivity against CH4 and N2 [17]. They reported that properly regenerated Zeolite 13X showed the best performance in terms of both CO2 capacity and CO2 selectivity. Walton et al. evaluated the effect of the exchanged cation on the CO2 adsorption isotherm in X and Y type zeolite [18]. The performance of CO2-PSA with Zeolite 13X has been investigated with many types of experimental setups and various operation patterns. Recently, CO2-PSA is also used preferably in the CH4 upgrading process, in which CO2 is removed from natural gases. Campo et al. measured both the isotherms and the breakthrough curves of CO2, CH4, and N2 in order to evaluate the performance of a Zeolite 13X adsorbent that was improved by reducing the binder in the particles [19]. They also carried out PSA experiments and created a PSA simulation model that enables the design of industrial-scale CO2-PSA processes. Khunpolgrang et al. attempted to improve both CH4 purity and CH4 recovery by adding a N2 purge step to CO2-PSA with Zeolite 13X [20]. In comparison with the process with the traditional product-purge step, significant improvement was observed when the N2 purge step was added. However, total power consumption increased due to the extra energy required for N2 separation from air by the second PSA process.
Especially when a CO2-PSA process is designed to handle a huge amount of gases, the optimum design of the PSA plant is very important for ensuring a higher CO2 throughput, higher purity of the recovered CO2, and minimum electric power consumption for CO2 separation. Ga et al. introduced new performance indicators of various adsorbents including Zeolite 13X to estimate the efficiency and product purity of CO2-PSA [21,22]. They compared performance indicators obtained from both laboratory data and the results of rigorous PSA simulations and suggested their practical utilization, although some improvement in prediction accuracy is still required. Zhang et al. proposed a multilayered bed of CDX alumina and NaX (13X) zeolite for CO2 separation from high humidity flue gases [23]. The water front in CDX alumina can be stabilized by properly designing the bed layers.
Many of these studies on CO2-PSA with Zeolite 13X were conducted on the assumption of using single-sized adsorbent pellets for simplicity, and differences in the pellet size were sometimes neglected by using the average size of the pellets. Additionally, the adsorbent pellet was sometimes assumed to be a homogeneous porous solid that has no hierarchical pore structure consisting of macro-pores and micro-pores. This sort of assumption is convenient, especially in cases of simulation-based studies owing to the simplicity of the gas diffusion model inside the adsorbent pellet. However, the pellet size and the pore structure could possibly have some effects on the total performance of CO2-PSA, especially when the pressure loss inside the adsorbent bed is not negligible. If the size of the adsorbent pellet could be increased without causing any lagging of CO2 diffusion, it would expectedly improve the performance of CO2-PSA by the effect of the reduction of pressure loss. However, the combined effect of both the pellet size and the hierarchical pore structure on the CO2 diffusion behavior was unclear. Therefore, in order to explore the further potential for reduction of the CO2 separation cost by changing the adsorbent pellet size, the authors carried out both laboratory-scale CO2-PSA experiments and pilot-scale CO2-PSA tests with various adsorbent pellets of different sizes and evaluated the CO2 diffusion rates inside the adsorbent pellets and the actual CO2-PSA performances.
2. Experimental
2.1. Preparation of Various Shapes of Adsorbents
The selection of the CO2 adsorbent is the first important step in the design of a high efficiency CO2-PSA system. In our previous study, we evaluated the isotherms of various types of CO2 adsorbents and selected Zeolite 13X (Zeolum F-9HA, Tosoh Corp., Tokyo, Japan) for CO2-PSA system design [5]. Zeolite 13X has both a higher CO2 working capacity in the CO2-PSA pressure swing range and higher CO2 selectivity against other impurity gases such as CO and N2. It also has higher pellet strength, which is sufficient to prevent degradation of the pellets during long-term PSA operation. Figure 2 shows the appearance of Zeolite 13X adsorbent pellets having a cylindrical diameter d = 1.5 mm, the shape of the crystallite observed by SEM and the microstructure. The crystallite of Zeolite 13X contains numerous uniformly-sized micro-pores inside its Faujasite (FAU) structure, which enables good accessibility of smaller gas species to the adsorption sites. These crystallites are aggregated into pellets with sufficient strength for long-term use. The pellets contain many macro-pores between the crystallites, which can be observed as darker spots in the SEM image, and these are also effective for rapid gas diffusion inside the pellets.

Figure 2.
Zeolite 13X adsorbent pellets ((a) Appearance of pellets; (b) Crystallites of Zeolite 13X observed by SEM; (c) Framework of Zeolite 13X from open access database of Structure Commission of the International Zeolite Association (IZA-SC)).
In order to compare the performances of CO2-PSA with various adsorbent shapes, adsorbent pellets having the four different shapes listed in Table 1 were prepared for laboratory-scale CO2-PSA experiments. All these pellets were produced by the extrusion molding method with different mold shapes. The external surface ratio in Table 1 is the pellet surface area per unit volume described as a relative value against the ratio of the d = 1.5 mm cylindrical pellet. The production conditions other than the mold shapes were common to all the adsorbents, meaning that there was no difference in the microstructure inside the pellets. Table 2 shows the specifications of the adsorbent. The total macro-meso pore volume and the average pore diameter were measured by a mercury penetration method, which is commonly used for measurement of the macro-meso pore distribution in porous materials [24]. The measuring apparatus was an AutoPoreIV9520 (Micrometrics Inc., Norcross, GA, USA). The average pore diameter at the measured pressure was calculated by using the relationship between the pressure and the surface tension of the penetrated mercury. The BET surface area was measured by the standard nitrogen adsorption method [25] by using a BELSORP-mini (MicrotracBEL Corp., Osaka, Japan).

Table 1.
Shapes of adsorbent pellets for laboratory-scale CO2-PSA experiments.

Table 2.
Common properties of adsorbents.
2.2. Laboratory-Scale CO2-PSA Experiment
Figure 3 shows the laboratory-scale CO2-PSA equipment having three adsorbers. The equipment specifications and operation conditions are listed in Table 3. Figure 4 shows a schematic diagram of the experimental setup of this laboratory-scale CO2-PSA, which consists of individual feed gas lines (N2, CO2, CO, H2) with mass flow controllers, three adsorbers consisting of SUS columns having a 40 mm inner diameter and 300 mm height, a backpressure valve to stabilize the adsorption pressure, a vacuum pump to control the desorption pressure, and gas flow meters to calculate the mass balance. Each adsorber was packed with 120 g of fresh adsorbent pellets. Standard gases having purity of more than 99.95% were prepared with gas cylinders and provided through the regulators. The mass flow controllers were calibrated previously to create a mixed gas of various feed gas compositions with high precision. The gas evacuation rate of the vacuum pump was adjusted by the needle valve of the vacuum pump suction line to achieve the target minimum gas pressure in the gas desorption step. The automatic valves were controlled by programmed patterns that were set previously on a control panel. The feed gas flow was controlled to a constant rate by the mass flow controllers. The gas adsorption pressure during the PSA cycle was adjusted to the value in Table 3 by adjusting the backpressure valve of the off-gas line. The gas flow rate was calculated by dividing the measured gas flow amount in one PSA cycle by the cycle time. The accumulated gas flow volume was measured by an integrating gas flow meter (model DC-1, Shinagawa, Tokyo, Japan). The gas recovered during one PSA cycle was collected in a gas bag, and its composition was measured by gas chromatography (GL-4000, GL Sciences, Tokyo, Japan).
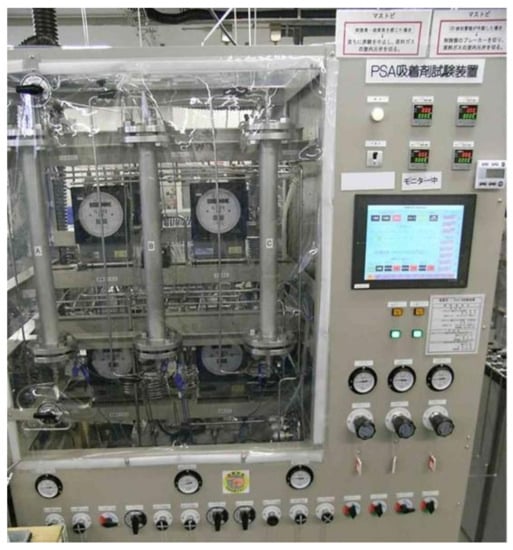
Figure 3.
Laboratory-scale CO2-PSA equipment.

Table 3.
Laboratory-scale CO2-PSA operation conditions.
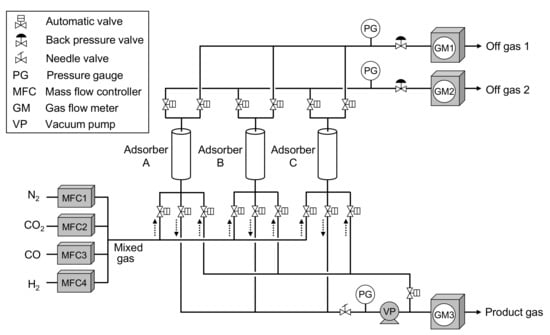
Figure 4.
Schematic diagram of laboratory-scale CO2-PSA equipment.
2.3. Measurement of CO2 Adsorption Rate in Early Stage of Adsorption
To clarify the effect of the adsorbent size on the CO2 adsorption rate of Zeolite 13X adsorbent pellets, the CO2 adsorption rate was measured by using a BELSORP-VC (MicrotracBEL Corp., Osaka, Japan). Figure 5 shows a schematic drawing of this experimental apparatus. The CO2, N2, and He (purity: >99.95%) gas cylinders were connected individually to the inlet gas lines. As the first step of this measurement, the fresh adsorbent pellets were regenerated in a sample column at 473 K in a vacuum state for 2 h. After cooling the sample, the whole system was evacuated and the dead volume of the sample column was measured by He gas expansion. Next, the system was evacuated again, and the 50% CO2–50% N2 mixed gas was prepared by using a pre-column having a circulation pump and two zones A, B with known volumes. As the first step in the gas mixing process, these A and B zones were filled with a primary gas at a specific pressure. The B zone was then isolated by shutting the V4, V5 valves, and the A zone was evacuated by a vacuum pump. Subsequently, a secondary gas was introduced into the A zone at the pressure necessary to obtain the target gas mixing rate and initial gas pressure. The A zone filled with the secondary gas was connected to the B zone filled with the primary gas by opening the V4, V5 valves, and the gases were mixed by the circulation pump. The gas mixing time by the circulation pump necessary to ensure sample uniformity was defined automatically. After preparing the CO2–N2 mixed gas, the gas was introduced into a stainless sample column having a 6 mm diameter and 100 mm length containing 1 g of adsorbent pellets by opening the V5, V6 valves at 298 K under thermostatic control. The pressure variation after gas introduction was measured every second until it reached to the equilibrium state. This system is also equipped a gas chromatograph that can measure the gas concentration within about 30 s, but the chromatograph was not used in this measurement because the measurement time was not sufficient to follow the variation of the gas adsorption amount in 1 s units.
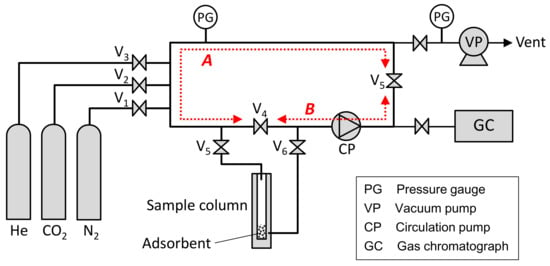
Figure 5.
Schematic diagram of experimental setup for measurement of CO2 adsorption rate.
3. Results
3.1. Result of the Laboratory-Scale CO2-PSA Experiment
Figure 6 shows the results of the laboratory-scale CO2-PSA experiment. The horizontal axis shows the pellet external surface ratio in Table 1, and the vertical axis shows the amount of CO2 recovered in one PSA cycle. The results show that the external shape of the adsorbent pellet has little relationship with the amount of CO2 recovery at this laboratory scale. The result of the honewort-shape pellets, which was originally expected to improve PSA performance as a result of its enhanced external surface area, was also on the same level as the other adsorbent pellets. From these results, it was estimated that the gas diffusion rate from the surface to the center of the adsorbent pellet was high enough that the effect of the external pellet size could be neglected, and this high diffusion rate was attributable to the larger macro-pores inside the pellets.
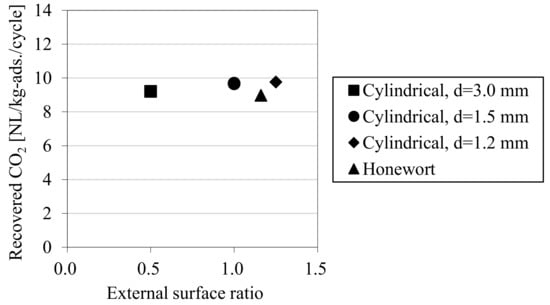
Figure 6.
Results of laboratory-scale CO2-PSA tests with adsorbents of various shapes.
3.2. Result of the Measured CO2 Adsorption Rate in Early Stage of Adsorption
The Figure 7a shows the pressure variation after introducing the mixed gas into the sample column of Figure 5. In the results with the d = 1.5 mm adsorbent pellets, a rapid pressure decrease was observed within a few seconds after gas introduction. However, the pressure decrease within the same time range was relatively small in the case of the d = 3.0 mm adsorbent pellets. The Figure 7b shows the variation of equilibrium achievement, which is defined as the ratio of the maximum pressure decrease after reaching equilibrium ∆pe and the temporal pressure decrease ∆p. The effect of the adsorbent size could be observed in the early stage of gas adsorption, as the gradient of the graph of the d = 1.5 mm adsorbent pellets was much larger than that of d = 3.0 mm adsorbent pellets. The gradient of equilibrium achievement became smaller as it approached 1.0 for the equilibrium state. The retention time for equilibrium achievement varied depending on the type of adsorbent and the adsorbed gas species.
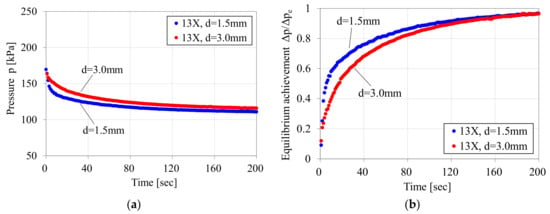
Figure 7.
Pressure variation after introducing 50% CO2–50% N2 mixed gas into sample column containing Zeolite 13X sample pellets. ((a) Pressure variation; (b) Variation of equilibrium achievement).
Based on the results shown in Figure 7, the overall volumetric mass transfer coefficient in this experiment was evaluated by the following calculation. The adsorbed gas amount in every second Δn can be calculated by the gas state Equation (1) from the measured pressure drop ∆p and the known volume v0.
In the case of Zeolite 13X, adsorption of CO2 is much stronger than that of N2 owing to the higher quadrupole moment of CO2 molecules. Therefore, the measured pressure drop in this experiment can be associated with the adsorbed CO2 amount under the assumption that the pressure drop occurred mainly by CO2 adsorption in this case. The driving force for CO2 adsorption is the pressure difference between the equilibrium CO2 pressure for the adsorbed CO2 amount and the actual CO2 pressure in the gas phase. The equilibrium CO2 pressure can be obtained from the measured CO2 isotherms, which were measured previously at 298 K. After converting the CO2 pressure to the CO2 concentration by the gas state equation, the overall volumetric mass transfer coefficient K′CO2 can be calculated by the following Equation (2). The increment of the adsorbed CO2 amount ∆q in each time step Δt can be calculated by unit conversion of Δn. In this experimental setup, the overall volumetric mass transfer coefficient is defined as a transient value during the progress of gas adsorption.
Figure 8 shows the time variations of K′CO2 derived from the measured pressure for both the d = 1.5 mm smaller pellet and the d = 3.0 mm larger pellet. The larger difference between these two graphs was observed in the early stage of gas adsorption. However, this gap decreased drastically within seconds, and these two graphs converged to the lower level of around 0.5 and showed almost no difference in the later stage of gas adsorption. This result means that the adsorbent size effect appears only when initial gas diffusion occurs and then diminishes rapidly as gas adsorption proceeds.
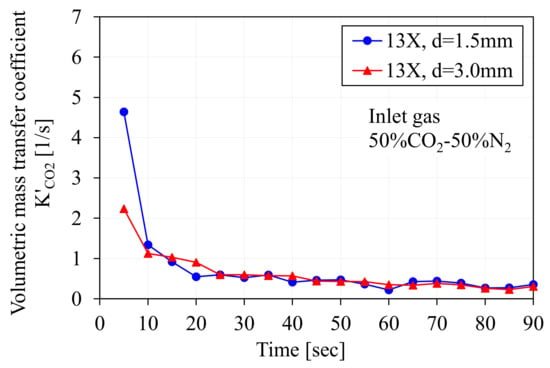
Figure 8.
Variation of overall volumetric mass transfer coefficient K′CO2 calculated by measured gas pressure after introduction of gas into sample column.
3.3. Discussion
From the results in Figure 8, it is estimated that the gas diffusion inside an adsorbent pellet occurs in accordance with the effect of a hierarchal pore structure consisting of the macro-pores between crystallites and micro-pores in the crystallite, which creates sequential gas diffusion steps. In addition, an external gas diffusion layer outside the pellet surface is also created and has some effect on the overall gas diffusion behavior. Figure 9 shows a schematic image of the hierarchal pore structure and the gas diffusion into an adsorbent pellet having a pellet radius of rp. The gas diffusion stages are indicated by the different colors of the bold arrows. In Figure 9, K1 is the volumetric mass transfer coefficient in the external gas diffusion layer, and its value depends on the gas flow conditions around the outer area of the pellet. K2 is the volumetric mass transfer coefficient in the macro-pores between crystallites, which is closely related to the macro-pore size inside the pellet. K3 is the volumetric mass transfer coefficient in the micro-pores inside a crystallite having a radius of rc. From the SEM image in Figure 9, the size of the crystallite seems not to be uniform; therefore, rc can be roughly characterized by the average size of the crystallites inside the pellet.
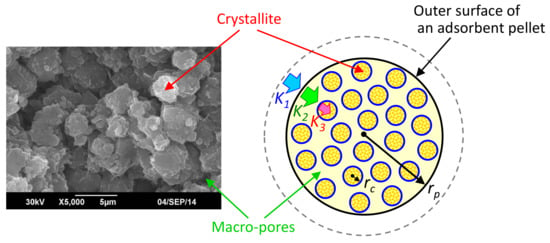
Figure 9.
Schematic image of gas diffusion behavior inside adsorbent pellet.
The gas adsorption rate in an adsorbent pellet is generally defined by the following Equation (3) based on the linear driving force model. The difference between the equilibrium gas concentration for the adsorbed gas amount and the actual gas concentration in the gas phase works as a driving force of the incremental gas adsorption. K′ is the overall volumetric mass transfer coefficient and includes the effects of the gas diffusivities of all these gas diffusion steps and the relevant pellet surface area per unit volume. According to the hierarchical pore structure of the adsorbent, K′ can be defined by the following Equation (4), which means that the gas adsorption rate is governed by the smallest value among K1, K2, and K3.
The volumetric mass transfer coefficient in the outer layer of the pellet K1 can be estimated by Yoshida’s Equation (5), which includes both the Schmidt number Sc and the Reynolds number Re [26]. By definition, the Reynolds number is proportional to the gas velocity u. Therefore, K1 becomes large in case of a higher gas velocity, which has a negligibly small effect on the overall gas adsorption rate according to Equation (5). The gas molecular diffusion coefficient can be derived by Chapman–Enskog’s equation, shown as Equation (6) [27]. For simplicity, only CO2 and N2 were considered as the diffusing gas species in the following calculation. The feed gas of the PSA experiment described above included CO in coexistence with CO2 and N2. Because the molecular weight of CO is almost equal to N2, the effect of CO on CO2 diffusion behavior is expected to be similar to that of N2, especially in gas phase diffusion.
The volumetric mass transfer coefficient in the macro-pores of the pellet K2 can be estimated by the following Equation (7), in which the effective diffusion coefficient Dep is expressed as the combined form with the molecular diffusion coefficient Dm and the Knudsen diffusion coefficient Dkp [28]. τp is the tortuosity factor of the porous structure and changes depending on the porosity and shape of the particle. Many reports have been published on the tortuosity of various porous materials investigated by experiments or simulations. Sun et al. reported the relationship between porosity and tortuosity for artificial particles of different shapes obtained from experimental data [29]. In the following Equation (7), tortuosity was estimated by the relationship in Sun’s report based on the measured porosity of the adsorbent pellet. The Knudsen diffusion coefficient of CO2 in the macro-pore can be calculated by the following Equation (8), which includes the macro-pore diameter dmacro, the gas temperature T and the molecular weight of the diffusing gas species Mi. The average macro-pore diameter measured by the mercury penetration method in Table 2 was used as the dmacro value in this calculation.
The volumetric mass transfer coefficient in the micro-pores of the crystallite K3 was defined by the following Equation (9) under the assumption that the size of the crystallite is represented as the average value. The gas phase diffusion in the micro-pores can be expressed simply as the Knudsen diffusion owing to the restricted space for molecular diffusion. The Knudsen diffusion coefficient of CO2 in the micro-pores can be calculated by Equation (10), which is the same expression as Equation (8) except that the pore diameter is the micro-pore diameter of the crystallite. The differential term on the right side of Equation (9) is related to the mass transfer of the adsorbed phase in the crystallite that also occurs due to the effect of the gradient of the adsorbed gas concentration, and is the so-called surface diffusion, which is expressed as the differential of the adsorbed gas amount against the displacement in the crystallite.
Table 4 shows the calculation conditions. As the focus here is the gas phase diffusion in the early stage of adsorption in the fresh adsorbent, only the first term of the right side of Equation (9) was considered in the following calculation. The surface area per unit volume av was estimated from the packing density of the adsorbent and the average pellet shape having a representative volume and surface area. The crystallite diameter was defined to be 5 μm from the appearance in the SEM image in Figure 9. The macro-pore diameter was the measured value in Table 2. The micro-pore diameter of 0.735 nm is the maximum pore diameter of Zeolite 13X (Faujasite) obtained from the database of zeolite structures, in which the light gas molecules are diffusible. The gas pressure of 151 kPa is the gas adsorption pressure in the CO2-PSA experiment in Table 3, which is close to result of the initial gas pressure in the gas adsorption rate measurement in Figure 7. The temperature of the adsorbent was assumed to be constant at 298.15 K. In the laboratory-scale measurement of CO2 adsorption rate in Figure 5, the constant temperature was achieved by using a thermostat, though some degrees of temperature increase by the gas adsorption heat could possibly occur at the local adsorption site. The total porosity inside a pellet was measured previously by a water immersion test in which the total pore volume was quantified as the water volume added to an adsorbent packed bed in a glass column. Table 5 shows the calculated gas diffusion coefficients D which were obtained as common values for both the d = 1.5 mm smaller pellet and the d = 3.0 mm larger pellet. The Knudsen gas diffusion coefficient in the macro-pores of the pellet Dkp is larger than the gas molecular diffusion coefficient Dm, which means that the size of the macro-pores inside the pellet is large enough to consider the gas diffusion inside the macro-pores as bulk phase diffusion. The Knudsen gas diffusion coefficient in the micro-pores of the crystallite Dkc, on the other hand, is much smaller than Dm, which means that the gas diffusion inside the micro-pores is substantially Knudsen diffusion due to the smaller pore size against the mean free path of the gas molecules. Table 6 shows the volumetric mass transfer coefficients K calculated for both adsorbent pellets. The volumetric mass transfer coefficient in the macro-pores of the pellet K2 is the smallest among K1, K2, and K3 in both cases, meaning that the gas diffusion in the macro-pores is the rate-determining process in the gas phase. In the experimental results in Figure 8, the initial values of K′CO2 were nearly equal to the K′CO2_calc in Table 6, which means that the gas diffusion in the macro-pores is the most dominant process in the early stage of gas adsorption. However, the values of K′CO2 in Figure 8 decreased rapidly after 10 s. It was estimated that the diffusion of the adsorbed phase, which can be described as surface diffusion inside the micro-pores in the crystallite in Equation (9), becomes more prominent than gas phase diffusion as adsorption proceeds. The volumetric mass transfer coefficients of surface diffusion were estimated to be about 0.5 from the converged value in Figure 8. In the CO2-PSA experiments introduced above, the total gas adsorption time including both the gas adsorption step and the rinse step was 200 s in one cycle. This time was much longer than the initial gas diffusion time when the effect of the pellet size was prominent. Therefore, surface diffusion was expected to be the most dominant process for CO2 adsorption in CO2-PSA with the Zeolite 13X adsorbent. The similarity of the performance of the adsorbents with various shapes in the laboratory-scale CO2-PSA in Figure 6 is considered to be a clear verification of this gas adsorption mechanism.

Table 4.
Calculation conditions.

Table 5.
Results of calculations (Diffusion coefficients).

Table 6.
Results of calculations (Mass transfer coefficients).
4. Pilot Scale CO2-PSA Experiment
4.1. Reduction of Power Consumption by Effect of Adsorbent Shape
When designing a large-scale PSA plant, the pressure loss inside the adsorber is significantly important, especially in cases where an enormous volume of the gas is to be handled. In the laboratory-scale CO2-PSA experiment introduced above, the effect of the shape of adsorbent pellet was negligibly small owing to the higher gas diffusion rate into the pellet. However, large-scale adsorbers have a much higher adsorbent packing height than that of the laboratory-scale PSA, and as a result, the pressure loss inside the adsorber affects the performance of PSA more significantly. Figure 10a shows schematic images of the estimated pressure loss reduction due to the effect of the adsorbent pellet shape. The small-sized pellet causes frequent distortion of the gas flow path when the gas passes through the adsorbent bed. With the same packing height, the gas distortion frequency can be mitigated by using larger size pellets. The graph in Figure 10b shows the relationship between the suction pressure and the electric power consumption of a Roots type dry pump estimated from the performance curve. In operation at the lower suction pressure, the electric power consumption of the vacuum pump surges significantly due to the lower efficiency caused by leakage of part of the delivery side gas to the entry side in the pump unit. Therefore, the optimum design of the desorption pressure in the PSA operation cycle is critically important for reducing total power consumption.
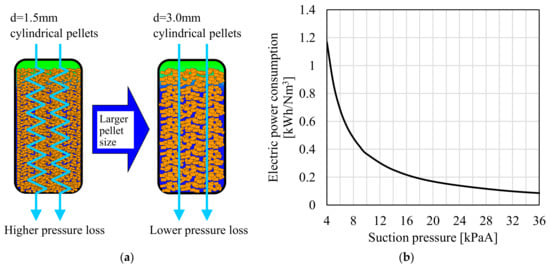
Figure 10.
Reduction of electric power consumption of vacuum pump by using larger size adsorbent pellets. ((a) Schematic image of pressure loss reduction inside adsorber; (b) Relationship between suction pressure and electric power consumption of vacuum pump estimated from performance curve).
4.2. CO2-PSA Pilot Tests
In order to evaluate the effect of the shape of the adsorbent pellets on actual power consumption, pilot-scale CO2-PSA tests were conducted with both the d = 1.5 mm smaller adsorbent pellets and the d = 3.0 mm larger adsorbent pellets. Figure 11 shows the exterior of the CO2-PSA pilot plant called “ASCOA-3” (Advanced Separation system by Carbon Oxide Adsorption, plant capacity: >3 t-CO2/day), which was constructed at JFE Steel Corporation, West Japan Works. This pilot plant was constructed close to the header pipe of the blast furnace gas in a steel mill. Figure 12 shows the process flow diagram of ASCOA-3. The blast furnace gas was branched from the header pipe and provided as a feed gas for the CO2-PSA process. The feed gas was sent to a compressor by a gas blower and was compressed by the compressor to enhance the adsorption pressure for higher CO2 loading. The moisture in the feed gas was removed by a dehumidifier packed with water-adsorbent silica-gel pellets. The water-adsorbent pellets in the dehumidifier were regenerated before starting operation by flowing heated N2 gas through the adsorbent bed. A desulphurizer was installed in the following line, but it was not used in ordinary operation because of the negligibly small effect of the sulfide gases on the performance of the CO2 adsorbent. The CO2-PSA at the lower left in Figure 12 consists of three adsorbers, a vacuum pump and a large number of automatic gas valves, which are used to change the gas flow directions in cyclic PSA operation (omitted for simplicity).
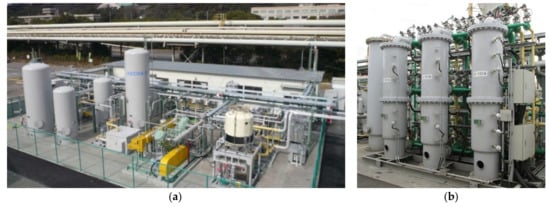
Figure 11.
Exterior of CO2-PSA pilot plant “ASCOA-3” [5] [Advanced Separation system by Carbon Oxide Adsorption, plant capacity: >3 t-CO2/day] ((a) Bird’s-eye view of plant; (b) Adsorbers (3 towers)).
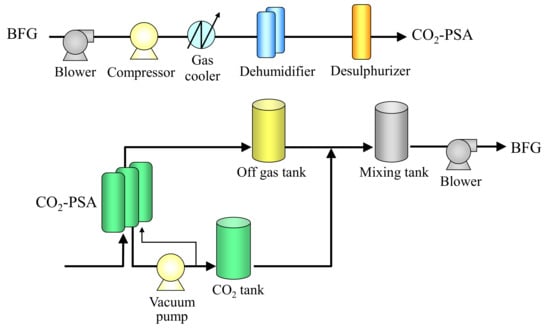
Figure 12.
Process flow diagram of ASCOA-3.
The height of the adsorber was designed to be 1.5 m, which was decided considering the estimated adsorber size of the industrial-scale plant. For stable operation, the gas flow rate was controlled by gas flow control valves. Some gas sampling lines were attached to the gas pipelines to send the collected gas directly to the measuring instruments (gas chromatography, IR, and dew-point recorder) during PSA operation. The vacuum pump was a Root type dry pump consisting of three units in series. The power of the vacuum pump was controlled by changing the frequency of the invertor to maintain the target gas desorption pressure. Both the CO2 tank and the off-gas tank were installed subsequently to store a certain amount of gases. These tanks also have gas sampling lines to measure the gas compositions for calculation of the gas balance. The gases in these tanks were collected in the mixing tank and sent back to the BFG header pipe. The utilities required for operation of the plant (e.g., cooling water for vacuum pump operation, compressed air for valve position change, etc.) were provided individually from the utility lines in the steel works. The whole system was controlled by a distributed control system (DCS) in a control room for fully automatic operation. The measurements of both the gas composition and the gas dew point were also carried out automatically, and these data were transferred to the DCS with no delay to check the validity of the operating conditions. Table 7 shows the plant specifications of ASCOA-3. This plant was originally designed with the total throughput of 3 t-CO2/day. After increasing the height of the adsorber from 1.2 to 1.5 m by plant modification work, the total throughput has actually reached 5 t-CO2/day in current operation.

Table 7.
ASCOA-3 plant specifications.
To prepare for the pilot tests, fresh adsorbent pellets were inserted into the adsorbers. A wire net and a perforated plate were initially placed at the bottom of the adsorber to support the adsorbent pellets after packing. After inserting 240 kg of adsorbent pellets in each adsorber, the packing density was calculated by dividing the weight of the packed adsorbent pellets by the measured packing volume. Figure 13 shows the appearance of the adsorbent pellets, together with scales indicating their sizes. Table 8 shows the measured size of the adsorbent pellets for 50 randomly selected pellets and their measured packing densities. The d = 3.0 mm larger adsorbent pellet has a smaller aspect ratio L/d than that of the d = 1.5 mm smaller ones. However, the results in Table 8 show that the effect of the shape difference on the packing densities of these adsorbent pellets were negligibly small. There are many reports on investigations of the packing densities of solid particles having size differences based various measurement methods or DEM packing simulations [30,31,32]. The size difference of the particles and its distribution generally cause some increase in the packing density owing to the effect of increased volumetric occupancy by smaller particles. The measured packing density in Table 8 shows that the size difference of these two types of adsorbent pellets is small enough to avoid a change of packing density, meaning that the adsorber size remains stable if the d = 3.0 mm larger adsorbent pellets are packed instead of the d = 1.5 mm smaller ones. The crushing strengths of the pellets were measured with a grain rigidity digital tester (WPFHT-20N, Shiro Industry Co., Osaka, Japan). The value was the average of the measured crushing load of 25 randomly selected samples. The crushing strength of the d = 3.0 mm larger pellet was about 2 times higher than that of the d = 1.5 mm smaller pellet, which was sufficient for practical utilization in a large-scale PSA process. After packing the adsorbent pellets in each adsorber, another wire net and ceramic balls were placed on the top of the adsorbent packed bed with the aims of both reducing the dead volume and preventing pellet fluidization during PSA operation.
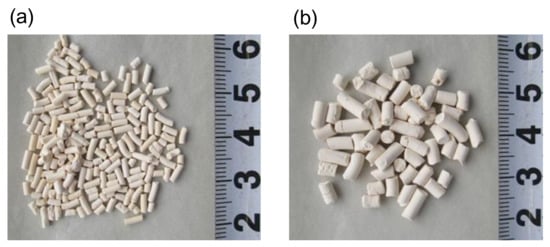
Figure 13.
Appearance of Zeolite 13X adsorbent pellets ((a) d = 1.5 mm; (b) d = 3.0 mm.).

Table 8.
Measured adsorbent pellet size, bulk density, and crushing strength.
Table 9 shows the operating conditions of the ASCOA-3 pilot-scale tests. The adsorbent pellets with the two shapes shown in Figure 13 and properties shown in Table 8 were used in these tests. The feed gas flow rate was controlled automatically by a flow-controlling valve placed at the inlet gas pipe of the PSA adsorbers. The dew point of the feed gas was kept below 213 K by using a dehumidifier that had been regenerated previously by flowing heated N2 gas. The pressure inside the adsorber was measured by a pressure gauge placed at the bottom of the adsorber. In both Case 1 and Case 2 operation, the desorption pressures were controlled by arranging the vacuum pump loading schedule to achieve the target CO2 recovery rate of 4.7 t-CO2/day. The adsorption pressure was set to be 151 kPaA by using a backpressure valve installed in the PSA off-gas line. In both cases, the gas flow rate, the gas composition, the gas pressure, and the vacuum pump power consumption, which accounts for more than half of the total power consumption of CO2-PSA, were measured. Figure 14 shows the operation pattern of the three adsorbers of ASCOA-3 in the pilot-scale tests. The procedure in each step of one PSA cycle is shown in abbreviated form. (The meanings of these abbreviations are shown at the bottom of the figure). The operation was fully controlled by automatic valves installed in the gas lines of each adsorber. The valve opening and closing patterns were set to be the same for all three adsorbers in the staggered parallel operation in the PSA cycle.

Table 9.
Operating conditions of ASCOA-3 pilot-scale tests.
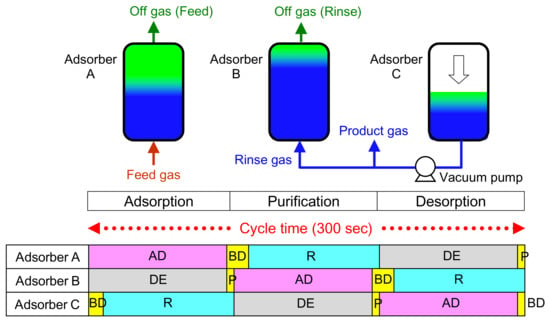
Figure 14.
Operation pattern of three adsorbers of ASCOA-3 in pilot-scale tests.
Figure 15 shows the measured pressure inside the adsorber during the CO2-PSA cycle in the ASCOA-3 pilot tests. In each graph, the dotted line shows the pressure at the top of the adsorber, and the solid line shows the pressure at the bottom of the adsorber. The time range illustrated by the bidirectional arrow is one cycle of CO2-PSA. Figure 15a shows the results with the d = 1.5 mm smaller adsorbent pellets (Case 1), and Figure 15b shows the results with the d = 3.0 mm larger adsorbent pellets (Case 2). Due to the effect of the pellet size difference, the gap between the dotted line and the solid line became smaller in Case 2 compared to Case 1. This pressure gap was observed in both the gas adsorption step in the positive pressure range and in the gas desorption step in the negative pressure range. Because the electric power consumption of the vacuum pump is the most cost-intensive factor in these cases, the pressure gap and the minimum desorption pressure in the gas desorption step substantially decide the efficiency of this process.
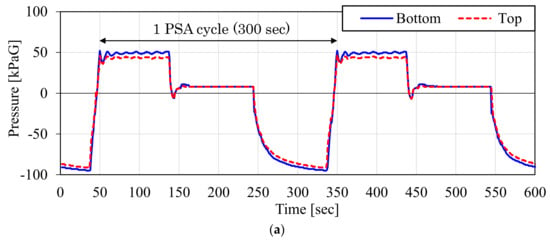
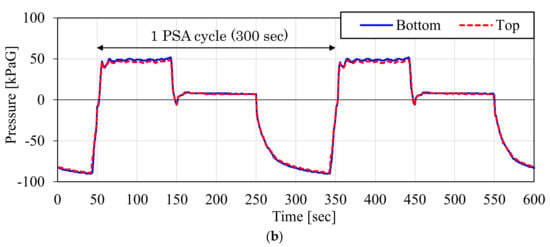
Figure 15.
Measured gas pressure variation inside adsorber during one CO2-PSA cycle in ASCOA-3 pilot tests ((a) Case 1, d = 1.5 mm adsorbent pellets; (b) Case 2, d = 3.0 mm adsorbent pellets).
Figure 16 shows the same graph with an amplified scale for the gas desorption step. The unit of the vertical axis was converted to the absolute scale to clarify the pressure achievement. The step-wise shape of these lines is due to the effect of the resolution of the power gauge output. The pressure loss in the adsorber can be evaluated from the gap between the dotted line and the solid line in each graph. As is clearly apparent here, the pressure loss decreased significantly in the test with the larger adsorbent pellets.
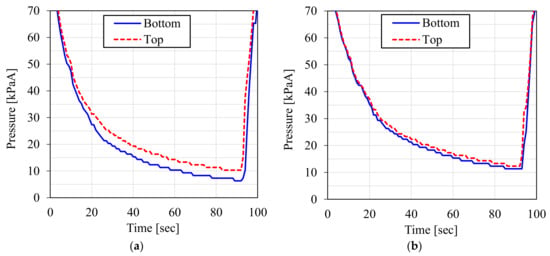
Figure 16.
Measured gas pressure inside adsorber during gas desorption step in ASCOA-3 pilot tests ((a) Case 1, d = 1.5 mm adsorbent pellets; (b) Case 2, d = 3.0 mm adsorbent pellets).
Figure 17 shows the measured CO2 recovery rate and the vacuum pump power consumption per unit CO2 amount in the ASCOA-3 pilot tests. The CO2 recovery rates of the two cases were almost equal owing to the power control of the vacuum pump. However, the vacuum pump power consumption decreased significantly in Case 2 operation in comparison with Case 1 operation. The pressure loss inside the adsorber generally creates a pressure distribution inside the adsorbent bed, and as a result, an excessively lower pressure is required during the gas desorption step in order to achieve the target CO2 recovery rate. According to the performance curve of the vacuum pump in Figure 10, the efficiency of the vacuum pump is improved by increasing the suction pressure. The reduction in vacuum pump power consumption is estimated to be achieved by the effect of the increase of the minimum gas desorption pressure from 6 to 10 kPaA observed in Figure 16. The durability of Zeolite 13X adsorbent under the same feed gas condition was already verified by a pilot-scale CO2-PSA operation in our previous work [5], and therefore, the superior performance of the larger size adsorbent is expected to gives us a great advantage for a long term operation of CO2-PSA.
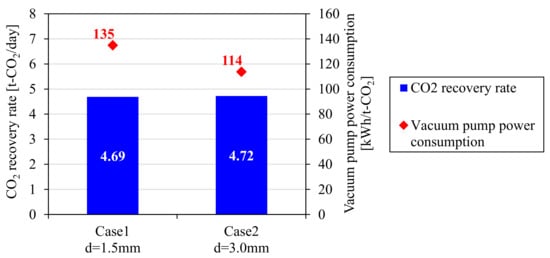
Figure 17.
Measured CO2 recovery rate and vacuum pump power consumption in ASCOA-3 pilot tests.
5. Conclusions
The effect of adsorbent pellet size on CO2-PSA performance was discussed in this work. Laboratory-scale experiments were conducted with a 3 tower-type CO2-PSA with Zeolite 13X adsorbents of four different shapes under the same PSA operating conditions. As a result, the measured CO2 recovery rates in all four cases were almost equal in spite of the large difference of the pellet external surface ratio. From these results, under the laboratory conditions, the gas diffusion rate when the gas passes through the macro-pores of the adsorbent pellet was estimated to be high enough to diminish the effect of the difference in the pellets’ external shapes. Gas adsorption rate measurements were also conducted at the laboratory scale. From the time variation of the volumetric mass transfer coefficient calculated from the measured gas pressure, the pellet size effect appeared only within a few seconds in the early stage of adsorption, and then diminished to a negligible level. The gas adsorption rate in the later stage of adsorption seemed to be governed mainly by the diffusion of the adsorbed phase inside the crystallite, especially when the adsorption time was sufficiently long. The performance of a pilot-scale CO2-PSA plant with the d = 3.0 mm larger adsorbent pellets was also evaluated in pilot tests and was compared with the performance obtained with the d = 1.5 mm smaller adsorbent pellets. Although the pressure loss inside the adsorber was negligible in the laboratory-scale CO2-PSA, pressure loss increased significantly with the height of the adsorbent bed in the tests at the pilot scale. In CO2-PSA pilot tests conducted with the same CO2 recovery rate, the power consumption of the vacuum pump, which accounts for more than half of the running cost, was reduced from 135 kWh/t-CO2 with the d = 1.5 mm smaller pellets to 114 kWh/t-CO2 with the d = 3.0 mm larger adsorbent pellets, achieving a 15% reduction, owing to the reduced pressure loss inside the adsorber during the gas desorption step.
Acknowledgment
This article is based on results obtained from the “Development of technologies for environmentally harmonized steelmaking process, ‘COURSE50’” project commissioned by the New Energy and Industrial Technology Development Organization (NEDO).
Author Contributions
Nobuyuki Shigaki conducted the data analysis and the pilot-scale CO2-PSA experiments and wrote this article; Takashi Haraoka performed the laboratory-scale experiments; Yasuhiro Mogi assisted the pilot-scale CO2-PSA experiments.; Ikuhiro Sumi supervised the entire project and approved this article.
Conflicts of Interest
The authors declare no conflict of interest.
Nomenclature
| q | Adsorbed gas amount per unit adsorbent weight (g/g) |
| t | Time (s) |
| γ | Packing density of adsorbents (g/m3) |
| KF | Overall mass transfer coefficient (m/s) |
| aV | Surface area per unit volume (m2/m3) |
| c | Gas concentration (g/m3) |
| c* | Equivalent gas concentration (g/m3) |
| K′ | Overall volumetric mass transfer coefficient (1/s) |
| K1 | Volumetric mass transfer coefficient in outer layer of pellet (1/s) |
| K2 | Volumetric mass transfer coefficient in macro-pore of pellet (1/s) |
| K3 | Volumetric mass transfer coefficient in micro-pore of crystallite (1/s) |
| b | Correction factor |
| kF | Mass transfer coefficient in outer layer of pellet (m/s) |
| Sc | Schmidt number |
| Re | Reynolds number |
| μ | Gas viscosity (Pa·S) |
| ρ | Gas density (kg/m3) |
| u | Gas superficial velocity (m/s) |
| Dm | Gas molecular diffusion coefficient (m2/s) |
| T | Temperature (K) |
| Mi | Molecular weight (K) |
| P | Pressure (atm) |
| σ12 | Collision diameter (Å) |
| ΩD | Collision integral |
| R | Gas constant (J/mol K) |
| Dep | Effective diffusion coefficient in macro-pore of pellet (m2/s) |
| Dkp | Knudsen diffusion coefficient in macro-pore of pellet (m2/s) |
| Dec | Effective diffusion coefficient in micro-pore of crystallite (m2/s) |
| Dkc | Knudsen diffusion coefficient in micro-pore of crystallite (m2/s) |
| dp | Adsorbent pellet diameter (m) |
| x | Crystallite diameter (m) |
| εp | Marco-pore porosity inside pellet |
| εc | Micro-pore porosity inside crystallite |
| τp | Tortuosity factor inside pellet |
| τc | Tortuosity factor inside crystallite |
| dmacro | Macro-pore diameter in pellet (m) |
| dmicro | Micro-pore diameter in crystallite (m) |
| Subscripts | |
| p | Pellet |
| c | Crystallite |
| macro | Macro-pore |
| micro | Micro-pore |
| i | Gas species |
References
- Miwa, T.; Okuda, H. CO2 Ultimate Reduction in Steelmaking Process by Innovative Technology for Cool Earth 50 (COURSE50). J. Jpn. Inst. Energy 2010, 89, 28–35. [Google Scholar]
- Tonomura, S. Outline of Course 50. Energy Procedia 2013, 37, 7160–7167. [Google Scholar] [CrossRef]
- Ujisawa, Y.; Tonomura, S.; Ishiwata, N.; Nabeshima, Y.; Saito, K. CO2 breakthrough program by COURSE50 in Japanese steel industry sector. In Energy Technology Roadmaps of Japan: Future Energy Systems Based on Feasible Technologies Beyond 2030; Springer: Berlin, Germany, 2016; pp. 431–439. [Google Scholar]
- Hayashi, M.; Mimura, T. Steel Industries in Japan Achieve Most Efficient Energy Cut-off Chemical Absorption Process for Carbon Dioxide Capture from Blast Furnace Gas. Energy Procedia 2013, 37, 7134–7138. [Google Scholar] [CrossRef]
- Saima, H.; Mogi, Y.; Haraoka, T. Development of PSA Technology for the Separation of Carbon Dioxide from Blast Furnace Gas. JFE Tech. Rep. 2014, 19, 133–138. [Google Scholar]
- Shigaki, N.; Tobo, H.; Ozawa, S.; Ta, Y.; Hagiwara, K. Heat Recovery Process from Packed Bed of Hot Slag Plates. ISIJ Int. 2015, 55, 2258–2265. [Google Scholar] [CrossRef]
- Shigaki, N.; Ozawa, S.; Ikuhiro, S. Effect of gas velocity distribution on heat recovery process in packed bed of plate-shaped slag. Energies 2017, 10, 755. [Google Scholar] [CrossRef]
- Goto, K.; Okabe, H.; Chowdhury, F.A.; Shimizu, S.; Fujioka, Y.; Onoda, M. Development of novel absorbents for CO2 capture from blast furnace gas. Int. J. Greenh. Gas Control 2011, 5, 1214–1219. [Google Scholar] [CrossRef]
- Chowdhury, F.A.; Okabe, H.; Shimizu, S.; Onoda, M.; Fujioka, Y. Development of novel tertiary amine absorbents for CO2 capture. Energy Procedia 2009, 1, 1241–1248. [Google Scholar] [CrossRef]
- Chowdhury, F.A.; Yamada, H.; Matsuzaki, Y.; Goto, K.; Higashii, T.; Onoda, M. Development of Novel Synthetic Amine Absorbents for CO2 capture. Energy Procedia 2014, 63, 572–579. [Google Scholar] [CrossRef]
- Chowdhury, F.A.; Goto, K.; Yamada, H.; Matsuzaki, Y.; Yamamoto, S.; Higashii, T.; Onoda, M. Results of RITE’s Advanced Liquid Absorbents Develop for Low Temperature CO2 Capture. Energy Procedia 2017, 114, 1716–1720. [Google Scholar] [CrossRef]
- Rashidi, N.A.; Yusup, S.; Borhan, A. Isotherm and Thermodynamic Analysis of Carbon Dioxide on Activated Carbon. Procedia Eng. 2016, 148, 630–637. [Google Scholar] [CrossRef]
- Hosseini, S.; Bayesti, I.; Marahel, E.; Babadi, F.E.; Abdullah, L.C.; Choong, T.S.Y. Adsorption of carbon dioxide using activated carbon impregnated with Cu promoted by zinc. J. Taiwan Inst. Chem. Eng. 2015, 52, 109–117. [Google Scholar] [CrossRef]
- Plaza, M.G.; Pevida, C.; Pis, J.J.; Rubiera, F. Evaluation of the cyclic capacity of low-cost carbon adsorbents for post-combustion CO2 capture. Energy Procedia 2011, 4, 1228–1234. [Google Scholar] [CrossRef]
- Sarker, A.I.; Aroonwilas, A.; Veawab, A. Equilibrium and Kinetic Behaviour of CO2 Adsorption onto Zeolites, Carbon Molecular Sieve and Activated Carbons. Energy Procedia 2017, 114, 2450–2459. [Google Scholar] [CrossRef]
- Mendes, P.A.P.; Ribeiro, A.M.; Gleichmann, K.; Ferreira, A.F.P.; Rodrigues, A.E. Separation of CO2/N2 on binderless 5A zeolite. J. CO2 Util. 2017, 20, 224–233. [Google Scholar] [CrossRef]
- McEwen, J.; Hayman, J.D.; Yazaydin, A.O. A comparative study of CO2, CH4 and N2 adsorption in ZIF-8, Zeolite-13X and BPL activated carbon. Chem. Phys. 2013, 412, 72–76. [Google Scholar] [CrossRef]
- Walton, K.S.; Abney, M.B.; LeVan, M.D. CO2 adsorption in Y and X zeolites modified by alkali metal cation exchange. Microporous Mesoporous Mater. 2006, 91, 78–84. [Google Scholar] [CrossRef]
- Campo, M.C.; Ribeiro, A.M.; Ferreira, A.F.P.; Santos, J.C.; Lutz, C.; Loureiro, J.M.; Rodrigues, A.E. Carbon dioxide removal for methane upgrade by a VSA process using an improved 13X zeolite. Fuel Process. Technol. 2016, 143, 185–194. [Google Scholar] [CrossRef]
- Khunpolgrang, J.; Yosantea, S.; Kongnoo, A.; Phalakornkule, C. Alternative PSA process cycle with combined vacuum regeneration and nitrogen purging for CH4/CO2 separation. Fuel 2015, 140, 171–177. [Google Scholar] [CrossRef]
- Ga, S.; Jang, H.; Lee, J.H. New Performance Indicators for Evaluation of Adsorbents for CO2 Capture with PSA processes. IFAC-PapersOnLine 2016, 49, 651–656. [Google Scholar] [CrossRef]
- Ga, S.; Jang, H.; Lee, J.H. New performance indicators for adsorbent evaluation derived from a reduced order model of an idealized PSA process for CO2 capture. Comput. Chem. Eng. 2017, 102, 188–212. [Google Scholar] [CrossRef]
- Zhang, J.; Xiao, P.; Li, G.; Webley, P.A. Effect of Flue Gas Impurities on CO2 Capture Performance from Flue Gas at Coal-fired Power Stations by Vacuum Swing Adsorption. Energy Procedia 2009, 1, 1115–1122. [Google Scholar] [CrossRef]
- Brunauer, S.; Emmett, P.H.; Teller, E. Adsorption of gases in multimolecular layers. J. Am. Chem. Soc. 1938, 60, 309–319. [Google Scholar] [CrossRef]
- Rübner, K.; Hoffmann, D. Characterization of Mineral Building Materials by Mercury Intrusion Porosimetry. Part. Part. Syst. Charact. 2006, 23, 20–28. [Google Scholar] [CrossRef]
- Yoshida, F.; Ramaswami, D.; Hougen, O.A. Temperatures and partial pressures at the surfaces of catalyst particles. AIChE J. 1962, 8, 5–11. [Google Scholar] [CrossRef]
- Ye, G.; Duan, X.; Zhu, K.; Zhou, X.; Coppens, M.O.; Yuan, W. Optimizing spatial pore-size and porosity distributions of adsorbents for enhanced adsorption and desorption performance. Chem. Eng. Sci. 2015, 132, 108–117. [Google Scholar] [CrossRef]
- Silva, J.A.C.; Schumann, K.; Rodrigues, A.E. Sorption and kinetics of CO2 and CH4 in binderless beads of 13X zeolite. Microporous Mesoporous Mater. 2012, 158, 219–228. [Google Scholar] [CrossRef]
- Sun, Z.; Tang, X.; Cheng, G. Numerical simulation for tortuosity of porous media. Microporous Mesoporous Mater. 2013, 173, 37–42. [Google Scholar] [CrossRef]
- Itoh, T.; Wanibe, Y.; Sakao, H. Analysis of Packing Density by Randomly Packed Models of Binary Powders. J. Jpn. Inst. Met. 1986, 50, 475–479. [Google Scholar] [CrossRef]
- Zhao, J.; Li, S.; Lu, P.; Meng, L.; Li, T.; Zhu, H. Shape influences on the packing density of frustums. Powder Technol. 2011, 214, 500–505. [Google Scholar] [CrossRef]
- Meng, L.; Lu, P.; Li, S.; Zhao, J.; Li, T. Shape and size effects on the packing density of binary spherocylinders. Powder Technol. 2012, 228, 284–294. [Google Scholar] [CrossRef]
© 2018 by the authors. Licensee MDPI, Basel, Switzerland. This article is an open access article distributed under the terms and conditions of the Creative Commons Attribution (CC BY) license (http://creativecommons.org/licenses/by/4.0/).


