Simulation and Experimental Study on the Optical Performance of a Fixed-Focus Fresnel Lens Solar Concentrator Using Polar-Axis Tracking


Abstract
:1. Introduction
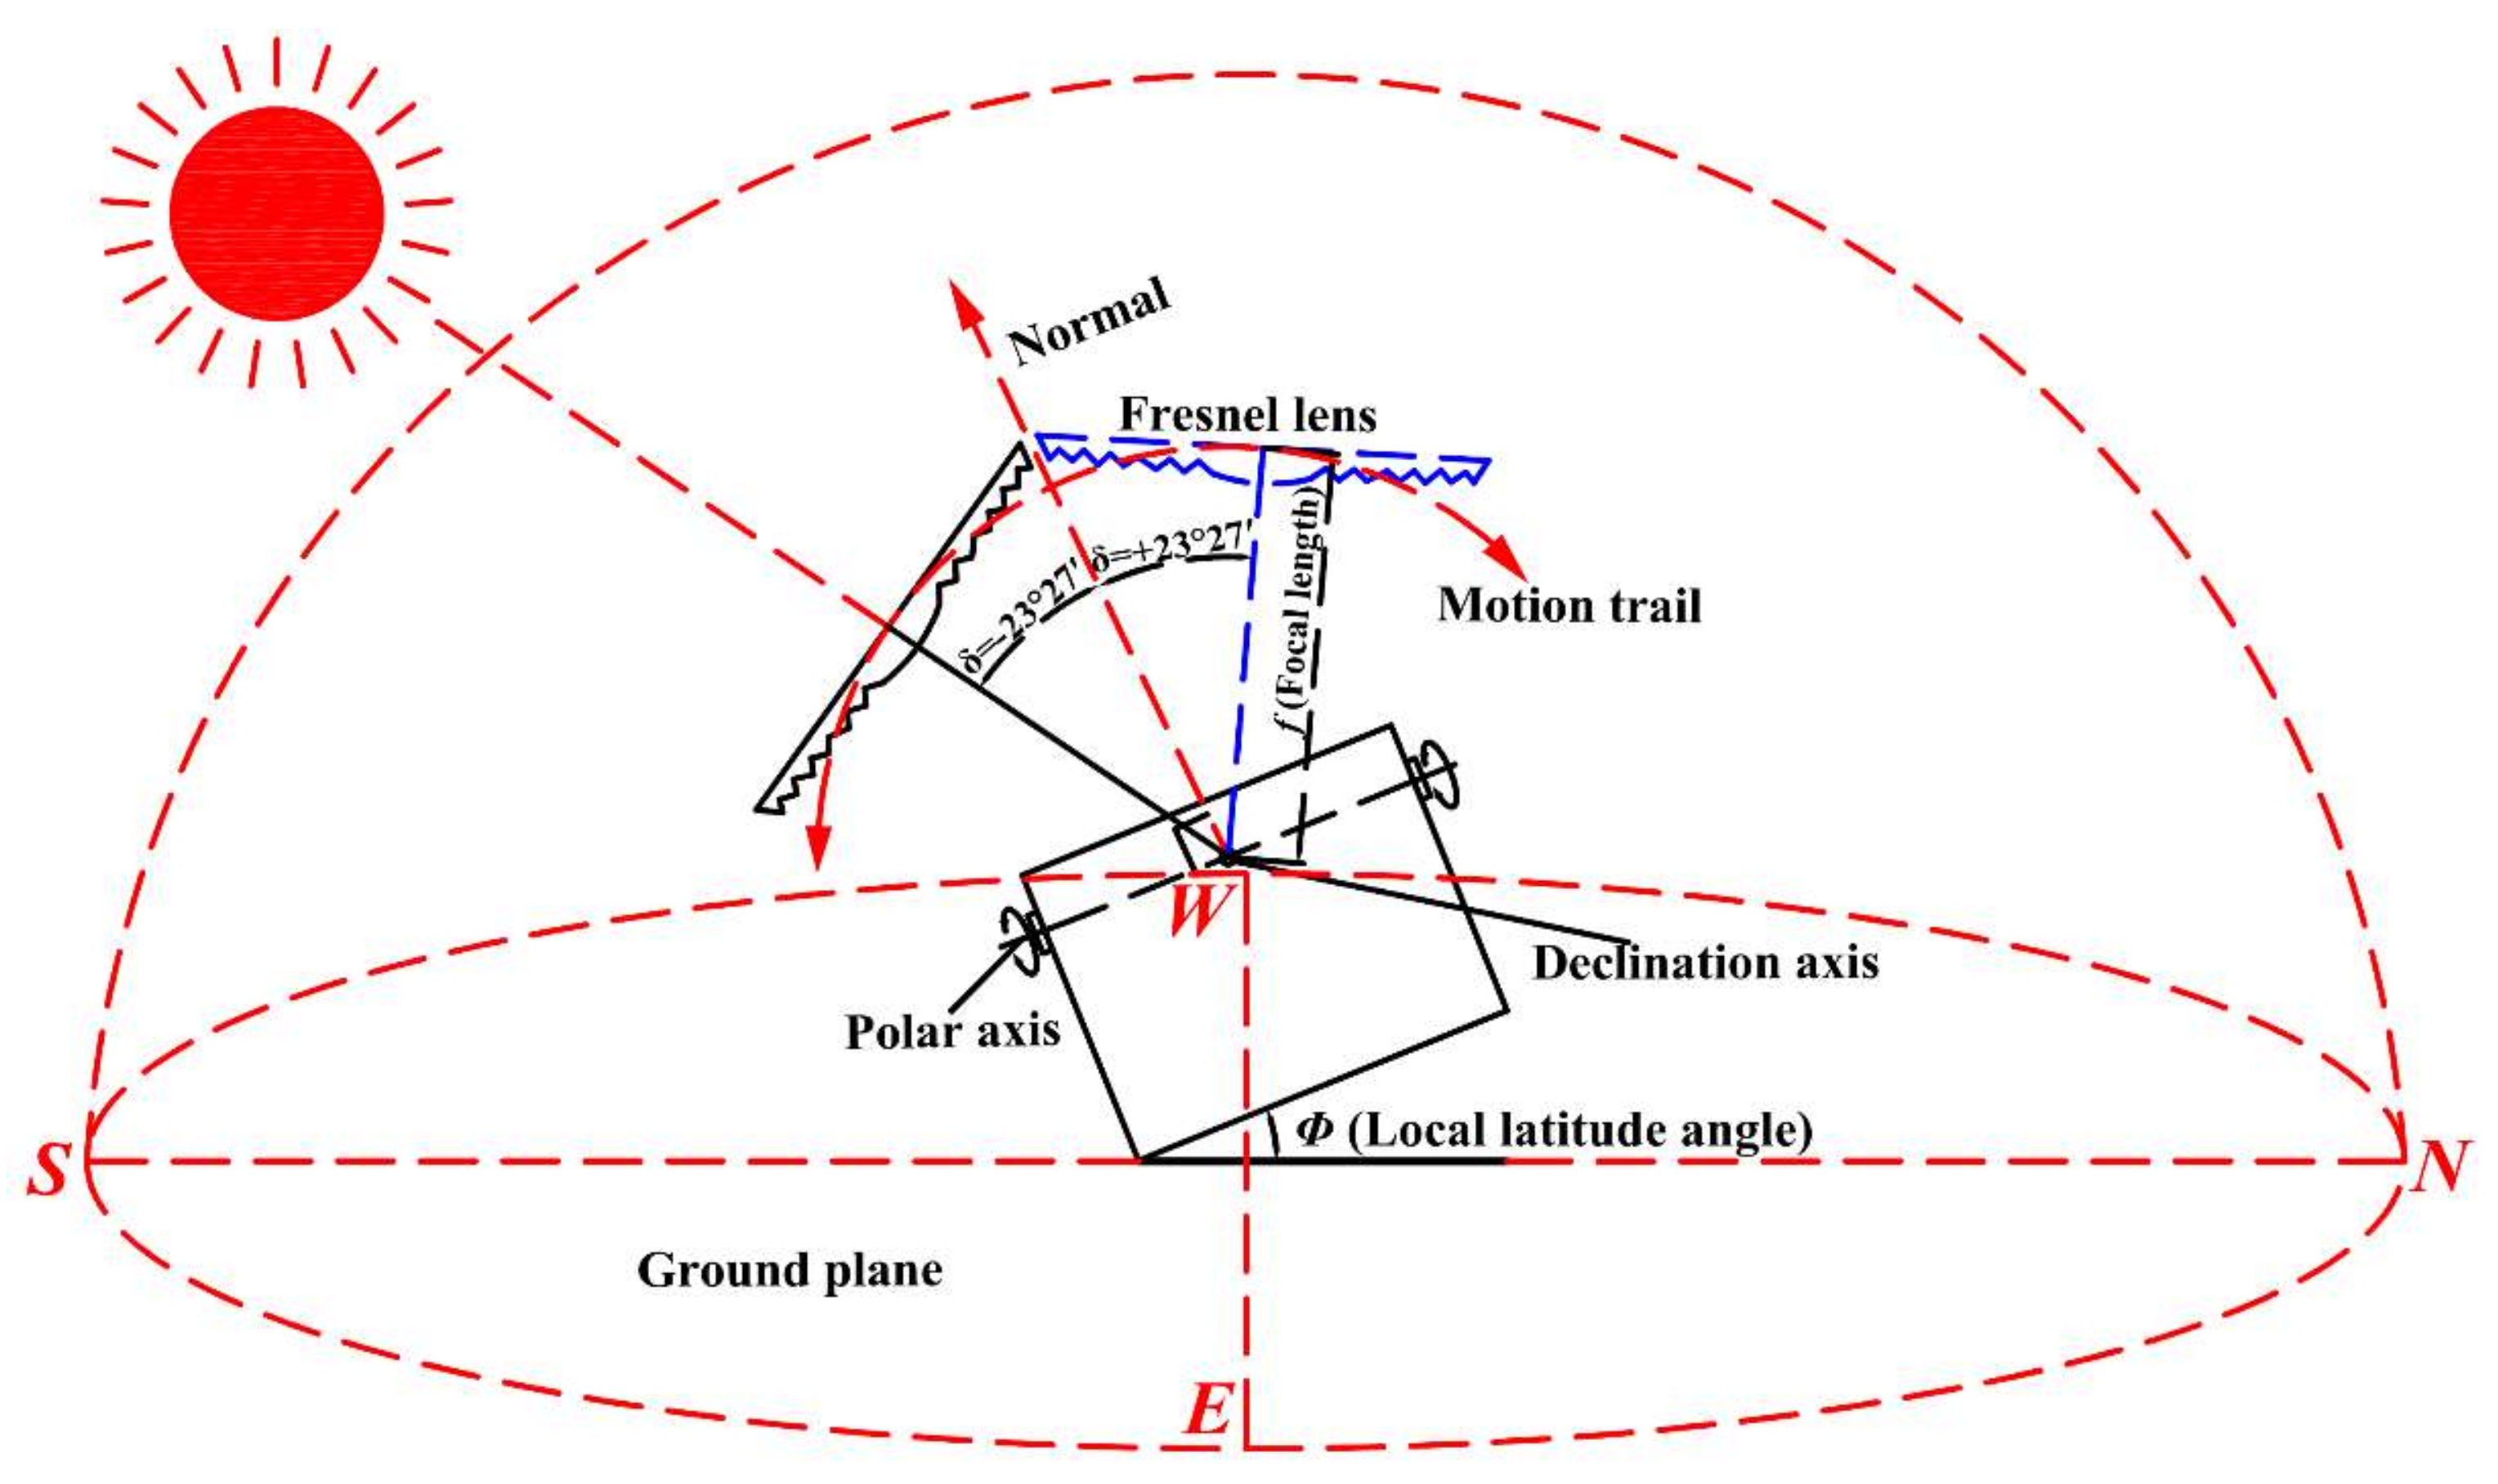
2. Working Principle of a Fixed-Focus Fresnel Lens Solar Concentrator
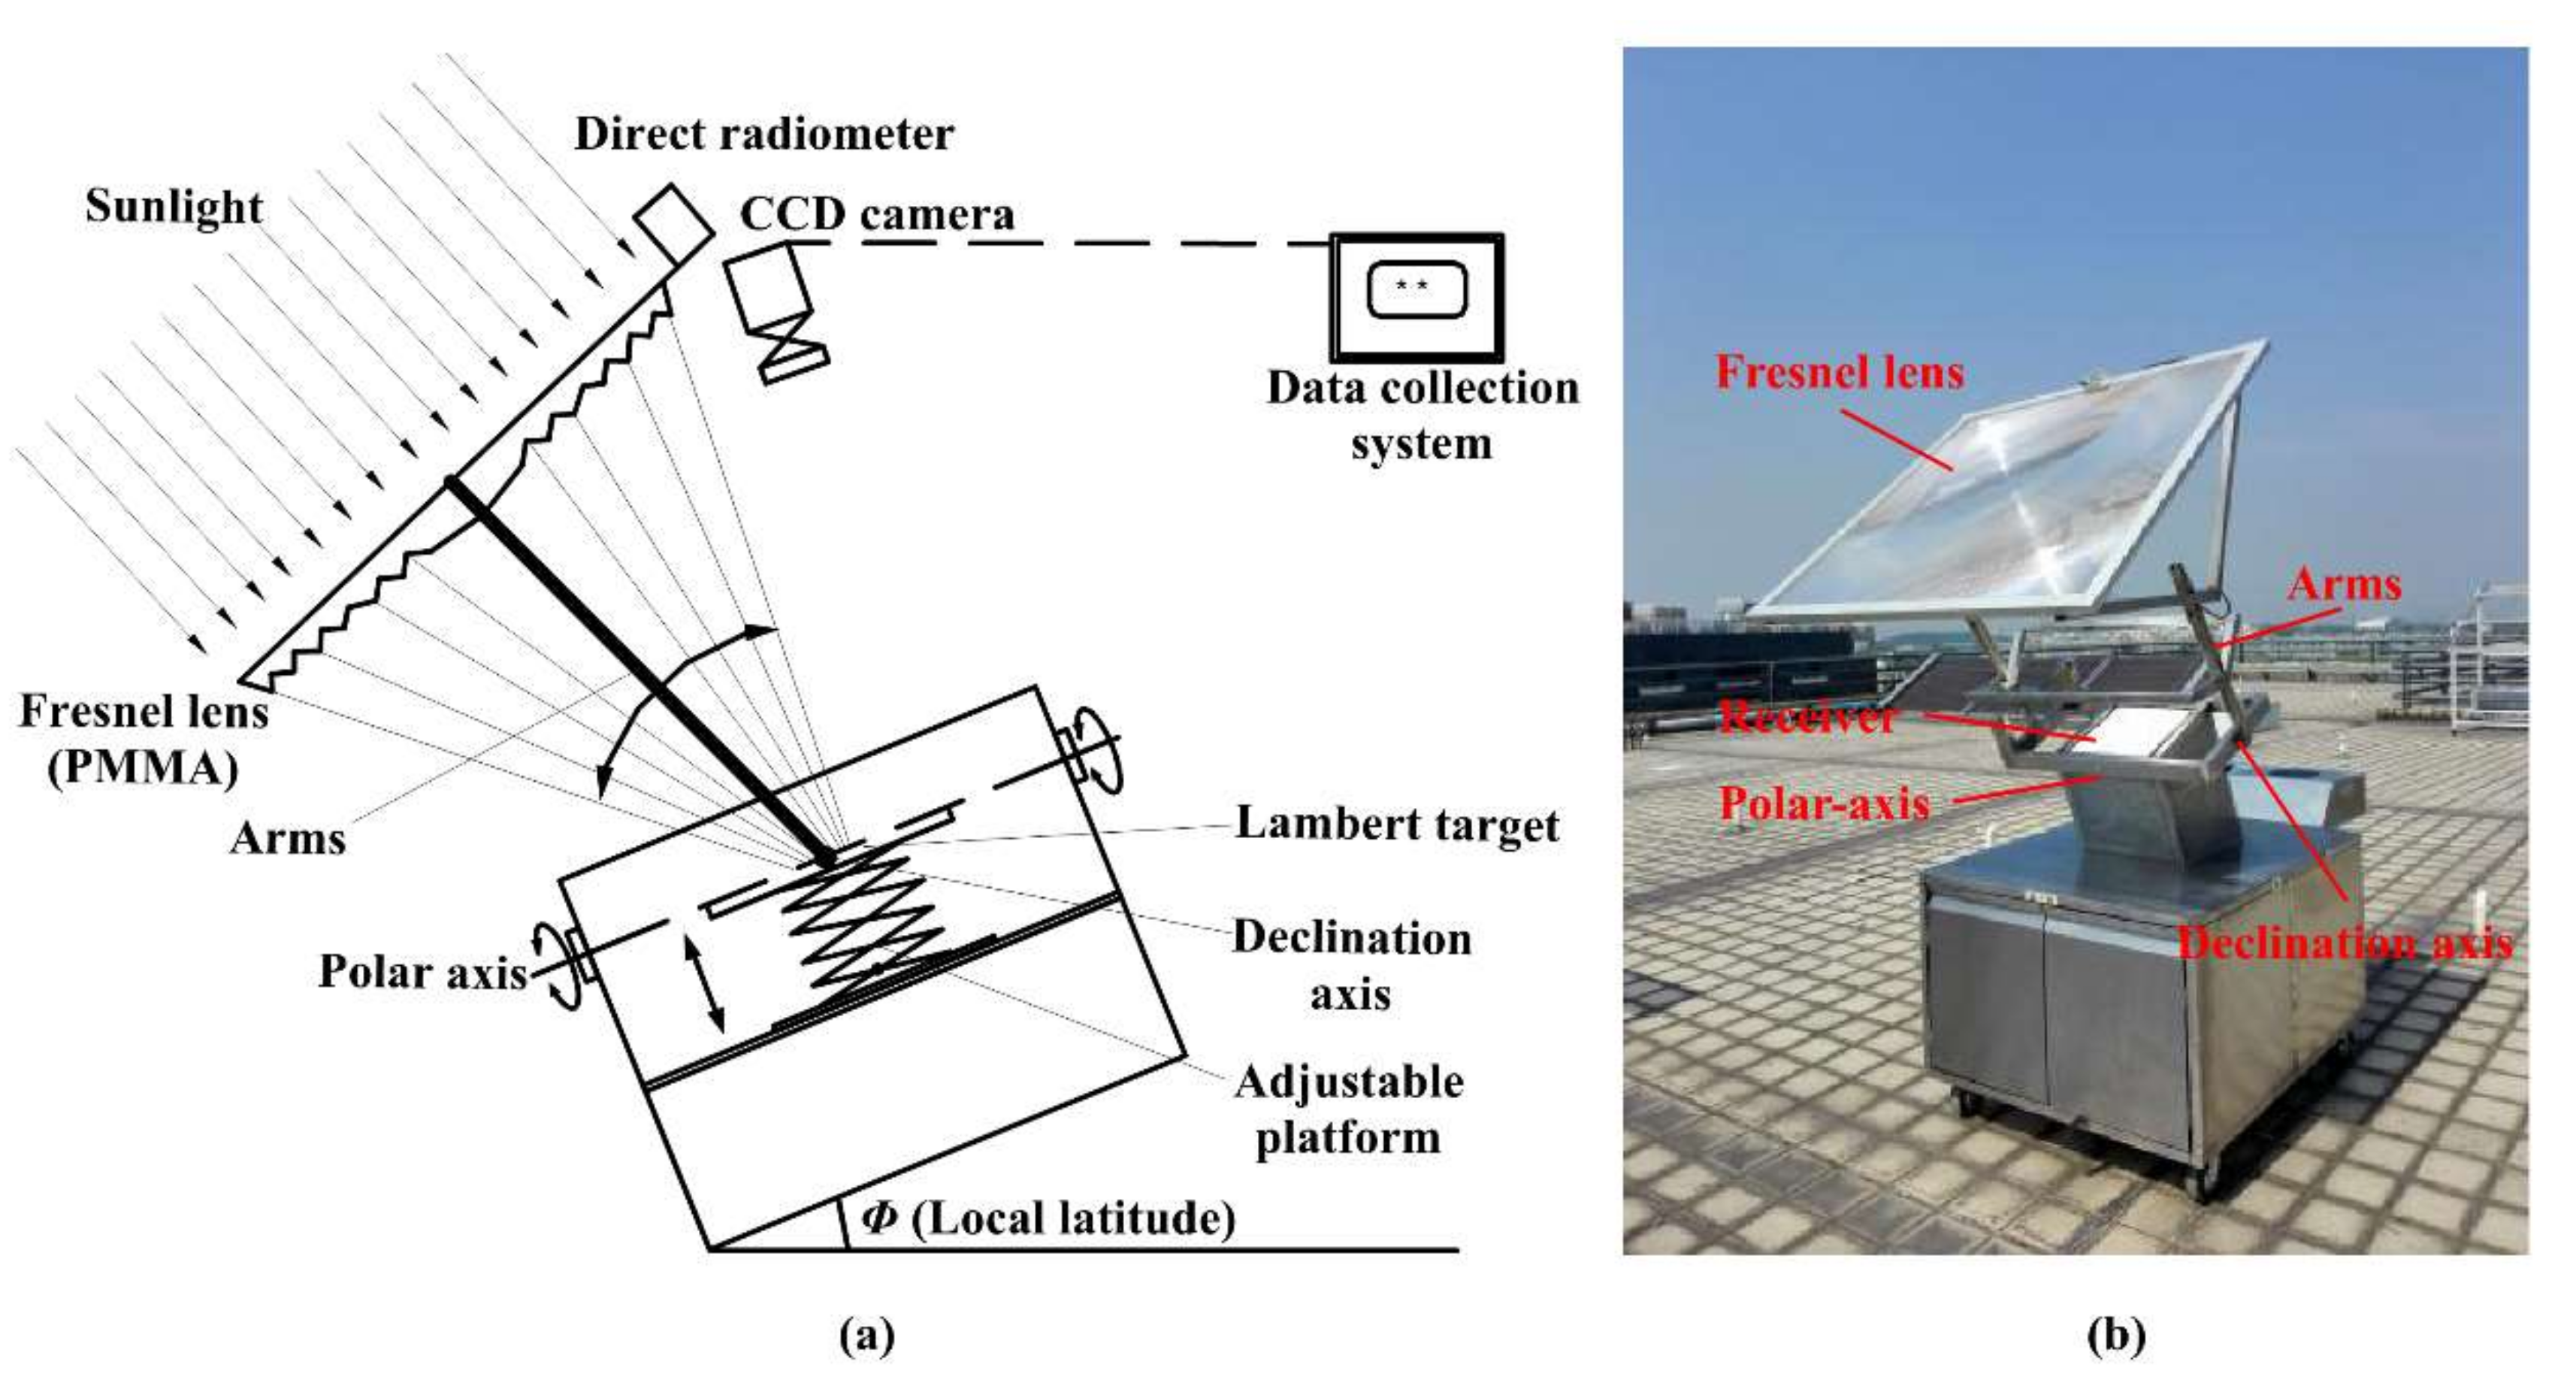
3. The Optical Experimental Analysis of a Fixed-Focus Fresnel Lens Solar Concentrator
3.1. Focal Spot Deviation
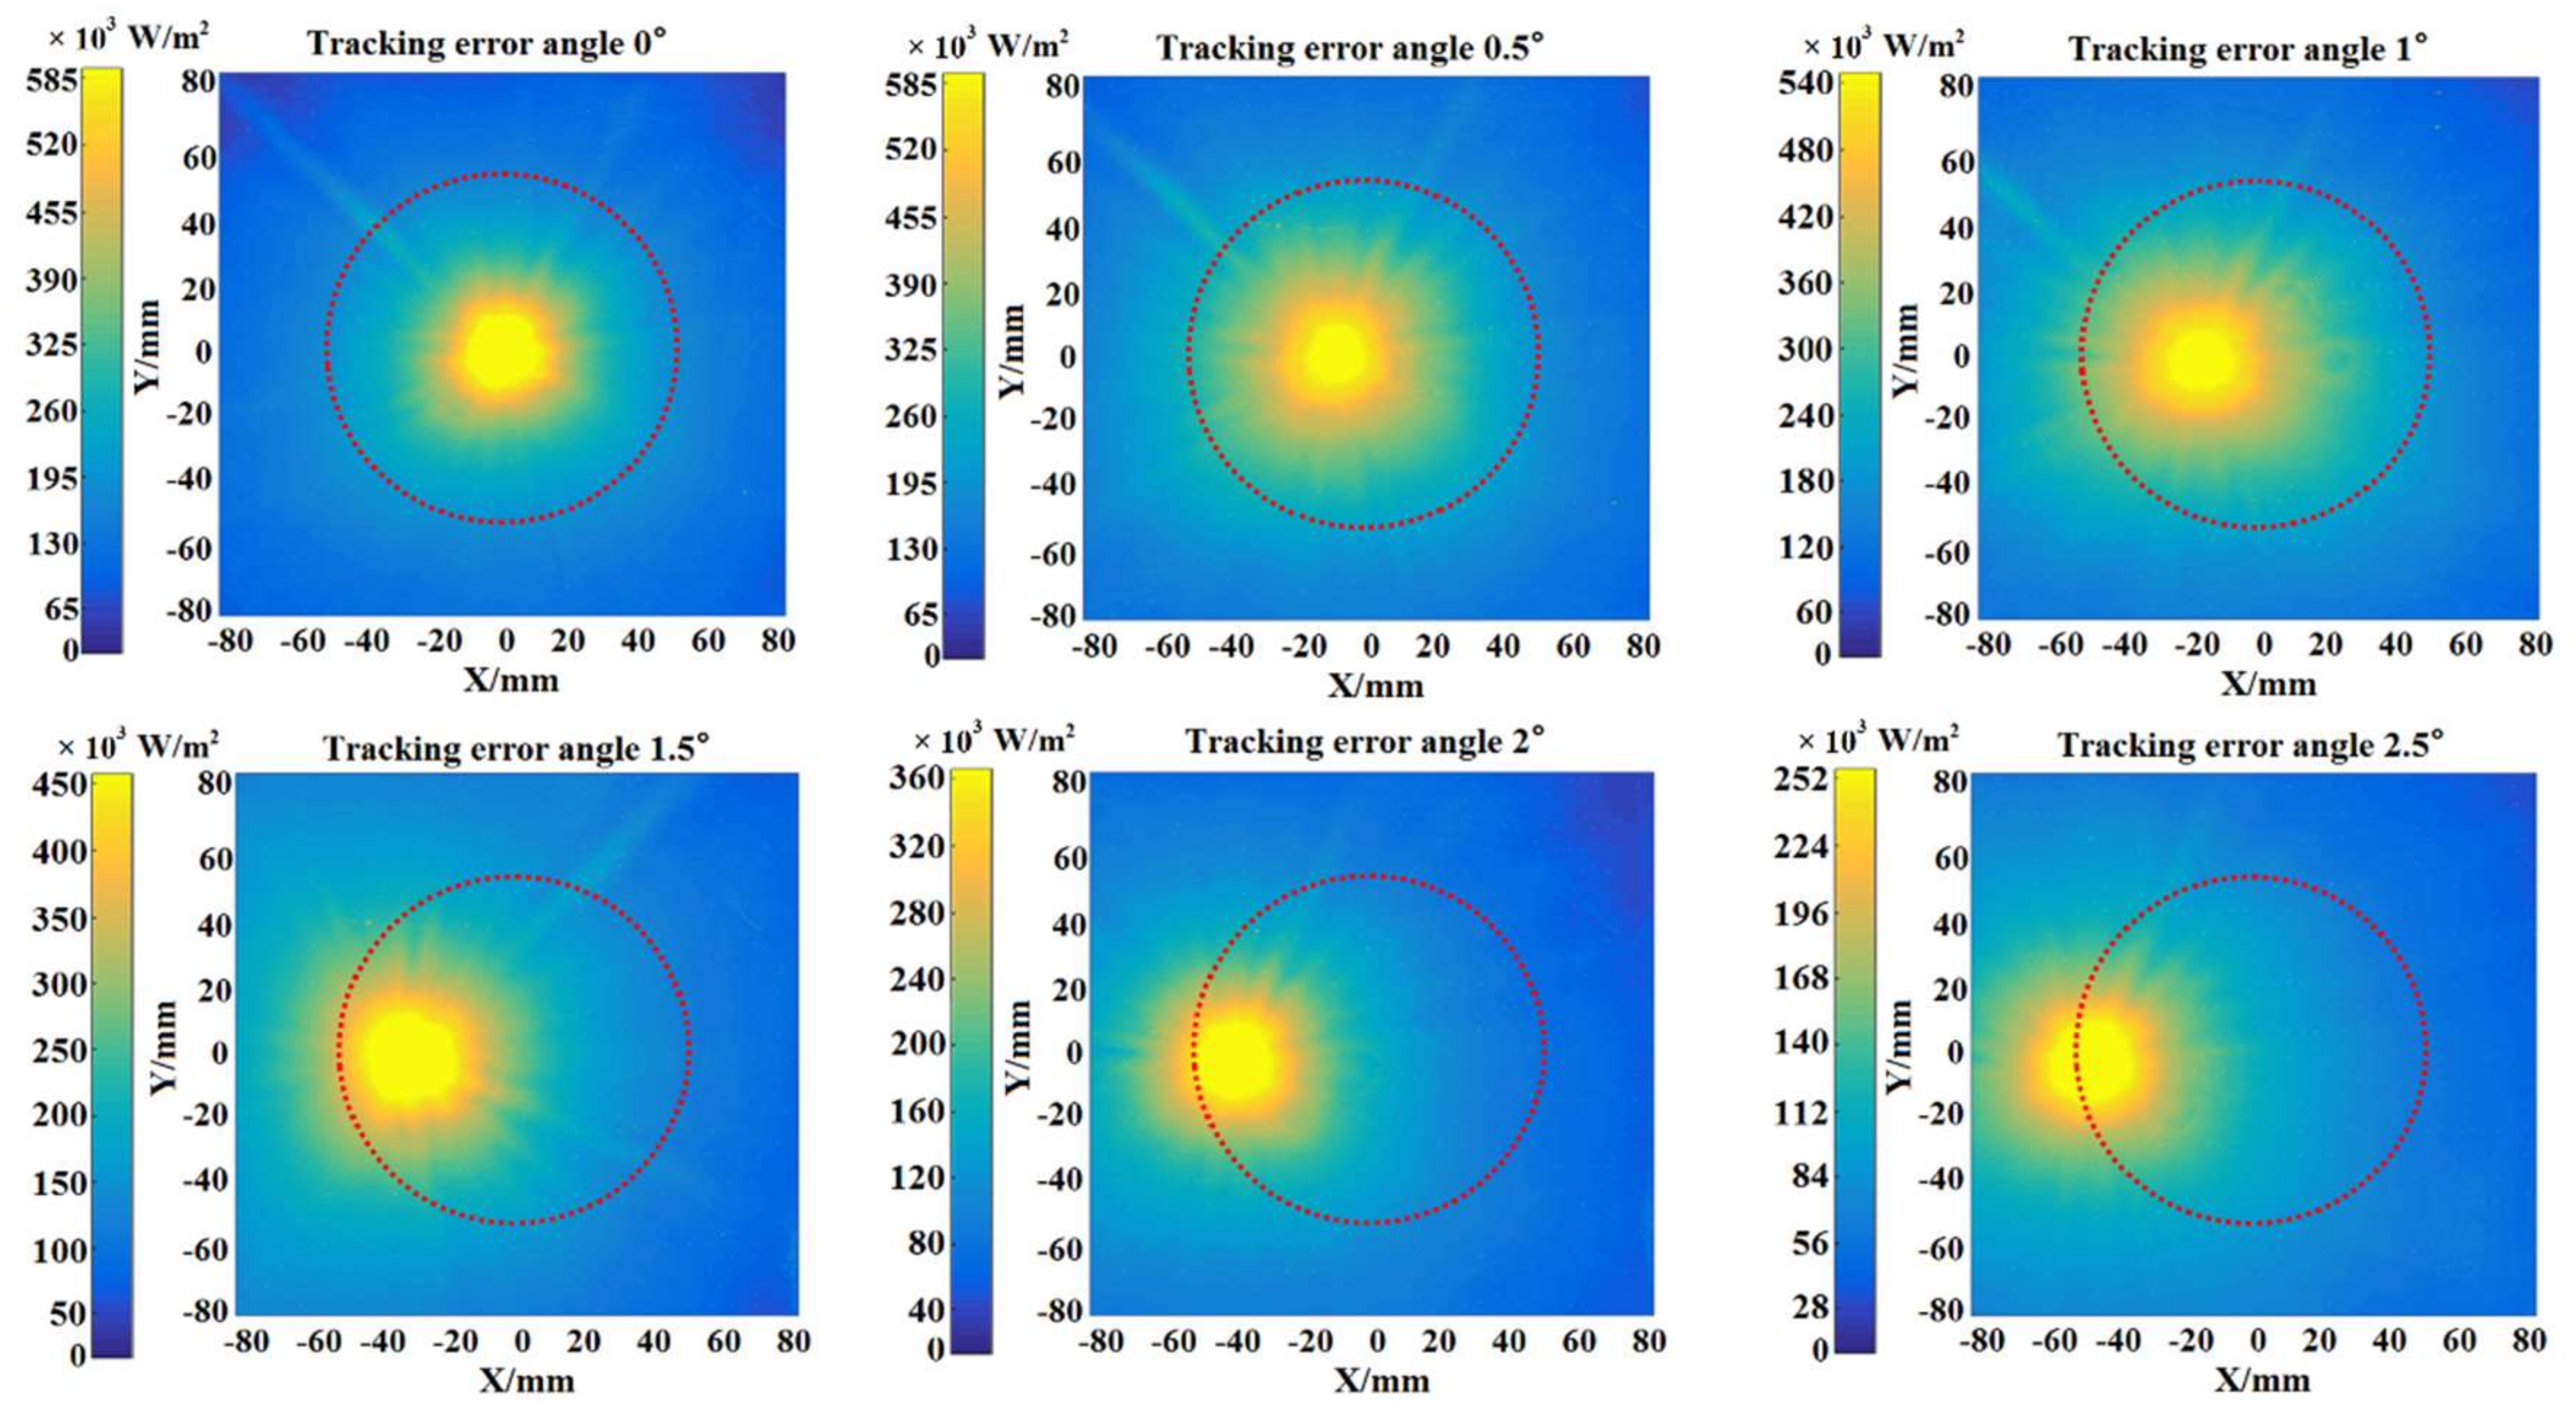
3.2. Tracking Precision Requirement
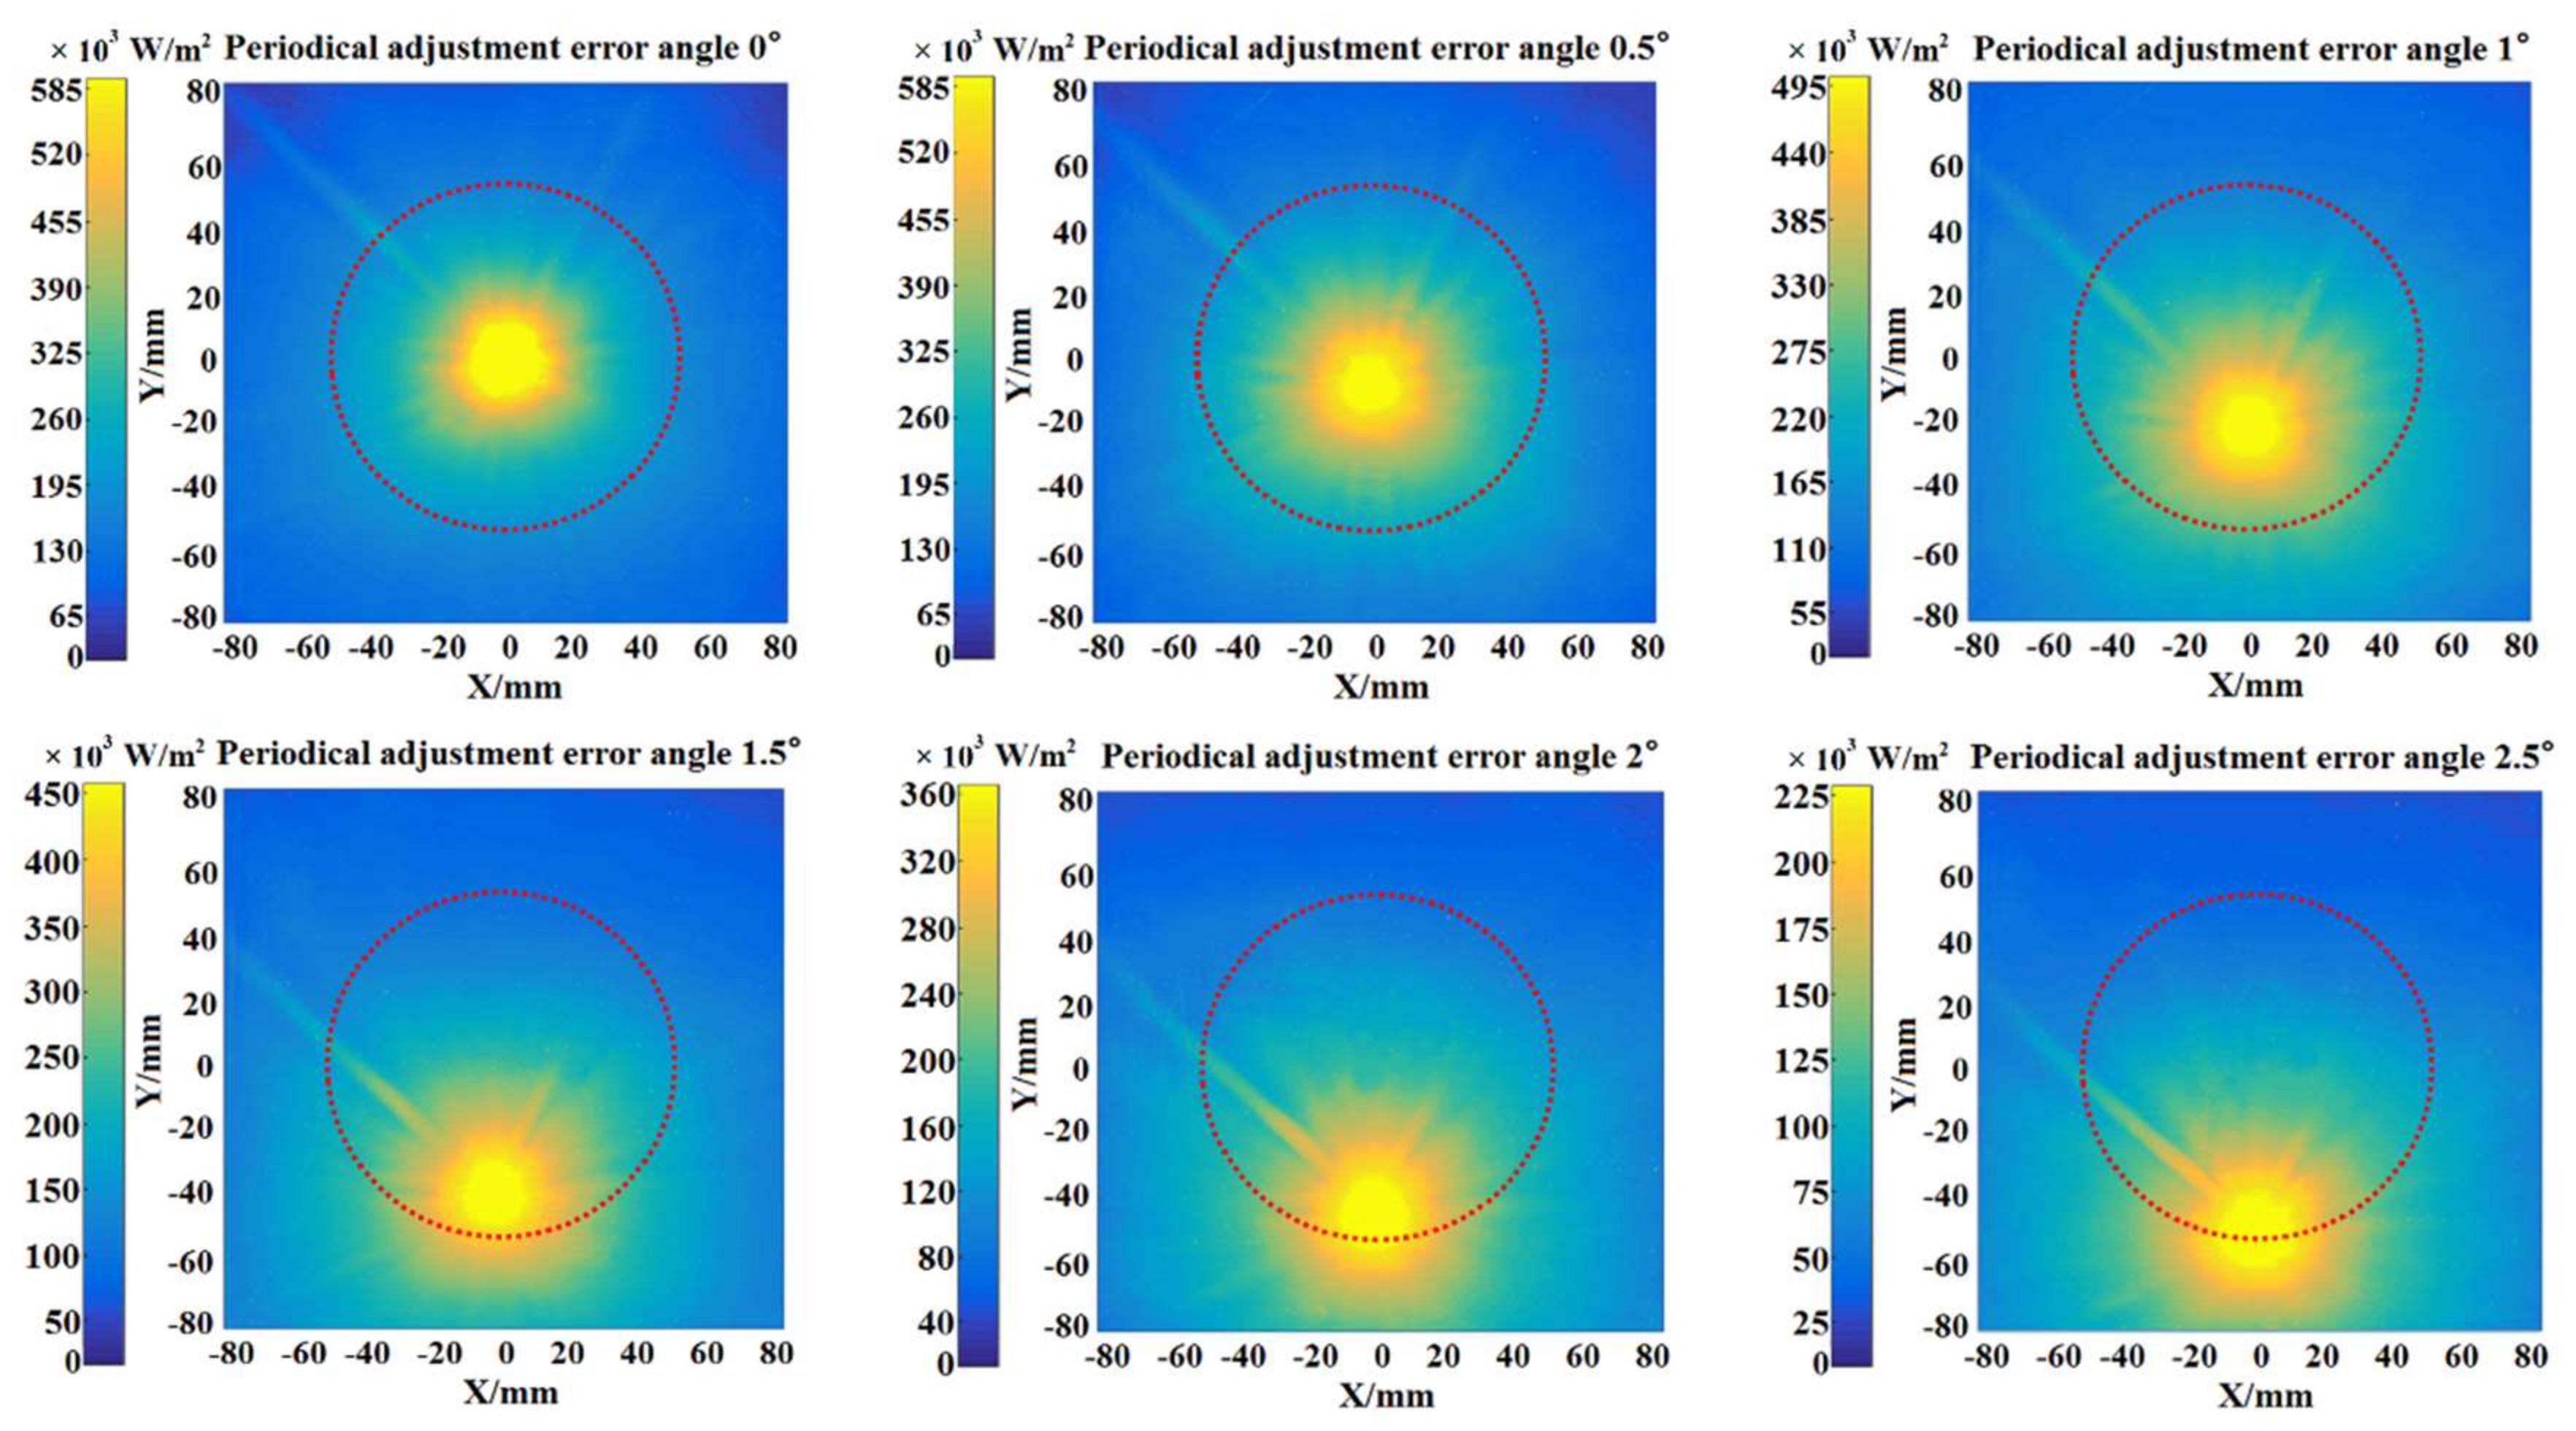
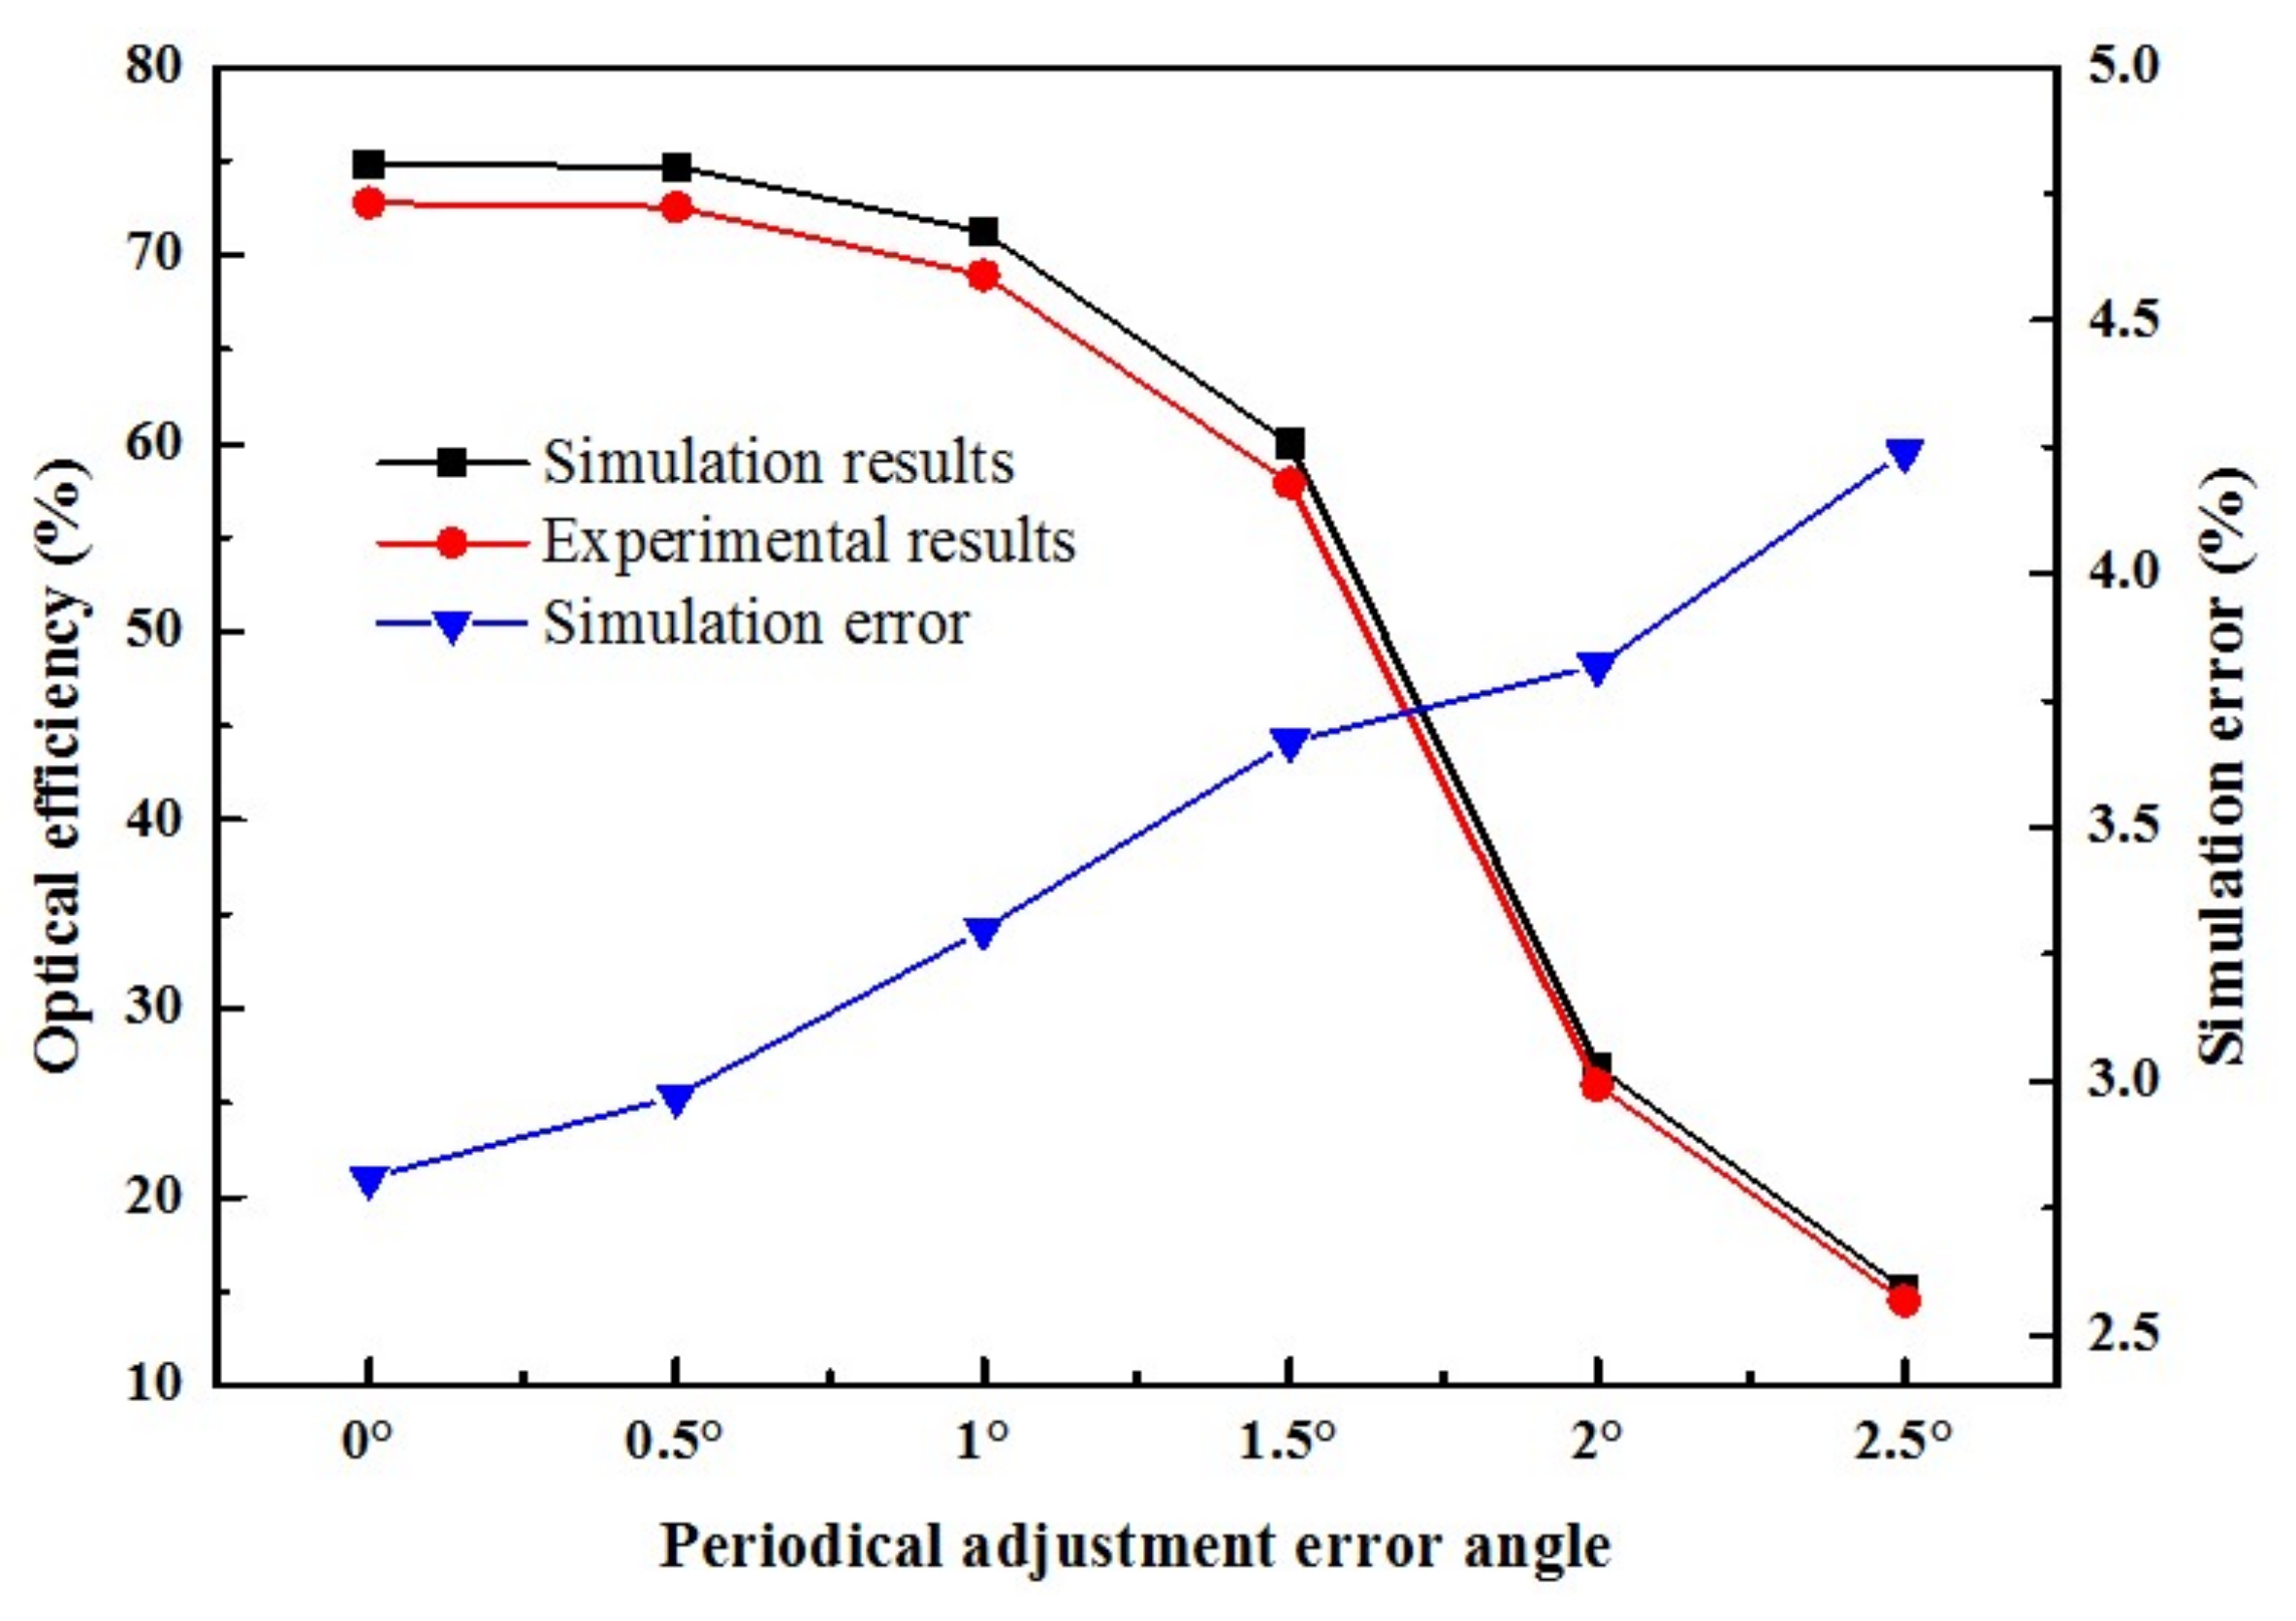
3.3. Effect of the Periodical Adjustment Error
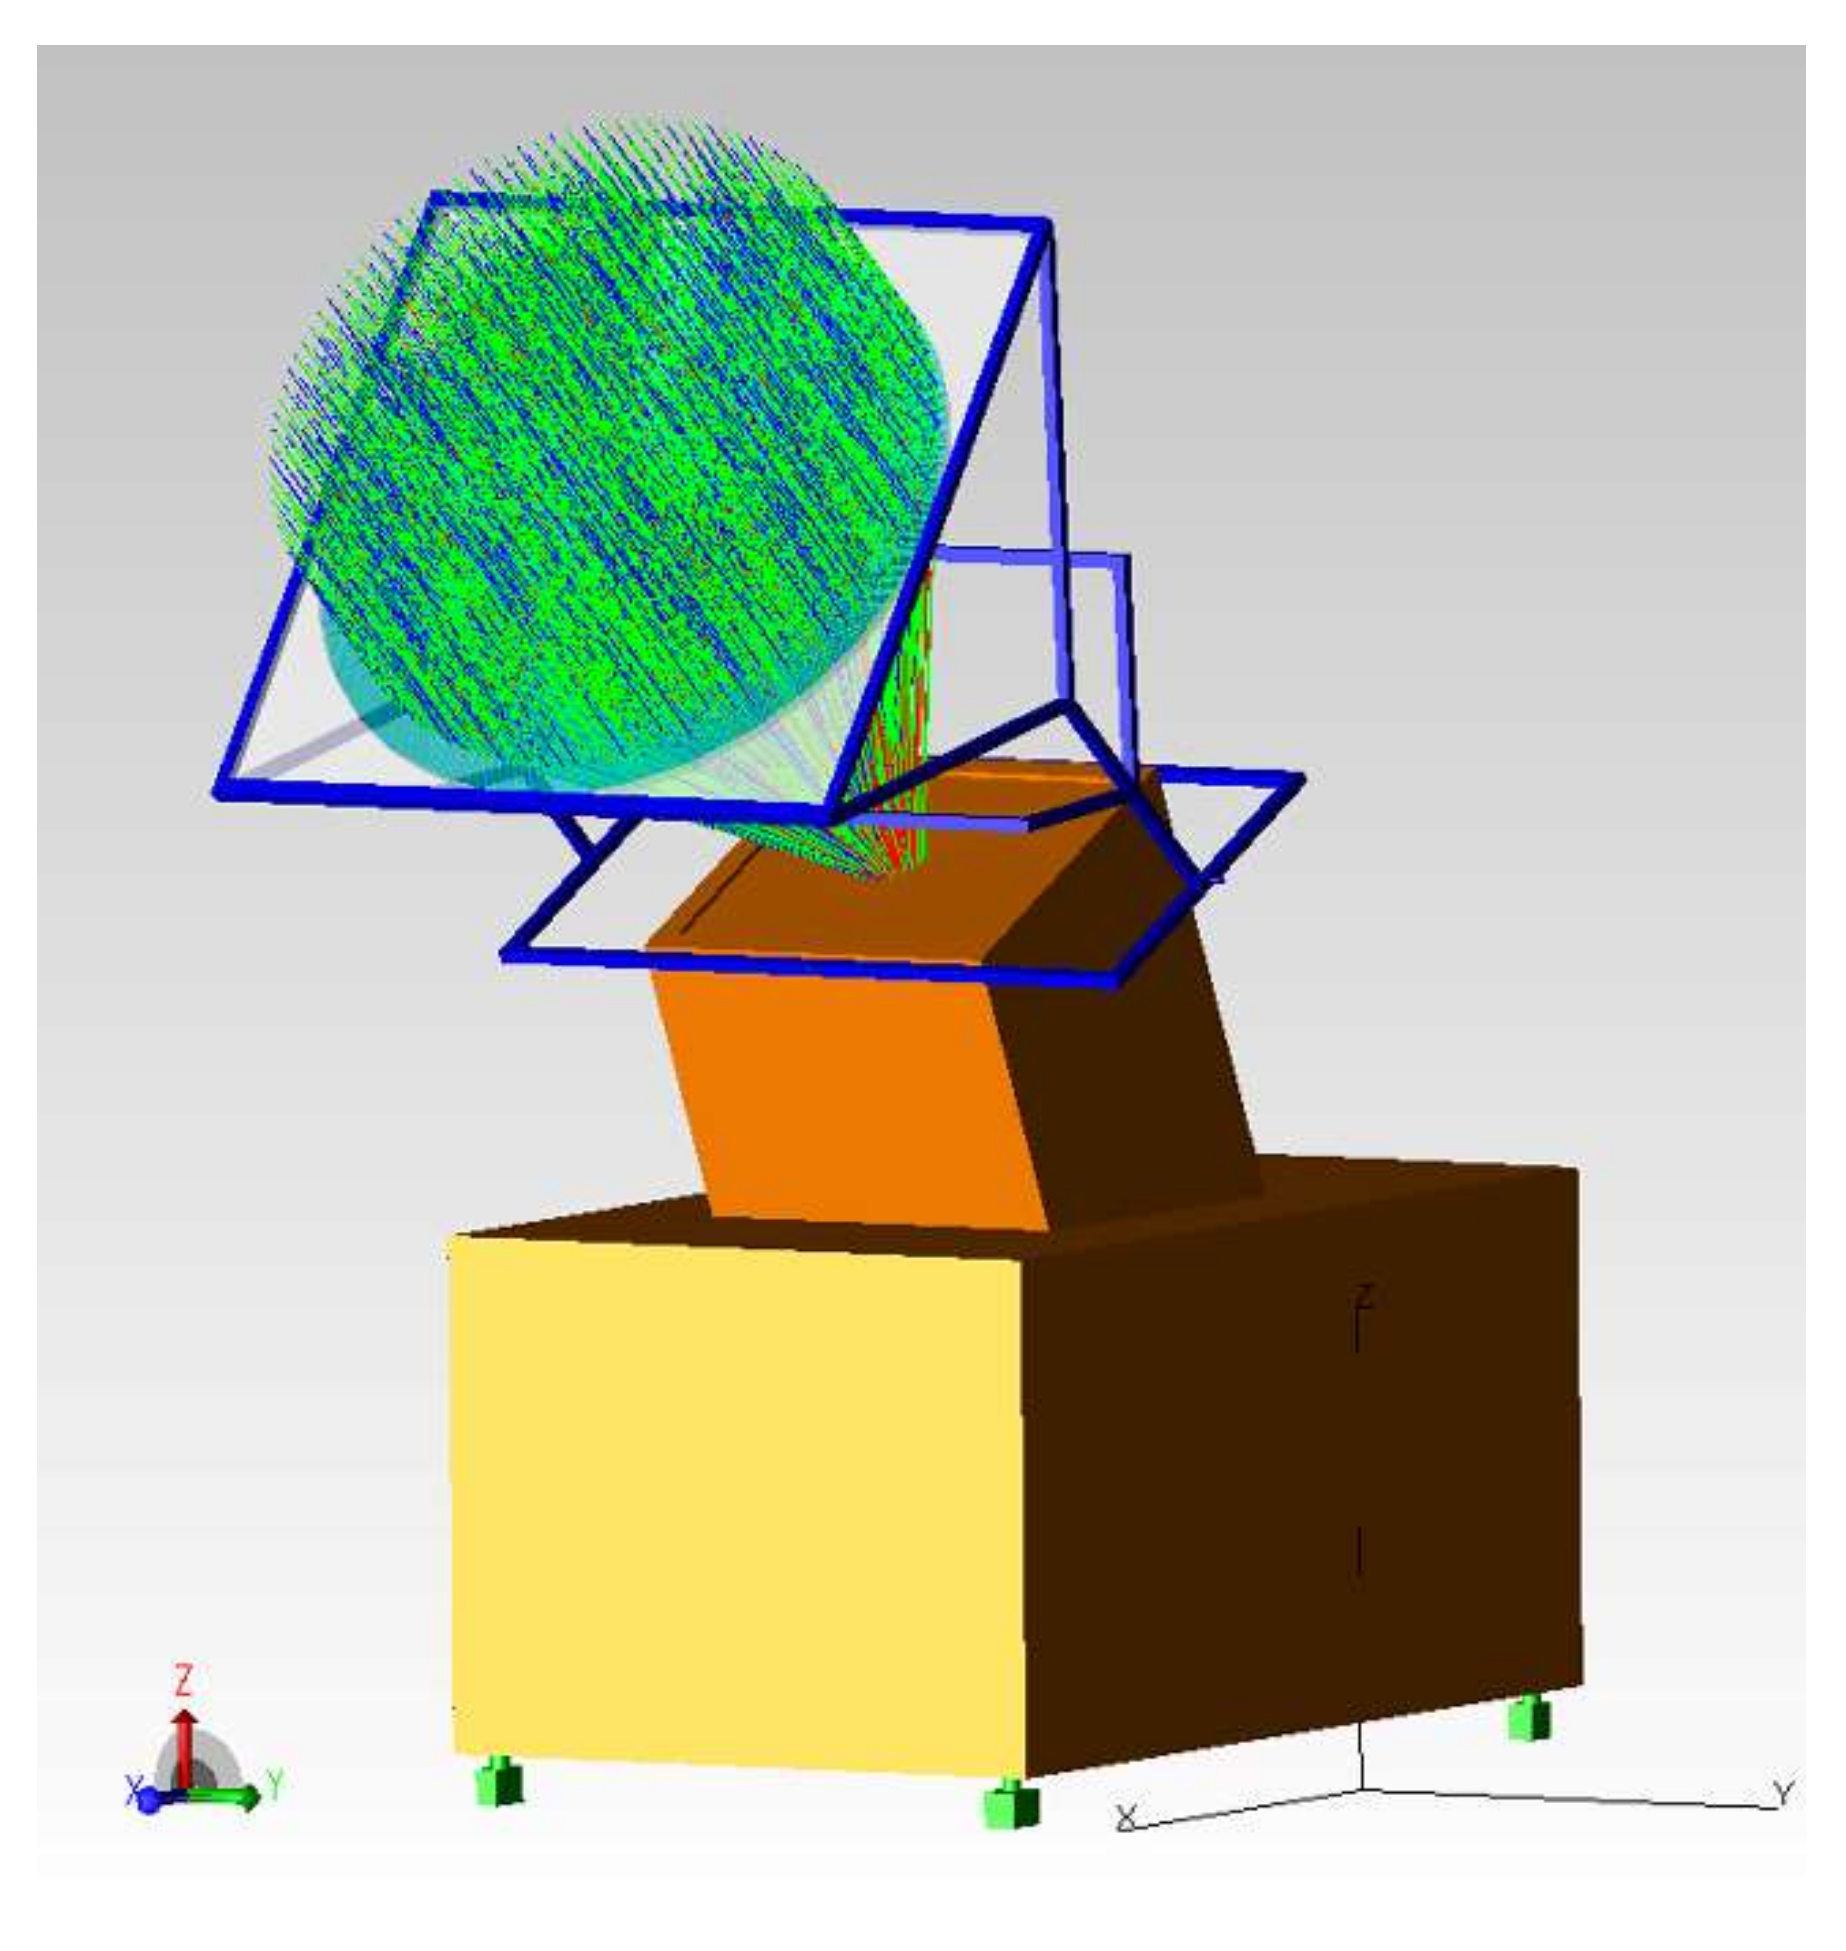
4. The Optical Simulation Analysis of the Fixed-Focus Fresnel Lens Solar Concentrator
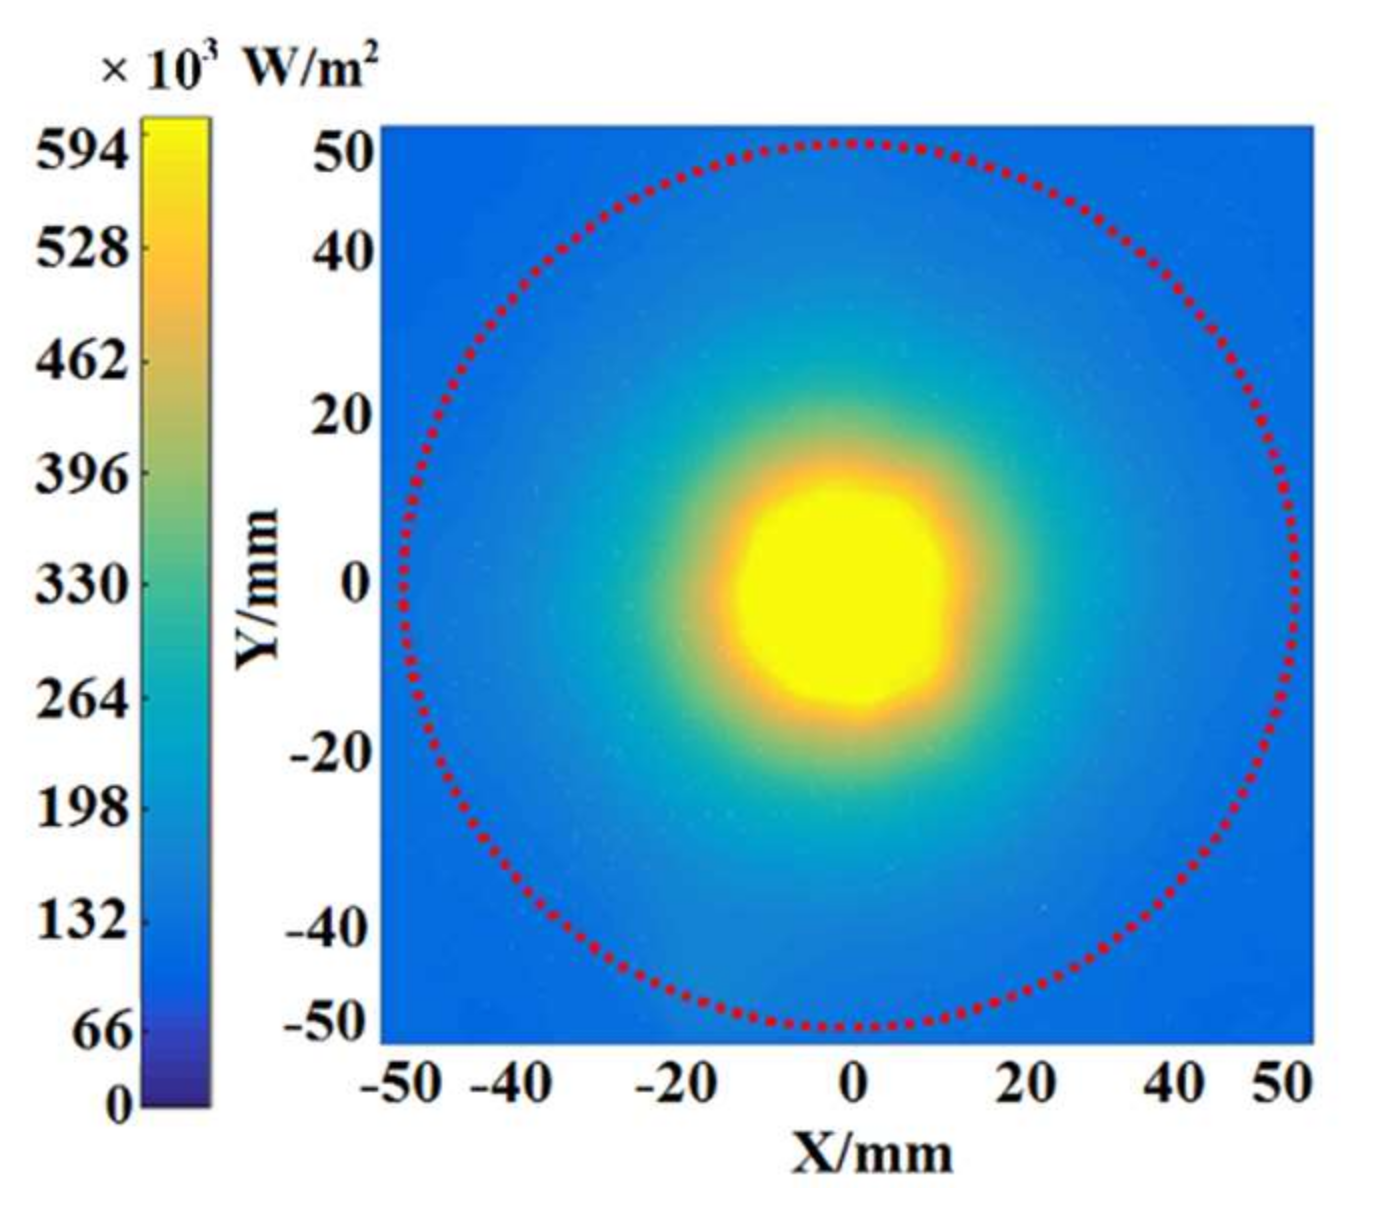
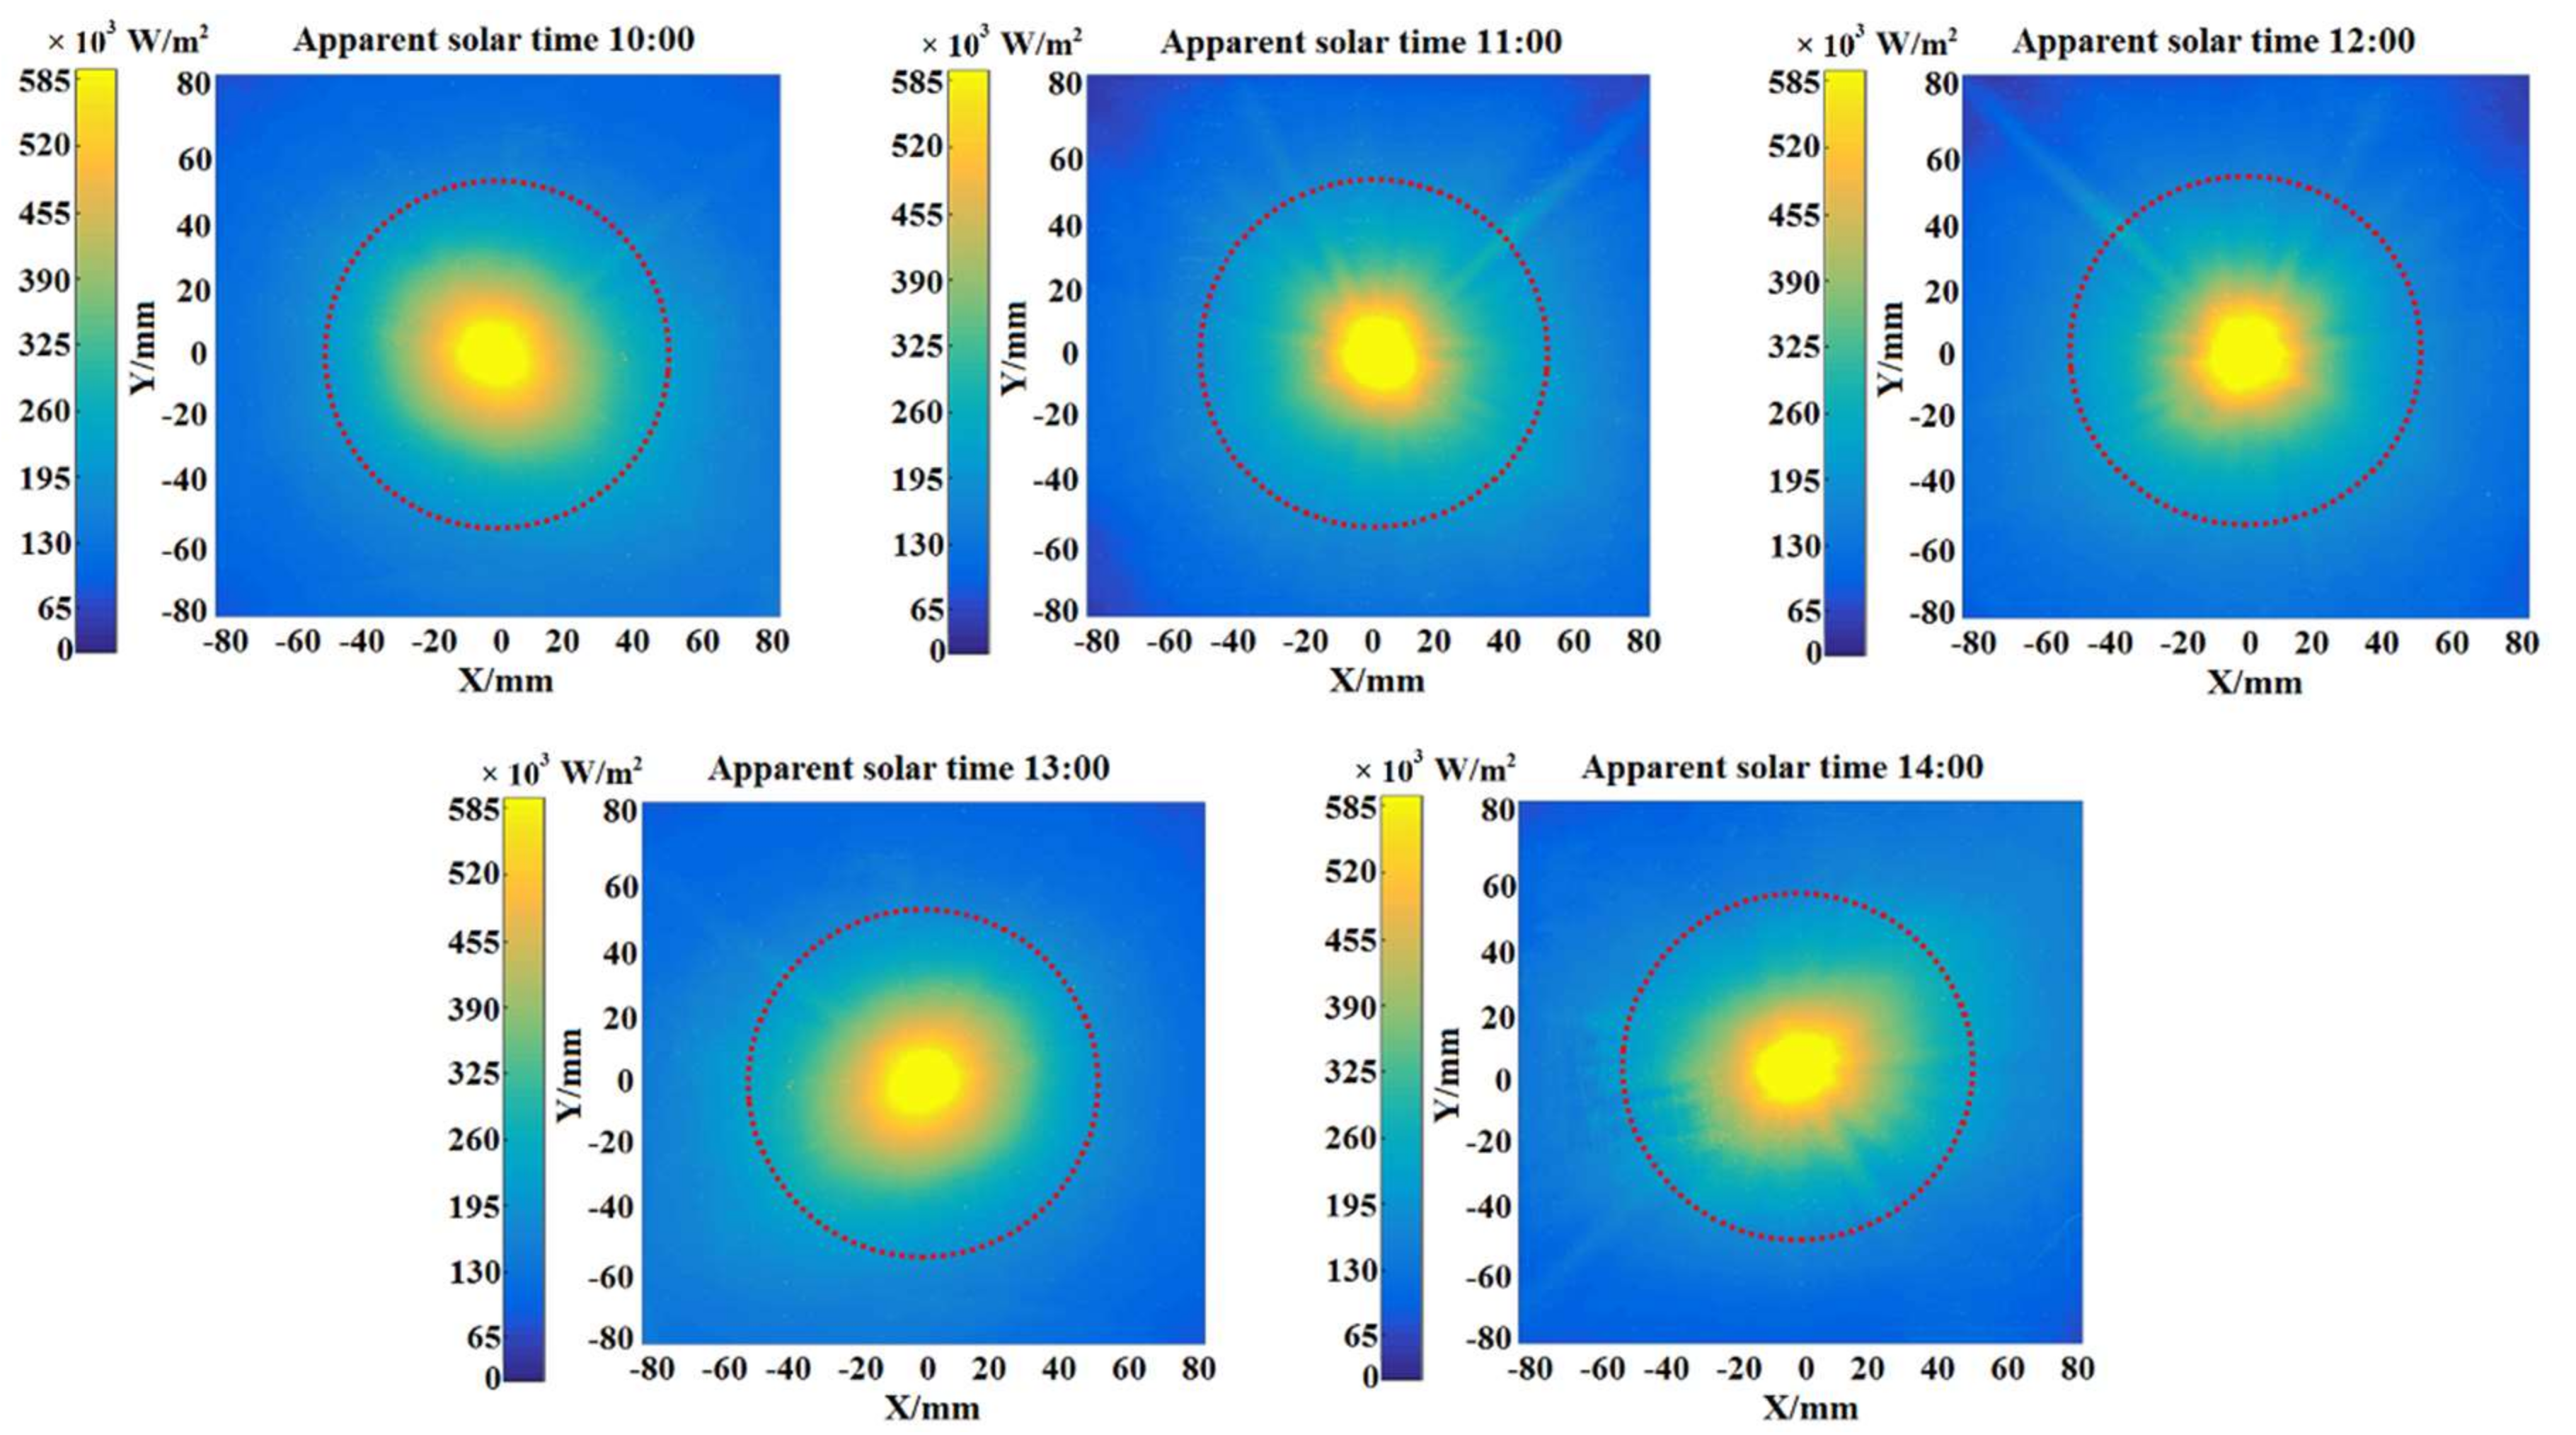
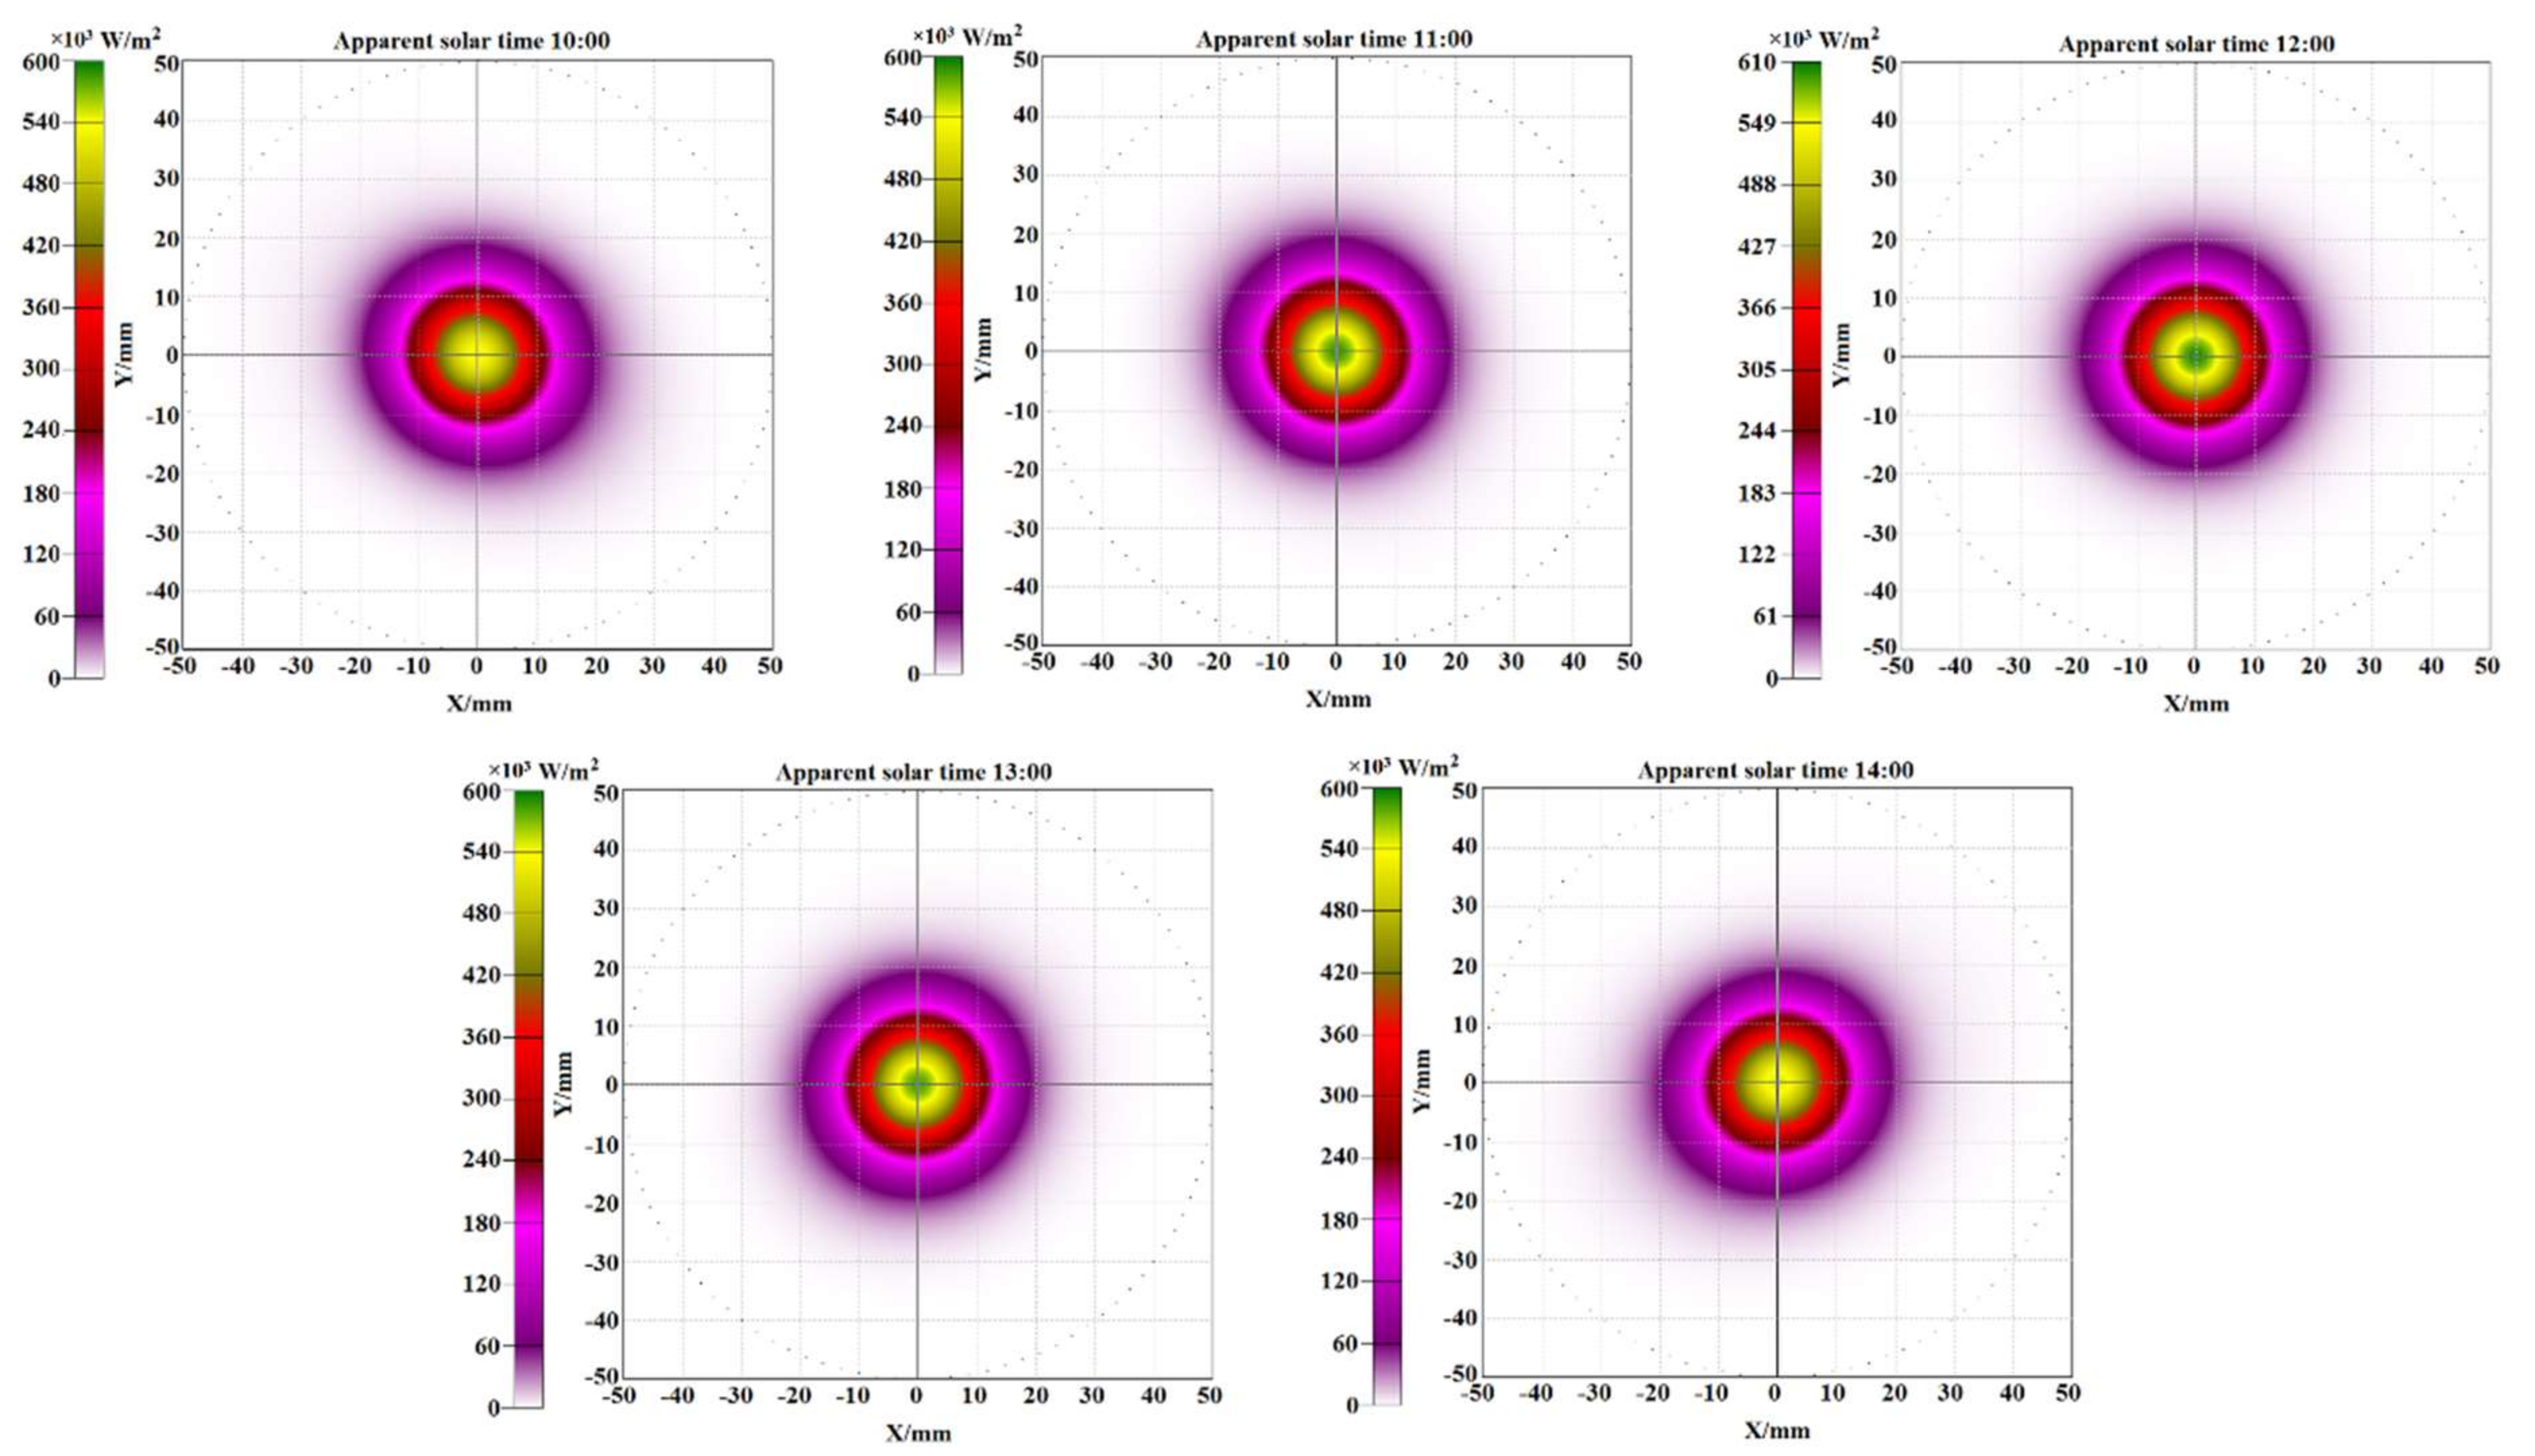
4.1. Focal Spot Deviation
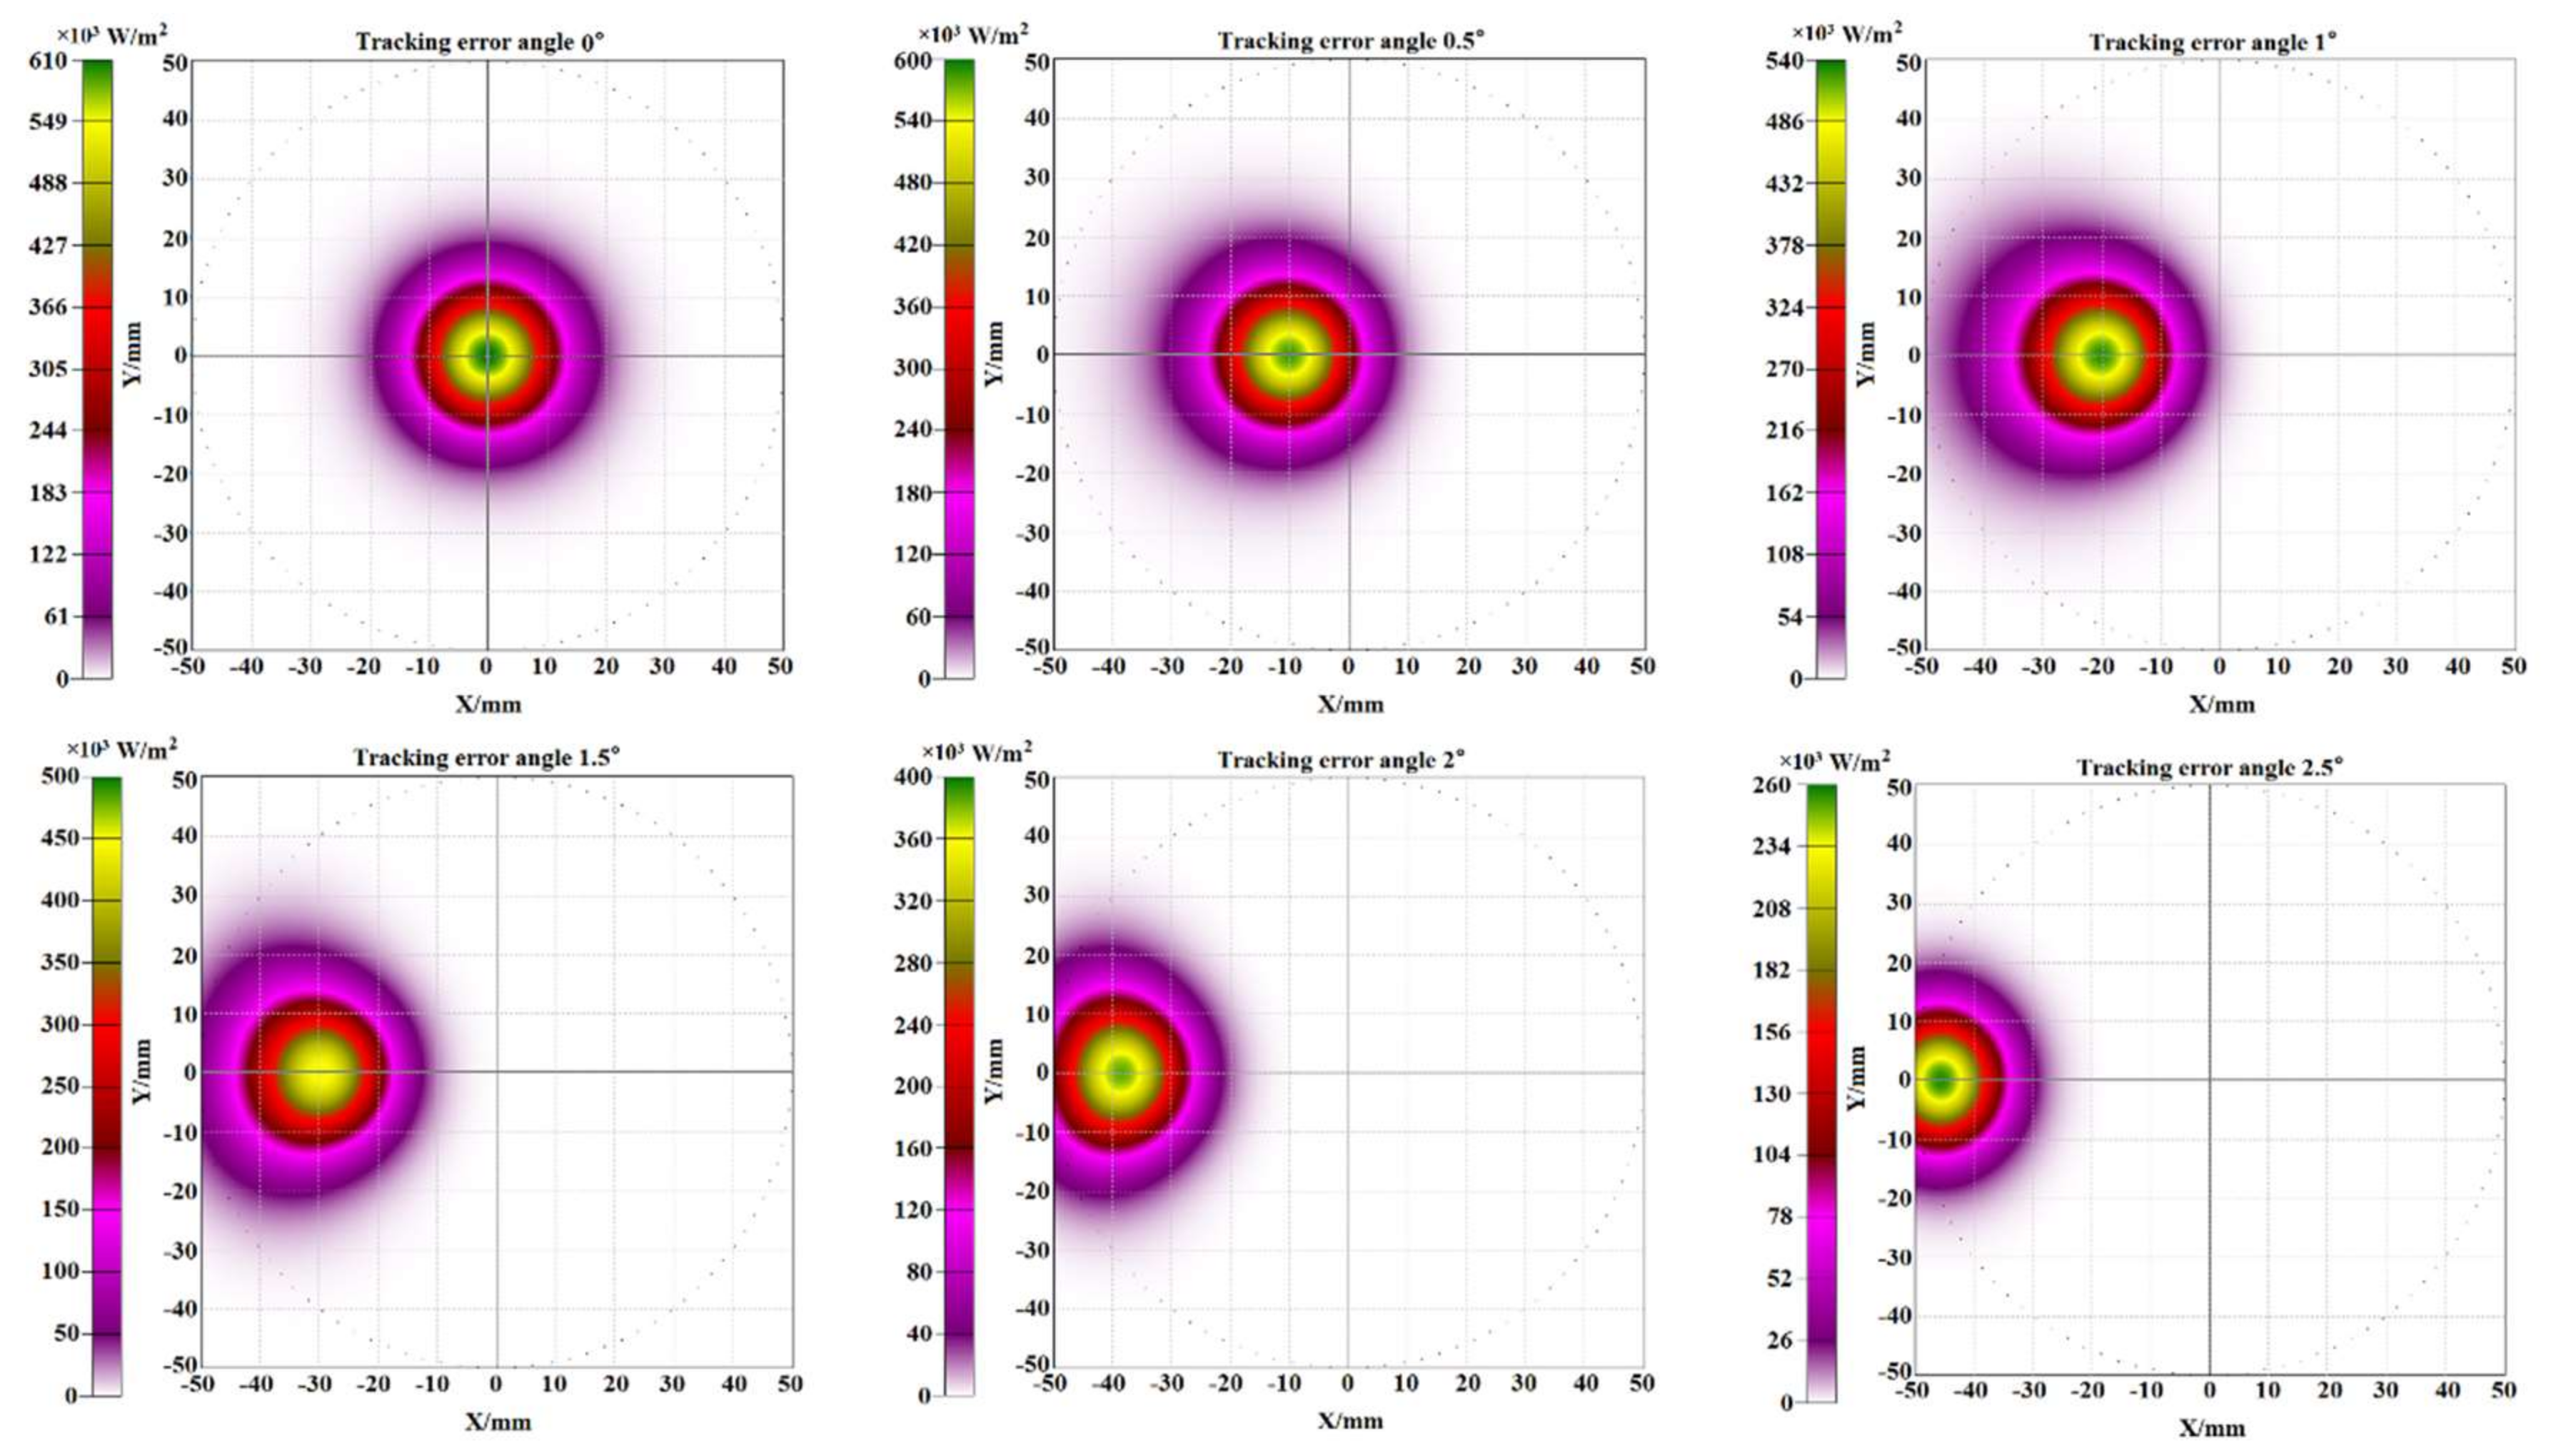
4.2. Tracking Precision Requirement
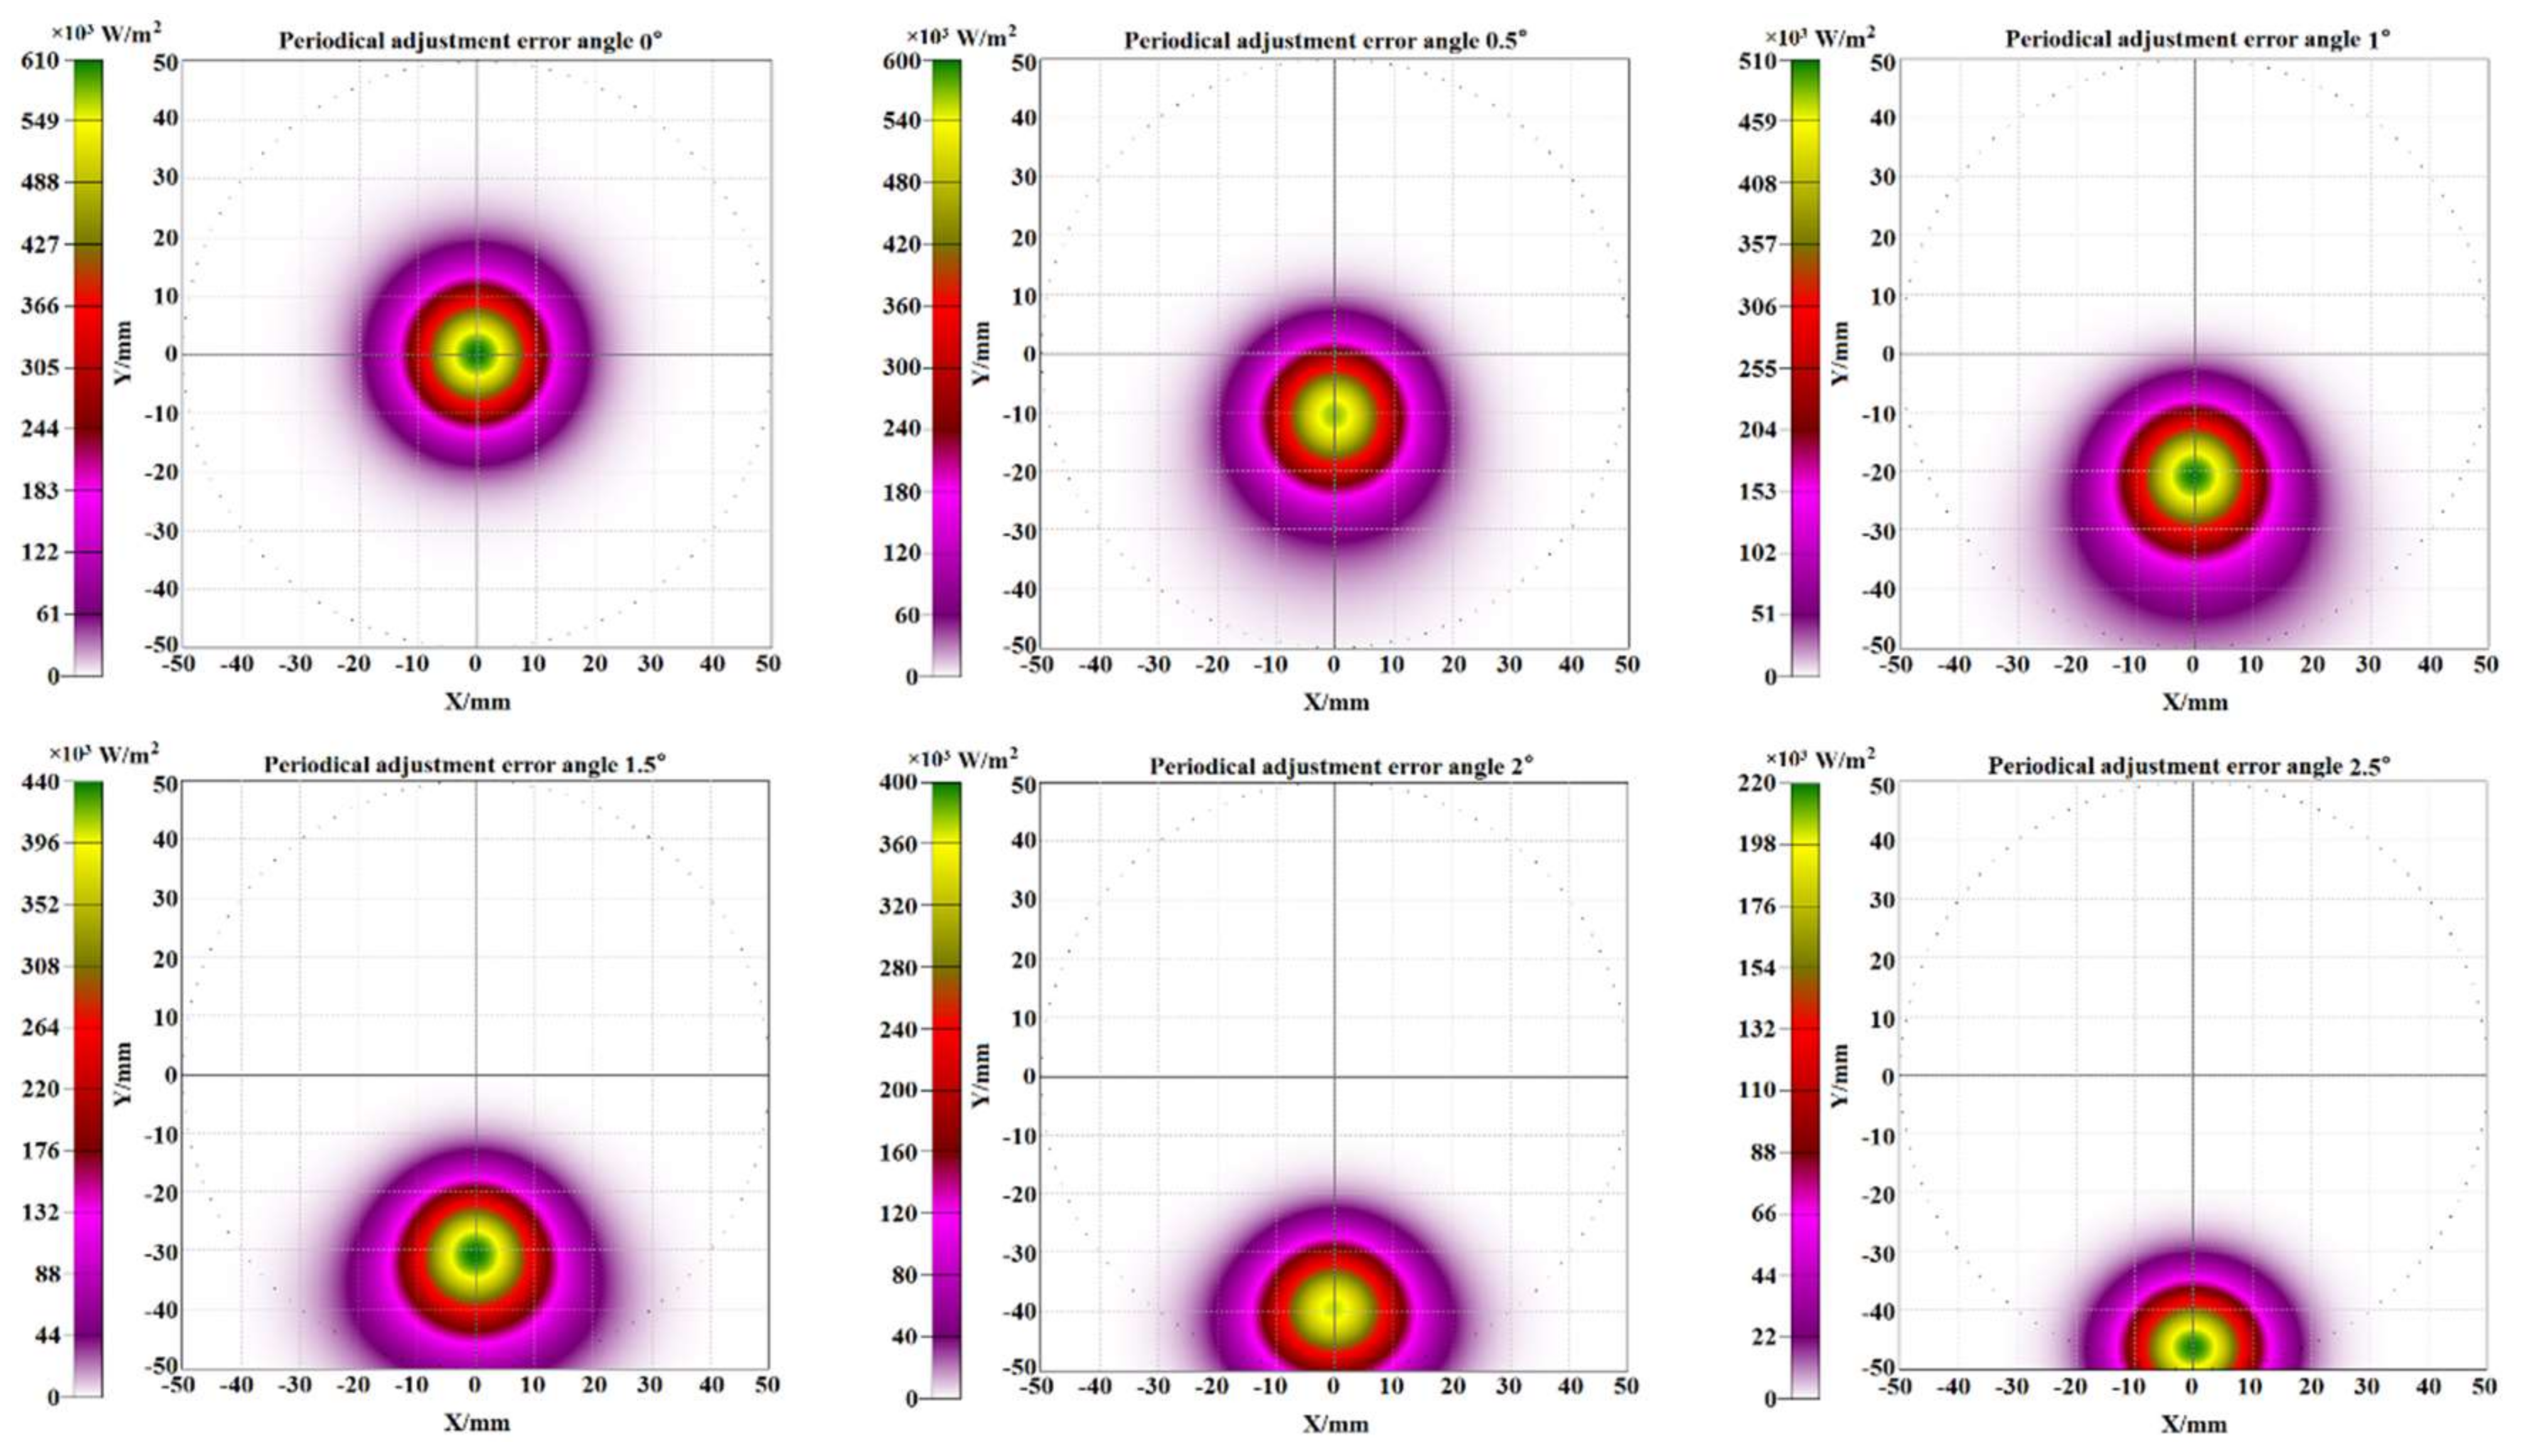
4.3. Effect of the Periodical Adjustment Error
5. The Validity of the Fixed-Focus Fresnel Lens Solar Concentrator’s Fixed-Focus Performance under Different Incident Angles in Total Year
6. Conclusions
- -
- Maximum value of the relative optical efficiency loss of FFFSC in the experiment for one day is 1.87%. Mean value and maximum value of the local concentration ratio of the solar flux on the receiver are more than 86.64 and 1319.43, respectively.
- -
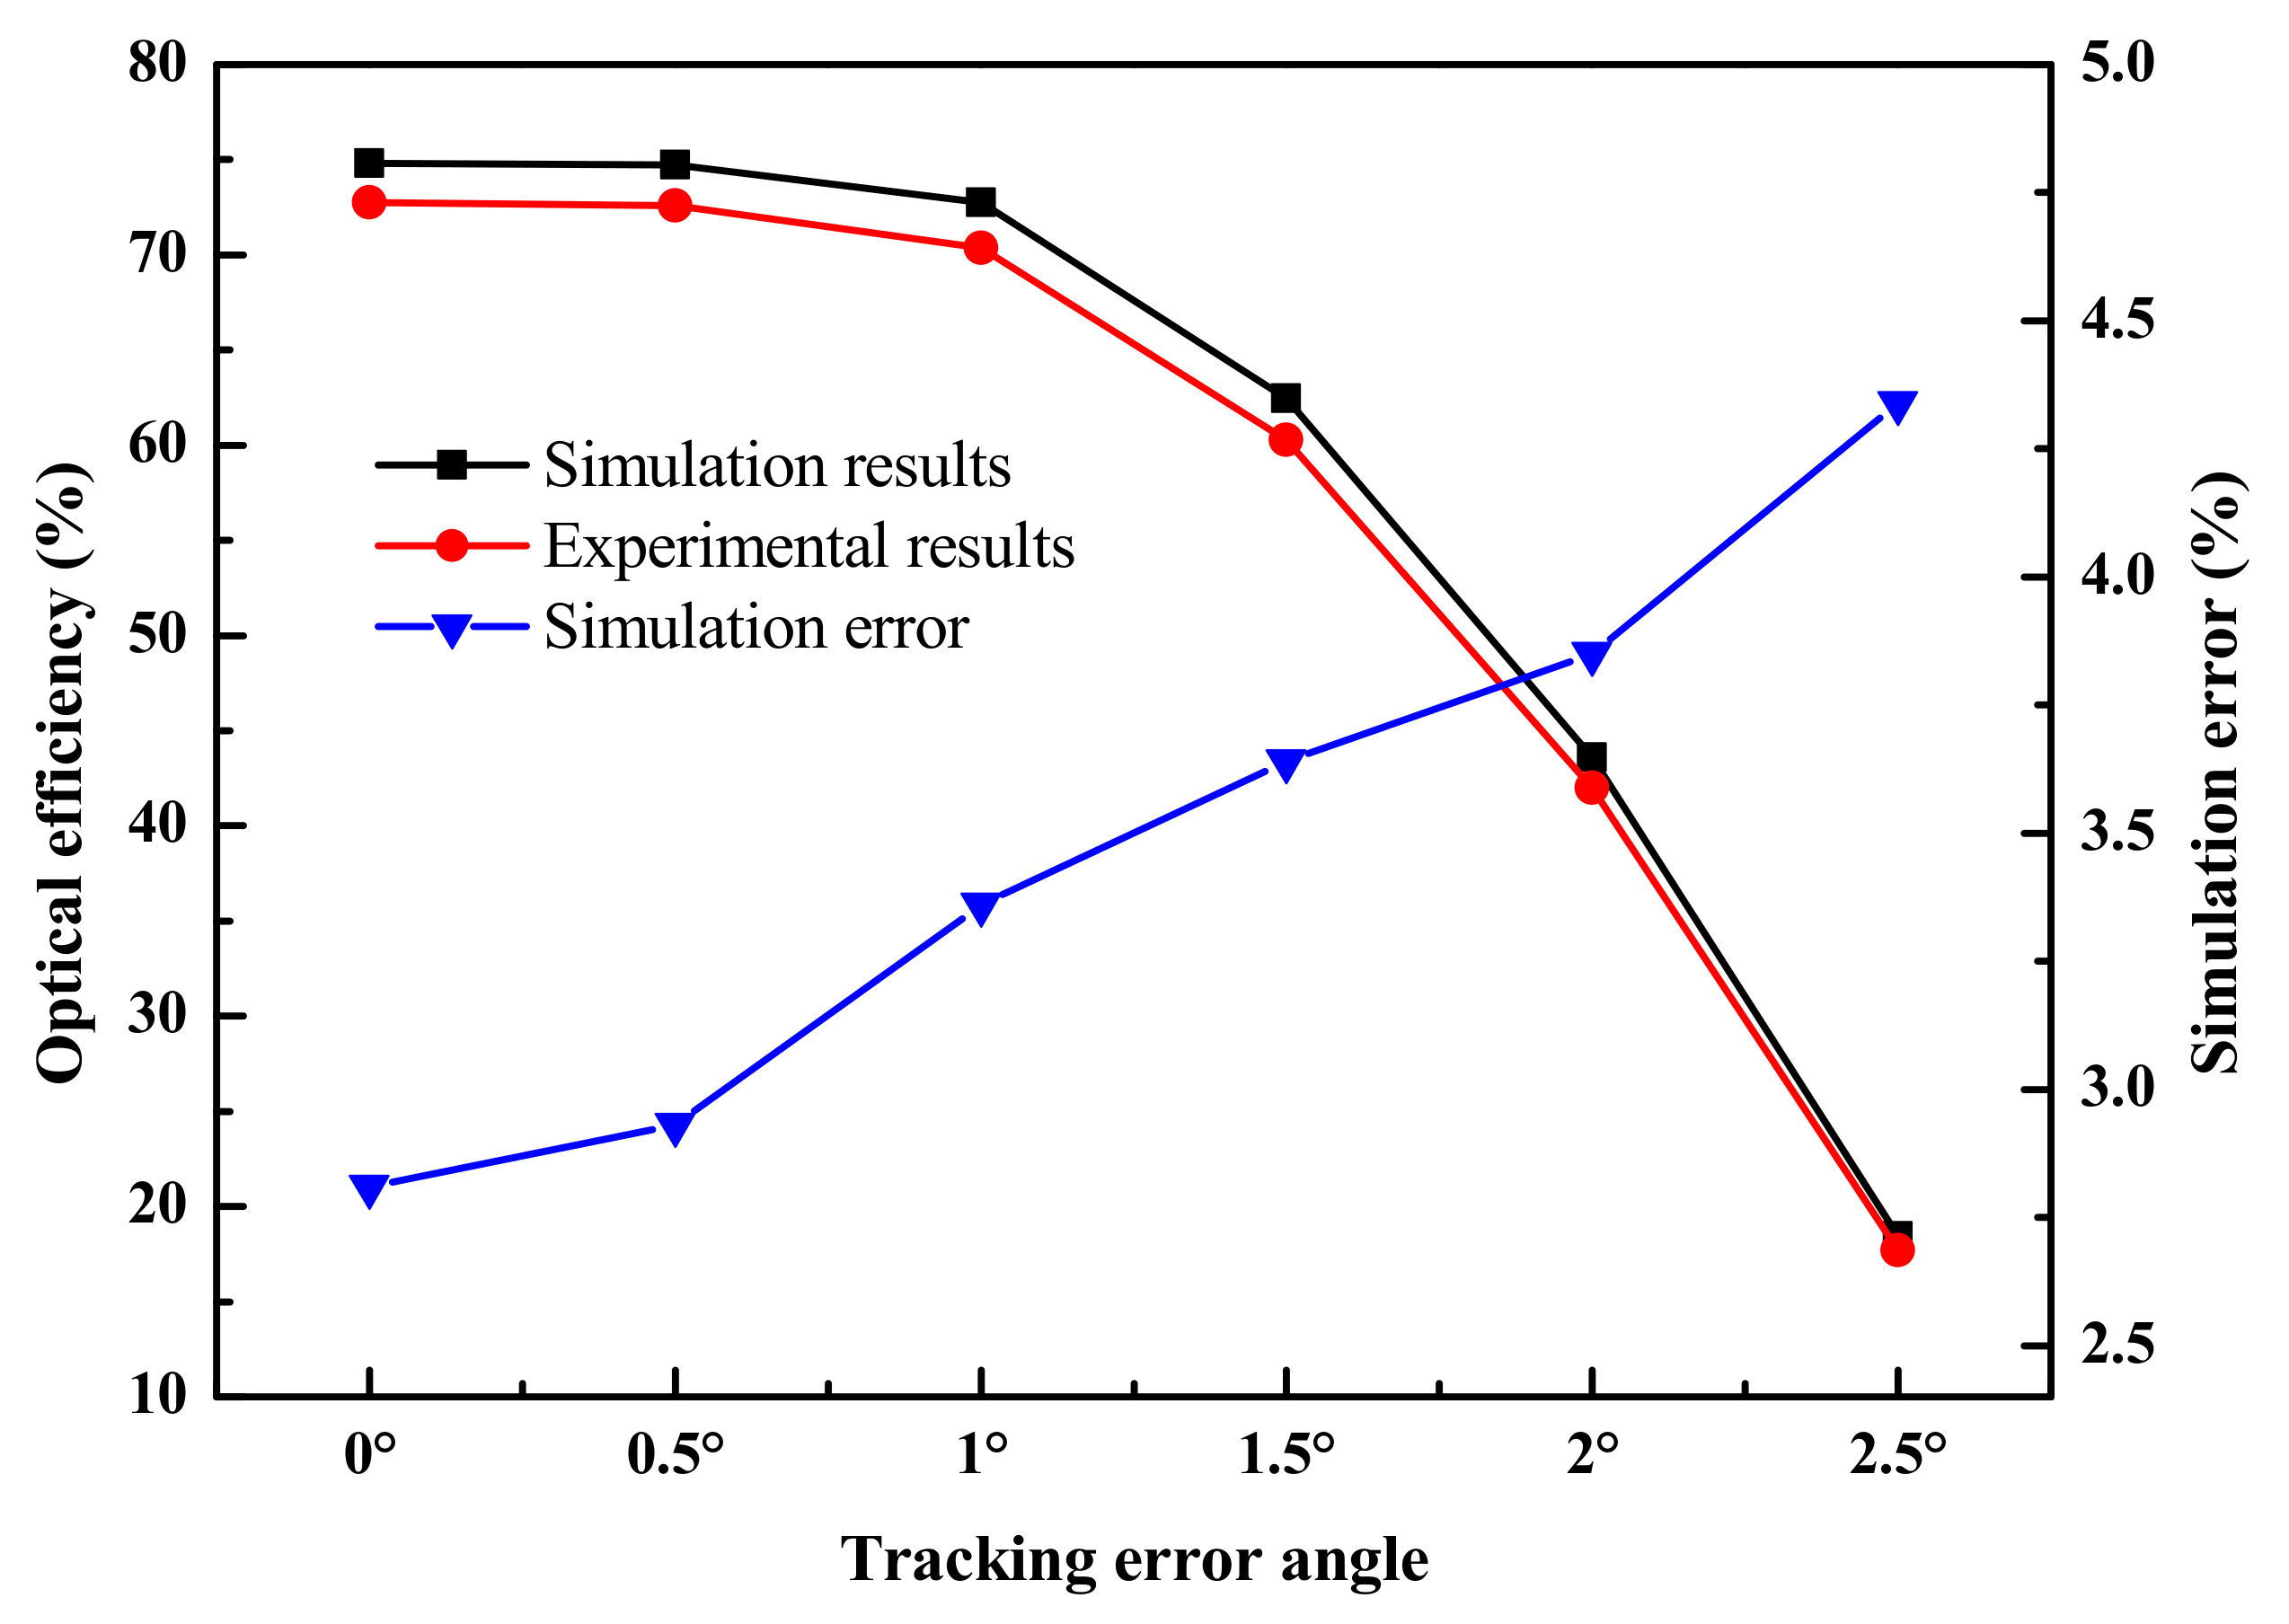
- The allowable angle of tracking error should be less than 1°. When the tracking error angle is bigger than 1.5°, the relative optical efficiency loss increases sharply which is up to 17.42%.
- -
- The allowable angle of periodical adjustment error should be less than 1°, too. It may be appropriate to adjust the FFFSC’s declination axis with the period of two days when the sun declination angle is −16°48′.
- -
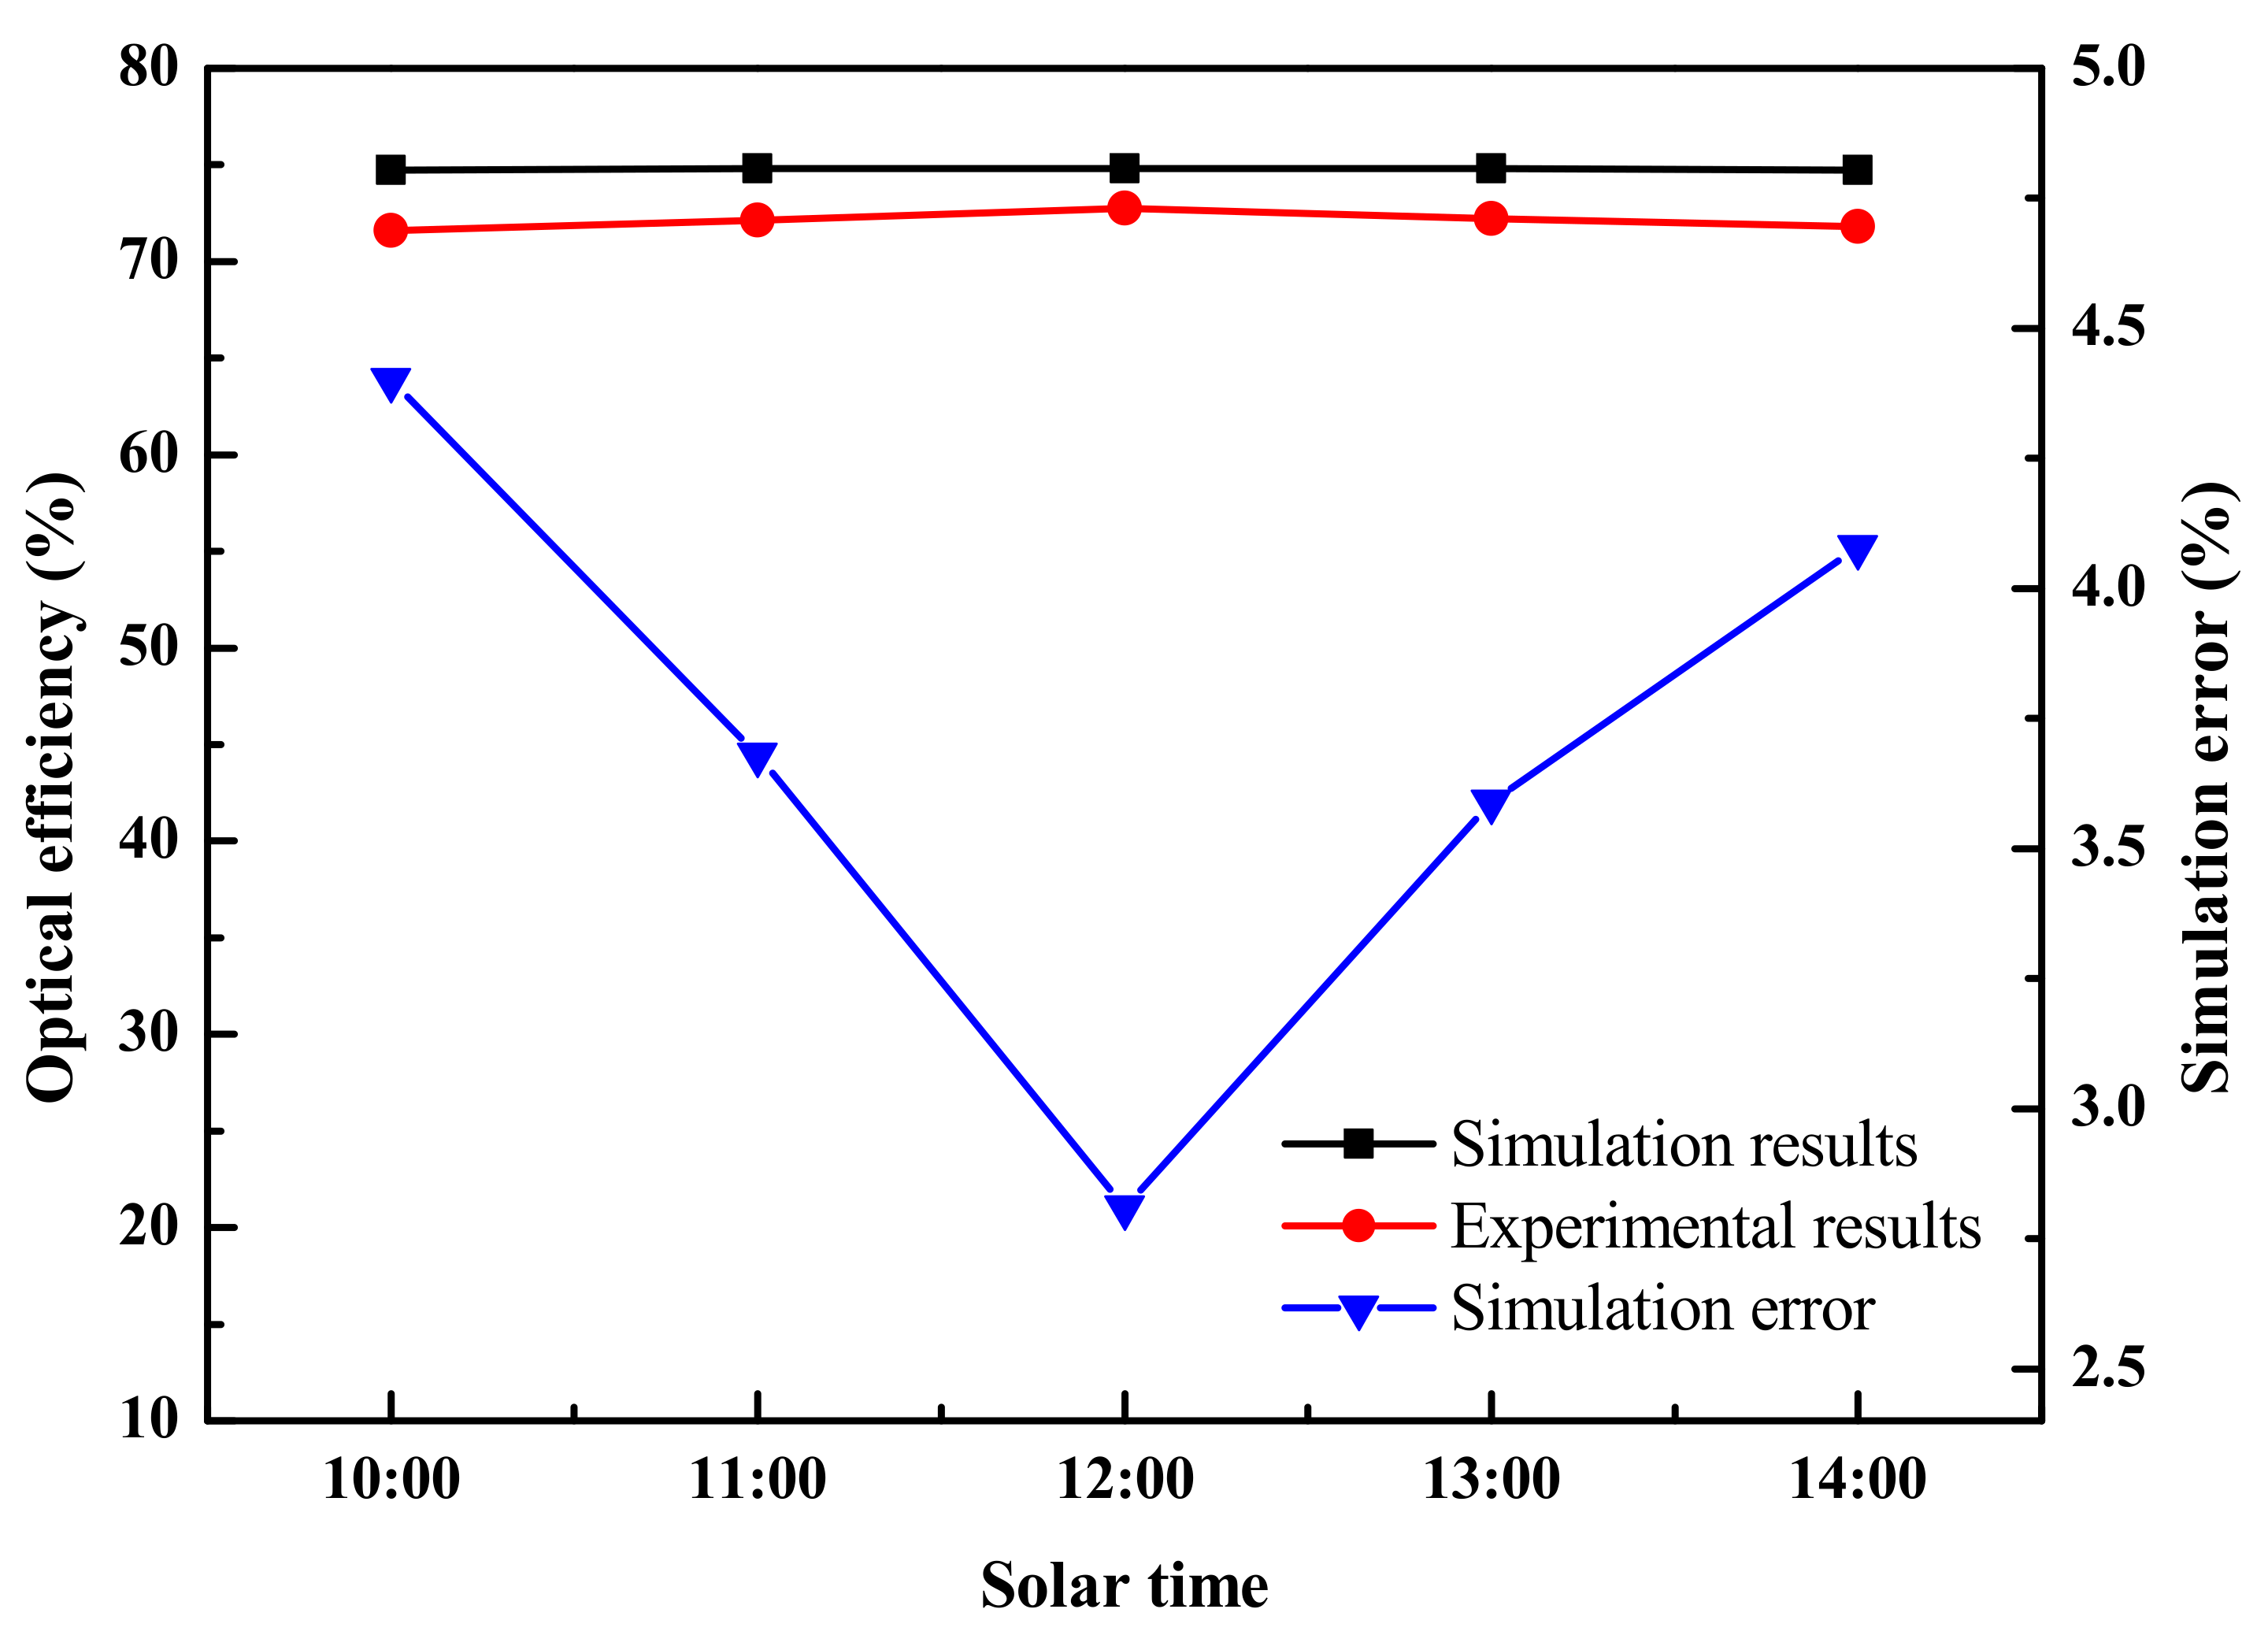
- Experimental results are in coincidence with optical simulation results and the peak value of simulation errors are less than 5%, which indicates that the simulation model is correct and the optical characteristics of FFFSC can be verified by optical simulation method.
- -
- According to the total year simulation of FFFSC’s fixed-focus performance, the maximum relative optical efficiency loss of FFFSC is 0.116%, which indicates that the FFFSC can achieve the fixed-focus under different incident angles in total year.
Acknowledgments
Author Contributions
Conflicts of Interest
Nomenclature
| Erec | The received energy (W) |
| G | The direct normal irradiance (W/m2) |
| Gmax | The maximum flux density on a receiver area (W/m2) |
| Gmean | The mean flux density on a receiver area (W/m2) |
| n | Refractive index of PMMA |
| Xmax | Maximum value of the local concentration ratio |
| Xmean | Mean value of the local concentration ratio |
| Greek Symbols | |
| δ | Sun declination angle (°) |
| ηopt | The optical efficiency of FFFSC (%) |
| ηre-opt,loss | The relative optical efficiency loss of FFFSC (%) |
| ηerror | The simulation error (%) |
| λ | The wavelength (µm) |
| Φ | Local latitude angle (°) |
| Abbreviations | |
| PMMA | Polymethyl methacrylate |
References
- Liu, Z.; Xu, W.; Zhai, X.; Qian, C.; Chen, X. Feasibility and performance study of the hybrid ground-source heat pump system for one office building in Chinese heating dominated areas. Renew. Energy 2017, 101, 1131–1140. [Google Scholar] [CrossRef]
- Liu, Z.; Cheng, K.; Li, H.; Cao, G.; Wu, D.; Shi, Y. Exploring the potential relationship between indoor air quality and the concentration of airborne culturable fungi: A combined experimental and neural network modeling study. Environ. Sci. Pollut. Res. Int. 2018, 25, 3510–3517. [Google Scholar] [CrossRef] [PubMed]
- Liu, Z.; Wu, D.; Yu, H.; Ma, W.; Jin, G. Field measurement and numerical simulation of combined solar heating operation modes for domestic buildings based on the Qinghai-Tibetan plateau case. Energy Build. 2018, 167, 312–321. [Google Scholar] [CrossRef]
- Liu, Z.; Li, H.; Liu, K.; Yu, H.; Cheng, K. Design of high-performance water-in-glass evacuated tube solar water heaters by a high-throughput screening based on machine learning: A combined modeling and experimental study. Sol. Energy 2017, 142, 61–67. [Google Scholar] [CrossRef]
- Zhu, J.; Huang, H. Design and thermal performances of semi-parabolic linear fresnel reflector solar concentration collector. Energy Convers. Manag. 2014, 77, 733–737. [Google Scholar] [CrossRef]
- Huang, F.; Li, L.; Huang, W. Optical performance of an azimuth tracking linear Fresnel solar concentrator. Sol. Energy 2014, 108, 1–12. [Google Scholar] [CrossRef]
- Bellos, E.; Mathioulakis, E.; Tzivanidis, C.; Belessiotis, V.; Antonopoulos, K.A. Experimental and numerical investigation of a linear Fresnel solar collector with flat plate receiver. Energy Convers. Manag. 2016, 130, 44–59. [Google Scholar] [CrossRef]
- Bellos, E.; Tzivanidis, C. Multi-criteria evaluation of a nanofluid-based linear Fresnel solar collector. Sol. Energy 2018, 163, 200–214. [Google Scholar] [CrossRef]
- Boito, P.; Grena, R. Optimization of the geometry of Fresnel linear collectors. Sol. Energy 2016, 135, 479–486. [Google Scholar] [CrossRef]
- Rungasamy, A.E.; Craig, K.J.; Meyer, J.P. 3-D CFD modeling of a slanted receiver in a compact linear Fresnel plant with etendue-matched mirror field. Energy Procedia 2015, 69, 188–197. [Google Scholar] [CrossRef]
- Benyakhlef, S.; Al Mers, A.; Merroun, O.; Bouatem, A.; Boutammachte, N.; El Alj, S.; Ajdada, H.; Erregueraguia, Z.; Zemmouria, E. Impact of heliostat curvature on optical performance of Linear Fresnel solar concentrators. Renew. Energy 2016, 89, 463–474. [Google Scholar] [CrossRef]
- Valmiki, M.M.; Li, P.; Heyer, J.; Morgan, M.; Albinali, A.; Alhamidi, K.; Wagoner, J. A novel application of a Fresnel lens for a solar stove and solar heating. Renew. Energy 2011, 36, 1614–1620. [Google Scholar] [CrossRef]
- Zheng, H.; Wu, G.; Tao, T.; Su, Y.; Dai, J. Combination of a light funnel concentrator with a deflector for orientated sunlight transmission. Energy Convers. Manag. 2014, 88, 785–793. [Google Scholar] [CrossRef]
- Schmitz, M.; Wiik, N.; Ambrosetti, G.; Pedretti, A.; Paredes, S.; Ruch, P.; Steinfeld, A. A 6-focus high-concentration photovoltaic-thermal dish system. Sol. Energy 2017, 155, 445–463. [Google Scholar] [CrossRef]
- Chong, K.K.; Yew, T.K.; Wong, C.W.; Tan, M.H.; Tan, W.C.; Lim, B.H. Dense-array concentrator photovoltaic prototype using non-imaging dish concentrator and an array of cross compound parabolic concentrators. Appl. Energy 2017, 204, 898–911. [Google Scholar] [CrossRef]
- Mousazadeh, H.; Keyhani, A.; Javadi, A.; Mobli, H.; Abrinia, K.; Sharifi, A. A review of principle and sun-tracking methods for maximizing solar systems output. Renew. Sustain. Energy Rev. 2009, 13, 1800–1818. [Google Scholar] [CrossRef]
- Nsengiyumva, W.; Chen, S.G.; Hu, L.; Chen, X. Recent advancements and challenges in Solar Tracking Systems (STS): A review. Renew. Sustain. Energy Rev. 2018, 81, 250–279. [Google Scholar] [CrossRef]
- Yabe, T.; Ohkubo, T.; Uchida, S.; Yoshida, K.; Nakatsuka, M.; Funatsu, T.; Daito, K. High-efficiency and economical solar-energy-pumped laser with Fresnel lens and chromium codoped laser medium. Appl. Phys. Lett. 2007, 90. [Google Scholar] [CrossRef]
- Alexandru, C.; Pozna, C. Simulation of a dual-axis solar tracker for improving the performance of a photovoltaic panel. Proc. Inst. Mech. Eng. Part A 2010, 224, 797–811. [Google Scholar] [CrossRef]
- Lv, H.; Zheng, Y.; Wang, J.; Chen, B.; Sheng, F.; Cheng, C.; Lv, Q. Tracking control and output power optimization of a concentrator photovoltaic system with polar axis. Opt. Int. J. Light Electron. Opt. 2016, 127, 3840–3843. [Google Scholar] [CrossRef]
- Ning, D.; Yao, N.; Song, L.F.; Wang, H.X. Design of the solar automatic tracker of polar axis type. Appl. Mech. Mater. 2014, 455, 625–630. [Google Scholar] [CrossRef]
- Chemisana, D.; Vossier, A.; Pujol, L.; Perona, A.; Dollet, A. Characterization of Fresnel lens optical performances using an opal diffuser. Energy Convers. Manag. 2011, 52, 658–663. [Google Scholar] [CrossRef]
- Chandrashekara, M.; Yadav, A. An experimental study of the effect of exfoliated graphite solar coating with a sensible heat storage and Scheffler dish for desalination. Appl. Therm. Eng. 2017, 123, 111–122. [Google Scholar] [CrossRef]
- Xie, W.T.; Dai, Y.J.; Wang, R.Z. Numerical and experimental analysis of a point focus solar collector using high concentration imaging PMMA Fresnel lens. Energy Convers. Manag. 2011, 52, 2417–2426. [Google Scholar] [CrossRef]
- Xu, N.; Ji, J.; Sun, W.; Huang, W.; Li, J.; Jin, Z. Numerical simulation and experimental validation of a high concentration photovoltaic/thermal module based on point-focus Fresnel lens. Appl. Energy 2016, 168, 269–281. [Google Scholar] [CrossRef]
- Zheng, H.; Feng, C.; Su, Y.; Dai, J.; Ma, X. Design and experimental analysis of a cylindrical compound Fresnel solar concentrator. Sol. Energy 2014, 107, 26–37. [Google Scholar] [CrossRef]
- Li, P.W.; Kane, P.; Mokler, M. Modeling of solar tracking for giant Fresnel lens solar stoves. Sol. Energy 2013, 96, 263–273. [Google Scholar] [CrossRef]
- Ayodele, T.R.; Ogunjuyigbe, A.S.O. Prediction of monthly average global solar radiation based on statistical distribution of clearness index. Energy 2015, 90, 1733–1742. [Google Scholar] [CrossRef]
- Mashaly, I.A.; Nassar, K.; El-Haggar, S. Mathematical model for designing a light redirecting prismatic panel. Sol. Energy 2018, 159, 638–649. [Google Scholar] [CrossRef]
- Li, S.; Meng, X.; Wei, X. Heat transfer and friction factor correlations for solar air collectors with hemispherical protrusion artificial roughness on the absorber plate. Sol. Energy 2015, 118, 460–468. [Google Scholar]
- Wang, J.; Yang, S.; Jiang, C.; Yan, Q.; Lund, P.D. A novel 2-stage dish concentrator with improved optical performance for concentrating solar power plants. Renew. Energy 2017, 108, 92–97. [Google Scholar] [CrossRef]
- Wu, G.; Zheng, H.; Ma, X.; Kutlu, C.; Su, Y. Experimental investigation of a multi-stage humidification-dehumidification desalination system heated directly by a cylindrical Fresnel lens solar concentrator. Energy Convers. Manag. 2017, 143, 241–251. [Google Scholar] [CrossRef]
- Chong, K.K.; Obianuju, O.N.; Yew, T.K.; Wong, C.W.; Tan, W.C. Design and construction of active daylighting system using two-stage non-imaging solar concentrator. Appl. Energy 2017, 207, 45–60. [Google Scholar] [CrossRef]
- Kasarova, S.N.; Sultanova, N.G.; Ivanov, C.D.; Nikolov, I.D. Analysis of the dispersion of optical plastic materials. Opt. Mater. 2007, 29, 1481–1490. [Google Scholar] [CrossRef]
- Zhuang, Z.; Yu, F. Optimization design of hybrid Fresnel-based concentrator for generating uniformity irradiance with the broad solar spectrum. Opt. Laser Technol. 2014, 60, 27–33. [Google Scholar] [CrossRef]
- Badescu, V. Theoretical derivation of heliostat tracking errors distribution. Sol. Energy 2008, 82, 1192–1197. [Google Scholar] [CrossRef]
- Badescu, V. Different tracking error distributions and their effects on the long-term performances of parabolic dish solar power systems. Int. J. Sol. Energy 1994, 14, 203–216. [Google Scholar] [CrossRef]
- Ha, S.M.; Choi, D.; Han, M.; Lee, J.S. Optical design of a static solar concentrator using Fresnel lenses. J. Mech. Sci. Technol. 2017, 31, 949–958. [Google Scholar] [CrossRef]
- Dai, J.; Liu, Y.; Yu, T. Development of flux density distribution measurement system based on CCD. J. Optoelectron. Laser 2008, 19, 1507–1511. [Google Scholar]
- Eldin, S.S.; Abd-Elhady, M.S.; Kandil, H.A. Feasibility of solar tracking systems for PV panels in hot and cold regions. Renew. Energy 2016, 85, 228–233. [Google Scholar] [CrossRef]
- Mousavi Maleki, S.A.; Hizam, H.; Gomes, C. Estimation of hourly, daily and monthly global solar radiation on inclined surfaces: Models re-visited. Energies 2017, 10, 134. [Google Scholar] [CrossRef]


| Description | Accuracy | Range | %error |
|---|---|---|---|
| Diffuse flat receiver | Reflectivity > 0.95 | 250–2500 nm | - |
| Polar-axis tracking unit | ±0.1° | ±75° | 1.5 |
| Solar pyranometer | ±1 W/m2 | 0–4000 W/m2 | 1 |
| CCD camera | 1.0 V/Lux-s | 400–1030 nm | 0.4 |
| Adjustable platform | ±5 μm | 0–60 mm | 1 |
| Apparent Solar Time | I (W/m2) | Xmax | Xmean | Erec (W) | ηopt (%) | ηre-opt,loss (%) |
|---|---|---|---|---|---|---|
| 10:00 | 437 | 1319.57 | 86.64 | 297.38 | 71.61 | 1.87 |
| 11:00 | 451 | 1382.95 | 87.29 | 309.20 | 72.14 | 1.14 |
| 12:00 | 460 | 1411.00 | 88.03 | 318.05 | 72.76 | 0.30 |
| 13:00 | 454 | 1380.68 | 87.36 | 311.51 | 72.20 | 1.06 |
| 14:00 | 445 | 1319.43 | 86.91 | 303.74 | 71.82 | 1.58 |
| Reference * | 460 | 1439.99 | 88.30 | 319.01 | 72.97 | - |
| Tracking Error Angle | I (W/m2) | Xmax | Xmean | Erec (W) | ηopt (%) | ηre-opt,loss (%) |
|---|---|---|---|---|---|---|
| 0° | 460 | 1411.00 | 88.03 | 318.05 | 72.76 | 0.30 |
| 0.5° | 460 | 1361.80 | 87.84 | 317.34 | 72.59 | 0.52 |
| 1° | 460 | 1228.04 | 85.16 | 307.67 | 70.38 | 3.55 |
| 1.5° | 460 | 1058.61 | 72.92 | 263.44 | 60.26 | 17.42 |
| 2° | 460 | 893.46 | 50.80 | 183.52 | 41.98 | 42.47 |
| 2.5° | 460 | 592.72 | 21.39 | 77.27 | 17.68 | 75.78 |
| Reference * | 460 | 1439.99 | 88.30 | 319.01 | 72.97 | - |
| Periodical Adjustment Error Angle | I (W/m2) | Xmax | Xmean | Erec (W) | ηopt (%) | ηre-opt,loss (%) |
|---|---|---|---|---|---|---|
| 0° | 460 | 1411.00 | 88.03 | 318.05 | 72.76 | 0.30 |
| 0.5° | 460 | 1328.24 | 87.76 | 317.06 | 72.53 | 0.61 |
| 1° | 460 | 1189.79 | 83.42 | 301.38 | 68.94 | 5.53 |
| 1.5° | 460 | 1025.56 | 70.02 | 252.99 | 57.87 | 20.70 |
| 2° | 460 | 858.52 | 31.38 | 113.38 | 25.94 | 64.46 |
| 2.5° | 460 | 503.20 | 17.52 | 63.31 | 14.48 | 80.15 |
| Reference* | 460 | 1439.99 | 88.30 | 319.01 | 72.97 | - |
| Apparent Solar Time | Sun Declination Angle | |||||||||||
|---|---|---|---|---|---|---|---|---|---|---|---|---|
| +23°27′ | 0° | -23°27′ | ||||||||||
| Xmax | Xmean | ηopt (%) | ηre-opt,loss (%) | Xmax | Xmean | ηopt (%) | ηre-opt,loss (%) | Xmax | Xmean | ηopt (%) | ηre-opt,loss (%) | |
| 10:00 | 1346.76 | 90.40 | 74.71 | 0.116 | 1395.54 | 90.47 | 74.77 | 0.040 | 1346.76 | 90.40 | 74.71 | 0.116 |
| 11:00 | 1407.93 | 90.49 | 74.78 | 0.015 | 1453.76 | 90.50 | 74.79 | 0.003 | 1407.93 | 90.49 | 74.78 | 0.015 |
| 12:00 | 1426.71 | 90.50 | 74.79 | 0.009 | 1471.48 | 90.50 | 74.80 | 0 | 1426.71 | 90.50 | 74.79 | 0.009 |
| 13:00 | 1407.93 | 90.49 | 74.78 | 0.015 | 1453.76 | 90.50 | 74.79 | 0.003 | 1407.93 | 90.49 | 74.78 | 0.015 |
| 14:00 | 1346.76 | 90.40 | 74.71 | 0.116 | 1395.54 | 90.47 | 74.77 | 0.040 | 1346.76 | 90.40 | 74.71 | 0.116 |
| Reference # | 1471.48 | 90.51 | 74.80 | - | ||||||||
© 2018 by the authors. Licensee MDPI, Basel, Switzerland. This article is an open access article distributed under the terms and conditions of the Creative Commons Attribution (CC BY) license (http://creativecommons.org/licenses/by/4.0/).
Share and Cite
Wang, H.; Huang, J.; Song, M.; Hu, Y.; Wang, Y.; Lu, Z. Simulation and Experimental Study on the Optical Performance of a Fixed-Focus Fresnel Lens Solar Concentrator Using Polar-Axis Tracking. Energies 2018, 11, 887. https://doi.org/10.3390/en11040887
Wang H, Huang J, Song M, Hu Y, Wang Y, Lu Z. Simulation and Experimental Study on the Optical Performance of a Fixed-Focus Fresnel Lens Solar Concentrator Using Polar-Axis Tracking. Energies. 2018; 11(4):887. https://doi.org/10.3390/en11040887
Chicago/Turabian StyleWang, Hai, Jin Huang, Mengjie Song, Yanxin Hu, Yunfeng Wang, and Zijian Lu. 2018. "Simulation and Experimental Study on the Optical Performance of a Fixed-Focus Fresnel Lens Solar Concentrator Using Polar-Axis Tracking" Energies 11, no. 4: 887. https://doi.org/10.3390/en11040887
APA StyleWang, H., Huang, J., Song, M., Hu, Y., Wang, Y., & Lu, Z. (2018). Simulation and Experimental Study on the Optical Performance of a Fixed-Focus Fresnel Lens Solar Concentrator Using Polar-Axis Tracking. Energies, 11(4), 887. https://doi.org/10.3390/en11040887