Article

Verification of Heat and Mass Transfer Closures in Industrial Scale Packed Bed Reactor Simulations

1
Department of Energy and Process Engineering, Norwegian University of Science and Technology (NTNU), NO-7491 Trondheim, Norway
2
Department of Chemical Engineering, University of Coimbra, Rua Sílvio Lima, Polo II, 3030-790 Coimbra, Portugal
3
SINTEF Materials and Chemistry, Flow Technology Department, S. P. Andersens veg 15 B, NO-7031 Trondheim, Norway
*
Author to whom correspondence should be addressed.
Energies 2018, 11(4), 805; https://doi.org/10.3390/en11040805
Submission received: 28 January 2018 / Revised: 14 March 2018 / Accepted: 28 March 2018 / Published: 30 March 2018
(This article belongs to the Section I: Energy Fundamentals and Conversion)

Abstract

:
Particle-resolved direct numerical simulation (PR-DNS) is known to provide an accurate detailed insight into the local flow phenomena in static particle arrays. Most PR-DNS studies in literature do not account for reactions taking place inside the porous particles. In this study, PR-DNS is performed for catalytic reactions inside the particles using the multifluid approach where all heat and mass transfer phenomena are directly resolved both inside and outside the particles. These simulation results are then used to verify existing 1D model closures from literature over a number of different reaction parameters including different reaction orders, multiple reactions and reactants, interacting reactions, and reactions involving gas volume generation/consumption inside the particle. Results clearly showed that several modifications to existing 1D model closures are required to reproduce PR-DNS results. The resulting enhanced 1D model was then used to accurately simulate steam methane reforming, which includes all of the aforementioned reaction complexities. The effect of multiple reactants was found to be the most influential in this case.

1. Introduction

Packed bed gas-solid systems are widely used in the chemical and process industry. Due to this industrial importance, modelling and simulation of packed bed reactors have been an important research and industrial priority for several decades.
With the development in computational resources, it is now possible to perform resolved 3D simulations of fluid flow as well as heat and mass transfer phenomena in realistic particle packings. The advantages of such resolved simulations, commonly referred to as particle-resolved direct numerical simulations (PR-DNS), have been pointed out by [1]. Due to the homogeneous average voidage inside a typical packed bed, the resolved simulation of a small segment of the bed can give valuable insight into the local transport phenomena, applicable to the whole packed bed. This is especially helpful in evaluating and improving industrially affordable 1D models without uncertainties associated with experiments, which motivates the current work.
A complete evaluation of 1D model performance requires full resolution of all transfer phenomena, both inside and outside the particles. However, the vast majority of PR-DNS studies involves studying pressure drop, particle–fluid heat transfer, and dispersion only on the fluid region [2,3,4,5,6,7,8,9,10,11,12,13,14,15,16,17,18,19,20,21,22] either on an orderly or randomly packed bed of spherical or cylindrical particles.
Analyzing the intraparticle transfer phenomena requires the particles to be meshed, which increases the computational overhead and also complicates the mesh generation. There have been several works including the intraparticle heat transfer for the nonreactive cases [5,23,24,25,26]. The complexity intensifies as the reactions are considered, with most of the available computational fluid dynamics (CFD) solvers not allowing chemical species inside the porous catalyst [27]. They consider the particle as solid regions [27]. To model reacting resolved systems some authors have constrained the parameters studied or simplified the geometries. Mousazadeh et al. [28] used a 2D model to study the ethylene oxidation, while Zhou et al. [29] chose to use a 3D spherical particle bed, without considering intraparticle effects to analyze an isopropanol-acetone-hydrogen heat pump module.
Particle resolved simulations for intraparticle reactive systems of steam methane reforming with catalyst particles as porous mediums was first presented by Dixon et al. [30] for spherical particles and by Dixon et al. [31] for cylindrical particles. They developed an approach in Fluent® to use user-defined parameters to be defined inside the solid particles and thus help in extracting correct heat and mass transfer at particle surfaces.
Recently, Dixon [27] presented a study for 3D simulations of heterogeneous catalytic reactions in packed beds of N = 5.96 with reactions happening inside the porous particle and not confined to the particle surface. They suggested that, in order to understand the transport phenomena and reaction engineering inside the packed bed, it is essential to have a particle bed long enough to obtain the developed flow properties.
Previous studies from the authors have used PR-DNS to study the intraparticle heat and mass transfer applied to reacting systems with both spherical [32,33] and cylindrical particles [34]. In these works, the geometry simulated is extracted from a large realistic packing in order to minimize wall, inlet, and outlet effects [19,20].
The objective of the current work is to use the conceptually more correct PR-DNS for a geometry of monodisperse spherical particles with solid catalyzed reactions taking place inside the porous catalyst particle. The main purpose of this study is to evaluate and improve the existing mass and heat transfer closures commonly used in industrial scale 1D models against the PR-DNS data for realistically packed particle packing. Moreover, our study is the only one focused on investigating and suggesting modifications to 1D models for simulating the steam methane reforming process compared with results from detailed scale of PR-DNS.
The work is presented as follows: in Section 2 we have explained the methodology, grid independence, closure models, and simulation setups. Section 3 documents the major findings of the paper with the investigation based on (i) reaction orders, (ii) multiple reactions, (iii) gas volume, and (iv) steam methane reforming reactions. Then finally we conclude in Section 4.

2. Methodology

2.1. Thiele Modulus and Effectiveness Factor

Intraparticle diffusion resistances are important in describing the actual reaction rate inside the catalyst pellet. The effectiveness factor ( η ) is defined by Equation (1) and quantifies the effect intraparticle diffusion resistance has on reaction rate [35,36,37,38].
η   = actual   reaction   rate reaction   rate   without   diffusion   limitations
The concept of effectiveness factor (η) in heterogeneous catalytic reactions for porous particles is given by Levenspiel [38]. Meanwhile, Thiele [39] added the plots of effectiveness factor vs. Thiele modulus for simple reaction orders. Thiele modulus ( ϕ ) is a dimensionless number dependent upon reaction rates, effective diffusivities, and concentration of the reactant in the fluid surrounding the particle (Equation (2)).
ϕ   = reaction   rate diffusion   rate
The effectiveness factor (η) and Thiele modulus ( ϕ ) definitions for spherical particles (given in Equations (3) and (4)) are according to the general definitions of these parameters given in Rawlings [35] for an nth order generic catalytic reaction ( A   k B ) ,   where   r = k c A n . Thus, for heterogeneous catalytic reaction systems, the effectiveness factor can be defined as a function of Thiele modulus. For the spherical particles studied in this work, a = r p / 3 .
ϕ   =   n + 1 2   k c A n 1 a 2 D e
η   = 1 ϕ   [ 1 tan h ϕ   1 3 ϕ ]
D e = D ε t

2.2. Conservation Equations

The steady state incompressible conservation equations for continuity, momentum, specie transfer, and energy for both 3D and 1D frameworks in Newtonian flow are given by the Eulerian multifluid approach, which assumes the gas phase and solid phase to be interpenetrating continua. Both the phases operate with separate sets of equations. The conservation of equations for each phase (k) are given in Equations (6)–(9). The momentum equation is not solved for the solid phase as the velocities of solid phase are fixed to zero, being a packed bed. In addition, species are only conserved for the gas phase because the solid acts only as a catalyst and does not undergo any reaction.
· ( α k ρ k u k ) =   0
· ( α g ρ g u g u g ) =   α g p + · τ ¯ ¯ g + α g ρ g g + K p g ( u p u g )
· ( α g ρ g g Y g , i ) =   · α g   J g , i + α g   S g , i
· ( α k ρ k u k h k ) =   τ ¯ ¯ k :   u k +   Q k +   ·   ( j h k , j J k , j )
The Ergun Equation [40] is used to account for drag in Equation (7) (last term). Interphase heat exchange term ( Q k ) in Equation (9) is modelled according to our previous work [19]. The rightmost term in Equation (8) accounts for the heterogeneous catalytic reactions implemented. The parametric studies presented in this study utilize a hypothetical reaction to allow for easy interpretation of results, but an example with real steam methane reforming reactions is also presented. These reactions are detailed later in the paper.
To be consistent with the previous works [19,20] using a similar way to obtain the geometry (Section 2.3.1), steady state DNS (and hence Equations (6)–(9)) in ANSYS Fluent 17.0 with phase coupled SIMPLE (Semi-Implicit Method for Pressure Linked Equations) algorithm and 2nd order spatial discretization for all other equations is used.
For the DEM simulation, only Newton’s translation motion equation with tangential forces included is solved to obtain the packed bed (Equation (10)).
m p d v d t =   m p g +   i = 1 j ( F p , i , n +   F p , i , t )

2.3. PR-DNS Simulation Setup

2.3.1. Geometry and Mesh Development

The spherical particle bed is generated using the discrete element method (DEM) in ANSYS Fluent. The methodology of generating the particle bed, extracting and creating the rendered geometry from this large bed for the simulations is exactly similar to the previous work with monodisperse spherical particles (Section 2.1 of [19]).
The overlap between the spherical particles in our realistically packed bed geometry is dealt with by caps method with the cylinder cap size of dp/50. This is consistent with the detailed study done in Section 3.3 of [19].
Following the creation of the geometry, the rendered geometry is meshed with polyhedral elements both inside and outside the particles using the Fluent Meshing tool with resolution dp/60 (Section 2.3.3). This allows for directly simulating mass and heat transfer phenomena both inside and outside the porous particle.
The rendered geometry used for simulations in this study is considered to be free from wall effects as proven for external heat transfer in our previous work [19]. This was found to be consistent even for this work, and we found negligible wall effects for specie conversion.

2.3.2. Boundary Conditions and Simulation Parameters

The simulated geometries contain a velocity inlet, pressure outlet, and a non-slip zero heat flux reactor wall [19]. The grain diameter inside the porous particles is set to 1 × 10⁻⁷ m. This small diameter results in essentially instantaneous momentum and heat transfer to prevent any flow through the particle and to ensure thermal equilibrium between the gas and the solid phase, especially with the high particle porosity employed in this work. As discussed later in Section 2.3.4, the particle porosity in the PR-DNS simulations had to be set close to unity in order to ensure accurate simulation of external heat transfer. A particle porosity of 0.993 was chosen, resulting in a 100 times lower solid concentration than a conventional particle with a porosity of 0.3. This implies that the volumetric reaction rate and particle thermal conductivity had to be increased by a factor of 100 to replicate the behavior of a regular particle with a porosity of 0.3.
Similar to our previous work [19], the method of calculating the bulk fluid temperature on a number of planes (in total 25 planes with gap of dp/5 between each plane) perpendicular to the flow was followed, in order to extract bulk specie concentrations ( Y b u l k ). In this way, the specie concentrations were calculated locally on each plane by Equation (11), where Y is the mass or mole fraction of the reacting specie. The resulting axial profiles of bulk temperature and species are suitable for direct comparisons to 1D model results.
Y b u l k =   ( u . e z ) Y d A ( u . e z ) d A

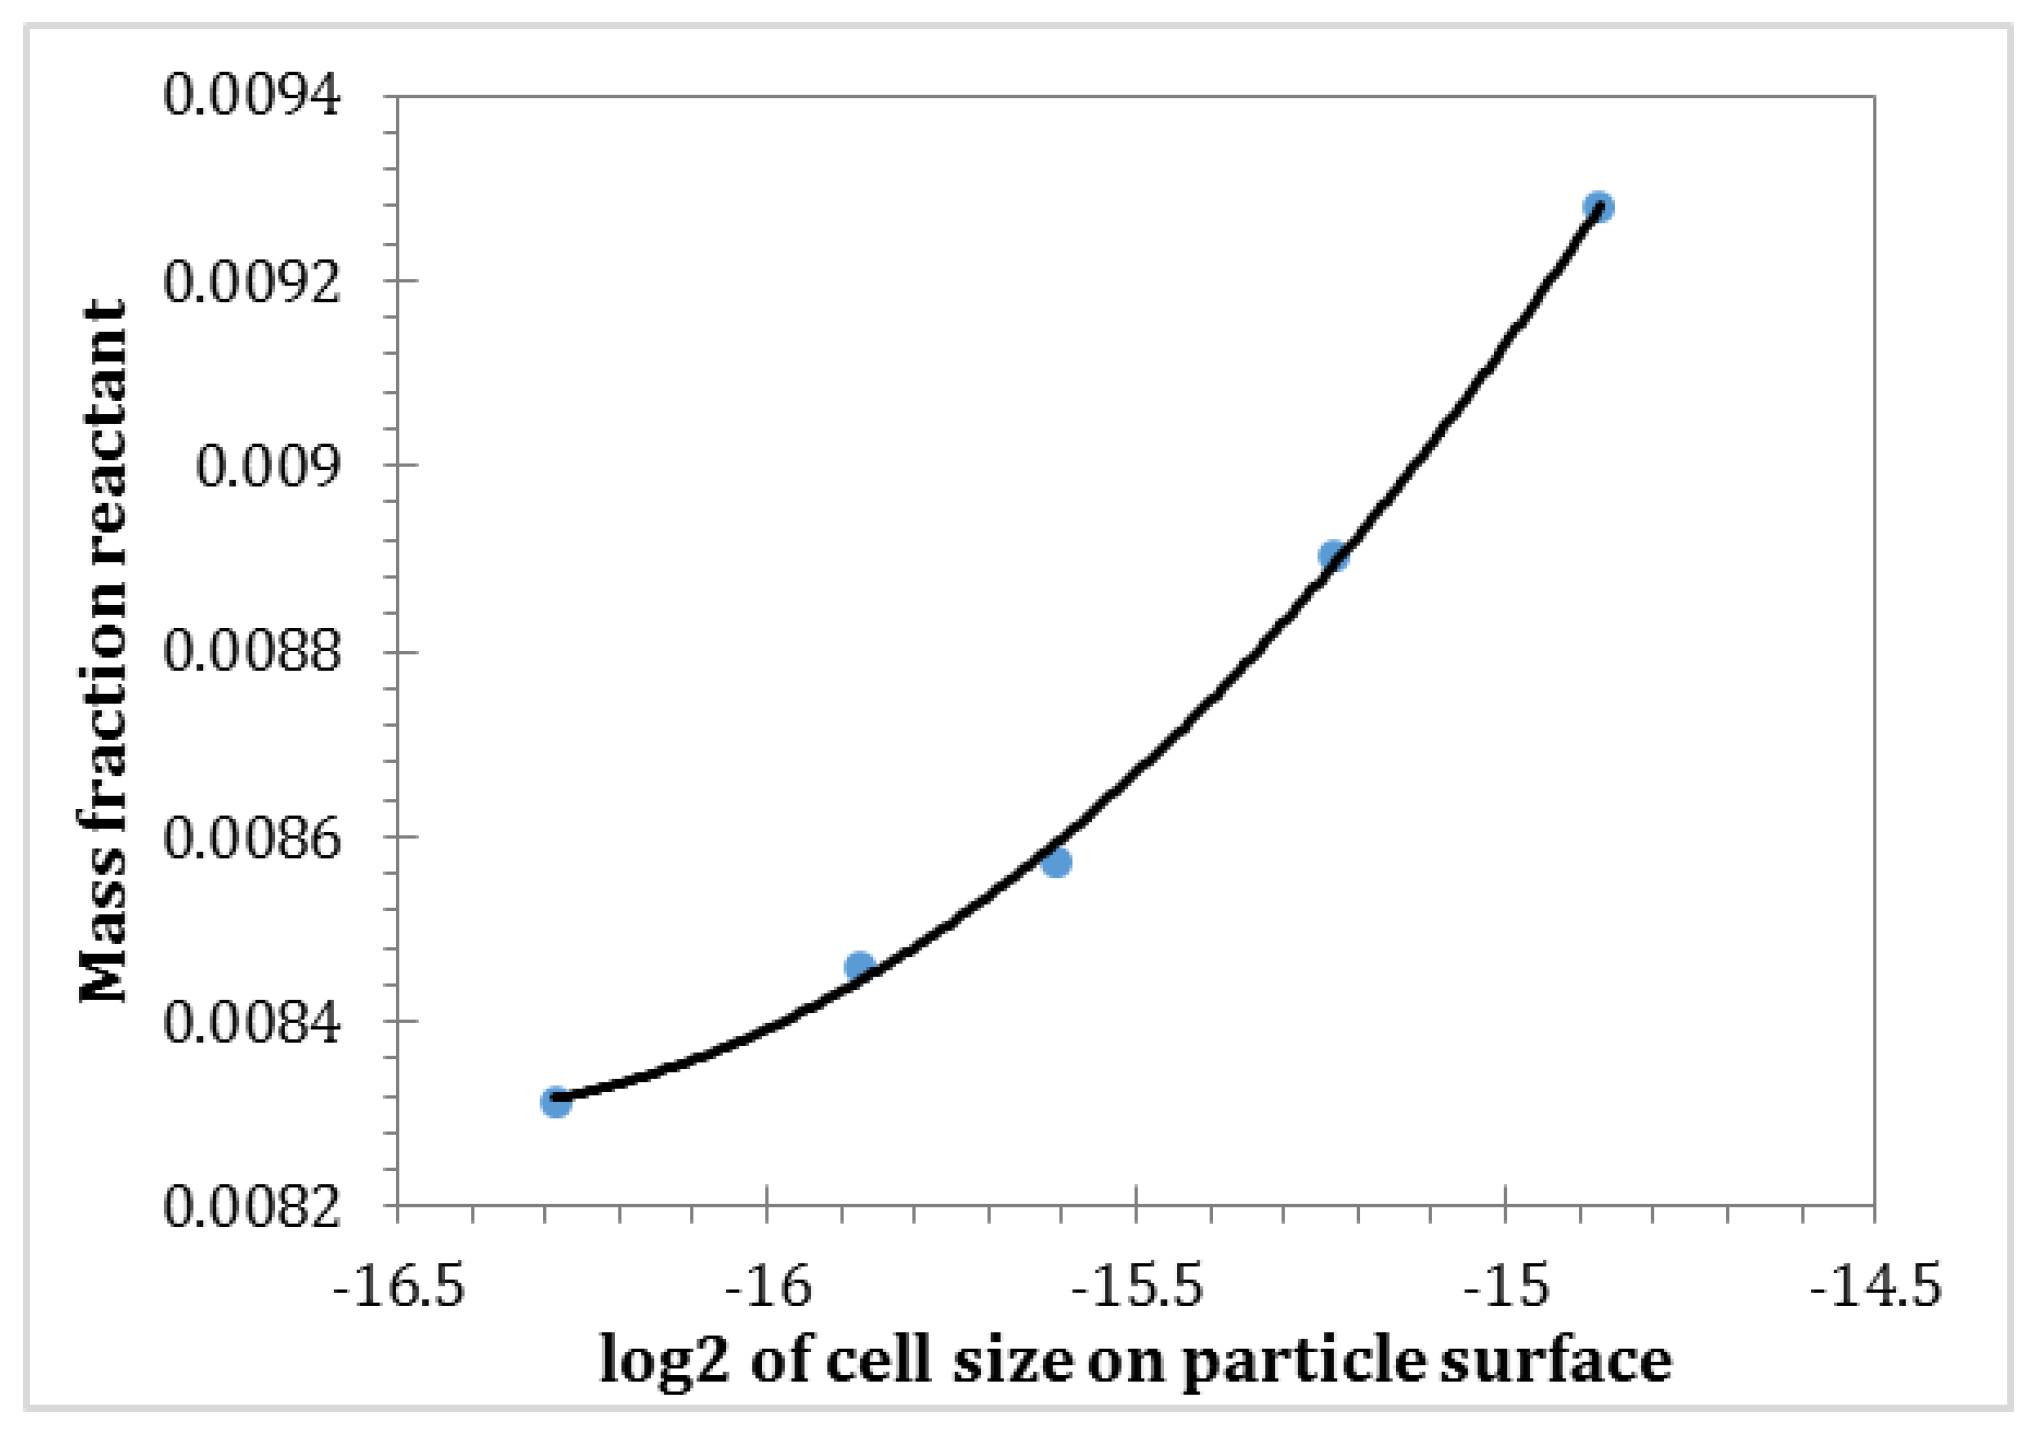
2.3.3. Mesh Dependence

The simulation for mesh independence study involved a hypothetical heterogeneous first-order catalytic reaction (Equation (12)). The reaction takes place inside the porous solid particle (by grain model [41]). The simulation is carried out at Reynolds number (Re = 100), Prandtl number (Pr = 1), and Thiele module ( ϕ = 10) with inlet reactant mass fraction (xA = 0.1). These conditions are representative of typical packed bed reactors, although a very wide range of Reynolds numbers can be found in industry. The relatively low reactant mass fraction was selected to ensure that the reaction enthalpy did not lead to excessive temperature changes. Equation (13) presents the reaction rate for an exothermic reaction (dHrxn = −10 kJ/mol) i.e., Equation (12), with pre-exponential factor in Equation (14) calculated to result in the reaction constant of 10,000 1/s at an inlet temperature of 1000 K. These values represent a relatively fast reaction, which ensures a thorough evaluation of grid independence behavior. The solid particle and particle bed properties are given in Table 1.
A   ( g ) + solid B   ( g ) + solid
r c a t =   α p k c A
k =   k 0   e ( E R T )
The mesh independence study is completed at an exothermic reaction (dHrxn = −10 kJ/mol) because the external heat transfer becomes the controlling phenomenon in this case and therefore the grid size becomes important. The mass fraction of specie A (xA) at 2 planes (Section 2.3.2) below the outlet is analysed to explore the mass fraction of xA through the geometry on different grid sizes. Figure 1 shows that the overall conversion decreases with each doubling of the grid size when fitted with an exponential function. This is because larger cell sizes overpredict the external heat transfer, allowing more of the heat generated by the exothermic reaction to leave the particle, in turn resulting in a cooler particle and a lower reaction rate. The difference between the value at dp/60 and the infinitesimally small cell size results in the difference of 4.8%. Thus the cell size of dp/60 on particle surfaces is used in this work. Subsequently, the growth rate of 20% is followed to fill the voids for fluid and solid sections.

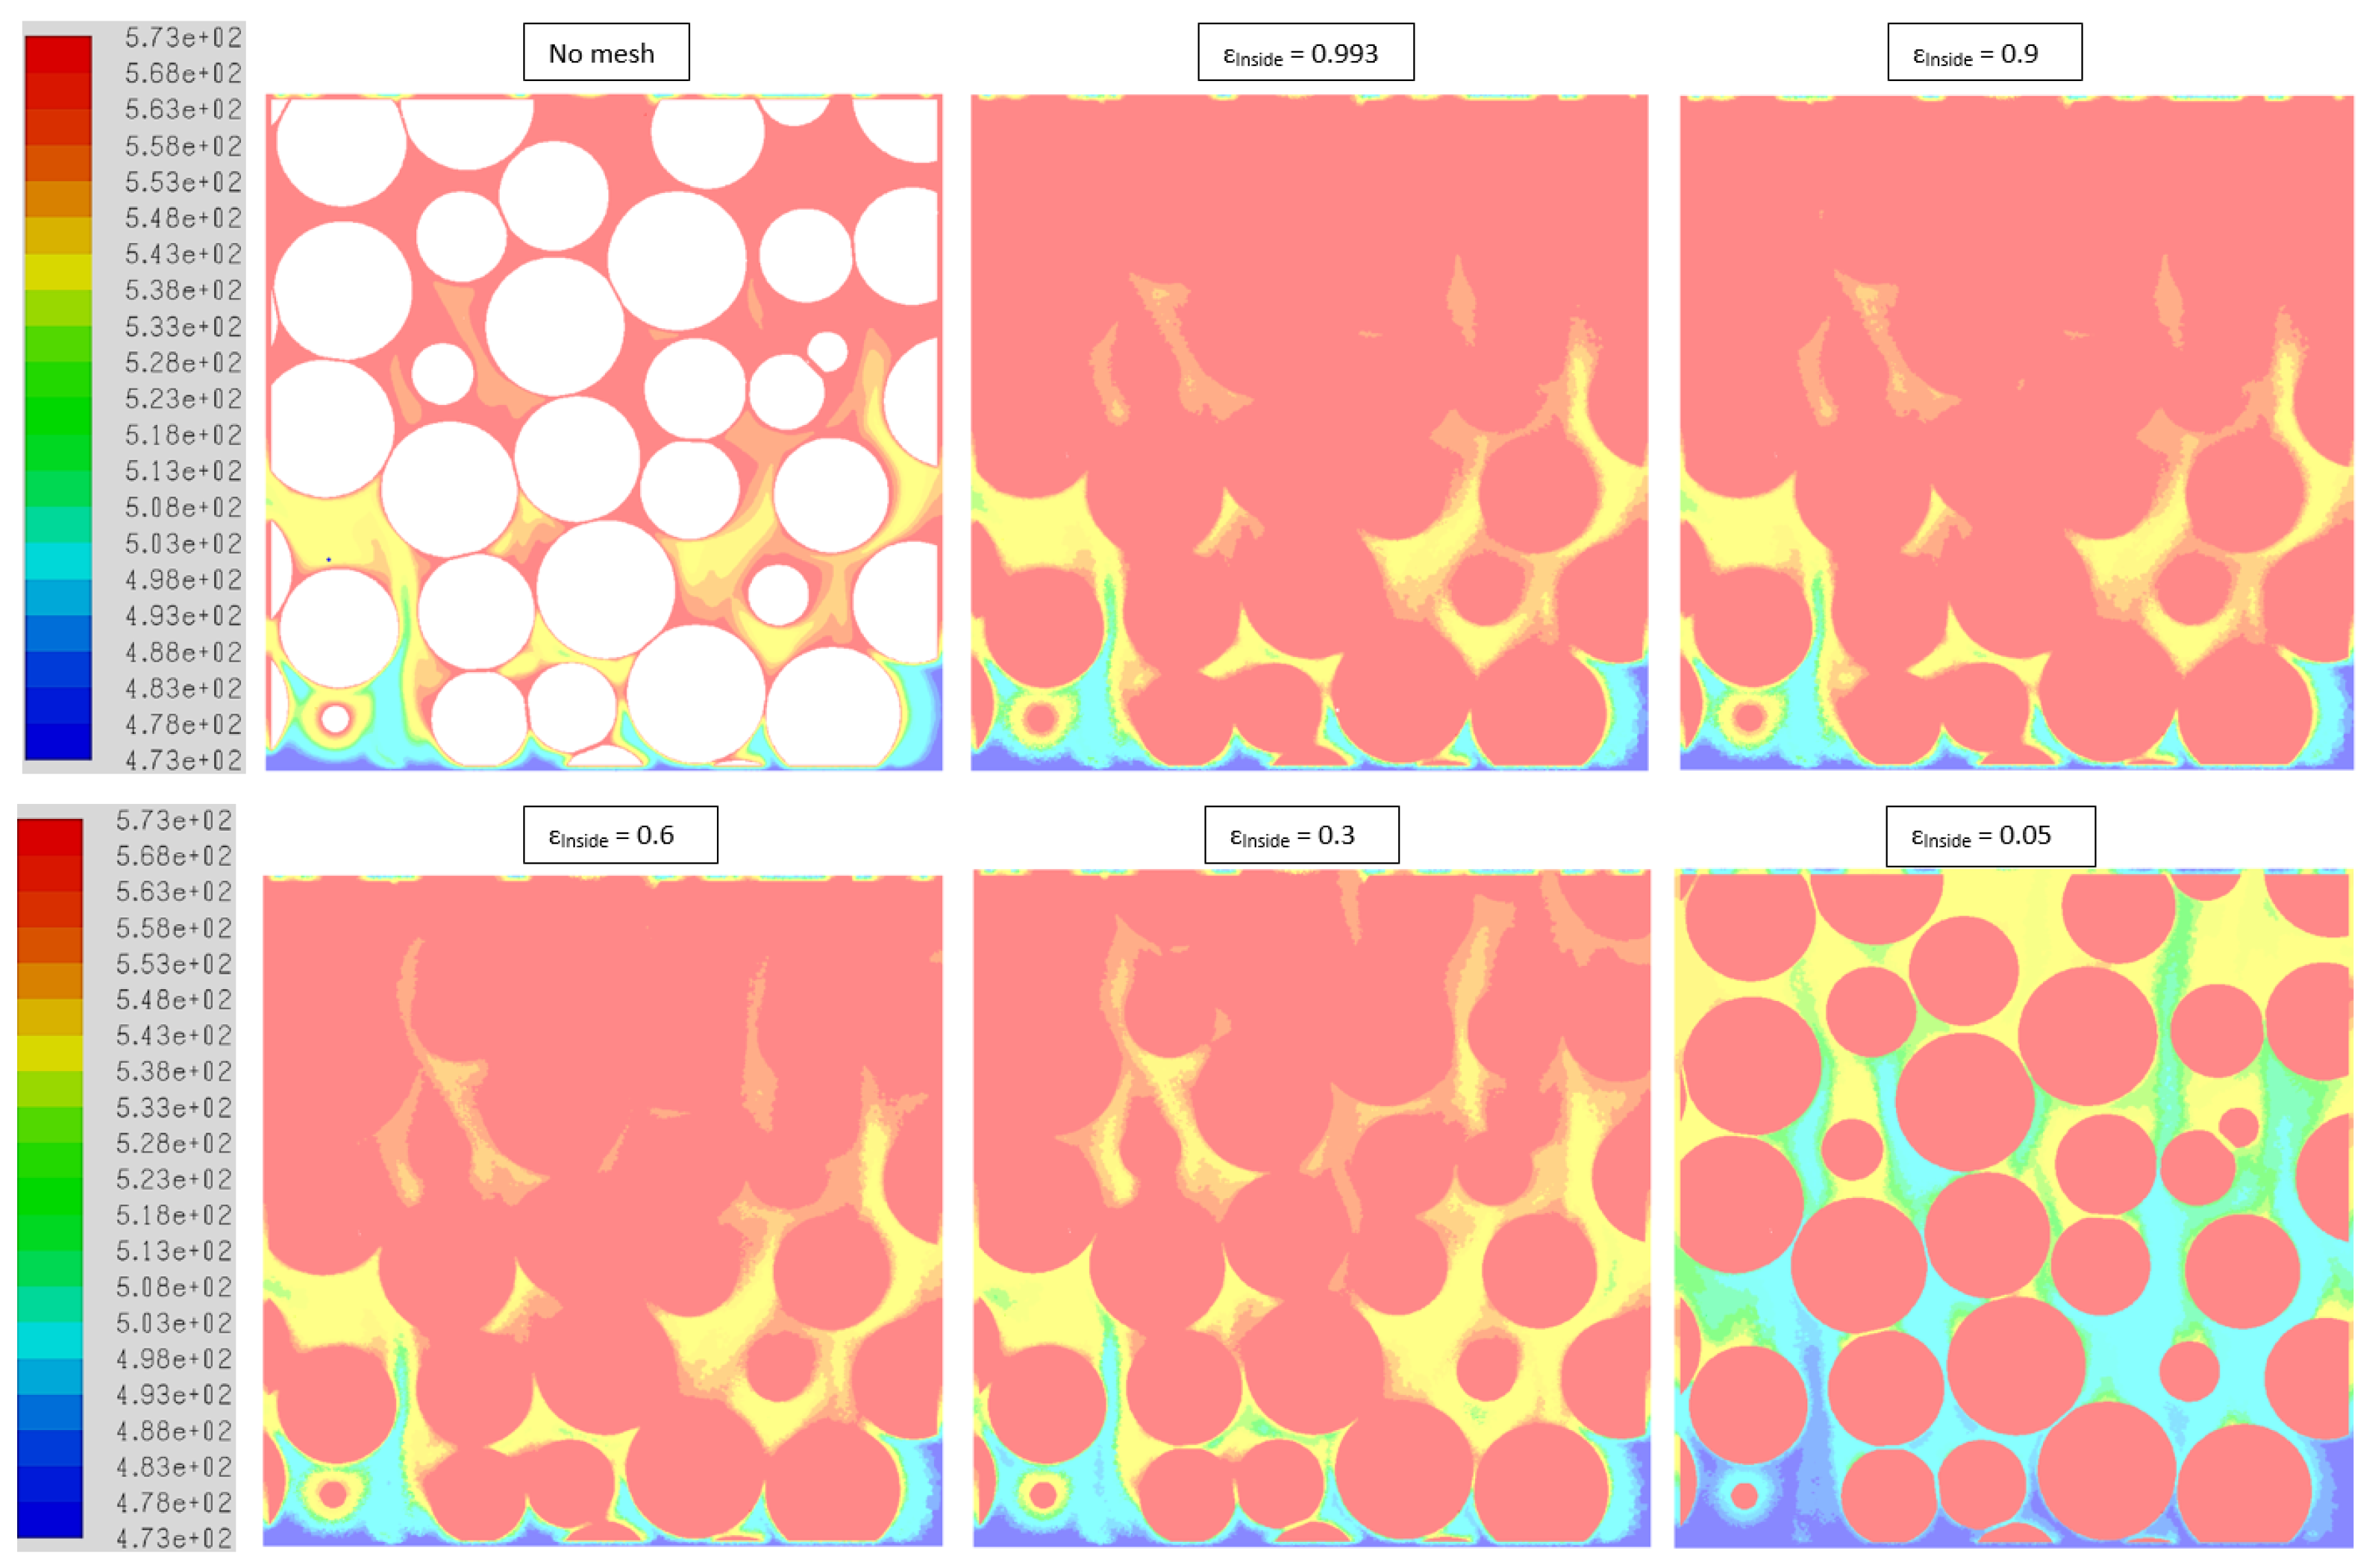
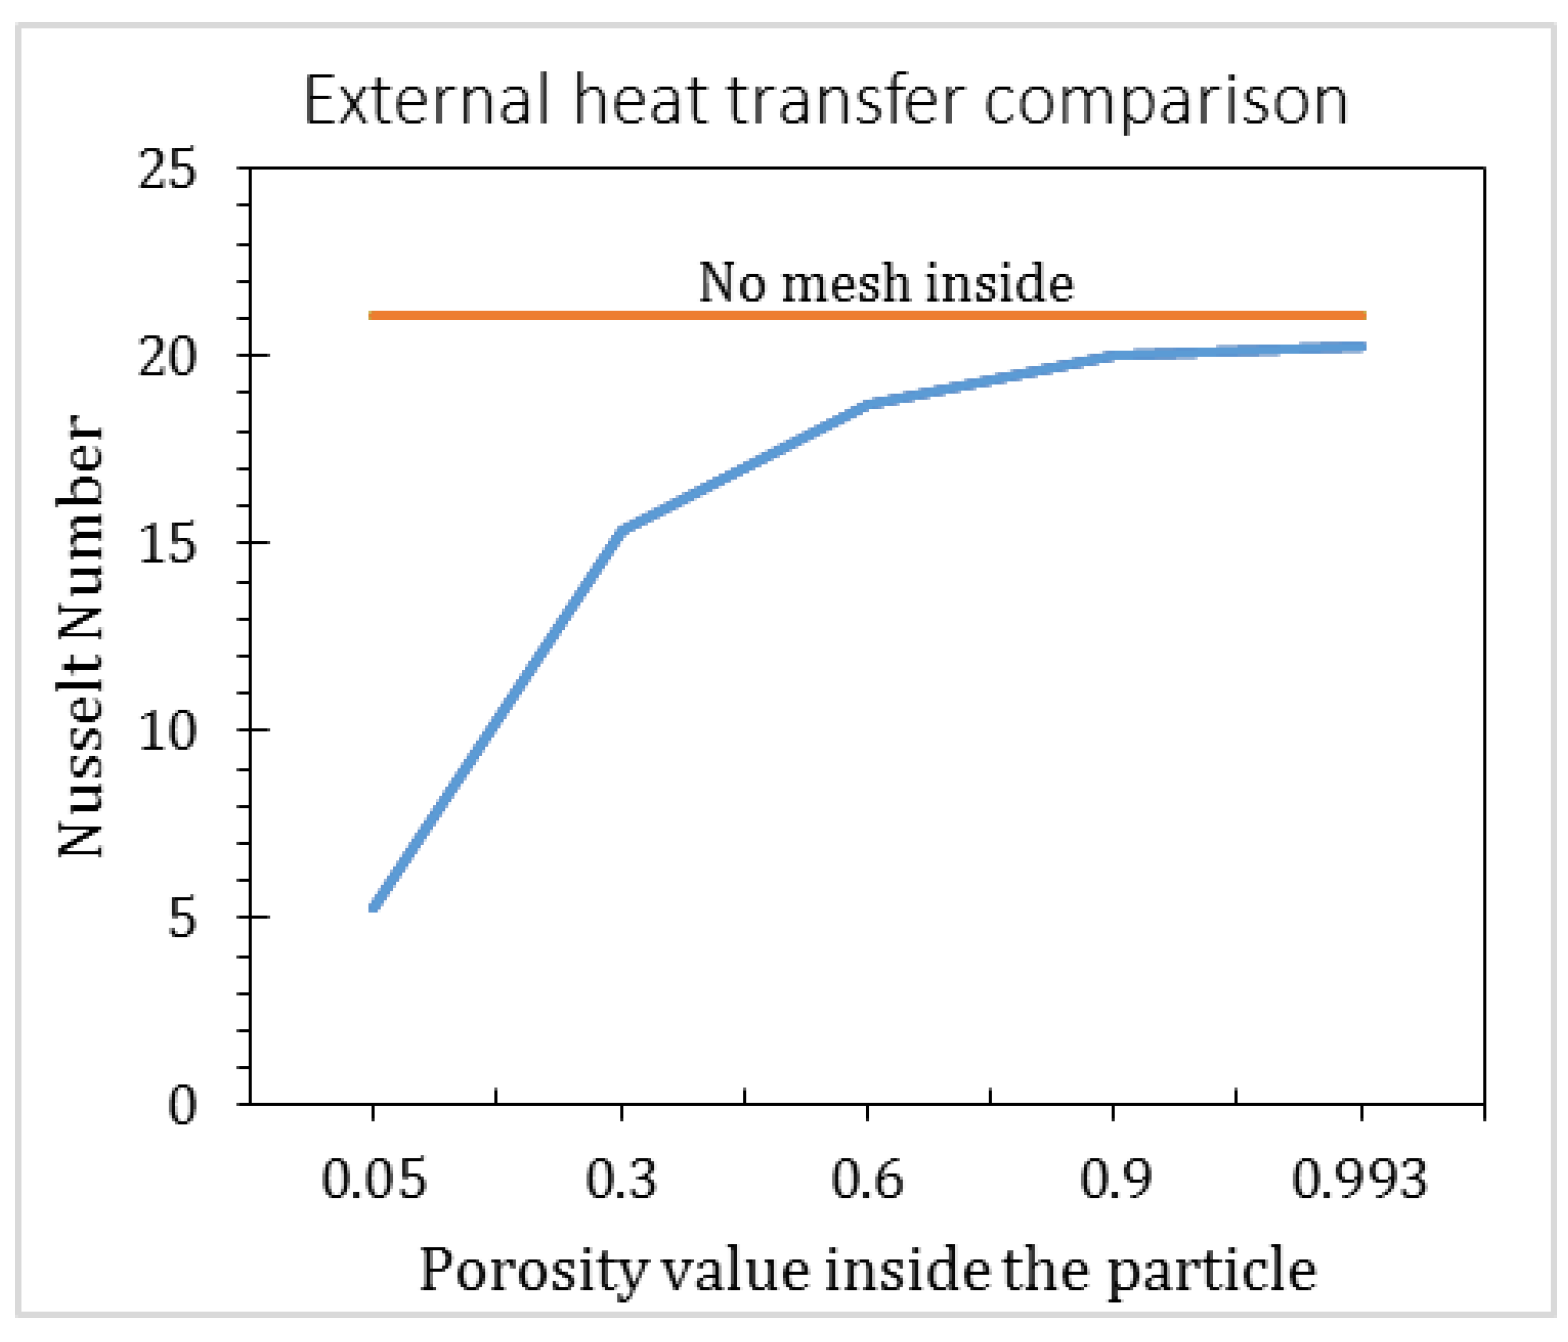
2.3.4. Void Fraction inside the Particle

The solid catalyst particles are defined as fluid regions in ANSYS Fluent using the multifluid approach and then a specific solid volume fraction value is patched into this region. This enables direct simulation of heat and mass transfer including gas density gradients inside the solid particle (as would be the case when the reaction creates or consumes gas volume).
Before proceeding with the intraparticle transfer, the ability of ANSYS Fluent to predict external heat transfer with the Eulerian multifluid approach is verified. The external heat transfer simulations on a geometry of spherical particles (ε = 0.352) are performed for Re = 100, Pr = 1, Tinlet = 473 K, and Tp = 573 K. The comparison is made over a range of particle porosity values (εinside = 0.05–0.993) and an ideal external heat transfer case, where the particle surface is defined as a wall without any inside mesh [19]. Figure 2 shows that as the particle porosity (εinside) value increases (or particle volume fraction (αp) decreases), the fluid temperature relates more closely to the ideal external heat transfer case.
This effect is quantified in Figure 3, when the Nusselt number (with the methodology explained in Section 2.2.2 of [19]) is extracted from all the cases shown in Figure 2. It is seen that Nusselt number value for external heat transfer from particle surface to fluid approaches the ideal value (i.e., the case value with no mesh inside the particles) as the particle porosity (εinside) is increased, with almost the same Nusselt number prediction between εinside = 0.993 or αp = 0.007 and No mesh case. This sensitivity is related to the multifluid assumption creating numerical errors on the edge of the particles where there is a step change in volume fraction in ANSYS Fluent.
Based on this result, the value (εinside = 0.993) is used for particle void fraction in the PR-DNS simulations and the reaction rate constant is increased by a factor of 100 to mimic the more realistic case where εinside = 0.3. This unrealistically high particle porosity is the main contestable assumption in this work. However, it was explicitly confirmed that this highly porous particle still behaved correctly in the simulation. In particular, the small selected grain size inside the particle (10−7 m) ensured that interphase momentum and heat transfer was essentially instantaneous as would be the case in a particle with realistic porosity. The ability of our model to represent the highly porous particles as perfect obstructions to the flow was thoroughly verified by visualizing velocity vectors showing that no gas passes through the highly porous particles employed in the PR-DNS simulations.
Regarding the reaction rate, Equation (18) shows the usually assumed proportionality to solids volume fraction. Thus, a particle with a solids volume fraction of 0.007 and a 100× higher reaction rate constant would return exactly the same reaction rate as a particle with a realistic solids volume fraction of 0.7 and the real reaction rate constant. The same approach is followed for the solids thermal conductivity, which is also proportional to the solids volume fraction. Finally, realistic intraparticle diffusion is ensured by imposing an effective diffusivity (Equation (5)) of D e = D / 5 , where the factor of 5 is representative of realistic particle porosity and tortuosity values.
The perfect match to the 1D model for a simple first-order reaction presented later in Figure 5 can be viewed as a validation of this PR-DNS approach. In this case, the effectiveness factor in Equation (4) represents an exact analytical solution of the mass transfer resistance inside the particle. Given that the 1D model was run with a realistic particle porosity of 0.3, this perfect match clearly illustrates the validity of the PR-DNS approach, despite the unrealistically low porosity that was necessary to ensure accurate predictions of external heat transfer.

2.4. 1D Packed Bed Model

As outlined in Section 2.2, the 1D model is also based on the Eulerian multifluid approach. Only in this case, the void fraction is constant in all cells and the geometry is meshed only in one direction. More details can be found in the previous work of the authors [44] and the applications in subsequent studies [32,33]. The domain is discretized into 100 cells with the length of the geometry equal to the PR-DNS geometry as given in Table 1. The 1D model is solved with similar simulation setup and boundary condition of respective PR-DNS cases. The primary difference is that the particles are assumed to have a realistic void fraction of 0.3 (as opposed to εinside = 0.993 used in the PR-DNS as outlined in the previous section), so no adjustment to the reaction rate is required.
This work focuses on closure models to account for external heat and mass transfer and intraparticle diffusion that are required to model the phenomena that are directly resolved in PR-DNS. The models to define intraparticle diffusion [35,38] are given in Equations (3)–(5), while the closures for external heat and mass transfer are given in Equations (15) and (16). These models are based on our previous work with monodisperse spherical particles [19] and are integrated to calculate the effective reaction rate in 1D models.
N u = 2.67 + 0.53 Re 0.77 Pr 0.53
S h = 2.67 + 0.53 Re 0.77 Sc 0.53
The mean solid volume fraction (α) in 1D models is fixed as a product of particle bed volume fraction (1 − ε) times the inside particle volume fraction (αp = 0.7). Also, the heat of reaction (dHrxn) in appropriate sections where heat transfer limitations exist is assigned to the solid phase unlike the PR-DNS (in which it is assigned as an enthalpy term to gas phase) as suggested in previous work [33].

3. Results and Discussion

In this section, the comparison of 1D models with PR-DNS is discussed based on different levels of complexity in the reactant behavior. Note that all simulations are carried out in a small geometry to allow for direct comparisons with computationally expensive PR-DNS, but the 1D models can easily be extended to large-scale simulations (e.g., [44,45]).

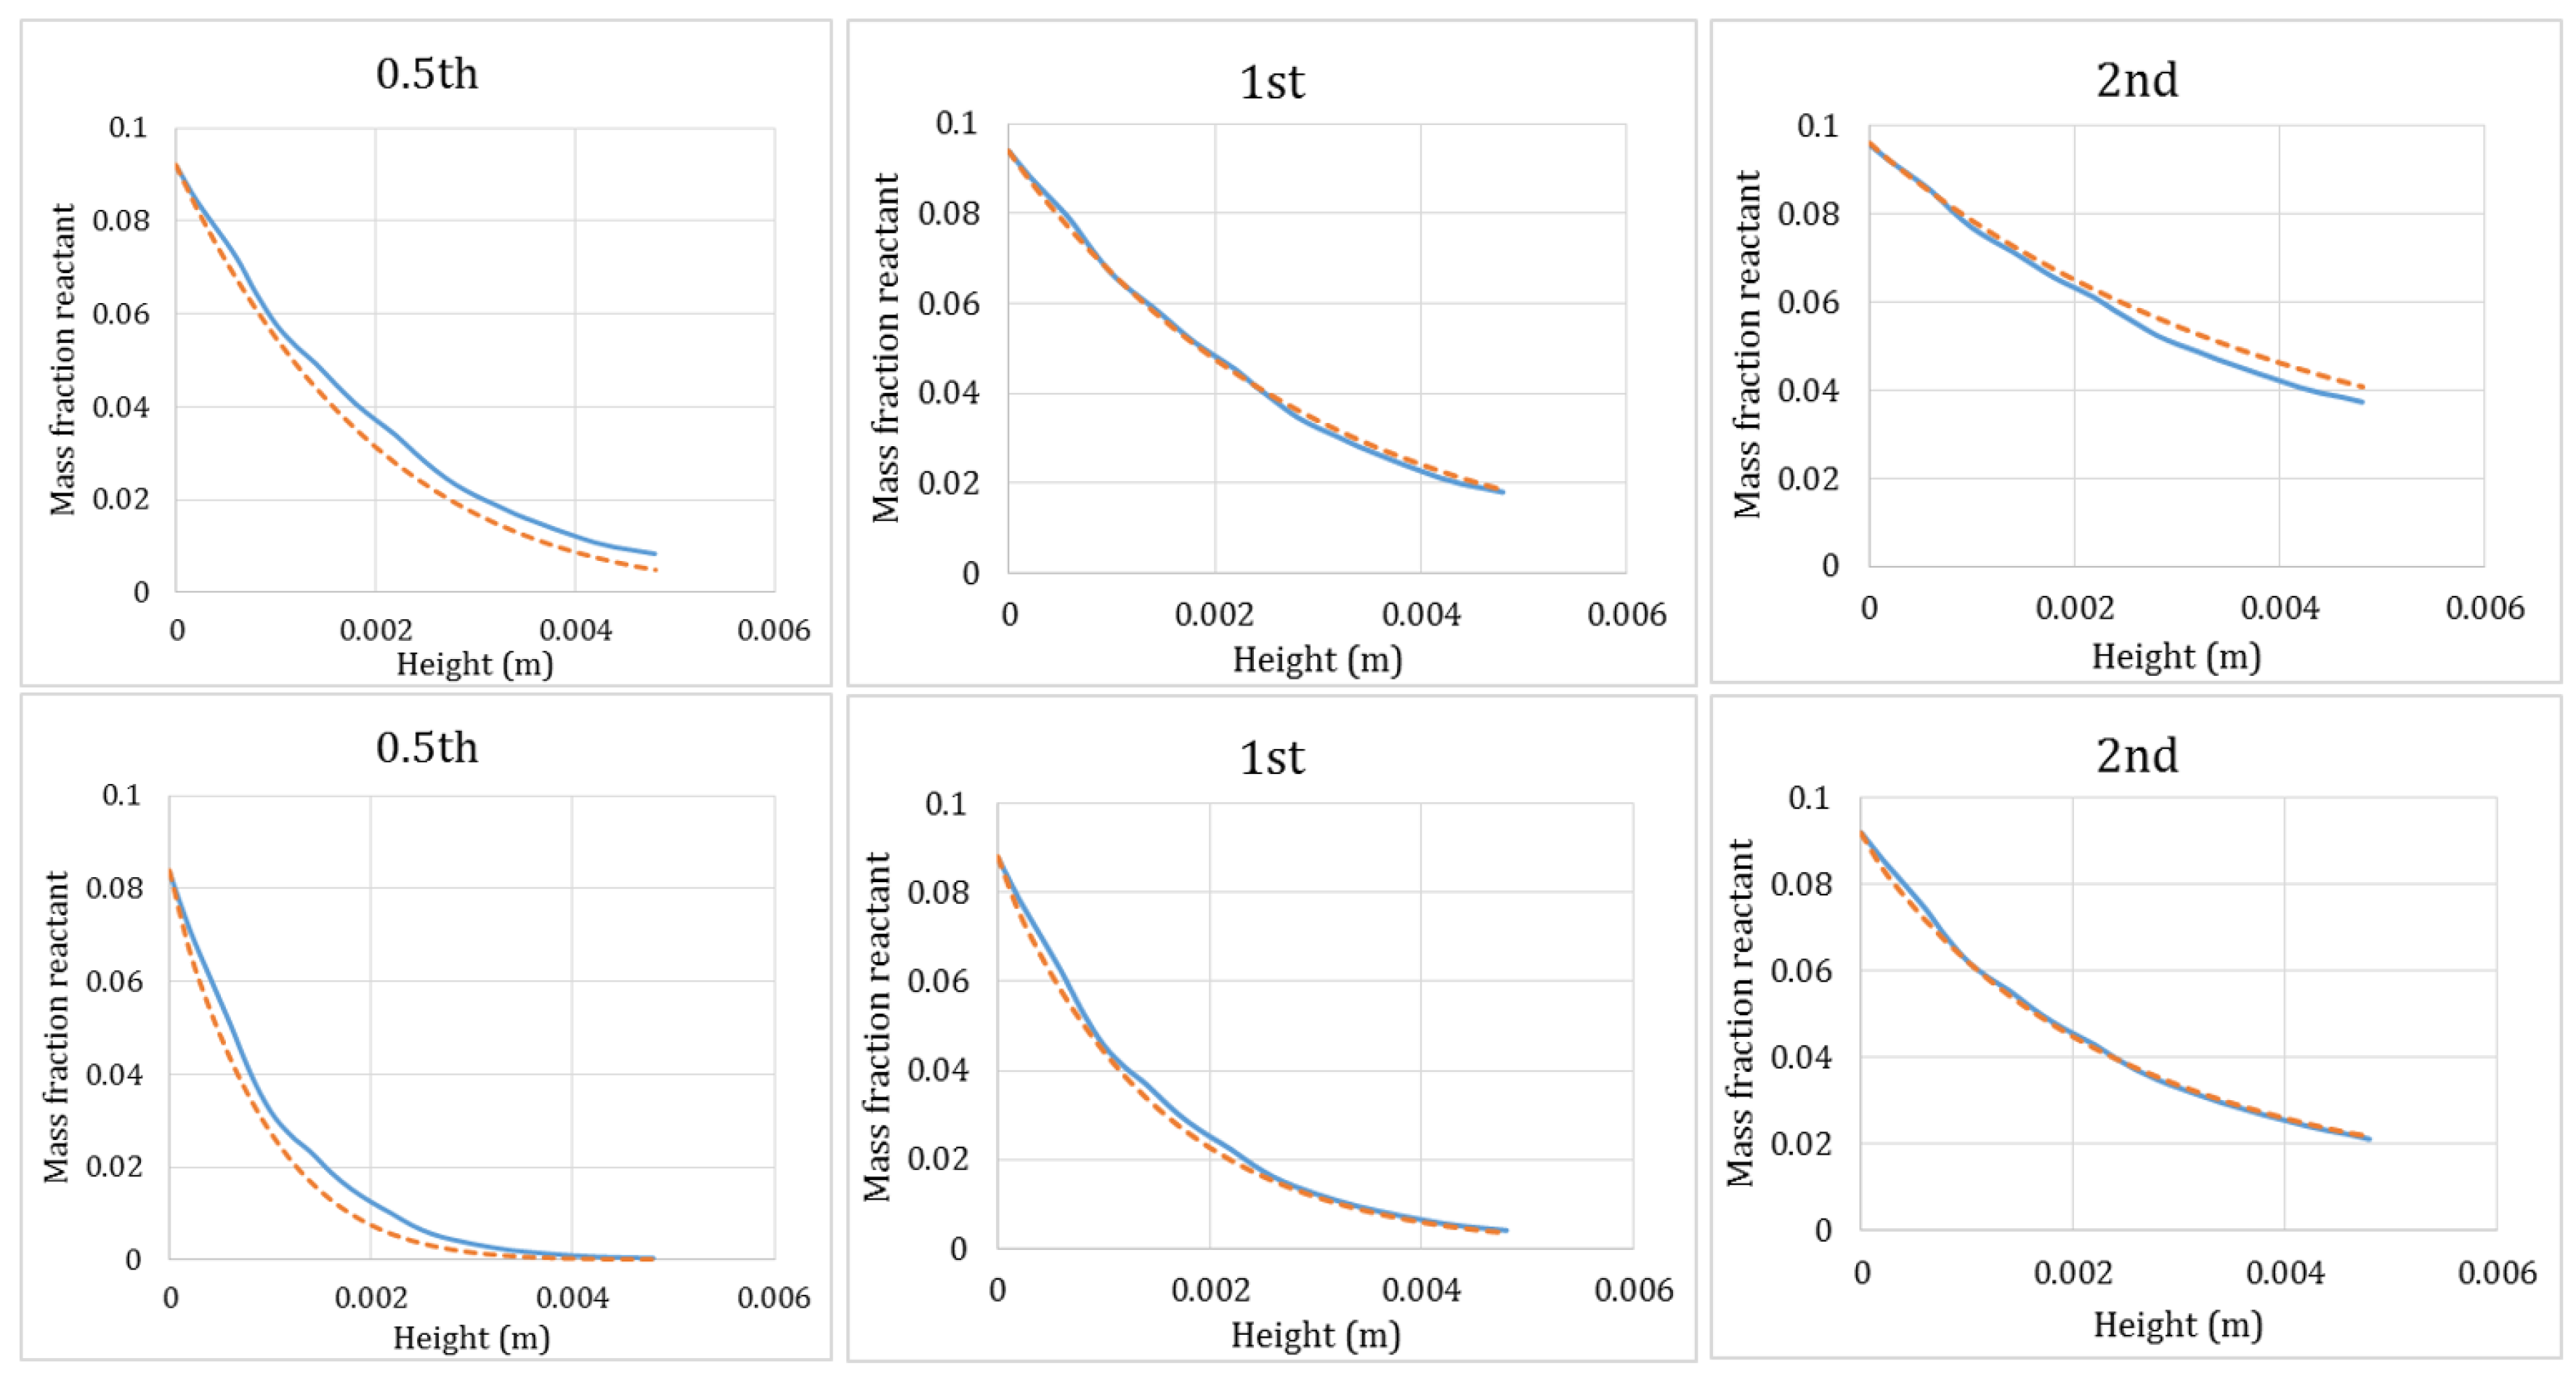
3.1. Single Isothermal Reaction with Different Reaction Orders

The ability of 1D models to predict correct reactant conversion with different reaction orders is studied in this section. It is expected that an excellent match will be achieved for a first-order reaction because Equation (4) represents an exact analytical solution for this case. However, for reaction orders different from unity (and for the more complex reaction systems presented in subsequent sections), Equations (3) and (4) are approximate in nature, requiring further verification and possible modification. For the hypothetical catalytic reaction in Equation (12), both the PR-DNS and 1D models are simulated with the properties given in Table 2. The molecular diffusivity (D) and thermal conductivity (k) of the gas is calculated based on the values ( ϕ = 10; Pr =1; Re = 100 and Sc ≈ 0.7).
In order to have uniformity in the predictions of reactant concentration (xA) with different reaction orders, the temperature influence (i.e., no heat transfer limitations) on reaction rate in this validation is eliminated. First, the effective diffusivity (De) of the gas inside the particle is calculated for the first-order reaction with reaction rate constant of 10,000 1/s (for ϕ = 10 and ϕ = 5) using Equation (3). Here, we assume that D e = D / 5 to account for a realistic particle porosity and tortuosity. Following this, using the rearranged Equation (3) for a fixed inlet concentration (cA = 10 mol/m3), the reaction rate constant (k; Equations (18) and (3)) for each reaction order is calculated in Equation (17). This practice ensures that the ratio of reaction rate to diffusion rate at the start of the geometry is identical between cases with different reaction orders.
k = 2 ϕ 2 D e ( n + 1 ) c A n 1 a 2
r n =   α p k n c A n
The reaction rate for each reaction order (namely 0.5th, 1st, and 2nd) is defined using Equation (18). The PR-DNS results of specie conversion of reactant (A) for inlet mass fraction (xA) at ϕ = 10, simulated for the setup and flow properties in Table 2, are shown in Figure 4. The reaction rate resistances increase with increase in reaction order, which is reflected in Figure 4. Thus, the reactant concentration (xA) gets consumed fastest at 0.5th order reaction. The reaction rate at the inlet is similar between cases, but slows down in the remainder of the domain in the cases with a higher reaction order as the reactant is consumed.
The results of reactant conversion through the reactor from the 1D model and PR-DNS compared for two different Thiele modulus values ( ϕ = 10, 5) over three different reaction orders are shown in Figure 5. Overall, the 1D model compares well with the PR-DNS simulations. The change in reaction order is well captured by the 1D model, with overall reactant conversion decreasing with increased reaction order.

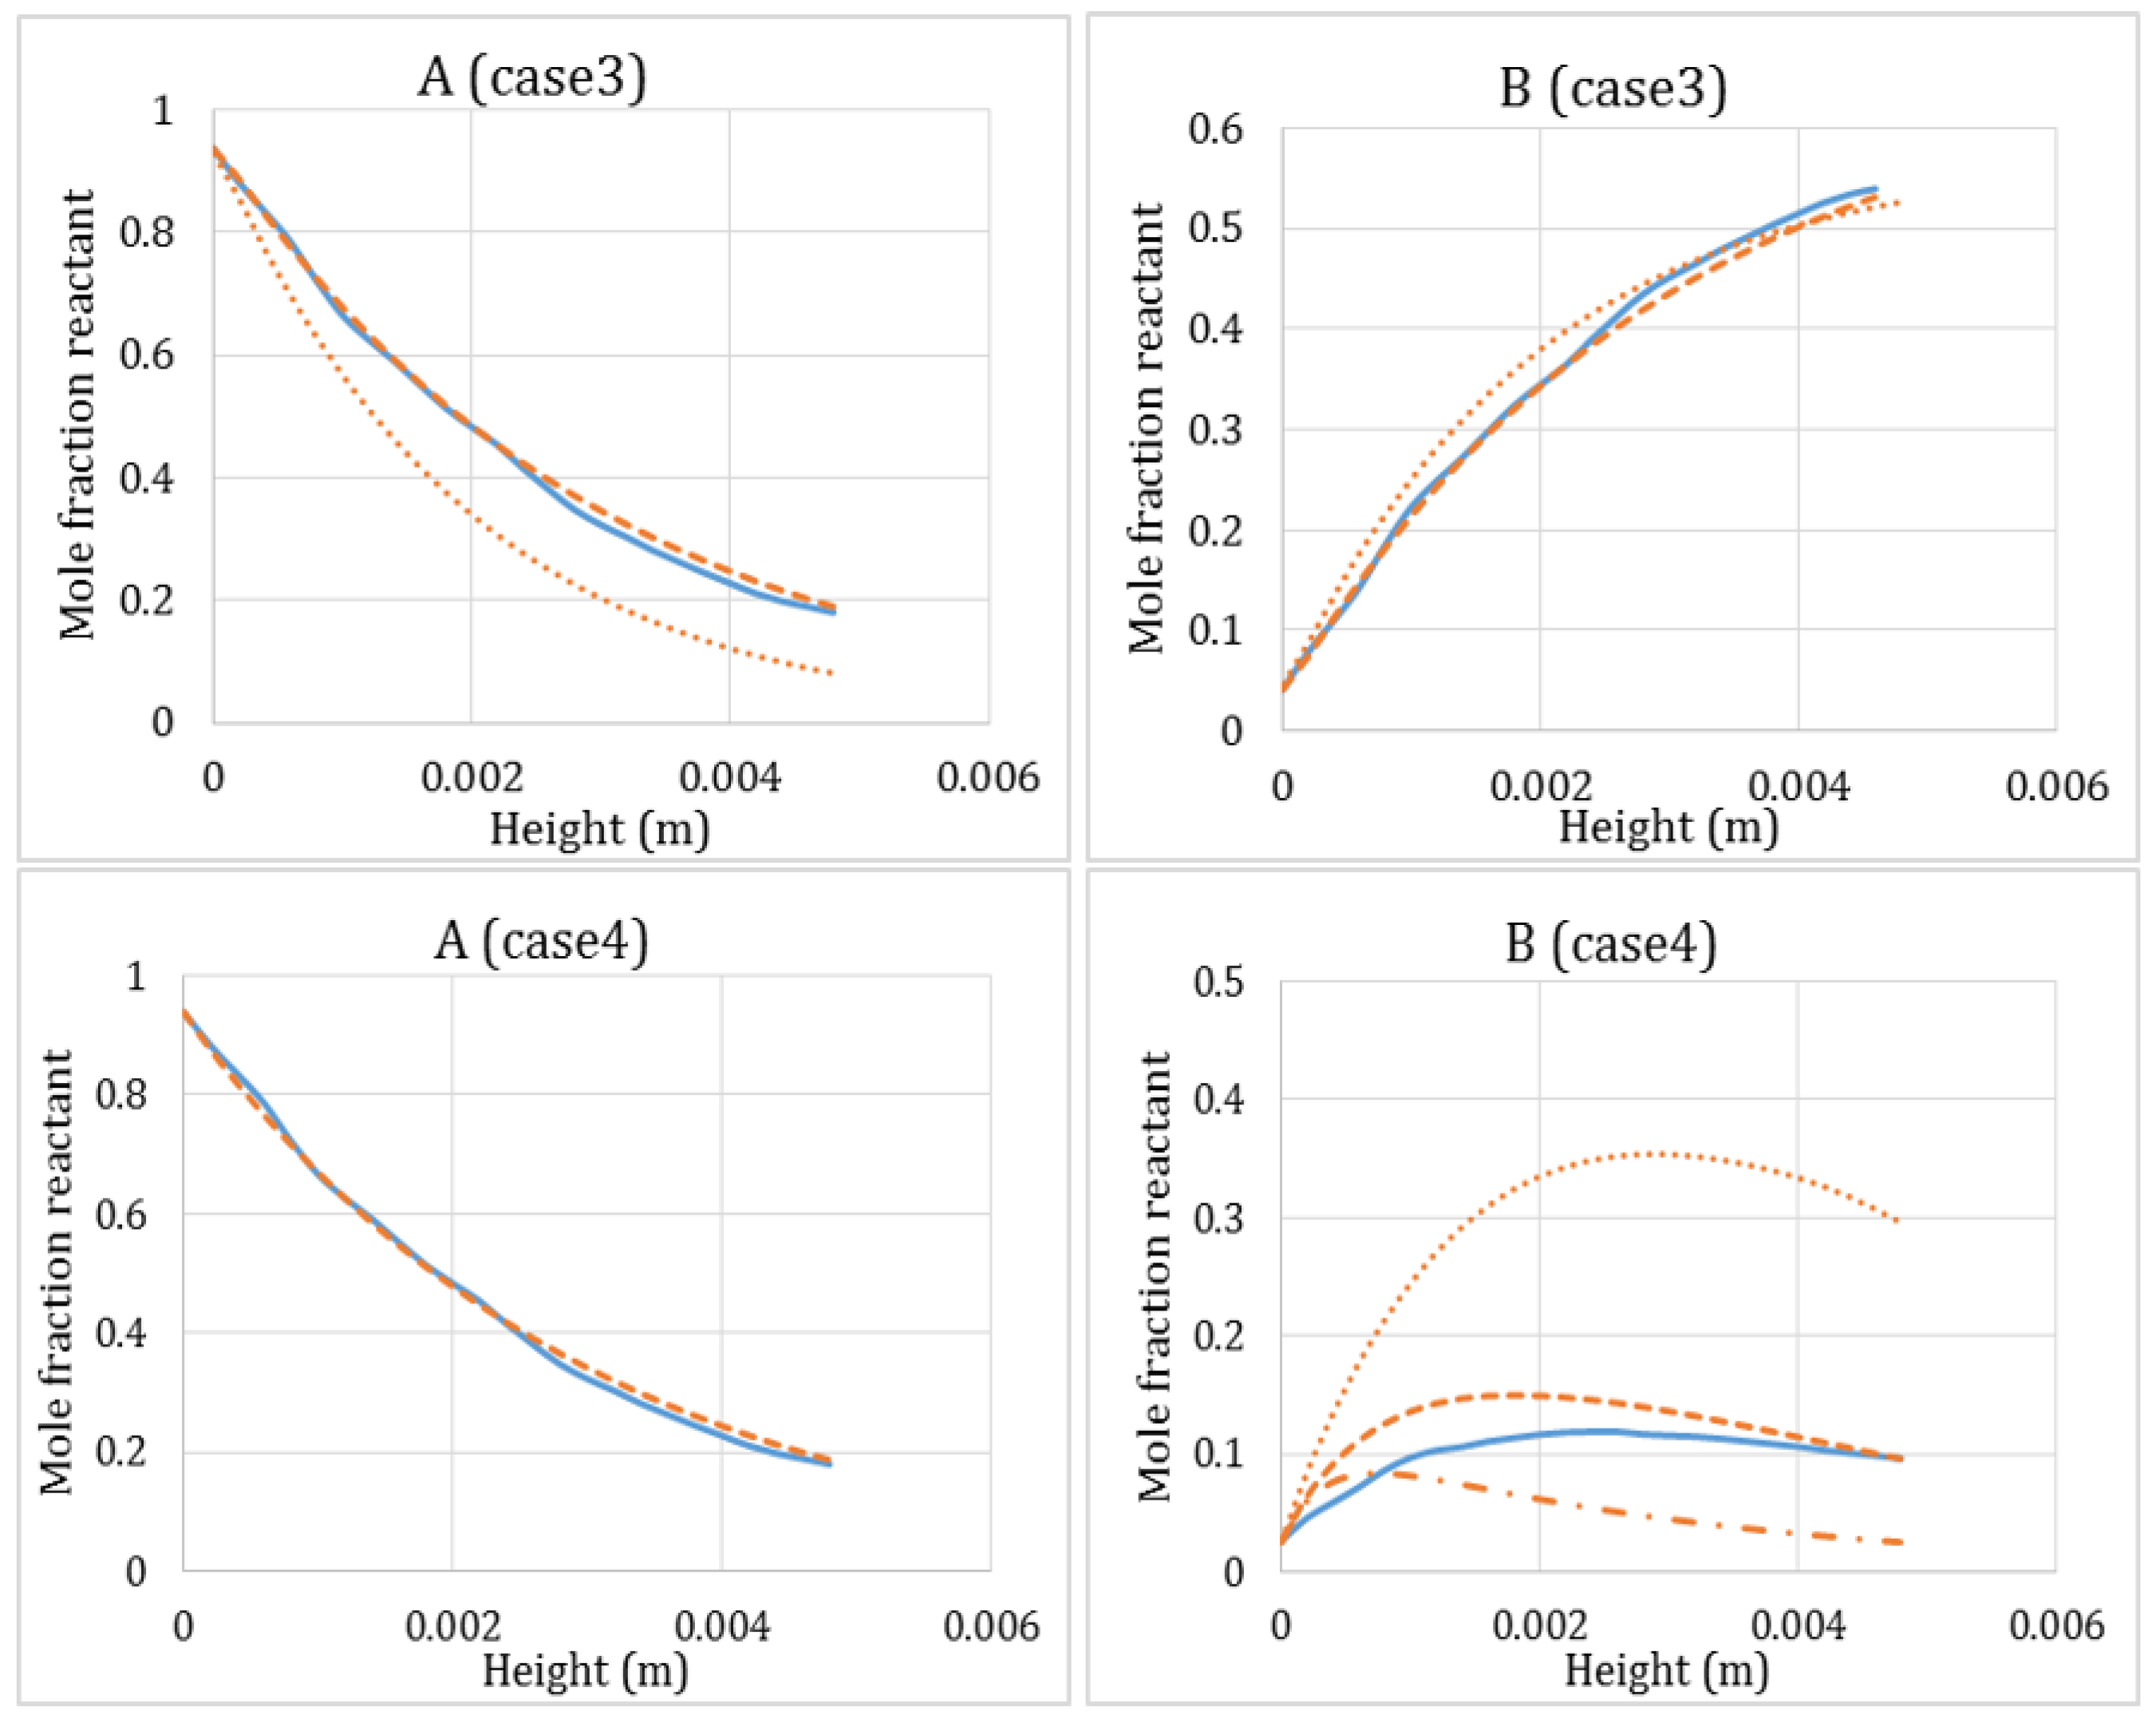
3.2. Multiple Isothermal Reactions

Chemical reaction systems often consist of multiple reactions or reactions with multiple reactants. This leads to interactions between species reaction and diffusion phenomena in the particle and could result in significant errors when using a single component mass transfer model. This section will therefore evaluate a number of different cases with multiple reactions/reactants to quantify the uncertainties that such reaction systems introduce to 1D packed bed modelling. The four investigated cases are briefly described below:
  • single catalytic reaction with two reactants (Case 1, Equation (19))
  • Two reactions with one independent reactant each (Case 2, Equation (20))
  • Two reactions consuming the same reactant at different rates (Case 3, Equation (21), parallel reactions)
  • Two reactions where the product of the first reaction is the reactant of the second (Case 4, Equation (22), sequential reactions)
In order to simplify the comparison between Cases 1 and 2, the inlet reactant ratio (of A and B i.e., yA:B = 1:2) is kept the same, and simulated for ϕ = 10, with flow properties for all the reacting species [(Case 1 (Equation (19)) and Case 2 (Equation (20))] similar and given in Table 2. The reaction rate constant (k2) for Case 2 (Equation (20)) is offset to 1000 1/s. The reaction rate constant (k1) for Case 1 is defined based on the fixed reaction rate constant of Case 2 (Equation (21)), by assuming the overall reaction rate from both cases to be equal at the reactor inlet.
A   ( g ) + B   ( g ) + solid   C   ( g ) + D   ( g ) + solid r A = α p k 1   c A   c B
A   ( g ) + solid   C   ( g ) + solid ;   r A = α p k 2 c A B   ( g ) + solid   D   ( g ) + solid ;   r B = α p k 2 c B
As may be expected, Figure 6 shows that the two independent reactions in Case 2 are well captured by the 1D model without any adjustment. For the multiple reactants in Case 1, however, an adjustment was required to define the overall effectiveness factor as ( η = ( η A 1 + η B 1 ) 1 ) using the effectiveness factor definition for individual species in Equation (4). If the effectiveness factor is defined according to the diffusion of only one reactant, Figure 6 shows that the 1D model significantly overpredicts the effective reaction rate.
k 1 = k 2 ( c A , i n +   c B , i n ) ( c A , i n   c B , i n )
For Cases 3 and 4, the inlet reactant mole fraction yA is set to 1. The reaction rate expressions simulated in these two cases are shown in Equations (22) and (23).
A   ( g ) + solid   B   ( g ) + solid ;     r = α p 2 3 k 2 c A A   ( g ) + solid   C   ( g ) + solid ; r = α p 1 3 k 2 c A
In Case 3 (Equation (22)), the Thiele modulus value (Equation (3)) for both the reactions must be calculated from the overall rate at which reactant A reacts. In other words, the Thiele modulus must be calculated according to the sum of the two reaction rates given in Equation (22) ( r = α p k 2 c A ). Figure 7 shows that calculating the Thiele modulus from the lower reaction rate of each individual reaction results in an underprediction of the mass transfer limitation and an overprediction of the overall reactant conversion.
A   ( g ) + solid   B   ( g ) + solid ;     r A = α p k 2 c A B   ( g ) + solid   C   ( g ) + solid ;   r B = α p k 2 c B
Case 4 (Equation (23)), where the product of the first reaction is the reactant of the second, is more complex. As shown in Figure 7, simulating the B → C reaction according to the standard mass transfer model greatly underpredicts the reaction rate, leading to a large overprediction in the mole fraction of B. This is simply because the A → B reaction releases species B directly inside the particle so that no mass transfer limitation is present. However, Figure 7 also shows that when the mass transfer limitation is completely removed, the B → C reaction rate is overpredicted. This suggests that some of the reactant B is consumed directly as it is formed inside the particle, but some must enter from outside the particle.
As such, a simple blended model is proposed for this case, respecting the limits that (1) when r B r A in Equation (23) the concentration of species B will be higher inside the particle than outside and can be approximated as c B / η A , and (2) when r B r A the B → C reaction will experience full mass transfer limitation (all reactant must come from outside the particle). Hence, the concentration of species B is divided into two parts (Equation (24)): a part that is released inside the particle ( c B , i n ) experiencing no mass transfer resistance, and a part that resides outside the particle ( c B , o u t ) experiencing the full mass transfer resistance. The reaction rate r B in Equation (23) is thus split into two reactions using the concentrations c B , i n and c B , o u t where the former is simulated with no mass transfer limitations and the latter with complete mass transfer limitations. As shown in Figure 7, this blended model returns a reasonable prediction if C = 5 in Equation (24).
c B , i n = c B η A + C r B r A c B , o u t = max ( c B c B , i n , 0 )

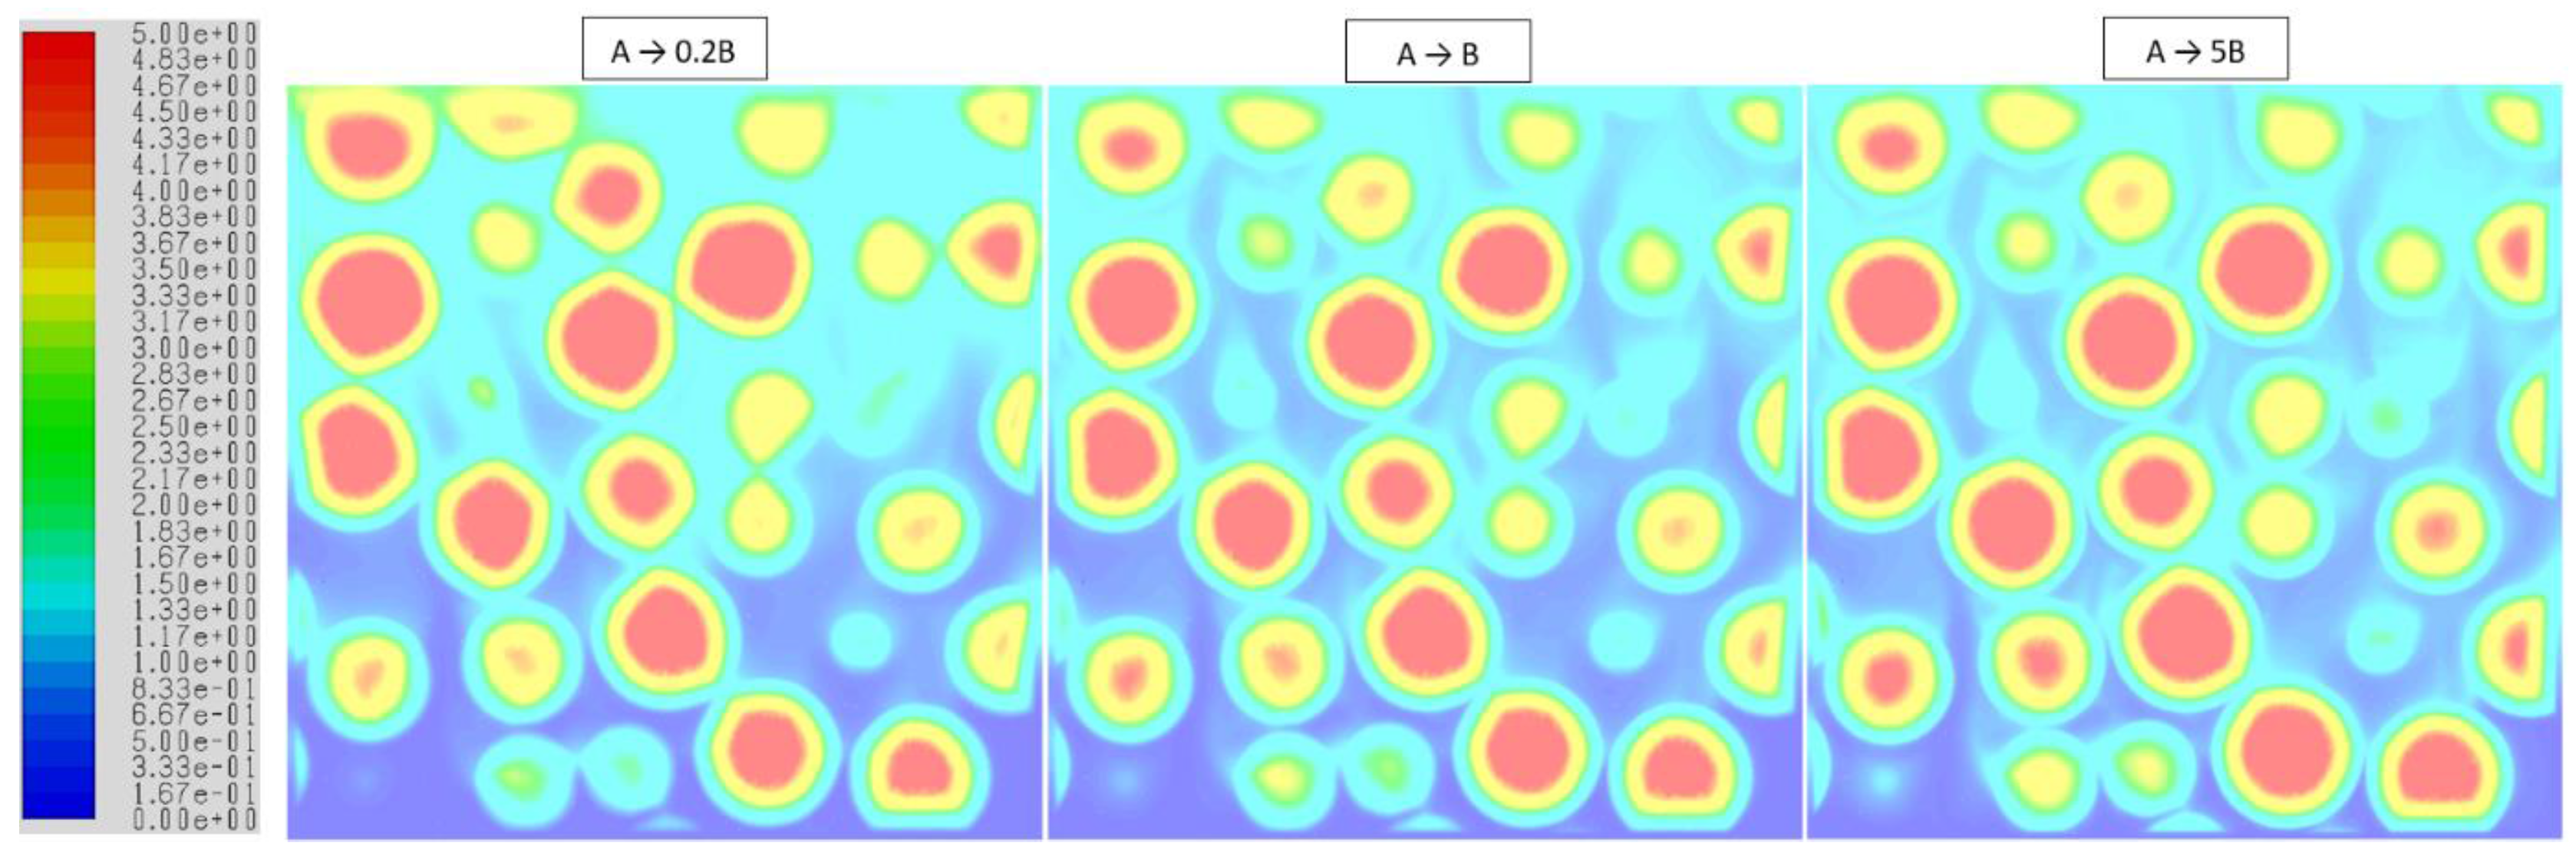
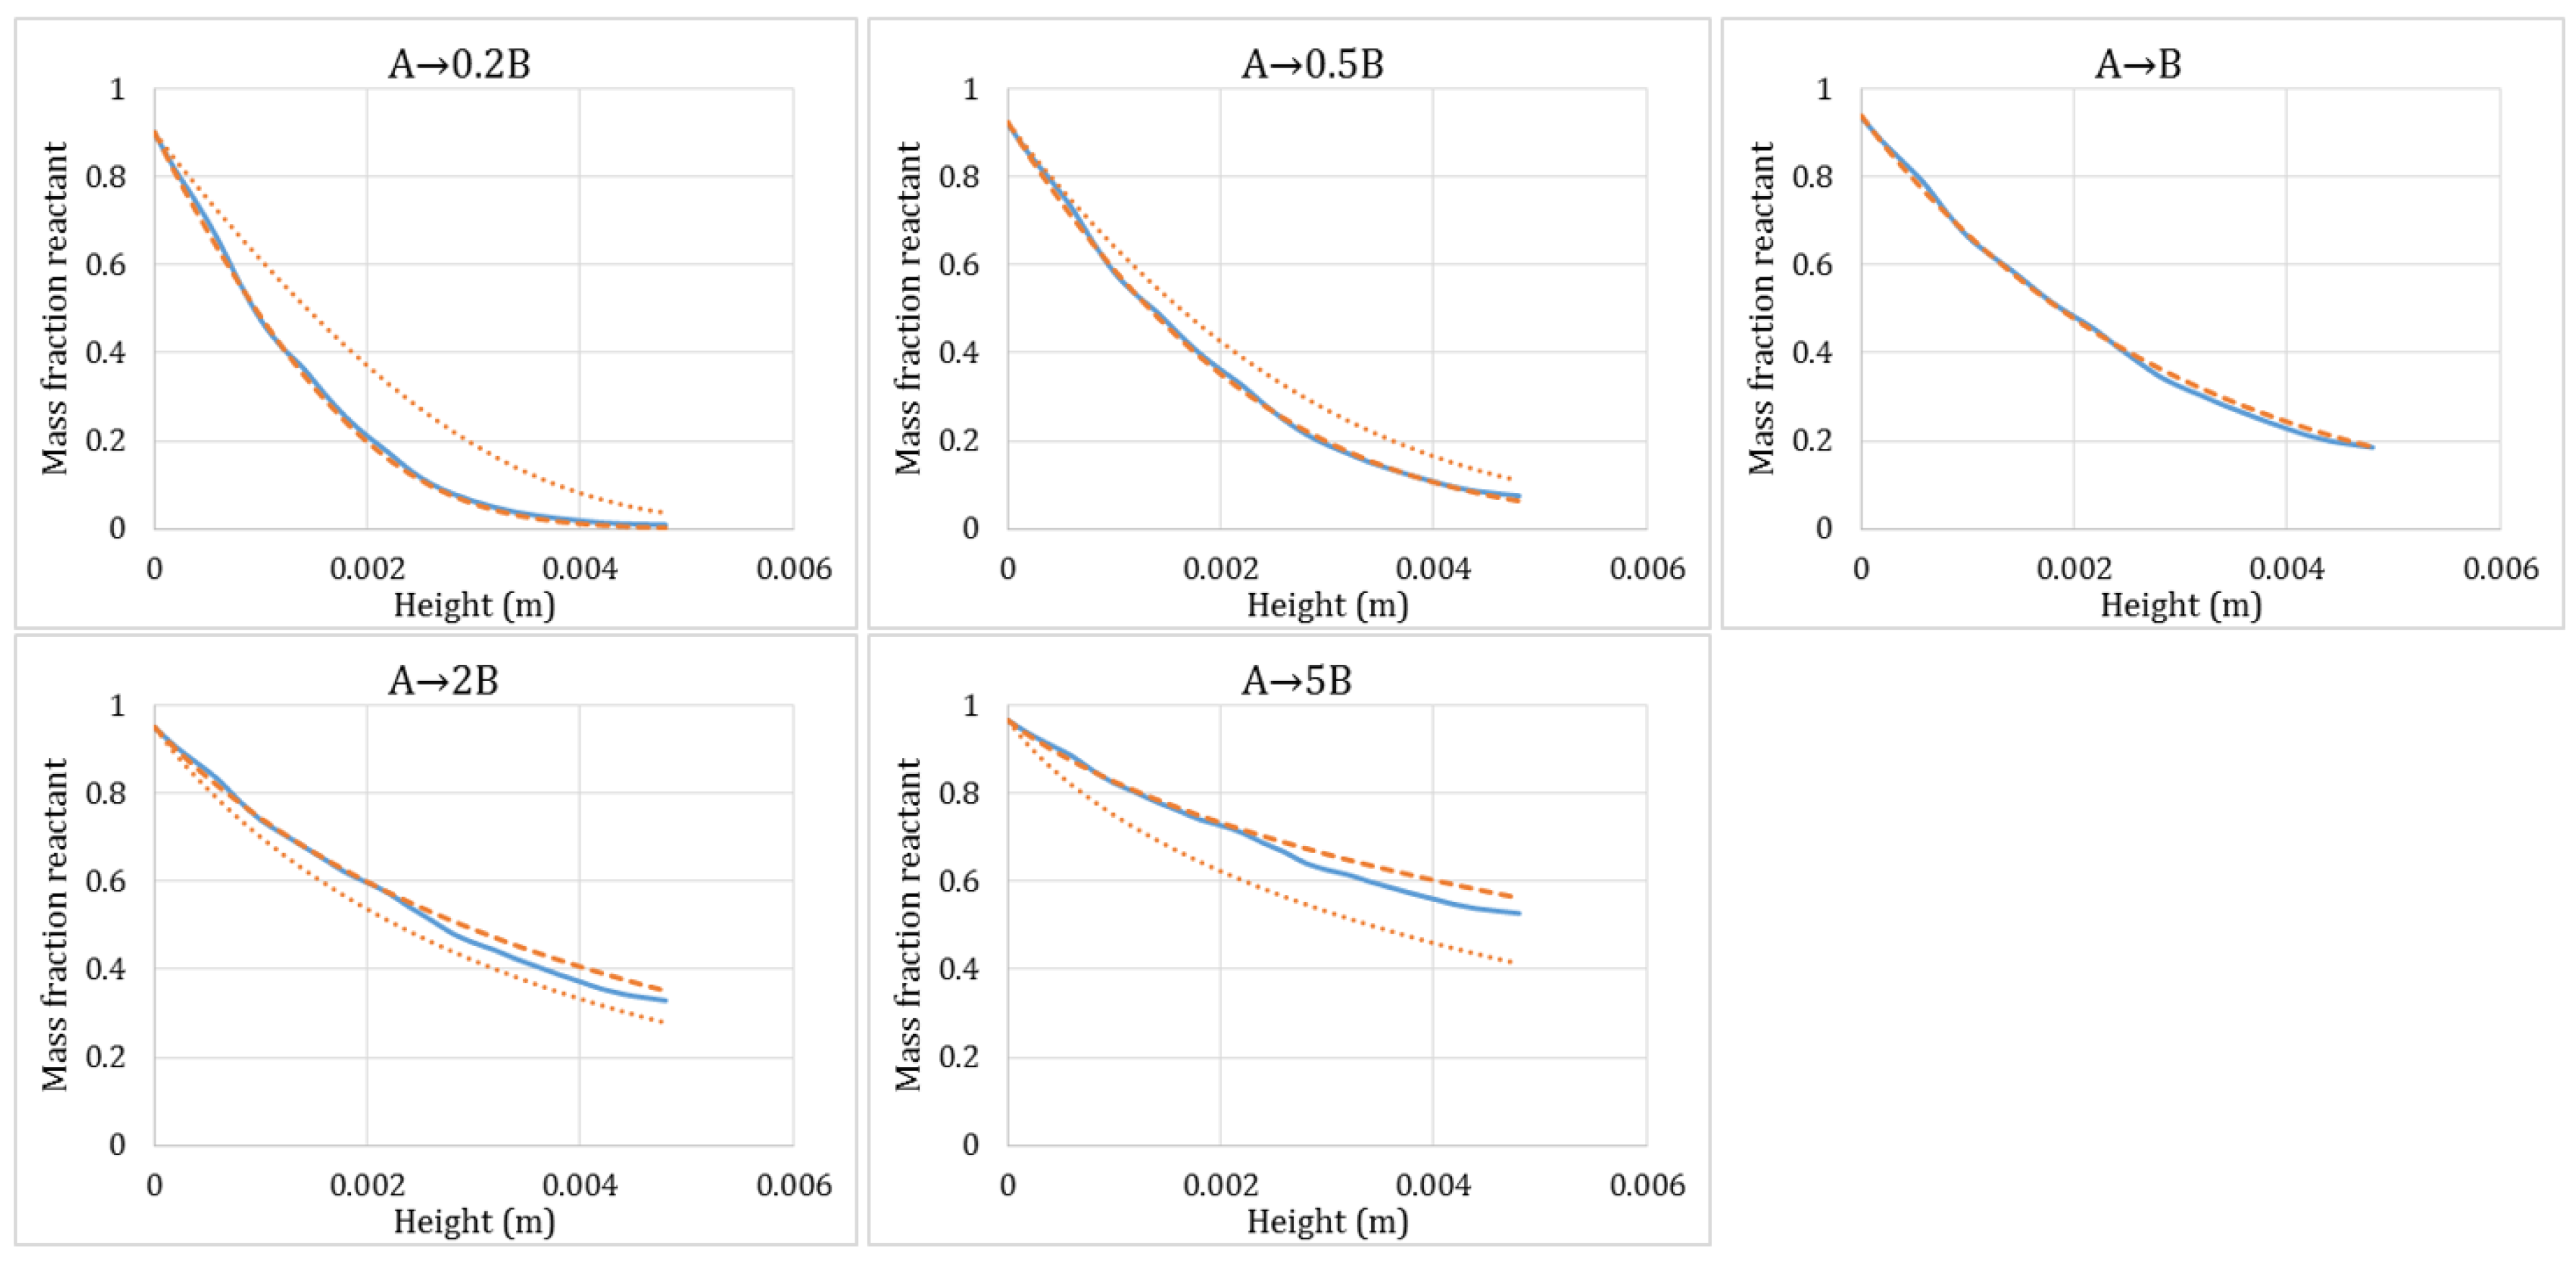
3.3. Isothermal Reactions with Gas Volume Generation/Consumption

Catalytic reactions that generate or consume gas volume without adding or removing mass create a gas density gradient in the particle. This gradient affects the flux at which gaseous reactants can diffuse into the particle ( D e ρ g x i ) , with a change in gas density resulting in a proportional change in diffusive flux. For gas volume generation (reactions (i) (b) and (iii) (b) in Table 3), the gas density decreases towards the center of the particle because the lighter reaction product (B) will be concentrated in this region, thus reducing the diffusive flux of reactant into the particle. As a result, the effective diffusivity used in the Thiele modulus calculation must be reduced in order to accurately model the resulting mass transfer resistance. Through the same mechanism, reactions that consume gas volume (reactions (i) (a) and (iii) (a) in Table 3) will enhance mass transfer into the particle and the effective diffusivity should be corrected in a similar manner.
Simulations are carried out under conditions similar to those in Section 3.1 for a first-order reaction with inlet reactant mass fraction now (xA = 1) to emphasize the effect of gas consumption or generation. To facilitate gas volume generation or consumption, the reaction stoichiometry as well as the gas species density and molecular weight are changed as outlined in Table 3. Five reactions are simulated: gas volume generation [(i) (b); (iii) (b)], gas volume consumption [(i) (a); (iii) (a)] and a base case (ii). Table 3 shows that the cases are set up to change the gas volume by a factor of 5 or 2 upon reaction.
As expected, Figure 8 (right) shows significantly lower overall reactant conversion for gas volume generation than for gas volume consumption (Figure 8 (left)). This is quantified in Figure 9.
It was found that this effect could be accounted for by simply multiplying the effective diffusivity (Equation (5)) by the ratio between the densities of the products and the reactants. If the products are lighter than the reactants (e.g., Cases (i) (b) and (iii) (b) in Table 3), this ratio will be smaller than 1, leading to a lower effective diffusivity, a higher Thiele modulus, and a larger mass transfer resistance. Reactions where the products are heavier than the reactants will experience the opposite effect. Thus, the effective diffusivity is redefined as follows:
D e = D ε t ρ p r o d u c t s ρ r e a c t a n t s
As illustrated in Figure 9, this simple adjustment to the intraparticle mass transfer model successfully captures the effect of gas volume generation/consumption over all the cases considered.

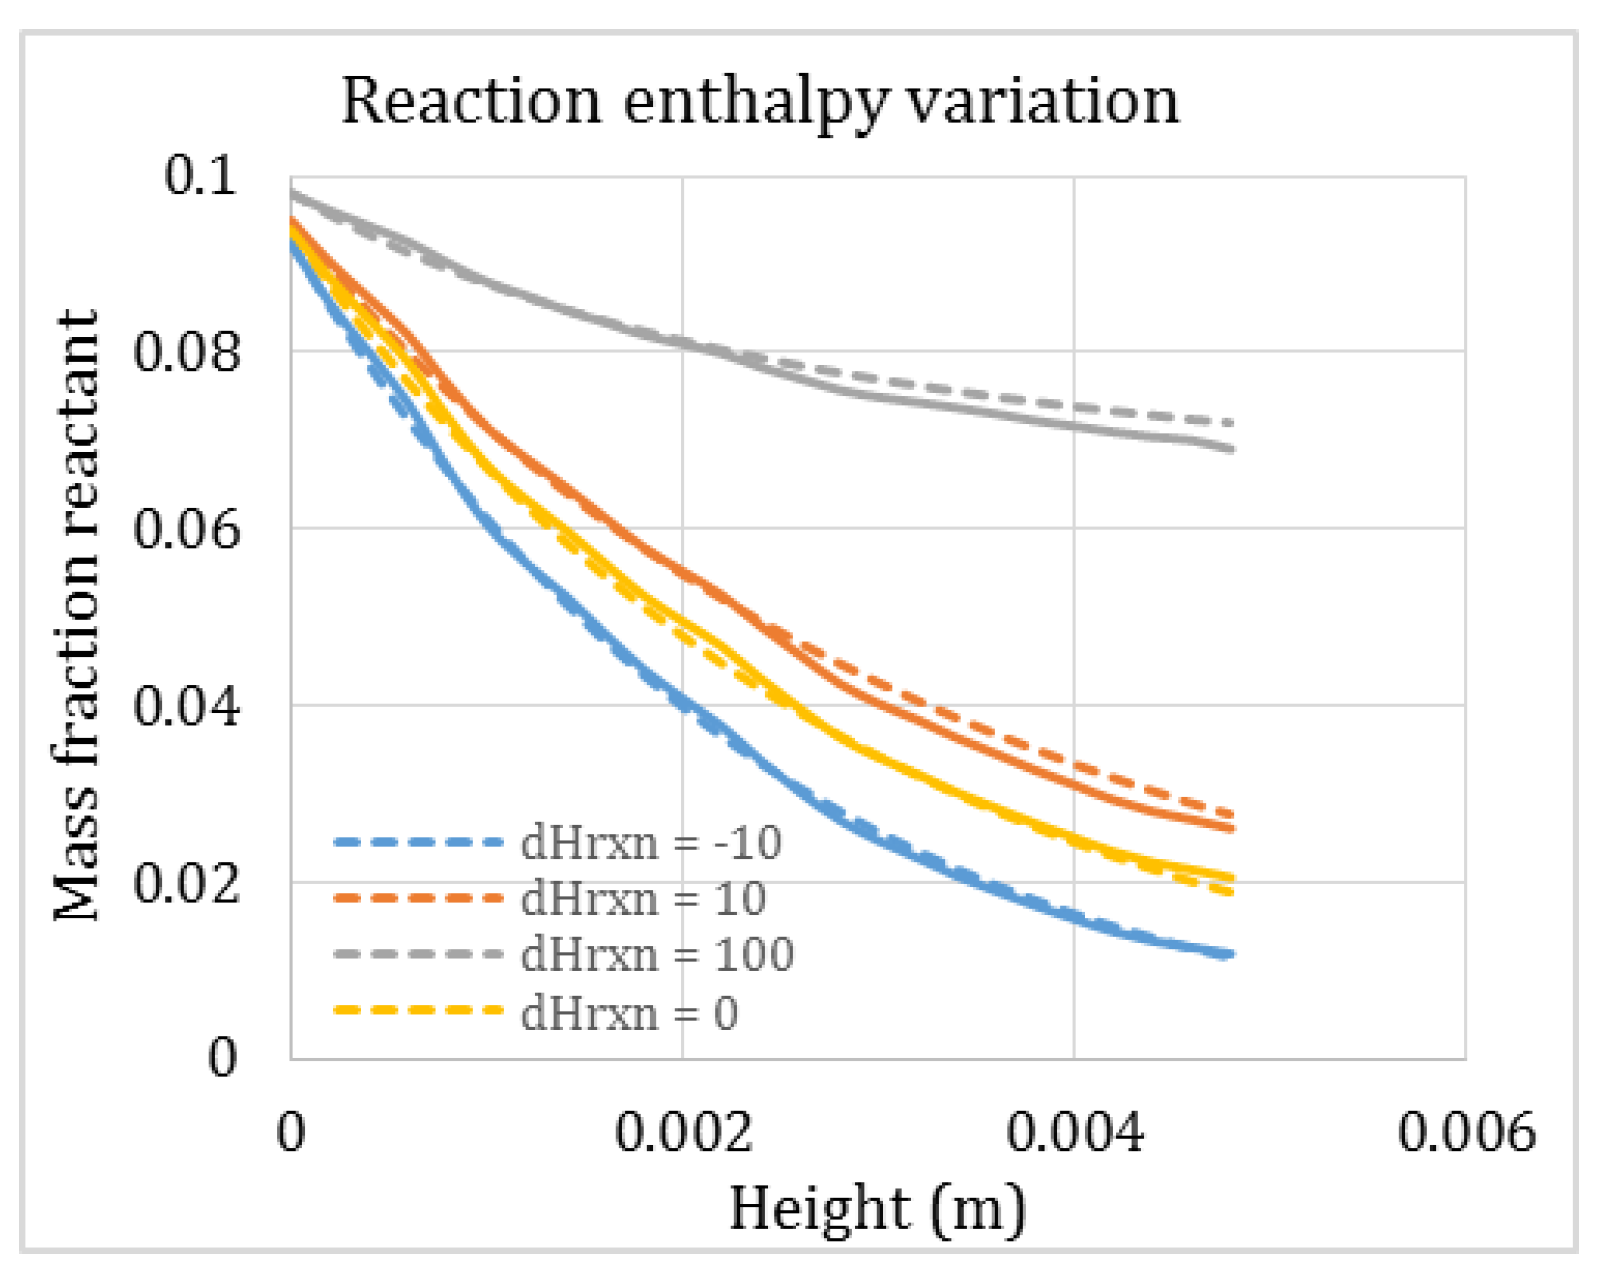
3.4. Combined Heat and Mass Transfer Resistance

In the previous sections, only the effect of mass transfer was considered. Therefore, in this section, the combined effect of heat and mass transfer limitations is presented. The first-order reaction (Section 3.1) is simulated for the case at Thiele modulus ( ϕ = 10) and Prandtl number (Pr = 1) with properties given in Table 1. The effect of reaction enthalpies or heat of reaction on specie conversion is detailed using two different endothermic (with dHrxn = 10 and 100 kJ/mol), one exothermic reaction (dHrxn = −10 kJ/mol), and an isothermal case with (dHrxn = 0 kJ/mol).
The case with Pr = 1 and ϕ = 10 involves large external heat and mass transfer limitations. Figure 10 showcases the ability of the 1D model to predict similar results for reactant conversions with PR-DNS for these combined heat and mass transfer limited cases without any additional modifications to the model.

3.5. Steam Methane Reforming Reactions

After verifying the 1D model on hypothetical conditions for (i) different reaction orders (Section 3.1), (ii) multiple reacting species (Section 3.2), and (iii) gas volume influence (Section 3.3), a realistic test case can be explored. Steam methane reforming (SMR) reactions are considered in this section to detail the performance of 1D models when compared with PR-DNS. The reaction rate expressions and simulation parameters used in this case are outlined in detail in the Appendix A.
PR-DNS results for the steam methane reforming process can be seen in Figure 11. The gradients in the CH4 conversion (Figure 11 (top left)) suggest the mass transfer limitations encountered by the reactant to diffuse inside the particle, while the constant concentration of H2 (Figure 11 (top right)) inside the particles suggests limited resistance to product diffusion out of the particle (H2 has a high molecular diffusivity relative to other gases). Figure 11 (bottom) shows significant external heat transfer limitations.
To gain further insight into the intraparticle mass transfer phenomena in this steam methane reforming reaction system, radial profiles were extracted from a particle close to the inlet. Figure 12 shows the two most important insights from the radial particle profile. Firstly, it can be seen that even though the SMR reaction system generates gas volume, the density inside the particle is essentially constant. This is primarily the result of the high diffusivity of H2 relative to the other gases in the system (~3 × higher). In practice, this means that the adjustment for gas volume generation (Equation (25)) is not required.
Secondly, Figure 12 reveals a new challenge introduced by this equilibrium reaction system: no clear reaction order exists. The intraparticle mass transfer modelling discussed in this paper is based on the analytical solution of a simple first-order reaction and relies on the assumption that the reaction rate constant used in the calculation of the Thiele modulus (Equation (3)) remains constant in an isothermal particle. However, it is clear from Figure 12 that the approximate reaction rate constant defined according to Equation (A8) is not constant inside the particle. This is primarily due to the sharp increase in the reaction rate of the overall steam methane reforming reaction at low H2 concentrations (due to p H 2 3.5 in the denominator of Equation (A6)) and could be corrected by adjusting the effective diffusivity (Equation (5)) as follows:
D e = D ε τ min ( y H 2 / 0.2 , 1 )
Following these insights, the 1D model was rerun in comparison to the PR-DNS results for five different cases:
  • Inclusion of all available model adjustments including multiple reactants (Equation (19)), reactions consuming the same reactant (Equation (22)), reactions consuming the products of other reactions (Equation (23)), and the effect of a varying reaction rate constant (Equation (26)).
  • Deactivation of the adjustment for the varying reaction rate constant relative to Case 1 (Equation (26)).
  • Deactivation of the adjustment for reactions consuming the products of other reactions relative to Case 2 (Equation (23)).
  • Deactivation of the adjustment for reactions consuming the same reactant relative to Case 3 (Equation (22)).
  • Deactivation of the adjustment for multiple reactants relative to Case 4 (Equation (19)).
Figure 13 shows that only the adjustment for multiple reactants (difference between Cases 4 and 5) had a large impact on the 1D model performance. Cases 1–4 that included this effect all compare well to PR-DNS results. Close inspection also shows that the adjustment for the varying reaction rate constant (difference between Cases 1 and 2) had a minor effect close to the inlet where the overall steam methane reforming reaction was very fast. The interacting effects between the different reactions were insignificant because the overall steam methane reforming reaction (Equation (A3)) was much faster than the other two reactions in this case.

4. Conclusions

This work presented a verification study of computationally efficient 1D packed bed models against data from computationally expensive but highly accurate particle-resolved direct numerical simulations (PR-DNS). The ability of the 1D model to account for several complexities such as different reaction orders, multiple reactions and reactants, interacting reactions, and gas volume generation/consumption from reactions was evaluated.
Results showed that 1D modelling with conventional mass and heat transfer closures can accurately reproduce different reaction orders and multiple noninteracting reactions. However, model adjustments are required for reactions with multiple reactants, interacting reactions, and reactions involving gas generation/consumption in the particle. Based on these results, enhancements were proposed, leading to substantial improvements in the 1D model performance.
The resulting enhanced model was then used to simulate a steam methane reforming reaction system. Comparisons between PR-DNS and 1D modelling showed that only the adjustment for multiple reactants was important in this particular case, as this was the specific factor which caused the 1D model to vary from the PR-DNS results. Following this enhancement, the highly computationally efficient 1D model could accurately reproduce results from computationally expensive PR-DNS.

Acknowledgments

This work is a part of a European Union project under Seventh research framework programme (FP7/2007–2013) under grant agreement n° 604656 called NanoSim—A multi-scale Simulation based design platform for Cost effective CO2 capture Processes using Nano-structured materials. The authors are grateful to European Research Council for its support. Additionally, the computational resources at NTNU provided by NOTUR, http://www.notur.no, were used during this project.

Author Contributions

Arpit Singhal and Schalk Cloete conceived and designed the idea, Arpit Singhal performed the simulations; Rosa Quinta-Ferreira and Shahriar Amini supervised the work and helped in the review of the paper; Arpit Singhal wrote the paper.

Conflicts of Interest

The authors declare no conflict of interest.

Nomenclature

Symbols
a Characteristic length of spherical particle (dp/6)
a p Spherical particle-fluid heat transfer surface per unit volume (ap = 6 ∙ (1 − ε)/dp) (1/m)
c A Concentration of specie A (kmol/m3)
CpSpecific heat capacity of fluid (J/kg K)
dpDiameter of the spherical particle (m)
dAArea of the axial plane (m2)
DMolecular diffusivity of gas (m2/s)
DeEffective diffusivity of gas (m2/s)
e z Vector in z-direction
E a Activation energy (J/mol)
gGravity (m/s2)
h Enthalpy (J/kg)
h e Heat transfer coefficient (W/m2K)
JDiffusive flux (kg/(m2 s))
k Reaction rate constant (mol1−n m3n−2/s)
k 0 Arrhenius constant (1/s)
KThermal conductivity of gas (W/m K)
K x Adsorption constant for specie (x = CH4, CO, H2,H2O)
K p g Interphase momentum exchange coefficient (kg/(m3·s))
mpMass of the particle (kg)
NRatio of diameter of reactor to diameter of the particle
NuNusselt number
p Partial pressure of the specie (bar)
PPressure (Pa)
PrPrandtl number ( μ   C p / K g )
rReaction rate (mol/m3·s)
RGas constant (8.314 J/mol/K)
ReReynolds number ( ρ   u s   d p / μ )
SSource term
ScSchmidt number ( μ / ρ   D )
tTortuosity
T Static temperature of the fluid (K)
T p Particle surface temperature (K)
T b u l k Bulk fluid temperature (K)
u s Superficial velocity of the fluid (m/s)
u z Velocity of the fluid in Z-direction (m/s)
vVelocity of the particles for Dem (m/s)
d V Volume in the region of interest (m3)
YSpecie concentration (mass or molar fraction)
ySpecie mole fraction
xSpecie mass fraction
Greek
αVolume fraction
εPorosity (void fraction)
ϕ Thiele modulus
ρ Density (kg/m3)
η Effectiveness factor
τ ¯ ¯ Stress tensor (kg/(m·s2))
μViscosity of fluid (kg/m s)
Vectors
u velocity (m/s)
g Gravity (m/s2)
Subscripts
pparticle
ggas
eeffective
nreaction order
ispecie i
jReaction and particle index
Operators
Gradient operator (m−1)
. Divergence operator (m−1)
d d t time derivative (s−1)

Appendix A

The steam methane reforming (SMR) reactions Equations (A1)–(A3) are modelled with reaction inside the particle as summarized in Table A1.
CH 4 + H 2 O   CO + 3 H 2   Rx 1
CO + H 2 O   CO 2 + H 2   Rx 2
CH 4 + 2 H 2 O   CO 2 + 4 H 2   Rx 3
Table A1. Simulation parameters (PR-DNS) for steam methane reforming.
ParametersValue
Particle diameter (dp) (m)0.005
Packed bed voidage (ε)0.352
Particle volume fraction (αp)0.007
Density (solid) (kg/m3)2500
Fluid velocity (m/s)0.5
Inlet mole fraction ratio (CH4:H2O)1:2
Specific heat capacity (Cp) (solid) (J/kg/k)1200
Inlet temperature (°C)1100
Operating pressure (bar)20
The reactions are modelled according to the kinetic model (Equations (A4)–(A6)) of Langmuir–Hinshelwood [46,47] with the appropriate kinetic and equilibrium constants (kj and Kj) adapted from [48,49,50] as outlined in Table A2. These expressions represent the kinetics measured from a crushed catalyst (~100 μm particles) where intraparticle mass transfer is not significant, thus requiring modification via an effectiveness factor for larger particles. The expressions are not influenced by the small grain size (10−7 m) required in the PR-DNS simulations to make the particles act as perfect obstructions to the flow despite the high particle porosity employed (Section 2.3.4). A meaningful comparison between PR-DNS and 1D modelling will therefore also be achieved in this case.
r 1 =   k 1 p H 2 2.5 ( p CH 4 p H 2 O   p H 2 3 p CO K 1 ) / ( D E N ) 2
r 2 =   k 2 p H 2 ( p CO p H 2 O   p H 2 4 p CO 2 K 2 ) / ( D E N ) 2
r 3 =   k 3 p H 2 3.5 ( p CH 4 p H 2 O 2   p H 2 4 p CO 2 K 3 ) / ( D E N ) 2
D E N = 1 + K CO p CO +   K H 2 p H 2 +   K CH 4 p CH 4 +   K H 2 O p H 2 O / p H 2
Table A2. Kinetic and equilibrium parameters for reforming reactions.
ReactionsKinetic ParametersEquilibrium Parameters
k0,jEaK0,jEa
Steam methane reforming (R × 1)5.83 × 1011218.55 × 1031.2 × 1013223.08 × 103
Water gas shift (R × 2)2.51 × 10473.523 × 1031.77 × 10−2−36.58 × 10³
Overall steam methane reforming (R × 3)4.67 × 1013236.85 × 1032.124 × 1011186 × 103
The adsorption coefficients ( K CO , K H 2 , K CH 4 , and K H 2 O ) of the gases are defined in Table A3 [47]. The particle thermal conductivity is kept to a high value (500 W/m·K; due to high assumed porosity of the particle), such that there are no considerable gradients for temperature inside the particles. The thermal conductivity and molecular diffusivity are calculated according to the kinetic theory of gases.
Table A3. Adsorption parameters for reforming reactions.
Adsorption Parameters
Speciek0,iEa
CH46.66 × 10−4−38.28 × 10³
CO8.25 × 10−5−70.65 × 10³
H26.15 × 10−9−82.90 × 10³
H2O1.77 × 10588.68 × 103
In order to determine the Thiele modulus for the SMR reactions, the reaction order must be identified. All the reactants are approximately first order, except for the H2O in Equation (A3), which is approximately second order according to Equation (A6). In addition, it was assumed that the reactions are controlled by reactant diffusion into the particle and not by product diffusion out of the particle. This is a reasonable assumption given that the diffusivities of the species are similar, except for the product H2, which has a much higher diffusivity than the other species.
Hence, the Thiele moduli for the different reactants were calculated as in the following example for the overall SMR reaction (Equations (A3) and (A6)):
ϕ CH 4   =     k a 2 D CH 4 ,   k = r 3 c CH 4
ϕ H 2 O   =   3 2 k c H 2 O a 2 D H 2 O ,   k = 2 r 3 c H 2 O 2

References

  1. Dixon, A.G.; Nijemeisland, M. CFD as a design tool for fixed-bed reactors. Ind. Eng. Chem. Res. 2001, 40, 5246–5254. [Google Scholar] [CrossRef]
  2. Eppinger, T.; Wehinger, G.D.; Jurtz, N.; Aglave, R.; Kraume, M. A numerical optimization study on the catalytic dry reforming of methane in a spatially resolved fixed-bed reactor. Chem. Eng. Res. Des. 2016, 115, 374–381. [Google Scholar] [CrossRef]
  3. Karthik, G.M.; Buwa, V.V. Effect of particle shape on fluid flow and heat transfer for methane steam reforming reactions in a packed bed. AIChE J. 2017, 63, 366–377. [Google Scholar] [CrossRef]
  4. Maestri, M.; Cuoci, A. Coupling CFD with detailed microkinetic modeling in heterogeneous catalysis. Chem. Eng. Sci. 2013, 96, 106–117. [Google Scholar] [CrossRef]
  5. Nijemeisland, M.; Dixon, A.G.; Hugh Stitt, E. Catalyst design by CFD for heat transfer and reaction in steam reforming. Chem. Eng. Sci. 2004, 59, 5185–5191. [Google Scholar] [CrossRef]
  6. Partopour, B.; Dixon, A.G. Resolved-particle fixed bed CFD with microkinetics for ethylene oxidation. AIChE J. 2017, 63, 87–94. [Google Scholar] [CrossRef]
  7. Wehinger, G.D.; Fütterer, C.; Kraume, M. Contact modifications for CFD simulations of fixed-bed reactors: Cylindrical particles. Ind. Eng. Chem. Res. 2017, 56, 87–99. [Google Scholar] [CrossRef]
  8. Mirhashemi, F.S.; Hashemabadi, S.H. Experimental and CFD study of wall effects on orderly stacked cylindrical particles heat transfer in a tube channel. Int. Commun. Heat Mass Transf. 2012, 39, 449–455. [Google Scholar] [CrossRef]
  9. Mirhashemi, F.S.; Hashemabadi, S.H.; Noroozi, S. CFD simulation and experimental validation for wall effects on heat transfer of finite cylindrical catalyst. Int. Commun. Heat Mass Transf. 2011, 38, 1148–1155. [Google Scholar] [CrossRef]
  10. Motlagh, A.H.A.; Hashemabadi, S.H. 3D CFD simulation and experimental validation of particle-to-fluid heat transfer in a randomly packed bed of cylindrical particles. Int. Commun. Heat Mass Transf. 2008, 35, 1183–1189. [Google Scholar] [CrossRef]
  11. Zare, M.; Hashemabadi, S.H. Experimental study and CFD simulation of wall effects on heat transfer of an extrudate multi-lobe particle. Int. Commun. Heat Mass Transf. 2013, 43, 122–130. [Google Scholar] [CrossRef]
  12. Atmakidis, T.; Kenig, E.Y. CFD-based analysis of the wall effect on the pressure drop in packed beds with moderate tube/particle diameter ratios in the laminar flow regime. Chem. Eng. J. 2009, 155, 404–410. [Google Scholar] [CrossRef]
  13. Bai, H.; Theuerkauf, J.; Gillis, P.A.; Witt, P.M. A coupled DEM and CFD simulation of flow field and pressure drop in fixed bed reactor with randomly packed catalyst particles. Ind. Eng. Chem. Res. 2009, 48, 4060–4074. [Google Scholar] [CrossRef]
  14. Eppinger, T.; Seidler, K.; Kraume, M. DEM-CFD simulations of fixed bed reactors with small tube to particle diameter ratios. Chem. Eng. J. 2011, 166, 324–331. [Google Scholar] [CrossRef]
  15. Lee, J.J.; Yoon, S.J.; Park, G.C.; Lee, W.J. Turbulence-induced heat transfer in pbmr core using les and rans. J. Nucl. Sci. Technol. 2007, 44, 985–996. [Google Scholar] [CrossRef]
  16. Romkes, S.J.P.; Dautzenberg, F.M.; van den Bleek, C.M.; Calis, H.P.A. CFD modelling and experimental validation of particle-to-fluid mass and heat transfer in a packed bed at very low channel to particle diameter ratio. Chem. Eng. J. 2003, 96, 3–13. [Google Scholar] [CrossRef]
  17. Jafari, A.; Zamankhan, P.; Mousavi, S.M.; Pietarinen, K. Modeling and CFD simulation of flow behavior and dispersivity through randomly packed bed reactors. Chem. Eng. J. 2008, 144, 476–482. [Google Scholar] [CrossRef]
  18. Deen, N.G.; Peters, E.A.J.F.; Padding, J.T.; Kuipers, J.A.M. Review of direct numerical simulation of fluid–particle mass, momentum and heat transfer in dense gas-solid flows. Chem. Eng. Sci. 2014, 116, 710–724. [Google Scholar] [CrossRef]
  19. Singhal, A.; Cloete, S.; Radl, S.; Quinta-Ferreira, R.; Amini, S. Heat transfer to a gas from densely packed beds of monodisperse spherical particles. Chem. Eng. J. 2017, 314, 27–37. [Google Scholar] [CrossRef]
  20. Singhal, A.; Cloete, S.; Radl, S.; Quinta-Ferreira, R.; Amini, S. Heat transfer to a gas from densely packed beds of cylindrical particles. Chem. Eng. Sci. 2017, 172, 1–12. [Google Scholar] [CrossRef]
  21. Sun, B.; Tenneti, S.; Subramaniam, S. Modeling average gas-solid heat transfer using particle-resolved direct numerical simulation. Int. J. Heat Mass Transf. 2015, 86, 898–913. [Google Scholar] [CrossRef]
  22. Tavassoli, H.; Peters, E.A.J.F.; Kuipers, J.A.M. Direct numerical simulation of fluid–particle heat transfer in fixed random arrays of non-spherical particles. Chem. Eng. Sci. 2015, 129, 42–48. [Google Scholar] [CrossRef]
  23. Augier, F.; Idoux, F.; Delenne, J.Y. Numerical simulations of transfer and transport properties inside packed beds of spherical particles. Chem. Eng. Sci. 2010, 65, 1055–1064. [Google Scholar] [CrossRef]
  24. Dixon, A.G.; Nijemeisland, M.; Stitt, H. CFD simulation of reaction and heat transfer near the wall of a fixed bed. Int. J. Chem. React. Eng. 2003, 1. [Google Scholar] [CrossRef]
  25. Wehinger, G.D.; Kraume, M.; Berg, V.; Korup, O.; Mette, K.; Schlögl, R.; Behrens, M.; Horn, R. Investigating dry reforming of methane with spatial reactor profiles and particle-resolved CFD simulations. AIChE J. 2016, 62, 4436–4452. [Google Scholar] [CrossRef]
  26. Singhal, A.; Cloete, S.; Radl, S.; Quinta-Ferreira, R.; Amini, S. Multiscale modelling of heat transfer from arrays of spherical particles. In Proceedings of the 9th International Conference on Multiphase Flow (ICMF), Firenze, Italy, 22–27 May 2016; ICMF: Firenze, Italy, 2016. [Google Scholar]
  27. Dixon, A.G. Local transport and reaction rates in a fixed bed reactor tube: Endothermic steam methane reforming. Chem. Eng. Sci. 2017, 168, 156–177. [Google Scholar] [CrossRef]
  28. Mousazadeh, F.; van Den Akker, H.E.A.; Mudde, R.F. Direct numerical simulation of an exothermic gas-phase reaction in a packed bed with random particle distribution. Chem. Eng. Sci. 2013, 100, 259–265. [Google Scholar] [CrossRef]
  29. Zhou, X.; Duan, Y.; Huai, X.; Li, X. 3D CFD modeling of acetone hydrogenation in fixed bed reactor with spherical particles. Particuology 2013, 11, 715–722. [Google Scholar] [CrossRef]
  30. Dixon, A.G.; Taskin, M.E.; Nijemeisland, M.; Stitt, E.H. CFD method to couple three-dimensional transport and reaction inside catalyst particles to the fixed bed flow field. Ind. Eng. Chem. Res. 2010, 49, 9012–9025. [Google Scholar] [CrossRef]
  31. Dixon, A.G.; Boudreau, J.; Rocheleau, A.; Troupel, A.; Taskin, M.E.; Nijemeisland, M.; Stitt, E.H. Flow, transport, and reaction interactions in shaped cylindrical particles for steam methane reforming. Ind. Eng. Chem. Res. 2012, 51, 15839–15854. [Google Scholar] [CrossRef]
  32. Singhal, A.; Cloete, S.; Quinta-Ferreira, R.; Amini, S. Multiscale modelling of packed bed chemical looping reforming. Energy Procedia 2017, 136, 349–355. [Google Scholar] [CrossRef]
  33. Singhal, A.; Cloete, S.; Radl, S.; Quinta-Ferreira, R.; Amini, S. Comparison of particle-resolved direct numerical simulation and 1d modelling of catalytic reactions in a packed bed. In Proceedings of the 12th International Conference on CFD in Oil & Gas, Metallurgical and Process Industries, Trondheim, Norway, 30 May–1 June 2017; Progress in Applied CFD—CFD2017: Trondheim, Norway, 2017; pp. 667–674. [Google Scholar]
  34. Singhal, A.; Cloete, S.; Quinta-Ferreira, R.; Amini, S. Comparison of particle-resolved direct numerical simulation and 1d modelling of catalytic reactions in a cylindrical particle bed. In Proceedings of the Vth International Conference on Particle-Based Methods—Fundamentals and Applications, Hannover, Germany, 26–28 September 2017; International Center for Numerical Methods in Engineering (CIMNE): Hannover, Germany, 2017; pp. 802–812. [Google Scholar]
  35. Rawlings, J.B.A.E.; John, G. Chapter 7. In Chemical Reactor Analysis and Design Fundamentals; Nob Hill Publishing: Madison, WI, USA, 2002. [Google Scholar]
  36. Yang, W.; Cloete, S.; Morud, J.; Amini, S. An effective reaction rate model for gas-solid reactions with high intra-particle diffusion resistance. Int. J. Chem. React. Eng. 2016, 14, 331–342. [Google Scholar] [CrossRef]
  37. Ishida, M.; Wen, C.Y. Comparison of kinetic and diffusional models for solid-gas reactions. AIChE J. 1968, 14, 311–317. [Google Scholar] [CrossRef]
  38. Levenspiel, O. Chemical Reaction Engineering, 3rd ed.; John Wiley & Sons: New York, NY, USA, 1999; Volume 3. [Google Scholar]
  39. Thiele, E.W. Relation between catalytic activity and size of particle. Ind. Eng. Chem. 1939, 31, 916–920. [Google Scholar] [CrossRef]
  40. Ergun, S. Fluid flow through packed columns. Chem. Eng. Prog. 1952, 48, 89–94. [Google Scholar]
  41. Szekely, J.; Evans, J.W.; Sohn, H.Y. Gas-Solid Reactions; Academic Press: New York, NY, USA, 1976; p. 612. [Google Scholar]
  42. Deen, N.G.; Kriebitzsch, S.H.L.; van der Hoef, M.A.; Kuipers, J.A.M. Direct numerical simulation of flow and heat transfer in dense fluid–particle systems. Chem. Eng. Sci. 2012, 81, 329–344. [Google Scholar] [CrossRef]
  43. Tenneti, S.; Sun, B.; Garg, R.; Subramaniam, S. Role of fluid heating in dense gas-solid flow as revealed by particle-resolved direct numerical simulation. Int. J. Heat Mass Transf. 2013, 58, 471–479. [Google Scholar] [CrossRef]
  44. Cloete, S.; Gallucci, F.; van Sint Annaland, M.; Amini, S. Gas switching as a practical alternative for scaleup of chemical looping combustion. Energy Technol. 2016, 4, 1286–1298. [Google Scholar] [CrossRef]
  45. Singhal, A.; Cloete, S.; Quinta-Ferreira, R.; Amini, S. Multiscale modeling of a packed bed chemical looping reforming (pbclr) reactor. Energies 2017, 10, 2056. [Google Scholar] [CrossRef]
  46. Xu, J.; Froment, G.F. Methane steam reforming, methanation and water-gas shift: I. Intrinsic kinetics. AIChE J. 1989, 35, 88–96. [Google Scholar] [CrossRef]
  47. Oliveira, E.L.G.; Grande, C.A.; Rodrigues, A.E. Methane steam reforming in large pore catalyst. Chem. Eng. Sci. 2010, 65, 1539–1550. [Google Scholar] [CrossRef]
  48. Francisco Morgado, J.; Cloete, S.; Morud, J.; Gurker, T.; Amini, S. Modelling study of two chemical looping reforming reactor configurations: Looping vs. Switching. Powder Technol. 2016, 316, 599–613. [Google Scholar] [CrossRef]
  49. Ortiz, M.; de Diego, L.F.; Abad, A.; García-Labiano, F.; Gayán, P.; Adánez, J. Catalytic activity of ni-based oxygen-carriers for steam methane reforming in chemical-looping processes. Energy Fuels 2012, 26, 791–800. [Google Scholar] [CrossRef]
  50. Zhou, Z.; Han, L.; Bollas, G.M. Model-based analysis of bench-scale fixed-bed units for chemical-looping combustion. Chem. Eng. J. 2013, 233, 331–348. [Google Scholar] [CrossRef]
Figure 1. Grid independence behavior for the variation of mass fraction of specie A (xA) at a plane perpendicular to the flow near the outlet (2 planes below the outlet) in array of spherical particles with respect to particle surface mesh resolution, simulated at dHrxn = −10 kJ/mol, Pr = 1, ε = 0.351, and ϕ = 10. Symbols represent the results and the line is the exponential function: x A   =   0.008048   +   exp   ( 9.7158 + 1.1035 log 2 ( d x ) ) , where (dx) is the grid size on the particle surface.
Energies 11 00805 g001
Figure 2. The contour plots for fluid temperature (K) (at plane y = 0, through a bed of ε = 0.351, Re = 100, Pr = 1). (Top left: (No mesh) represents the case without inside particle mesh [19]; in all other plots εinside represents the particle porosity in each case). The edge of low temperature at the inlet and outlet is because of the added volume region to avoid meshing problems; this does not affect the overall Nusselt number obtained.
Energies 11 00805 g002
Figure 3. Nusselt number extracted on 25 planes based on local driving force [18,21,42,43] versus porosity value inside the particle. The comparison is made to Nusselt number from the ideal external heat transfer case without inside particle mesh. This value has also been verified with Singhal [19] heat transfer correlation.
Energies 11 00805 g003
Figure 4. PR-DNS results for mass fraction of specie A (xA) through a geometry of spherical particles (at plane y = 0; ε = 0.352, ϕ = 10, Pr = 1) for different reaction orders (0.5th, 1st, 2nd), respectively.
Energies 11 00805 g004
Figure 5. Comparison of the mass fraction of reactant (xA) between the two approaches (i) PR-DNS (represented by solid lines); (ii) 1D model (dashed lines) for (Top) Thiele modulus ϕ = 10), and (Bottom) ϕ = 5 for different reaction orders (0.5th, 1st, 2nd); along the height of the reactor geometry.
Energies 11 00805 g005
Figure 6. Comparison of the mole fraction of reactant (of specie A and specie B) for the simulated two cases, (Top) Case 1, and (Bottom) Case 2 from (i) PR-DNS (represented by solid lines); (ii) 1D model corrected (dashed lines); along the height of the reactor geometry. The dotted lines in Case 1 (Top) represent the predictions without adjusting the effectiveness factor as η = ( η A 1 + η B 1 ) 1 .
Energies 11 00805 g006
Figure 7. Comparison of the mole fraction of reactant (of specie A and specie B) for the simulated two cases, (Top) Case 3, and (Bottom) Case 4 from (i) PR-DNS (represented by solid lines); (ii) 1D model corrected (dashed lines); (dotted line) in Case 4 represents the prediction including a full mass transfer model for reactant B, while (interval line) represents a prediction without a mass transfer model; while in Case 3 (dotted line) represents the prediction with incorrect Thiele modulus.
Energies 11 00805 g007
Figure 8. PR-DNS predictions of the reactant concentration (specie A) for different reactions (Table 3) (at plane y = 0; ε = 0.352, ϕ = 10, Pr = 1) through a bed of porous spherical particles. (Note: The contours shown above are expressed on a scale (−log10 (xA)); Blue suggests high, while Red means minimum).
Energies 11 00805 g008
Figure 9. Comparison of mass fraction of the reactant (specie A) along the height of the reactor between PR-DNS (solid lines), modified 1D model (dashed lines), and 1D model (dotted lines) for different reaction cases in Table 3. The dotted lines represent the 1D model predictions without accounting for gas volume generation. The inlet specie concentration in the case of the 1D model has been adjusted to account for faster specie conversion at the inlet in PR-DNS results.
Energies 11 00805 g009
Figure 10. Comparison of axial specie profiles between PR-DNS (solid lines) and 1D simulations (dashed lines) for a packed bed of spherical particles at (ε = 0.355, Pr = 1, and ϕ = 10) for different heat of reactions (dHrxn in kJ/mol).
Energies 11 00805 g010
Figure 11. PR-DNS predictions of mole fraction of CH4 (top left), H2 (top right), and fluid temperature (in K) (bottom) at (plane y = 0; ε = 0.352) for inlet temperature 1100 °C, through a packed bed of porous spherical particles for steam methane reforming process.
Energies 11 00805 g011
Figure 12. Radial profiles of gas density and the approximate reaction rate constant (Equation (A8)) in a particle close to the inlet of the simulated geometry.
Energies 11 00805 g012
Figure 13. Comparisons of different 1D model setups against PR-DNS results.
Energies 11 00805 g013
Table 1. Packed bed geometry and flow simulation properties.
ParameterValue
Particle size (m)1 × 10⁻³
Bed porosity (ε)0.352
Particle inside volume fraction (αp)0.007
Number of particles107
Diameter of the geometry (m)4.8 × 10⁻³
Height of the geometry (m)4.8 × 10⁻³
Mesh resolution (particle surface)dp/60
Pre-exponential factor (k0) (1/s)1.674 × 109
Activation energy (J/mol)100,000
Thermal conductivity of solid (W/m K)500
Table 2. Flow properties for CFD simulation. The flow properties are based on the range of dimensionless parameters (Re, Pr) in the PR-DNS study.
ParameterValue
Prandtl number1
Reynolds number100
Thiele modulus10; 5
Temperature of Inlet (K)1000
Inlet mass fraction (specie A)0.1
Heat of reaction (kJ/mol)0
Operating pressure (bar)1
Thiele modulus ϕ = 10 ϕ = 5
Molecular diffusivity (m2/s)1.38889 × 10−55.55556 × 10−5
Reaction rate constants
0.5th order4.22 × 104
1st order1.00 × 104
2nd order6.67 × 102
ParameterGasesParticles
Dynamic Viscosity (µ) (kg/m·s)1 × 10−5-
Density (ρ) (kg/m3)12500
Thermal conductivity (W/m·K)0.01500
Molecular weight (kg/kg·mol)1010
Specific heat (Cp) (J/kg·K)10001000
Table 3. Different catalytic reactions with their gas specie properties and length scale.
ReactionsMolecular Weight (kg/kmol)Density (kg/m3)
Analogous CasesABAB
(i) (a) A + solid → 0.2B + solid105015
  (b) A + solid → 5B + solid10210.2
(ii) A + solid → B + solid101011
(iii) (a) A + solid → 0.5B + solid102012
  (b) A + solid → 2B + solid10510.5

