Article

Algorithm for Fast and Efficient Detection and Reaction to Angle Instability Conditions Using Phasor Measurement Unit Data

1
Croatian Transmission System Operator Ltd., 10000 Zagreb, Croatia
2
Department of Energy and Power Systems, Faculty of Electrical Engineering and Computing, University of Zagreb, 10000 Zagreb, Croatia
*
Author to whom correspondence should be addressed.
Energies 2018, 11(3), 681; https://doi.org/10.3390/en11030681
Submission received: 15 February 2018 / Revised: 7 March 2018 / Accepted: 12 March 2018 / Published: 17 March 2018

Abstract

:
In wide area monitoring, protection, and control (WAMPAC) systems, angle stability of transmission network is monitored using data from phasor measurement units (PMU) placed on transmission lines. Based on this PMU data stream advanced algorithm for out-of-step condition detection and early warning issuing is developed. The algorithm based on theoretical background described in this paper is backed up by the data and results from corresponding simulations done in Matlab environment. Presented results aim to provide the insights of the potential benefits, such as fast and efficient detection and reaction to angle instability, this algorithm can have on the improvement of the power system protection. Accordingly, suggestion is given how the developed algorithm can be implemented in protection segments of the WAMPAC systems in the transmission system operator control centers.

1. Introduction

Transmission network control centers use a large number of applications for control and protection of transmission power system network. Wide area monitoring, protection, and control (WAMPAC) systems utilize phasor data from phasor measurement units (PMU) for power system estimation [1], system disturbance monitoring [2], and system observability and detection improvement [3]. Wide spread deployment of PMU devices has enabled development of a range of advanced protection functions [4,5]. Dynamic analysis of different transient phenomena in the transmission network is also enabled by the availability of PMU data streams [6].
Usage of such data streams from PMU for the development of WAMPAC systems with advanced angle instability protection functionalities is in more details elaborated in [7]. The prerequisite for such advanced angle instability protection algorithms are PMUs installed across the important nodes in the transmission system. This way, good insights into the conditions of the transmission corridors are obtained when angle instability conditions occur [8]. In order to have a proper detection and reaction sequence on different angle instability events, it is necessary to have an algorithm that can detect the instability and react swiftly [9]. Information synthesis from the PMU measurements can also be used even to predict potential power swings [10] and even further enhance the power system protection. These algorithms are to be implemented into future WAMPAC systems and will give good observability and protection for transmission power system in general and for each line equipped with PMU devices individually [11].
The suggested algorithm that is described in this paper completely relies on synchronized phasor data stream from PMU devices and extends the research done in [12]. Modern PMU devices [13] and phasor data concentrators (PDC) normally operate with sampling time equal to one electricity sine period (20 milliseconds), which can enable all actions of the advanced protection algorithms, both in detection and operation phases, to be completed fortifying the transition towards smart transmission grid concepts [14,15].
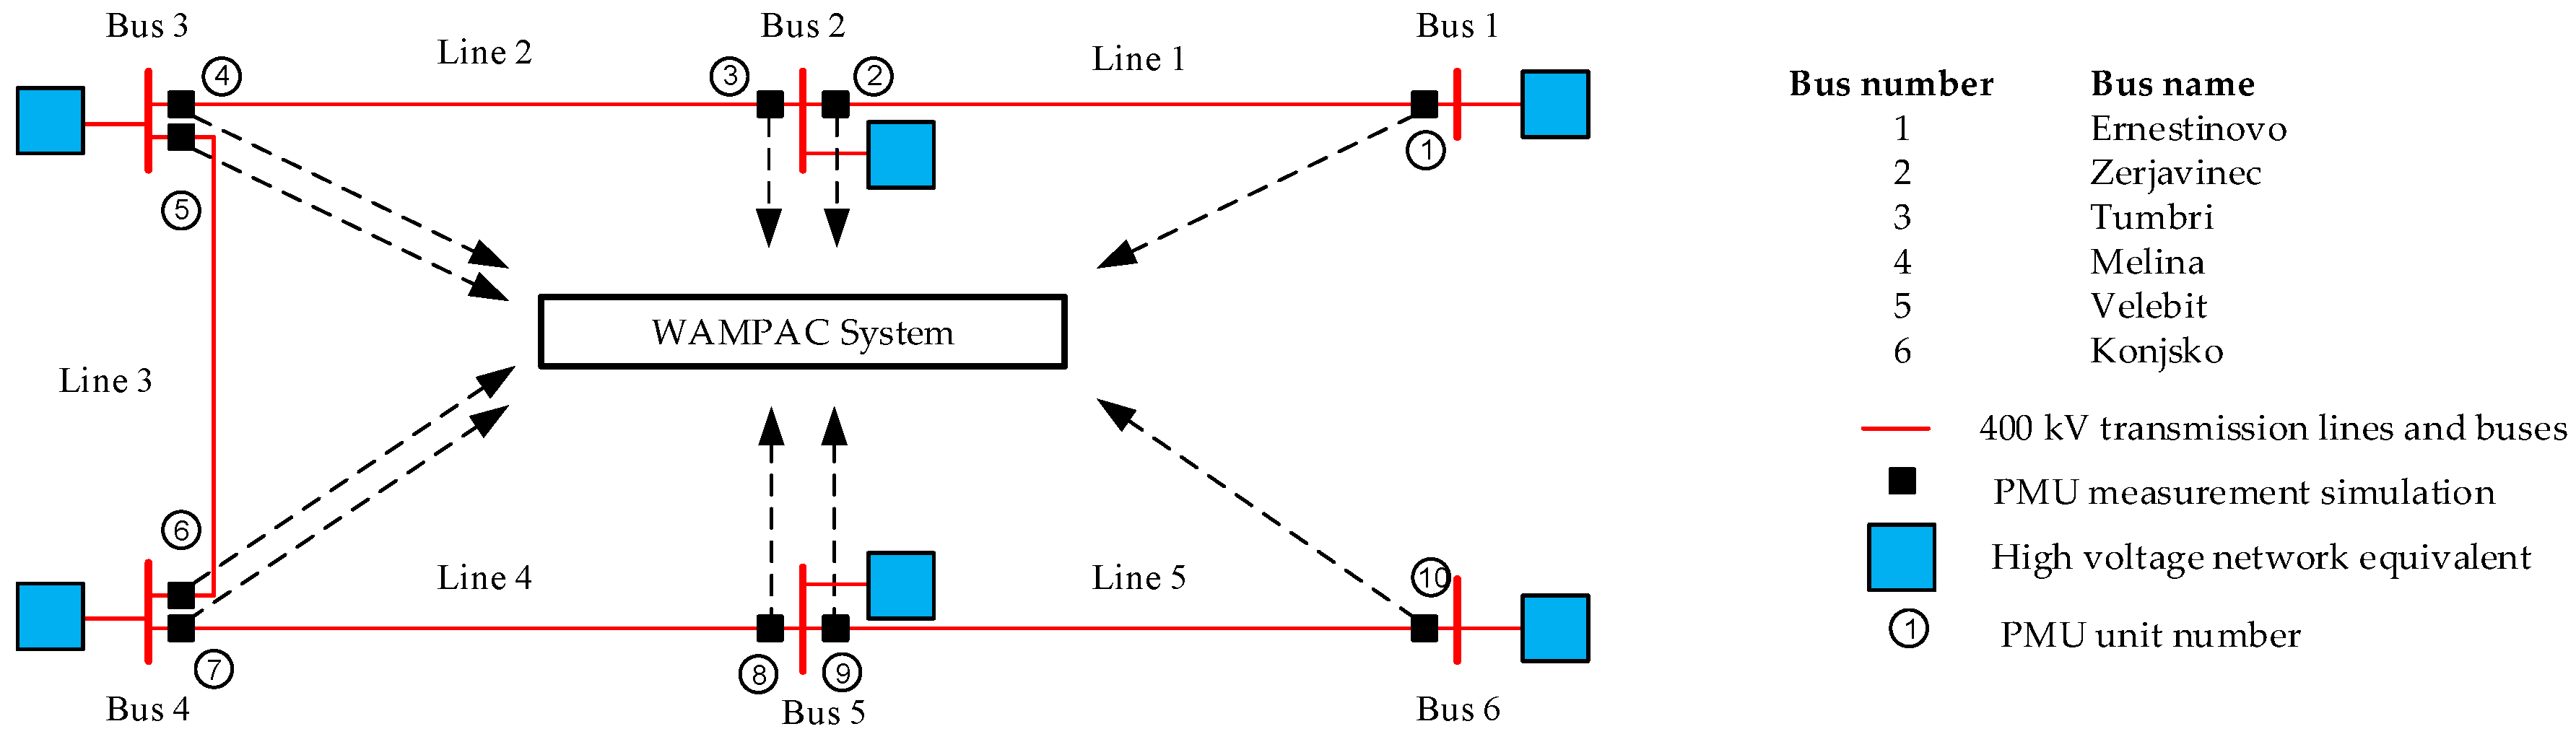
Proposed algorithm is developed in Matlab simulation environment and tested on the model that represents a real high voltage 400 kV transmission network with corresponding protection schemes models. The model uses adequate system equivalents, which substitute the neighboring transmission network systems on all interconnection buses used in model.
The paper presents results of the extensive simulations and analyses done with the focus on out-of-step conditions in transmission network early detection and warning issuing. Presented results provide contribution in the field of relay protection for transmission network with results presenting possible direction for further development of protection and monitoring functions in WAMPAC systems. In contrast, today, the most common technique for out-of-step protection is based on impedance measurements that are directly embedded on relay protection devices, which is sensitive to network topology. Voltage-based and swing voltage center-based methods are not commonly used because of inherent sensitivity in the setting phase [16]. Others methods that can be implemented in the WAMPAC system protection segments, like fuzzy logic-based and neural network-based [17] are still in the development phase and for now cannot be used in real applications in transmission network control centers like the proposed algorithm can. Therefore, the main contribution of the paper is the design and development of a centralized transmission system protection algorithm based on synchronized phasor data that is able to swiftly and react to a wide range of angle instability conditions by issuing corresponding trip commands before an out-of-step condition develops and that is suitable to be implemented in the transmission system operator control center.
The rest of the paper is organized as follows: Section 2 describes the general features of the proposed WAMPAC system, Section 3 describes in short lines the angle instability disturbances. Section 4 presents the method for quick detection of angle instability, followed by the results presentations and scenario description through Section 5 and Section 6. Finally, the conclusion is given in the Section 7.

2. WAMPAC Simulations Features

2.1. Basic Principles for Measurement and Protection

Intelligent electronic devices (IED), which are used for relay protection, have many functions [18], including protection and monitoring functions. These functions are standardized and widely used in transmission network protection systems. Line protection terminals are multifunctional devices with basic and reserve protection and monitoring function that are used in transmission line protection systems, as shown on Figure 1. The numbers adjacent to the different function represent their identifier in accordance with the standard [18]. In the field of relay protection the numbers are used to simply enumerate and list all the available functions. Therefore, they are commonly found in SCADA and protection systems.
Modern PMU devices today can be standalone devices or in some cases are integrated in other intelligent electronic devices used in transmission network protection systems. In both cases, their role is to gather synchro phasor measurement values on the substation level, which are sent towards WAMPAC system or other superior applications in control center.
Relay protection systems have many functions implemented that are all oriented towards protection of just one transmission line locally. In WAMPAC systems, new functions are developed and implemented for protecting and monitoring transmission network as a whole using wide area information based on general coverage of network with PMU measurements. Both, the protection functions and monitoring functions in control room are connected and exchanging with SCADA system since it also offers a valuable information source for the efficient control of the transmission power system.
The new approach also applies to out-of-step protection schemes. More precisely, these schemes are based on the synchrophasor voltage angle measurements. They offer advanced monitoring and protection of the transmission network in a wider range, which is not only limited to one transmission line [19]. The suggested system protection has potential to be implemented in full operation in transmission substations and WAMPAC systems in control centers.

2.2. Developing and Designing the Triping Procedure of the WAMPAC System

In a system where reaction time needs to be measured in milliseconds and consequences can be severe the analyses of whole communication chain from substation to WAMPAC system and back is very important, as has been discussed in the literature [20,21,22]. As a prerequisite for successful functioning of the proposed advanced protection algorithms testing of time delay issues in communications infrastructure being used was conducted. The principal schemes for WAMPAC protection function operations are presented on Figure 2. It can be seen that it is a rather complex scheme with dedicated equipment and communications paths and devices covering the whole path from the transmission line to the WAMPAC system.
On the flow chart below (Figure 2) the upper limit expected time delay in all three segments of the communication chain is presented. The real time measurements conducted on a real transmission system (Croatian transmission power system) show much smaller time delays (Table 1). Time delays measured were done separately for different communication infrastructure on a TSOs (Transmission System Operator) synchronous digital hierarchy (SDH) optical network with LAN and WAN configurations. The measured values presented in table below (Table 1) include both the main and reserve paths with distance from substation to control center of up to 300 km. Results for those measurements are presented in Table 1, for power substations in 400 kV and 220 kV high voltage network. Values in table (Table 1) are on average much lower than the upper limits presented in the flow chart on Figure 2.
This means that, in principal, with current infrastructure it is feasible to have advanced protection functions that require small time delays. Consequently, the advanced angle instability protection seems to be possible to be implemented in real transmission networks since the communications infrastructure offers a reliable path with affordable time delays.
It can be seen from Figure 2 (decision tree connected to the decision weather phasor data flow consistency check is satisfactory or not), in the case that the whole range of required PMU measurements is not available the algorithm issues warning signal that the corresponding block function is not available. Similarly, like in relay protection devices, if a signal from analog or binary input is not available, particular functions depending on will be blocked and will not operate until the conditions for particular signal recover.
An important part of WAMPAC system are Phasor Data Concentrator (PDC) units. PDCs also contribute to the total time delay for a protection application running on dedicated server. The delay measurements were conducted for a real system. All types of PMU devices and communications links were included as shown in Table 2. These devices are installed on 400 kV, 220 kV and 110 kV voltage levels. PMU devices No. 19 and No. 20 are installed for testing purposes in control center. Type A PMU unit has protocols designed and produced for phasor measurement data in accordance with [23]. PMU type B generates phasor measurements in accordance with [24,25]. The “link type” column indicates the communications link type between measurement units and control center. Communication type 1 has 64 kbit/s channel encapsulated within 2 Mbit/s through the SDH optical network. Type 2 uses 10 Mbit/s Ethernet (WAN) protocol while for testing purposed inside control center LAN links are used for communication type 3.
The last column in Table 2 shows statistical mean values for packet delay measured for PDC system units. It is clearly shown that significant difference in time delay exists. Reasoning for that can be found in the fact that different types of PMU devices have different time stamping.
PMU units type A have stamping according to standard [23], where the time of the last sample is estimation windows used in PMU time stamp. The newer standards [24,25] implemented in PMU type B, use time stamps representing instant of the center of the estimation window.
The PMU devices that are used in Croatian transmission system have been in operation since 2004 and in principle there were installed in predefine spots for control and protection devices. Recently, there were temporary test installations (Table 2) with portable PMU devices for dedicated field measurement purposes and academic research. PMUs in operations are from four different vendors: majority produced by ABB Company, the rest by companies Arbiter, SEL, and one domestic producer STER. PMUs listed in Table 2 come from two vendors: (1) Type A PMU is ABB manufactured device (type RES 521) that was connected to secondary metering coil of voltage and current instrument transformer; (2) Type B PMU, is from STER vendor (type STERPMU-R1), connection is the same for voltages measurements (secondary metering coil of voltage instrument transformer), while different connection was used for currents measurements that were connected to secondary protection coil of current instrument transformer. This way, it is possible to trace currents in a complete range from normal operating currents to short circuit values also enabling at the same time line back up protection functions.
Again, after this second series of delay measurements general conclusion is that it is possible to use complex transmission system protection algorithms in control centers for advanced monitoring and protection purposes since the whole delay chain (data transmission delay + processing data delay + command transmission delay) contributes with total delay time that is smaller than 50 ms, which is satisfactory.

2.3. Simulations Environment Model for Developed WAMPAC System Functionalities

Well proven model of Croatian 400 kV transmission system network [26] was updated and used for this study work in the form that is presented on Figure 3. Model has undergone fine tuning process with the historic real operation data, and is therefore used as simulations reference for development of protection and monitoring functions of WAMPAC systems.
Model has six buses with five transmission lines, but includes more details than most similar IEEE 9 bus reference model [27]. Model for PMU measurement has been designed on each of the transmission lines since the Croatian transmission system has full coverage with PMU devices and this model aims to reflect the real situation with PMU installation and WAMPAC system coverage of the high voltage transmission network. High voltage network equivalents were calculated and modeled for each bus to represent the on that bus truncated rest of the transmission system. As will be shown in the results section, very accurate responses were achieved with the described model for various dynamic angle instability scenarios simulations.

3. Angle Instability Disturbances in Transmission Network

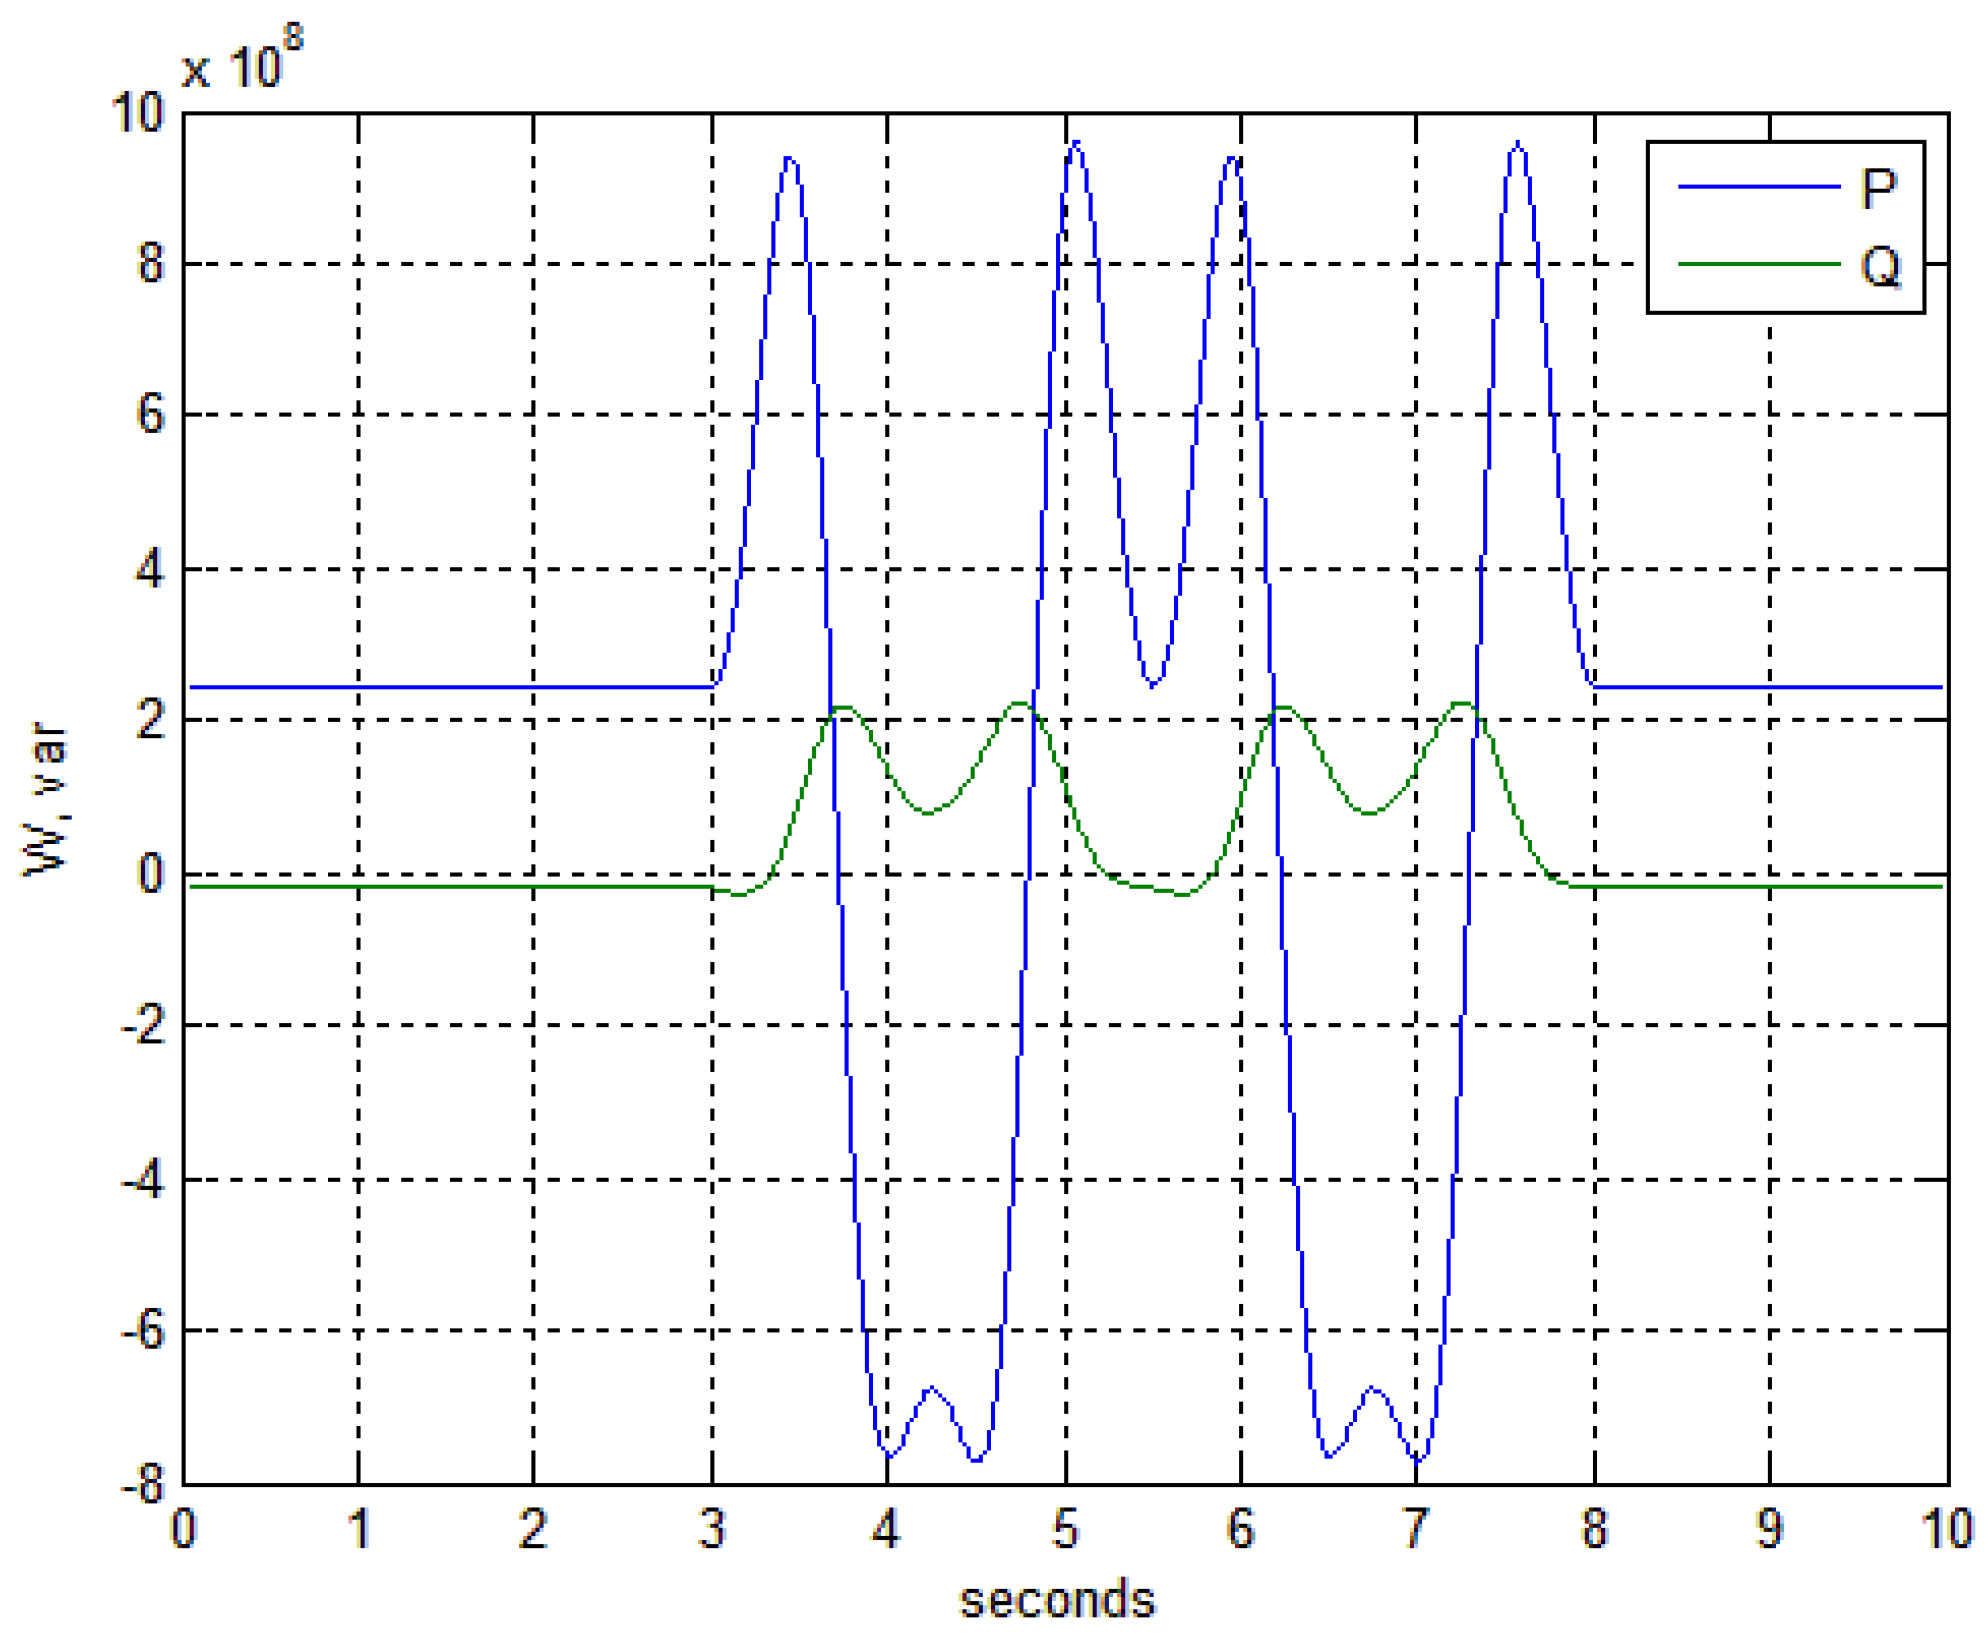
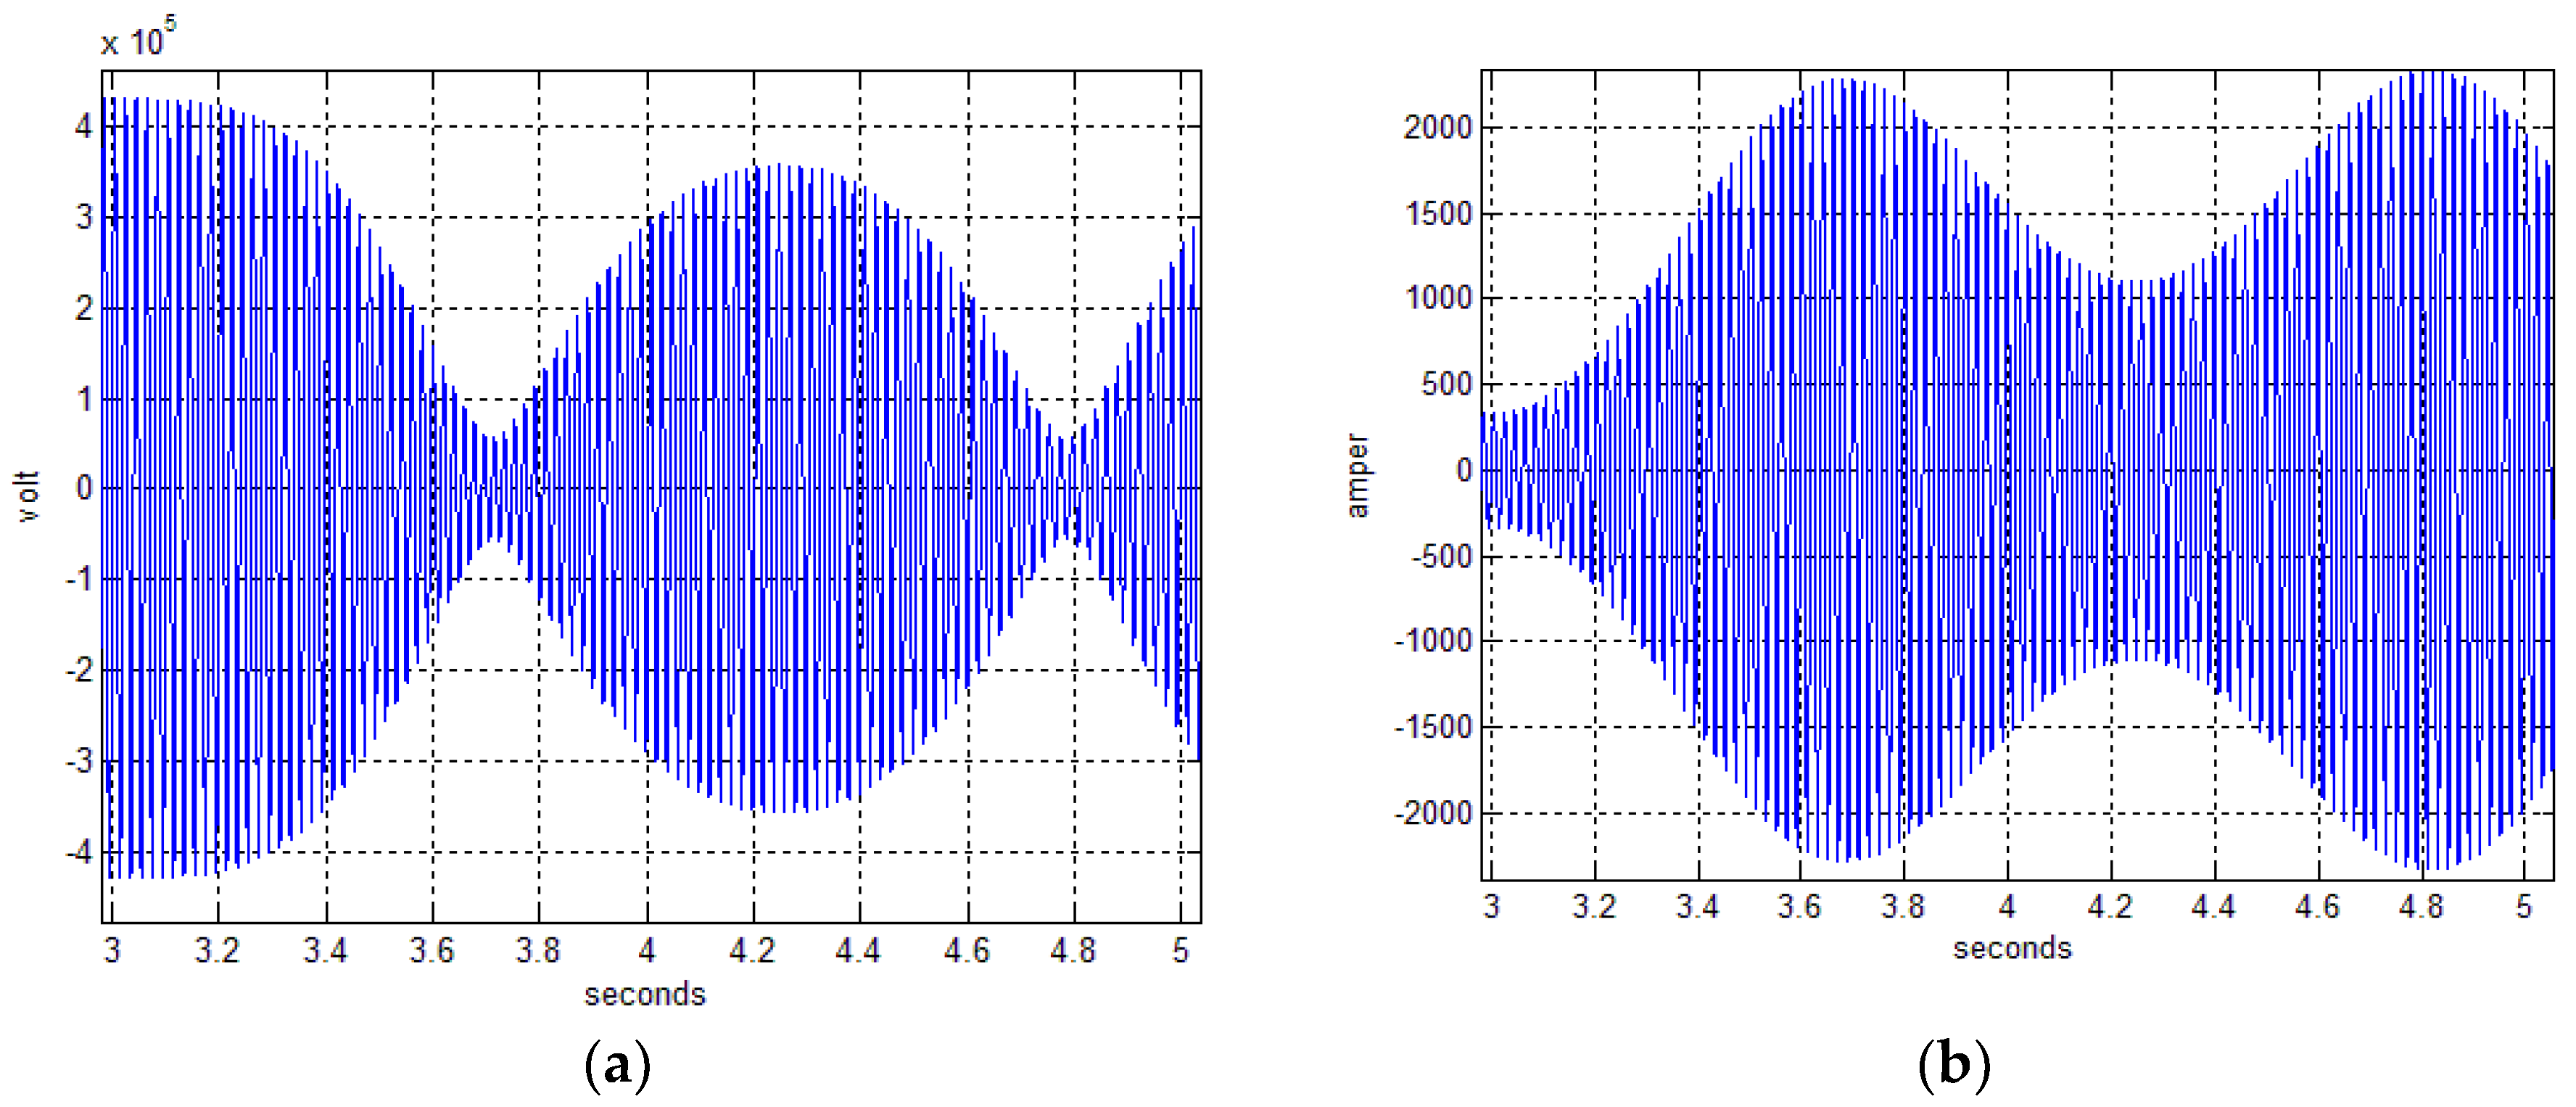
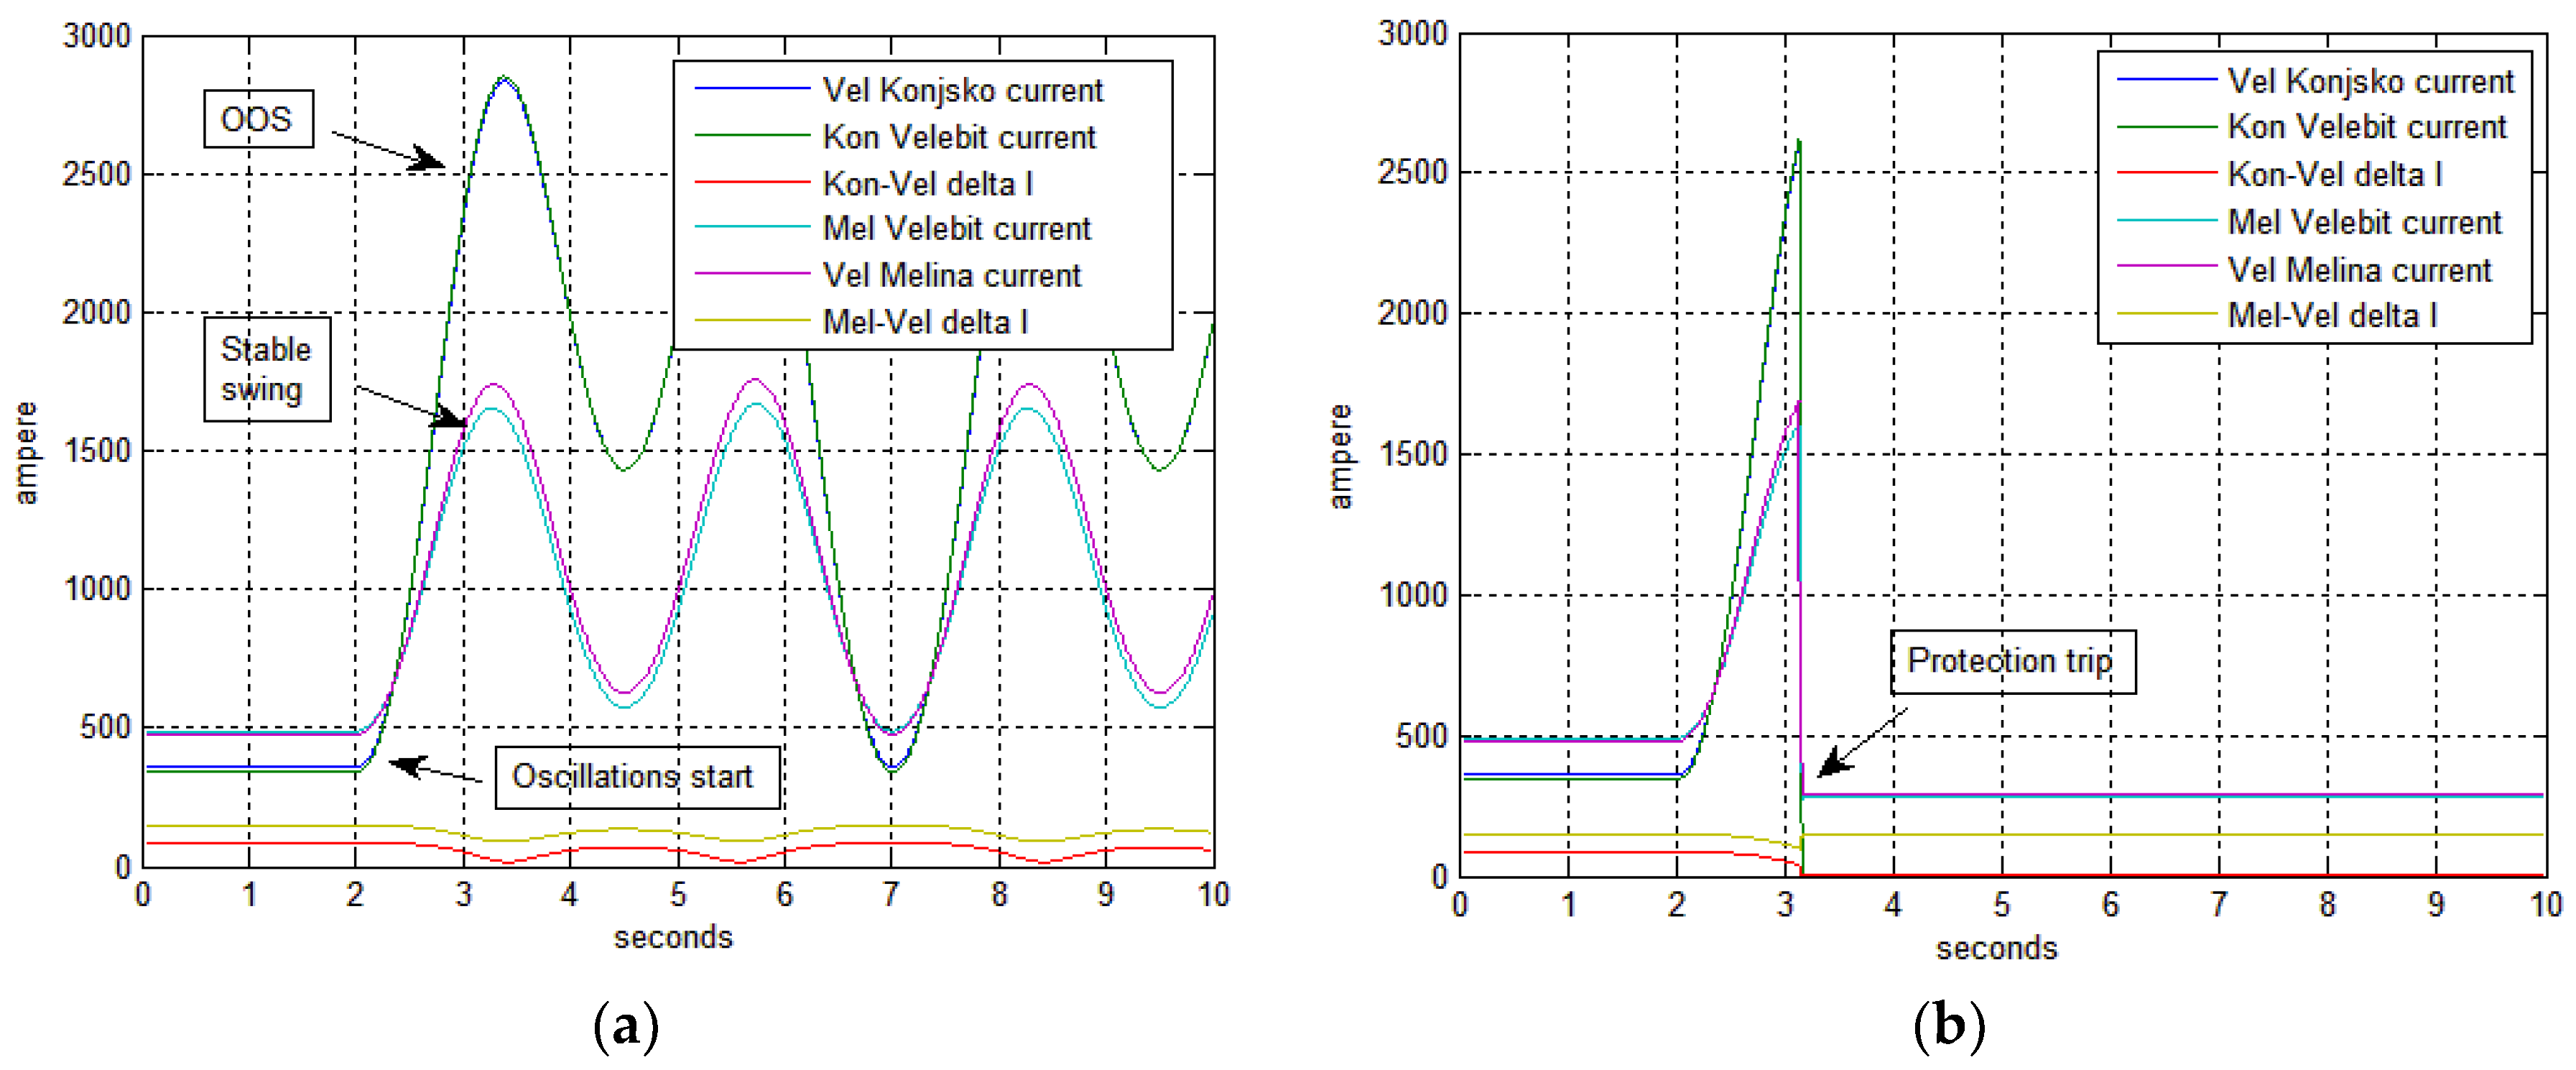
Angle instability conditions in transmission power network are undesirable events that can have severe consequences. They can seriously jeopardize normal operation in the transmission network with great risk of energy supply reduction. Out-of-step condition disturbance is an extreme manifestation of angle instability. As an example, significant oscillations in voltage (Figure 4a) and current (Figure 4b) values followed the occurrence of out-of-step condition (simulations done for real 400 kV Croatian transmission network model described in Section 2.3).
Voltage magnitude decreased to almost to zero kV for a transmission line where the out-of-step condition manifested (Figure 4a) and current values surpassed the nominal values by a large margin (Figure 4b). In parallel, intense power oscillations are also present as can be seen from the Figure 5, where the difference compared to stationary state (before second 3 when out-of-step condition occurs) is significantly different.
These power oscillations are far above the nominal values of transmission lines, which can cause damage to other parts in electrical power system, especially generators units that can be seriously damaged [28]. Furthermore, circuit breakers on transmission lines can also be endangered due to increased voltage stress that is caused by even doubled voltage amplitudes during the breaker opening contact sequence [29].
There are different methods of detection and reaction to the angle instability conditions, mainly out-of-step. As was mentioned in the introduction, this paper describes the developed algorithm that can be implemented in the TSOs control center and provides efficient detection and reaction mechanism to a wide range of angle instability conditions. The prerequisite is availability of communication infrastructure as was discussed in Section 2.2 of this paper and availability of full-coverage of PMU measurements, which at the present time, can be achieved only in smaller systems, but in the future, even for the larger systems if the trends of PMU development persist. These prerequisite being met, the real operation implementation of the proposed algorithm can be achieved as was shown for the case of the Croatian transmission network. For comparison, majority of different angle instability protection methods are still in the study phase and not mature enough for the implementation (e.g., fuzzy logic/clustering based algorithm or resistance based algorithms) or have some inherent deficiencies (e.g., equal area based algorithms or voltage based algorithms). More detailed overview and comparison of the methods can be found in the previous work of the authors [12].

4. Developed Method for Quick Detection of Angle Instabilities in Transmission Power Network

4.1. Trajectory Characteristic Tracking for Protection Purposes

Alike the traditional relay protection systems WAMPAC system also tracks the data quality of the measurements that flow in. As a first data evaluation step, the angle trajectory paths are being tracked. This first step distinguishes between smooth and continuous trajectory paths opposed to trajectory jump that occur under certain conditions. This preliminary data evaluation is also used as one of the protection criteria during the development of out-of-step condition detection and early warning issuing algorithm.
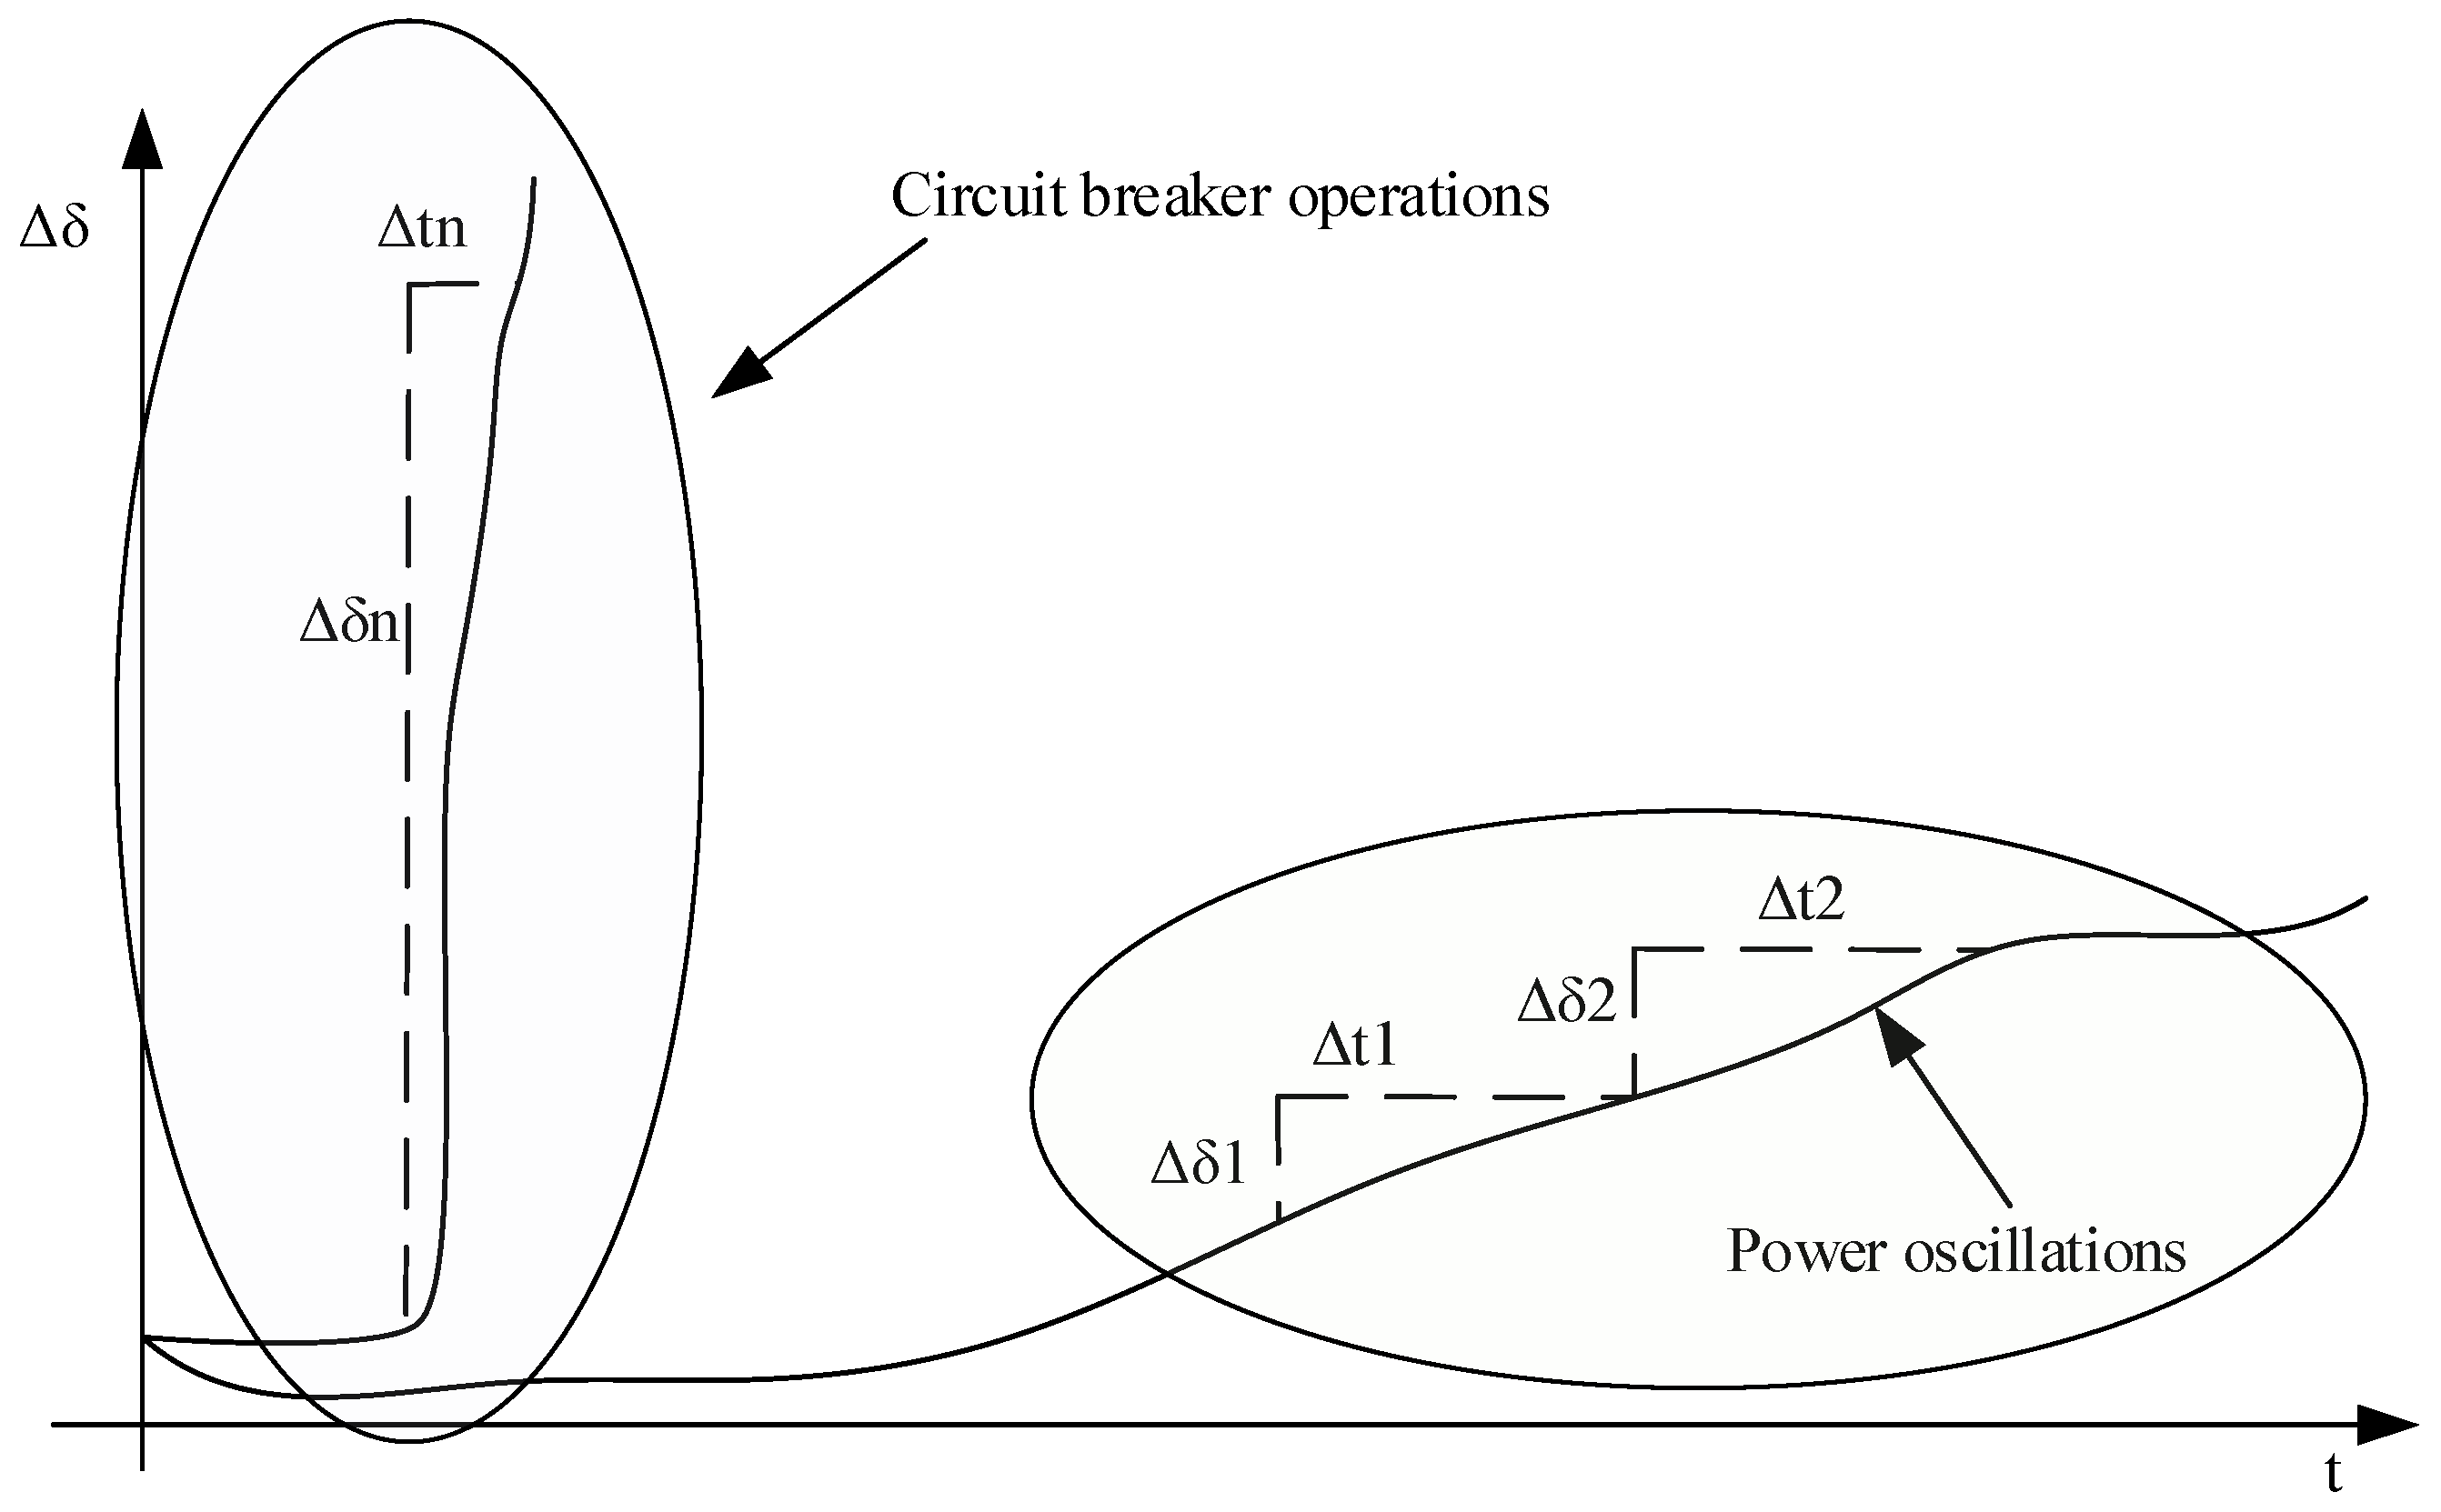
Clear differentiation between power oscillations and ramping characteristics should be assured. Usually, angle difference trajectory during oscillating conditions manifests smoothly changed electrical values (voltages, currents, and active and reactive power). Ramping changes happen when sudden actions such as short circuit or breaker switching operations occur, as shown on Figure 6.
With the PMU sampling rate given with 50 samples per second trajectory characteristics are smooth enough and with enough details resolution to be used in WAMPAC systems. All of the trajectories during oscillations should be changed following two main principles:
  • Uniformity—values received from PMU devices for each sample period (20 ms) change proportionally below preset thresholds without significant steps or jumps.
  • Continuity—two subsequent values have consistently small differences. Trajectories have no discontinuities or disruptions in their path. Breaker switching operations are manifested as leaps from one value to other without further changes of trajectory for the duration of fault.
For any kind of switching operations, the trajectory is not smooth inherently since it has almost discrete change from one value to another. Furthermore, under some circumstances, e.g., segment of measurement data packet delayed or missed, the smoothness of the trajectory is also disrupted.

4.2. Main Detection and Protection Criteria

Voltage phase angle values obtained by the PMU unit can be deployed as new cornerstone for protection purposes. Basic values of voltage phase angle difference Δφ are shown by Equation (1). These values are derived from synchropahasor measurements.
Δ ϕ = ϕ 1 ϕ 2
This value is available on all the transmission lines that have their conditions monitored and observed by PMU units. Other two values and indicators of conditions on transmission lines that are used by the proposed algorithm are angle speed (Equation (2)) and angle acceleration (Equation (3)).
ω = d ( Δ ϕ ) d t
α = d 2 ( Δ ϕ ) d t 2
The proposed algorithm for out-of-step condition detection and early warning has to react before angle difference (Δφ) reaches 180°. Furthermore, it should differentiate active power oscillations in transmission network from out-of-step conditions. Reaction time, as discussed earlier in Section 2.2, is very limited because out-of-step conditions in transmission network develop extremely fast. In each phasor cycle (20 ms time window), angle difference, angle speed, and angle acceleration are constantly monitored. Trigger values for α and Δφ are used as indicators. With active power changes on transmission lines angle acceleration (α ≠ 0) increase is observed:
| α i + 1 | > | α i |
For a stable active power swing angle acceleration passes through zero (zero-crossing) in the first few hundred milliseconds. Therefore, values of α equaling zero in first i + n cycles, is a first indices that a stable swing will occurs during that power swing period. During that time angle speed, ω (Equation (5)) and angle difference (Equation (6)) follow their own trajectories. Values of angle speed will have zero crossing in the first (i + n) + m cycles. Angle difference Δφ will have zero crossing in the (i + n + m) + k cycles. Where n, m and k represent limited number of cycles after consecutive zero crossing of corresponding phase angle value.
| ω i + 1 | > | ω i |
| ϕ i + 1 | > | ϕ i |
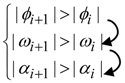
If those conditions (zero-crossings) are realized in described particular sequence, α than ω than φ, (αωφ) that power swing will remain stable and will not develop in out-of-step conditions. Simulation scenarios indicate that signal for stable power swing is possible to be generated in time before angle difference reaches its maximum value.
Different values and trajectories are measured for occurrence of unstable swing that leads to out-of-step conditions. Angle difference threshold is set as the maximal allowed value for operation of transmission network in alert conditions. These values (Δφ MONITOR START) are used for setting of the synchrocheck functions on the transmission lines. Study work and calculations for relay protection purposes define that the maximal allowed voltage angle differences for synchrocheck function in the transmission network are in range from 20 to 30°. Greater values can endanger normal operation conditions and therefore for the values above 30° the synchrocheck function inside relay protection or bay computer blocks issuing the closing command for circuit breaker. In some emergency or specific situations, the override of the blockade is possible.
If the following sequence of zero-crossings accomplishes: φ than ω than α, (φωα—Equation (7)) for each observed cycle and the trajectory has a monotony increasing trend alarm for unstable swing will be generated before full out-of-step condition occurs (Δφ =180°).
Energies 11 00681 i001
Alarm will be generated few hundreds of milliseconds before out-of-step condition occurs. These values can be indirectly defined through preset values (Δφ TRIP COMMAND) that are in range from 30 to 50°, which will assure enough time to send a trip command to dedicated line circuit breaker.

4.3. Line Differential Remedial Protection Criteria

Protection systems should always assure correct detection of disturbances in the transmission network. Additional protection conditions need to be used for this demanding task. The main criteria are evaluated through additional remedial criteria in the proposed algorithm. Two remedial criteria are chosen in the algorithm described in this paper. In a case of line fault appearance, first criteria are the line current difference that can help determine the exact fault locations. This criterion relies on well proven technology of line differential current (Equation (8)), which compares the currents from sending (I1) and receiving (I2) ends of the transmission line.
Δ I = | I ¯ 1 I ¯ 2 |
Values of I1 and I2 are phasor values from both line ends and comparison is done for values with the same time tag. This criterion will detect every kind of line fault (short circuit, high resistance fault, earth fault, etc.).
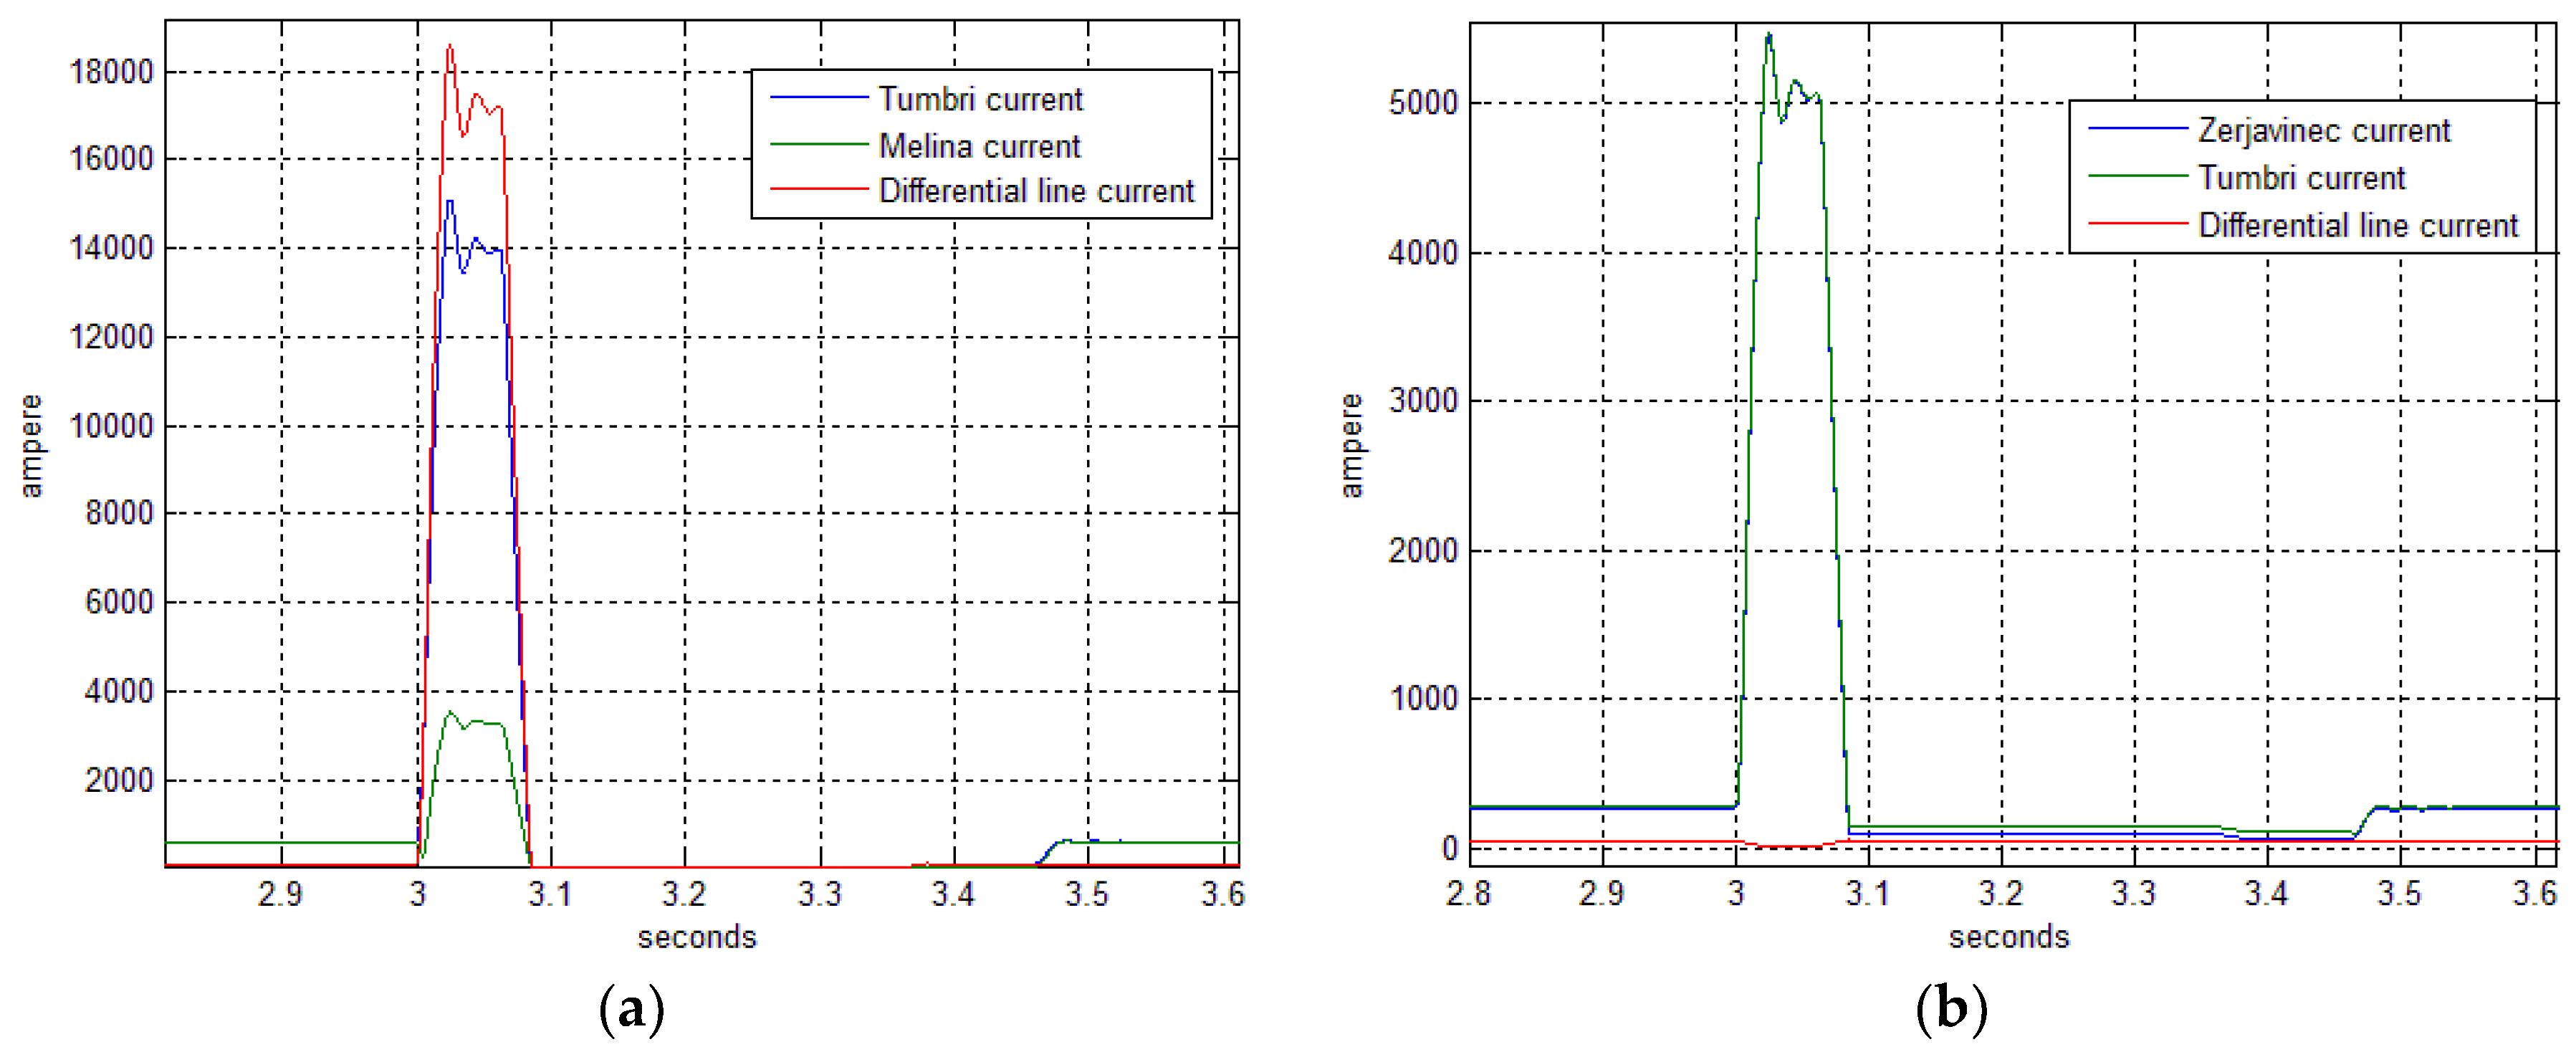
As an example, three phase short circuit line fault on Tumbri-Melina 400 kV line was simulated and line current and line differential current conditions are presented on Figure 7a. Neighboring line, Tumbri-Zerjavinec, with its current conditions is presented on the Figure 7b. The scale and order of magnitude difference between the current on faulted line (Figure 7a) and current of neighboring line (Figure 7b.) is important to notice since this difference can help to determine the fault location.
Presented graphs (Figure 7) show a great potential of differential protection functions for the use in WAMPAC systems, since they can also be realized with synchrophasor data, and therefore combined with various other WAMPAC system functionalities.

4.4. Equivalent System Inertia Remedial Protection Criteria

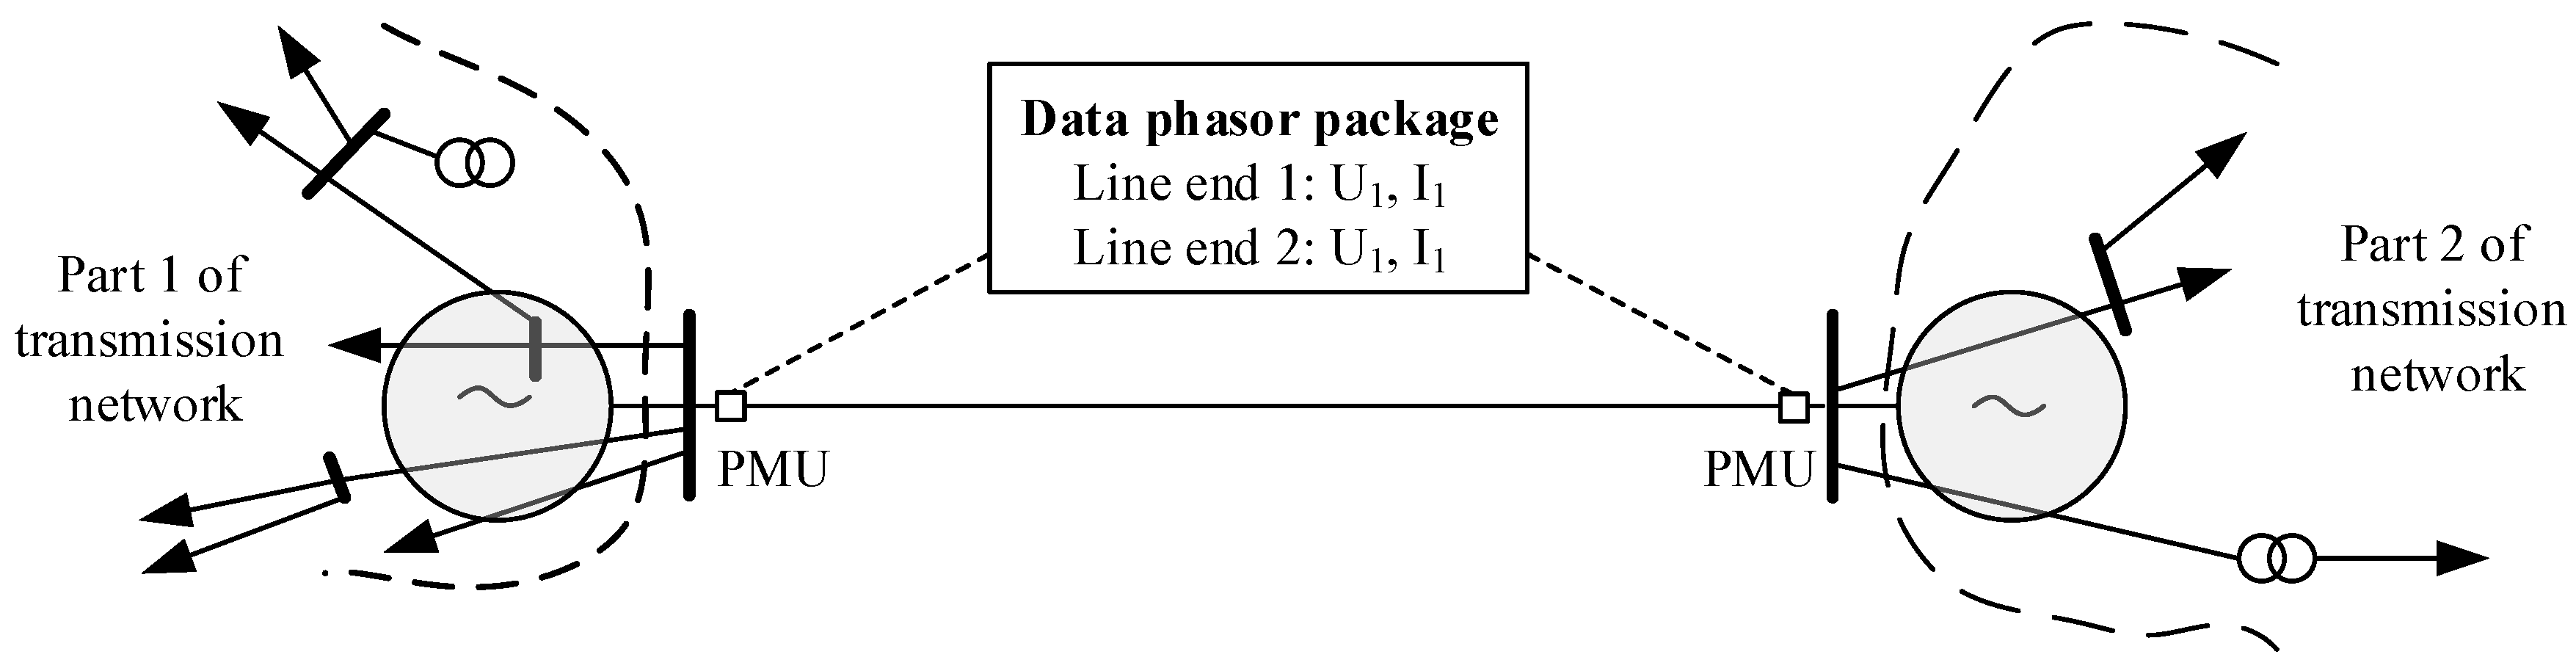
Each transmission lines equipped with PMU devices inside a transmission network can be presented as an isolated connections between two machine equivalents (shaded generators equivalent behind busbars on Figure 8).
Despite the generator equivalent simplification clear picture for analyses and action is obtained regardless. From relay protection perspective, full protection and monitoring functions can be implemented. These include protection algorithms for active power oscillations, with a focus on adequate reaction during out-of-step conditions and tracing of energy oscillations on observed lines and indirectly in wider transmission area. The main goal is to detect various types of active power oscillations in transmission system in order to issue appropriate protective alarms and actions if needed.
For the development of different monitoring and protection functions in WAMAPAC system it was necessary to acquire insight to energy that transitions and oscillates during disturbances. One important condition for successful algorithm development is to use the only available synchrophasor measurements. Therefore, this energy can be expressed in various values as a function of angle momentum or equivalent system inertia. The outputs are well known equations for generator state description, which have to be adopted for transmission network and for calculations in real time. These equations include the Newton’s second law for rotating machines (Equation (9)) [30].
J d ω m d t + D d ω m = τ t τ e
where J is the total moment of inertia for turbine and generator and ω m is a rotor angular speed and δ is rotor angle. D d is the damping factor and τ is the torque for turbine ( τ t ) and for generator ( τ g ). This covers a single machine case.
Rearranging and substitution Equation (9) will have the following result:
P m P e = M d 2 δ d t 2
Swing equation with some simplifications can be adapted for usage as the second additional remedial criteria. Accordingly, Equation (10) is adapted for usage in order to achieve real time calculation capabilities (Equation (11)). Losses on transmission line are neglected.
Δ P l i n e Δ P l i n e a c c e l e r a t i o n = M l i n e α l i n e
Adopted angular momentum on transmission line is expressed as:
Μ l i n e = Δ P l i n e α l i n e
With this equitation energy changes on transmission lines are measured both during the normal operations and during disturbance conditions. This energy changes are expressed in accordance to angle change on particular line.
In similar manner transmission line equivalent inertia ( H l i n e _ e q ) can be expressed since it is measured the same way like angular momentum. Relations between angular momentum and inertia constant H is given by Equation (13).
M = 2 H S n ω s
Equation (13) can adopted for transmission lines and is expressed in per unit values.
M l i n e = 2 H S n ω s = Δ P l i n e α l i n e
Assumed that nominal power is equal to base power ( S n = S b with for example S b being 1000 MVA for one transmission line), and nominal angle speed ω n = 1 , then Equation (15) is reached.
2 H l i n e _ e q = Δ P l i n e Δ α l i n e 1 S b
Using Equation (15) and synchrophasor, measurement data insight into values of inertia constant in the transmission network becomes available. Values of transmission line equivalent inertia H l i n e _ e q has very different trajectories and patterns for stable active power oscillations and out-of-step conditions. On this basis, second remedial criterion (first being differential current) for early recognitions of out-of-step condition was defined. As is described later in the results section, the equivalent inertia has significantly different trajectory depending if the unstable swing (out-of-step condition) developed or the angle instability remained only as stable swing.

4.5. Two Level Criteria Protection Schemes

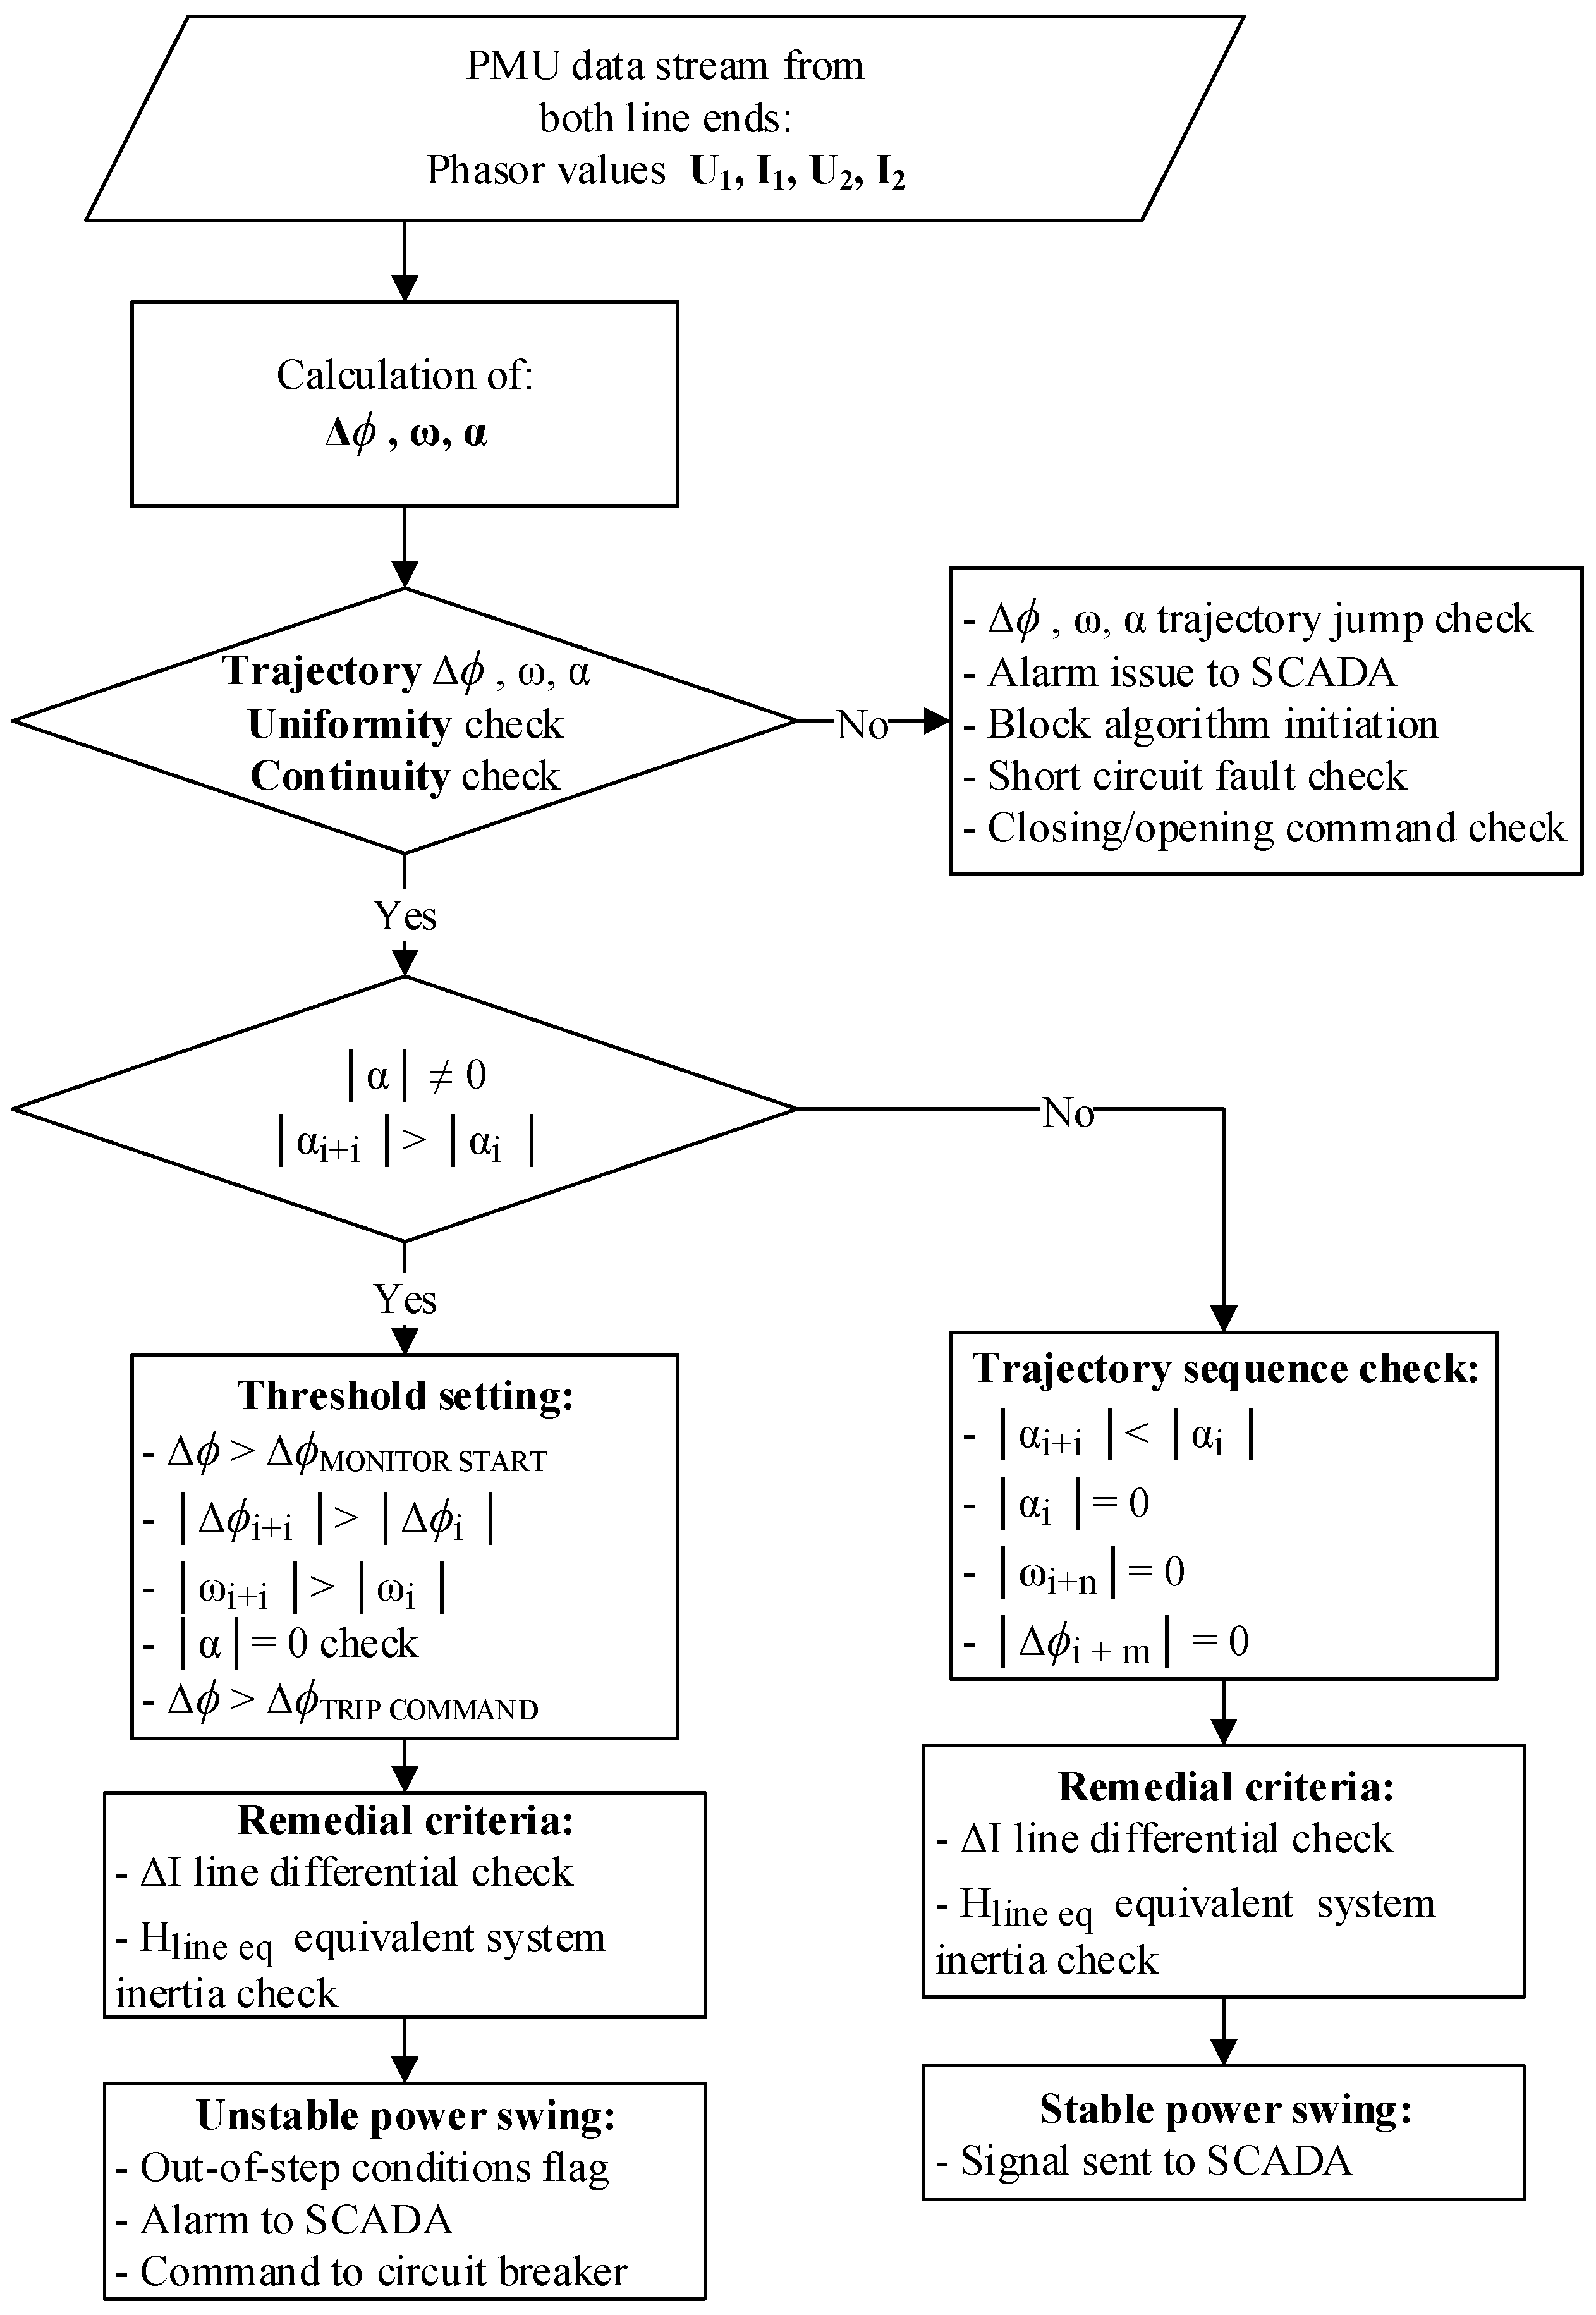
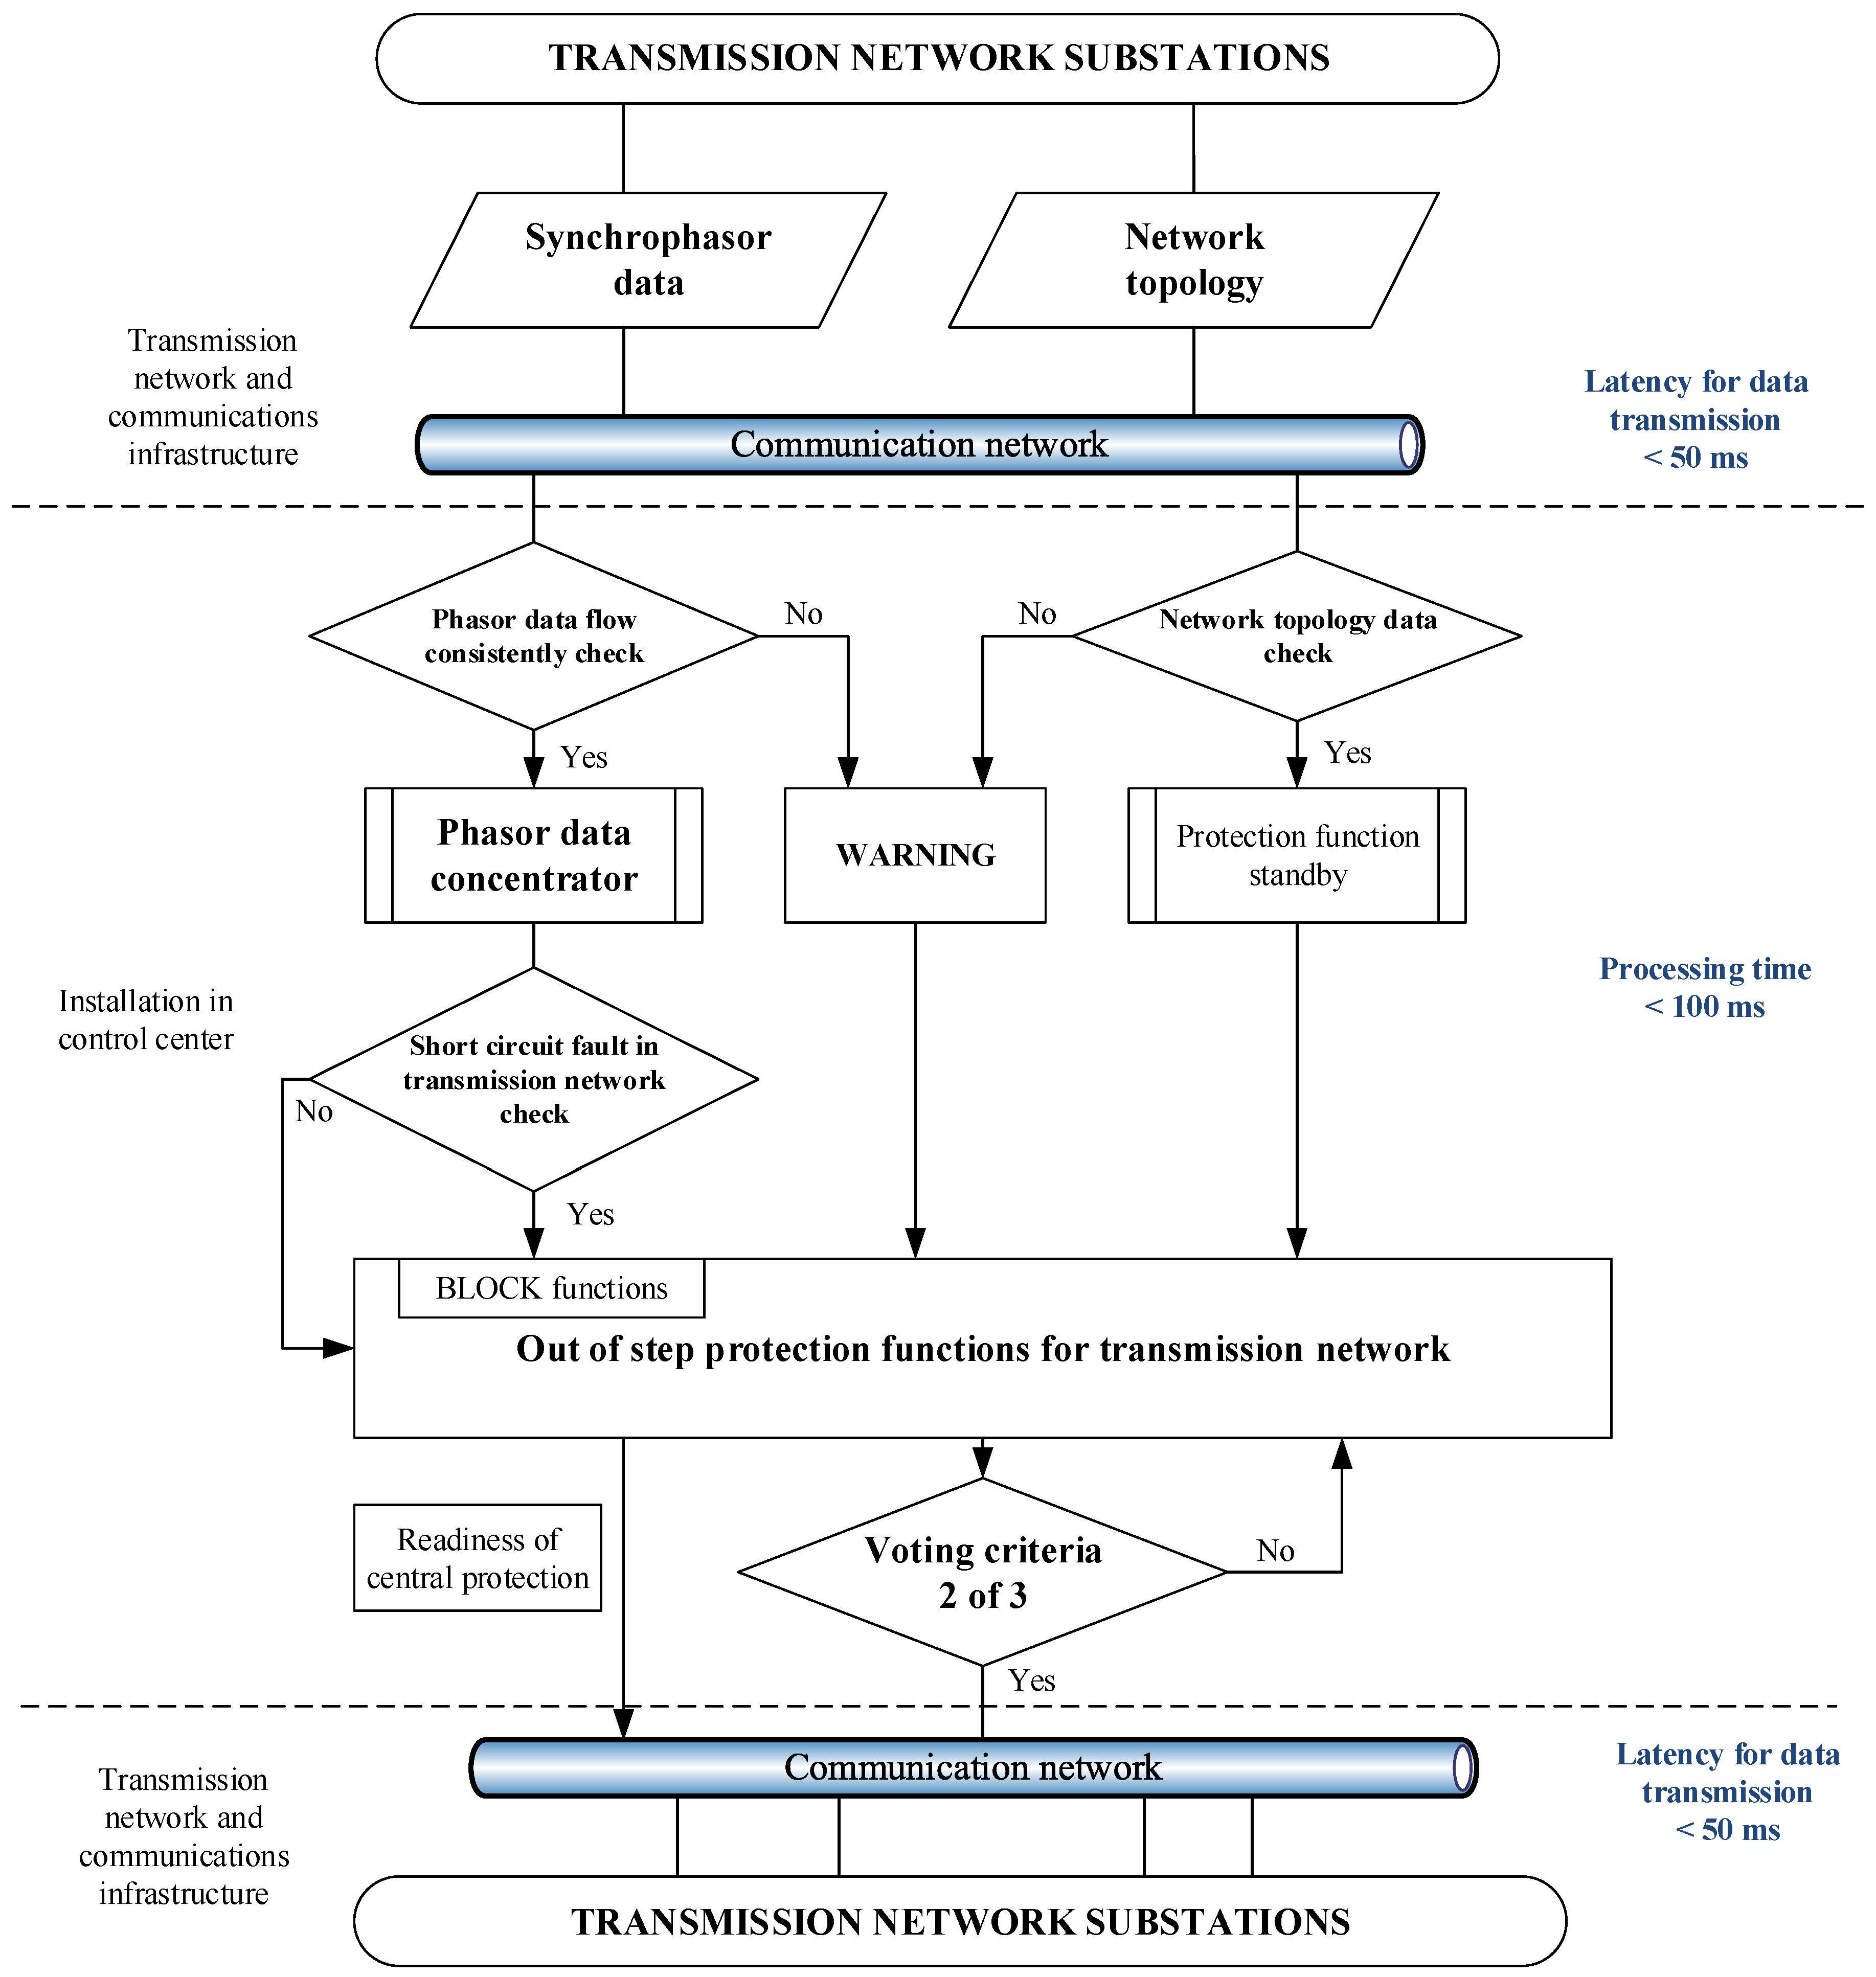
Main criteria for detecting active power oscillations and differentiation between stable and unstable power swing was designed and explained in previous section. The proposed flow chart for described algorithm design is depicted on Figure 9 and is to be implemented into the WAMPAC system. The interconnection between SCADA and WAMPAC system is in the exchange of signals and statues from different WAMPAC system protective blocks/function. This way, the SCADA system information of the knowledge of the system status is enhanced even further.
The detection of out-of-step conditions in transmission network is a complex process in comparison to short circuit detection. Additionally, checks need to be carried out in a case of real line fault, because under those conditions, line relay protection has to be activated. This checking process runs in parallel to main criteria and it is divided into two level protection schemes (Figure 9).
A line differential criterion provides additional confirmation of the location of the faulted line. Equivalent transmission system inertia H l i n e _ e q criterion additionally differentiates between stable and unstable swing development on transmission lines. The described two level criterion enables fast reaction for protection purposes during angle instabilities disturbances.

5. Analysis of the Simulations Results and Basic Characteristics of Angle Instabilities in Transmission Power Network

Simulation model was developed in MATLAB software [31] and afterwards ran through the extensive process of verification and validation against real operation archived data [32,33]. The modelled 400 kV network is a multi-machine network of the real 400 kV Croatian transmission system, as was mentioned before.
For the test of the proposed algorithm, the simulation duration was set to 10 s and oscillations were initiated in 3rd second and lasted till 8th second. Segments of the simulation results are presented in the following section. The model was designed primarily for developing protection functions for angle instability events and the priority was to achieve proper protection response.
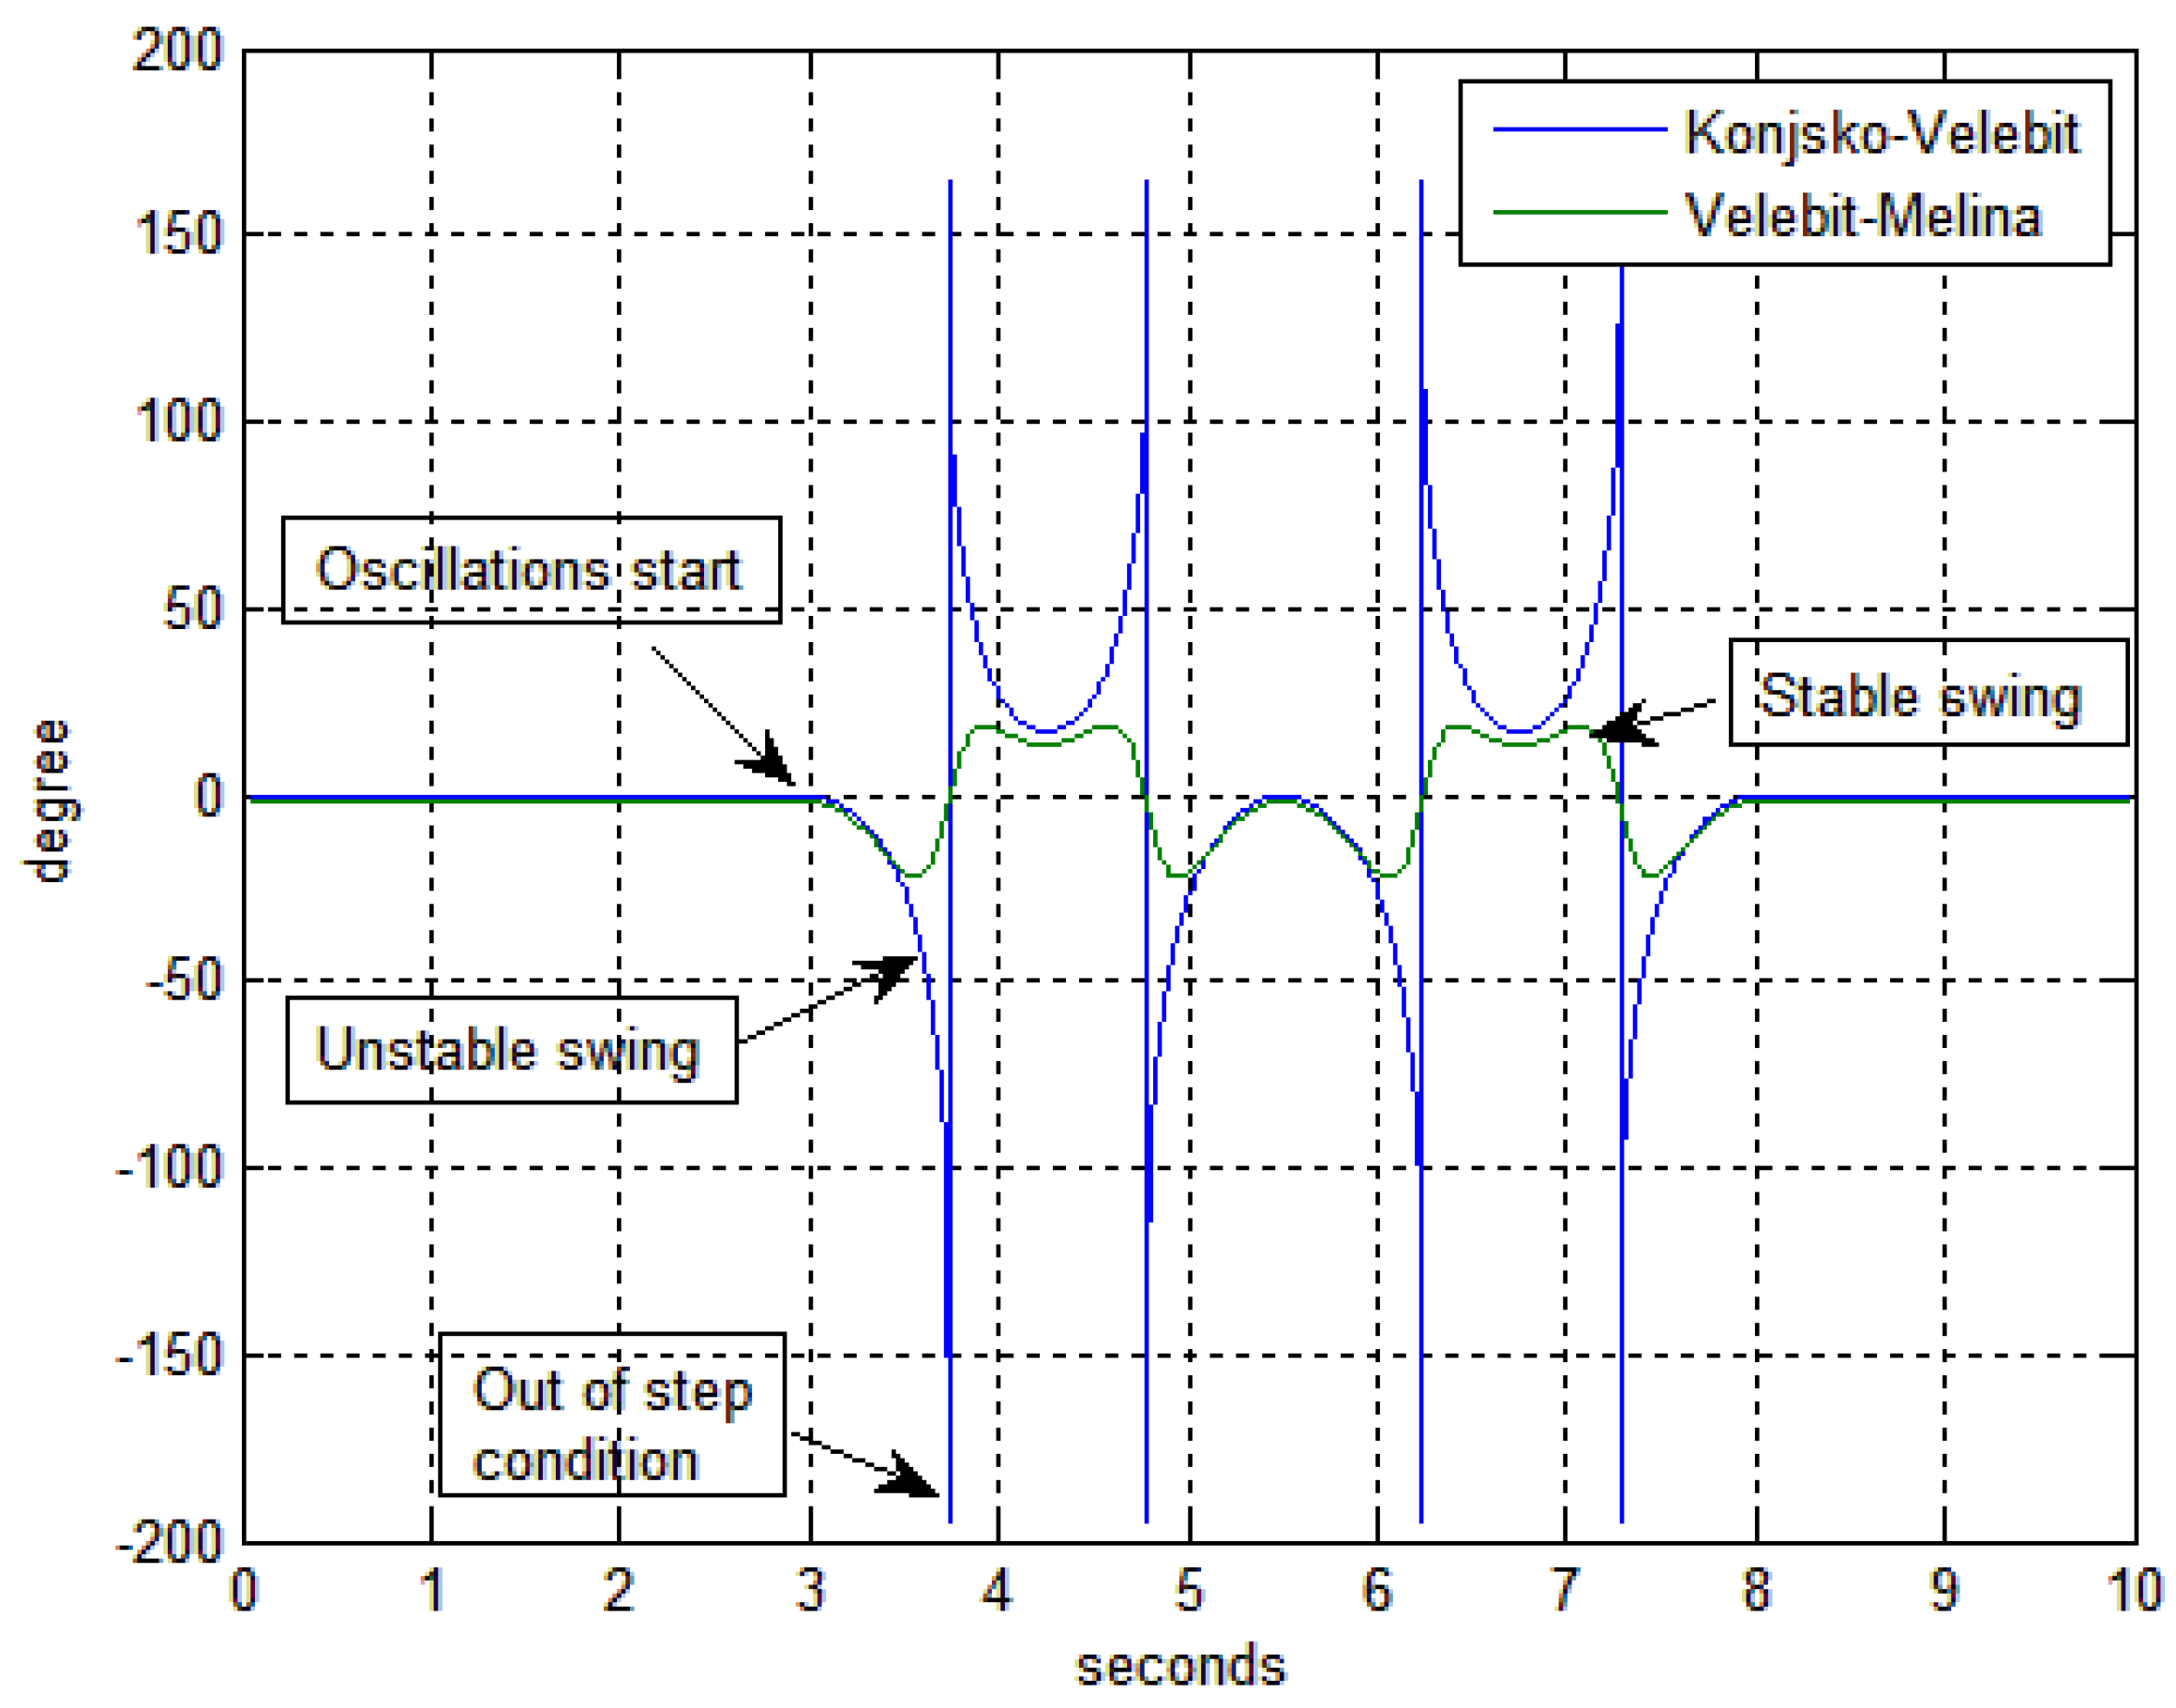
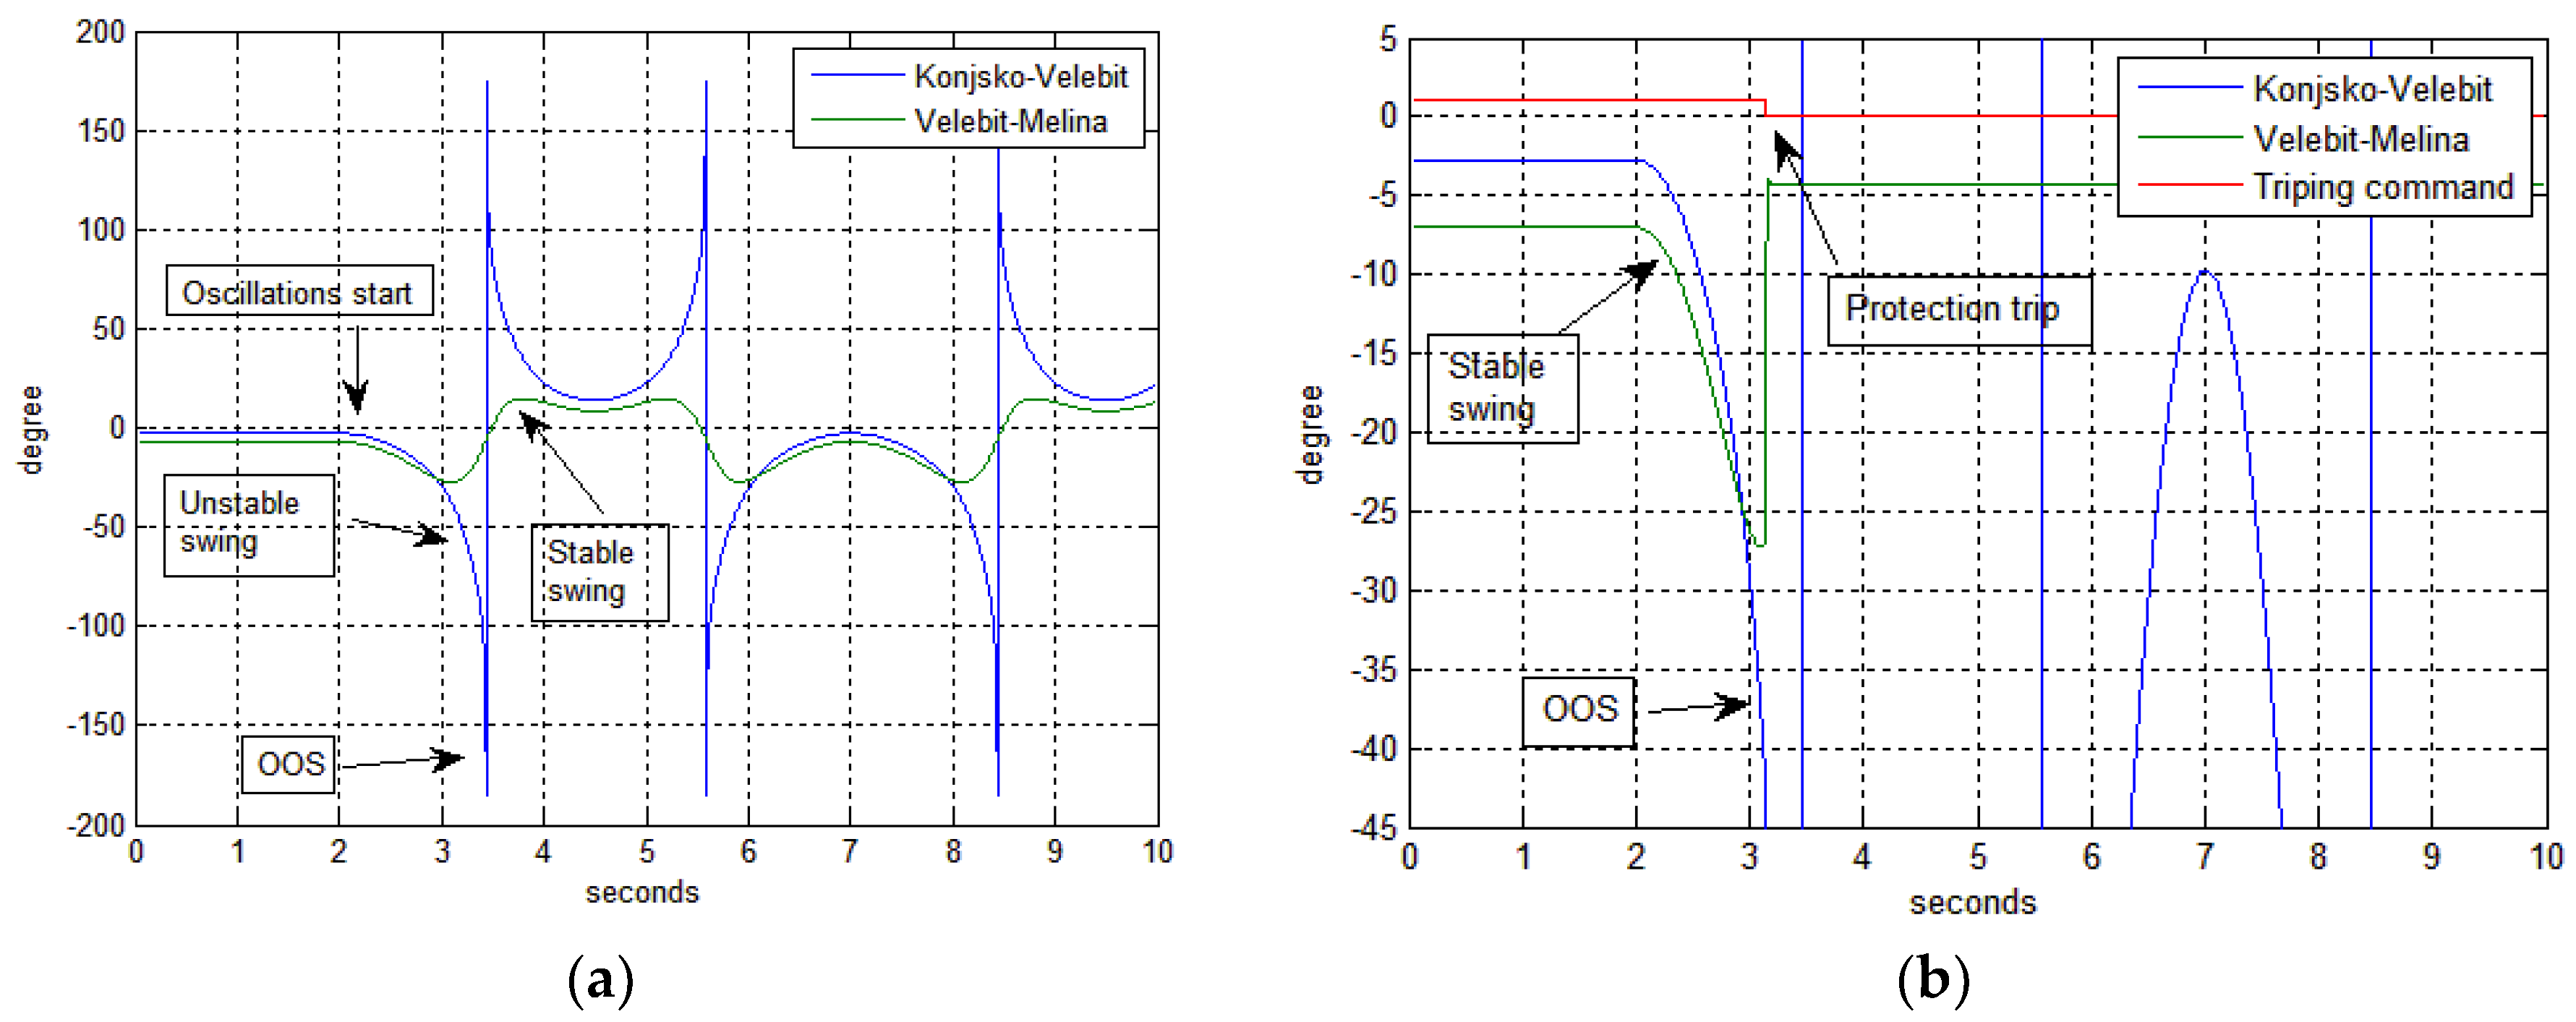
Using synchronized phasor measurement data in daily operation gives the TSO a broad range of advanced and powerful possibilities such as monitoring of angle stability, which is in the focus of this work. This means that every oscillation in transmission network will be observed and noted, thus alarm can be issued or even automated reaction can be generated. Described protection algorithm, as was mentioned before, is developed with aim to help the detection of angle instability events and provided basis for fast reaction. Simulations results for high active power oscillations on two lines are presented on figure below (Figure 10—blue line). 400 kV transmission line Konjsko-Velebit is exposed to unstable swing, which develops to out-of-step condition. Neighboring 400 kV line Velebit-Melina, manifests only the stable power swing (Figure 10—green line).
Angle difference, Δφ presents how power oscillations behave using the data of voltage angle from both sides of the transmission lines, Figure 10. Simulated disturbances in Matlab environment follow the characteristic pattern for stable and unstable swing [34]. The representative disturbance for out-of-step condition occurrence on the 400 kV transmission line Konjsko-Velebit was presented on the following figure (
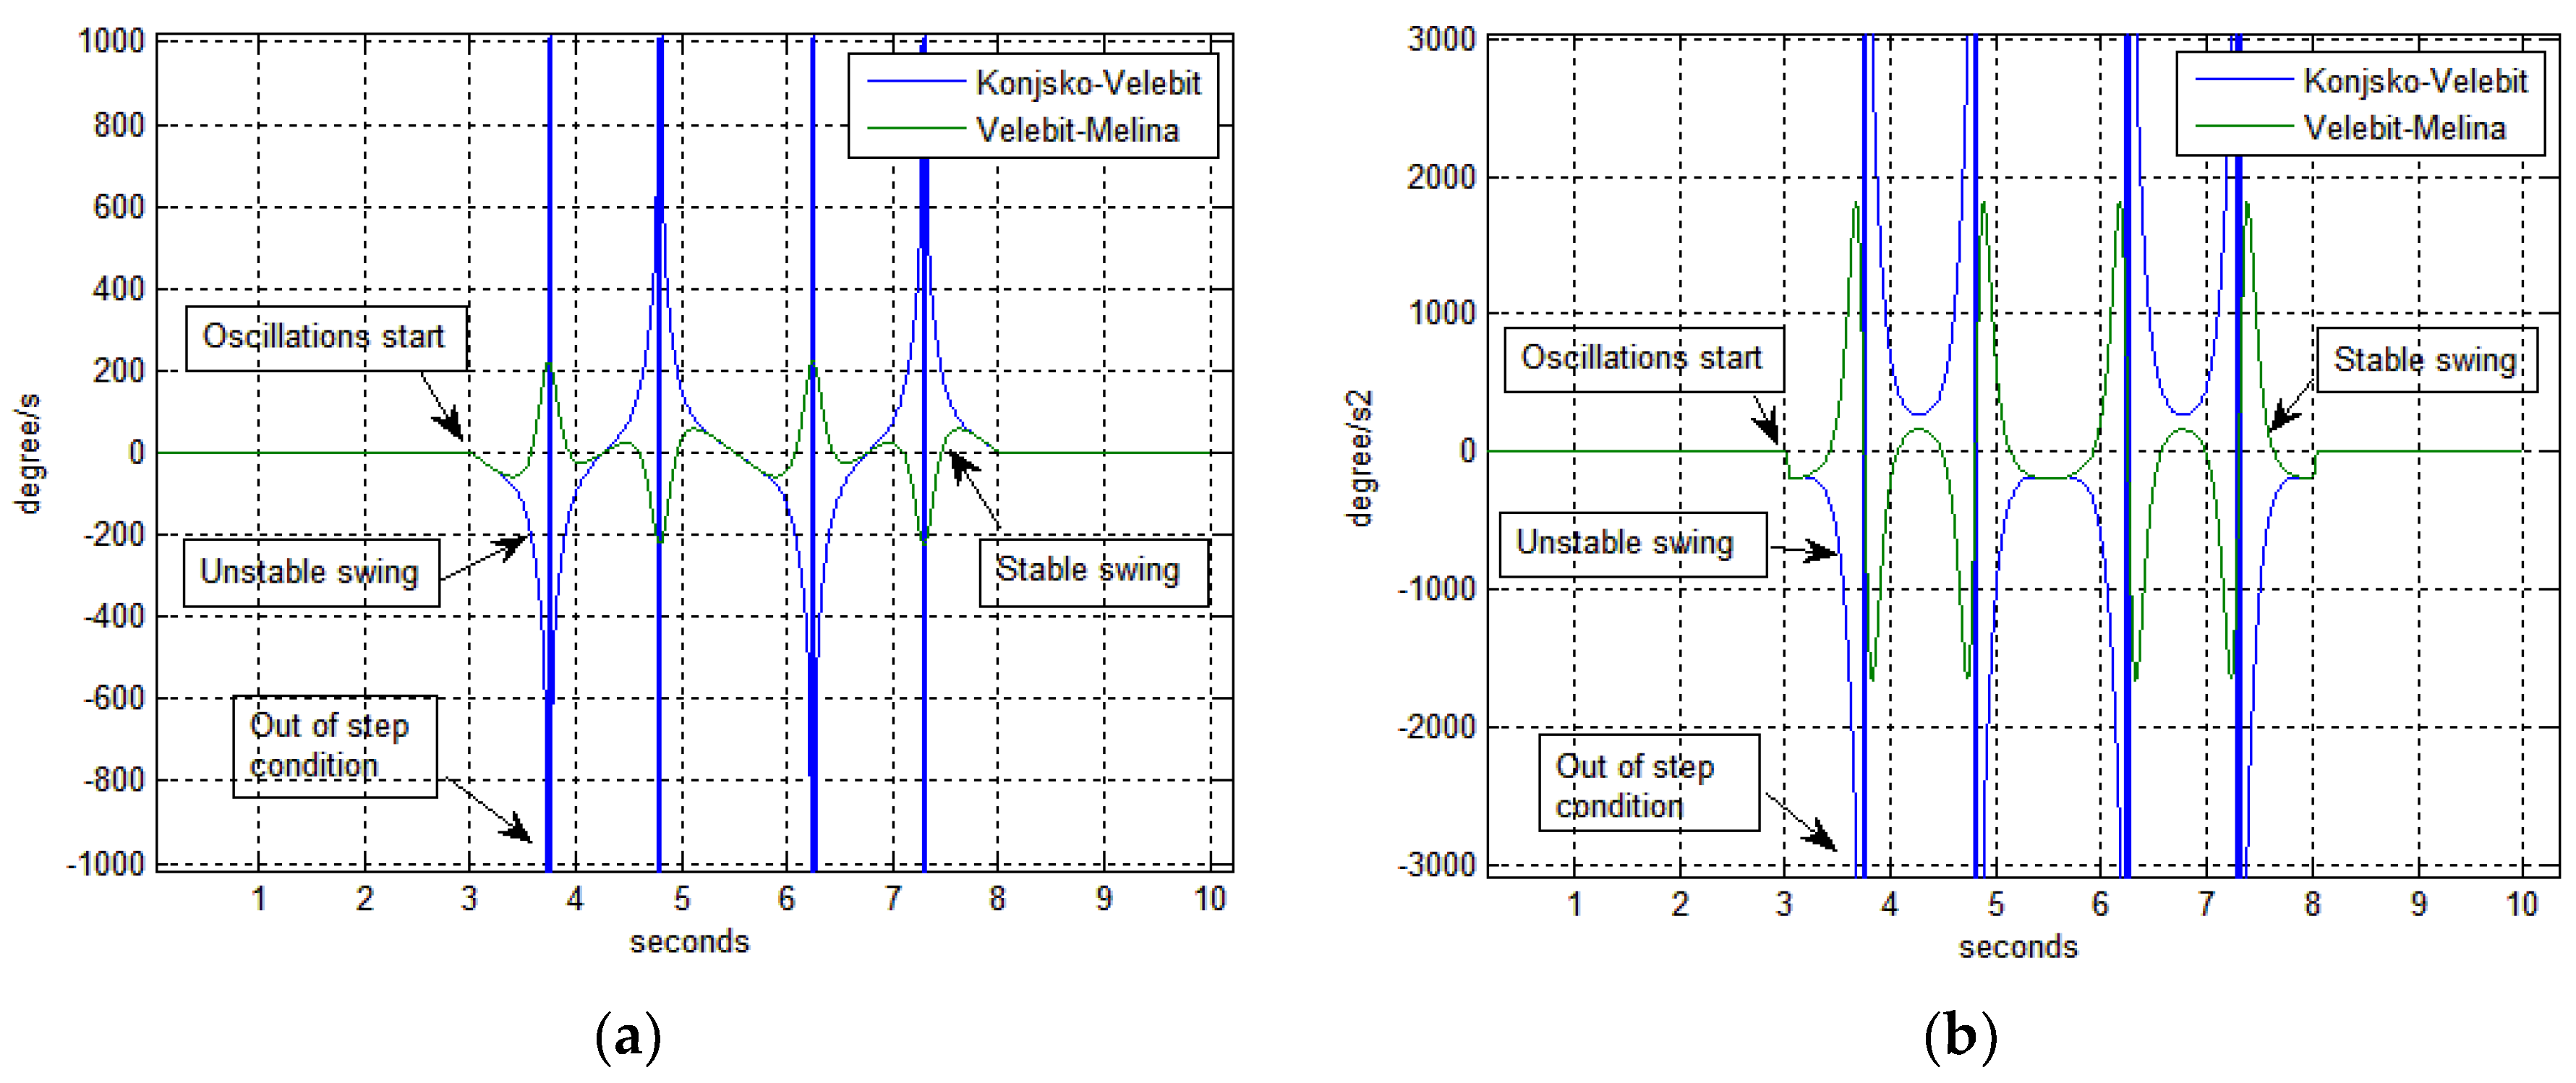
Figure 11). Neighboring 400 kV lines (e.g., Velebit-Melina) also manifested strong active power oscillations.
Through simulation, it was shown that besides angle difference other angle values should be traced and monitored in order to correctly detect the disturbance. Those values are angle speed (ω) and angle acceleration (α). Line with out-of-step condition (Figure 11—blue line Konjsko-Velebit) has significantly higher angle speed ω then other lines where only power swings manifests (Figure 11—green line Velebit-Melina).
Readings from Figure 11 return values of ω = 16,000 degree/s (value is out of scope for selected axis range) for line with out-of-step condition and for line with only power swing value is ω = 700 degree/s. Very similar ratio but with much bigger absolute values happened with angle acceleration α as shown on Figure 11. Angle acceleration α, for out-of-step conditions maxed at α = 900,000 degree/s2 and the neighboring line had value of only α = 9250 degree/s2. Values on Figure 11 show only a limited scope of values to present in more details most important changes of the characteristics.
After series of conducted simulations of angle instability events, it became evident that focus must be on relationship between values of angle spend ω and angle acceleration α. The reaction time for any action during angle instability is extremely short and is in range of hundreds of milliseconds, which means any control action must be generated and propagated to circuit breaker in that time frame. Advanced protection algorithms such as mentioned in [35], and including in this paper proposed one, are based on the interdependent behavior of the three angle values, angle difference Δφ, angle speed ω and angle acceleration α.
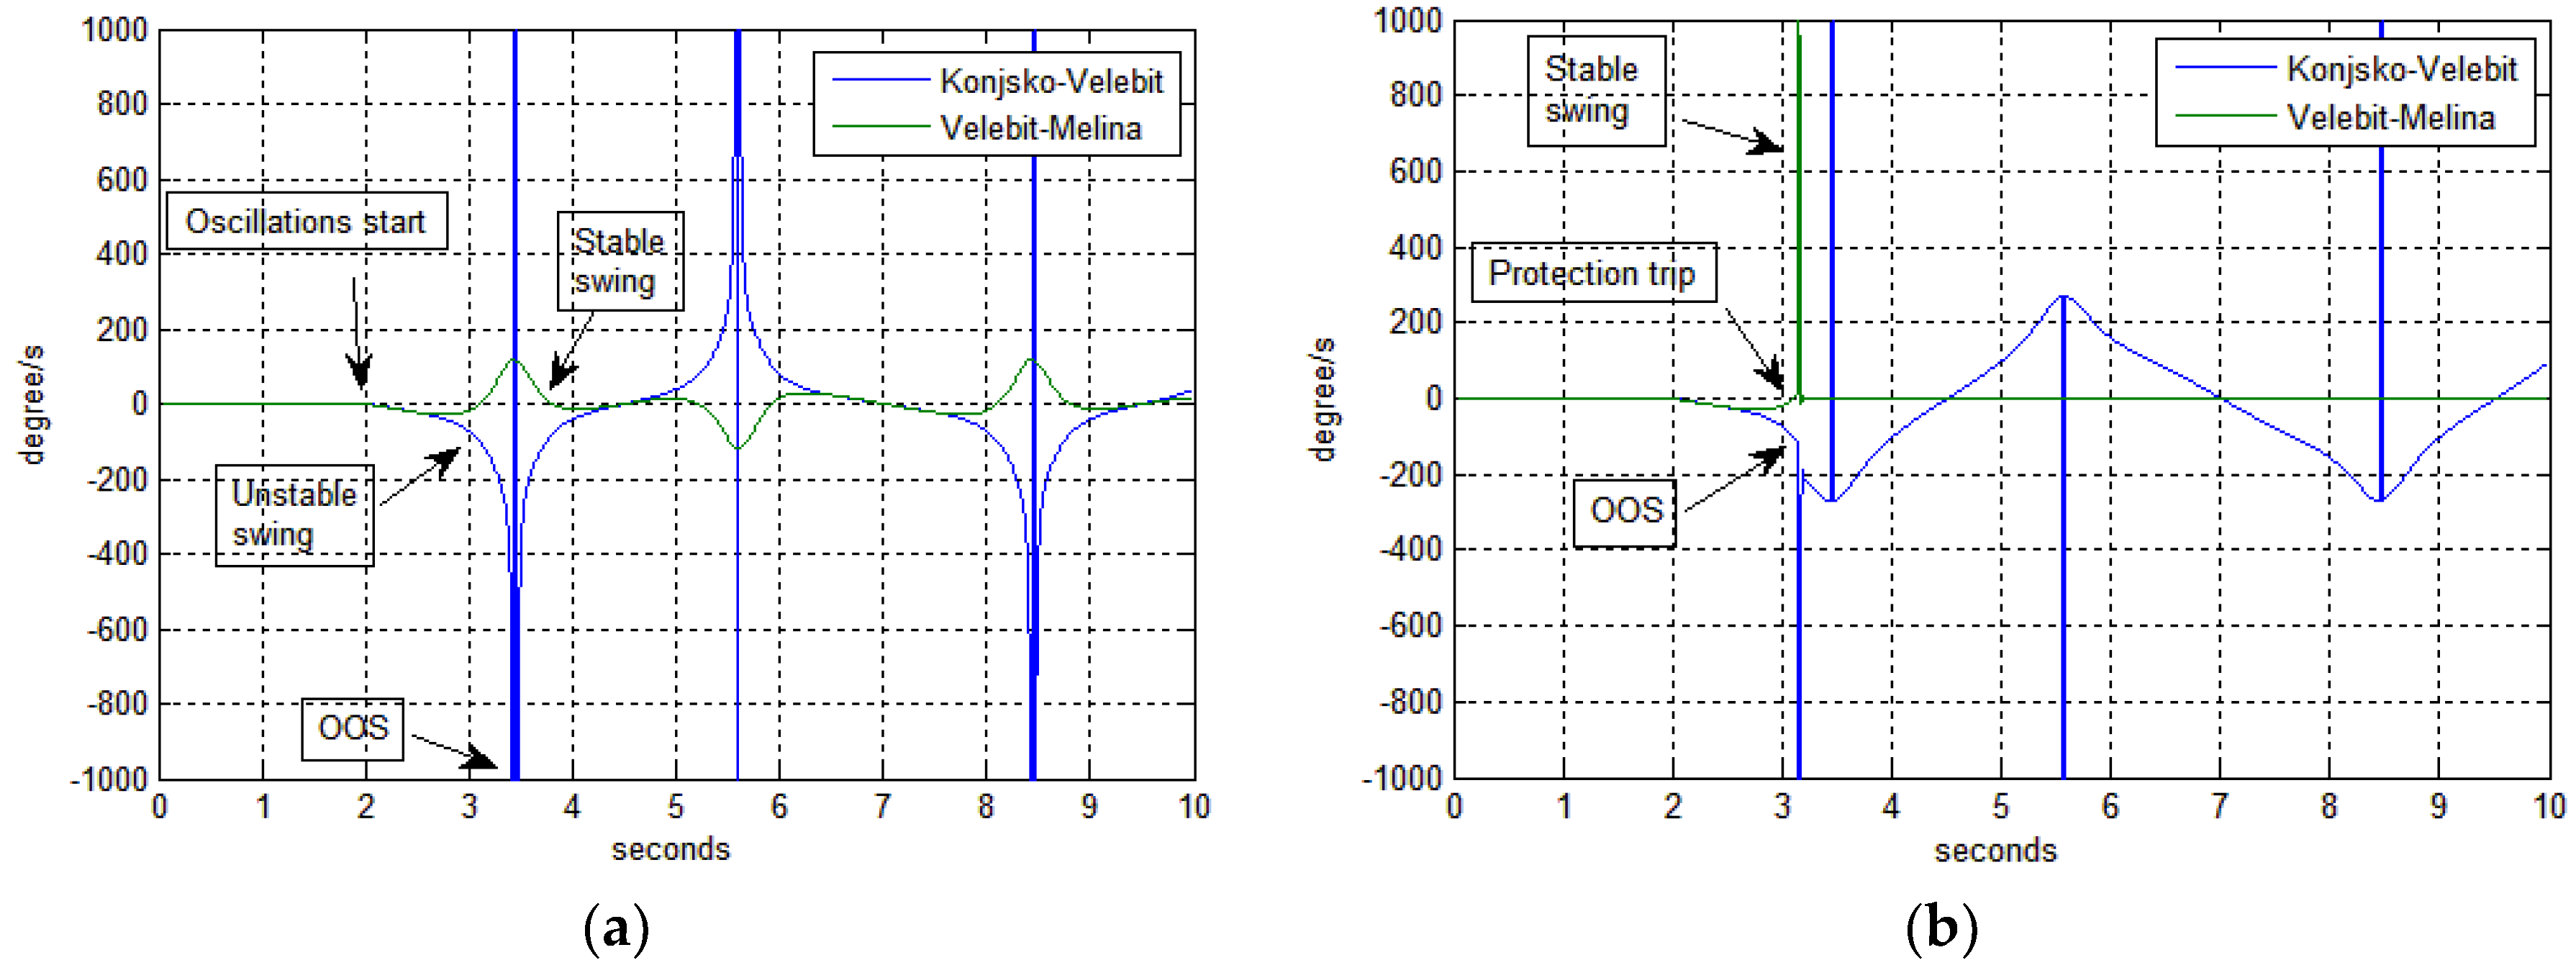
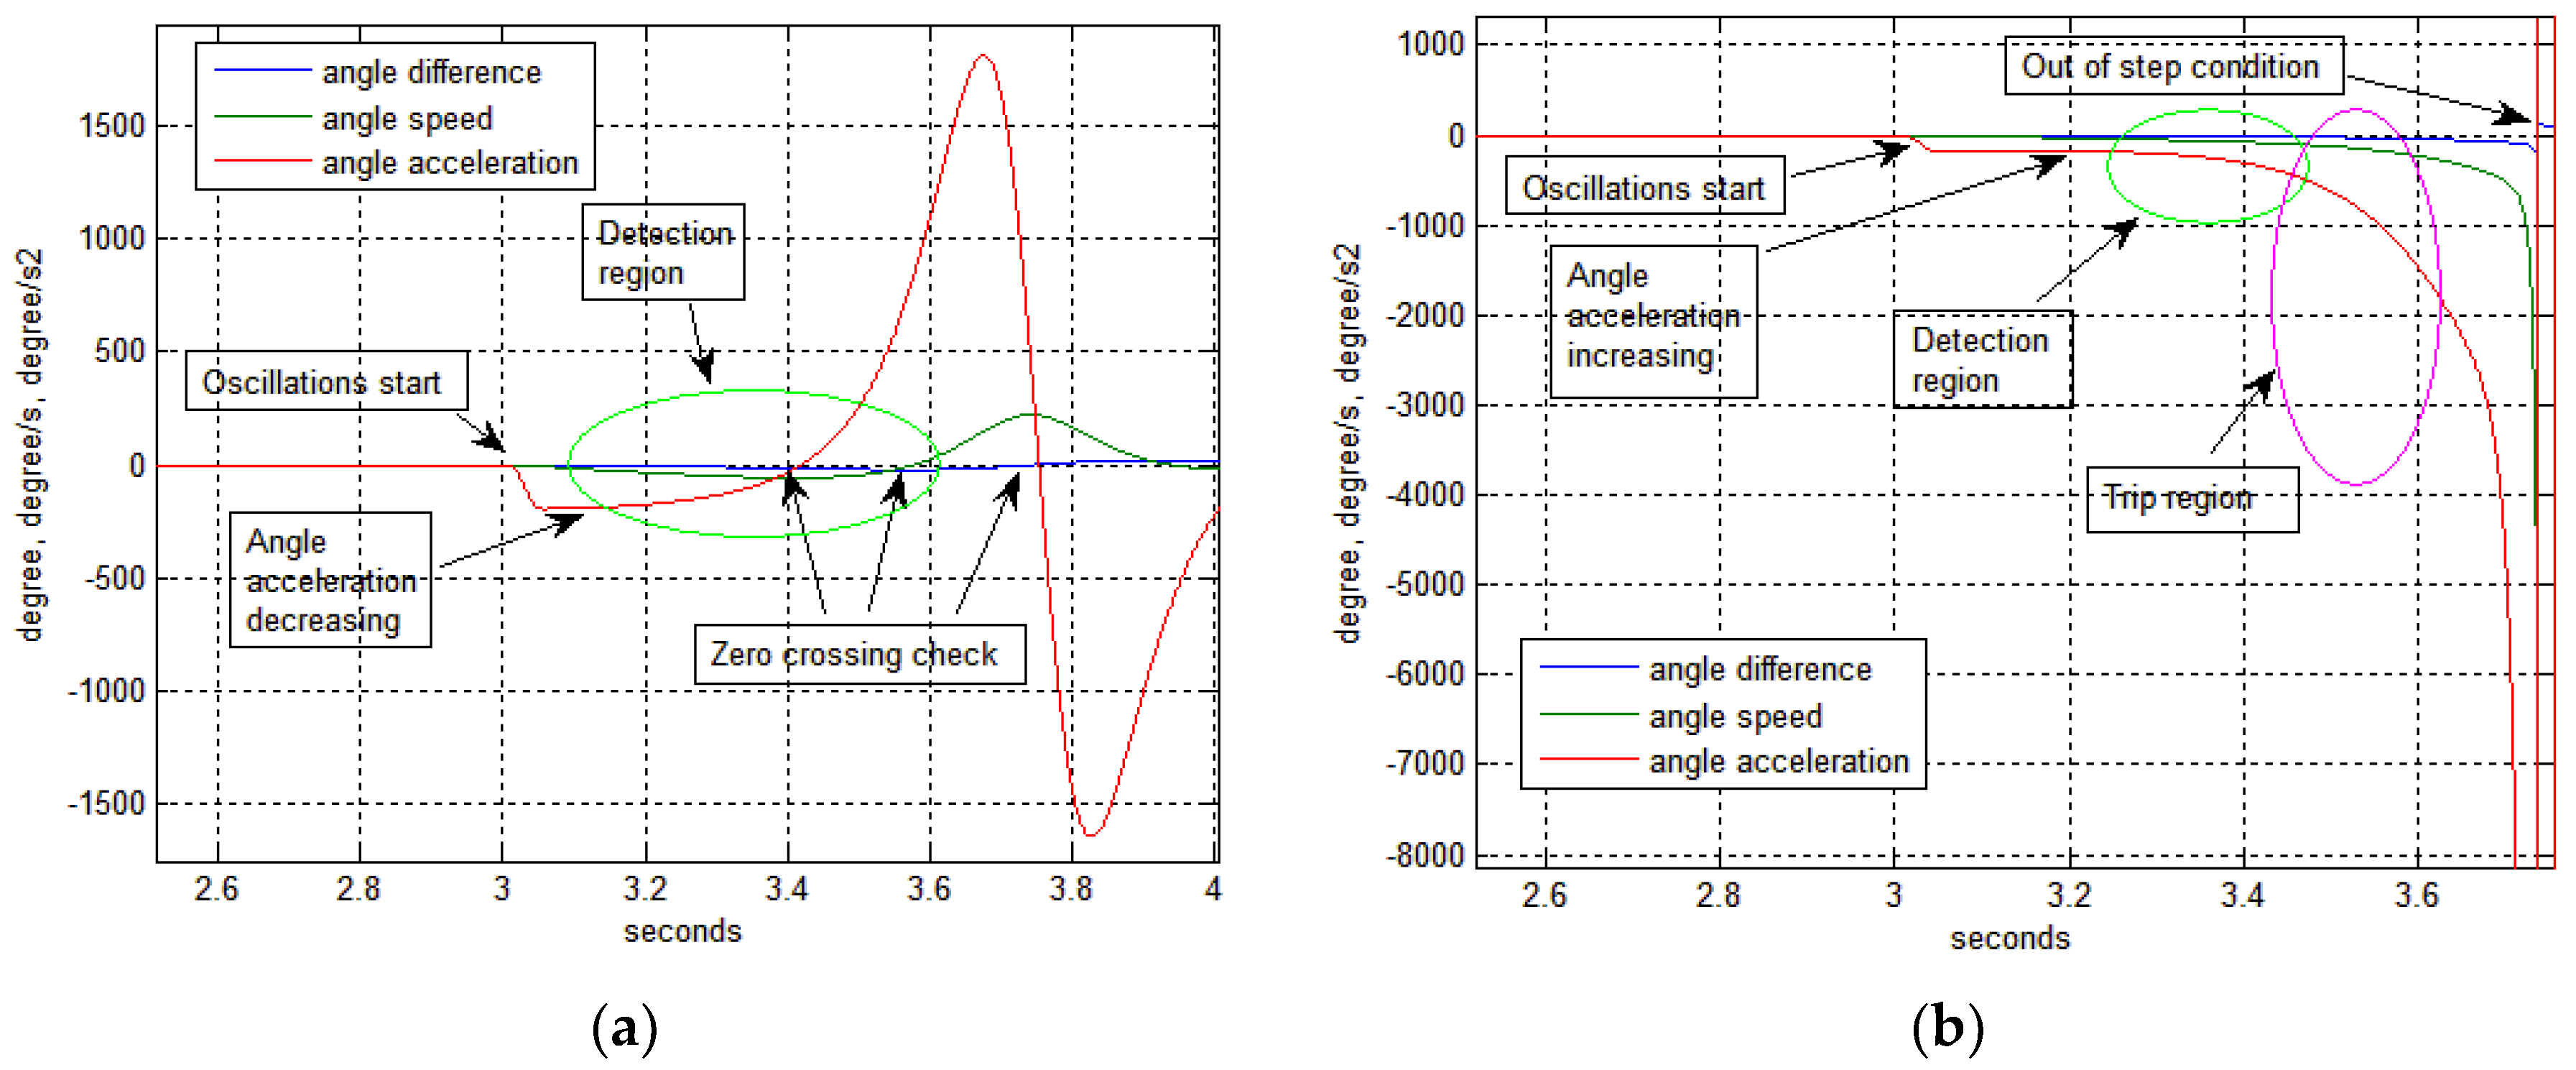
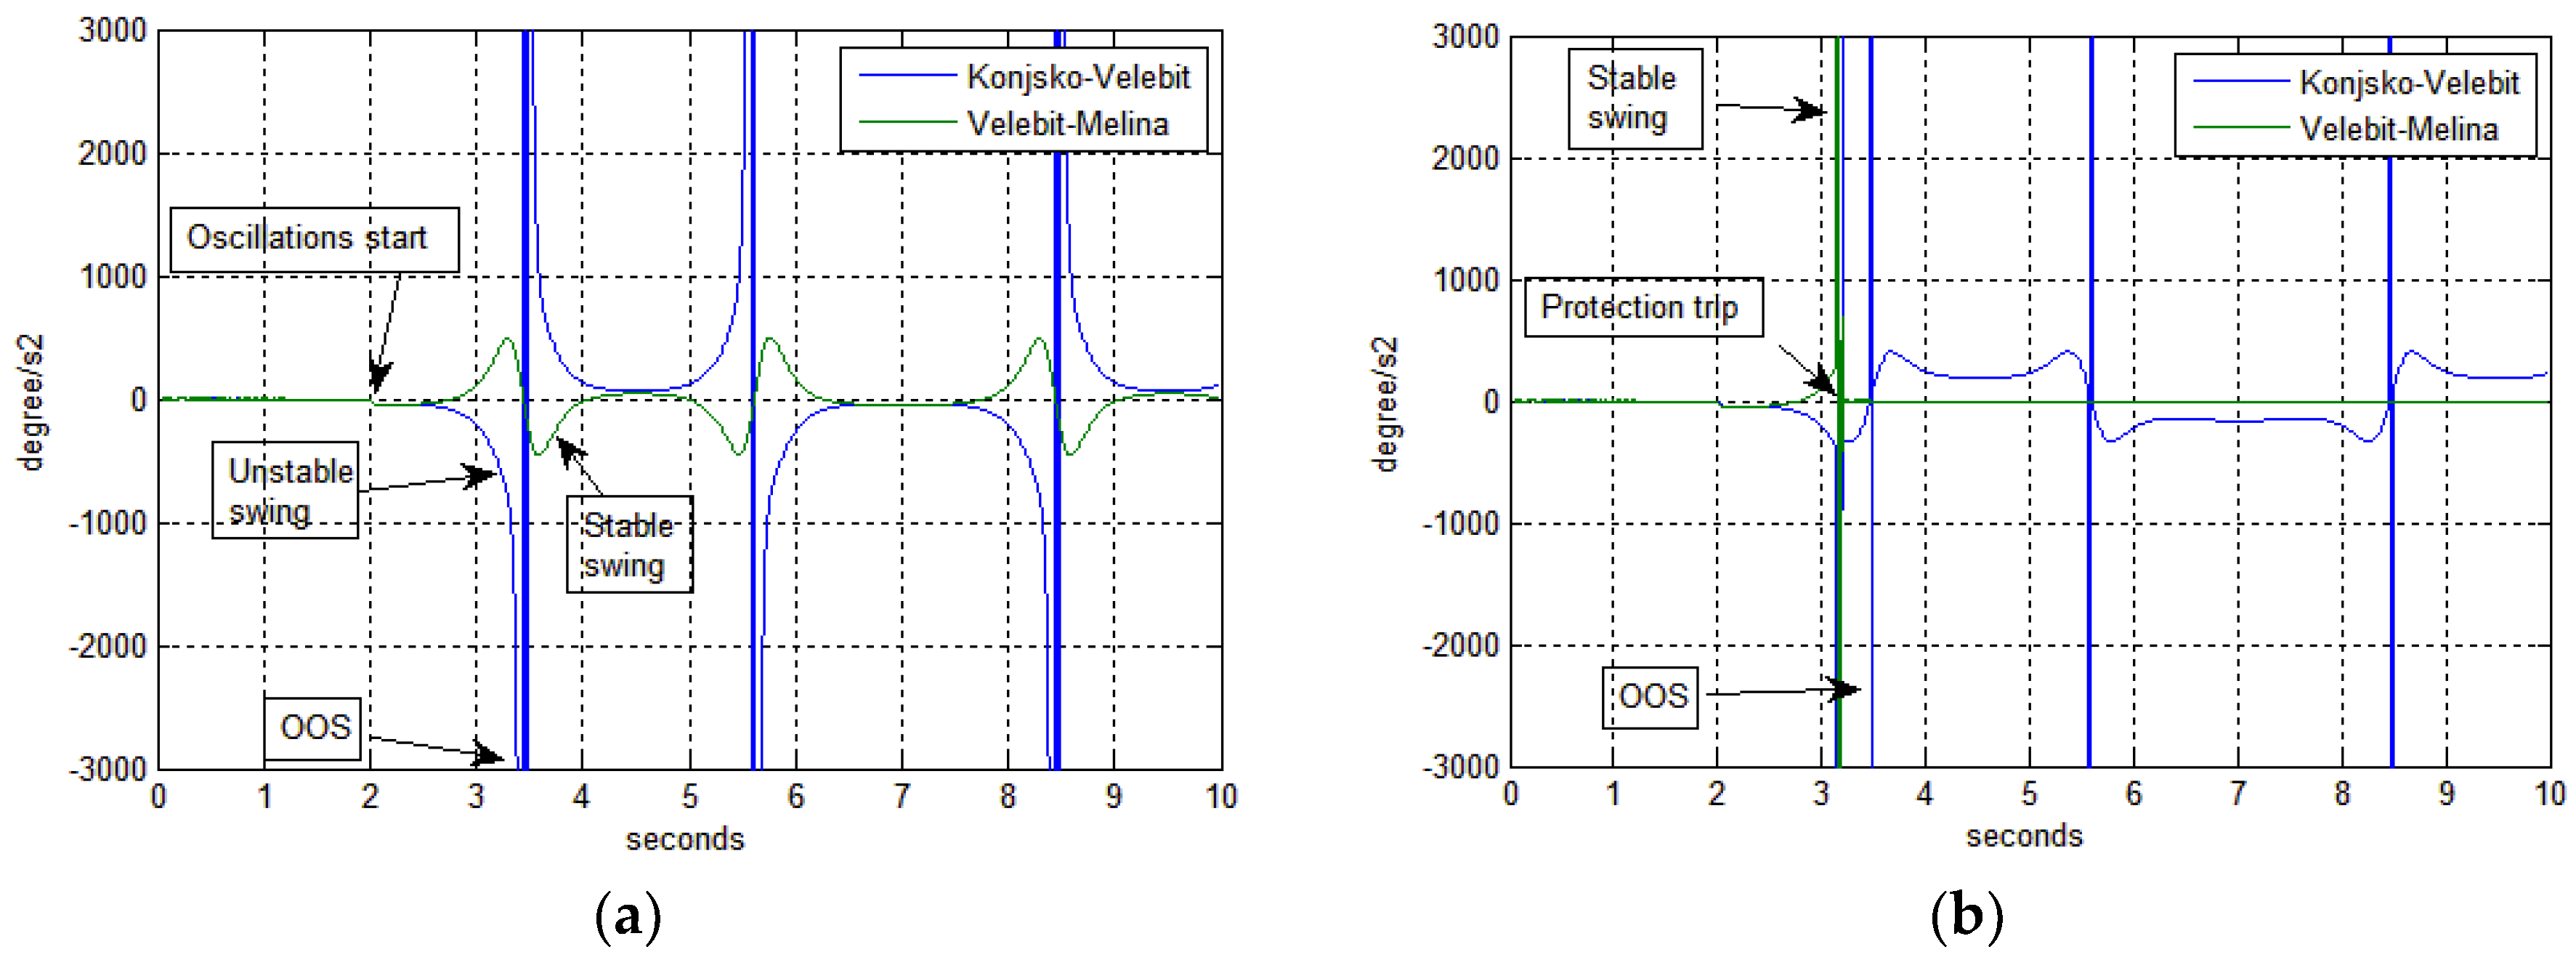
The described algorithm in this paper uses characteristic behavior that was observed through series of simulations (Figure 12) for power swing and out-of-step condition detection and early warning issue.
Angle acceleration α, has zero crossing at t < 3.4 s, which is before angle difference Δφ (Figure 12a). Additionally, angle speed ω, has zero crossing at t ~ 3.6 s which before Δφ crosses the x-axis (zero-crossing at Figure 12a). This is a characteristic footprint for power swing. Line affected with out-of-step condition has very different pattern (Figure 12b) as compared to power swing pattern (Figure 12a) with different patterns for all three angle values, Δφ, ω, and α. None of these values have zero crossings before reaching the 180 degrees point and all of the values continue increasing until slip finally occurs (after 3.7 s at Figure 12b).
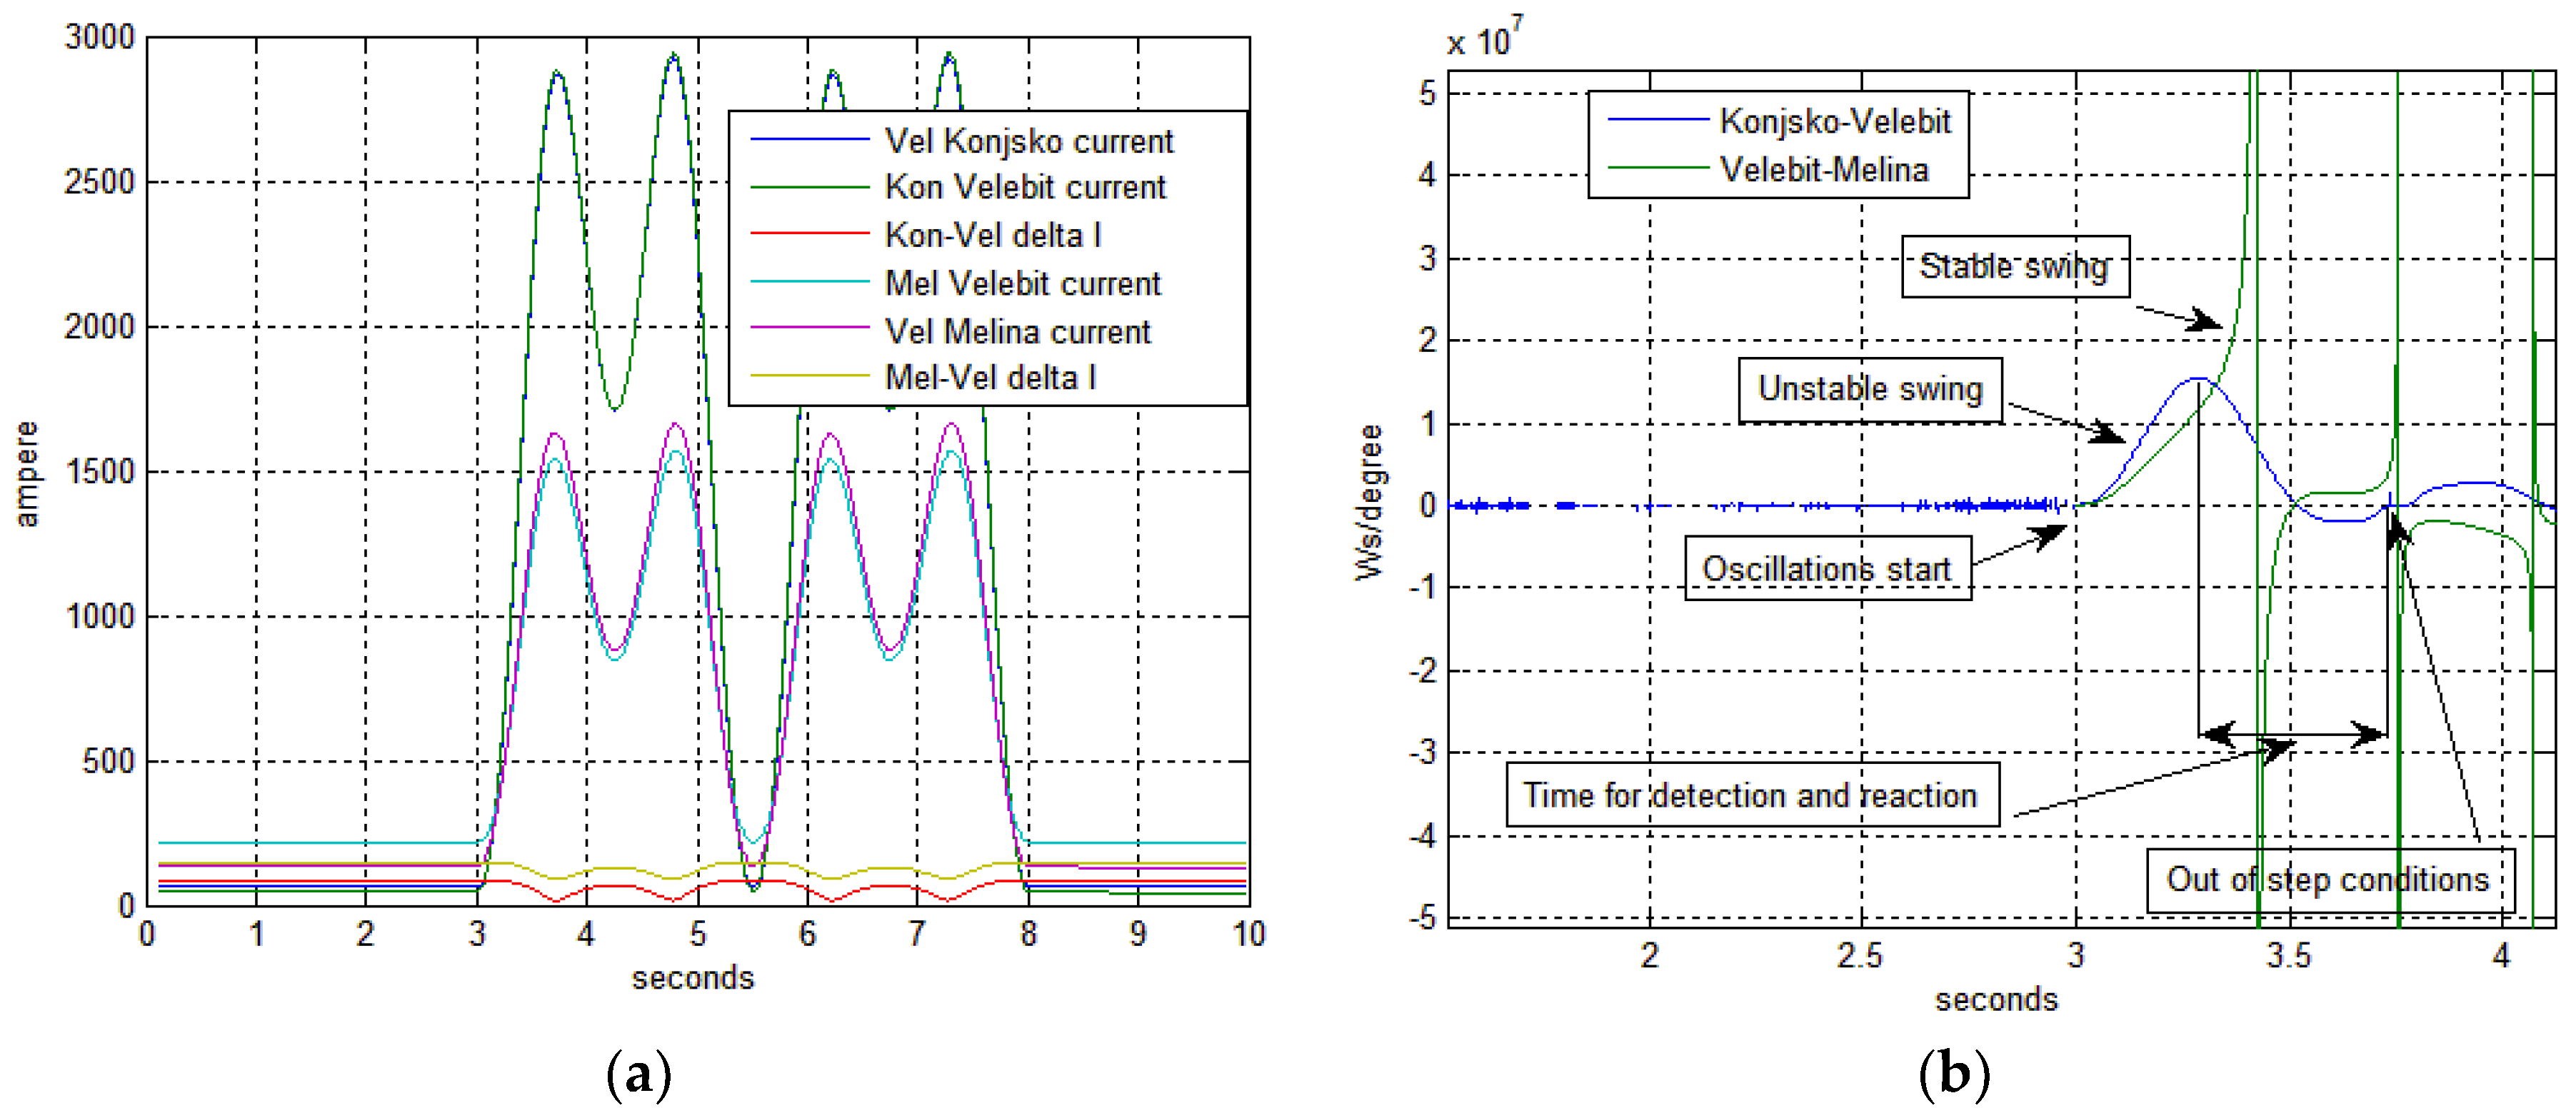
Furthermore, remedial criteria ΔI, clearly shows only oscillations developed on both lines Figure 13a (Velebit-Melina affected by stable swing and Konjsko-Velebit affected by unstable swing (out-of-step)). Values of ΔI have small values that are caused by line charging current. Other remedial criteria (equivalent transmission system inertia H l i n e _ e q ) for both lines also has a characteristic pattern shown on Figure 13b. Line affected by unstable swing has significantly lower equivalent inertia ( H l i n e _ e q ) with trajectory, which decreases few hundred ms before out-of-step is developed (Figure 13b—blue line). Line with stable swing has higher values of equivalent inertia and zero crossings exists (Figure 13b—green line).

6. Simulations Scenarios and Results for Transmission Network Model with Protection Operation

6.1. Simulations Scenarios for Out-of-Step Condition Detection and Early Warning

Numerous simulation scenarios were conducted using described Matlab model. Table 3 presents characteristic situations for the initiation of a disturbance in the transmission network that can lead to out-of-step conditions.
Table 3 contains basic data for 4 scenarios of out-of-step conditions occurrence. Third column presents values of frequency oscillations. Source of oscillation is in network equivalent connected to observed busses. Modelled transmission network has no significant power generator units connected to high voltage network. Consequently, all serious disturbance stems from neighboring transmission networks [35]. That is the reason why the source of oscillations is set to be in network equivalents. The disturbance frequencies (f) are in range from 0.1 Hz to 1 Hz, with the majority of them around 0.2 Hz. For higher oscillation frequencies the out-of-step condition is not possible to be induced, but all scenarios result with stable swing. In the Table 3, values that induce the angle imbalance Δf is amplitude of the modulation and f is frequency of the modulation (disturbance).
In the last column a main features of the surrounding network is given. In weak parts of the network, it is much easier to induce the out-of-step condition, then in meshed and well interconnected network. On buses that connect four or five 400 kV lines, the out-of-step condition is not easily reached and special conditions need to be aligned in order for out-of-step condition to occur. In some circumstances, it is necessary to induce oscillations on all external lines; otherwise, there no out-of-step condition occurs, but rather only active power oscillations. To achieve more severe simulation scenario conditions disconnecting lines in order to make the network weaker can be done (as was the case in scenario 4).

6.2. Results of the Protection Actions

This chapter presents the simulation results of scenarios without protection actions and with protection actions issued by the developed algorithm to the circuit breakers in simulation model. Simulations starts at t = 2 s after all of the elements have reached stationary states from their initial one and lasts 8 s till t = 10 s. Protection action command (Figure 13b—red line) is presented only on the first graph (Figure 14) because of the appropriate scale of the y axis but is present on all following figure (Figure 15, Figure 16 and Figure 17).
The most interesting part of network is buses 4 (Melina), 5 (Velebit), and 6 (Konjsko). Bus number 6 is the source of induced large active power oscillation, which trips out-of-step protection of the simulated WAMPAC system. On other lines in the network, will be recorded power swing conditions.
Figure 14 presents conditions on transmission lines Konjsko-Velebit (Figure 14—blue line) and Velebit-Melina (Figure 14—green line) for the changes of the angle φ.
Figure 15a presents the values for angle speed ω on two observed transmission lines with protection operations being depicted on Figure 15b.
As was mentioned, order of magnitude of angle speed is too great to be presented on the same y-axis scale with protection trip signal (change from 1 to 0), so the protection trip is omitted to maintain the visibility of the trends observed.
In similar way Figure 16 presents an angle acceleration α values for the same disturbance. Angle acceleration α oscillations on two observed transmission lines have similar trends as other angle values (Δφ and ω) but the angle acceleration is used for further calculation of equivalent angle momentum.
Figure 17a presents results from the remedial line differential criteria perspective for the same disturbance. Current values during out-of-step reach values above normal operating range and above the thermal range of transmission line conductors. Figure 17b again presents the effectiveness of the developed out-of-step protection algorithm that issues protective operations. Opening the circuit breaker on line with out-of-step condition interrupts the further development of current flows.
Line differential criteria results presented on Figure 17 indicates that there are no short circuit current presents, but rather high overcurrent that is caused by the out-of-step condition occurrence.

7. Conclusions

Developing protection algorithm for fast and efficient detection and reaction to angle instability is important for transmission network operations. It acts as an important segment of WAMPAC applications in control centers. This paper presented simulation results that provide guidelines for the design of such protection algorithm, and finally gave an algorithm design suggestion. Algorithm was described in an analytical way with flow diagram devised based on simulation results and corresponding simulation conclusions.
Proposed protection algorithm based on PMU data has advantages when compared to the traditional relay protection logic. This protection method is not dependable on network configurations and enables good observability and detection of different disturbances including power swing and out-of-step conditions. Developed algorithm is robust and simple to implement (short processing and delay times) on transmission line equipped with PMU devices. It operates on transmission line independently from other elements (any number of generators, lines, transformers, or FACTS devices) that can also be connected to the observed busbar.
The proposed algorithm will be unifying transmission phasor measurement in WAMPAC system, which will allow the creations of advanced protection functions in control centers. Future work will be focused on the implementation of developed algorithm in transmission system control center and extensive testing of the algorithm in real operation conditions.

Acknowledgments

This work has been supported by Croatian Science Foundation, Croatian Transmission System Operator (HOPS) and HEP Generation under the project WINDLIPS—WIND Energy Integration in Low Inertia Power System (grant no. PAR-02-2017-03) and project FENISG-Flexible Energy Nodes in Low Carbon Smart Grid funded by Croatian Science Foundation under project grant No. 7766.

Author Contributions

Igor Ivanković and Igor Kuzle conceived and designed the experiments; Igor Ivanković performed the experiments; Igor Ivanković and Igor Kuzle analyzed the data; Ninoslav Holjevac contributed to analysis tools design; Igor Ivanković, Igor Kuzle and Ninoslav Holjevac wrote the paper.

Conflicts of Interest

The authors declare no conflict of interest.

References and Notes

  1. Jin, T.; Chu, F.; Ling, C.; Nzongo, D.L.M. A Robust WLS Power System State Estimation Method Integrating a Wide-Area Measurement System and SCADA Technology. Energies 2015, 8, 2769–2787. [Google Scholar] [CrossRef]
  2. Terzija, V.; Valverde, G.; Cai, D.; Regulski, P.; Madani, V.; Fitch, J.; Skok, S.; Begovic, M.M.; Phadke, A. Wide area monitoring protection control of future electric power networks. IEEE Proc. 2011, 99, 80–93. [Google Scholar] [CrossRef]
  3. Hong, X. A Total Solution for Power Network Monitoring and Controlling—WAMAP. In Proceedings of the 2007 IEEE Power Engineering Society General Meeting, Tampa, FL, USA, 24–28 June 2007; pp. 1–6. [Google Scholar]
  4. Zhang, S.; Zhang, Y. A Novel Out-of-step Splitting Protection Based on the Wide Area Information. IEEE Trans. Smart Grid 2017, 8, 41–51. [Google Scholar] [CrossRef]
  5. Alinejad, B.; Karegar, H.K. Out-of-Step Protection Based on Equal Area Criterion. IEEE Trans. Power Syst. 2017, 32, 968–977. [Google Scholar] [CrossRef]
  6. Velez, F.G.; Centano, V.A.; Phadke, A.G. Multiple swing transient stabillty assessment with phasor measurements. In Proceedings of the 2017 IEEE Manchester PowerTech, Manchester, UK, 18–22 June 2017. [Google Scholar]
  7. Ivankovic, I.; Kuzle, I.; Holjevac, N. Multifunctional WAMPAC system concept for out-of-step protection based on synchrophasor measurements. Int. J. Electr. Power Energy Syst. 2017, 87, 77–88. [Google Scholar] [CrossRef]
  8. Dubey, R.; Samantaray, S.R.; Panigrahi, B.K. An spatiotemporal information system based wide-area protection fault identification scheme. Int. J. Electr. Power Energy Syst. 2017, 89, 136–145. [Google Scholar] [CrossRef]
  9. Gurusinghe, D.R.; Rajapakse, A.D. Post-Disturbance Transient Stability Status Prediction Using Synchrophasor Measurements. IEEE Trans. Power Syst. 2016, 31, 3656–3664. [Google Scholar] [CrossRef]
  10. Wang, Y.; Tang, Y.; Ding, L.; Zhang, C.; Chen, Z.; Huang, Y. A Wide-area Coordinated Out-of-step Control System. In Proceedings of the International Conference on Power System Technology (POWERCON 2014), Chengdu, China, 20–22 October 2014; pp. 691–695. [Google Scholar]
  11. Begovic, M.; Novosel, D.; Karlsson, D.; Henville, C.; Michel, G. Wide-Area Protection and Emergency Control. Proc. IEEE 2005, 93, 876–891. [Google Scholar] [CrossRef]
  12. Ivanković, I.; Kuzle, I.; Holjevac, N. Wide Area Information-Based Transmission System Centralized Out-of-Step Protection Scheme. Energies 2017, 10, 633. [Google Scholar] [CrossRef]
  13. Phadke, A.G.; Thorp, J.S. Synchronized Phasor Measurement and Their Applications; Springer: Cham, Switzerland, 2008. [Google Scholar]
  14. Li, F.; Qiao, W.; Sun, H.; Wan, H.; Wang, J.; Xia, Y.; Xu, Z.; Zhang, P. Smart Transmission Grid: Vision and Framework. IEEE Trans. Smart Grid 2010, 1, 168–177. [Google Scholar] [CrossRef]
  15. Feng, K.; Zhang, Y.; Liu, Z.; Li, T.; Ma, H. A new scheme for out-of-step splitting considering drift oscillation center. Power Syst. Technol. 2015, 39, 1082–1087. [Google Scholar]
  16. Salimian, M.R.; Aghamohammadi, M.R. Intelligent Out of Step Predictor for Inter Area Oscillations Using Speed-Acceleration Criterion as a Time Matching for Controlled Islanding. IEEE Trans. Smart Grid 2016. [Google Scholar] [CrossRef]
  17. Frimpong, E.A.; Asumandu, J.; Okyere, P.Y. Neural Network and Speed Deviation Based Generator Out-Of-Step Prediction Scheme. J. Electr. Eng. 2015, 15, 1–8. [Google Scholar]
  18. ANSI/IEEE Standard Device Numbers according to IEEE Standard C37.2-2008.
  19. Sorrentino, E.; Navas, G.; Orea, E. Effect of an additional large disturbance during power swings on the impedance seen by the out-of-step blocking function. Int. J. Electr. Power Energy Syst. 2018, 99, 79–84. [Google Scholar] [CrossRef]
  20. Kasztenny, B.; Fischer, N.; Fodero, K.; Zvarych, A. Communications and Data Synchronization for Line Current Differential Schemes; TP 6492-01; Schweitzer Engineering Laboratories, Inc.: Pullman, WA, USA, 2011. [Google Scholar]
  21. International Council on Large Electric Systems (CIGRE). Protection Using Telecommunications; JWG 34/35.11; CIGRE: Paris, France, 2001. [Google Scholar]
  22. Miller, H.; Burger, J.; Fischer, N.; Kasztenny, B. Modern Line Current Differential Protection Solutions. In Proceedings of the 36th Annual Western Protective Relay Conference, Spokane, WA, USA, 19–22 October 2009. [Google Scholar]
  23. IEEE Std 1344-1995, IEEE Standard for Synchrophasors for Power Systems.
  24. IEEE Std C37.118.1-2011, IEEE Standard for Synchrophasor Measurements for Power Systems.
  25. IEEE Std C37.118.2-2011, IEEE Standard for Synchrophasor Data Transfer for Power Systems.
  26. Ivankovic, I.; Kuzle, I.; Sirovina, R. Multifunctional System Protection for Transmission Lines Based on Phasor Data. In Proceedings of the IEEE 16th International Conference on Environment and Electrical Engineering (EEEIC), Florence, Italy, 7–10 June 2016; pp. 1–6. [Google Scholar]
  27. Peettikkattil, J. Data for Reference Model IEEE 9 Bus. Available online: https://www.mathworks.com/matlabcentral/fileexchange/45936-ieee-9-bus (accessed on 5 February 2018).
  28. Ivankovic, I.; Rubesa, R.; Kuzle, I. Modeling 400 kV transmission grid with system protection and disturbance analysis. In Proceedings of the 2016 IEEE International Energy Conference (ENERGYCON), Leuven, Belgium, 4–8 April 2016; pp. 1–7. [Google Scholar]
  29. Rajapakse, A.D.; Gomez, F.; Nanayakkara, K.; Crossley, P.A.; Terzija, V.V. Rotor Angle Instability Prediction Using Post-Disturbance Voltage Trajectories. IEEE Trans. Power Syst. 2010, 25, 947–956. [Google Scholar] [CrossRef]
  30. Machowski, J.; Bialek, J.W.; Bumby, J.R. Power System Dynamics: Stability and Control, 2nd ed.; John Wiley & Sons Ltd.: Hoboken, NJ, USA, 2008. [Google Scholar]
  31. MathWorks®, MATLAB 2016 software. Available online: https://uk.mathworks.com/products/matlab.html (accessed on 12 February 2018).
  32. Ivankovic, I.; Kuzle, I.; Holjevac, N. Algorithm for Out-of-Step Condition Detection and Early Warning Using Phasor Measurement Unit Data. In Proceedings of the 2017 IEEE 16th International Conference on Environment and Electrical Engineering (EEEIC), Milan, Italy, 6–9 June 2017; pp. 1–6. [Google Scholar]
  33. Taylor, C.W.; Erickson, D.C.; Martin, K.E.; Wilson, R.E.; Venkatasubramanian, V. WACS-Wide-Area Stability and Voltage Control System: R&D and Online Demonstration. Proc. IEEE 2005, 93, 892–906. [Google Scholar]
  34. Yan, J.; Liu, C.-C.; Vaidya, U. PMU-Based Monitoring of Rotor Angle Dynamics. IEEE Trans. Power Syst. 2011, 26, 2125–2133. [Google Scholar] [CrossRef]
  35. Union of the Co-ordiantion of Transmission of Electricity (UCTE). Final Report System Disturbance on 4 November 2006; UCTE: Brussels, Belgium, 2007; pp. 1–85. [Google Scholar]
Figure 1. Principal block schemes of a wide area monitoring, protection, and control (WAMPAC) systems based on traditional transmission line relay measurement and protection system.
Energies 11 00681 g001
Figure 2. Flow chart design for issuing tripping command for out-of-step protection in WAMPAC system to circuit breaker in transmission network substations.
Energies 11 00681 g002
Figure 3. Scheme for CRO6BUS model in Matlab simulation environment.
Energies 11 00681 g003
Figure 4. Details for starting point of active power oscillations on 400 kV transmission line during out-of-step condition during simulation scenario: (a) Voltage oscillations; and, (b) Current oscillations.
Energies 11 00681 g004
Figure 5. Active and reactive power oscillations on 400 kV transmission line during out-of-step condition in simulations that last 10 s without protection action.
Energies 11 00681 g005
Figure 6. Trajectory path for circuit breaker switching operations or short circuit faults and some trajectory path for possible active power oscillations on a single transmission line.
Energies 11 00681 g006
Figure 7. Values for line currents and line differential currents on two adjacent transmission lines: (a) Short circuit fault on Tumbri-Melina line with currents from both side of line with differential current ΔI; (b) Tumbri-Zerjavinec line with fault current and differential current ΔI.
Energies 11 00681 g007
Figure 8. Simplified two machine equivalent on a transmission network line equipped with PMU devices which send phasor data packages to WAMPAC system.
Energies 11 00681 g008
Figure 9. Flow chart of the algorithm for active power oscillations and out-of-step condition detection and early warning issuing.
Energies 11 00681 g009
Figure 10. Voltage angle difference Δφ, for two 400 kV transmission lines during out-of-step condition occurrence in the network.
Energies 11 00681 g010
Figure 11. Out of step condition and power swing condition on 400 kV lines: (a) Angle speed ω, for two 400 kV transmission lines during out-of-step conditions occurrence; and, (b) Angle acceleration α, for two 400 kV transmission lines during out of step condition occurrence.
Energies 11 00681 g011
Figure 12. Details for power swing condition and out-of-step conditions on 400 kV line: (a) Details of the voltage angle difference Δφ, angle speed ω and angle acceleration α, on 400 kV transmission line with stable swing condition; (b) Details of the voltage angle difference Δφ, angle speed ω and angle acceleration α, on 400 kV transmission line with out-of-step conditions.
Energies 11 00681 g012
Figure 13. Remedial protection criteria: (a) Konjsko-Velebit and Melina-Velebit currents from both line ends with differential current protection (ΔI). Out-of-step has developed on Konjsko-Velebit line and only stable power swing was present on Melina-Velebit line; and, (b) Konjsko-Velebit and Melina-Velebit lines with equivalent transmission system inertia measurements. Out-of-step developed on Konjsko-Melina line and only stable swing was present on Melina-Velebit line.
Energies 11 00681 g013
Figure 14. Active power oscillations on two 400 kV lines with voltage angle difference Δφ and protection operations: (a) On line Konjsko-Velebit there is an out-of-step (OOS) conditions and on line Velebit-Melina there is a power swing condition; and, (b) Detail presenting protection activations when protection setting is reached and tripped the Konjsko-Velebit line while Velebit-Melina remained in operation.
Energies 11 00681 g014
Figure 15. Active power oscillations on two 400 kV lines with angle speed ω: (a) On line Konjsko-Velebit there is an out-of-step (OOS) condition and on line Velebit-Melina there is a power swing condition; and, (b) Detail presenting angle speed ω protection operation and tripping of the Konjsko-Velebit line while linr Velebit-Melina remained in operation.
Energies 11 00681 g015
Figure 16. Active power oscillations on two 400 kV lines with angle acceleration α: (a) On line Konjsko-Velebit there is an out-of-step (OOS) condition and on line Velebit-Melina there is a power swing condition; and, (b) Detail presenting angle speed ω protection operation and tripping of the the Konjsko-Velebit line while Velebit-Melina remained in operation.
Energies 11 00681 g016
Figure 17. Remedial line protection criteria: (a) Konjsko-Velebit and Melina-Velebit currents from both line ends with differential current protection (ΔI). Out-of-step has developed on Konjsko-Velebit line and only stable power swing was present on Melina-Velebit line; (b) Konjsko-Velebit and Melina-Velebit transmission line current with protection operations.
Energies 11 00681 g017
Table 1. Phasor measurement units (PMUs) measurement data packet transfer delay (for a path of max 300 km).
No.High Voltage SubstationAverage Delay Time
1.Žerjavinec2 ms
2.Melina4 ms
3.Ernestinovo5 ms
4.Mraclin2 ms
5.Tumbri2 ms
6.Brinje3 ms
7.Konjsko6 ms
8.Velebit5 ms
Table 2. Time delays recorded by phasor data concentrators (PDC) application.
PMU No.SubstationTransmission LinePMU TypeLink TypetDEL Average (ms)
1.Žerjavinec 400/220/110 kV- line TumbriAType 16.0
2.- line ErnestinovoAType 18.5
3.Ernestinovo 400/110 kV- line ŽerjavinecAType 19.6
4.Konjsko 400/220/110 kV- line BrinjeAType 110.6
5.- line VelebitAType 110.6
6.Melina 400/220/110 kV- line VelebitAType 110.0
7.- line TumbriAType 19.9
8.- line DivačaBType 121.6
9.Velebit 400/110 kV- line MelinaAType 17.8
10.- line KonjskoAType 17.7
11.Tumbri 400/110 kV- line MelinaAType 17.0
12.- line Krško 1BType 222.3
13.Brinje 220/35 kV- line KonjskoAType 19.4
14.- line MraclinAType 19.3
15.Mraclin 220/110 kV- line BrinjeAType 15.3
16.Pehlin 220/110 kV- line DivačaBType 220.8
17.Peruća 110 kV- Generator 2BType 123.6
18.- Generator 1BType 124.1
20.Control Centre PMU 1- (test unit)BType 319.3
21.Control Centre PMU 2- (test unit)BType 319.3
Table 3. Scenarios for out-of-step condition simulations.
Simulations ScenarioOrigin of the Disturbance (Busbar Number)Disturbance SeverityCharacteristic of the Network Surrounding Observed Busbar
1.6 (Konjsko)Δf = 0.5 HzWeak and radial type network
f = 0.2 HzOscillations on one transmission line
2.4 (Melina)Δf = 0.5 HzWeak and radial type network
f = 0.2 HzOscillations on one transmission line
3.1 (Ernestinovo)Δf = 0.6 HzWell connected network
f = 0.2 HzOscillations on four transmission lines
4.2 (Zerjavinec)Δf = 0.6 HzWell connected network
Oscillations on two transmission lines
f = 0.2 HzOne transmission line disconnected

