Article

Research on Optimal Wind Power Penetration Ratio and the Effects of a Wind-Thermal-Bundled System under the Constraint of Rotor Angle Transient Stability

1
Anhui Provincial Laboratory of New Energy Utilization and Energy Conservation, Hefei University of Technology, Hefei 230009, China
2
State Grid Anhui Zhongxing Electric Power Design Institute Co., Ltd., Hefei 230022, China
*
Author to whom correspondence should be addressed.
Energies 2018, 11(3), 666; https://doi.org/10.3390/en11030666
Submission received: 12 February 2018 / Revised: 8 March 2018 / Accepted: 11 March 2018 / Published: 15 March 2018
(This article belongs to the Section F: Electrical Engineering)

Abstract

:
Large-scale wind-thermal-bundled power that is transmitted by mixed ultra-high voltage direct current (UHVDC)/ultra-high voltage alternating current (UHVAC) systems has become crucial for large-scale wind farms in China. Equations describing the electromagnetic power characteristics under short circuits for UHVAC lines and UHVDC blocks are derived based on an analysis of the external characteristics of a doubly fed wind farm and UHVDC systems. The effect of wind power penetration ratio on rotor angle transient stability is analysed, and the optimal wind power penetration ratio under the constraint of rotor angle transient stability is determined. The effects of system parameters, such as the UHVDC transmission capacity and the reactance of UHVAC lines on the optimal wind power penetration ratio are discussed. The trend of rotor angle stability varies from a monotonic deterioration to concave, and the optimal wind power penetration ratio increases from 0 to 30% under an UHVDC block when the reactance of UHVAC lines increases from 0.005 to 0.02. The optimal wind power penetration ratio under a short circuit increases from 40% to 60% when the reactance of UHVAC lines decreases from 0.02 to 0.006 and decreases from 40% to 30% when the capacity of UHVDC decreases from 3200 MW to 1600 MW. The analysis is verified by simulating an actual system in China’s Northwest Power Grid.

1. Introduction

In recent years, wind power has developed rapidly in China. Several gigawatts of wind farms have been planned and constructed in North China, Northwest China and Northeast China (Three-North area) [1]. The transmission distance to the eastern China load center is greater than 2000 km. To solve the problems that are associated with large-scale wind power consumption in China, it is necessary to transmit the wind power from northern areas to remote eastern areas [2,3].
Wind power that is harvested in the Three-North area is transmitted to local load centers by the existing ultra-high voltage alternating current (UHVAC) systems. However, long-distance transmission using an UHVAC system creates large amounts of power loss and reduces the economy of power delivery. An ultra-high voltage direct current (UHVDC) system offers the advantages of enormous transmission capacity, low transmission loss, and a narrow corridor; it is the clear choice for large-scale wind farms in northern China [4]. However, large-scale wind power cannot be delivered remotely because of its fluctuation; it must be bundled with thermal power units to obtain steadier transmission power and thus meet the requirement of power control. Therefore, wind-thermal-bundled power transmitted by an UHVDC system mixed with existing UHVAC systems has become an effective scheme for large-scale wind farms in China. At present, the rated capacity of the ±800 kV UHVDC from Hami to Zhengzhou in the Hami wind-thermal-bundled system is 8000 MW, which can effectively relieve the power supply pressure of the Central China Power Grid and enhance the utilization of wind power [5,6].
In recent years, the doubly fed induction generator (DFIG) has achieved a significant position in wind turbine market because of its various advantages, including small converter capacities, flexible control, and reactive power compensation capability [7,8]. The transient characteristics of are different from those of traditional thermal power units and will affect the operation of system. In addition, the UHVDC system further affects power system stability. Therefore, in-depth research on the transient stability of wind-thermal-bundled systems is required.
At present, the influence of wind power integration on the stability of power grid has only been partially studied. The reactive power support of a DFIG during faults is considered critical for maintaining the rotor angle stability of thermal power units [9,10]. The conventional synchronous generator replaced with equivalent DFIG has negative impacts on rotor angle stability, but it can be mitigated by the proposed control strategies of the DFIG in [11]. The damping characteristics and voltage control ability decreases appreciably with an increasing wind power penetration ratio, as indicated by simulations performed in [12]. The inertia of a system is reduced with increasing wind power integration, and it worsens the rotor angle stability of system [13]. Based on the extended equal-area criterion (EEAC), the rotor angle stability is considered to depend on the change in electromagnetic power and system inertia when the thermal power is replaced by equivalent capacity of DFIG or fixed speed induction generation (FSIG), as reported in [14].
Wind power integration will affect the system voltage control ability and inertia, thereby affecting the rotor angle stability. Furthermore, the voltage control ability and inertia of system will vary with the integration capacity of wind power. Therefore, wind power penetration ratio will affect the rotor angle stability of the system. The mechanism by which DFIG penetration ratio affects rotor angle stability under a close-distance short-circuit fault and remote-distance short-circuit fault is analysed in [15]. The variation in rotor angle stability with increasing wind power capacity after a three-phase short circuit fault is analysed based on the equal-area criterion (EAC) in [16]. However, the UHVDC system is not considered in the above articles. The influence of wind power penetration ratio on rotor angle transient stability of a wind-thermal-bundled system after a short-circuit fault is analysed in [17]. The function describing the variation of rotor angle acceleration with wind power penetration ratio after a short-circuit fault is deduced in [18], and the conditions under which the function is concave are proposed.
The influence of UHVDC reactive power characteristics after a short-circuit fault on rotor angle stability is not considered in the above mentioned studies, and UHVDC faults are not analysed. The UHVDC block will break the power balance and thus affect the rotor angle stability of the system [19,20]. In addition, the reactive power recovery characteristics of UHVDC systems and wind power during a fault will also affect the rotor angle stability [21]. Therefore, further mechanistic analyses of the influence of wind power penetration ratio on rotor angle transient stability and research on optimal wind power penetration ratio under the constraint of rotor angle transient stability are required; such studies can provide a reference for the planning and operation, and thus be used to improve the rotor angle stability of wind-thermal-bundled systems.
In this paper, the electromagnetic power equations of a typical wind-thermal-bundled system under a UHVDC block and short circuit of UHVAC lines are derived, respectively, based on an analysis of the transient external characteristics of a wind farm and UHVDC system. The influence of wind power penetration ratio on rotor angle stability is analysed, and the optimal wind power penetration ratio corresponding to the minimum value of the rotor angle difference is determined. Furthermore, the effect of system parameters, such as UHVDC transmission capacity and UHVAC line reactance, on the optimal wind power penetration ratio are discussed. The theoretical derivation is verified by a simulation of a typical wind-thermal-bundled system and an actual system in China’s Northwest Power Grid.
This paper is organized as follows: the electromagnetic power characteristics of a wind-thermal-bundled system during normal operation are analysed based on an analysis of the transient characteristics of a wind farm and UHVDC system in Section 2. The effects of wind power penetration ratio on rotor angle stability and parameter variations on the optimal wind power penetration ratio under an UHVDC block are analysed in Section 3, and the case of a short circuit of UHVAC lines is analysed in Section 4. Simulation results are presented and discussed in Section 5. Finally, the paper is concluded in Section 6.

2. Methodology

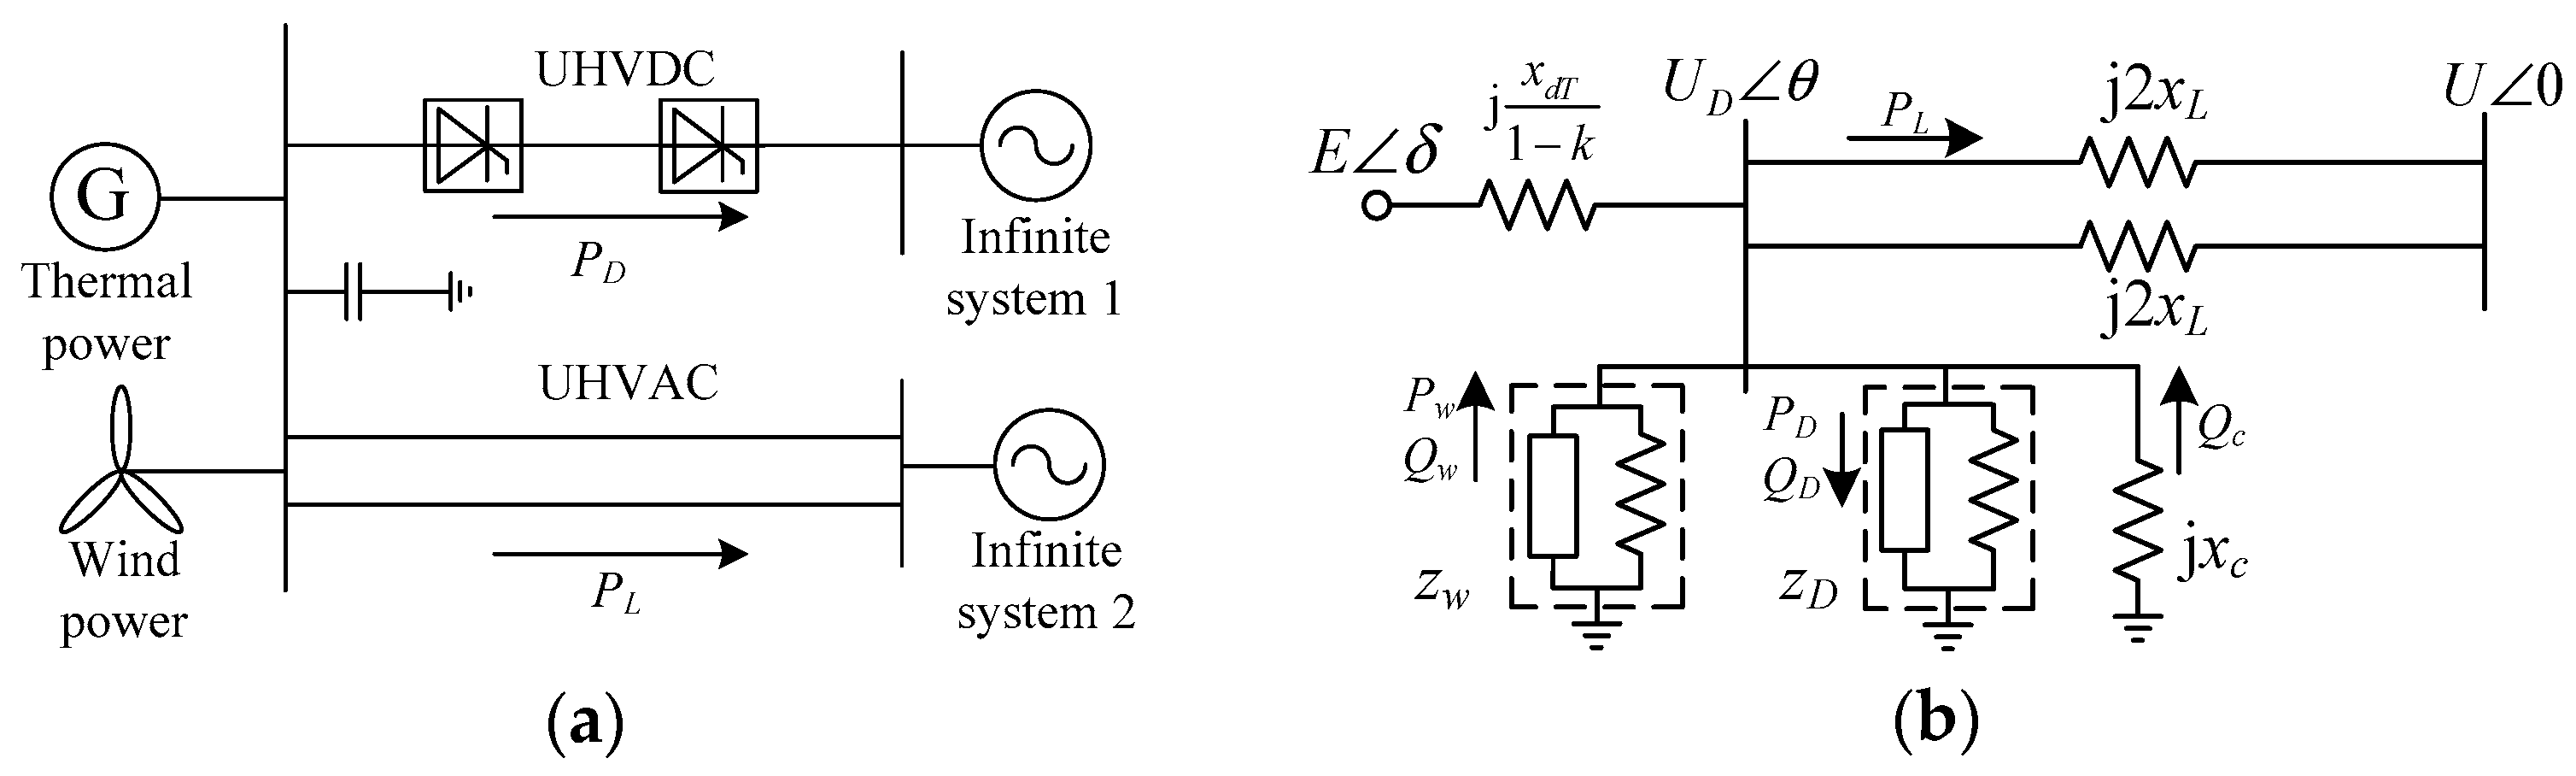
The analytical method is introduced in this section. Firstly, the electromagnetic power of the thermal power units in a single-ended power transmission system is presented. Then, the power characteristics of a wind farm and UHVDC system are presented by introducing a hypothetical impedance in order to determine the impact on electromagnetic power. Finally, the electromagnetic power of thermal power units of a typical wind-thermal-bundled system during normal operation is analysed.

2.1. Electromagnetic Power Characteristics of a Single-Ended Power Transmission System

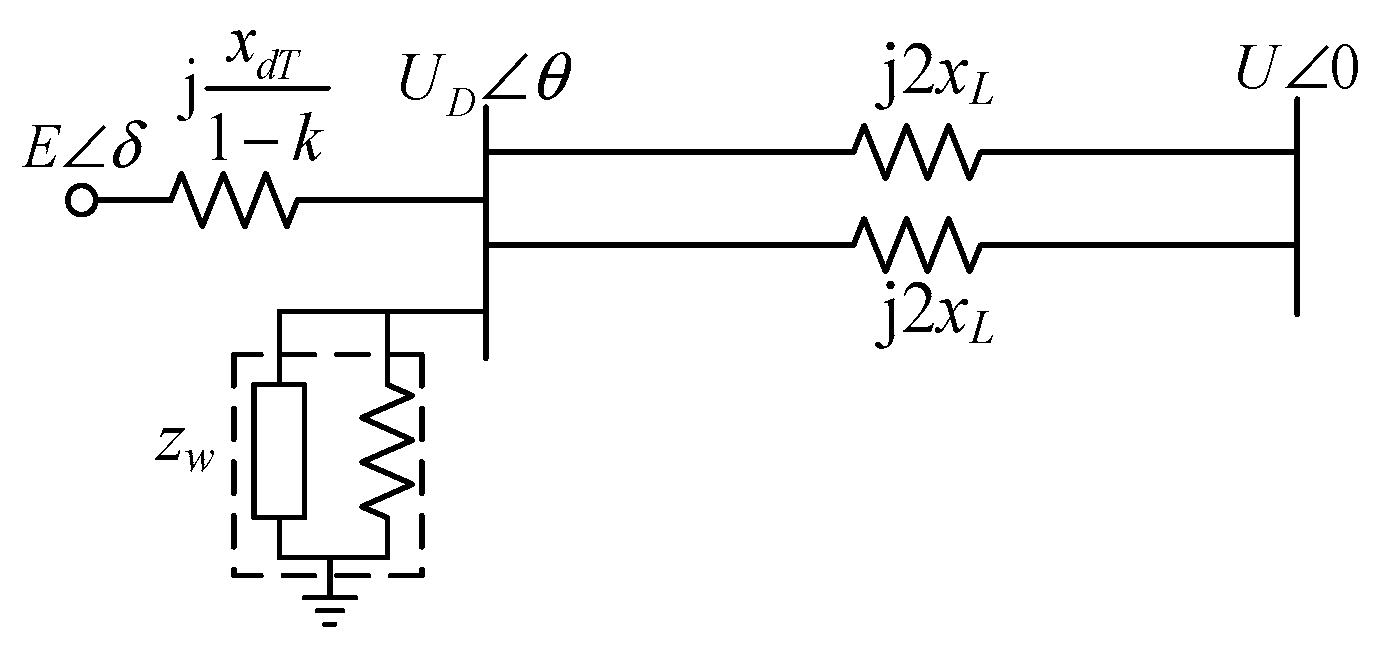
The structural schematic and equivalent circuit diagram of a single-ended power transmission system are shown in Figure 1. The electromagnetic power of the thermal power units in a single-ended power transmission system is [15]
P e = E q 2 | Z 11 | sin α 11 + E q U | Z 12 | sin ( δ α 12 )
where Eq is the no-load electromotive force (EMF) of thermal power units; U is the voltage of receiving end system; δ is the angle difference between Eq and U; Z11 is the self-impedance of thermal power units; Z12 is the mutual impedance between thermal power units and receiving end system; and, α 11 and α 12 are complementary angles of the self-impedance angle and mutual impedance angle, respectively.
The thermal power units are simulated by the classical second-order model without the prime mover, governor or excitation system. When the system resistance is not considered, the electromagnetic power of single-ended power transmission system as shown in Figure 1 can be calculated as follows:
P e = E q 2 | Z 11 | sin α 11 + E q U | Z 12 | sin ( δ α 12 )
Z 11 = j x d T + j x L = j x = | Z 11 | 90 ° = Z 12
where xdT, which is called the equivalent internal resistance, is the sum of internal resistance of a thermal power unit x d and the transformer impedance connected to thermal power unit xT. The superscript I in the equations represents the relevant parameters of single-ended power transmission system shown in Figure 1. Therefore, Equation (2) can be written as
P e = E q U | Z 12 | sin δ

2.2. Analysis of the Wind Farm Transient Characteristics

The structural schematic and equivalent circuit diagram of a typical wind-thermal-bundled system are shown in Figure 2. Suppose that the total capacity of a wind-thermal-bundled system is P0. When the wind power is not integrated, the number of thermal power units is N, and P0 = N × PSG, where PSG is the capacity of a single thermal power unit. When the wind power is integrated into the system, the number of thermal power units is Nt, and the capacity is PS = Nt × PSG; thus, the wind power penetration ratio is k = (NNt)/N, Nt = 0, 1, …, N, and the equivalent internal resistance of thermal power is xdT/(1 − k).
The wind power is analysed based on a DFIG. The DFIG is simulated using the control model suggested in IEC 61400-27, which includes active power, reactive power, current and pitch angle control modules [22,23]. The wind farm is equipped with a static var compensator (SVC) according to the integration capacity of the DFIG. The parameters of the DFIG model that is used in this article are shown in Appendix A. When the system is disturbed, the DFIG and SVC provide reactive power support to maintain the voltage constant [24].
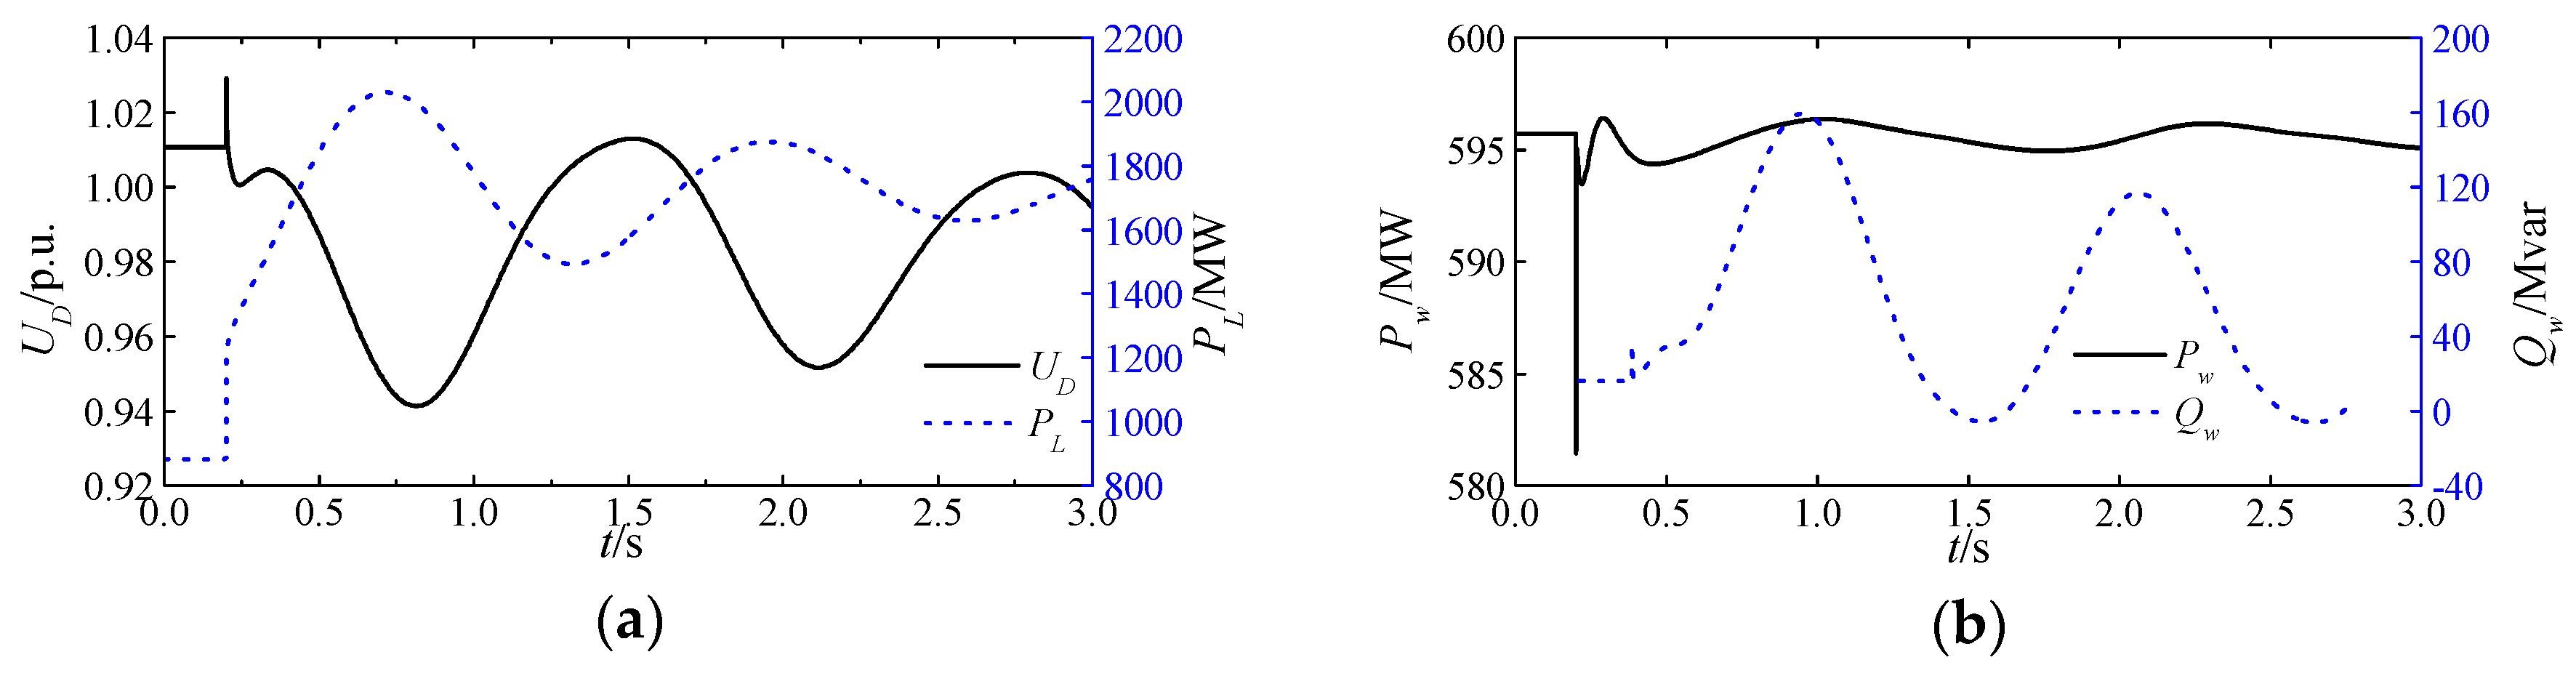
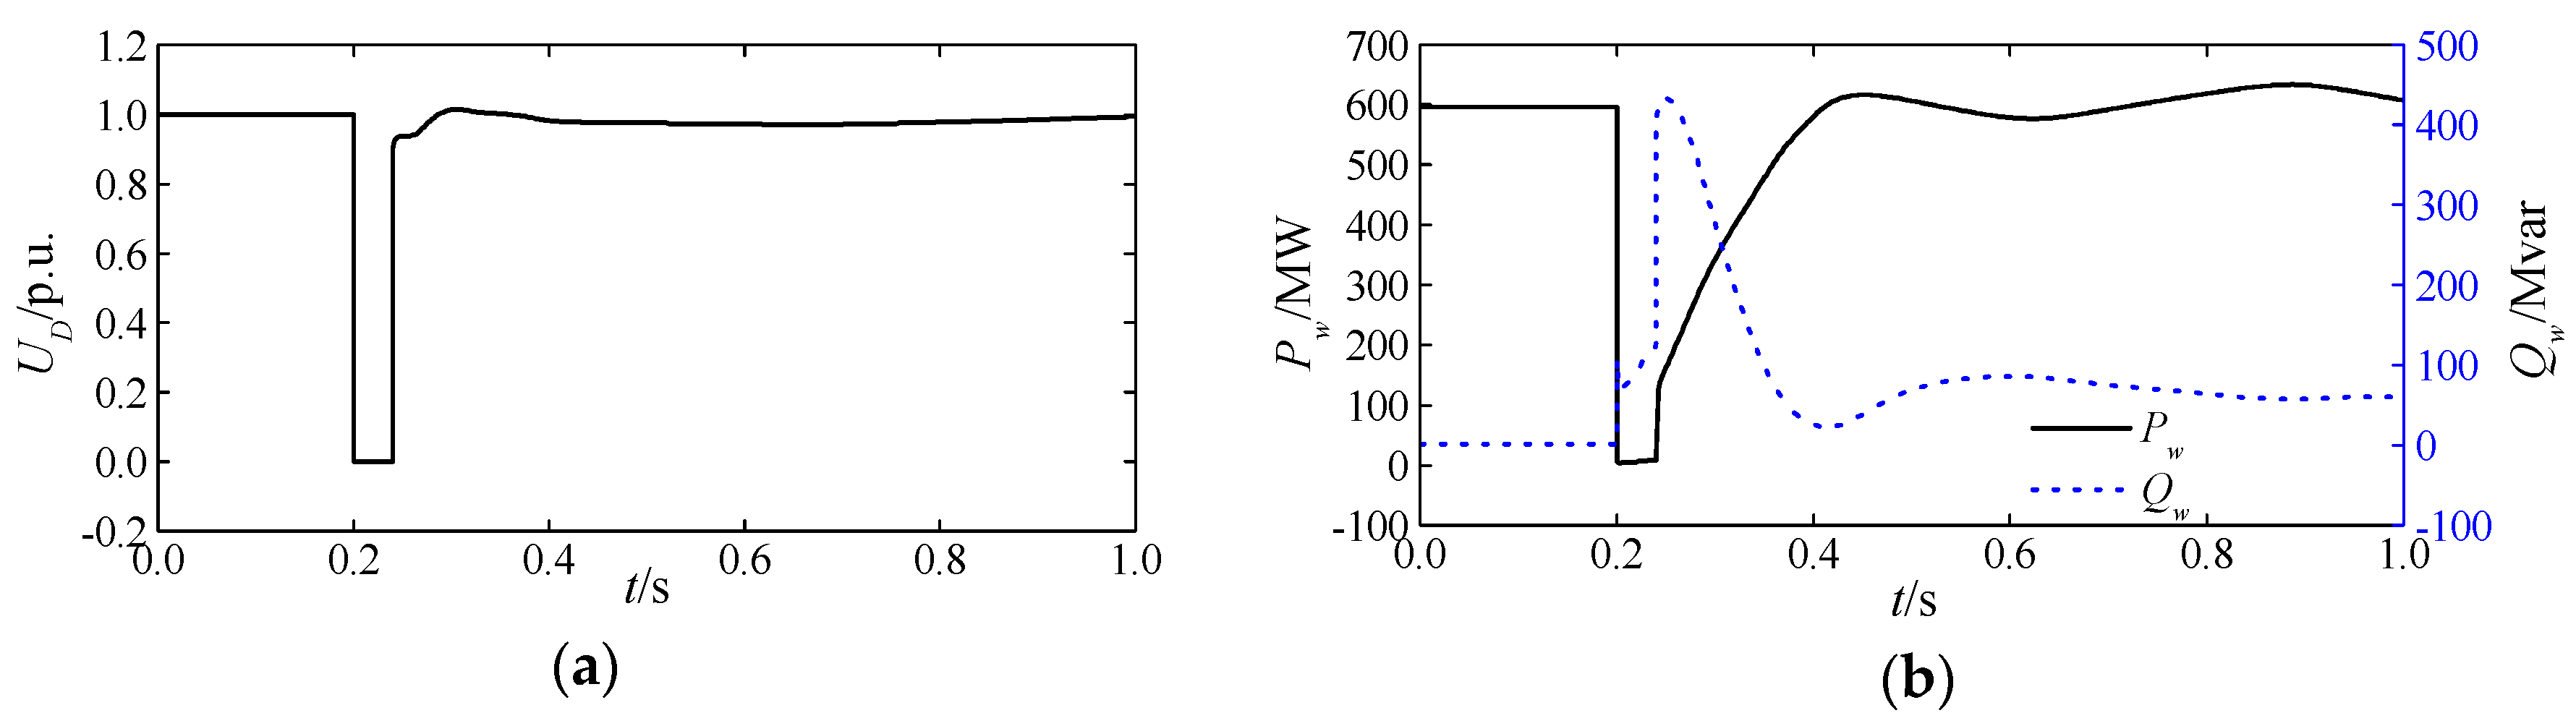
When a three-phase short circuit of an UHVAC line occurs in a wind-thermal-bundled system, the variations inthe bus voltage UD of the rectifier station, active power Pw, and reactive power Qw injected into the system by the wind farm are shown in Figure 3.
The wind power penetration ratio k will affect the active and reactive power output of wind farm in a wind-thermal-bundled system. Suppose that the operation state of entire DFIG in a wind-thermal-bundled system is same, such that Pw and Qw vary with k; that is, Pw = kPw0 and Qw = kQw0, where Pw0 and Qw0 are the instantaneous active and reactive power that are injected by the wind power when k = 1. To facilitate the derivation of the influence of Pw and Qw on the electromagnetic power of thermal power unit, as shown in Figure 2, the negative resistance rw and negative reactance xw are connected in parallel to the bus of the sending-end system. The impedance value of zw is set as follows [15]:
z w = r w + j x w = U D 2 P w j Q w = U D 2 k ( P w 0 j Q w 0 )

2.3. Analysis of UHVDC Transient Characteristics

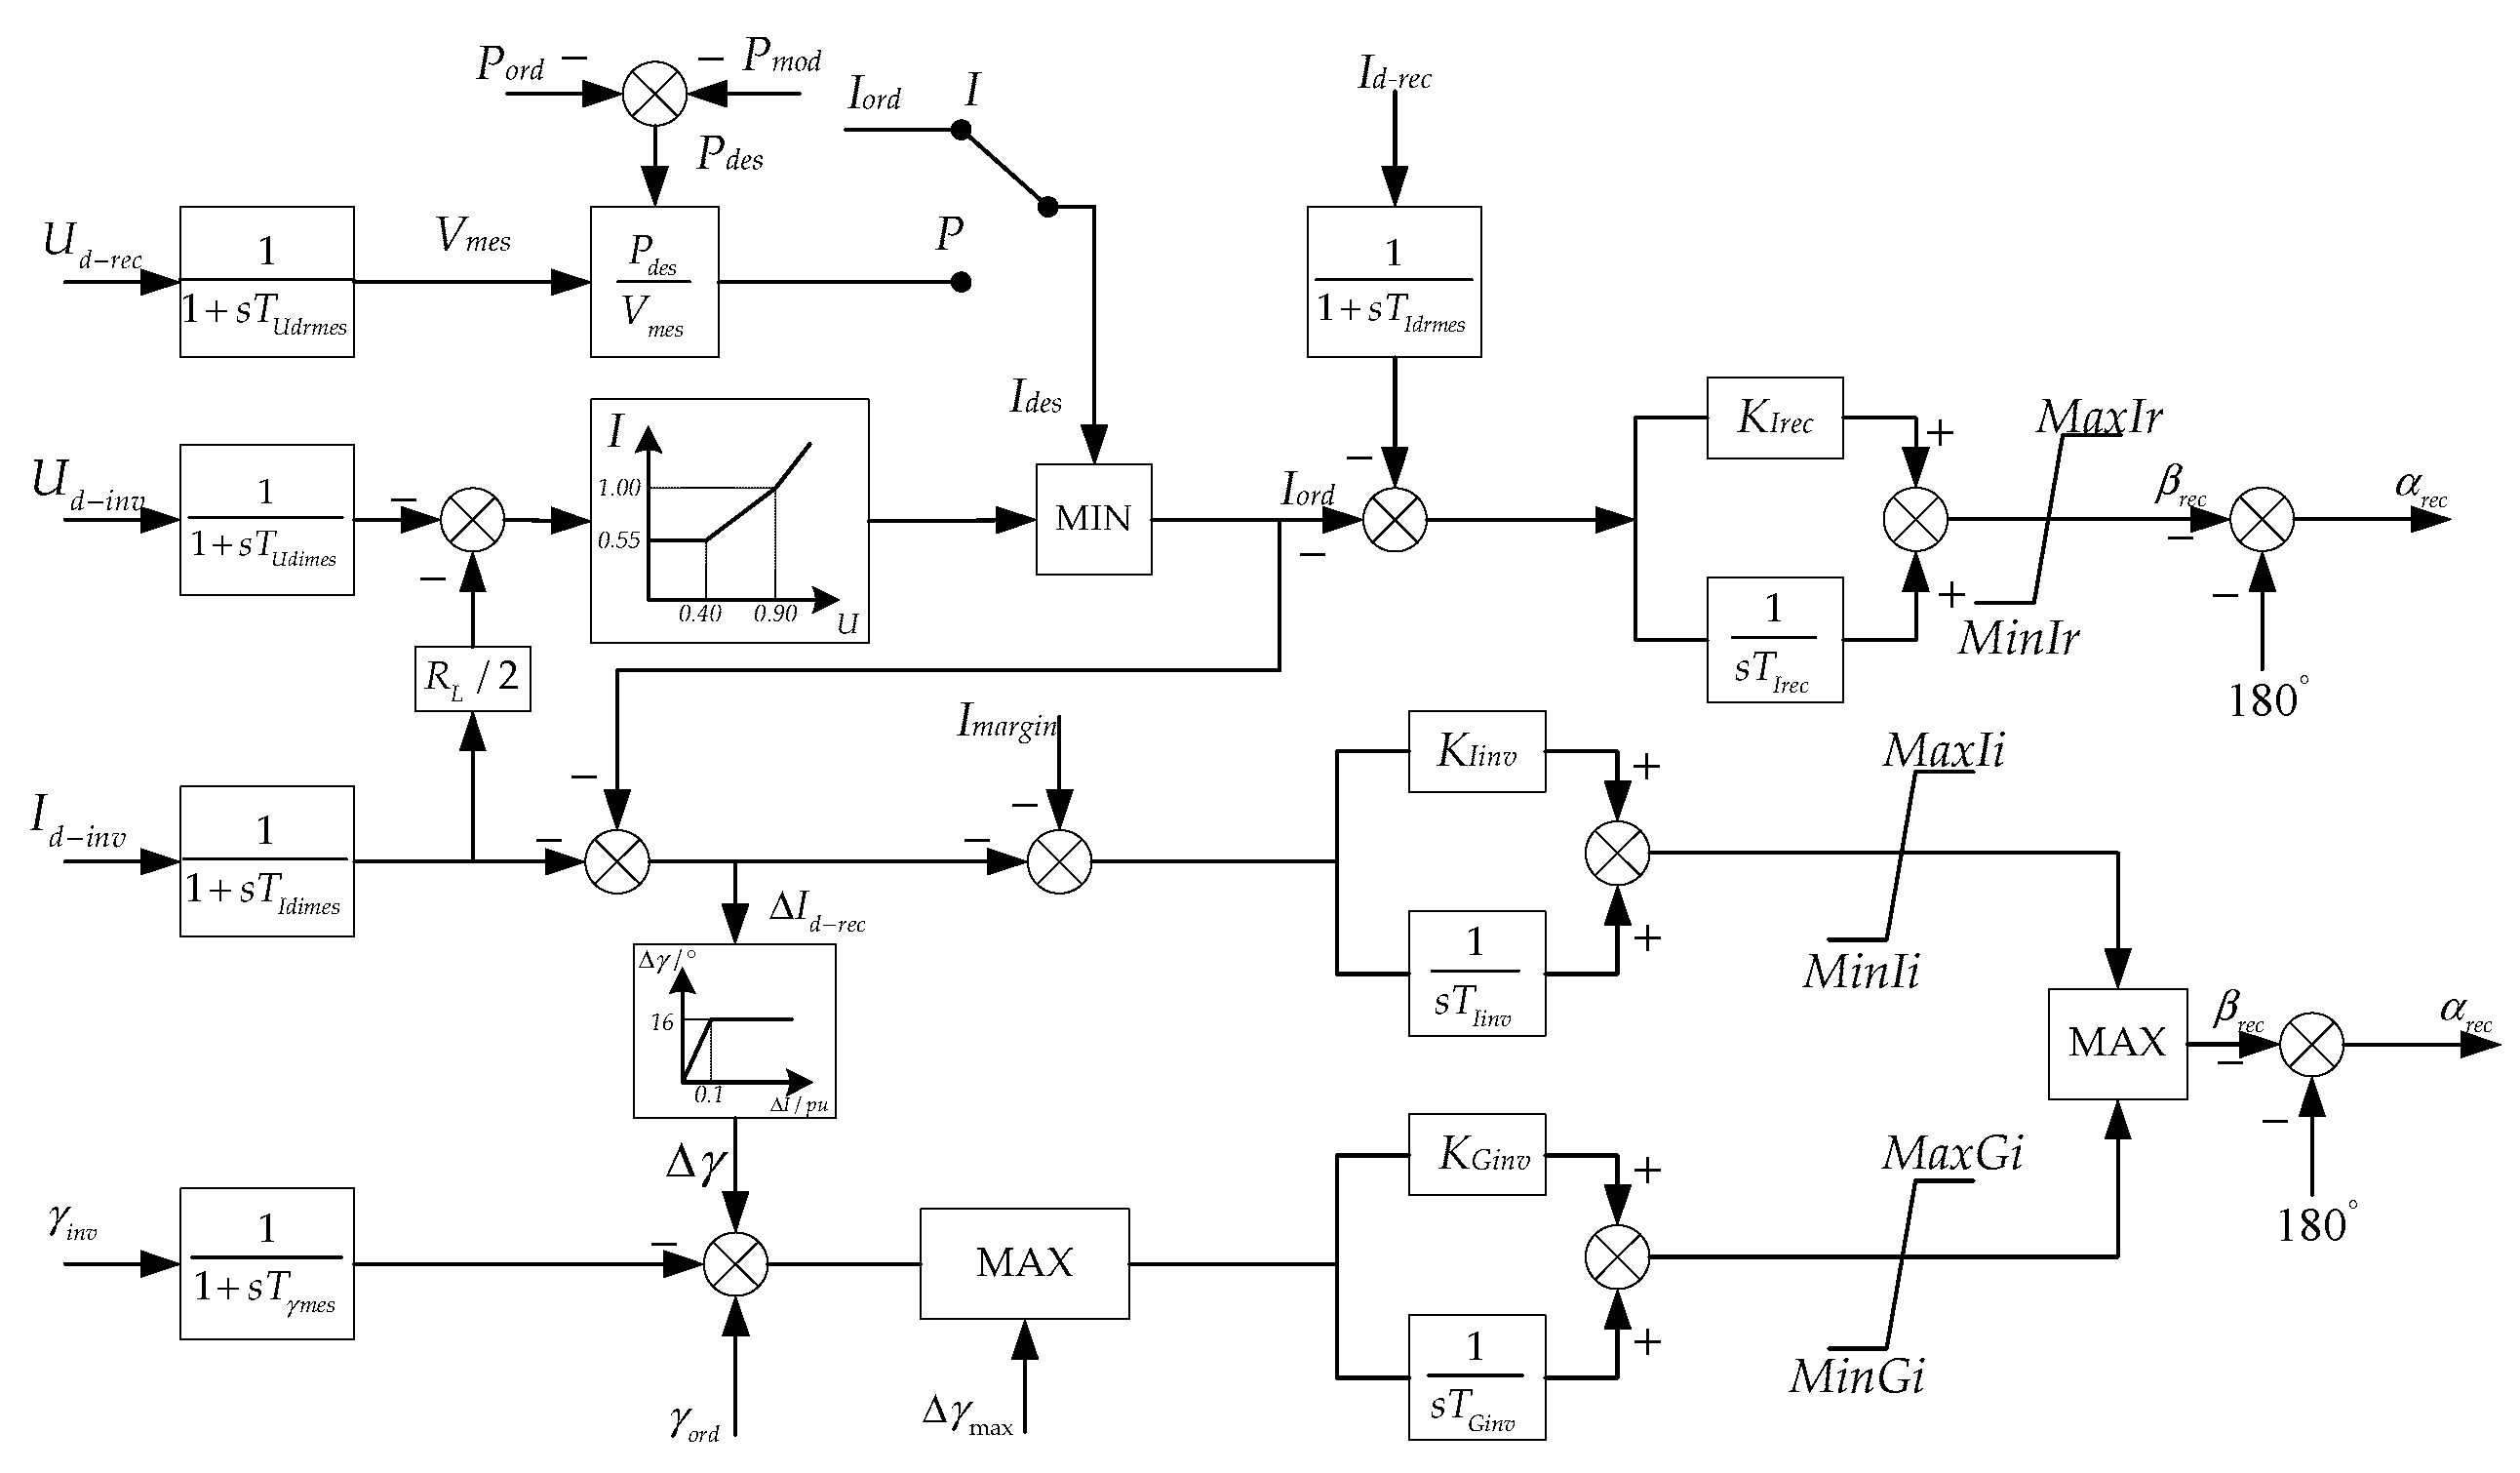
UHVDC in a wind-thermal-bundled system is simulated using the CIGRE standard test model. The rectifier can be controlled as a constant current (CC) mode and constant αmin (CIA) mode. The inverter can be controlled as constant extinction angle (CEA) mode and CC mode, as well as with VDCOL control [25,26]. The structure diagram and parameters of the CIGRE HVDC control system are presented in Appendix B. A large amount of reactive power is consumed while transmitting active power, and it is approximately 40% of the UHVDC transmission capacity [27]. To ensure normal UHVDC operation, a large number of capacitors are installed on the AC side of the rectifier station in order to compensate for the reactive power of system. Suppose that the reactance value of the capacitors is jxc; thus, the reactive power compensation Qc of capacitors can be expressed as
j Q c = U D 2 / j x c
During normal operation, the QC is approximately equal to the reactive power QD consumed by rectifier station; that is, QC = 
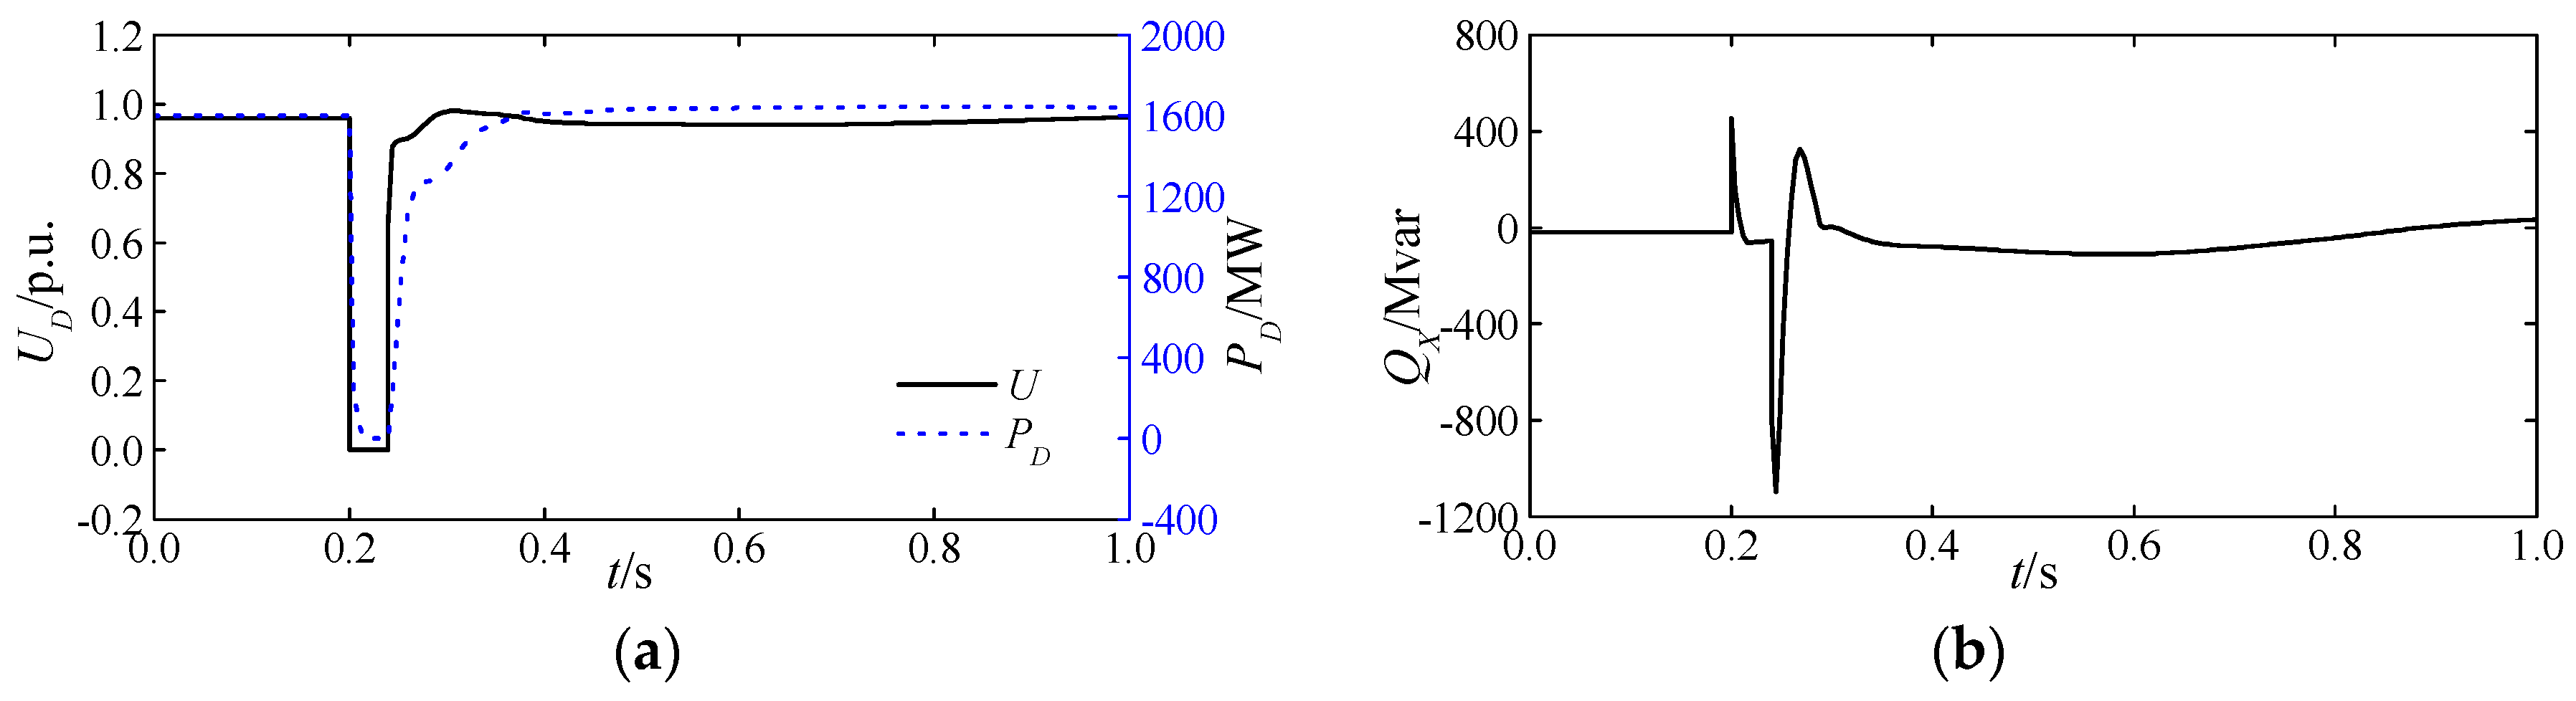
QD. When a three-phase short circuit of the UHVAC line occurs in the wind-thermal-bundled system, UD, PD and the reactive power exchange QX between the rectifier station and sending-end system are shown in Figure 4, where QX = QDQc.
As shown in Figure 4, PD and QD drops to zero during the fault. Then, Qc is rapidly recovered as the voltage resumes, faster than the resume ratio of QD; thus, QX < 0. When UD recovers at a higher level, the control mode of rectifier is switched from αmin control to constant power control. Due to the time delay in the control system, the output current of rectifier is greater than the set value, which causes the rated value to be exceeded; thus, QX > 0. After a time delay, PD decreases to the rated value, and QD equals Qc; thus, the reactive power exchange between the rectifier and system is equal to zero [28].
The PD and QD are variations after the fault, and they are affected by the system voltage and the control schemes of UHVDC after fault. To facilitate the derivation of the influence of PD and QD on electromagnetic power of thermal power units, a resistance rD and reactance xD are connected in parallel to the bus of the sending-end system. The impedance value of zD is set as follows:
z D = r D + j x D = U D 2 P D j Q D
During normal operation, QD is equal to Qc, thus, xD = 0, and rD can be written as follows:
r D = U D 2 / P D

2.4. Electromagnetic Power Characteristics of the Thermal Power Units in a Wind-Thermal-Bundled System

During normal operation, the equivalent circuit diagram of a typical wind-thermal-bundled system is shown in Figure 2. The electromagnetic power of the thermal power units in the wind-thermal-bundled system is
P e = E q 2 | Z 11 | sin α 11 + E q U | Z 12 | sin ( δ α 12 )
A comparison of Equations (11) and (4) shows that the self-impedance and mutual impedance are changed due to the DFIG, UHVDC, and rectifier station capacitors that are integrated into the system. The superscript II in the equations represents the relevant parameters of wind-thermal-bundled system shown in Figure 2. The self-impedance Z 11 and mutual impedance Z 12 in Equation (9) are calculated as follows:
Z 11 = j x d T 1 k + ( z w ) / / ( z D ) / / ( j x c ) / / ( j x L ) = ( P D k P 0 ) U D 4 + ( P D k P 0 ) 2 x L 2 + j [ x d T 1 k + x L U D 4 U D 4 + ( P D k P 0 ) 2 x L 2 ] = a 11 + j b 11 = | Z 11 | φ 11
Z 12 = j ( x d T 1 k + x L ) + j x L · j [ x d T / ( 1 k ) ] ( z w ) / / ( z D ) / / ( j x c ) = x d T x L ( P D k P 0 ) ( 1 k ) U D 2 + j ( x d T 1 k + x L ) = a 12 + j b 12 = | Z 12 | φ 12
The value of a 11 and a 12 depend on the difference between PD and Pw; b 11 and b 12 are always positive. When PD > kP0, a 11 > 0 , a 12 < 0 , 0 < α 11 < 90 ° , and 90 ° < α 12 < 0 ; therefore, ( E q 2 sin α 11 / | Z 11 | ) > 0 . Relative to P e , the curve of P e moves | α 12 | to the left. With increasing k, a 11 < 0 , a 12 > 0 , 90 ° < α 11 < 0 , and 0 < α 12 < 90 ° when PD < kP0; therefore, ( E q 2 sin α 11 / | Z 11 | ) < 0 . Relative to P e , the curve of P e moves | α 12 | to the right.
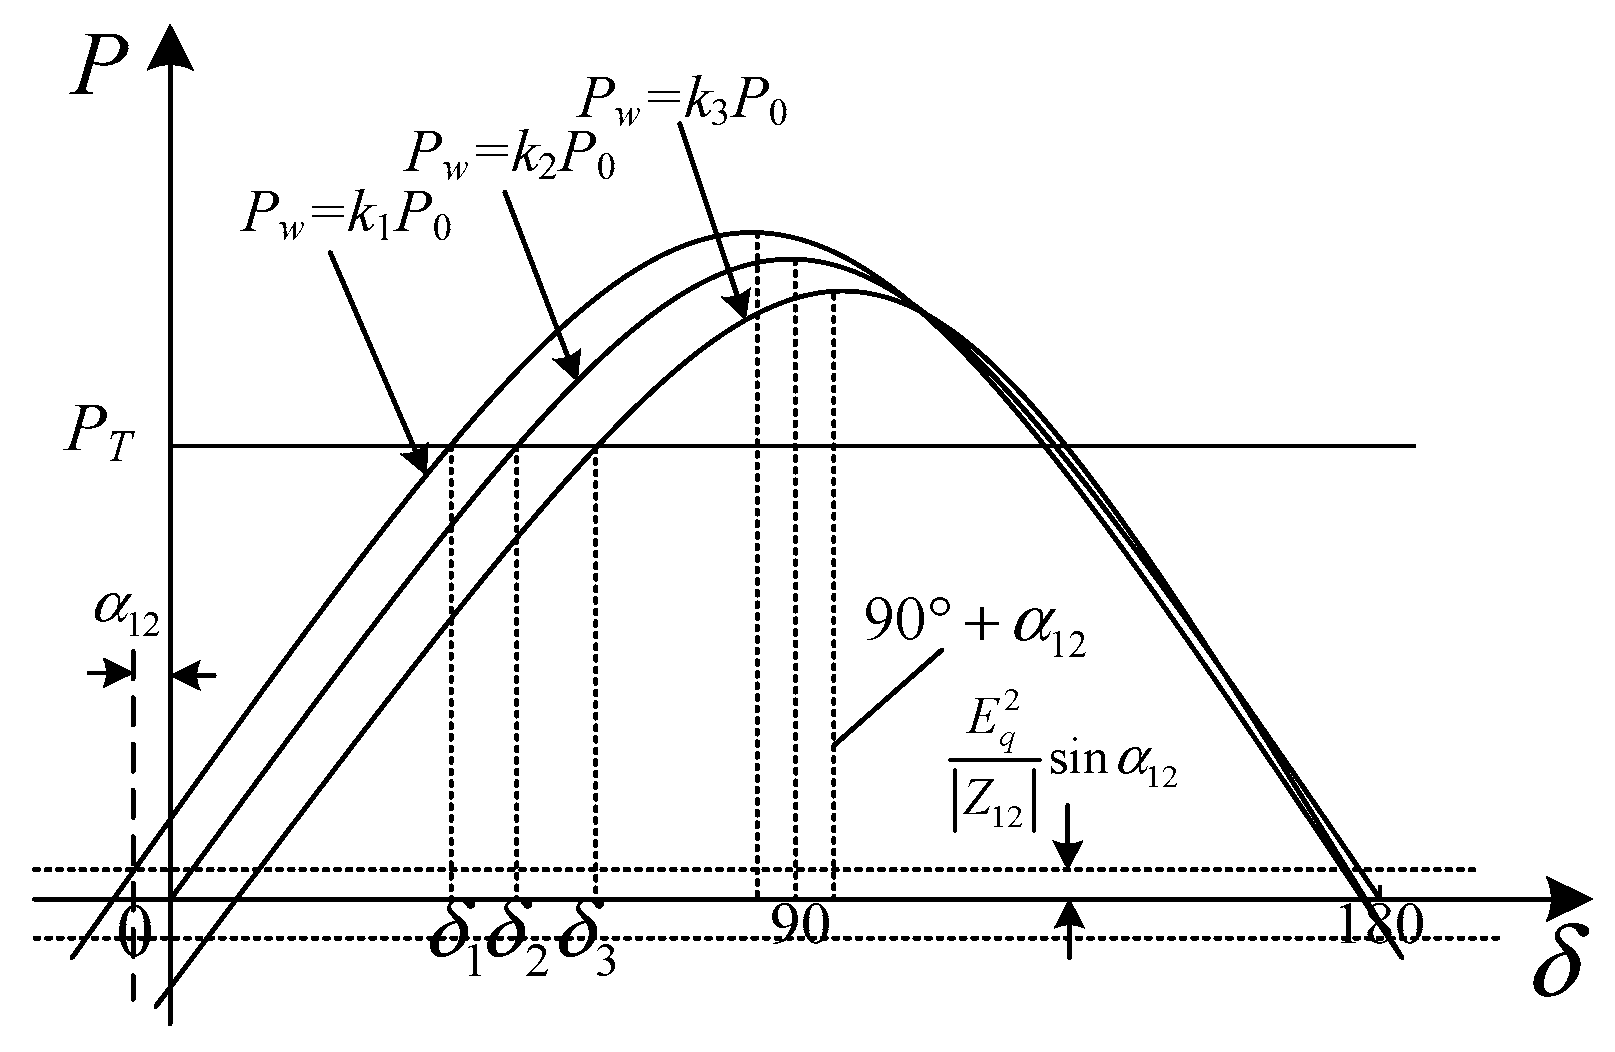
The electromagnetic power characteristics of thermal power units with different wind power penetration ratios are shown in Figure 5. For wind power penetration ratios k1, k2, and k3, k1 < k2 < k3. Figure 5 shows that the electromagnetic power characteristics moves to the lower right with increasing k. Specifically, the initial rotor angle increases continuously with increasing k when the mechanical power and the operating conditions of thermal power units are unchanged.

3. Analysis of Wind Power Penetration Ratio in a Wind-Thermal-Bundled System Considering UHVDC Block

The UHVDC block that is caused by an internal fault, such as that in an UHVDC line circuit or converter valve, will break the balance of active power and reactive power in the sending-end system. The surplus active power will cause the rotor speed of the thermal power units to increase. To balance the surplus reactive power, all capacitors installed in the rectifier station are switched off after a delay time Δ t after the UHVDC block [27]. In this paper, it is assumed that the capacitors are switched off with no time delay to simplify the equation derivation, that is, Δ t = 0 .

3.1. Analysis of Electromagnetic Power Characteristics after UHVDC Block

After the UHVDC block, PD is reduced to zero, and QD is also reduced to zero. Therefore, zD can be considered an open circuit.
The equivalent circuit diagram of the system after the UHVDC block is shown in Figure 6, and the relevant parameters are represented by the superscript III. The electromagnetic power characteristics of the thermal power units are P e :
P e = E q 2 | Z 11 | sin α 11 + E q U | Z 12 | sin ( δ α 12 )
where
Z 11 = j x d T 1 k + ( z w ) / / ( j x L ) = k P w 0 x L U D 2 ( U D 2 k Q w 0 x L ) 2 + k 2 P w 0 2 x L 2 + j [ x d T 1 k + x L U D 2 ( U D 2 k Q w 0 x L ) ( U D 2 k Q w 0 x L ) 2 + k 2 P w 0 2 x L 2 ] = a 11 + j b 11 = | Z 11 | φ 11
Z 12 = j ( x d T 1 k + x L ) + j x L · j [ x d T / ( 1 k ) ] z w = k x d T x L P w 0 ( 1 k ) U D 2 + j [ ( x d T 1 k + x L ) k x d T x L Q w 0 ( 1 k ) U D 2 ] = a 12 + j b 12 = | Z 12 | φ 12
The electromagnetic power of thermal power units is altered after the UHVDC block because the system structure and the parameters are changed. The parameters xdT and xL in Equations (13) and (14) are constant, and Pw0 and Qw0 are affected by the system parameters and control. The self-impedance angles φ 11 can be obtained by Equation (13):
φ 11 = arcsin { { Δ 1 + ( 1 k ) U D 2 x L Δ 2 } / { ( 1 k ) 2 k 2 U D 4 x L 2 P w 0 2 + { Δ 1 + ( 1 k ) U D 2 x L Δ 2 } 2 } 1 2 }
where
Δ 1 = x d T [ ( k P w 0 x L ) 2 + Δ 1 2 ]
Δ 2 = U D 2 k Q w 0 x L
The higher order term ( 1 k ) 2 k 2 U D 4 x L 2 P w 0 2 in Equation (15) is approximately zero; thus, φ 11 is approximately equal to 90°, and α 11 is approximately equal to zero [15]. Therefore, the self-impedance in the power characteristics equations can be omitted, and Equation (12) can be written as follows:
P e = E q U | Z 12 | sin ( δ α 12 )

3.2. Analysis of Wind Power Penetration Ratio on Rotor Angle Stability and the Determination of Optimal Wind Power Penetration Ratio

The variation of UD, the active power PL of the UHVAC lines, Pw and Qw after the UHVDC block and the capacitors switched off are shown in Figure 7.
Large amounts of active power as surplus in the sending-end system are caused by the UHVDC block. The surplus active power is transmitted to the UHVAC lines and it substantially increases the power flow in the UHVAC lines. The reactive power loss of AC lines is approximately proportional to the square of the active power transmitted by UHVAC [29]. Therefore, the power flow transferred from UHVDC will increase the reactive power loss of UHVAC lines and cause the voltage of sending-end system to drop. The electrical distance between wind farm and UHVDC system is small; therefore, the voltage of wind farm integration point will decrease after the UHVDC block. As shown in Figure 8, the active power fluctuation of wind farm is small after an UHVDC block and can be considered constant; the reactive power Qw is essentially positive before the rotor angle reaches the maximum.
The variation | Z 12 | is analysed as follows. Equation (13) shows that a 12 increases monotonically with increasing k, and the increase or decrease in b 12 depends on the value of ( 1 k Q w 0 x L / U D 2 ) .
When k Q w 0 x L / U D 2 < 1 , b 12 increases gradually with increasing k; thus, | Z 12 | and the maximum rotor angle difference increases monotonically. Specifically, the rotor angle transient stability decreases gradually with an increasing k.
When k Q w 0 x L / U D 2 > 1 , b 12 decreases gradually with increasing k. Function F1 is constructed as follows:
F 1 = | Z 12 | 2 = k 2 P w 0 2 x d T 2 x L 2 ( 1 k ) 2 U D 4 + x d T 2 ( 1 k ) 2 + 2 x d T x L 1 k + x L 2 2 k Q w 0 x d T 2 x L ( 1 k ) 2 U D 2 2 k Q w 0 x d T x L 2 ( 1 k ) U D 2 + k 2 Q w 0 2 x d T 2 x L 2 ( 1 k ) 2 U D 4
The derivative of F1 with respect to k is obtained, and the minimum point km is calculated as follows:
k m = ( x d T + x L ) ( x L Q w 0 U D 2 U D 4 ) x L [ ( P w 0 2 + Q w 0 2 ) x d T x L U D 4 + ( x d T x L ) Q w 0 U D 2 ]
Equation (20) shows that F1 is a concave function whose minimum value occurs at
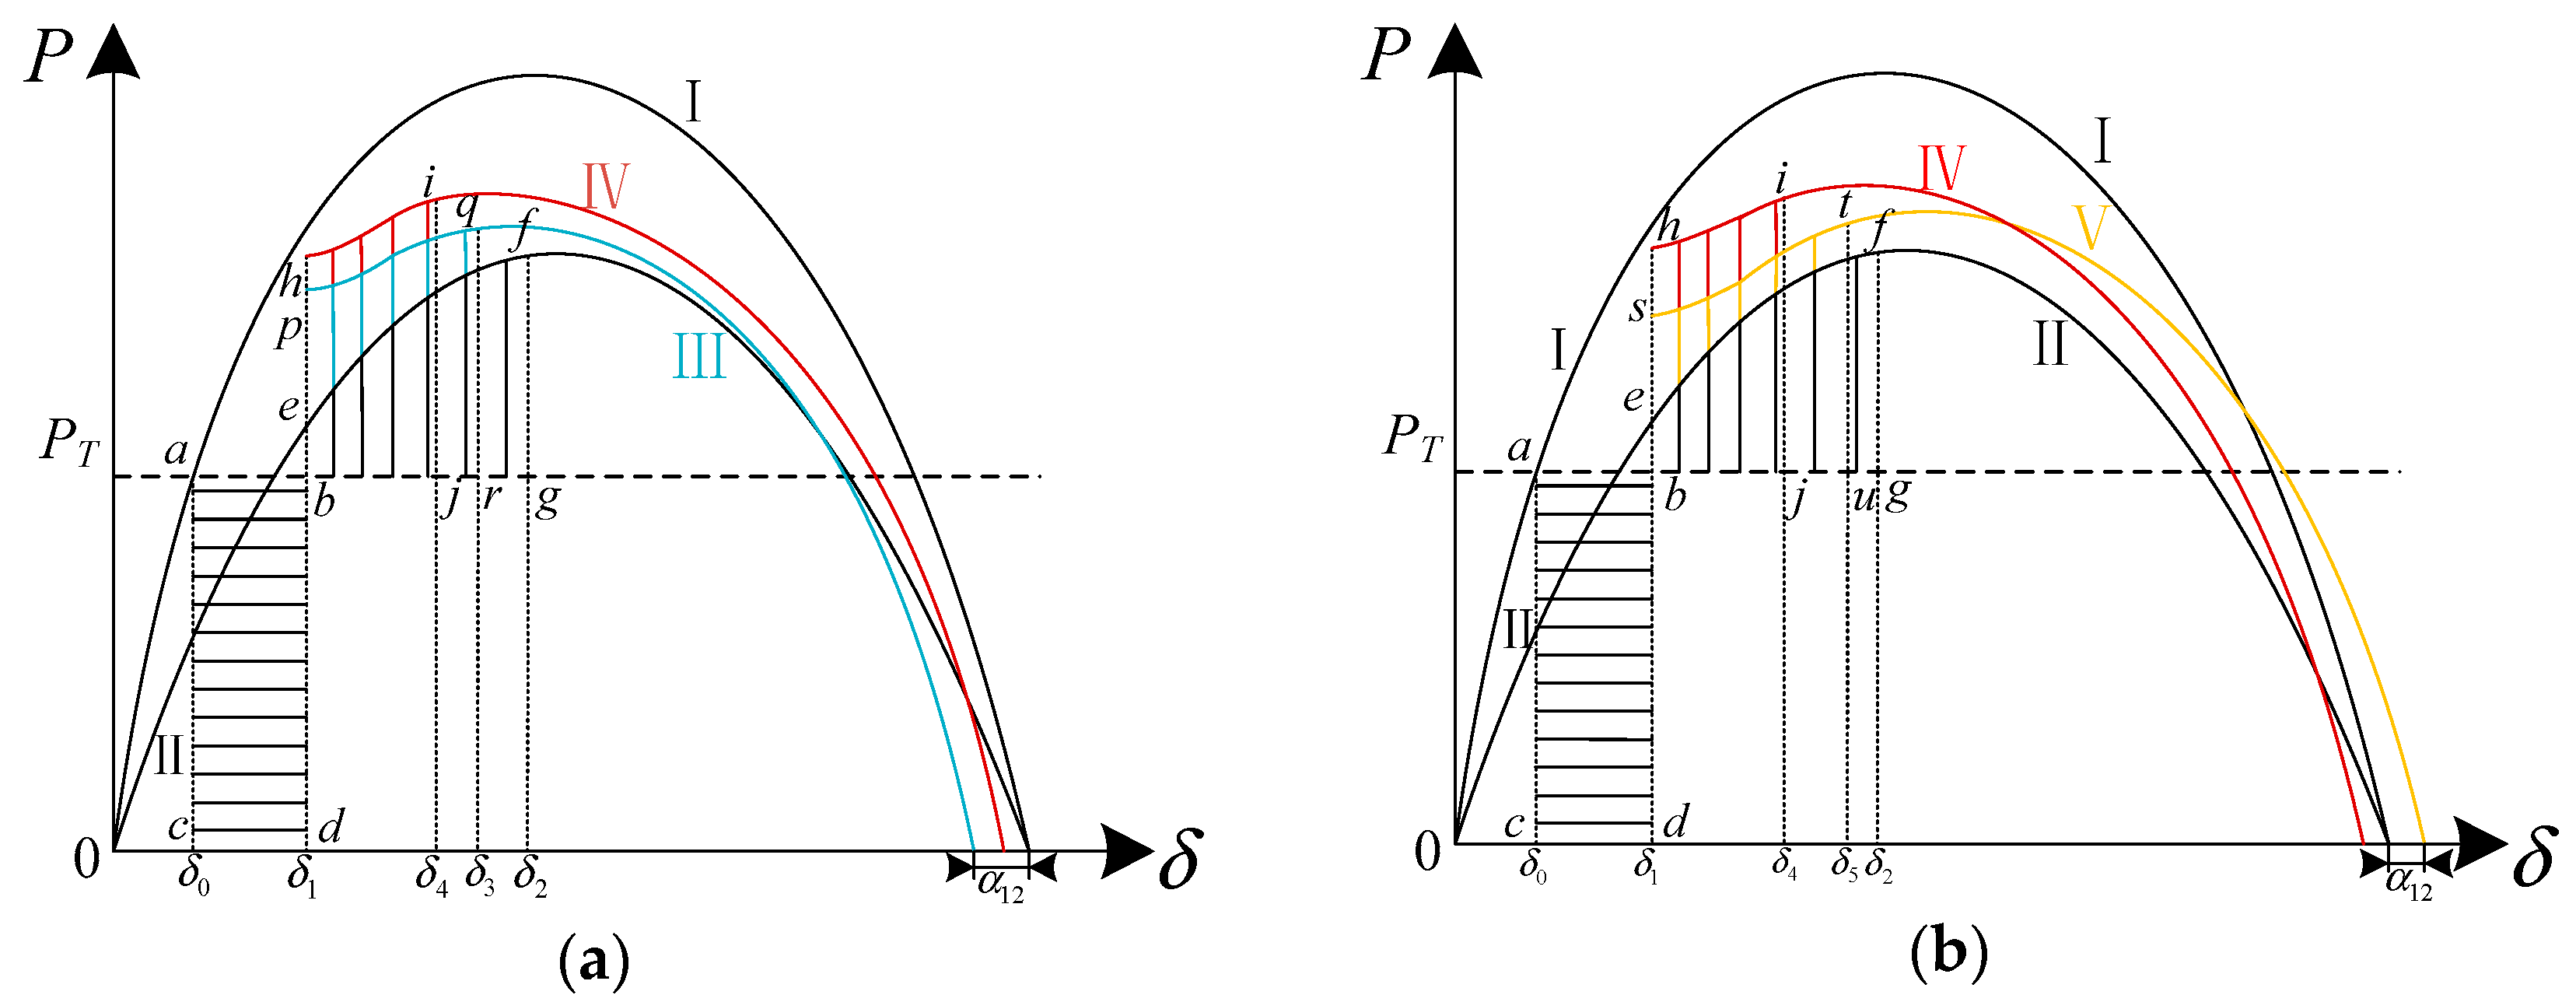
 k = km. The influence of the wind power penetration ratio on the acceleration area and deceleration area of the thermal power units is shown in Figure 8.
For k1, k2 and k3, 0 < k1 < k2 = km < k3 < 1. Curve I in Figure 8 corresponds to the electromagnetic power of the thermal power units during normal operation without UHVDC or wind power. Curves II, III and IV correspond to the electromagnetic power when wind power penetration ratios are k1, k2 and k3, respectively. As indicated by Equation (20), | Z 12 | decreases and α 12 increases gradually with increasing k when 0 < k < km; thus, curve III is to the upper right of curve II. When k = k1, the acceleration area is Sabc, the deceleration area is Scde, and the maximum rotor angle is δ 1 . When k = k2, the acceleration area is Safg, the deceleration area is Sghi, and the maximum rotor angle is δ 2 . As Safg < Sabc, δ 2 < δ 1 can be obtained based on the EAC. When km < k < 1, | Z 12 | increases gradually with k. The acceleration area and deceleration area when k = k3 are Sajp and Spqr, respectively. When compared with that at k = k2, curve IV is to the lower right of curve III and Sajp > Safg; thus, we have δ 3 > δ 2 . Specifically, the maximum rotor angle experiences an improvement first and then worsens with the increase in k, and the rotor angle is minimized when k = km. Thus, km is described as the optimal wind power penetration ratio after the UHVDC block.

3.3. Analysis of Factors Affecting the Optimal Wind Power Penetration Ratio

The optimal wind power penetration ratio km is affected by PD and xL after the UHVDC block. When x L < U D 2 / Q w 0 , the rotor angle transient stability of the system worsens monotonically with increasing k. When x L > U D 2 / Q w 0 , the rotor angle transient stability first improves but then worsens with increasing k, and the optimal wind power penetration ratio is km after an UHVDC block.
The power flow transferred to the UHVAC lines increases gradually with PD, and it causes the reactive power loss of the UHVAC lines to increase and UD to decrease. Equations (14) and (20) indicate that the change ratio of a 12 and b 12 increases with decreasing UD and causes the optimal wind power penetration ratio km to decrease. Specifically, the optimal wind power penetration ratio km decreases with an increasing PD.

4. Analysis of Wind Power Penetration Ratio in a Wind-Thermal-Bundled System Considering Three-Phase Short Circuit of UHVAC Lines

A three-phase short circuit of UHVAC lines will seriously affect the rotor angle transient stability of a wind-thermal-bundled system. A short circuit of UHVAC lines near to the sending-end system is analysed in this section.

4.1. Analysis of Electromagnetic Power Characteristics after a Short Circuit of UHVAC Lines

The equivalent circuit of the system during the short circuit of the UHVAC line is shown in Figure 9a. During the short circuit, UD is decreased to zero, which causes Pw, PD and the electromagnetic power of thermal power units to decrease to zero. The equivalent circuit of the system after UHVDC line cut-off is shown in Figure 9b, and the relevant parameters are represented by the superscript IV. The electromagnetic power characteristics of thermal power units are P e :
P e = E q 2 | Z 11 | sin α 11 + E q U | Z 12 | sin ( δ α 12 )
where
Z 11 = j x d T 1 k + ( z w ) / / ( z D ) / / ( j x c ) / / ( j x L ) = 4 U D 2 x L 2 ( P D k P w 0 ) 4 ( P D k P w 0 ) 2 x L 2 + [ 2 ( k Q w 0 + Q c Q D ) x L U D 2 ] 2 +    j [ x d T 1 k + 2 U D 2 x L [ U D 2 2 x L ( k Q w 0 + Q c Q D ) ] 4 ( P D k P w 0 ) 2 x L 2 + [ 2 ( k Q w 0 + Q c Q D ) x L U D 2 ] 2 ] = a 11 + j b 11 = | Z 11 | φ 11
Z 12 = j ( x d T 1 k + x L ) + j x L · j [ x d T / ( 1 k ) ] ( z w ) / / ( z D ) / / ( j x c ) = 2 x d T x L ( P D k P w 0 ) ( 1 k ) U D 2 + j [ ( x d T 1 k + 2 x L ) 2 x d T x L ( k Q w 0 + Q c Q D ) ( 1 k ) U D 2 ] = a 12 + j b 12 = | Z 12 | φ 12
Similarly to the analysis of φ 11 , φ 11 90 ° and α 11 0 , therefore, P e can be written as follows:
P e = E q U | Z 12 | sin ( δ α 12 )

4.2. Analysis of Wind Power Penetration Ratio on Rotor Angle stability and the Determination of Optimal Wind Power Penetration Ratio

As shown in Figure 3 and Figure 4, QX quickly recovers to zero after a momentary oscillation when the short circuit is cleared; thus, Qw0 > 0. With increasing k, kQw0 + QcQD > 0, therefore, a 12 increases gradually from negative to positive, and b 12 decreases gradually. Function F2 is constructed as follows:
F 2 = | Z 12 | 2 = 4 x d T 2 x L 2 Δ 3 2 ( 1 k ) 2 U D 4 + x d T 2 ( 1 k ) 2 + 4 x d T x L 1 k + 4 x L 2 + 4 x d T 2 x L 2 Δ 4 2 ( 1 k ) 2 U D 4 4 x d T 2 x L Δ 4 ( 1 k ) 2 U D 2 8 x d T x L 2 Δ 4 ( 1 k ) 2 U D 2
where
Δ 3 = P D k P w 0
Δ 4 = k Q w 0 + Q c Q D
The derivative of F2 with respect to k is obtained, and the minimum point kn is calculated as follows:
k n = [ 4 x d T x L 2 P D Δ 5 + ( x d T + 2 x L ) U D 4 + 4 x d T x L 2 ( Q c Q D ) Δ 6 2 x d T x L U D 2 Δ 7 4 x L 2 U D 2 Δ 6 ] / [ 2 x L ( U D 4 + 2 x d T x L P w 0 Δ 5 + x d T Q w 0 U D 2 2 x d T x L Q w 0 Δ 6 2 x L U D 2 Δ 6 ) ]
where
Δ 5 = P D P w 0
Δ 6 = Q w 0 + Q c Q D
Δ 7 = Q w 0 + 2 Q c 2 Q D
Therefore, F2 is a concave function whose minimum occurs at k = kn. The effect of wind power penetration ratio on the acceleration area and deceleration area of thermal power units when 0 < kkn is shown in Figure 10a. The curve I in Figure 10a corresponds to the electromagnetic power of the thermal power units during normal operation without UHVDC or wind power, and curve II corresponds to the electromagnetic power after the fault is eliminated. For the wind power penetration ratio k1 and k2, 0 < k1 < k2 = kn. Curves III and IV correspond to the electromagnetic power when the levels of wind power penetration ratio are k1 and k2, respectively. When compared with that of curve II, the shift value of curve III is α 12 . An analysis of the transient characteristics of the wind farm indicates that Qw0 is positive and decrease gradually; thus, the “perk-up” phenomenon appears in the initial stage of curve III after fault is cleared. As shown in Figure 10a, the acceleration area is Sabcd, the deceleration area is Spqrb, and the maximum rotor angle is δ 3 . When k < kn, | Z 12 | decreases and α 12 increases gradually with increasing k, such that curve IV is in the upper right of curve III. The acceleration area and deceleration area when k = k2 are Sabcd and Shijb, respectively. Thus, Shijb = Spqrb can be obtained based on the EAC and the maximum rotor angle δ 4 when k = k2 is less than δ 3 . Specifically, the rotor angle transient stability is improved with increasing k when k < kn.
The influence of the wind power penetration ratio k on the acceleration area and deceleration area of thermal power units when kn ≤ k < 1 is shown in Figure 10b. For wind power penetration ratios k2 and k3, kn = k2 < k3 < 1. The electromagnetic power is given by curve V when k = k3. When k > kn, | Z 12 | and α 12 increase gradually with k such that curve V is to the lower right of curve IV. The acceleration area and deceleration area when k = k3 are Sabcd and Sstub, respectively, and the maximum rotor angle is δ 5 . Thus, Shijb = Sstub and δ 5 > δ 4 can be obtained based on the EAC, that is, the rotor angle transient stability worsens with an increasing k when k > kn. Therefore, after a three-phase short circuit of UHVAC lines, the rotor angle transient stability first improves and then worsens with increasing k, and the rotor angle stability is optimal when k = kn.

4.3. Analysis of Factors Affecting the Optimal Wind Power Penetration Ratio

The optimal wind power penetration ratio kn is affected by xL and PD after short circuit of the UHVAC lines. The decrease in xL will not affect the variation trend of a 12 , but it will reduce the decreasing ratio of b 12 , which will increase the optimal power penetration ratio kn. The increase in PD will cause the wind power penetration ratio to increase, corresponding to a 12 = 0 , and the variation trend of reactive power in b 12 will not be affected by the increase in PD. Therefore, the increase in PD will cause the optimal wind power penetration ratio kn to increase.

5. Example Verification and Discussion

5.1. Analysis of a Typical Wind-Thermal-Bundled System

A typical wind-thermal-bundled system, as shown in Figure 2, is established in the PSD-BPA simulation software. The total installed capacity of thermal power units is 6 GW (600 MW × 10), and the total installed capacity of wind farms is 6 GW. The transmission capacity of UHVDC system is 3.2 GW and the capacity of 750 kV UHVAC lines is 1.5 GW. The receiving end is an infinite system, and the total active power output of sending-end system remains constant at 6 GW. The thermal power units are simulated by a 6th-order synchronous model with an excitation and governor system. The wind turbine is simulated by an IEC 61400-27 DFIG model and UHVDC is simulated by the CIGRE standard test model.

5.1.1. Analysis of Optimal Wind Power Penetration Ratio under an UHVDC Block

The initial voltage of the rectifier bus under different wind power penetration ratios remains unchanged in the simulation. The reactance of UHVAC lines is 0.02 and the UHVDC block occurs at 0.2 s. The simulation results are shown in Figure 11 and Figure 12. As shown in Figure 11, the maximum rotor angle difference Δ δ decreases gradually when k increases from 0 to 30%; then, the maximum rotor angle difference increases gradually when k continually increases. The minimum value of Δ δ is 41.2182° when k = 30%, as shown in Figure 12. Specifically, the rotor angle transient stability first improves and then worsens.
Then, the factors that are affecting the variation trend of the rotor angle stability and the optimal wind power penetration ratio are analysed. The simulation results are shown in Figure 13, in which PD remains unchanged and xL decreases to 0.005. Figure 13 shows that the curve of the rotor angle moves upward with increasing k, and the maximum power angle difference increases with k, that is, the rotor angle transient stability gradually worsens. Figure 14 shows the simulation results that were obtained when the reactance of UHVAC lines is 0.02 and PD decreases to 2400 MW. When compared with the results shown in Figure 12, the optimal wind power penetration ratio is increased from 30% to 50%.
It is obvious that the optimal wind power penetration ratio under the UHVDC block is affected by the reactance of the UHVAC lines and the UHVDC capacity. It is detrimental to the rotor angle stability of the wind-thermal-bundled system when xL is very small. In this case, the rotor angle transient stability worsens gradually, and the optimal wind power penetration ratio is zero. This is not coincident with the purposes of the wind-thermal-bundled system. The excessive UHVDC capacity will reduce the optimal wind power penetration ratio km under an UHVDC block, as the system inertia will reduce with increasing wind power penetration ratio. Thus, the pressure to system frequency regulation will increase when PD is excessive, and the rotor angle of the system may even be unstable.

5.1.2. Analysis of Optimal Wind Power Penetration Ratio under a Short Circuit of UHVAC Lines

A three-phase short circuit fault is set near the end of a single loop of the UHVAC transmission lines. The fault occurs at 0.2 s and the fault line is cut off after 0.04 s. The curves of rotor angle are shown in Figure 15 when xL is 0.02 and PD is 3200 MW. Figure 15 shows that with an increasing k, the curve of the rotor angle moves to the lower when k ≤ 40% and then moves upwards when k ≥ 40%. The initial rotor angle δ 0 , the maximum rotor angle δ max , the maximum rotor angle difference Δ δ and the critical clearing time (CCT) are shown in Table 1. Table 1 shows that the initial rotor angle increases continuously with wind power penetration ratio, it is coincident with the theoretical analysis in Section 2.4 as the electromagnetic power characteristics moves to the lower right with increasing k. The maximum rotor angle difference gradually decreases when k < 40% and increases when k > 40%, the minimum value of Δ δ is 18.7224°. This indicates that the variation trend of the rotor angle transient stability is concave and the optimal wind power penetration ratio is 40%. In addition, the variation in CCT is consistent with the variation trend of Δ δ .
Table 2 shows the simulation results obtained when the reactance of UHVAC lines are 0.01 and 0.006. Table 2 shows that the optimal wind power penetration ratios are 50% and 60% when xL is 0.01 and 0.006, respectively. Specifically, the optimal wind power penetration ratio increases with the decrease in xL. When compared with Table 1, the effect of the short circuit on the rotor angle stability is reduced with decreasing xL.
Table 3 shows the simulation results obtained when xL is 0.02 and PD is reduced to 1600 MW. In this case, the optimal wind power penetration ratio is reduced to 30%. When compared with Table 1, Δ δ is increased at the same wind power penetration ratio as the power flow in the UHVDC system is transferred to the UHVAC lines, and it increases the transmission pressure of the UHVAC lines and the severity of the fault.
In conclusion, the variation trend of rotor angle transient stability under a short circuit of UHVAC lines is concave with an increasing k, and the optimal wind power penetration ratio kn is affected by the reactance of the UHVAC lines and the capacity of the UHVDC system. A decrease in xL or an increase in PD will increase the optimal wind power penetration ratio kn. The results are significant for the planning and operation of a wind-thermal-bundled system. For planning a wind-thermal-bundled system, the rotor angle transient stability can be improved by optimizing the structure of the power grid. Although the structure is determined and cannot be changed for an already built wind-thermal-bundled system, the reactance of the UHVAC lines can be adjusted in a certain range if thyristor-controlled series compensation (TCSC) is installed in the system. The rotor angle transient stability can be improved by adjusting TCSC during normal operation.

5.2. Analysis of an Actual Wind-Thermal-Bundled System in China

To further verify the accuracy of theoretical derivation, the model of an actual wind-thermal-bundled system in China’s Northwest Power Grid, as shown in Figure 16, is built in the PSD-BPA simulation software. The rated voltage of UHVDC is ±800 kV, and the rated power is 8000 MW. The rectifier station has accessed to the Xinjiang Power Grid. The active power of mating thermal units is 6000 MW, and the wind farms are located in the Hami and south Hami areas. The Xinjiang Power Grid is connected to the Northwest Power Grid by four transmission lines whose rated voltage is 750 kV. The total capacity of reactive power compensation of the UHVDC rectifier station is 3880 Mvar.

5.2.1. Analysis of Optimal Wind Power Penetration Ratio under UHVDC Monopolar Block

The initial voltage of the rectifier bus remains unchanged in the simulation. The UHVDC monopolar block occurs at 2.0 s, and half of the capacitors are switched off without time delay. When compared with the typical wind-thermal-bundled system, the power transmitted by UHVAC and UHVDC is composed of mating thermal power, wind power, and Xinjiang Power Grid. In the simulation, the mating thermal power units are tripped-off firstly to increase the wind power penetration ratio. The simulation results are shown in Figure 17. When compared with the results shown in Figure 12, the variation trend of actual system is similar to the trend of a typical system, that is, the rotor angle stability first improves and then worsens with increasing k, and the optimal wind power penetration ratio km is 20%.
The UHVAC lines in actual wind-thermal-bundled system are installed with TCSC, and the reactance can be adjusted in a certain range. To further verify the correctness of theoretical analysis, the simulation results obtained when the reactance of the UHVAC line is reduced by adjusting TCSC are shown in Figure 18. Clearly, the rotor angle transient stability worsens monotonously with an increasing k, and the optimal wind power penetration ratio is 0, which is consistent with the results obtained for a typical system and verifies the analysis presented in Section 3.2.

5.2.2. Analysis of Optimal Wind Power Penetration Ratio under a Short Circuit of UHVAC Lines

A three-phase short circuit fault is set near the end of the single loop of the 750 kV UHVAC transmission lines from Hami to Dunhuang. The fault occurs at 2.0 s, and the fault line is cut off after 0.1 s. The simulation results are shown in Figure 19 and Table 4. The maximum rotor angle difference decreases first and then improved, and the minimum value occurs at k = 20%, that is, the optimal wind power penetration ratio kn = 20%. The results of CCT are consistent with Δ δ . The rotor angle is unstable when k = 70% as the CCT is lower than the duration time of the short circuit.
Table 5 shows the simulation results obtained when the reactance of the UHVAC line is reduced by adjusting the TCSC. When compared with Table 4, the optimal wind power penetration ratio kn increases from 20% to 30% as xL decreases. Specifically, the simulation results of the actual wind-thermal-bundled system in China’s Northwest Power Grid verifies the correctness and practicability of the theoretical analysis.

6. Conclusions

In this paper, equations describing electromagnetic power characteristics under a short circuit of UHVAC lines and an UHVDC block are derived based on an analysis of the external characteristics of a doubly fed wind farm. The effects of the wind power penetration ratio on the rotor angle transient stability are analysed and the optimal wind power penetration ratio corresponding to the minimum value of rotor angle difference is determined. The effects of system parameters, such as the UHVDC transmission capacity and the reactance of UHVAC lines on the optimal wind power penetration ratio, are discussed. The conclusions are as follows:
(1) During normal operation, an increase in wind power penetration ratio will cause the curve of electromagnetic power to shift to the lower right, that is, the initial rotor angle increases continuously with increasing k when the mechanical power and operating conditions of the thermal power units are unchanged.
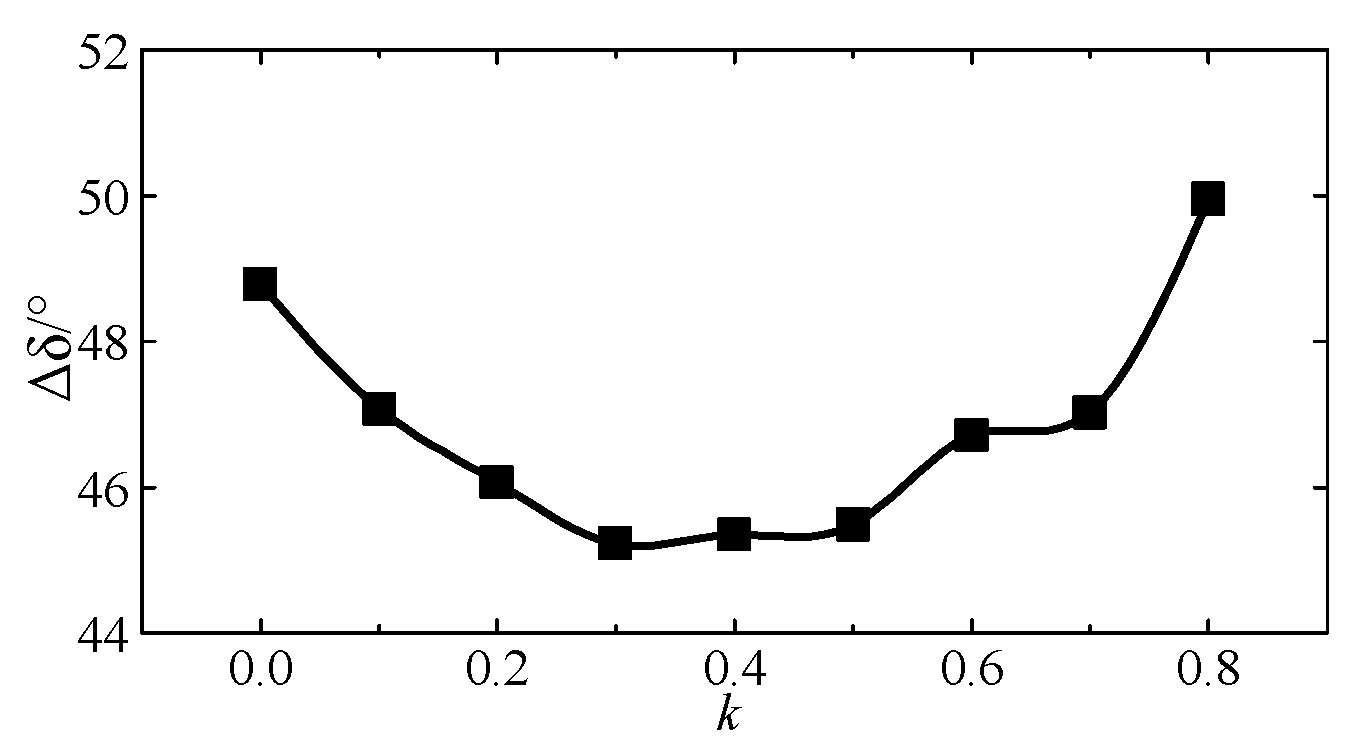
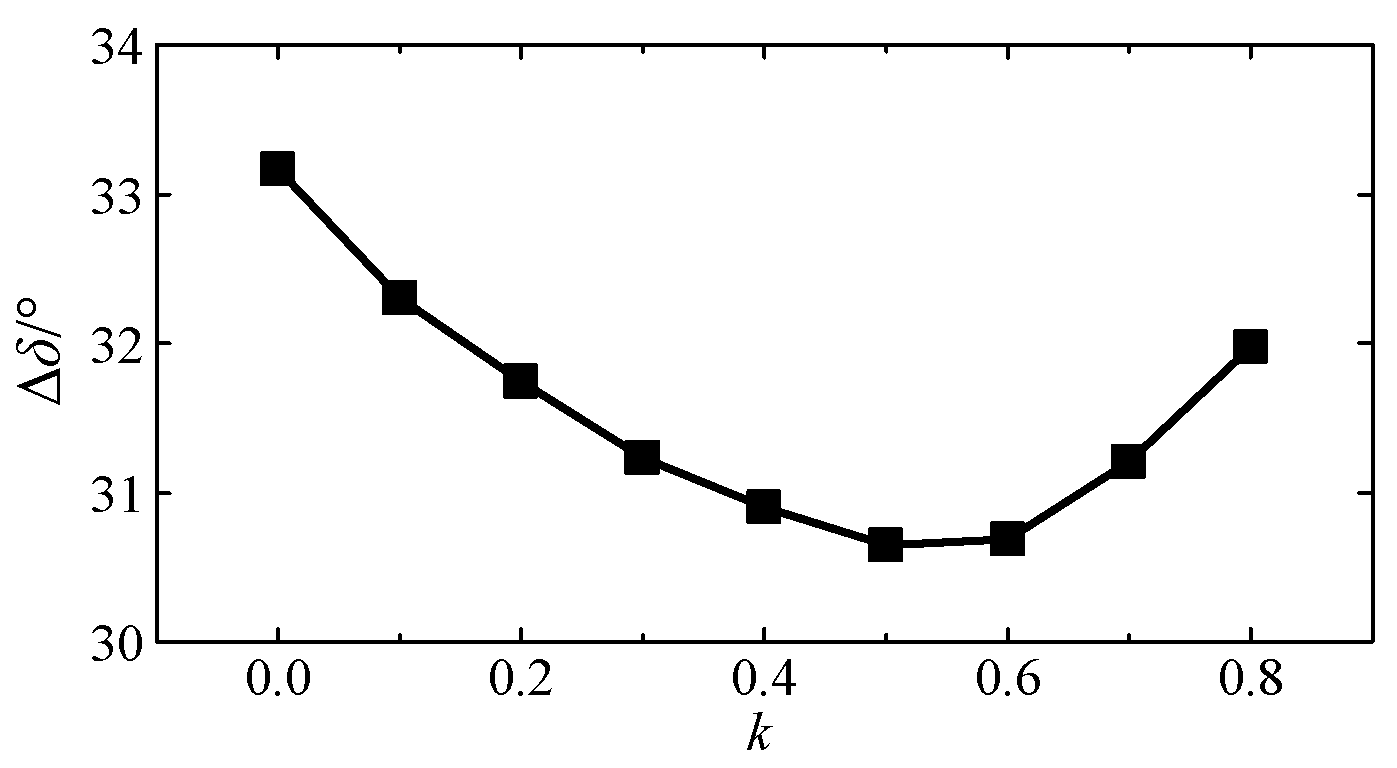
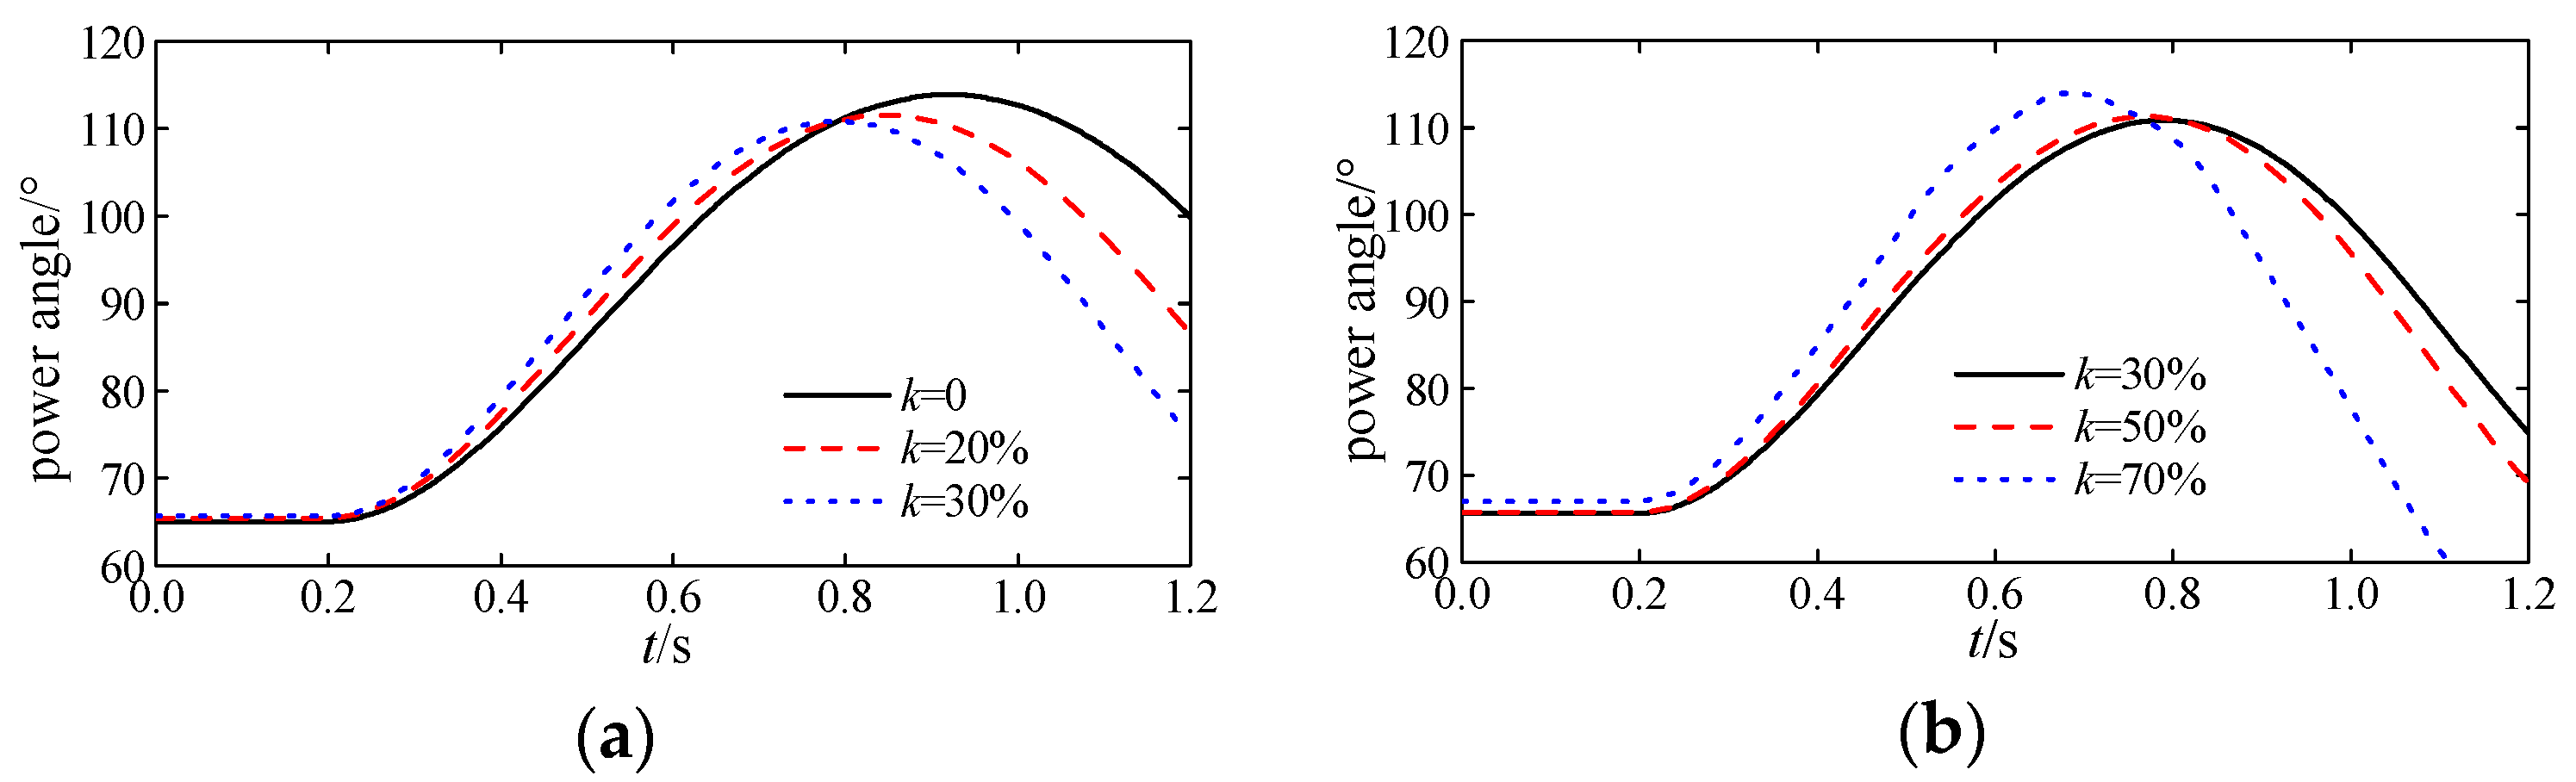
(2) After the UHVDC block, the variation trend of the rotor angle stability under different wind power penetration ratios is affected by the reactance of the UHVAC lines. When the reactance value is small, the rotor angle stability worsens monotonically with an increasing wind power penetration ratio. When the reactance value is greater, the rotor angle stability first improves and then worsens. The rotor angle stability worsens monotonically and the optimal wind power penetration ratio in typical wind-thermal-bundled system is 0 at xL is 0.005, and the variation trend of rotor angle stability is concave and the optimal wind power penetration ratio is 30% when xL is 0.02.
(3) The increase in the UHVDC transmission capacity causes the optimal wind power penetration ratio to decrease. The typical system results indicate that the optimal wind power penetration ratio increases from 30% to 50% when PD decreases from 3200 MW to 2400 MW.
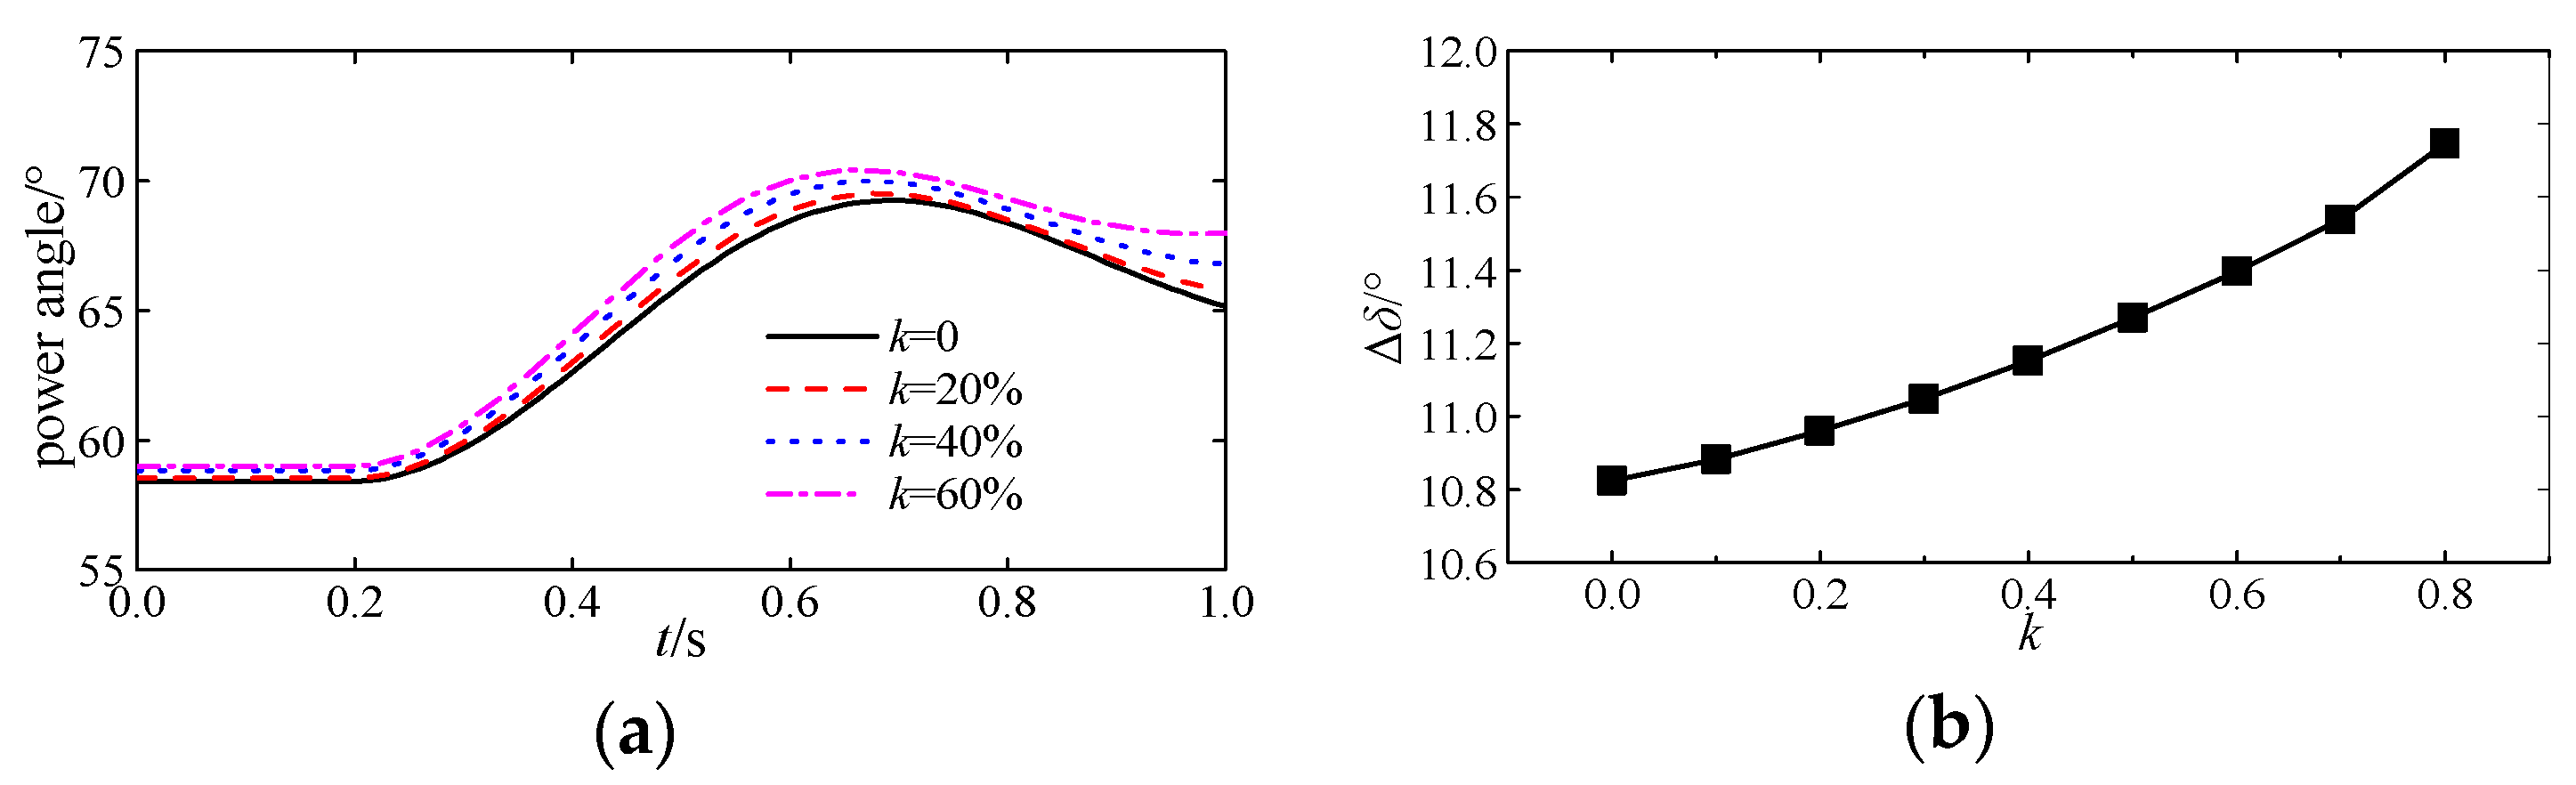
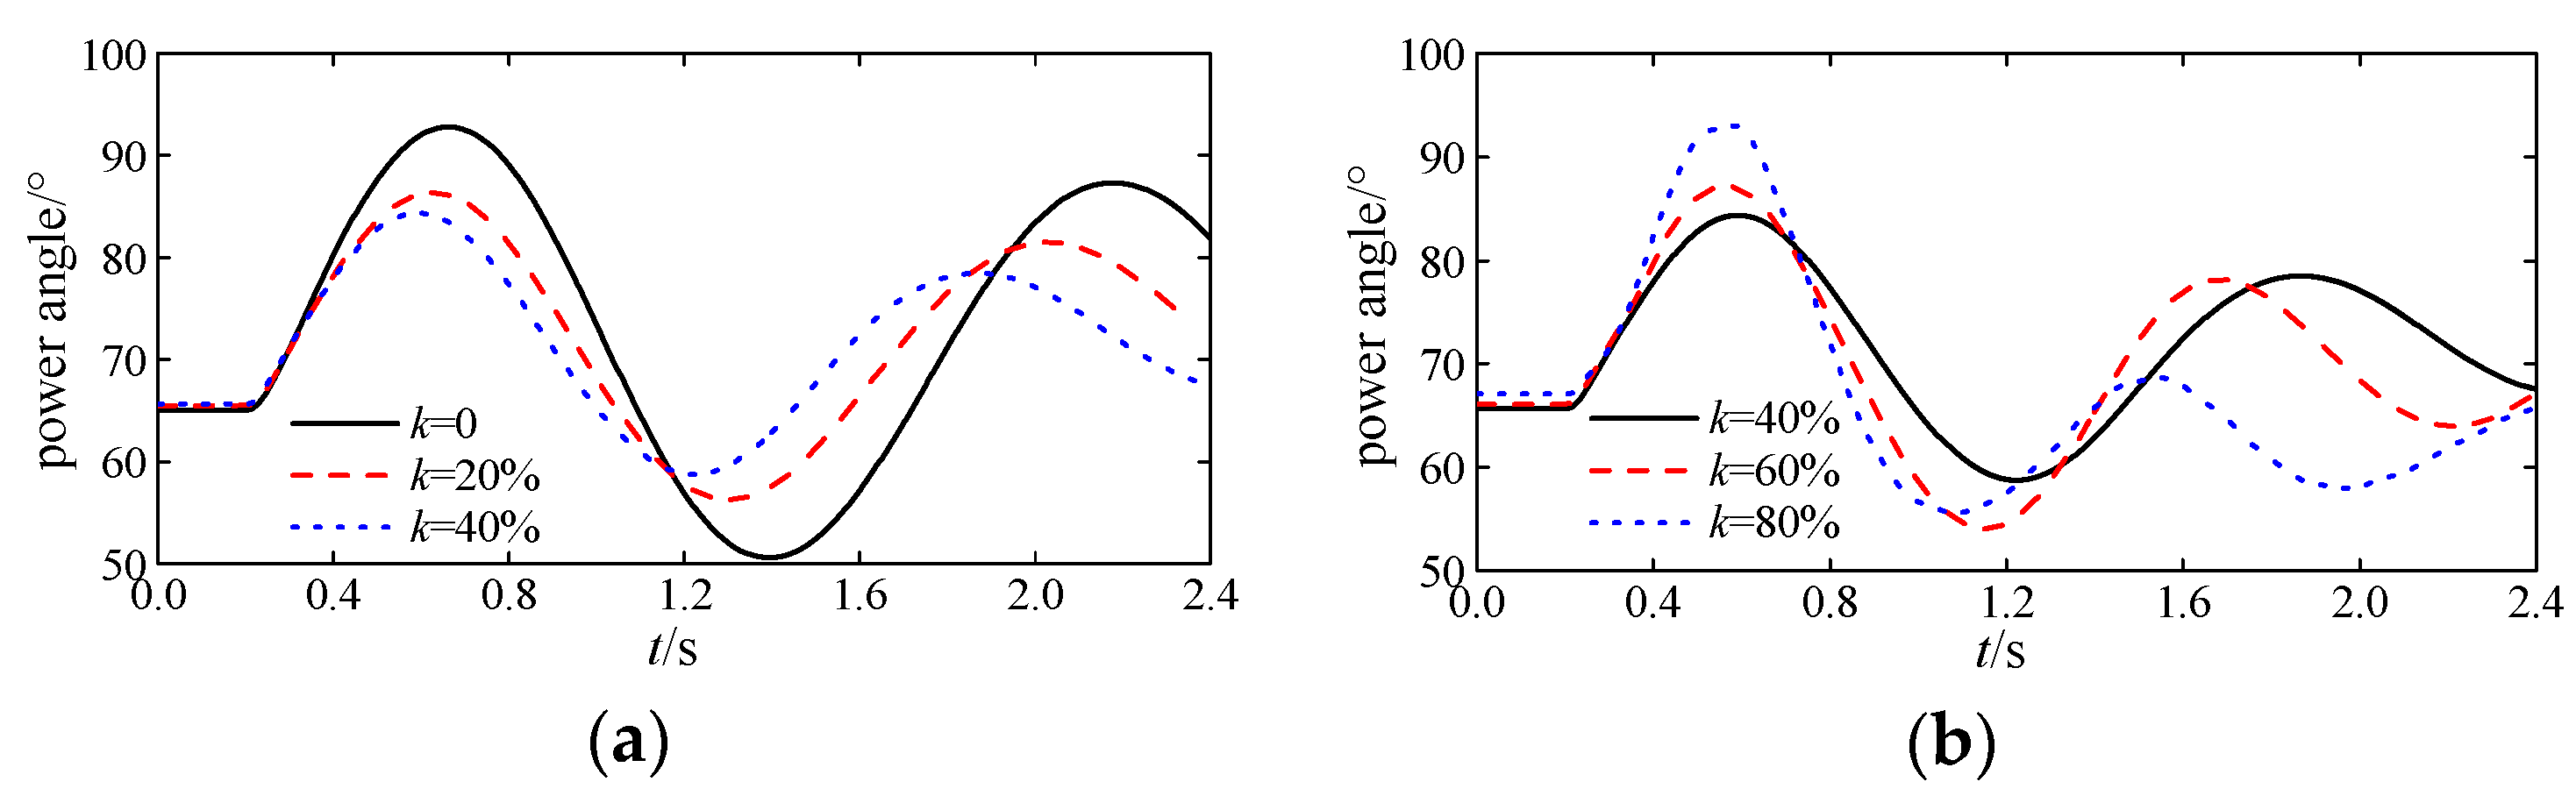
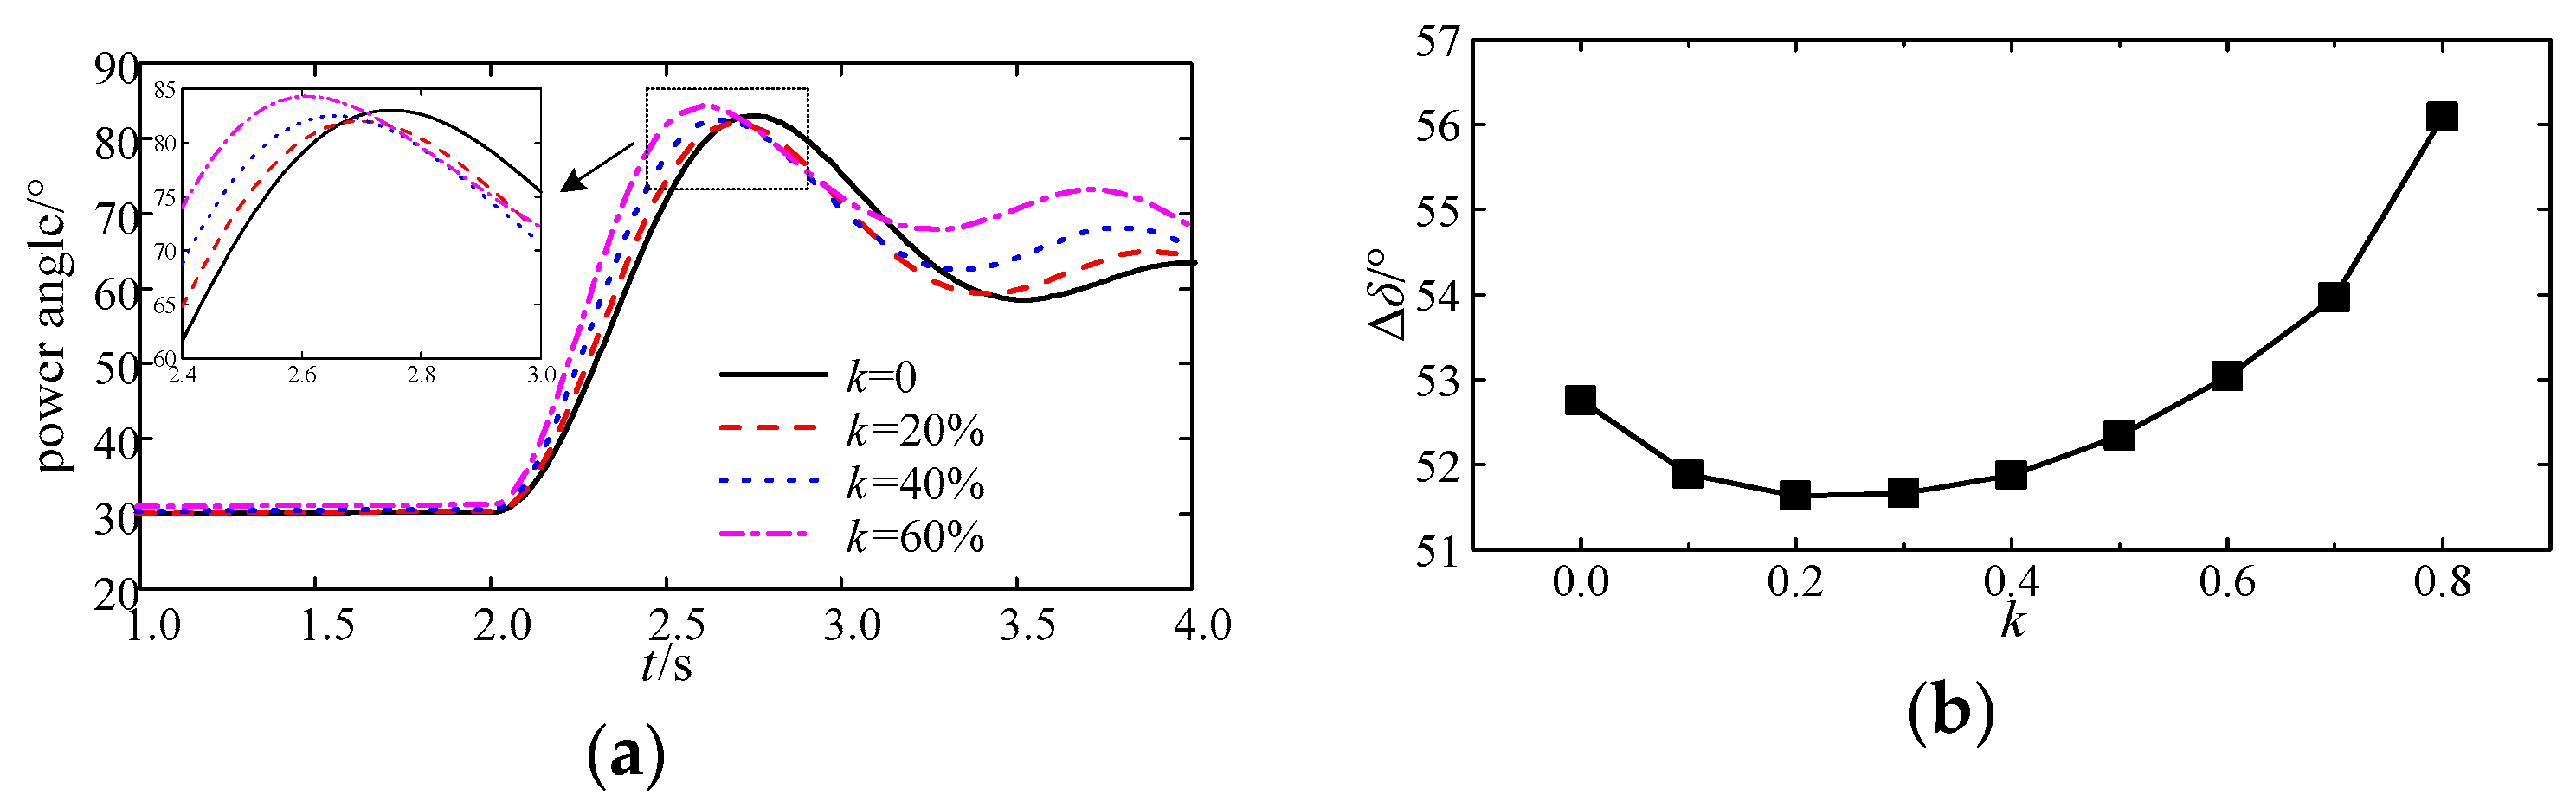
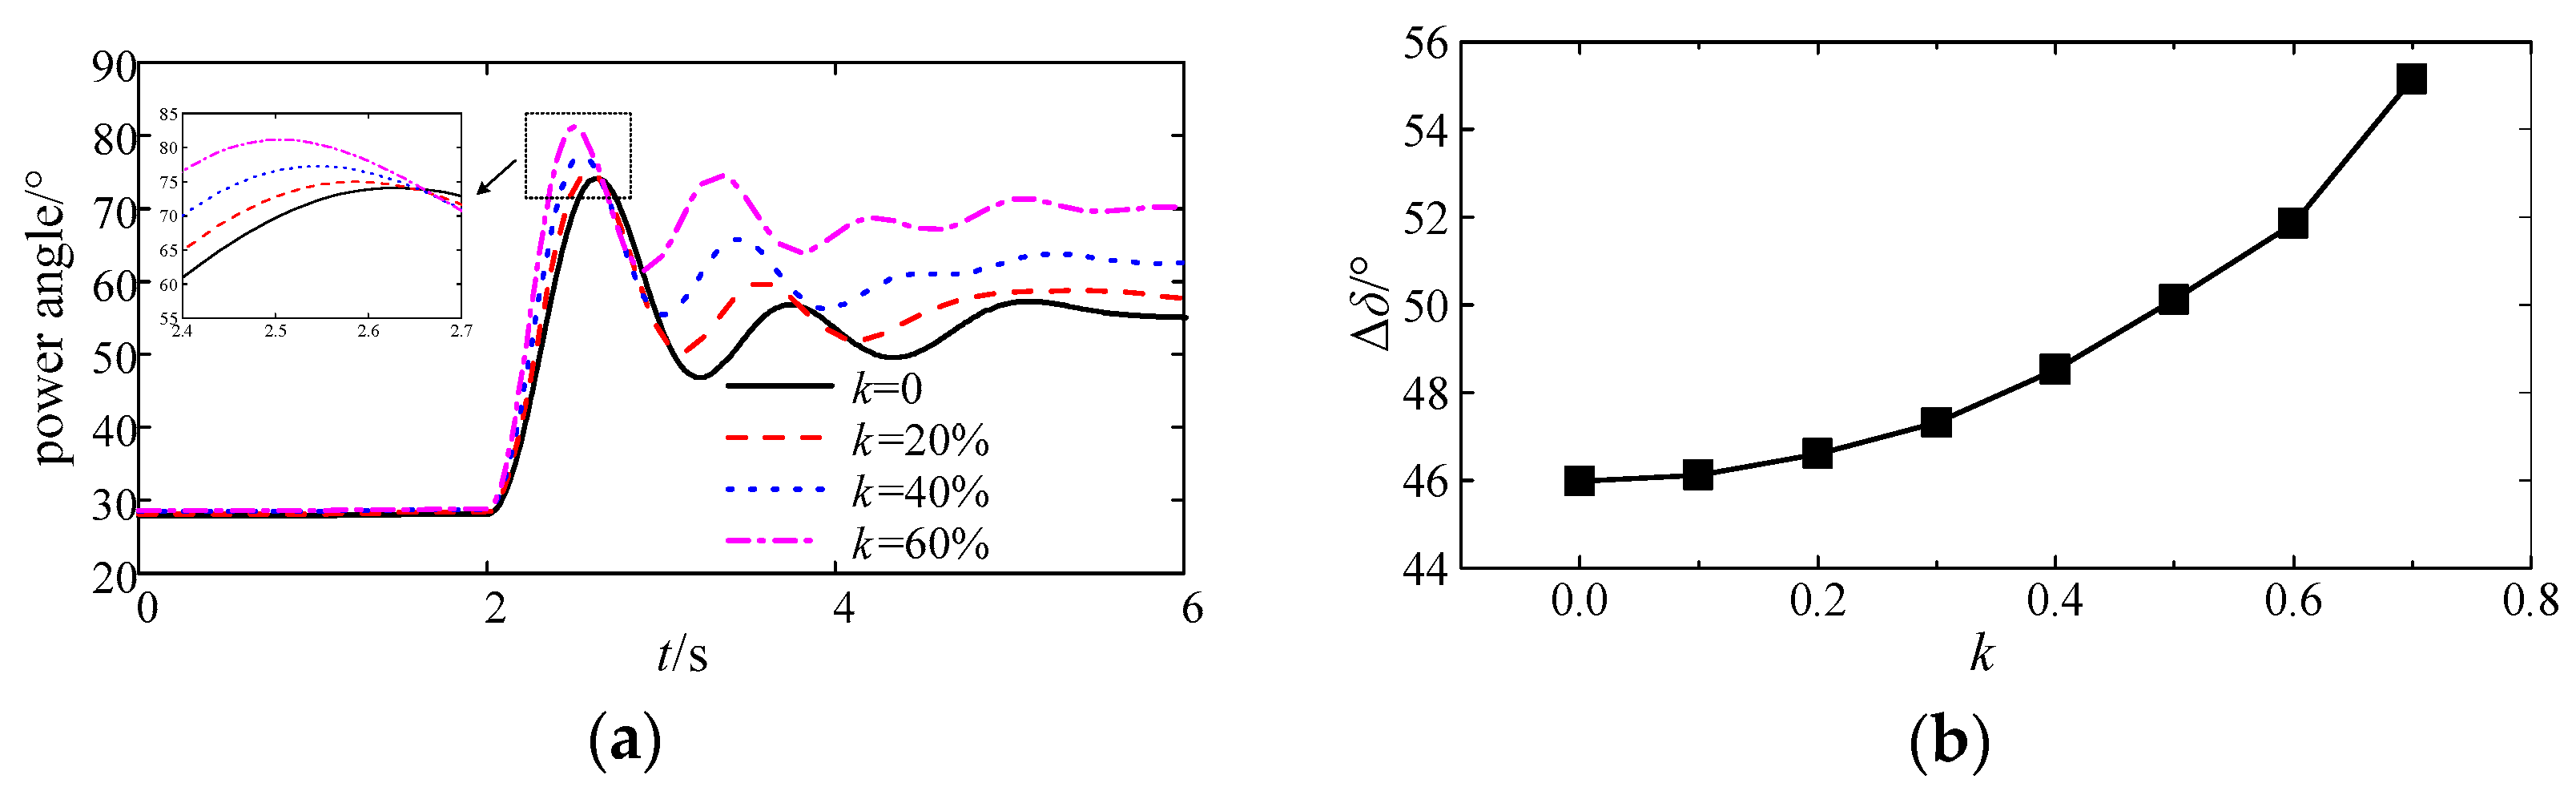
(4) After the three-phase short circuit of the UHVAC lines, the rotor angle stability first improves and then worsens with an increasing wind power penetration ratio. An increase in the UHVDC transmission capacity or a decrease in the reactance of the UHVAC lines will cause the optimal wind power penetration ratio to increase. The optimal wind power penetration ratio increase from 40% to 60% when xL decreases from 0.02 to 0.006 and decreases from 40% to 30% when PD decreases from 3200 MW to 1600 MW.
The results are significant for the planning and operation of wind-thermal-bundled systems. The rotor angle transient stability can be improved by optimizing the structure of the system during the planning, or by adjusting the reactance of the UHVAC lines by TCSC during the operation. In addition, it should be noted that this paper is a qualitative analysis of the variation trend of rotor angle stability and is not a precise quantitative calculation.
The impact of the control schemes of DFIG and UHVDC on rotor angle transient stability is the follow-up task. Optimal control schemes of DFIG and UHVDC for improving rotor angle stability in a wind-thermal-bundled system will be developed in the future. Research results will be reported in later articles.

Acknowledgments

This paper is based on the China National Key Research and Development Plan “Smart Grid and Equipment” (No. 2016YFB0900601) and Project Supported by Science and Technology Foundation of State Grid Corporation of China (XT71-15-066).

Author Contributions

The paper was a collaborative effort between the authors. The authors contributed collectively to the theoretical analysis, modeling, simulation, and manuscript preparation.

Conflicts of Interest

The authors declare no conflict of interest.

Appendix A

The parameters of the DFIG used in this article are presented in Table A1.
Table A1. The parameters of the doubly fed induction generator (DFIG).
ParameterValue
Nominal power1.67 MVA
Rated voltage690 V
Stator to rotor turns ratio0.3
Rated frequency50 Hz
Stator resistance (Rs)0.012 pu
Stator inductance (Ls)0.15 pu (referred to stator)
Rotor resistance (Rr)0.012 pu
Rotor resistance (Lr)0.15 pu (referred to stator)
Mutual inductance (Lm)4 pu
Inertia constant0.0685 pu
DC link rated voltage1200 V
Turbine inertia constant4.32 s
Shaft spring constant1.11 pu
Shaft mutual damping1.5 pu

Appendix B

The structure diagram of the control system of the CIGRE HVDC test model is shown in Figure A1, and the parameters of the CIGRE HVDC control system are presented in Table A2.
Figure A1. The structure diagram of the control system of CIGRE HVDC test model.
Energies 11 00666 g0a1
Table A2. The parameters of the CIGRE HVDC control system.
ParameterValueParameterValue
TUdrmes0.02MaxIr175°
TUdimes0.02 sMinIr30°
TIdimes0.0012 sKIinv0.63
Tγmes0.01 sTIinv0.01524 s
TIdrmes0.0012 sMaxIi110°
RL0.02MinIi30°
γ ord15°KGinv0.7506
Δγord31°TGinv0.0544 s
KIrec1.0989MaxGi90°
TIrec0.01092 sMinGi30°

References

  1. Zhang, S.; Li, X. Large scale wind power integration in China: Analysis from a policy perspective. Renew. Sustain. Energy Rev. 2012, 16, 1110–1115. [Google Scholar] [CrossRef]
  2. Pei, W.; Chen, Y.; Sheng, K.; Deng, W.; Du, Y.; Qi, Z.; Kong, L. Temporal-spatial analysis and improvement measures of Chinese power system for wind power curtailment problem. Renew. Sustain. Energy Rev. 2015, 49, 148–168. [Google Scholar] [CrossRef]
  3. Chen, Z.; Wang, Q.; Ma, S.; Xiang, L.; Wang, N. Study on frequency and voltage regulation strategy of thermal power generating units in wind power uniting thermal power outgoing system. In Proceedings of the 2014 International Conference on Power System Technology (POWERCON), Chengdu, China, 20–22 October 2014; pp. 2529–2536. [Google Scholar]
  4. Hammons, T.J.; Lescale, V.F.; Uecker, K.; Haeusler, M.; Retzmann, D.; Staschus, K.; Lepy, S. State of the Art in Ultrahigh-Voltage Transmission. Proc. IEEE 2012, 100, 360–390. [Google Scholar] [CrossRef]
  5. Hu, B.; Xie, K.; Ta, H. Optimal Reliability Allocation of ±800 kV Ultra HVDC Transmission Systems. IEEE Trans. Power Deliv. 2017. [Google Scholar] [CrossRef]
  6. Zheng, B.; Teng, W.; Han, Y.; Li, Y.; Yang, P.; Xiang, Z.; Ban, L.; Zhan, H. Study on influence and countermeasures of coupling transformer charging inrush current to Hami-Zhengzhou UHVDC project. In Proceedings of the 8th Asia-Pacific Power and Energy Engineering Conference (IEEE PES APPEEC), Xi’an, China, 25–28 October 2016; pp. 1082–1086. [Google Scholar]
  7. Bongiorno, M.; Thiringer, T. A Generic DFIG Model for Voltage Dip Ride-Through Analysis. IEEE Trans. Energy Convers. 2013, 28, 76–85. [Google Scholar] [CrossRef]
  8. Xiang, D.; Turu, J.C.; Muratel, S.M.; Wang, T. On-Site LVRT Testing Method for Full-Power Converter Wind Turbines. IEEE Trans. Sustain. Energy 2016, 8, 395–403. [Google Scholar] [CrossRef]
  9. Vittal, E.; O’Malley, M.; Keane, A. Rotor Angle Stability with High Penetrations of Wind Generation. IEEE Trans. Power Syst. 2012, 27, 353–362. [Google Scholar] [CrossRef]
  10. Gautam, D.; Vittal, V.; Harbour, T. Impact of Increased Penetration of DFIG-Based Wind Turbine Generators on Transient and Small Signal Stability of Power Systems. IEEE Trans. Power Syst. 2009, 24, 1426–1434. [Google Scholar] [CrossRef]
  11. Edrah, M.; Lo, K.L.; Anaya-Lara, O. Impacts of High Penetration of DFIG Wind Turbines on Rotor Angle Stability of Power Systems. IEEE Trans. Sustain. Energy 2015, 6, 759–766. [Google Scholar] [CrossRef]
  12. Nunes, M.V.A.; Lopes, J.A.P.; Zurn, H.H.; Bezerra, U.H.; Almedia, R.G. Influence of the variable-speed wind generators in transient stability margin of the conventional generators integrated in electrical grids. IEEE Trans. Energy Convers. 2004, 19, 692–701. [Google Scholar] [CrossRef]
  13. Meegahapola, L.; Flynn, D. Impact on transient and frequency stability for a power system at very high wind penetration. In Proceedings of the 2010 IEEE Power and Energy Society General Meeting (PES-GM), Minneapolis, MN, USA, 25–29 July 2010; pp. 1–8. [Google Scholar]
  14. Yu, C.; James, G.; Xue, Y.; Xue, F. Impacts of large scale wind power on power system transient stability. In Proceedings of the 4th International Conference on Electric Utility Deregulation and Restructuring and Power Technologies (DRPT), Weihai, China, 6–9 July 2011; pp. 277–283. [Google Scholar]
  15. Mu, P.; Zhao, D.; Wang, J. Influence Mechanism Analysis of Large-scale Wind Power Integration on Power System Angle Stability. Proc. CSEE 2017, 37, 1324–1332. [Google Scholar] [CrossRef]
  16. Wang, Q.; Xue, A.; Bi, T.; Zheng, Y. Impact of DFIG-based Wind Farm on Transient Stability of Single Machine Infinite Bus System. In Proceedings of the 5th Asia-Pacific Power and Energy Engineering Conference (IEEE PES APPEEC), Hongkong, China, 12–14 July 2013; pp. 1–6. [Google Scholar]
  17. Guo, X.; Zhao, L.; Tang, Y.; Shen, H. Study on angle transient stability for wind-thermal-bundled power transmitted by AC/DC system. Proc. CSEE 2013, 33, 19–25. [Google Scholar] [CrossRef]
  18. Tang, Y.; Zhao, L.; Guo, X. Impact on wind power penetration on angle transient stability of wind-thermal combined system. Autom. Electr. Power Syst. 2013, 37, 34–40. [Google Scholar] [CrossRef]
  19. Hu, H.; Jiang, Y.; Wang, D.; Ge, Y.; Zhou, C. Simulation analysis on “9.19” ±800 KV Jinpin-Suzhou DC bipolar block fault. In Proceedings of the 2016 China International Conference on Electricity Distribution (CICED), Xi’an, China, 10–13 August 2016; pp. 1–5. [Google Scholar]
  20. Chen, D.; Ma, S.; Song, Y.; Wang, N.; Fang, P.; Ren, J. Research on transient stability under HVDC block fault in wind-thermal-bundled power base transmitted by AC/DC system. In Proceedings of the 2014 International Conference on Power System Technology (POWERCON), Chengdu, China, 20–22 October 2014; pp. 2884–2890. [Google Scholar]
  21. Tian, X.; Wang, N.; Chi, Y.; Li, G.; Tang, H.; Li, Y. Performances of DFIG-based Wind Turbines During System Fault and Its Impacts on Transient Stability of Power Systems. Autom. Electr. Power Syst. 2015, 39, 16–21. [Google Scholar] [CrossRef]
  22. Ackermann, T. Wind Power in Power Systems, 2nd ed.; Wiley: West Sussex, UK, 2012; pp. 254–259. ISBN 9780470974162. [Google Scholar]
  23. Rashid, G.; Ali, M.H. Nonlinear Control-Based Modified BFCL for LVRT Capacity Enhancement of DFIG-Based Wind Farm. IEEE Trans. Energy Convers. 2017, 32, 284–295. [Google Scholar] [CrossRef]
  24. IEC Standard 61400-27-1. 2015. Available online: https://webstore.iec.ch/publication/21811 (accessed on 13 February 2015).
  25. Faruque, M.O.; Zhang, Y.; Dinavahi, V. Detailed modeling of CIGRE HVDC benchmark system using PSCAD/EMTDC and PSB/SIMULINK. IEEE Trans. Power Deliv. 2006, 21, 378–387. [Google Scholar] [CrossRef]
  26. CIGRE Working Group 14.02. The CIGRE HVDC Benchmark Model—A New Proposal with Revised Parameters. Electra 1994, 157, 61–66. [Google Scholar]
  27. Zhao, W. HVDC Transmission Projects Technology; China Electric Power Press: Beijing, China, 2004; pp. 17–18 & 165–170. ISBN 7508319990. [Google Scholar]
  28. Zheng, C.; Tang, Y.; Ma, S.; Wang, H.; Fu, X.; Sheng, C.; Luo, L.; Lin, J.; Xue, J.; Qin, X.; et al. Study on the Dynamic Reactive Power Characteristic of HVDC Rectifier Stations and Optimization Measures. Proc. CSEE 2014, 34, 4886–4896. [Google Scholar] [CrossRef]
  29. Kundur, P.; Balu, N.J.; Lauby, M.G. Power System Stability and Control; McGraw-Hill Inc.: New York, NY, NSA, 1994; pp. 17–19. ISBN 9780070359581. [Google Scholar]
Figure 1. Diagram of the single-ended power transmission system: (a) Structural schematic diagram; and (b) Equivalent circuit diagram.
Energies 11 00666 g001
Figure 2. Diagram of a typical wind-thermal-bundled system during normal operation: (a) Structural schematic diagram; and (b) Equivalent circuit diagram.
Energies 11 00666 g002
Figure 3. Transient response characteristics of a wind farm: (a) Voltage of wind farm integration point; and, (b) Active and reactive power of wind farm.
Energies 11 00666 g003
Figure 4. Transient response characteristics of ultra-high voltage alternatingcurrent (UHVDC): (a) UD and PD; (b) Reactive power exchange between rectifier and system.
Energies 11 00666 g004
Figure 5. Electromagnetic power characteristics of thermal power units at different wind power penetration ratios.
Energies 11 00666 g005
Figure 6. Equivalent circuit diagram of a typical wind-thermal-bundled system after an UHVDC block.
Energies 11 00666 g006
Figure 7. Simulation results of a typical wind-thermal-bundled system under an UHVDC block: (a) UD and active power of UHVAC lines; (b) Pw and Qw.
Energies 11 00666 g007
Figure 8. Influence of wind power penetration ratio on acceleration and deceleration area after an UHVDC block.
Energies 11 00666 g008
Figure 9. Equivalent circuit diagram of a typical wind-thermal-bundled system: (a) During a short circuit; and (b) After a short circuit.
Energies 11 00666 g009
Figure 10. Influence of wind power penetration ratio on acceleration and deceleration area after a short circuit of UHVAC lines: (a) 0 < k ≤ n; (b) n ≤ k < 1.
Energies 11 00666 g010
Figure 11. Curve of rotor angle under an UHVDC block of a typical wind-thermal-bundled system when PD is 3200 MW and xL is 0.02: (a) k ≤ 30%; (b) k ≥ 30%.
Energies 11 00666 g011
Figure 12. Maximum rotor angle difference of a typical wind-thermal-bundled system under an UHVDC block when PD is 3200 MW and xL is 0.02.
Energies 11 00666 g012
Figure 13. Simulation results under an UHVDC block of a typical wind-thermal-bundled system when PD is 3200 MW and xL is 0.005: (a) Curves of rotor angle; (b) Maximum rotor angle difference.
Energies 11 00666 g013
Figure 14. Maximum rotor angle difference of a typical wind-thermal-bundled system under an UHVDC block when PD is 2400 MW and xL is 0.02.
Energies 11 00666 g014
Figure 15. Curve of rotor angle under a short-circuit of a typical wind-thermal-bundled system when PD is 3200 MW and xL is 0.02: (a) k ≤ 40%; and (b) k ≥ 40%.
Energies 11 00666 g015
Figure 16. Structural schematic diagram of an actual wind-thermal-bundled system in China’s Northwest Power Grid.
Energies 11 00666 g016
Figure 17. Simulation results under an UHVDC monopolar block of an actual wind-thermal-bundled system: (a) Curve of rotor angle; and (b) Maximum rotor angle difference.
Energies 11 00666 g017
Figure 18. Simulation results under an UHVDC block of an actual system when xL is decreased by (thyristor-controlled series compensation) TCSC: (a) Curve of rotor angle; and (b) Maximum rotor angle difference.
Energies 11 00666 g018
Figure 19. Curve of rotor angle under a short circuit of an actual wind-thermal-bundled system.
Energies 11 00666 g019
Table 1. Simulation results under a short-circuit of a typical wind-thermal-bundled system when PD is 3200 MW and xL is 0.02.
k (%)PS (MW)Pw (MW) δ 0 (°) δ max (°) Δ δ (°)CCT (s)
06000065.085892.785827.69990.110
10540060065.389589.599824.21030.116
204800120065.479686.382120.90250.118
304200180065.623185.115019.49190.120
403600240065.643284.365618.72240.126
503000300065.798284.777119.97890.118
602400360066.075387.201921.12660.112
701800420066.742289.360622.61840.108
801200480067.084693.014425.92980.106
Table 2. Simulation results under a short-circuit of a typical wind-thermal-bundled system when xL is 0.01 and 0.006.
k (%)xL = 0.01xL = 0.006
δ 0 (°) δ max (°) Δ δ (°) δ 0 (°) δ max (°) Δ δ (°)
061.426379.419817.993560.054473.574713.5203
1061.684777.644215.959560.243372.403112.1598
2061.763875.417713.653960.285471.289311.0039
3061.805475.010513.205160.325970.933810.6079
4061.879274.674712.795560.495870.40539.9095
5062.072174.086512.014460.702170.34489.6427
6062.270174.625812.355760.949970.51499.5650
7062.479375.373312.894061.347271.14959.8023
8063.292876.614013.321262.120172.316210.1961
Table 3. Simulation results under a short-circuit of a typical wind-thermal-bundled system when PD is 1600 MW and xL is 0.02.
k (%)PS (MW)Pw (MW) δ 0 (°) δ max (°) Δ δ (°)
06000075.9902113.247537.2573
10540060076.1727109.970833.7981
204800120076.2873106.444230.1569
304200180076.5496104.951228.4016
403600240076.6393105.119628.4803
503000300076.9120106.532229.6202
602400360077.1247107.821530.6968
701800420077.2904UnstableUnstable
Table 4. Simulation results under a short circuit of an actual wind-thermal-bundled system.
k (%)PS (MW)Pw (MW) δ 0 (°) δ max (°) Δ δ (°)CCT (s)
06000030.270576.514246.24370.136
10540060030.311473.620643.30920.140
204800120030.371271.669041.29780.144
304200180030.432973.727043.29410.134
403600240030.629874.383343.75350.126
503000300030.831274.613043.78180.116
602400360031.285876.138544.85270.104
701800420032.4648UnstableUnstable0.094
Table 5. Simulation results under a short circuit of an actual wind-thermal-bundled system when xL is decreased by TCSCs.
k (%)PS (MW)Pw (MW) δ 0 (°) δ max (°) Δ δ (°)CCT (s)
06000015.635054.038038.40300.142
10540060016.233752.732136.49840.144
204800120017.036651.932734.89610.148
304200180017.568420.713133.14470.152
403600240018.047252.328834.28160.148
503000300018.210654.221136.01050.146
602400360018.482956.993338.51040.140
701800420019.362658.205138.84250.136

