Article

Experimental Study on Breakdown Characteristics of Transformer Oil Influenced by Bubbles

1
School of Electrical Engineering, Northeast Electric Power University, No. 169 Changchun Road, Jilin 132012, China
2
Hebei Provincial Key Laboratory of Power Transmission Equipment Security Defense, North China Electric Power University, No. 619 North of Yonghua Street, Baoding 071003, China
*
Author to whom correspondence should be addressed.
Energies 2018, 11(3), 634; https://doi.org/10.3390/en11030634
Submission received: 30 January 2018 / Revised: 7 March 2018 / Accepted: 9 March 2018 / Published: 13 March 2018
(This article belongs to the Special Issue Engineering Dielectric Liquid Applications)

Abstract

:
Bubbles will reduce the electric strength of transformer oil, and even result in the breakdown of the insulation. This paper has studied the breakdown voltages of transformer oil and oil-impregnated pressboard under alternating current (AC) and direct current (DC) voltages. In this paper, three types of electrodes were applied: cylinder-plan electrodes, sphere-plan electrodes, and cone-plan electrodes, and the breakdown voltages were measured in both no bubbles and bubbles. The sphere-sphere electrodes were used to study the breakdown voltage of the oil-impregnated pressboard. The results showed that under the influence of bubble, the breakdown voltage of the cylinder-plan electrode dropped the most, and the breakdown voltage of the cone-plan electrode dropped the least. The bubbles motion was the key factor of the breakdown. The discharge types of the oil-impregnated pressboard were different with bubbles, and under DC, the main discharge type was flashover along the oil-impregnated pressboard, while under AC, the main discharge type was breakdown through the oil-impregnated pressboard.

1. Introduction

Mineral transformer oil is the main dielectric liquid for engineering application, and the oil and pressboard insulation system is widely used in high voltage electric power equipment manufacturing [1]. High-voltage DC projects are being developed in China now [2], and the AC and DC high voltages will be applied to the insulation of the converter transformer. The primary insulation of the converter transformer is also oil and pressboard insulation [3]. Bubbles will decrease the electrical strength of the oil-pressboard insulation, and will cause a partial discharge in the oil, finally resulting in the insulation breaking down due to the accumulation of the bubbles. Therefore, the bubbles are a key factor that affects the breakdown voltages of the oil-pressboard insulation [4].
Since the liquid discharge is so complex, there is no physical interpretation for all time and space stages of the development of the liquid discharge [5]. There is also no absolutely pure oil in engineering. Due to manufacturing, transportation, and other reasons, there will be some bubbles and particles in the oil. The generation progress of moisture in the mineral oil-impregnated pressboard has been studied previously. The oil-impregnated pressboard contains moisture, which will be released to the oil generally and, especially under high temperatures, the moisture is released quickly from the pressboard into the oil in the form of gas bubbles [6]. Researchers have studied the bubble-generating mechanism in oil-pressboard insulation of transformers. Heinrichs [7] discussed gas-evolving mechanisms in oil, pressboard, and combinations of oil and pressboard. Some models approximating the hot-spot configuration were designed to study the critical mechanisms under conditions that were approaching service overloads. A maximum transformer overload temperature was recommended from the results of this study. Kaufmann and McMillen also performed similar studies [8]. Oommen [9] has given an initial mechanism of bubble evolution and an equation to obtain bubble evolution temperatures. Koch and Tenbohlen [10] have studied the formation of bubbles in oil-paper insulating systems. The results showed that bubbles greatly reduce the dielectric withstand strength of the oil. Water accelerates the aging of the oil-paper insulation, decreases its dielectric strength, and generates bubbles at high temperatures. The bubbles will be harmful to transformer operation if the water content in the pressboard is above 2%. Przybylek et al. [11,12,13] have studied that it is easier to generate the bubbles in ageing paper than in new paper at a high temperature. Perkasa et al. [14] have studied the evolution of bubbles in vegetable oil-impregnated pressboard.
The behavior of bubbles plays an important role in the breakdown of the dielectrics. Sharbaugh et al. [15] suggested that breakdown occurs in the bubbles and the bubbles may be produced by the electronic progress. Ogata et al. [16] have found that the bubbles’ size will decrease with the strength of the electric field, and the generation of an electrohydrodynamic (EHD) flow of the liquid will affect not only the movement of the bubble, but also the bubble evolution mechanism. Hara et al. [17] have studied the thermal bubble deformation and indicated that the breakdown voltages are close to the bubble behavior with pulse voltages. Seok et al. [16] have indicated that the bubbles’ behavior was affected by a 60 Hz electric field and pressure, and the groove generated the bubbles’ stream. In [18], Hara and Kubuki have suggested that a partial discharge might occur in the bubble before breakdown, if the bubble size is as large as 0.5 mm. In [19], Hara et al. have studied that the gradient force and Maxwell stress strongly affect the bubble dynamics and bubble shape in the gap, and the electric forces that are applied on the bubble lead to a lesser effect of the bubble on the breakdown voltage.
From the above discussion, the oil-paper insulation can generate the bubbles, which will decrease the electrical strength of the insulation. Most studies have been aimed at the bubble-generating mechanism and bubble behavior in the discharge of liquid nitrogen and helium, yet, there are few breakdown characteristics of transformer oil with the bubbles. Therefore, in this work, breakdown voltages of transformer oil and the oil-impregnated pressboard with the bubbles were studied under 50 Hz AC and positive DC power supplies.

2. Experimental Methods

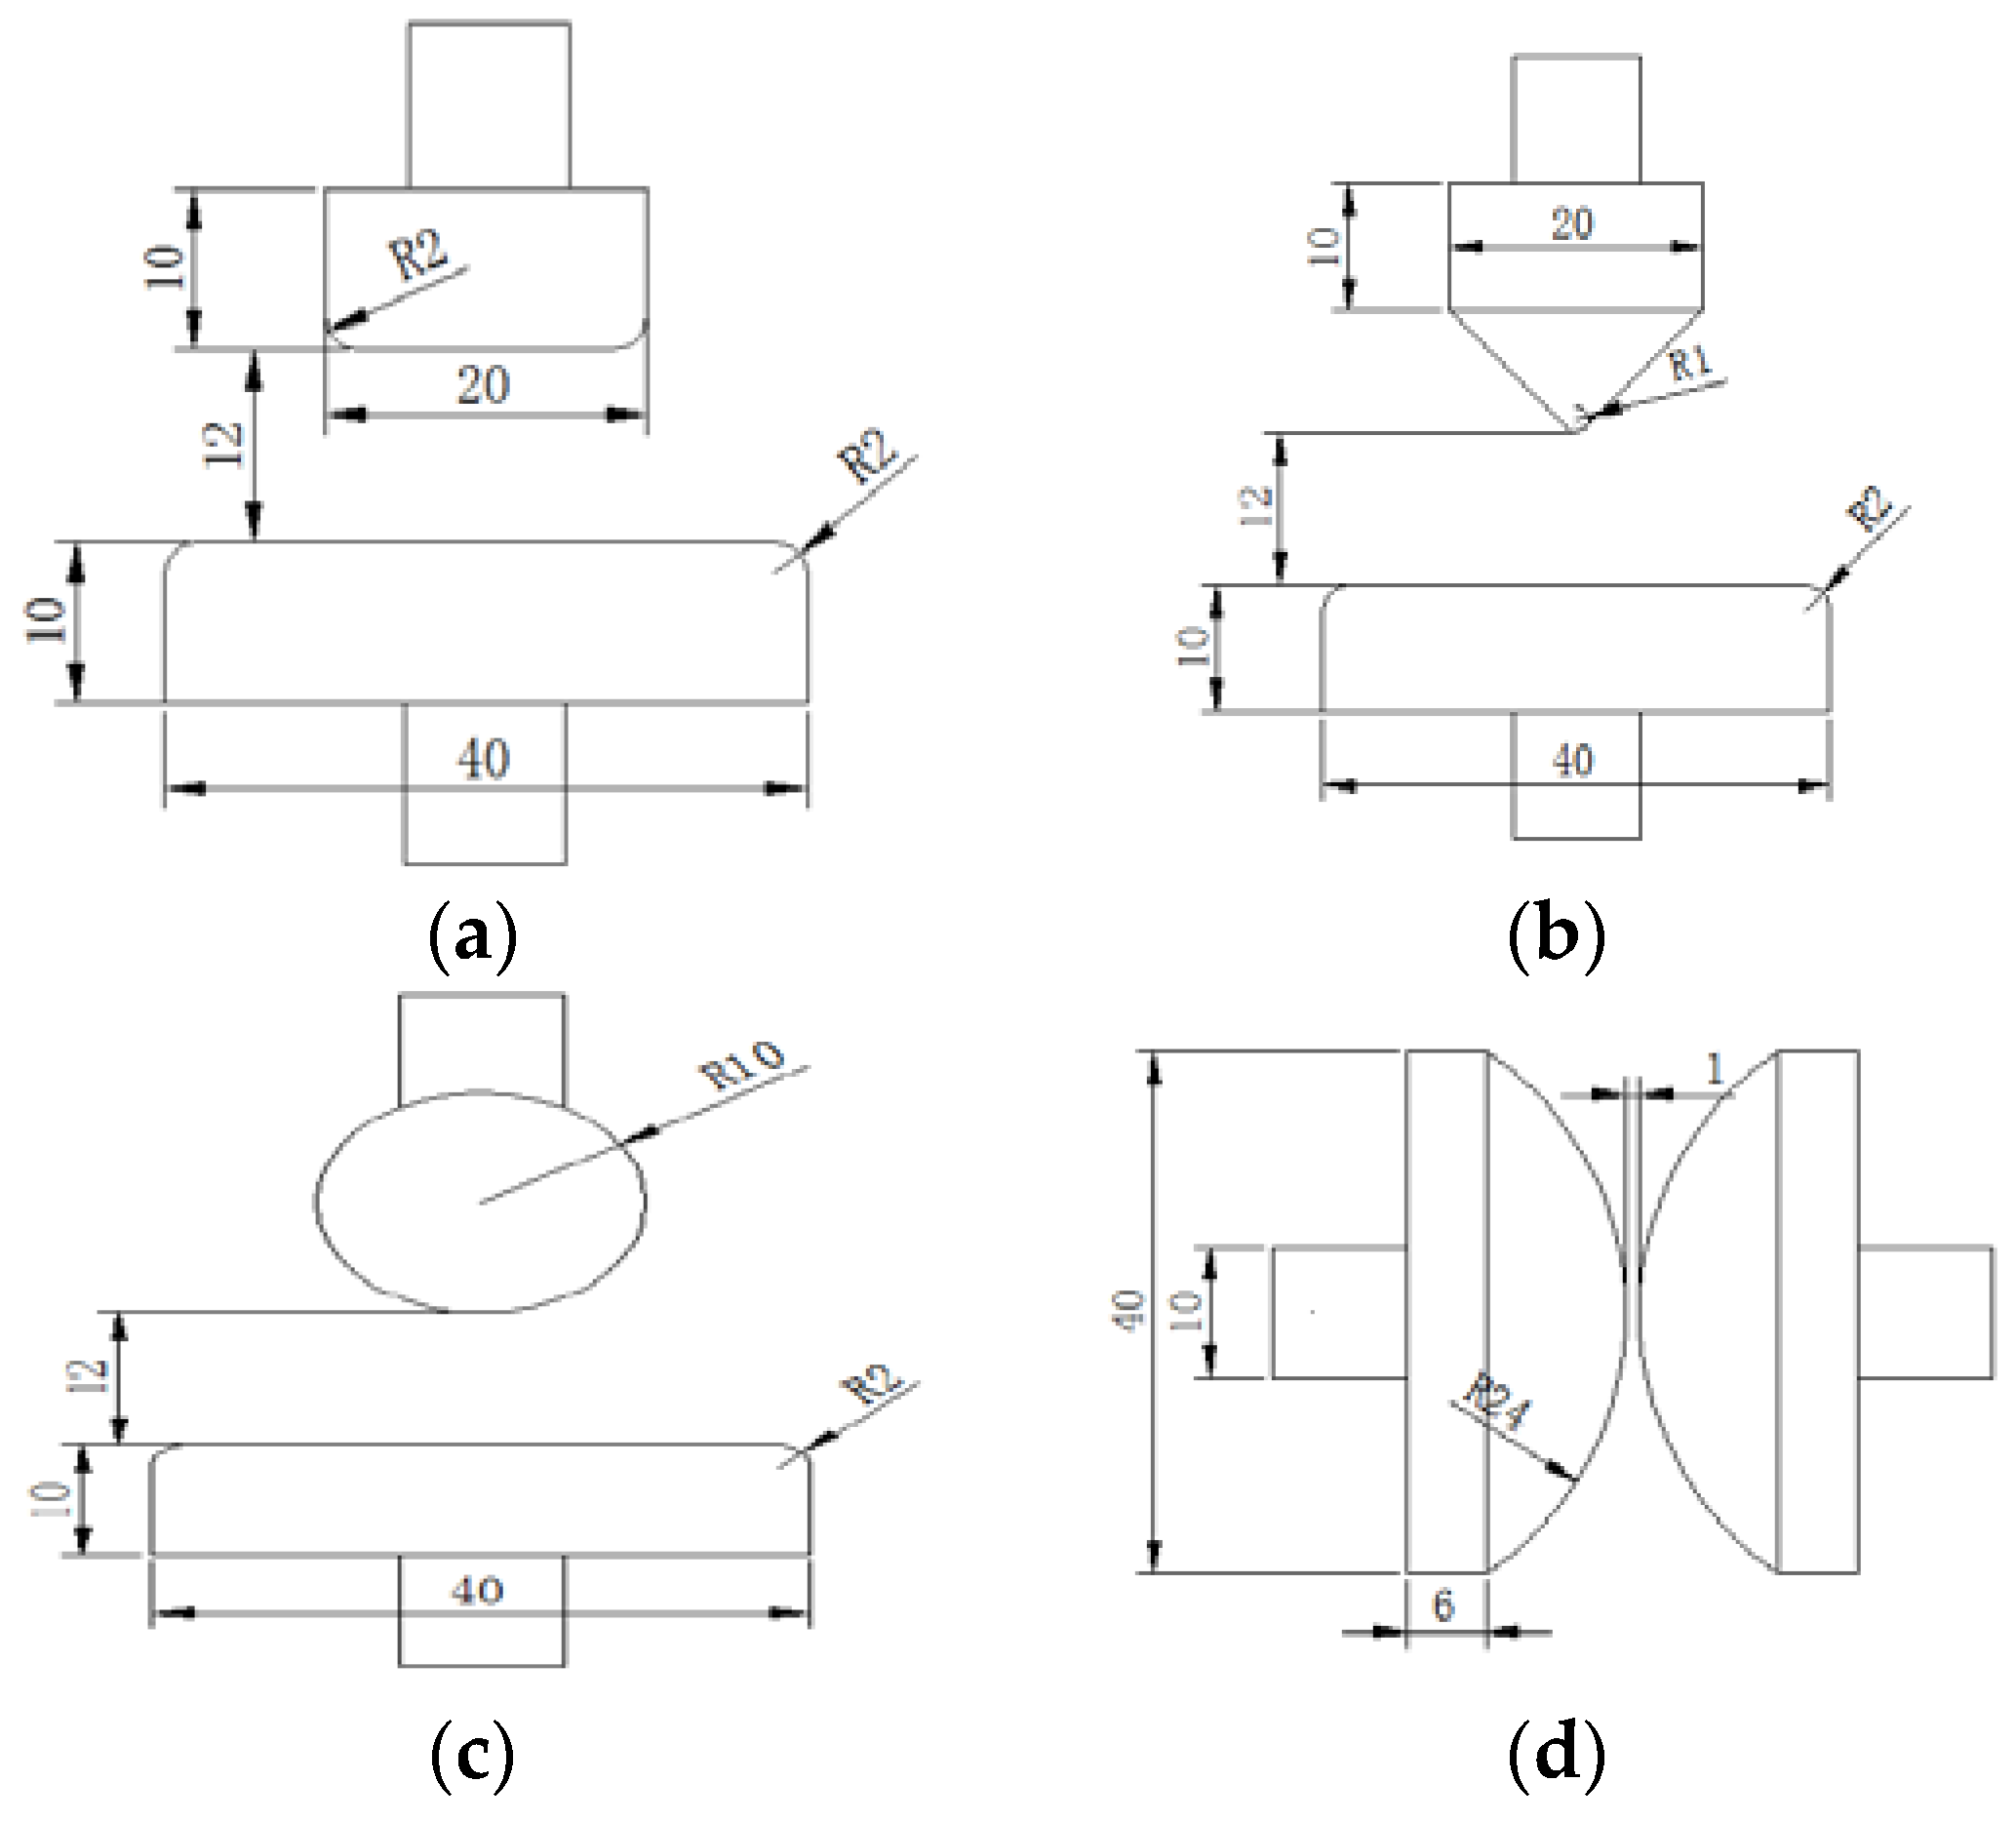
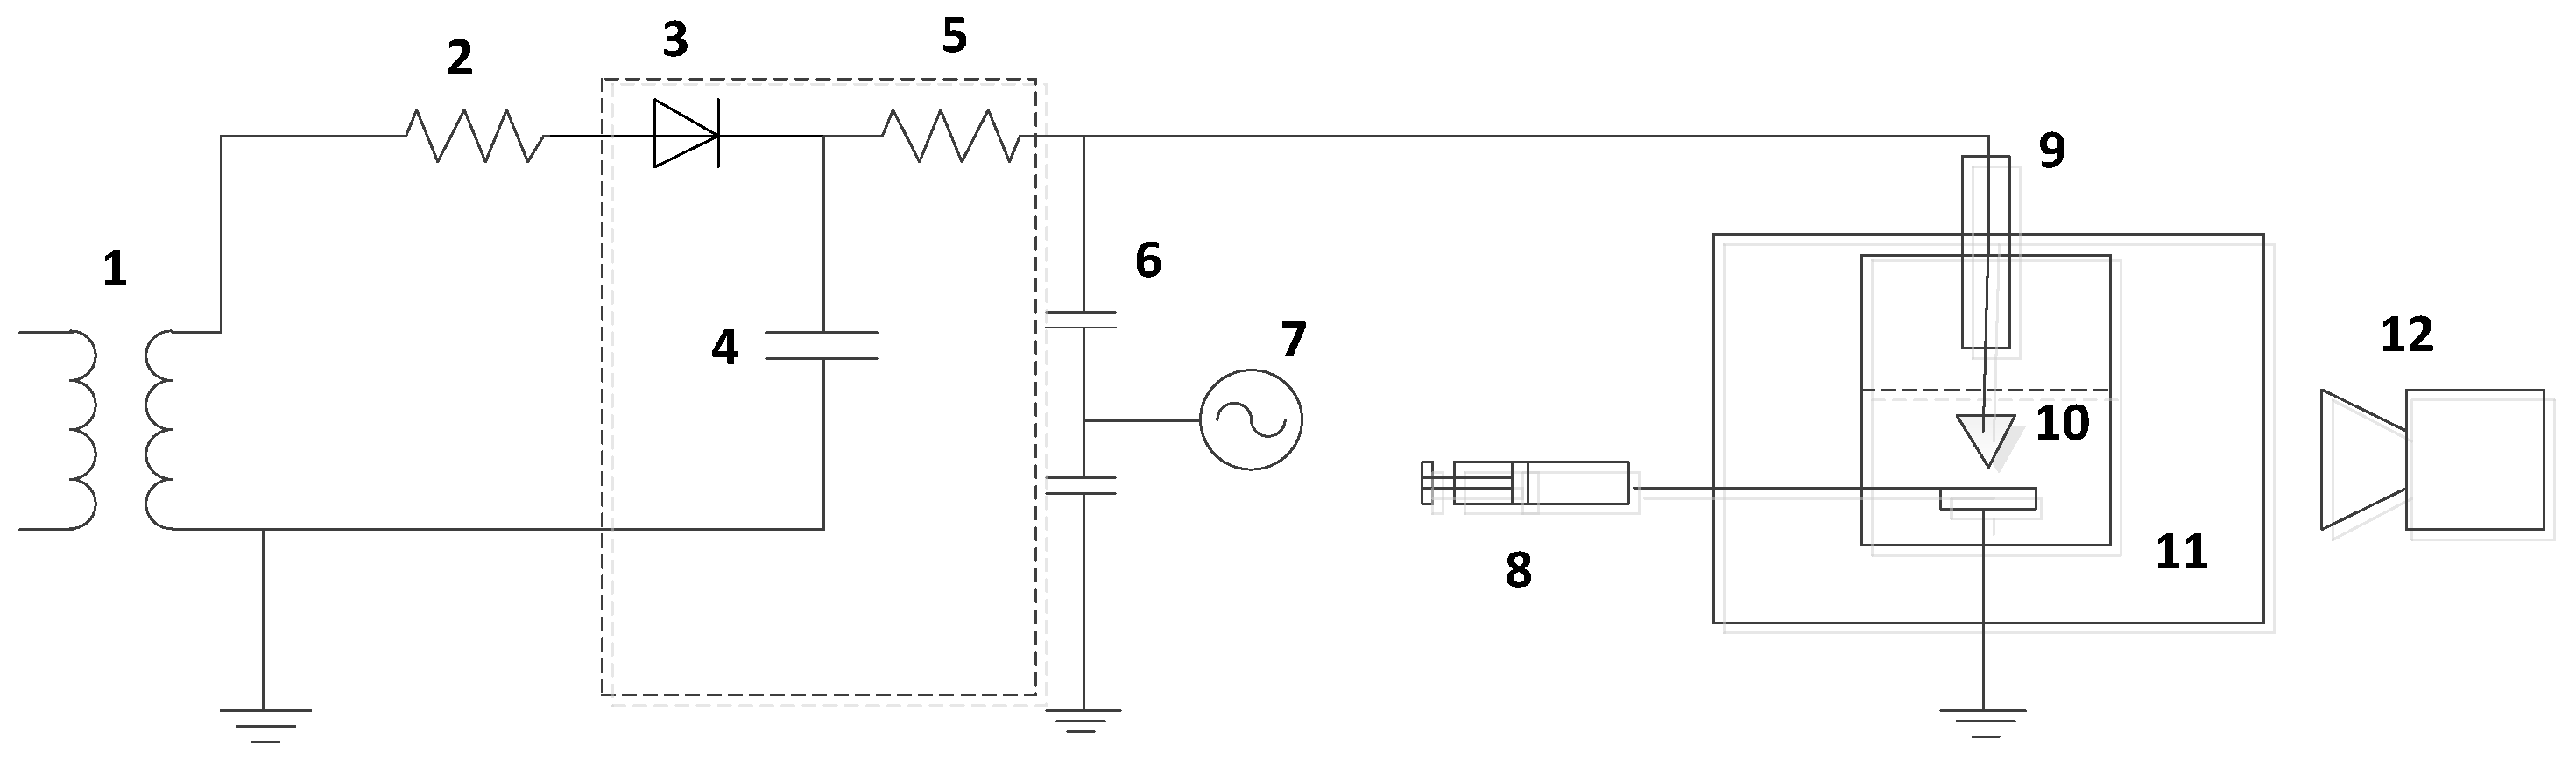
2.1. Experimental System

The experimental system included the power supply (50 Hz AC and DC), oscilloscope, vacuum test chamber, and high-speed camera, as shown in Figure 1. Where 1 is the 50 Hz power frequency testing transformer, 2 and 5 are protected resistors, 3 is a HV diode, 4 is a HV capacitor, 6 is the potential divider, 7 is the oscilloscope, 8 is a syringe, 9 is a bushing, 10 is the electrode system that was immersed in the oil tank with dimensions of 35 cm × 20 cm × 20 cm, 11 is the vacuum test chamber (the dimensions of the vacuum test chamber are 60 cm × 50 cm × 40 cm), and 12 is high-speed camera, and the model of the high-speed camera is FASTEC-IL5, produced by Rocky Mountain High Speed, with a frame rate of 1000 frames per second.
The test oil was KI 25X transformer oil, and the main characteristics are shown in Table 1. The size of the oil-impregnated pressboard is 50 mm × 35 mm, and the thickness of the pressboard is 1 mm. The pressboard was soaked in the oil for more than 24 h, and then the oil in the pressboard reached the saturation state. From the Oommen curve [20], the water content of the oil-impregnated pressboard is 6%. The size of the electrodes is shown as Figure 2, and the material of the electrodes is brass. The distribution of the electric field will influence the bubbles’ movement, so we designed the cone-plan electrodes to study the extremely non-uniform field, and as is known, in the transformer insulation, a more uniform electric field is the typical one, so we select the other two electrode systems (cylinder-plan electrodes and sphere-plan electrodes) in order to study the relative uniform electric fields. The sphere-sphere electrodes (a typical relative uniform electric field) was used for the investigation of the breakdown voltage of the pressboard.

2.2. Test Method

2.2.1. The Breakdown of the Oil

The tests were carried out at a high voltage experimental hall which is about 40 m × 20 m × 6 m, and the test method is as follows:
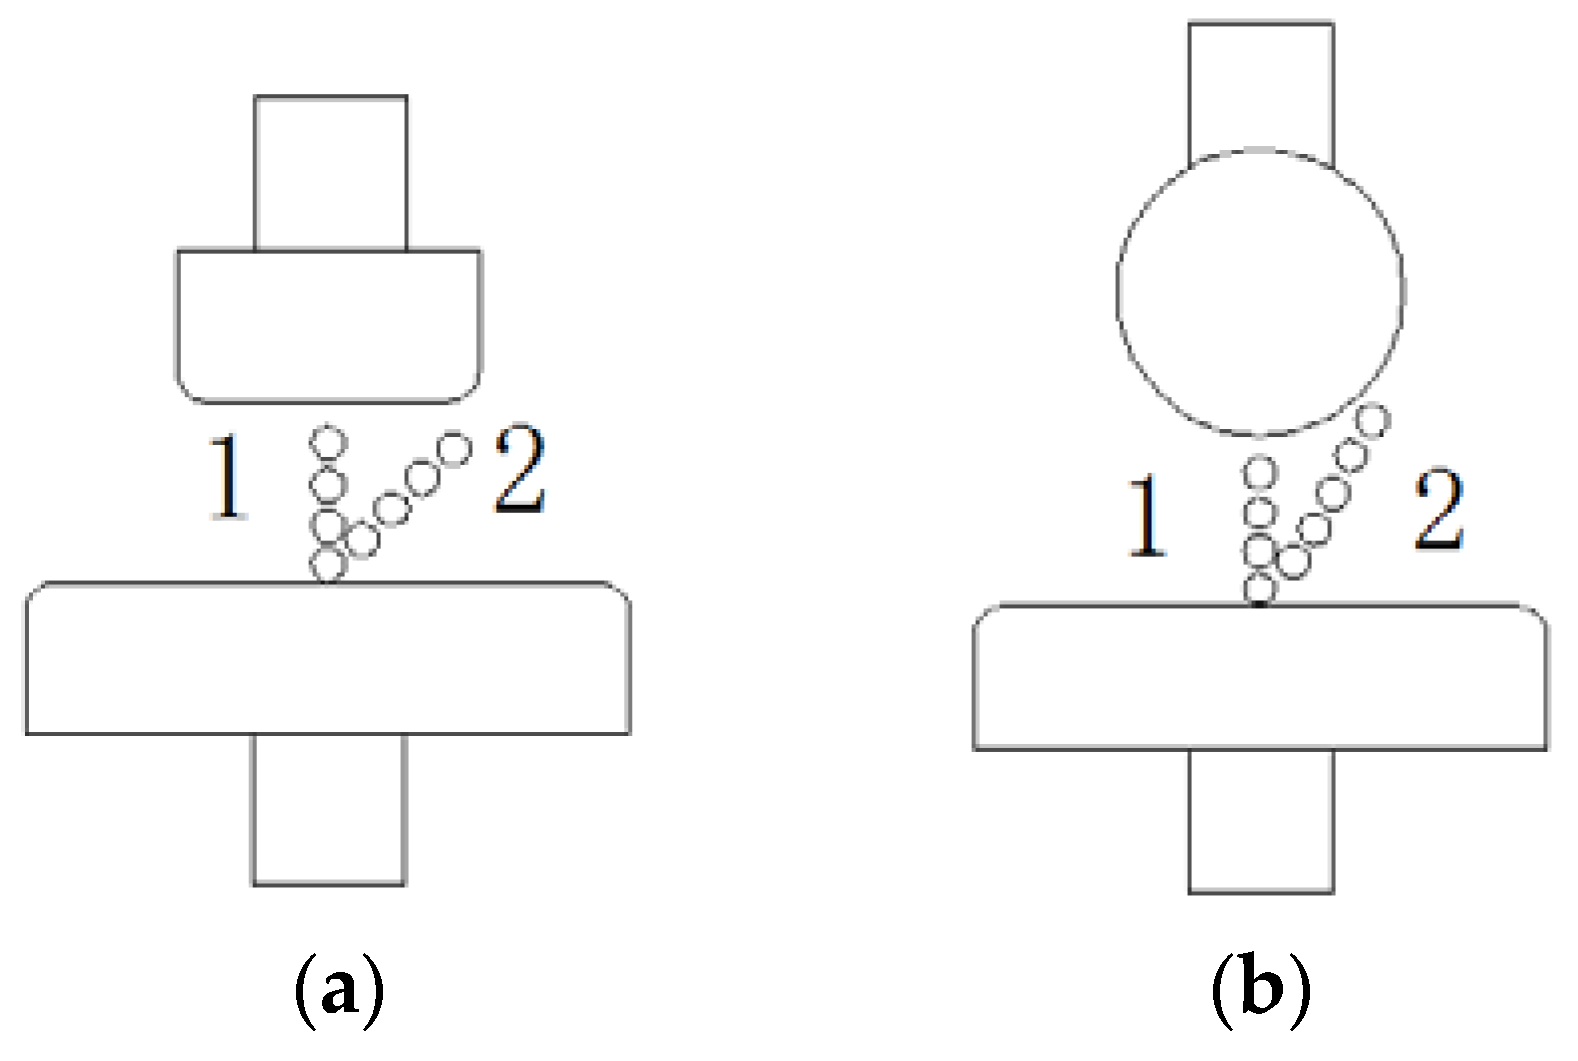
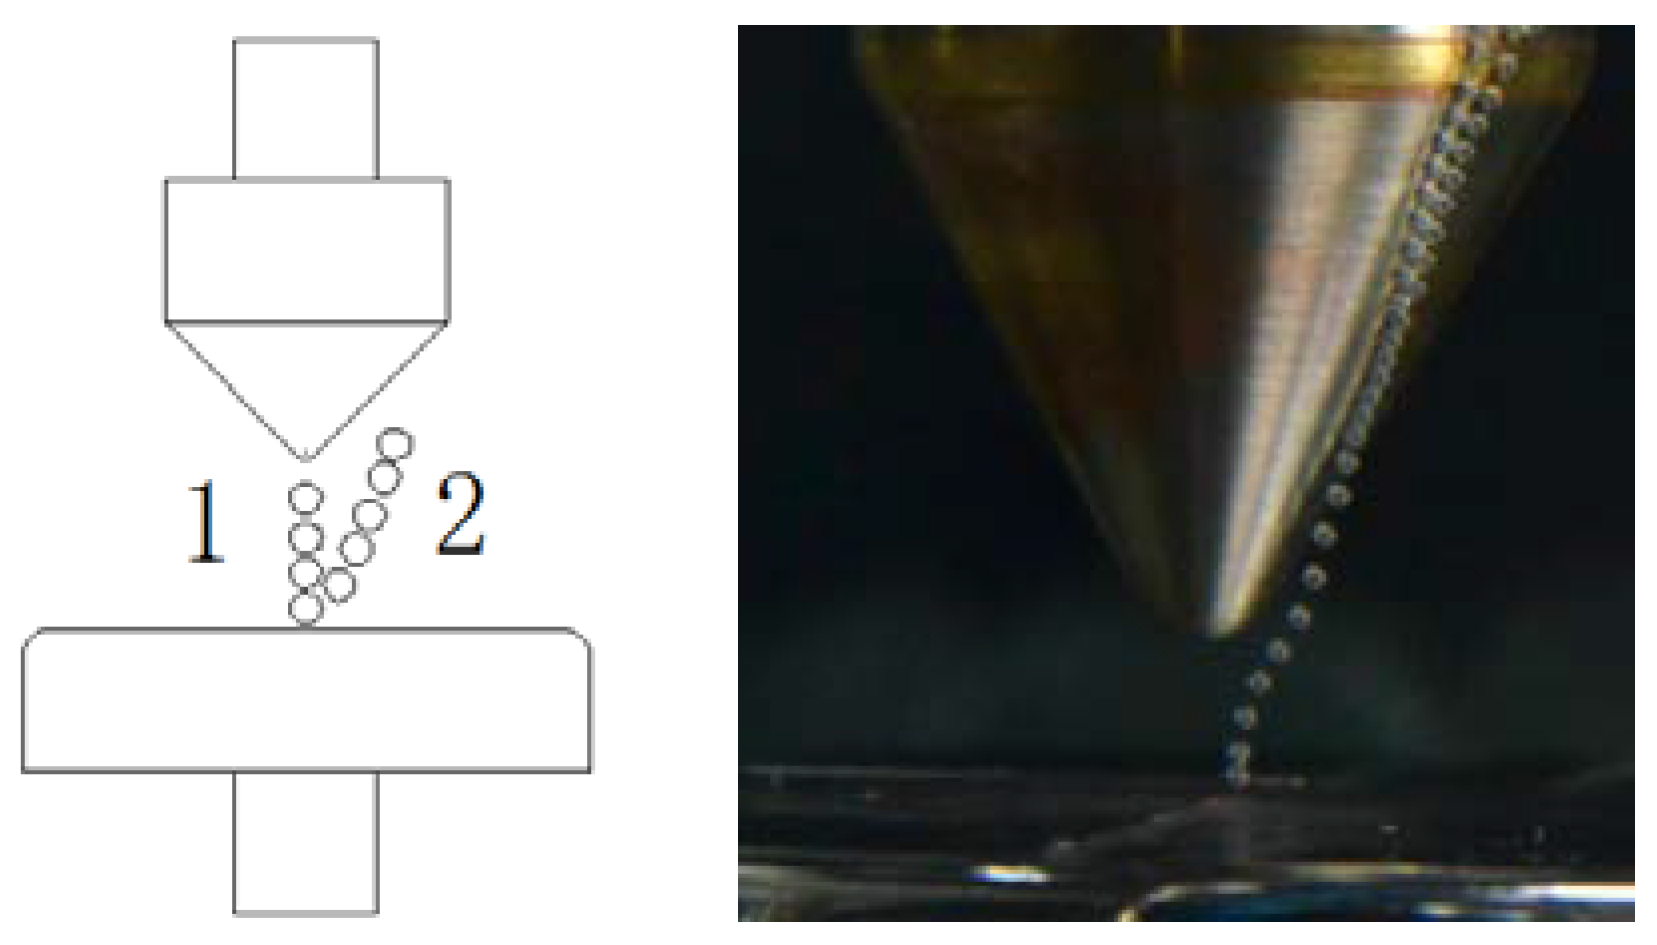
  • Before voltage was applied, about 7 L of initial oil was put into the electrode systems, and the oil’s surface is 5 cm above the electrodes. After 30 min’ standing, the bubbles were injected by a syringe at a speed of three bubbles per second, and the bubbles linked the two electrodes. The bubbles were injected all the time until the breakdown occurred.
  • Then, AC or DC voltages were applied on the electrodes at the rate of voltage rise of 1 kV/s until breakdown of the oil. We then waited 0.5 h.
  • We changed the oil and repeated the tests.
  • All of the discharges were recorded by the high-speed camera.

2.2.2. The Breakdown of the Oil-Impregnated Pressboard

The sphere-sphere electrodes were selected to study the breakdown voltages of the oil-impregnated pressboard. Before the tests, the oil-impregnated pressboard was put between the two electrodes and we injected the oil into the electrode system. The surface of the oil is one centimeter taller than the electrodes, so the entire discharge system was immersed in oil.
  • AC or DC voltages were applied on the electrodes and the rate of voltage rise was 1 kV/s until breakdown. We changed the pressboard, mixed the oil, and then waited 0.5 h.
  • Using a vacuum to reduce air pressure to 100 Pa, the bubbles appeared on the oil-impregnated pressboard. AC or DC voltages were applied to the electrodes and the rate of voltage rise was 1 kV/s until breakdown of the insulation.
  • We mixed the oil, changed the oil-impregnated pressboard, and repeated steps 1 and 2.
  • All of the discharges were recorded by the high-speed camera.

3. Results and Discussion

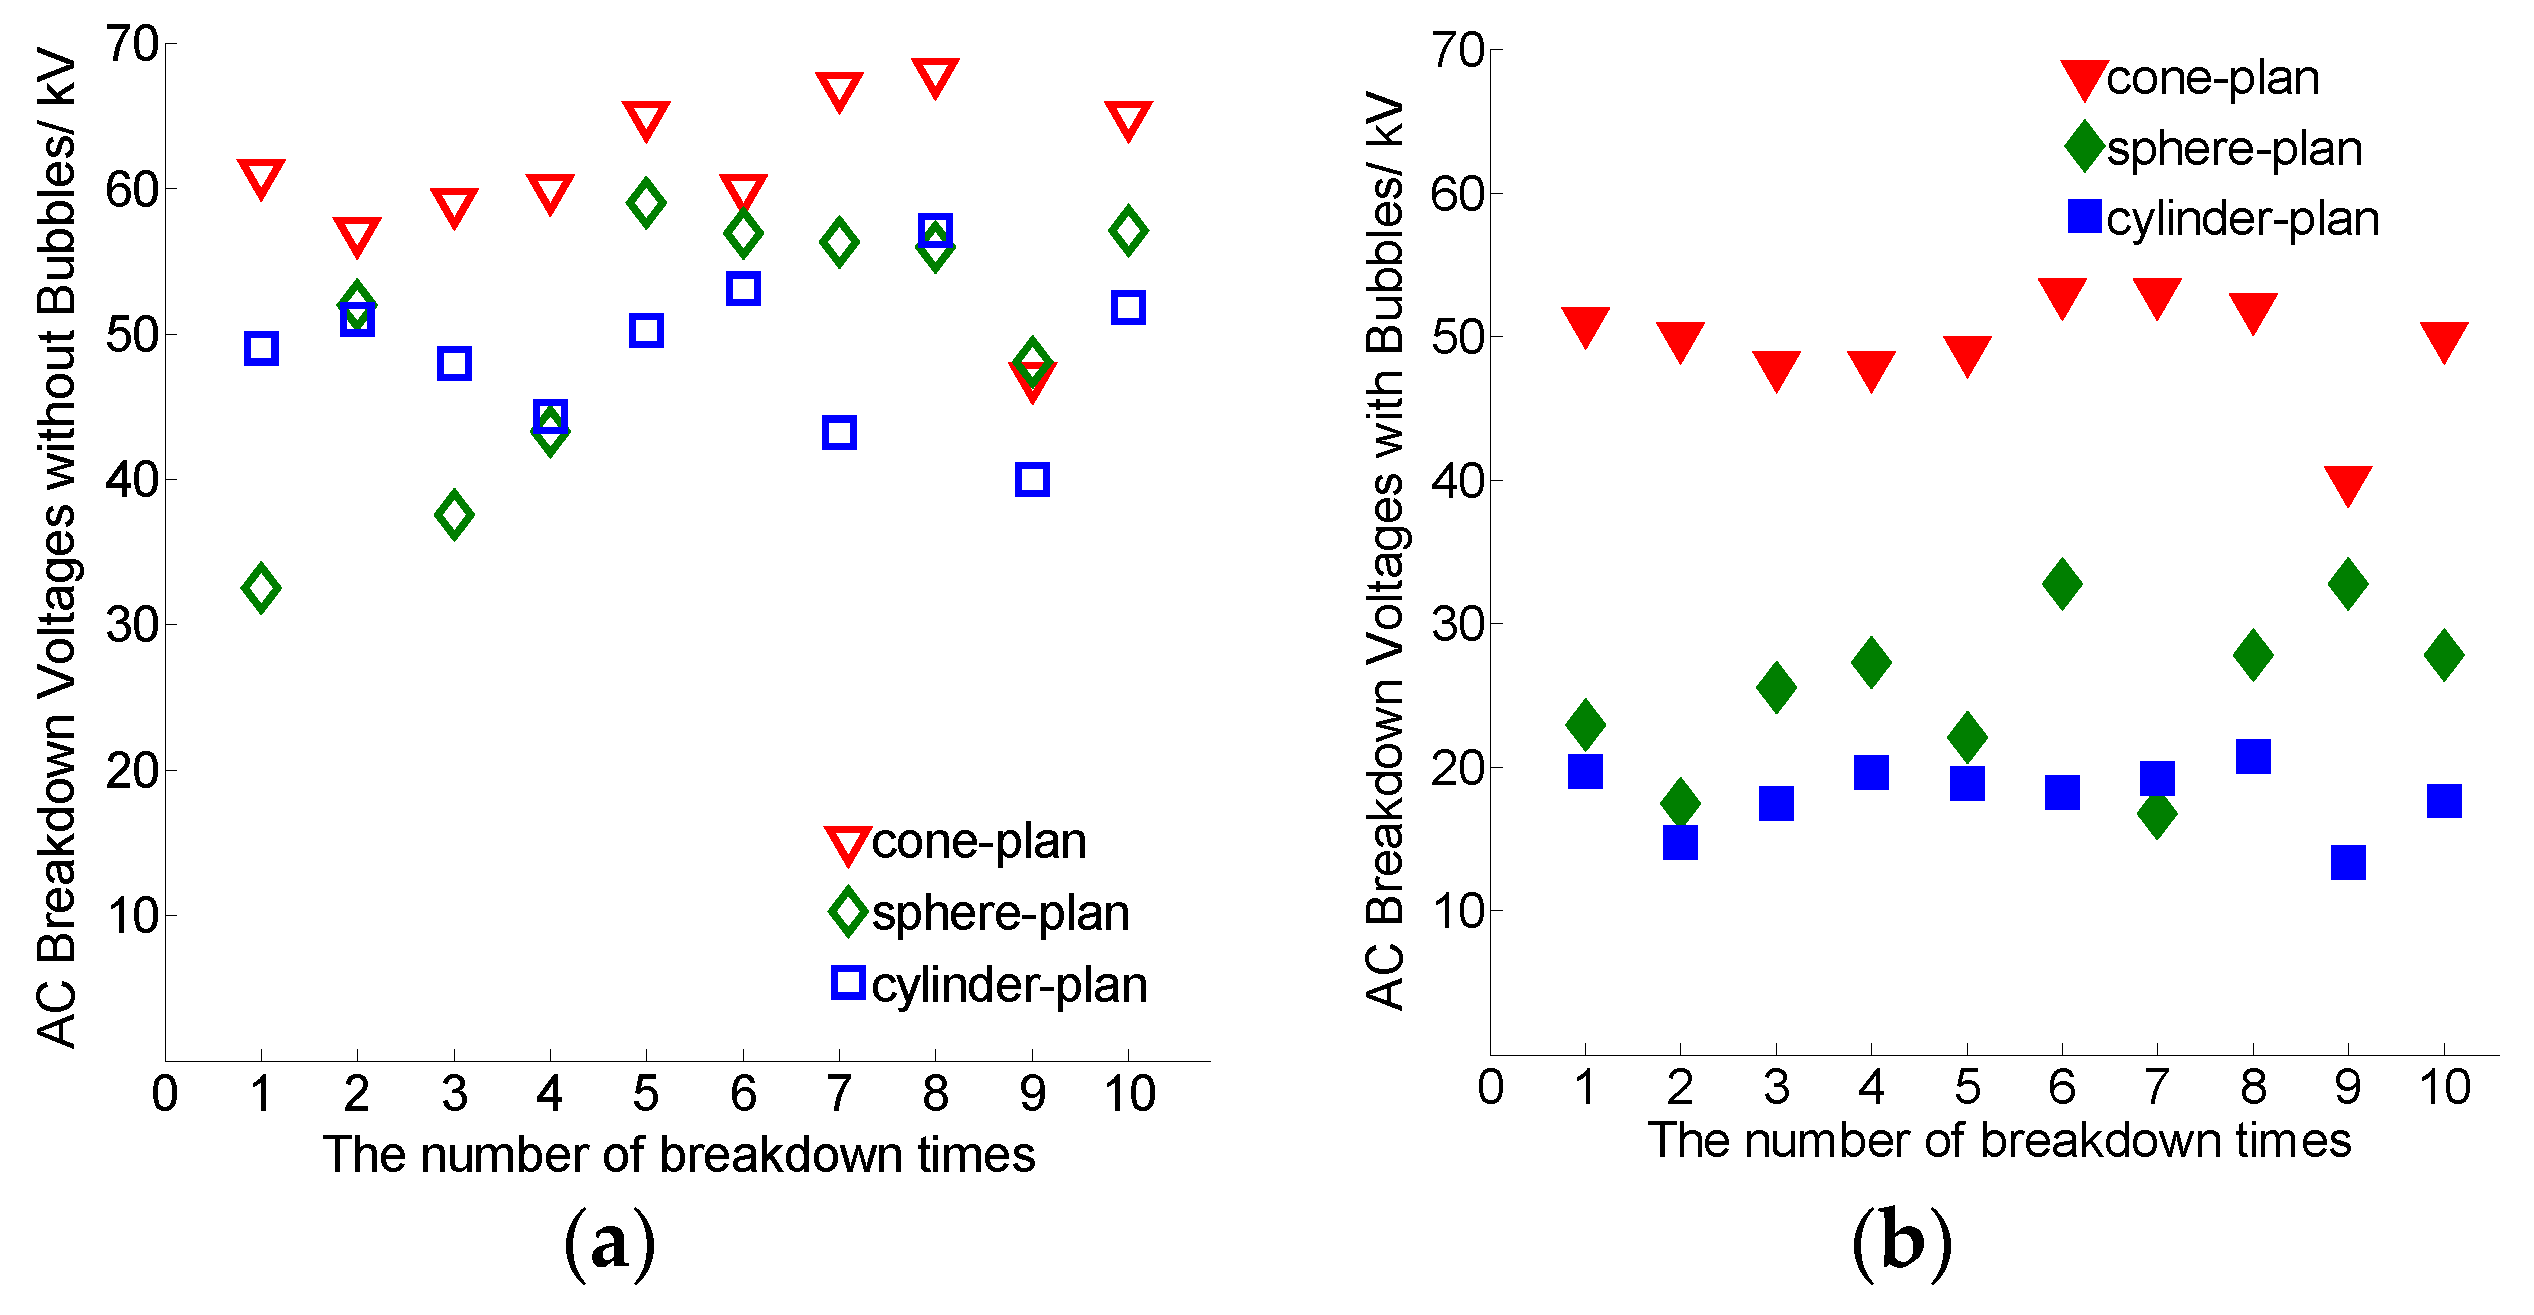
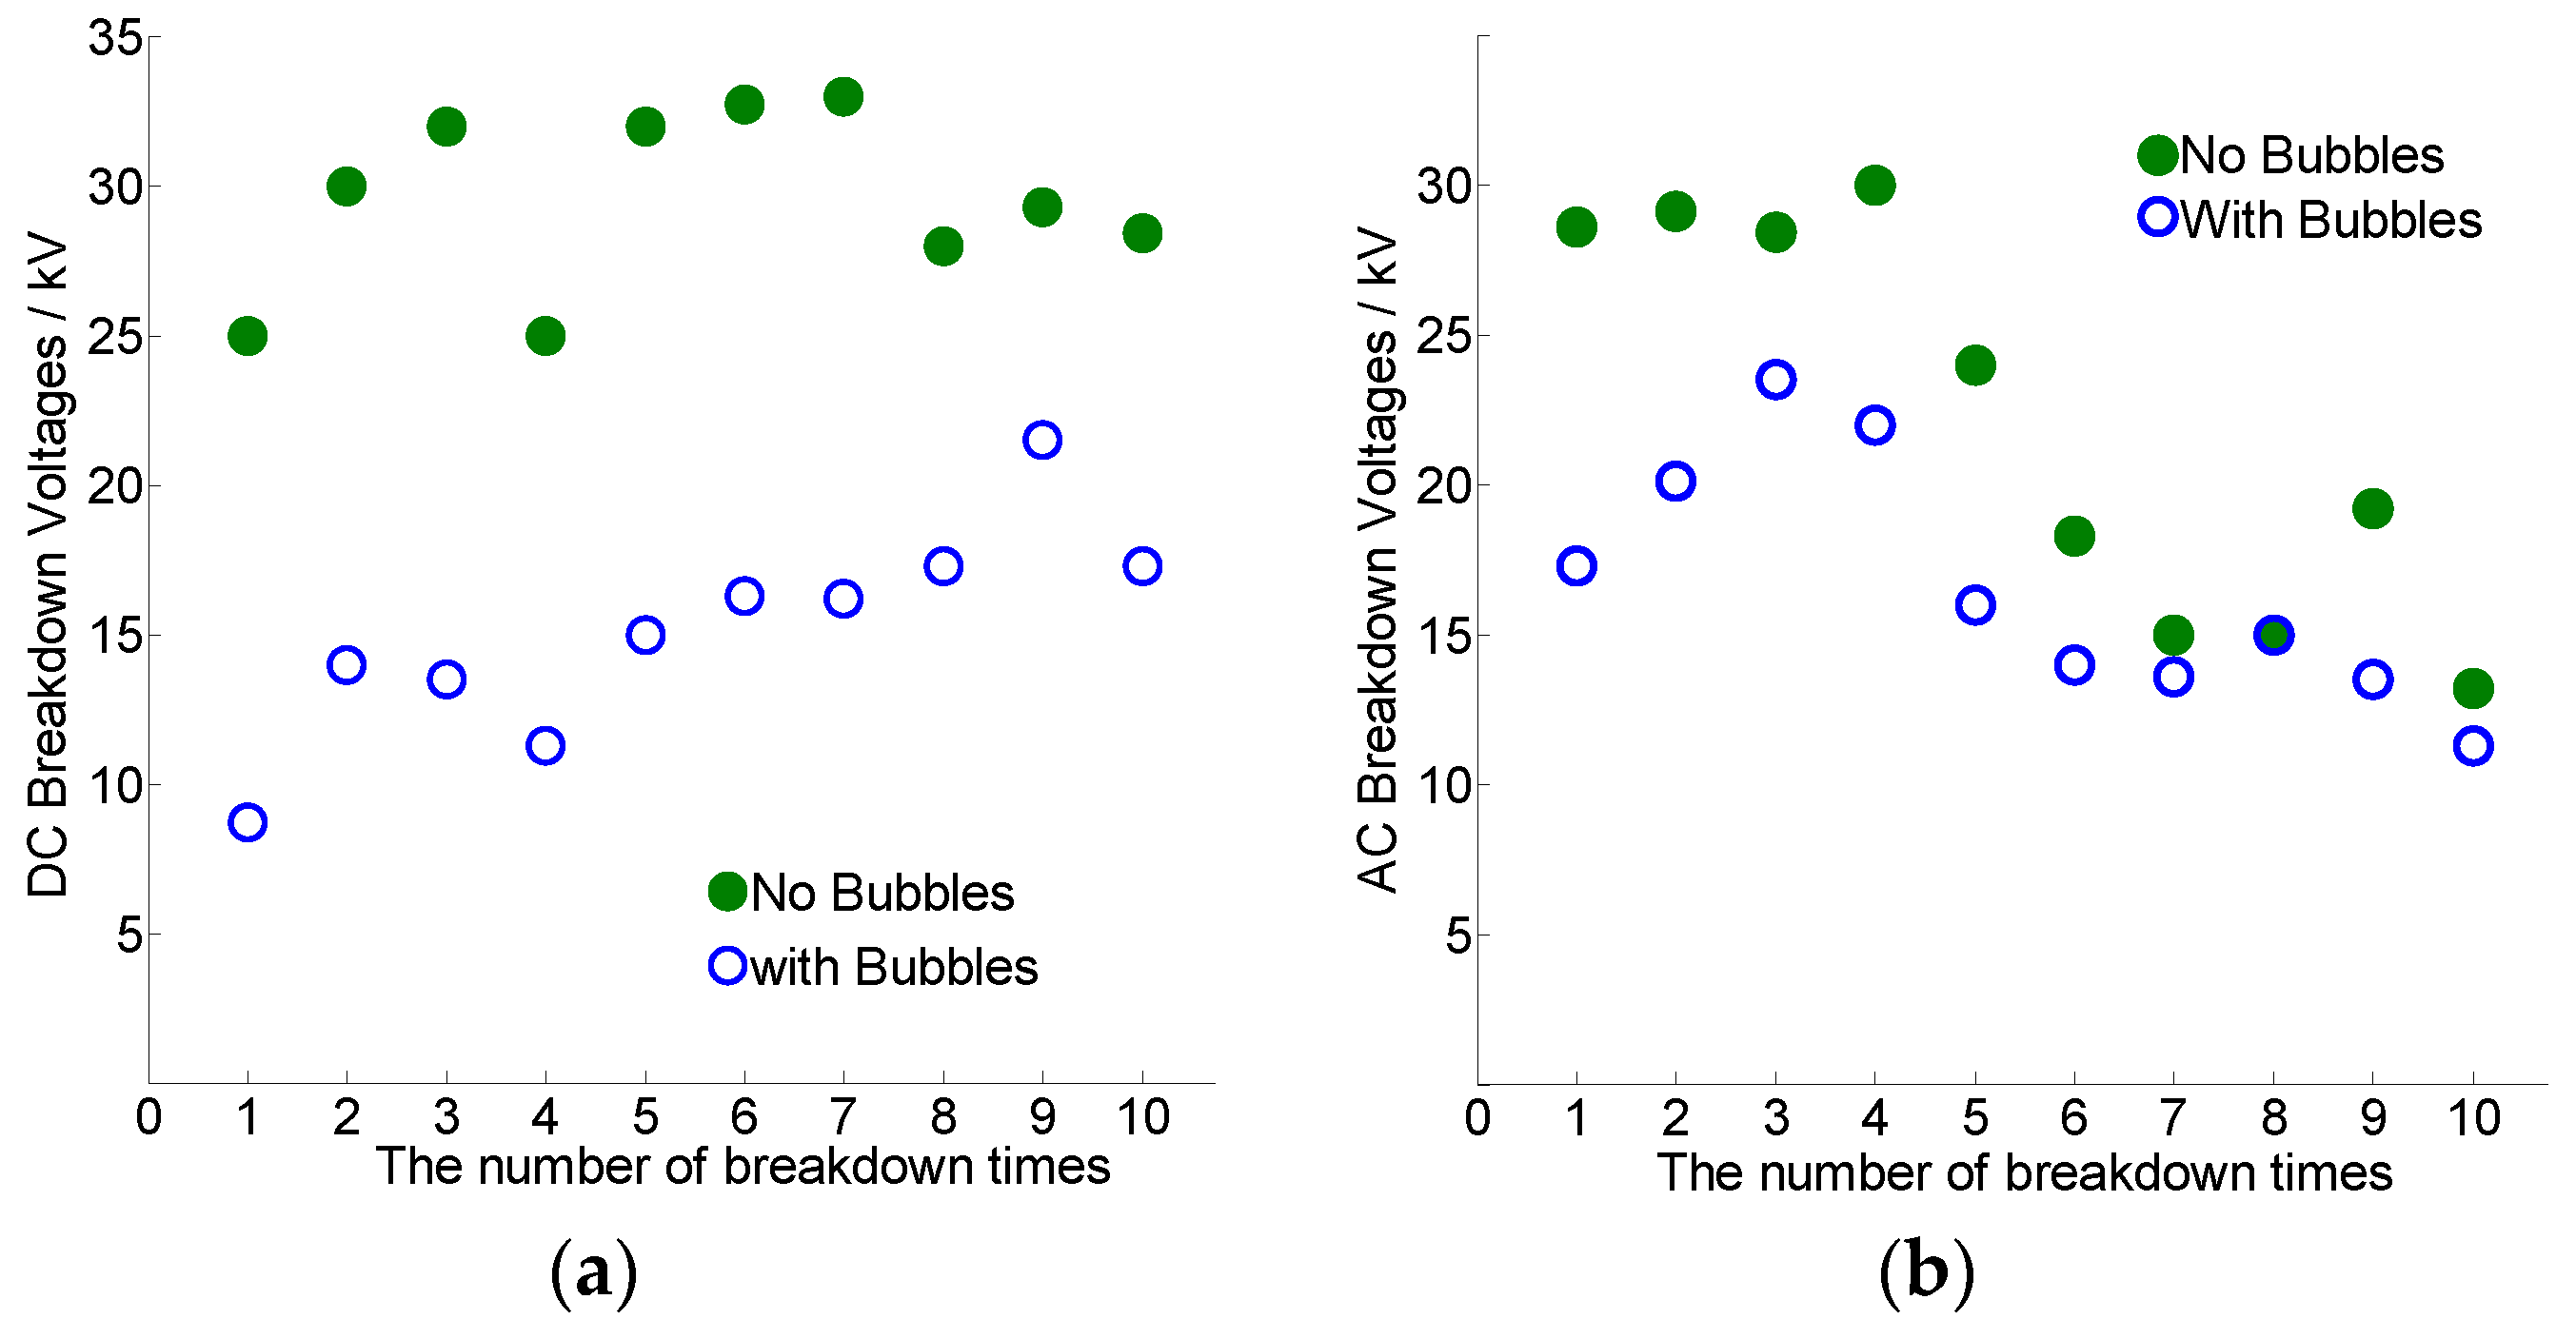
3.1. AC Breakdown Voltages of the Transformer Oil

From Figure 3a, the breakdown voltages of the cone-plan electrodes without bubbles are more than the breakdown voltages of the other two types electrodes, and the breakdown voltages of the sphere-plan electrodes are similar to the cylinder-plan electrodes. Dissado [21] and Peppas [22] indicated that the statistical analyses were suitable for the dielectric breakdown. Based on these, we calculated some statistics of the breakdown voltages.
From Table 2, the average value of the breakdown voltages of the cone-plan electrodes is 60.9 kV, the average value of the breakdown voltages of the sphere-plan electrodes is 49.9 kV, and the average value of the breakdown voltages of the cylinder-plan electrodes is 48.8 kV.
It can be seen that the system with the most non-uniform field distribution had the greatest withstand voltage. As it was known, the breakdown theory of the transformer oil is a discharge bridge mechanism, and according to this theory, the breakdown voltage is determined by the formation of the bridge. Under the most uniform field distribution, there is a corona that will disturb the discharge bridge path, and it is more difficult to form the breakdown path than under the uniform fields. Therefore, the cone-plan electrodes have the highest breakdown voltages.
From Figure 3b, the breakdown voltages of the cone-plan electrodes with bubbles are much more than the breakdown voltages of the other two types of electrodes, and the breakdown voltages of the sphere-plan electrodes are more than the cylinder-plan electrodes. The average value of the breakdown voltages of the cone-plan electrodes is 49.4 kV, the average value of the breakdown voltages of the sphere-plan electrodes is 25.3 kV and the average value of the breakdown voltages of the cylinder-plan electrodes is 18.0 kV.
From the above, with the influence of the bubbles, the breakdown voltages of the cone-plan electrodes have a 18.9% decrease on average; the bubbles have led to a 49.1% decrease in the value of the average breakdown voltage for the sphere-plan electrodes; and, the bubbles have also led to a 62.3% decrease in the value of average breakdown voltage for the cylinder-plan electrodes. The results showed that the bubbles would decrease the breakdown voltages for all of the electrodes, and the reduction of the cylinder-plan electrodes was the most serious. Meanwhile, the cone-plan electrodes had the minimal effects.
The electric strength and electric field distribution affect the breakdown voltages and the progresses of the discharge. The three electrodes have different electric distributions: the electric fields of the cylinder-plan electrodes and the sphere-plan electrodes are more uniform than that of the cone-plan electrodes. When the bubbles were generated from the central of the plan electrode, and they formed a bridge that linked the two electrodes, and then the AC high voltage was applied on the electrodes. If there was a uniform electric field between the two electrodes, there was no corona that can disturb the bubbles bridge, and the discharge would take place in the bubbles bridge, and that would cause the breakdown of the two electrodes. However, if there was a non-uniform electric field between the two electrodes, then the corona would take place near the highest electric field area, which would disturb the bubbles and the length of the bridge would get extended, then the discharge path in the non-uniform electric field would be longer than that of the uniform electric field, the progress of which is shown as Figure 4. The breakdown voltages of the non-uniform electric field saw a more minor effect than that of the uniform electric field. It can be concluded that the electric field can affect the movements of the bubbles and change the discharge path, which directly affected the breakdown voltages of the two electrodes. Thus, the breakdown voltages of the cone-plan electrodes had a minimal effect, and the breakdown voltages of the other two types of electrodes had more serious effects by the bubbles. Since the uniformity of the cylinder-plan electrodes’ electric field was close to the sphere-plan electrodes, the reductions of the breakdown voltages of the two types electrodes are close.

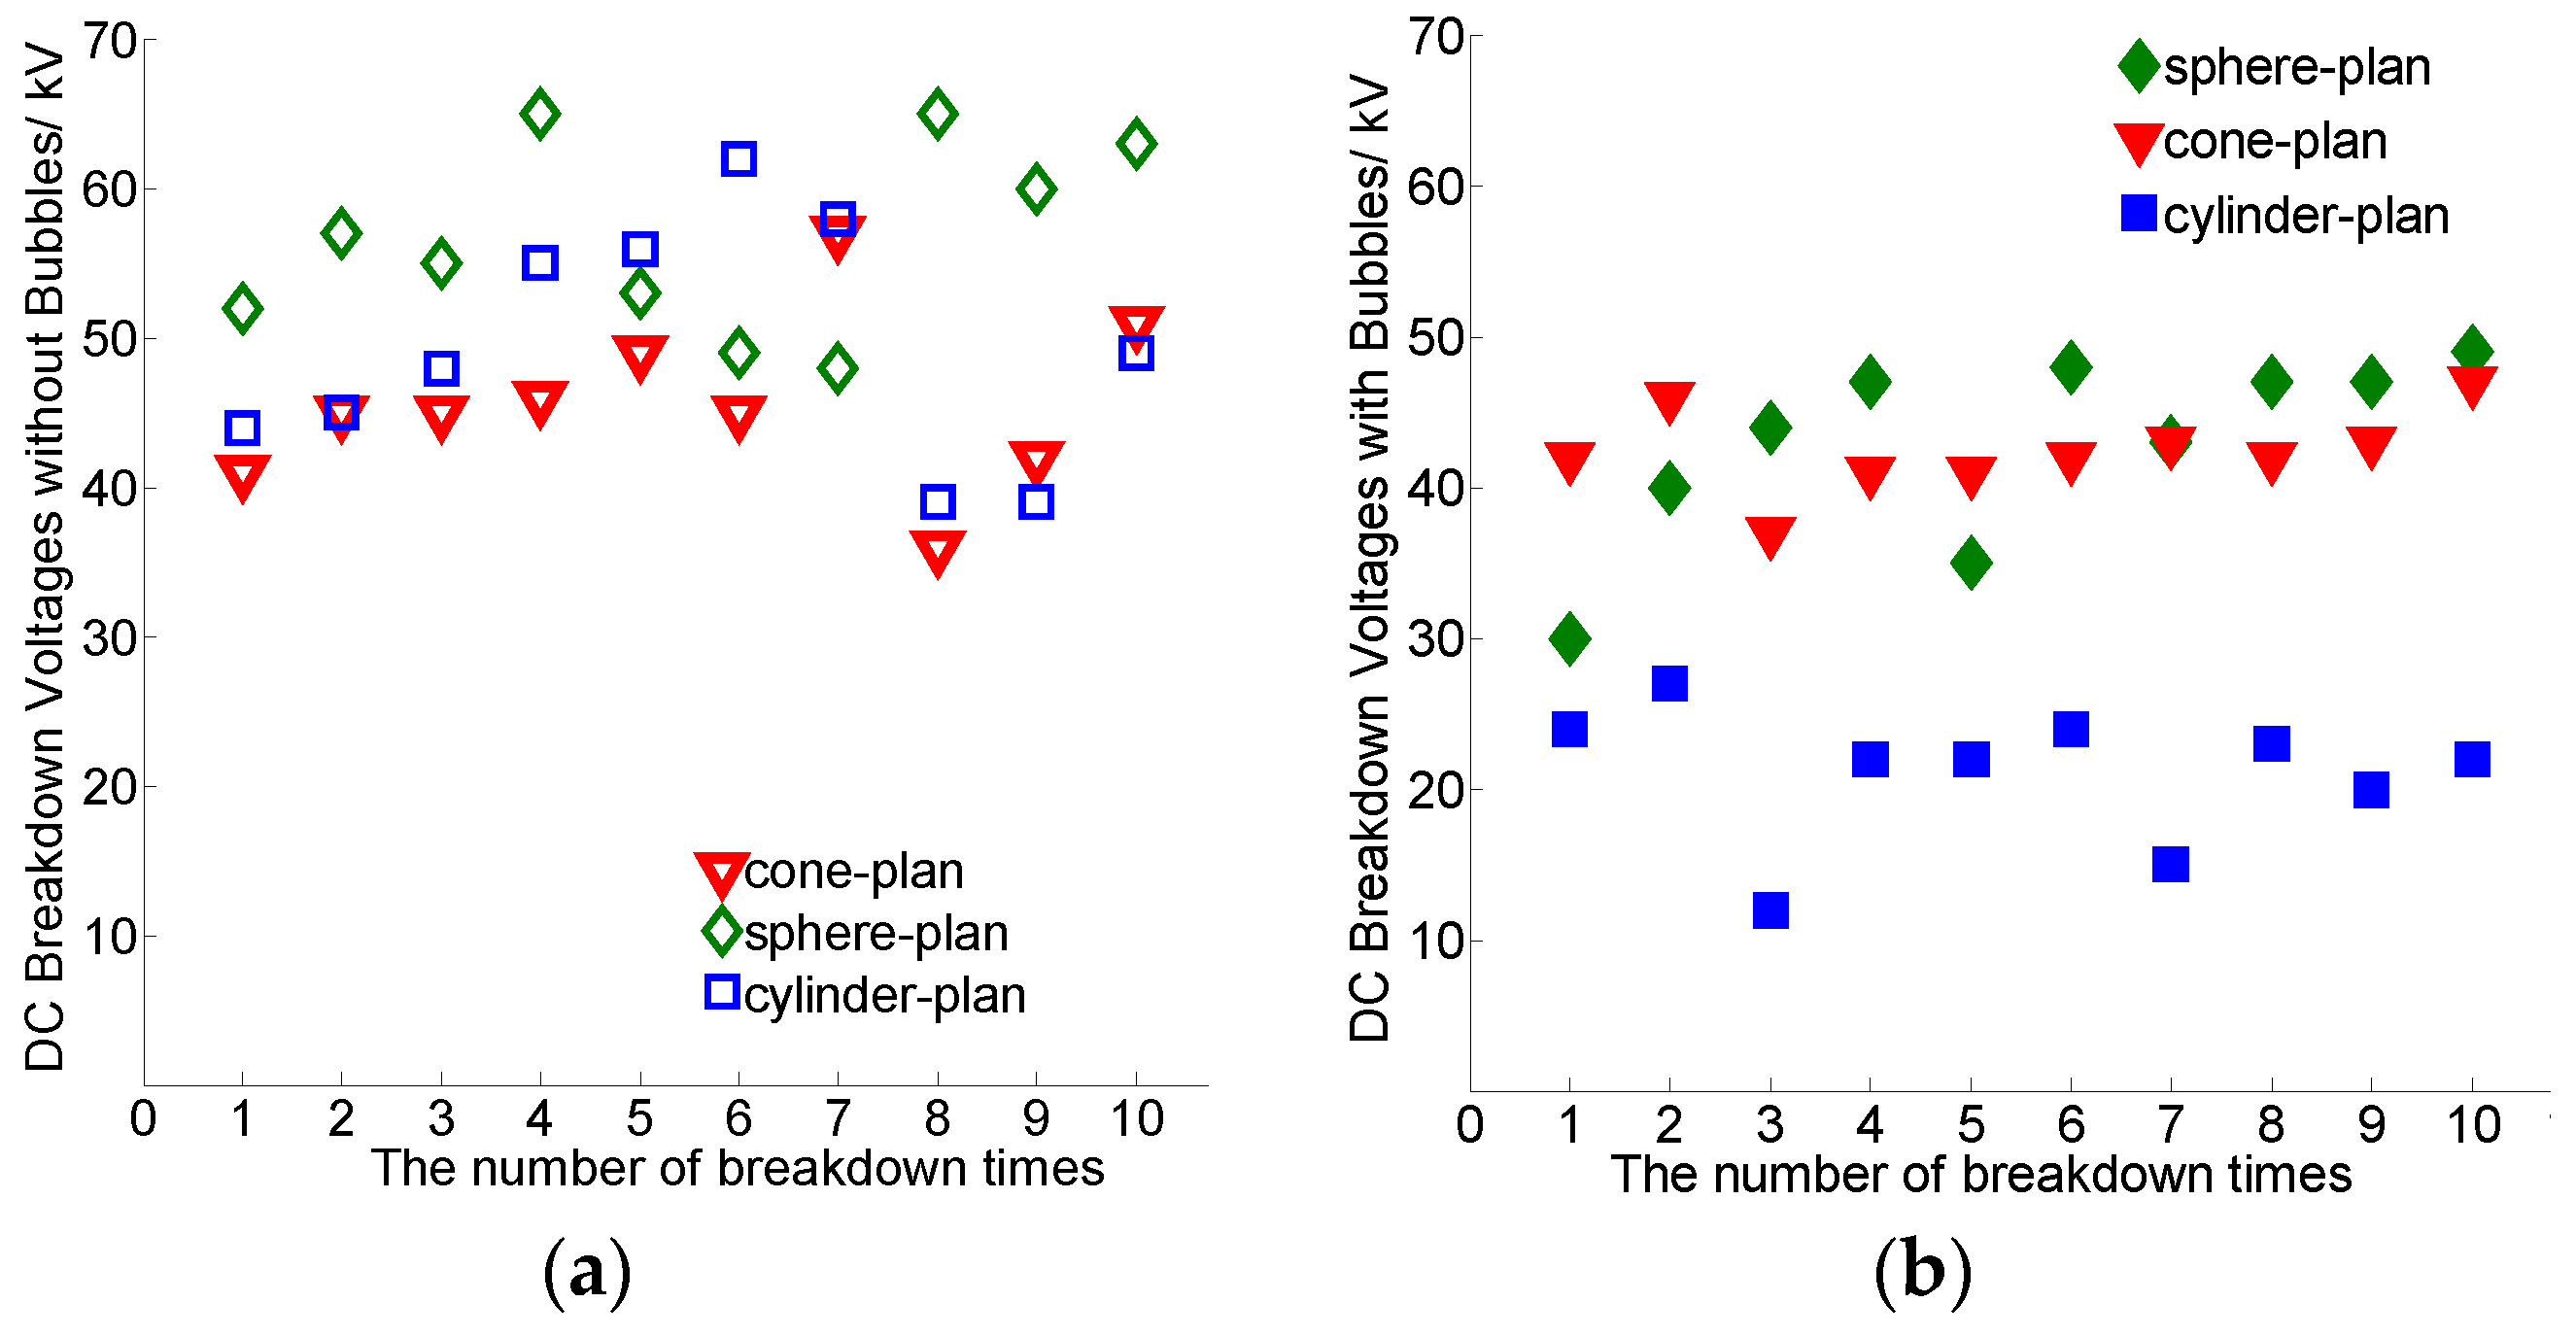
3.2. Positive DC Breakdown Voltages of the Transformer Oil

From Figure 5a, the breakdown voltages of the three types of electrodes without bubbles were different from that of the AC conditions. From Table 3, the average value of the breakdown voltages of the cone-plan electrodes is 45.7 kV, the average value of the breakdown voltages of the sphere-plan electrodes is 56.7 kV, and the average value of the breakdown voltages of the cylinder-plan electrodes is 49.5 kV.
From Figure 5b, the breakdown voltages of the cylinder-plan electrodes with bubbles are much lower than the breakdown voltages of the other two types of electrodes, and the breakdown voltages of the sphere-plan electrodes are close to that of the cone-plan electrodes. From Table 3, the average value of the breakdown voltages of the cone-plan electrodes is 42.4 kV, the average value of the breakdown voltages of the sphere-plan electrodes is 43.0 kV, and the average value of the breakdown voltages of the cylinder-plan electrodes is 21.0 kV.
From the above, with the influence of the bubbles, the breakdown voltages of the cone-plan electrodes have a 7.2% decrease on average; the bubbles have led to a 24.1% decrease in the value of The average breakdown voltage for the sphere-plan electrodes; and also the bubbles have led to a 66.9% decrease in the value of The average breakdown voltage for the cylinder-plan electrodes. The results showed that under a DC voltage, the bubbles would also decrease the breakdown voltages for all the electrodes, and the reduction of the cylinder-plan electrodes’ breakdown voltages were the most serious, and the cone-plan electrodes had minimal effects. However, the sphere-plan electrodes saw a minor reduction than that of the AC condition.
From the above, the breakdown voltages’ decrease of the cylinder-plan electrodes under positive DC voltage were similar to that under AC voltage, however, the decreases of the breakdown voltages of the sphere-plan and cone-plan electrodes are much smaller than those of the AC conditions.
From Section 3.1, it is can be seen that the discharge progress was influenced by the movements of the bubbles: if the bubbles were easy to link the two electrodes, the breakdown voltage would see a sharp decrease. Under the DC electric field, the bubbles were easy to charge, and they would then obtain an electric force with constant direction that made the bubbles move faster than under the AC condition. For that, the bubbles would move from the plan electrode to the other electrode with a higher speed under the DC condition, and this progress made it difficult for the bubbles to link the two electrodes, especially in the non-uniform electric fields, like the electric field of the cone-plan electrodes, the existence of the corona would make the bubbles’ bridge more difficult to form.
From Figure 4, the bubbles in path 2 with high speed were easy to spread to other regions in the oil, which would make the bubbles difficult to link the electrodes, so the breakdown voltages had a minimal reduction, and in [15], the authors made a similar conclusion, that the strong electric field prevented the bubbles from flowing steadily. From Figure 6a, the central of the two electrodes formed a uniform electric field, and there was no corona and disturbance, the bubbles would move from the center of the plan electrode to the center of the cylinder electrode directly, like path 1, and there was little possibility to form path 2 under the uniform electric field. From Figure 6b, the bubbles of the sphere-plan electrodes also spread easily to other areas in the oil from the edge of the sphere, so it was also difficult to form the bubbles to link the two electrodes, and the decrease of breakdown voltages was minor compared to the AC condition. However, in the case of the cylinder-plan electrodes, the decrease of the breakdown voltages under the DC condition was approximately equal to that under the AC condition.
From the above analyses, it was difficult for the bubbles to link the two electrodes in the non-uniform electric field under the DC condition, so the breakdown voltages of the cone-plan electrodes were minimally affected by the bubbles. However, under the force of the DC electric field, there was little effect on the formation of the bubbles in the uniform electric field, so the descent of the breakdown voltage of the cylinder-plan electrodes under the DC condition was approximately equal to that under the AC condition.

3.3. The Breakdown Voltages of the Oil-Impregnated Pressboard

From Figure 7a, under positive DC voltage, the breakdown voltages of the oil-impregnated pressboard have decreased by the bubbles produced by the oil-impregnated pressboard. From Table 4, the average value of the breakdown voltages of the oil-impregnated pressboard without bubbles was 29.5 kV, and the average breakdown voltage with bubbles was 15.1 kV. This means that with the influence of the bubbles, the breakdown voltages of oil-impregnated pressboard have a 48.9% decrease, on average.
From Figure 7b, under AC voltage, the breakdown voltages of the oil-impregnated pressboard have decreased by the bubbles that are produced by the oil-impregnated pressboard. In Table 4, the average breakdown voltages of the oil-impregnated pressboard without bubbles was 22.1 kV, and the average breakdown voltage with bubbles was 16.8 kV. This means that with the influence of the bubbles, the breakdown voltages of oil-impregnated pressboard have a 25% decrease, on average.
However, it can be seen that there was a sharp decline of the breakdown voltages after about ten discharges, in total. The breakdown voltages of the oil-impregnated pressboard with bubbles have no obvious reduction when compared with the breakdown voltages without bubbles. Thus, the data before the sharp decline were selected again to calculate the average breakdown voltages, shown as AC* (in Table 4), the average value without bubbles was 28 kV, and the value with bubbles was 19.8 kV. There was a 29.4% decrease of the average breakdown voltage under the influence of the bubbles that were produced by the oil-impregnated pressboard.
The AC breakdown voltages showed a sharp decline after about nine or ten breakdown discharges. The breakdown progress damaged the oil-impregnated pressboard and the oil, and some fiber, carbon, and other products can decrease the electric strength of the oil. Under the AC condition, the breakdown progress had multiple discharges (shown as Figure 8), and the oil and the pressboard decomposed into other chemical compositions that would decrease the electric strength of the oil, and that the compositions had a cumulative effect. It can be concluded that the cumulative effect in our test will play an important role after about 10 AC breakdown discharges. On the other hand, under the DC condition, the DC discharge only had one discharge (seen in Figure 8), and this caused slight damage to the pressboard and the oil, and the repeated breakdown tests can change the morphology of water in oil, which make the breakdown voltage of transformer oils increase. In [23], they reached a similar conclusion. Thus, the DC breakdown voltages are larger for the last tests than the first.
Table 5 shows the discharge forms of the oil-impregnated pressboard under the DC and AC electric fields. The breakdown meant that when the discharge occurred, the oil impregnated pressboard was broken down by the high voltage, and, meanwhile, the flashover meant that when the discharge occurred, the oil-impregnated pressboard was not broken down, but the discharge occurred along the oil-impregnated pressboard, only breaking down the bubbles and oil. From Table 5, under the AC voltage, bubbles or no bubbles, the discharge forms were mainly breakdown, and under the DC condition, the discharge forms with no bubbles were breakdown. However, the main discharge forms with bubbles under the DC condition have changed into flashover.
From the above results, with the influence of bubbles, the descent of the breakdown voltages under DC voltage was much more than that under AC voltage; this is because the main discharge forms under DC voltage with bubbles were flashover, and that had a minor breakdown voltage.
In DC, the discharge almost takes place in the bubbles and the insulation cannot be recovered, thus the bubble will move up to the top surface of the oil along the paper, so the discharge occurred in the bubbles along the paper surface, and the flashover was formed. However, in AC, on one hand, the insulation of the bubbles can be recovered after breakdown, so the discharge will be shut down when the bubbles move toward up to the top, while, on the other hand, the oil-impregnated paper has a greater dielectric loss and produce more heat, which will reduce the insulation strength of the paper. Additionally, in AC, the pressboard is a complex insulation, there are oil and air in the paper, and there will be a higher electric strength on them, thus making them easier to breakdown, but this is not a problem in DC, and the authors in [24] share the same opinion. Therefore, the discharge form of the pressboard is always that of breakdown in AC.

4. Conclusions

The presence of the bubble will reduce the breakdown voltages of the oil-paper insulation. From the above discussion, the work may be concluded as follows:
In AC and DC, the bubbles decreased the breakdown voltage of the cylinder-plan electrodes the most among the three electrodes systems, and the mean values have dropped more than 60%, whereas the cone-plan electrodes have the least decline. That is say the bubbles have the minimum effect on the non-uniform electric field. This is due to the movement of the bubbles and the corona will prevent the bubbles’ discharge path. We also found that for the corona preventing the fibers and particles to form the bridge, in AC, the cone-plan electrodes have the largest breakdown voltages in the oil without bubbles. In DC, the decrease of the breakdown voltages of the cone-plan and sphere-plan electrodes influenced by the bubbles were much less than that in AC.
For the oil-impregnated pressboard, the decrease of the breakdown voltage under DC voltage was more than that under AC voltage. In our work, the main discharge form is flashover in DC, however, the main discharge form is breakdown through the pressboard. The phenomenon is determined by the discharge mechanisms in DC and AC. The discharge is the single discharge in DC, which cannot destroy the oil-paper insulation, but it can change the morphology of water in oil, and which can cause the BDV increase. Meanwhile, the AC breakdown is a kind of multiple high intensity discharge, which can seriously destroy the pressboard and oil, and the cumulative effect of fibrinogen degradation products will reduce the BDV.

Author Contributions

Chunxu Qin, Tao Zhao and Fangcheng Lv conceived and designed the experiments; Yan He, Bing Shi and Xiangrui Cheng performed the experiments; Chunxu Qin and Tao Zhao analyzed the data; Fangcheng Lv contributed reagents/materials/analysis tools; Chunxu Qin wrote the paper.

Conflicts of Interest

The authors declare no conflict of interest.

References

  1. Liao, R.; Ying, L.; Zheng, H.; Ma, Z. Reviews on oil-paper insulation thermal aging in power transformers. Trans. China Elctrotech. Soc. 2012, 27, 1–12. [Google Scholar]
  2. Yin-biao, S. Present status and prospect of HVDC transmission in China. High Volt. Eng. 2004, 30, 1–2. [Google Scholar]
  3. You-liang, S.; Qing-pu, W.; Wen-ping, L. R&D ofconverter transformer for ±800 kV HVDC power transmission project. Electr. Equip. 2006, 7, 17–20. [Google Scholar]
  4. Tao, Z.; Yunpeng, L.; Fangcheng, L.; Ruihong, D. Study on dynamics of the bubble in transformer oil under non-uniform electric field. IET Sci. Meas. Technol. 2016, 10, 498–504. [Google Scholar] [CrossRef]
  5. Ushakov, V.Y.; Klimkin, V.F.; Korobeynikov, S.M. Impulse Breakdown of Liquids, 1st ed.; Springer: Berlin/Heidelberg, German; GmbH & Co. K: Berlin, German, 2007; ISBN 9783642091858. [Google Scholar]
  6. Heinrichs, F.W. Bubble formation in power transformer windings at overload temperatures. IEEE Trans. Power Appar. Syst. 1979, PAS-98, 1576–1582. [Google Scholar] [CrossRef]
  7. Kaufmann, G.H.; McMillen, C.J. Gas bubble studies and impulse tests on distribution transformers during loading-above nameplate rating. IEEE Trans. Power Appar. Syst. 1983, PAS-102, 2531–2542. [Google Scholar] [CrossRef]
  8. Oommen, T.V.; Lindgren, S.R. Bubble evolution from transformer overload. Transm. Distrib. Conf. Expo. 2001, 1, 137–142. [Google Scholar]
  9. Koch, M.; Tenbohlen, S. Evolution of bubbles in oil-pressboard insulation influenced by material quality and ageing. IET Electr. Power Appl. 2011, 5, 168–174. [Google Scholar] [CrossRef]
  10. Przybylek, P. The influence of cellulose insulation aging degree on its water sorption properties and bubble evolution. IEEE Trans. Dielectr. Electr. Insul. 2010, 17, 906–912. [Google Scholar] [CrossRef]
  11. Przybylek, P.; Nadolny, Z.; Moscicka-Grzesiak, H. Bubble effect as a consequence of dielectric losses in cellulose insulation. IEEE Trans. Dielectr. Electr. Insul. 2010, 17, 913–919. [Google Scholar] [CrossRef]
  12. Przybylek, P.; Moranda, H.; Walczak, K.; Moscicka-Grzesiak, H. Can the bubble effect occur in an oil-impregnated pressboard bushing. IEEE Trans. Dielectr. Electr. Insul. 2012, 19, 1879–1883. [Google Scholar] [CrossRef]
  13. Perkasa, C.Y.; Nick, L.; Tadeusz, C.; Jaury, W.; Daniel, M. A Comparison of the Formation of Bubbles and Water Droplets in Vegetable and Mineral Oil Impregnated Transformer pressboard. IEEE Trans. Dielectr. Electr. Insul. 2014, 21, 2111–2118. [Google Scholar] [CrossRef]
  14. Sharbaugh, H.; Devins, J.S.; Rzad, S.J. Progress in the field of electric breakdown in dielectric liquids. IEEE Trans. Electr. Insul. 1978, 13, 249–276. [Google Scholar] [CrossRef]
  15. Ogata, S.; Shigehara, K.; Yoshida, T.; Shinohara, H. Small bubble formation by using strong non-uniform electric field. IEEE Trans. Ind. Appl. 1980, IA-16, 766–770. [Google Scholar] [CrossRef]
  16. Hara, M.; Koishihara, H.; Saita, K. Breakdown behavior of cryogenic liquids in the presence of thermal bubbles under ramped voltage. IEEE Trans. Dielectr. Electr. Insul. 1991, 26, 685–691. [Google Scholar] [CrossRef]
  17. Seok, B.Y.; Tamuro, N.; Hara, M. A study of thermal bubble behavior in the simulated electrode system of HT superconducting coils. IEEE Trans. Dielectr. Electr. Insul. 1999, 6, 109–116. [Google Scholar] [CrossRef]
  18. Hara, M.; Kubuki, M. Effect of thermally induced bubbles on the electrical breakdown characteristics of liquid nitrogen. Proc. IEE 1990, 137, 209–216. [Google Scholar]
  19. Hara, M.; Wang, Z.; Saito, H. Thermal Bubble Breakdown in Liquid Nitrogen under Nonuniform Fields. IEEE Trans Dielectr. Electr. Insul. 1994, 4, 709–716. [Google Scholar] [CrossRef]
  20. Gan, D.; Liu, F.; Liu, P.; Hu, C. Calculation Method of Oil-Paper Insulation Moisture Content Based on Oil-Paper Moisture Equilibrum of Transformer. Transformer 2009, 8, 21–24. [Google Scholar]
  21. Dissado, L.A. Theoretical basis for the statistics of dielectric breakdown. J. Phys. D Appl. Phys. 1990, 23, 1582–1591. [Google Scholar] [CrossRef]
  22. Peppas, G.D.; Charalampakos, V.P.; Pyrgioti, E.C.; Danikas, M.G.; Bakandritsos, A.; Gonos, I.F. Statistical investigation of AC breakdown voltage of nanofluids compared with mineral and natural ester oil. IET Sci. Meas. Technol. 2016, 10, 644–652. [Google Scholar] [CrossRef]
  23. You, Z.; Jun, J.; Yingting, L.; Hao, W.; Yuzhen, L.; Chengrong, L. Statistical Analysis of AC Breakdown Voltage for Transformer Oil. Insul. Mater. 2015, 48, 73–77. [Google Scholar]
  24. Wang, Y.; Wei, X.; Chen, Q. Breakdown Characteristics of Oil-pressboard Insulation in Converter Transformer under Composite Electric Field and Its Test Method. High Volt. Eng. 2011, 37, 2005–2011. [Google Scholar]
Figure 1. The schematic diagram of the experimental system.
Energies 11 00634 g001
Figure 2. The schematic diagram of the electrodes (mm). (a) cylinder-plan electrodes; (b) cone-plan electrodes; (c) sphere-plan electrodes; and, (d) sphere-sphere electrodes used for the investigation of the breakdown voltage of the pressboard.
Energies 11 00634 g002
Figure 3. The AC breakdown voltages (effective values) of the transformer oil. (a) The AC breakdown voltages of the oil without bubbles; and, (b) the AC breakdown voltages of the oil with bubbles.
Energies 11 00634 g003
Figure 4. The bubbles of the cone-plan electrodes, where 1 are the initial bubbles; 2 are the bubbles affected by the electric field. The left picture is the schematic diagram and the right one is the real photo of the bubbles affected by the electric field.
Energies 11 00634 g004
Figure 5. The positive DC breakdown voltages of the transformer oil. (a) The DC breakdown voltages of the oil without bubbles; (b) the DC breakdown voltages of the oil with bubbles.
Energies 11 00634 g005
Figure 6. The bubbles of the cylinder-plan and sphere-plan electrodes, where 1 is the initial bubbles; 2 shows the bubbles affected by the corona; (a) the bubbles of the cylinder-plan electrodes; and, (b) the bubbles of the sphere-plan electrodes.
Energies 11 00634 g006
Figure 7. The breakdown voltages of the oil-impregnated pressboard. (a) The DC breakdown voltages; and (b) the AC breakdown voltages (effective values).
Energies 11 00634 g007
Figure 8. The breakdown progress of the cylinder-plan electrodes in the oil.
Energies 11 00634 g008
Table 1. Characteristics of the tested oils.
Dielectric LiquidMoisture (ppm)Viscosity (mm2/s), 40 °CFlash Point (°C)Tan δ (90 °C, 50 Hz)Acid Number (mg∙KOH/g)
KI25X≤4010.131420.00060.05
Table 2. Statistics of the AC breakdown voltages (BDV).
Electrode SystemsCone-PlanSphere-PlanCylinder-Plan
With bubblesMean BDV (kV)49.425.318
Std. Deviation (kV)3.85.52.3
Min BDV (kV)4016.813.4
Max BDV0 (kV)5332.820.8
Without bubblesMean BDV (kV)60.949.948.8
Std. Deviation (kV)6.19.25.1
Min BDV (kV)4732.540
Max BDV (kV)685957.1
Table 3. Statistics of the AC breakdown voltages (BDV).
Electrode SystemsCone-PlanSphere-PlanCylinder-Plan
With bubblesMean BDV (kV)42.44321.1
Std. Deviation (kV)2.76.24.4
Min BDV (kV)373012
Max BDV (kV)474927
Without bubblesMean BDV (kV)45.756.749.5
Std. Deviation (kV)5.76.38.0
Min BDV (kV)364839
Max BDV (kV)42.44321.1
Table 4. Statistics of the oil-impregnated pressboard breakdown voltages (BDV).
Electrode SystemsACAC*DC
With bubblesMean BDV (kV)16.61915.1
Std. Deviation (kV)4.03.13.5
Min BDV (kV)11.3168.7
Max BDV (kV)23.523.521.5
Without bubblesMean BDV (kV)22.82829.5
Std. Deviation (kV)6.62.32.9
Min BDV (kV)13.229.125
Max BDV (kV)301633
Table 5. The discharge forms of the oil-impregnated pressboard under AC and DC electric fields.
VoltagesACDC
Test No.No BubblesBubblesNo BubblesBubbles
1BreakdownBreakdownBreakdownFlashover
2BreakdownBreakdownBreakdownFlashover
3BreakdownBreakdownBreakdownFlashover
4BreakdownBreakdownBreakdownFlashover
5BreakdownBreakdownBreakdownFlashover
6BreakdownFlashoverBreakdownFlashover
7BreakdownBreakdownBreakdownFlashover
8BreakdownBreakdownBreakdownFlashover
9BreakdownBreakdownBreakdownBreakdown
10BreakdownBreakdownBreakdownFlashover

