Article

Thermal Rating of Offshore Wind Farm Cables Installed in Ventilated J-Tubes

1
School of Electric Power Engineering, South China University of Technology, Guangzhou 510640, China
2
School of ITEE, The University of Queensland, Brisbane 4109, Australia
3
Guangdong Electric Power Design Institute Co. Ltd. of China Energy Engineering Group, Guangzhou 510663, China
*
Author to whom correspondence should be addressed.
Energies 2018, 11(3), 545; https://doi.org/10.3390/en11030545
Submission received: 31 January 2018 / Revised: 1 March 2018 / Accepted: 1 March 2018 / Published: 3 March 2018
(This article belongs to the Section F: Electrical Engineering)

Abstract

:
The section of submarine cable that is installed in enclosed J-tubes represents a possible thermal limiting point along the export circuits of offshore wind farms (OWFs). To obtain higher continuous thermal ratings for J-tube systems, a ventilated design, realized by allowing for the flow of natural wind into the J-tube through vents, is considered in this paper. To evaluate the performance of this forced-ventilation design, a coupled three-dimensional (3D) numerical model is constructed using the computational fluid dynamics (CFD) technique. The CFD method is first successfully tested through comparisons with existing methods for enclosed J-tubes. Then, the cable rating for the ventilated design is determined using the CFD model and compared with the rating for the enclosed case. The results show that the cooling effect from forced ventilation is obvious, and the cable rating could be increased by up to 27.5% for a wind speed of 10 m/s. This improvement in rating is especially significant for OWFs where the export circuit output is limited by the cable rating in enclosed J-tubes.

1. Introduction

The development of offshore wind farms (OWFs) has rapidly advanced in recent years [1,2]. For the OWF export system, a short section of submarine cable that is enclosed by a protective J-tube is laid between the sea floor and the offshore platform. The continuous thermal rating of these cables is attracting increasing attention [3,4]. This is mainly because the heat transfer from the cable to the ambient air is severely obstructed by the tube itself [3,4,5,6]. As such, the cable section in the J-tube is a potential thermal limiting point for the overall export cable. Due to the extremely high construction cost of OWFs [7,8], enlarging the submarine cable size to improve the rating may not be economically viable.
A natural and straightforward method for increasing the cable rating would be through utilizing natural wind and allowing it to enter the J-tube. This can be done by opening some vents to the J-tube surfaces. It is expected that the cable in the J-tube would receive good cooling effects from forced ventilation. This method has recently been tested in several Chinese OWFs.
To evaluate the performance of this ventilated design, cable ratings in ventilated and enclosed J-tubes should be compared. However, no formal rating methods exist for the ventilated J-tube, and the existing rating methods for enclosed J-tubes [4,5,6] cannot be directly applied to ventilated ones. This is because these methods do not account for the air flowing into/out of the J-tube, i.e., the effect of forced ventilation cannot be represented. Moreover, the air flowing into the J-tube would make the inside flow and temperature fields more complex than in the fully enclosed case.
Due to the above two reasons, this paper presents a three-dimensional (3D) coupled computational fluid dynamics (CFD) numerical model to help determine the corresponding cable rating. The rating results are compared with those of the enclosed J-tubes. The thermo-fluid phenomenon within the ventilated J-tube is investigated. This helps us to fully understand how the ventilated design can improve the cable rating.
The rest of this paper is organized as follows. The following section presents the existing rating methods for the enclosed J-tube system. Section 3 describes the CFD models that were developed for enclosed and ventilated J-tubes in this paper. In Section 4, following the benchmarking test where the CFD model for the enclosed design is compared with the existing methods, the benefits of converting J-tubes from traditional design to forced ventilation are accurately quantified using the CFD model for the ventilated design. Finally, conclusions are drawn in Section 5.

2. Existing Rating Methods for Cables in Enclosed J-Tubes

A typical enclosed J-tube system is divided vertically into three different sections at sea level and on the platform, as shown in Figure 1. It is assumed that the J-tube is vertical to sea level and also the platform. In the water section, the J-tube is often not effectively sealed at the bottom in actual OWFs, and thus seawater fills the J-tube annulus. In the air section, the J-tube is generally required to be effectively sealed at the top, and thus the vertical annulus is air-filled. In the platform section, above the platform the cable runs to the substation, with no part of the J-tube being covered.
Since the thermal environment of the vertical risers used to protect cables on land is similar to that of OWF J-tubes, the two-dimensional (2D) analytical methods proposed in [5,6] for terrestrial risers are also often used for J-tubes. An updated 2D analytical model for J-tube was recently presented in [4], in which the empirical correlation used to determine the average cable surface convective heat transfer coefficient (CHTC) hc (W·m−2·K−1) was updated, in accordance with [9].
h c = c λ δ gap R a n A R b K p
where λ is the thermal conductivity of air (W·m−1·K−1); δgap is the radius gap of the vertical annulus filled with air, m; Ra is the Rayleigh number based on δgap (dimensionless); AR is the aspect ratio (dimensionless) which is the ratio of the air section height to δgap; K is the radius ratio (dimensionless); and c, n, b, and p are constants, whose values change depending on the Ra.
In fact, these 2D methods may overestimate the peak conductor temperature for short air section lengths since they neglect the effect of longitudinal heat transfer (LHT). This point was demonstrated in [4], where the updated 2D method was compared with a quasi-3D analytical method. This quasi-3D method accounts for the LHT by defining longitudinal thermal resistivity.
A 3D Finite Element (FE) model was also developed in [4], which predicts 4.7% more ratings than the quasi-3D method for air sections that are longer than 10 m. In order to reduce the computing time, the temperature gradient-induced natural flow inside the J-tube is not modeled in the FE model, but rather represented by an empirical CHTC that is calculated using Equation (1). However, the possible loss of accuracy due to this simplification is not further investigated. Thus, in this study the CFD technique is also applied to the enclosed J-tube to model the inside natural convection, and meanwhile, the comparisons with the existing methods in [4] can be seen as a process of benchmarking test for the CFD models developed.

3. Model Development

Based on the FE model in [4], a 3D CFD model for enclosed J-tubes is first built, followed with the establishment of a 3D CFD model for ventilated J-tubes. Descriptions of the developed CFD models will be given.

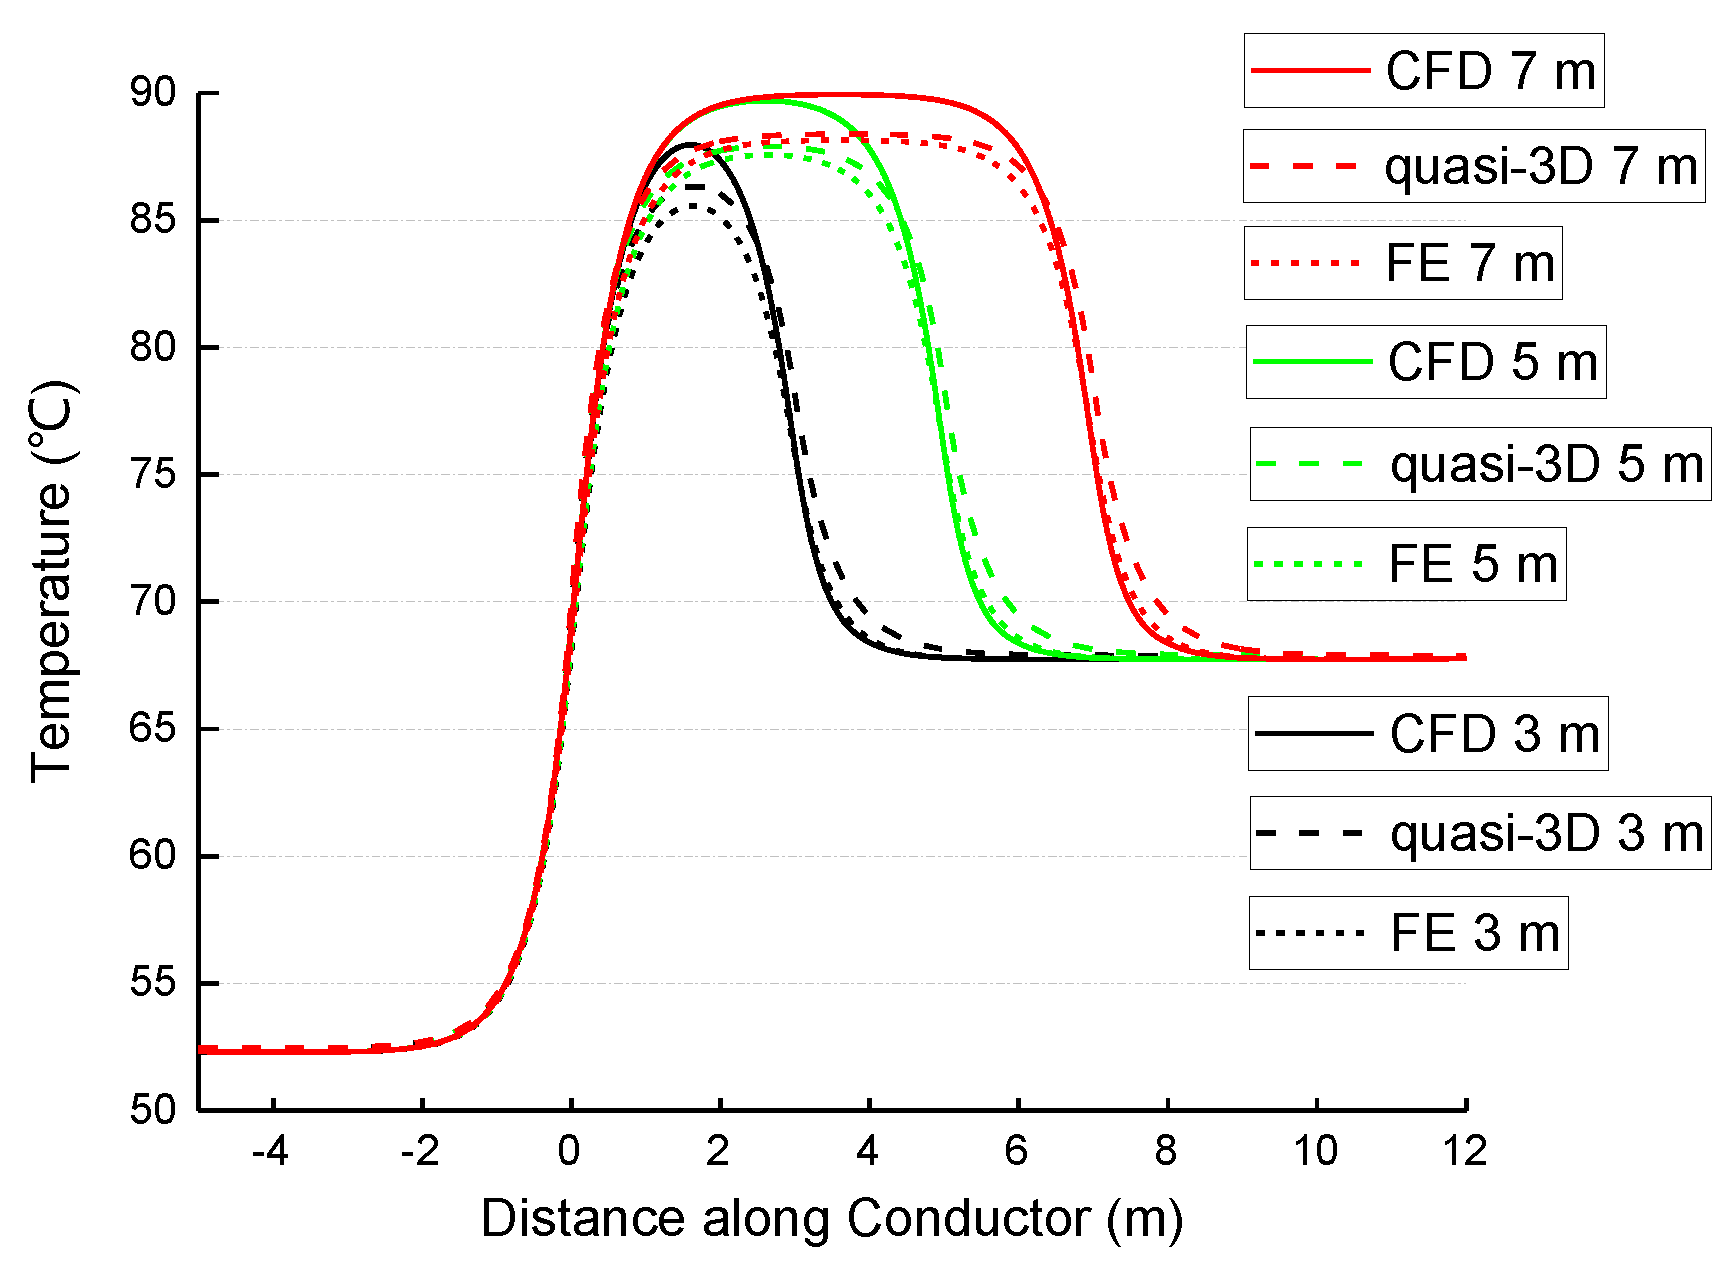
3.1. J-Tube and Cable Parameters

The design parameters of the submarine cable considered in this research are given in Table 1. They are based on a 630 mm2, 64/110 kV single-core XLPE insulated cable, which is often used in Chinese OWF export systems [10,11]. Only one phase of the export circuit is modeled. Within the modeled cable, heat is generated in the conductor, dielectric, sheath, and armoring [12]. These heat sources are defined according to IEC 60287-1 [13]. The sheath and armoring loss factor values are 0.4095 and 1.2703, respectively, with a dielectric loss of 1.4219 W/m.
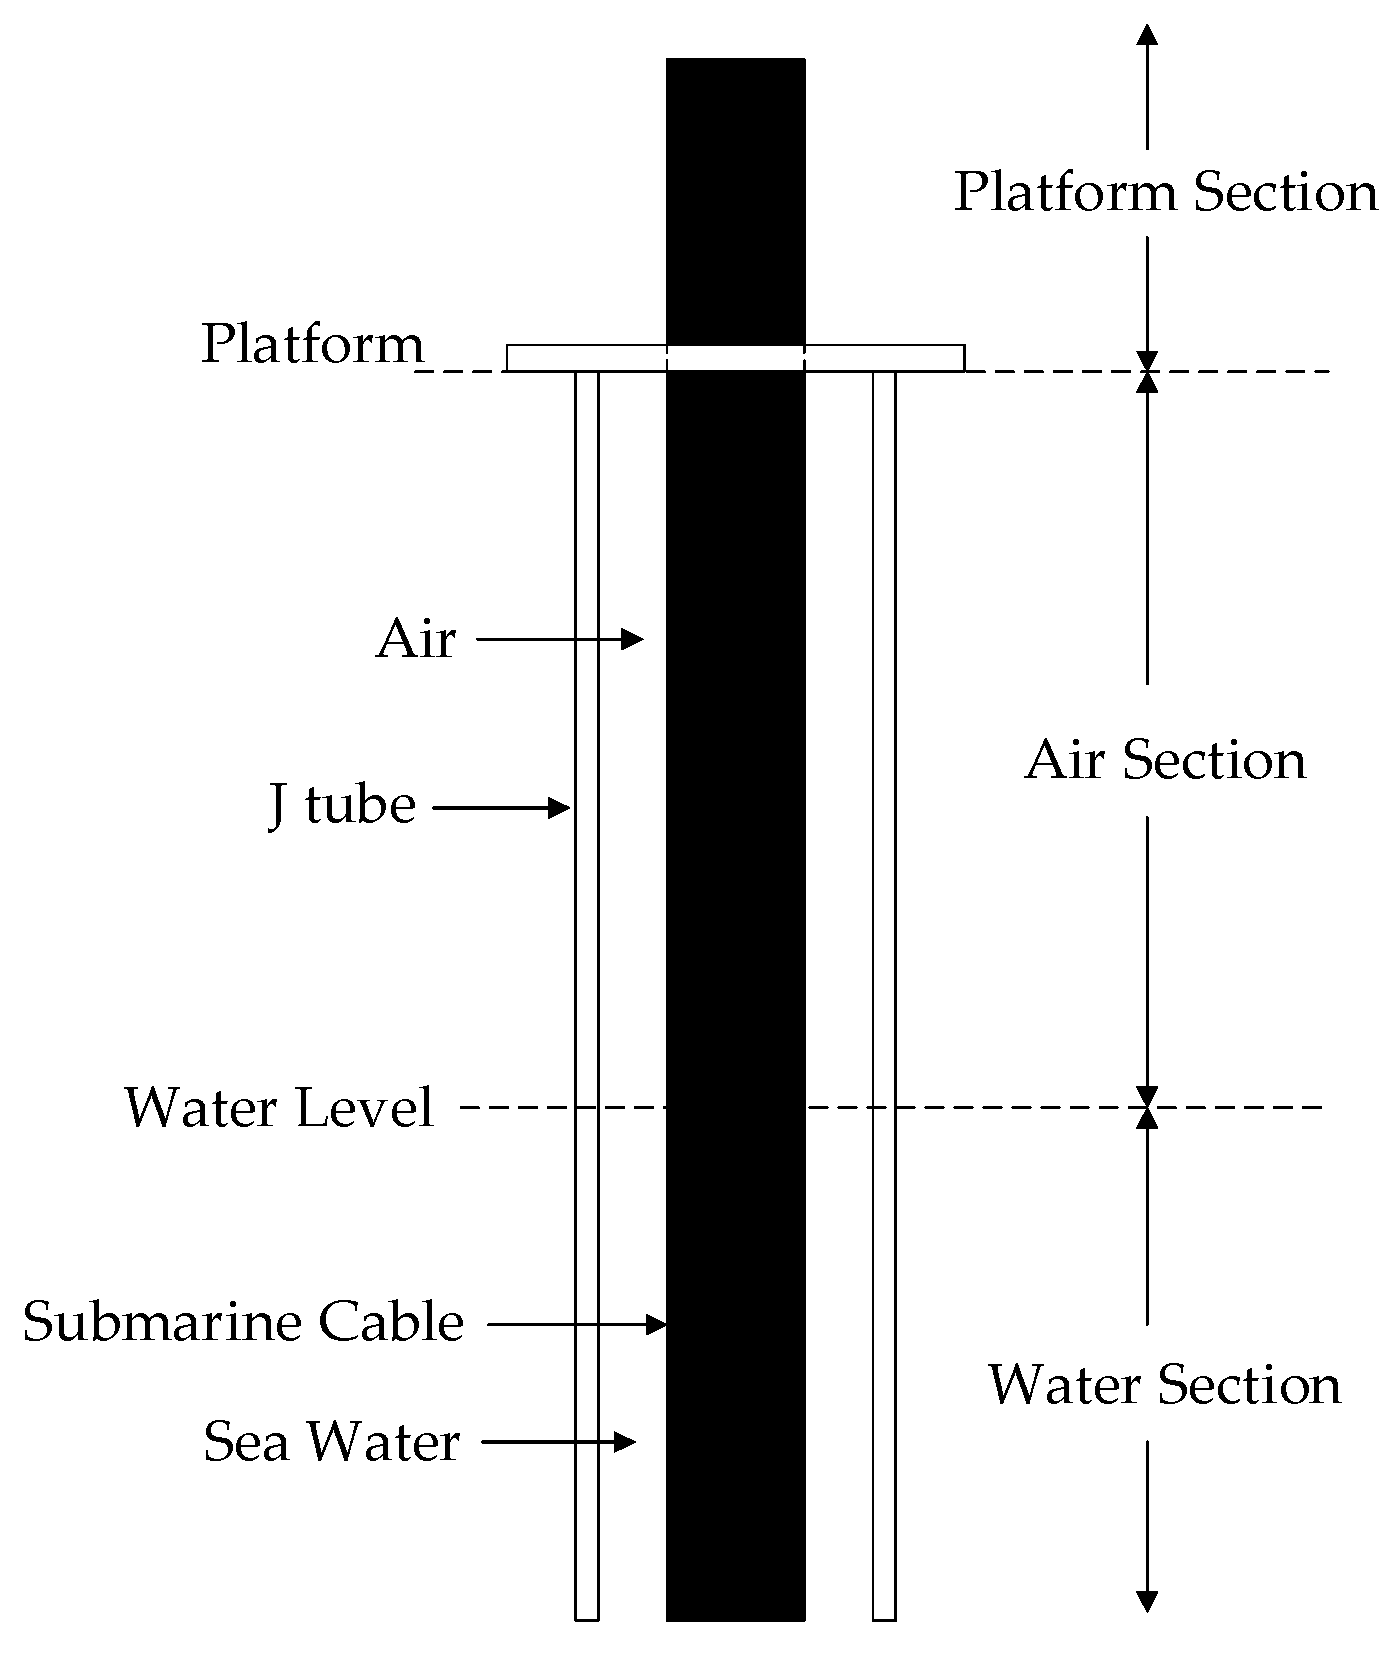
The structure of the J-tube is shown in 
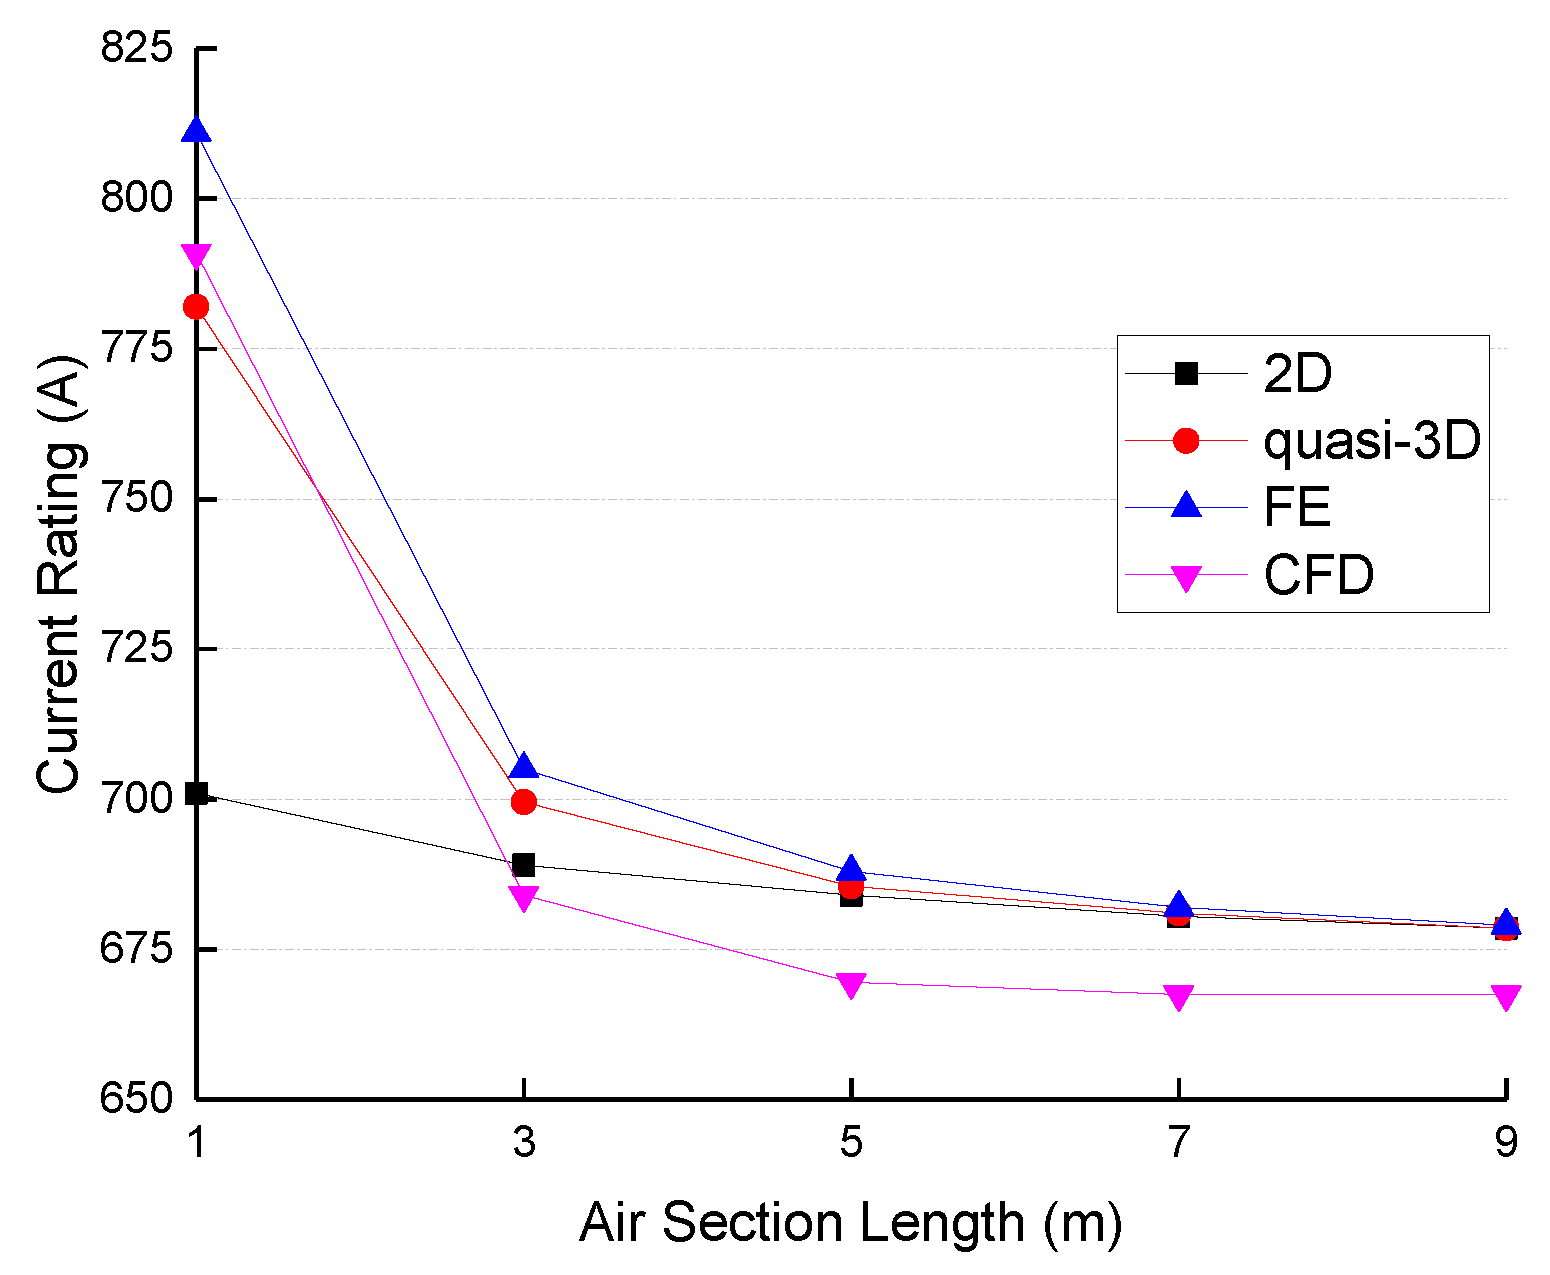
Figure 1. In the models, the length of the air section (Lair) varies from 1 m to 9 m, while the lengths of the water section and the platform section are set at 5 m. The inner radius of the J-tube is twice the outer radius of the cable. The J-tube is of steel construction and is 15 mm thick, with a thermal conductivity of 18 W·m−1·K−1, thus the outer diameter of the J-tube (Do) is 261.6 mm. The platform has a short thickness (0.3 m) and large areas for heat dissipation to the ambient air. Thus, it was not modeled in [4] due to its negligible impact on the overall thermal profile, and it is modeled in this study as a vertical annulus with the same material and outer diameter as the J-tube.

3.2. Enclosed J-Tube Model

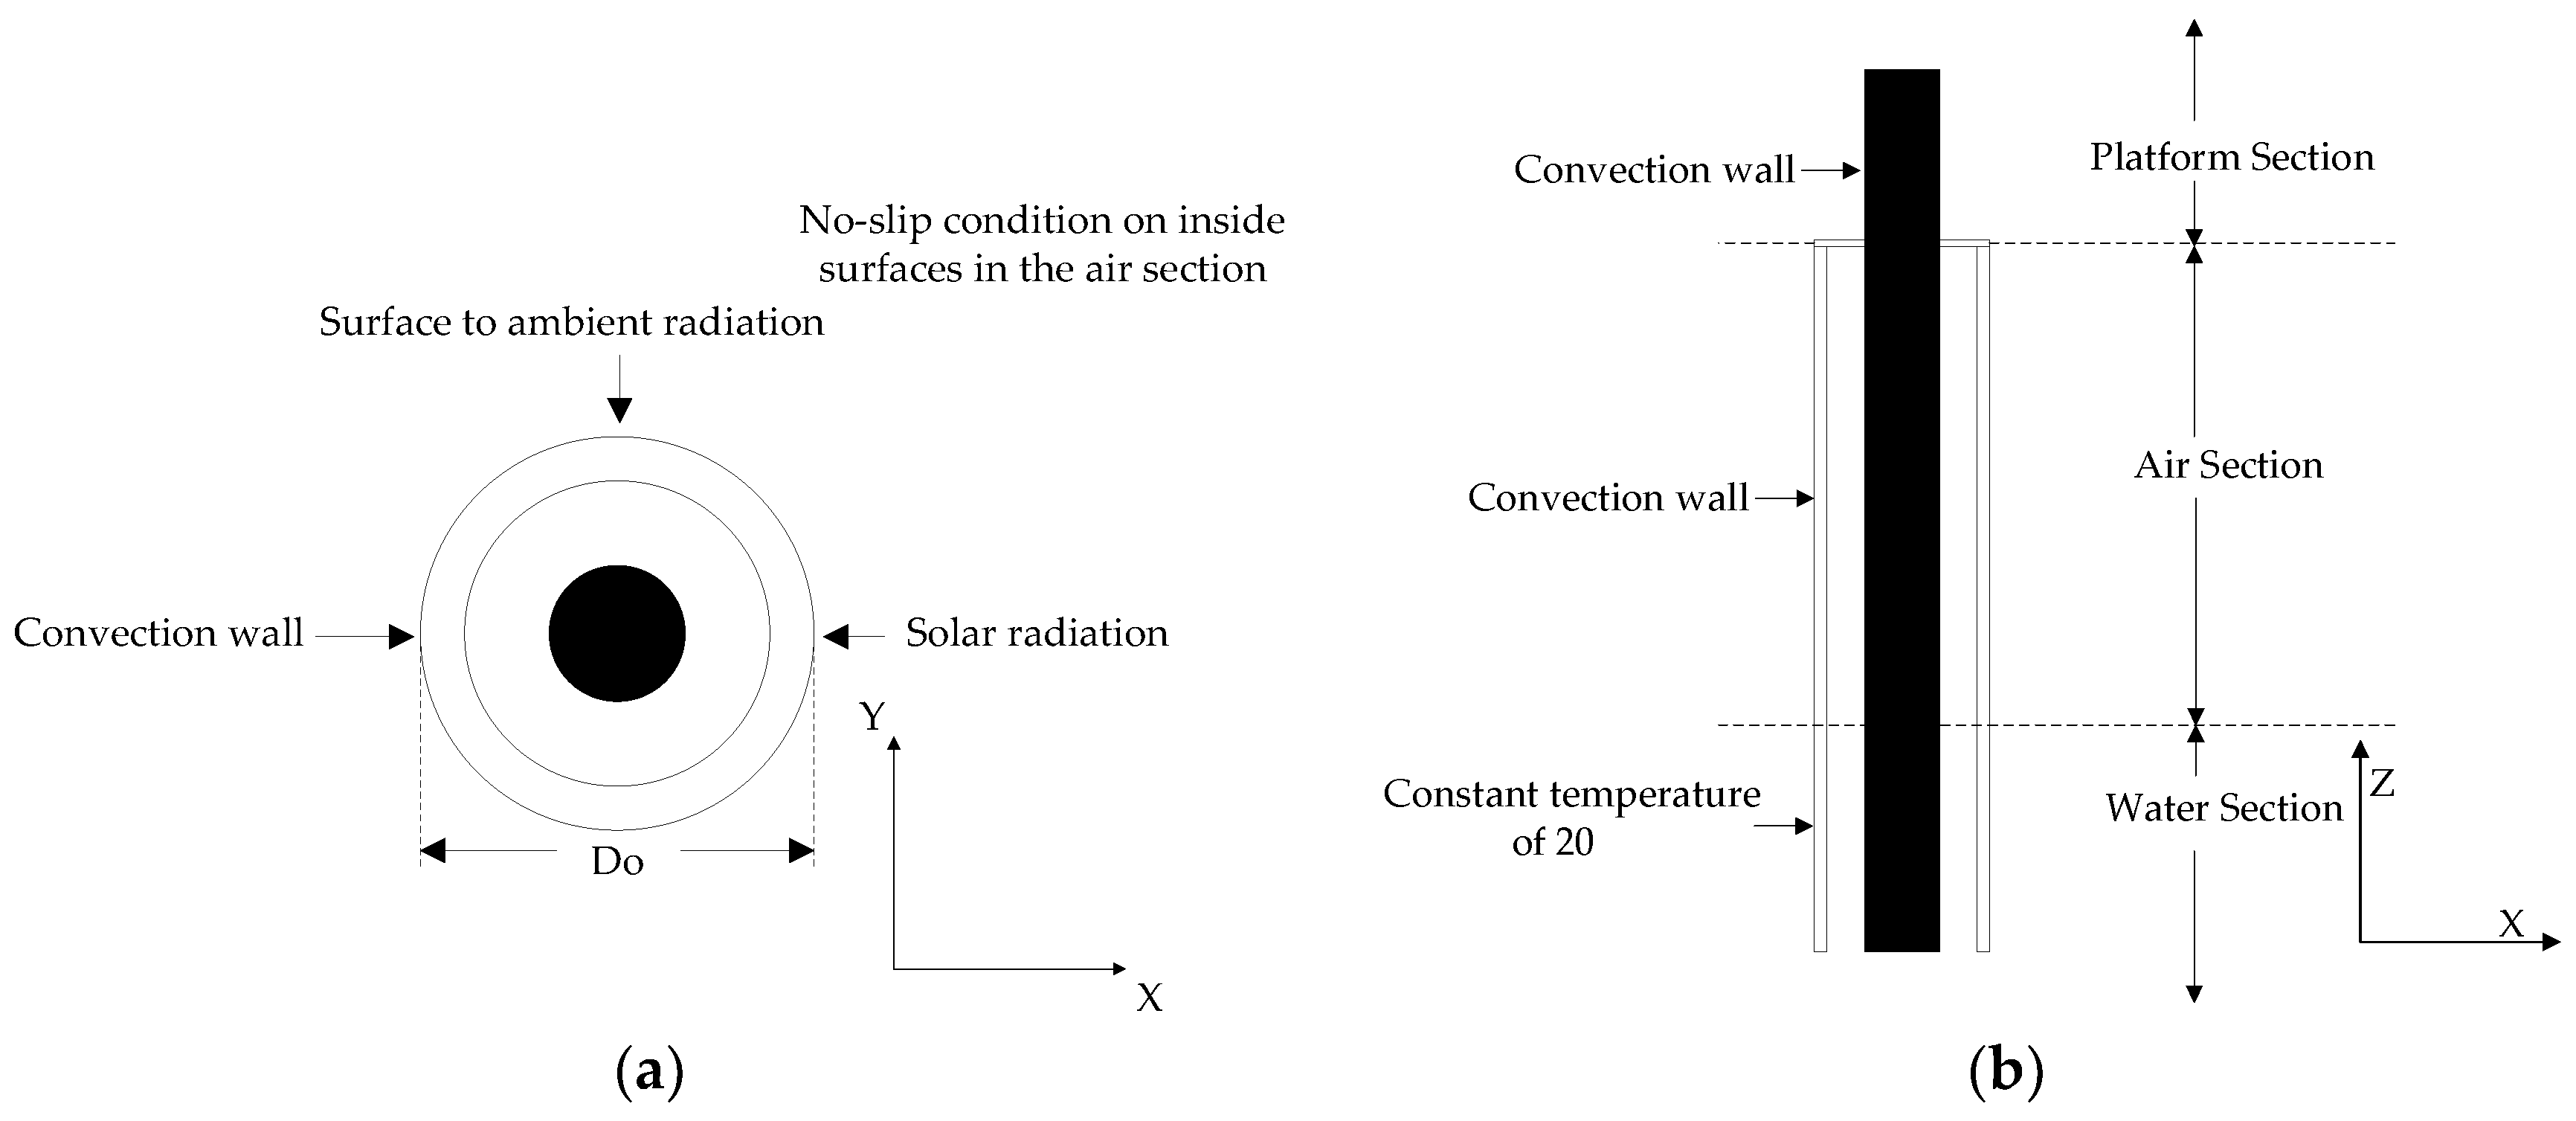
The CFD analysis of the enclosed J-tube system needs to consider the thermo-fluid phenomena involving heat conduction, radiation, convection, conjugate heat transfer between the solid and fluid elements, and buoyancy.
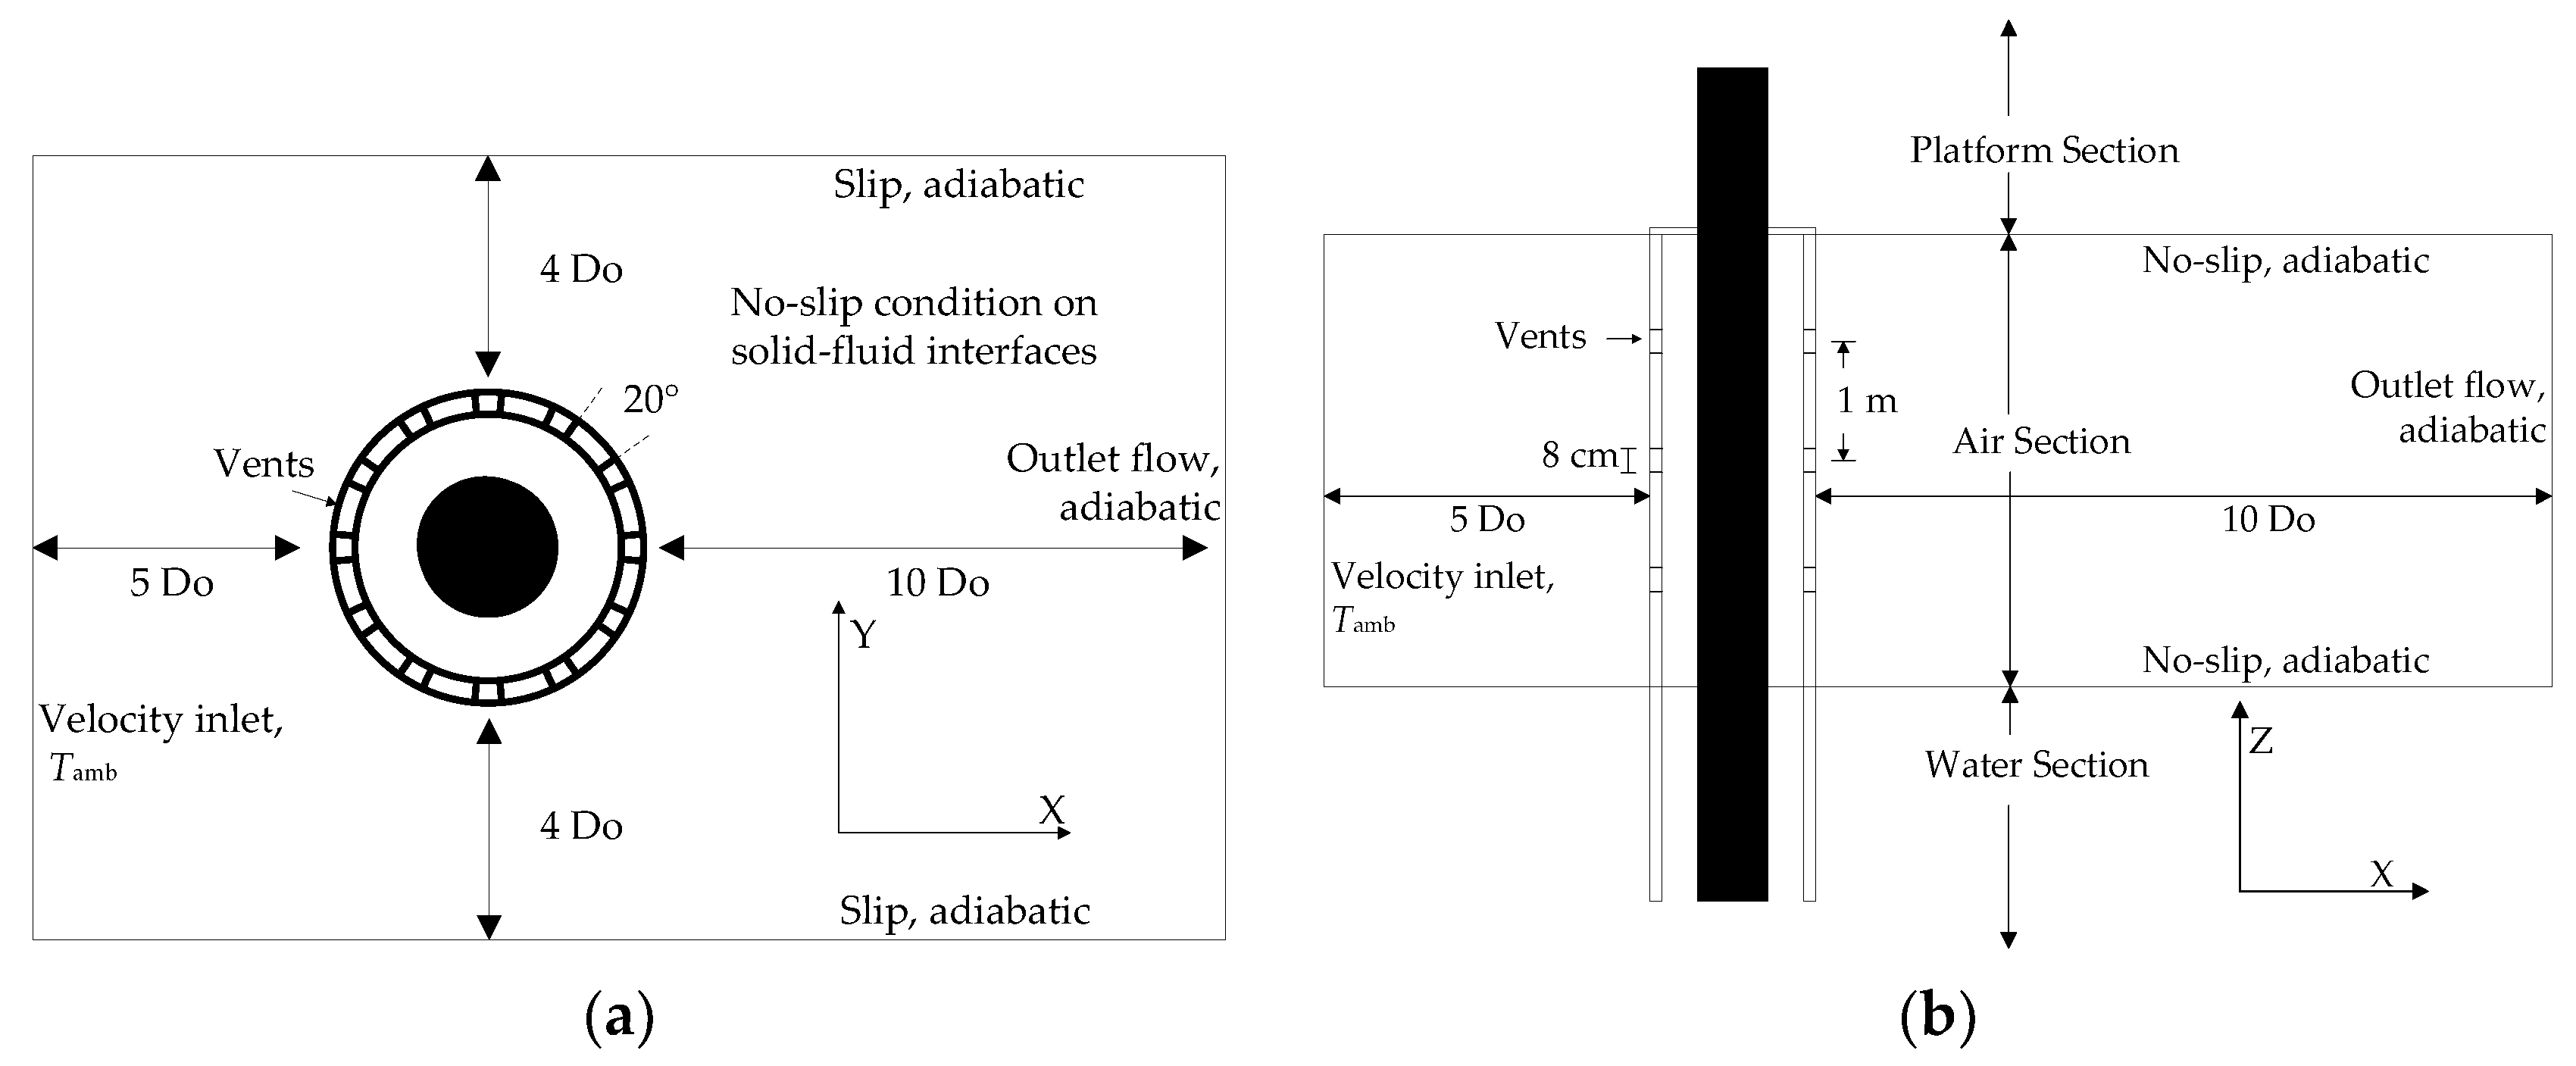
In order to save the computing time that is needed to solve the external flow field, the air outside the J-tube is not included in the computational domain, with the interaction with the external air handled via boundary CHTCs. The computational domain is shown in Figure 2.
Conduction is assumed to be the only heat transfer mode within the cable and the J-tube. In particular, for the water section (similar to [4]), the inside seawater is thermally assumed to be a solid, with a thermal conductivity of 0.58 W·m−1·K
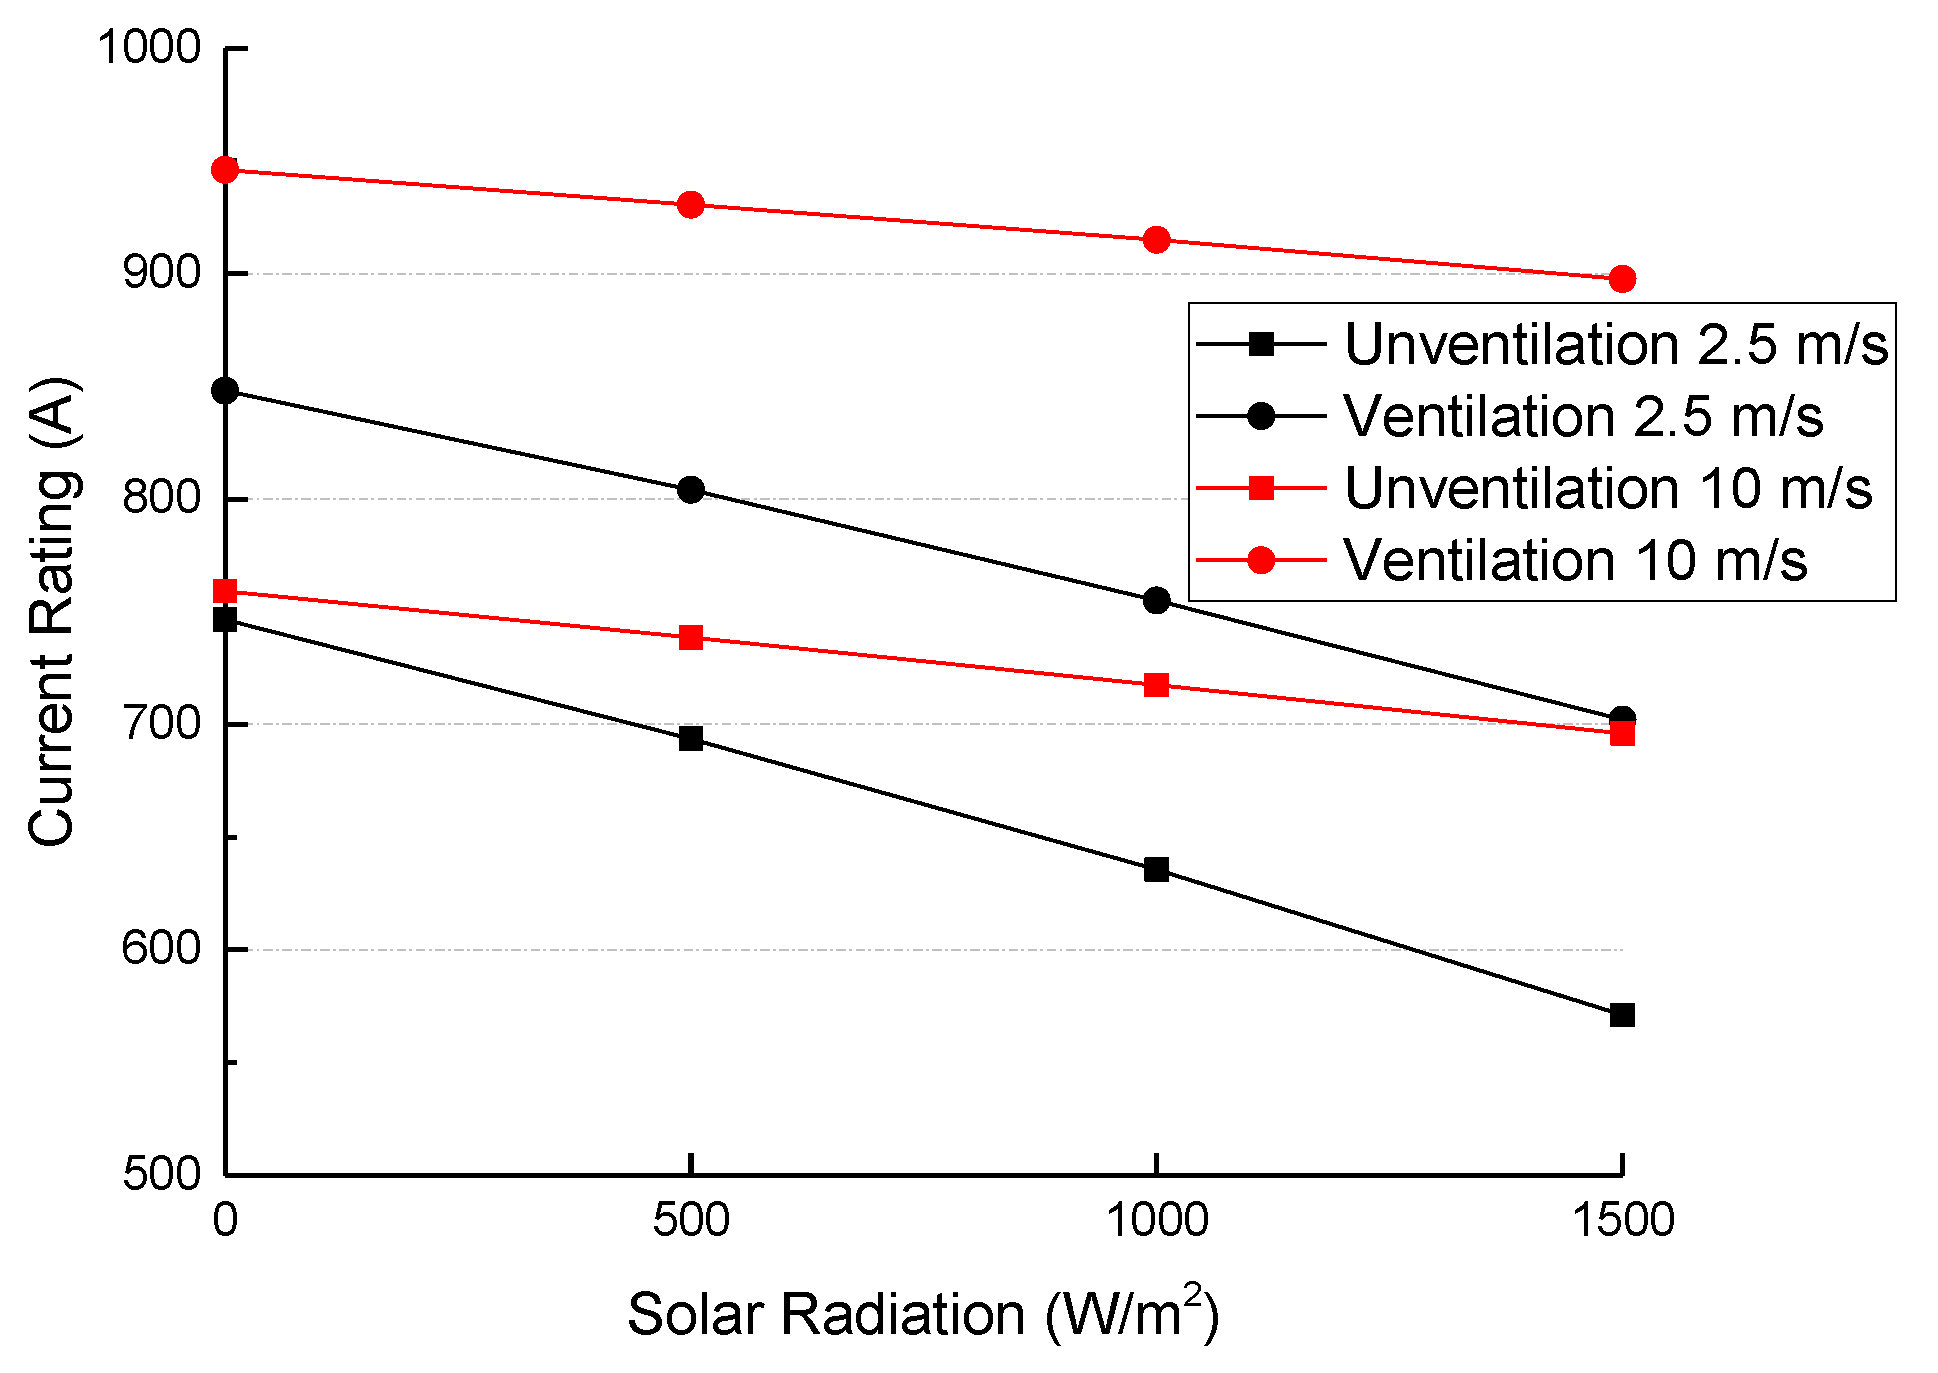
−1, and the J-tube’s external surface is assumed to be at a constant temperature of 293 K (20 °C). Besides, the ambient air temperature (Tamb, K) is set to be 298 K in winter, 303 K in spring and autumn, and 308 K in summer, respectively.
For the air section, the radiation exchanges between the walls inside the annular enclosure are evaluated by setting up the surface to surface (S2S) radiation model, in which the energy exchange parameters are accounted for by a geometric function, called the “view factor” [14]. The surface emissivity values are taken to be 0.9 and 0.7 for the cable surface and J-tube, respectively.
The natural flow in the air enclosure is expected to be turbulent, since the Rayleigh number based on the air section length is estimated to be larger than 109 [15]. The inside turbulent flow is modeled by the Reynolds-averaged Navier-Stokes (RANS) equations for conservation of momentum and the continuity equation for conservation of mass [16]. Although many different turbulence models exist, the standard k-ε model [16] is chosen to predict the turbulent effects. This is because the standard k-ε model achieves a good balance between the computing time and accuracy, while many other models, such as the SST-k-omega model, require enormous computer resources. It has also been demonstrated in [17] that the standard k-ε model can predict results with fairly good accuracy in the case of a tall vertical cavity with inside turbulent flow and surface to surface radiation, which is very similar to an enclosed J-tube.
The Boussinesq approximation is applied to model buoyancy effects inside the J-tube. It is valid due to the small temperature difference ΔT (K) between two vertical walls (less than 35 K in this study) [18], that is
βΔT≪1
where β is the thermal expansion coefficient (K−1). The buoyancy reference temperature and air properties are evaluated at the mean air temperature, which is obtained iteratively from the CFD solutions with initially estimated values.
In addition, the flow near the solid-fluid interfaces inside the J-tube is modeled using the wall function from [19,20], and these surfaces are modeled as no-slip walls, that is
u = v = w = 0
where u is the velocity in X direction (m/s); v is the velocity in Y direction (m/s); and, w is the velocity in Z direction (m/s).
The boundary-layer meshing technique is also used to ensure enough grid density within the boundary layers.
The dimensionless local cable CHTC hc,loc (W·m−2·K−1) and radiative heat transfer coefficient (RHTC) hr,loc (W·m−2·K−1) are defined as
h c , loc = λ T x | wall T h T c
h r , loc = q r T h T c
where T is the fluid temperature (K); Th is the local cable surface temperature (K); Tc is the local J-tube inside surface temperature (K); and, qr is the cable radiative heat flux (W/m2).
The final step is defining the boundary conditions that are imposed on external surfaces above the sea level.
Modeling of the surface to ambient radiation is also achieved with the S2S radiation model.
The effect of solar radiation is modeled by boundary heat sources distributed uniformly on the external surfaces, that is,
q b = 0.5 α 0 q sun
where qb is the boundary heat source (W/m2); α0 (dimensionless) is the absorptivity to solar radiation, which is assumed to be 0.95 for all external surfaces; qsun (W/m2) is the solar flux, which is set to be 1000 W/m2 according to IEC 60287-2 [21]; and, the additional 0.5 term is used since the solar flux can only affect half of the surface due to shadow.
Equivalent average CHTCs hcomb (W·m−2·K−1) is applied to external surfaces, that is
h c omb = ( h nc 2 + h fc 2 ) 1 / 2
where hnc (W·m−2·K−1) and hfc (W·m−2·K−1) are the heat transfer coefficients for natural convection and forced convection, respectively. The calculation methods can be found in [6].

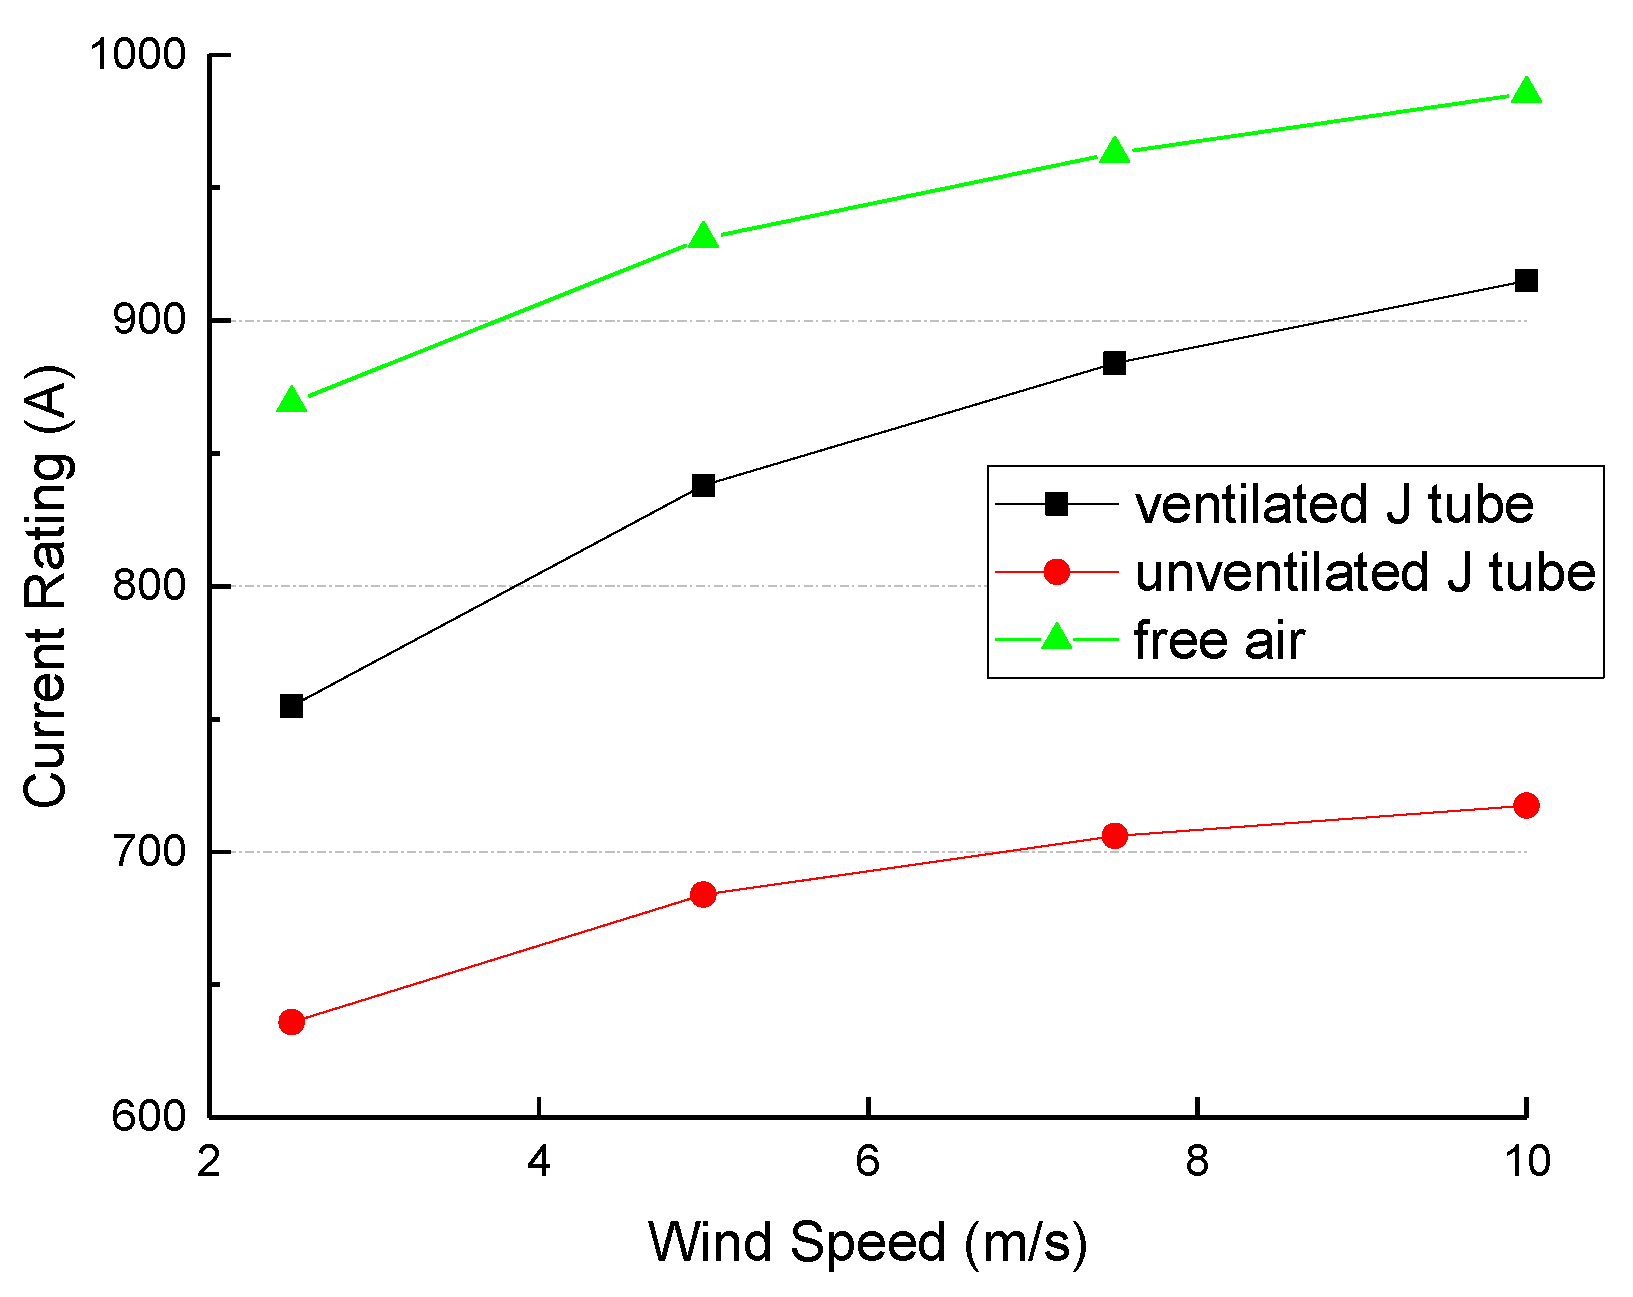
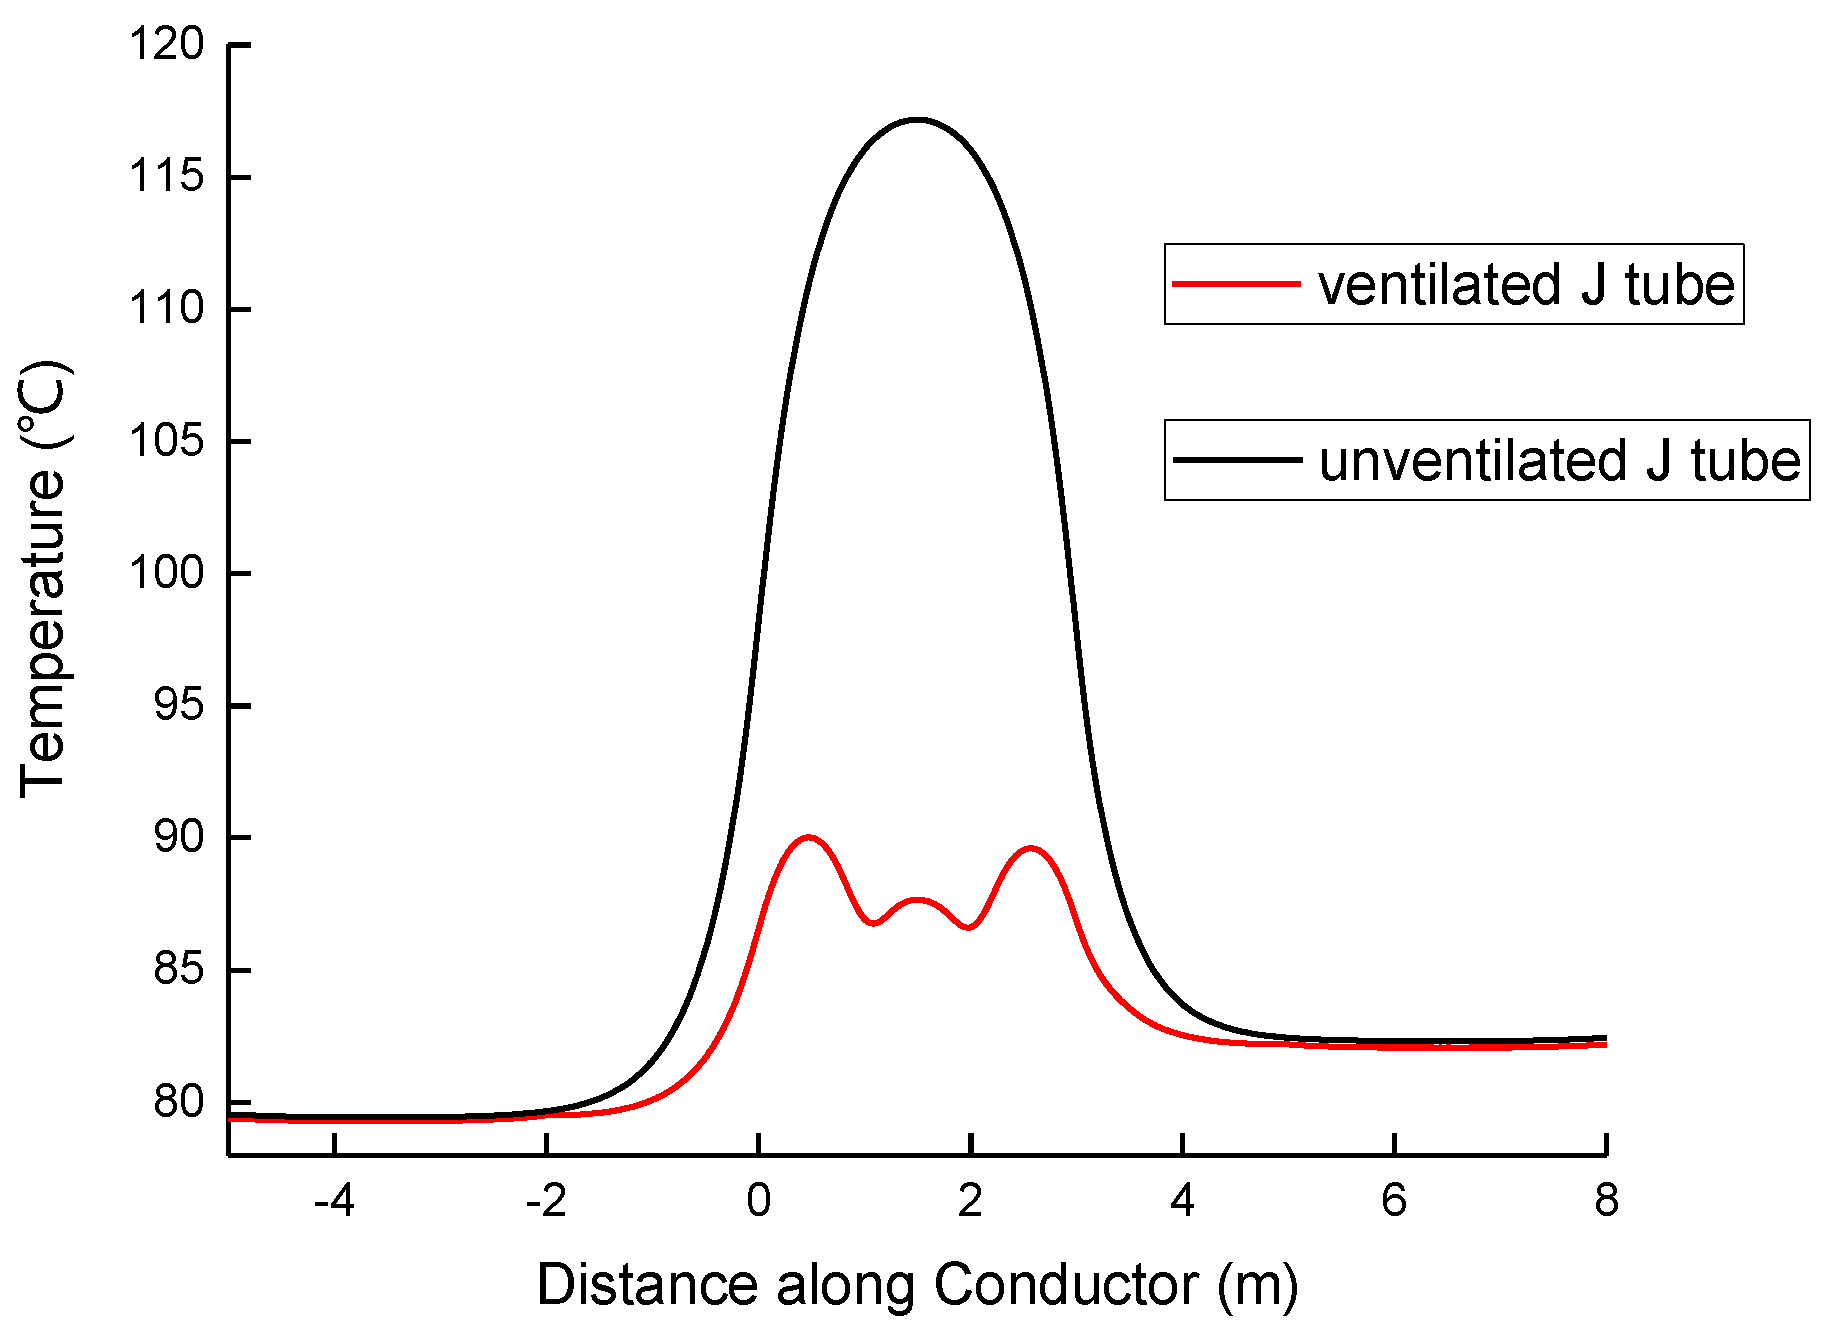
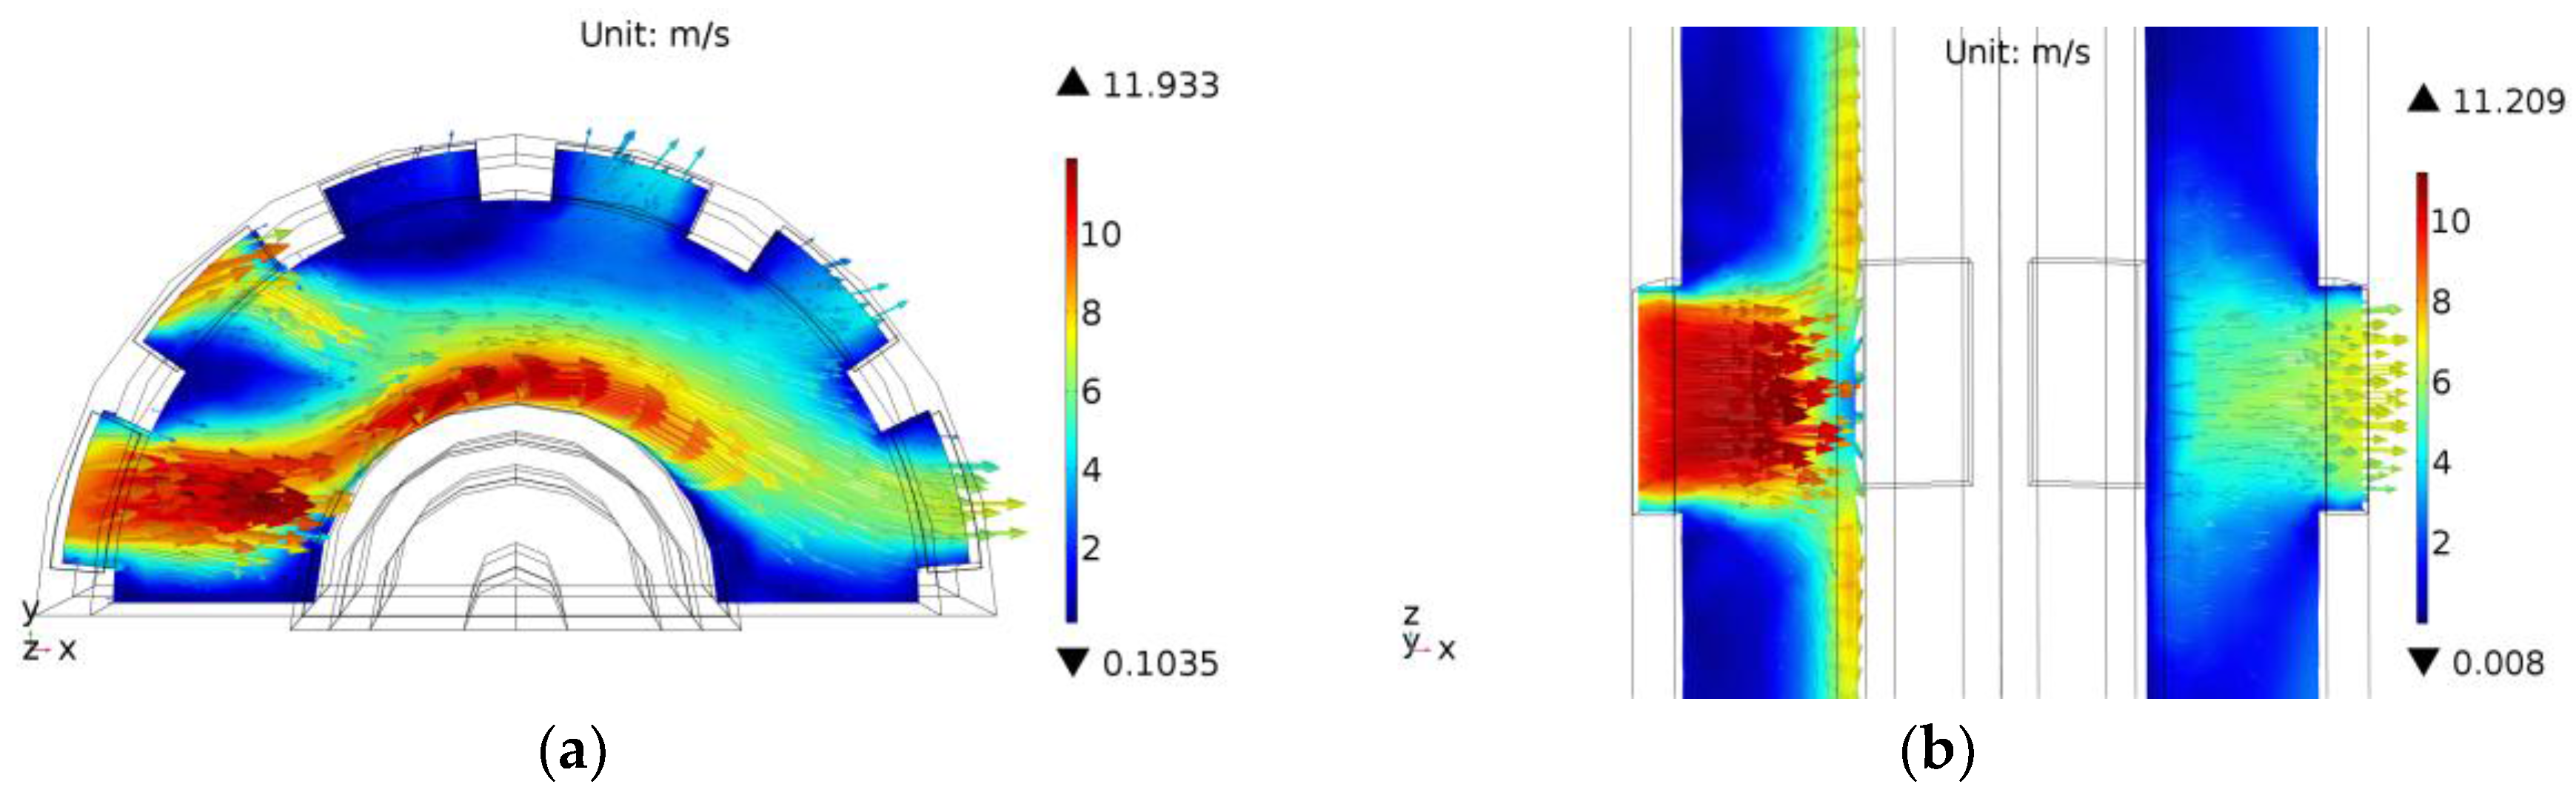
3.3. Ventilated J-Tube Model

For the ventilated J-tube, the model is built on the basis of the enclosed J-tube model, and much of the design is similar to that of the enclosed case, with the only changes being some air vents on the J-tube, as shown in Figure 3.
Since the flow field inside the J-tube is closely associated with the external flow filed, the external air needs to be included in the computational domain, as shown in Figure 3. It should be noted that only the ambient air around the air section is modeled, and the equivalent CHTCs calculated by Equation (7) are applied on the external surfaces in the platform section. Thus, the domain height is equal to the Lair. It is considered that this simplification would have little impact on the rating that was obtained, since the platform section provides much less thermal limitation than the air section, and the rating mainly relies on the thermal environment between the cable and the J-tube in the air section. Therefore, for the air section, in the X and Y directions, −5.5 ≤ x/Do ≤ 10.5 and −4.5 ≤ y/Do ≤ 4.5, and in the Z direction, 0 ≤ z ≤ Lair.
The external flow across the J-tube is often turbulent, since the Reynolds number based on Do is estimated to be from 5 × 10⁴ to 2 × 10⁵ for wind speeds from 2.5 to 10 m/s [
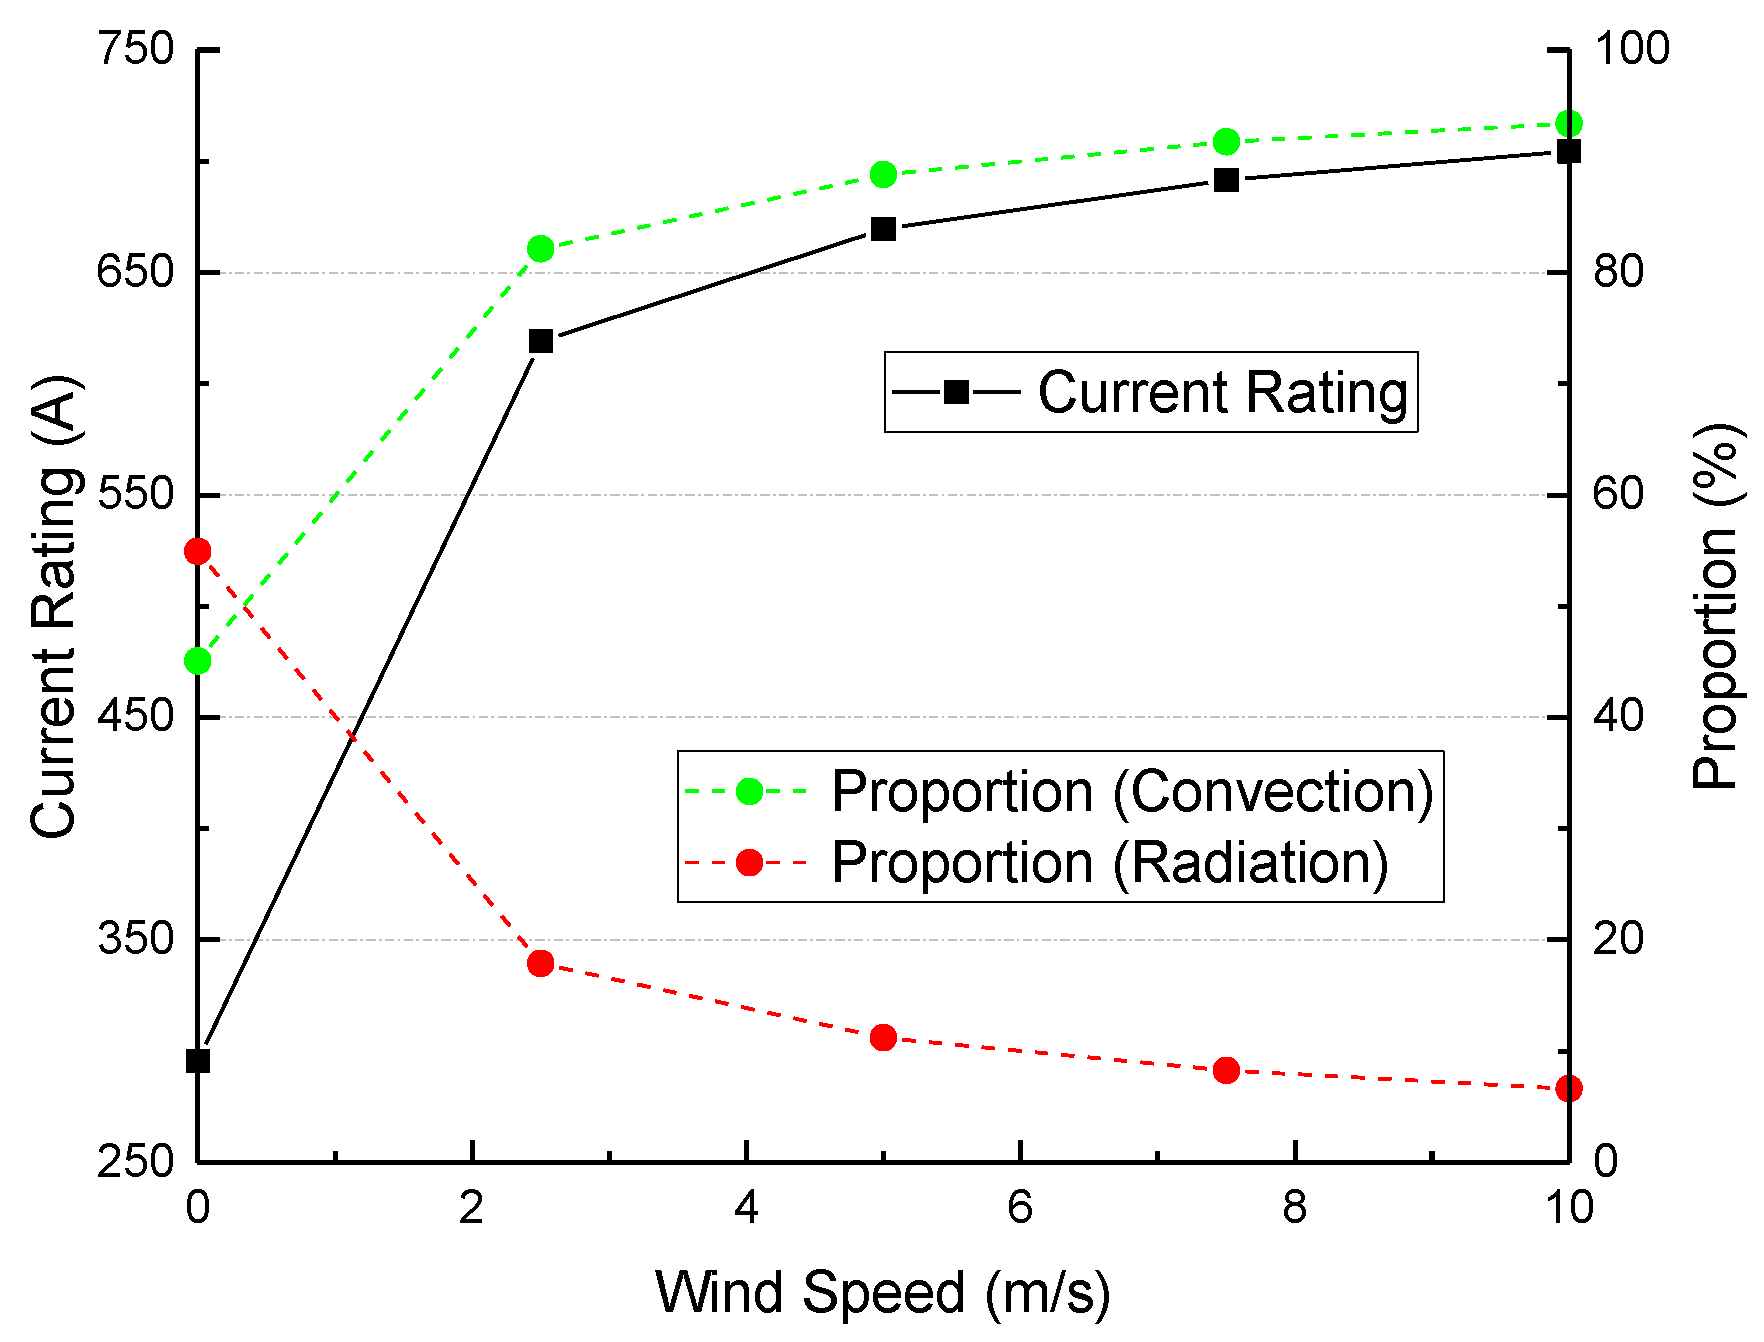
15]. The flow inside the tube is complicated, but the mean air speed should be much larger than that of the enclosed case due to the forced ventilation, and thus turbulent flow is also expected. The turbulent flow model that is applied in the enclosed case is also used here to solve the whole flow field in the computational domain. Besides, a boundary-layer meshing technique is also used to ensure enough grid density near the fluid-solid interfaces, especially near the vents.
The final step is defining the boundary conditions of the domain, as shown in Figure 3.
At the inlet of the domain, the mean wind speeds perpendicular to the inlet and uniform ambient air temperature Tamb are specified. Zero static pressure is specified at the outlet. No-slip wall conditions are imposed at the top and ground boundaries when considering the upper platform and the lower seawater (assumed to be solid). The lateral boundaries of the domain are modeled as slip walls, that is
v = w = u y = u z = 0
For all the boundaries of the domain except the inlet, adiabatic boundary conditions are assumed. This simplified assumption may affect the temperature and flow fields adjacent to the platform and the sea water, but it should have small impact on the whole temperature and flow fields due to the large volume of the air flowing into the domain.
Other boundary conditions, such as the temperature settings, surface to ambient radiation, and solar radiation, are same with those of the enclosed case.

4. Modeling Results and Analysis

The continuous rating results of enclosed J-tubes are calculated by different models, as described in Section 2 and Section 3. The rating calculation for ventilated J-tubes with the CFD model developed in Section 3 then follows. All of the CFD simulations are performed using heat transfer and CFD modules from COMSOL Multiphysics 5.3. In simulations, all of the governing equations are discretized by the FE method, a stationary segregated solver is used for each mode of physics separately, and all of the residuals are run down to less than 1 × 10⁻³. The season is summer if not otherwise specified.

4.1. Ratings of Enclosed J-Tubes

In CFD simulations, anywhere between 105,000 and 608,000 triangular mesh elements are used, depending on Lair from 1 to 9 m. Grid independence studies show that across quite a wide range, grid spacing exerts a very minor influence on the calculated peak temperature. For example, when Lair = 1 m and the wind speed is 5 m/s, the change of the peak temperature is less than 0.5% for the total grid number ranging from 105,000 to 313,000.
The conductor temperature profiles of the different 3D methods (the quasi-3D analytical method, the FE method, and the CFD method) are presented in Figure 4, in which the wind speed is 5 m/s and the load is 667 A. It is apparent that the temperature profiles of these 3D methods are very similar, the peak temperature point is approximately located at the center of the air section, and the temperature decreases towards both cooler sections due to the LHT. Besides, there is a small part of conductor in the hottest central air section, where the temperature remains nearly constant for Lair ≥ 5 m, that is, the LHT in this part of conductor has become very weak.
Ratings results at a wind speed of 5 m/s are displayed in Figure 5. For Lair = 1 m (AR = 17), all 3D models predict much higher ratings than the 2D analytical method. However, due to the quickly diminishing LHT in the central air section, the gaps between all the 3D results and the 2D results decrease rapidly with the increasing Lair. In particular, the results of the methods from [4] are generally very close for Lair ≥ 5 m (AR = 86). The FE method predicts only a 0.6% higher rating than the 2D method for Lair = 5 m, which may be a result of the already very weak LHT in the central air section. This is because the total local cable heat transfer coefficients (HTCs) at the center of the air section of these two methods are very close, as shown in Table 2. In other words, the equivalent radial air thermal resistances of these two methods between the cable and the J-tube are very close.
It is also clear in Figure 5 that the CFD method gives the most pessimistic results of all the methods for Lair ≥ 3 m. For example, the CFD method predicts about 2.3% lower results than the 2D method for Lair = 5 m. This is because in the central air section the total local cable HTC of the CFD method is lower than that of the 2D method. Thus, even though the LHT (which is already not very effective) is considered, the CFD method still predicts higher peak temperature than the 2D method. Besides, it is also found in Table 2 that the main heat transfer inside the enclosed J-tube is via radiation, with less than 20% of total heat via natural convection. Thus, although the CHTC determined, empirically in the 2D method, is about 60% higher than the CFD value, the absolute value of the difference in CHTC is not very large, and hence the impact on the conductor temperature is not obvious.
Overall, the CFD model is in good agreement with the models in [4]. This can be seen as a validation of the CFD model developed for enclosed J-tubes. In addition, the successful application of the CFD technique to enclosed J-tubes provides evidence that the CFD technique could also be used to calculate cable ratings in ventilated J-tubes.
In addition, the impact of wind speed on the rating is also shown in Figure 6, in which the air section length is 5 m. It is found that a small increase of wind speed from 0 to 2.5 m/s could improve the rating by up to 85%. This is because when compared with the no-wind condition, the forced convection from the wind could take away a lot of heat from external surfaces and help cool the J-tube system significantly. Thus, the convection (mainly forced convection) becomes dominant in transferring heat outside the J-tube, with more than 80% of total heat transferred outside the J-tube via convection, as shown in Figure 6. However, when the wind speed continues to increase, the cooling effect quickly approaches its ultimate value and the improvement of rating diminishes rapidly. The rating increases by only 5.17% when the wind speed doubles from 5 to 10 m/s.

4.2. Ratings of Ventilated J-Tubes

The following section will test the performance of the ventilated design in which the natural wind is utilized, and the wind speed considered ranges from 2.5 to 10 m/s. Due to the limitation on computing resources, the length of the air section is chosen to be 3 m, which is considered to be sufficient to represent the improvement of rating and the thermal and fluid characteristics inside J-tubes with longer lengths. When the total number of tetrahedron meshes ranges from about 2,023,000 to 4,530,000, the change of the peak temperature is less than 1%. Thus, in the simulations for ventilated J-tubes, the total number of meshes is restricted to be about 2,023,000 to reduce the computing time. Besides, the free-air cable rating is also calculated by the 2D analytical method, in which the J-tube is assumed to be removed, that is, the forced CHTC from the wind is applied directly on the cable surface.
The rating results are shown in Figure 7. It is apparent that the introduction of forced ventilation enabled a significant increase in rating, with the improvement rising from 18.9 to 27.5% when the wind speed increases from 2.5 to 10 m/s. For the ventilated J-tube, the same increase of wind speed leads to approximately twice the rating increase for the unventilated case.
Although the ratings are still below those that were predicted from the same cable with no J-tube covered, the ventilated design produced about 86.9–92.9% of the free-air rating for wind speeds from 2.5 to 10 m/s, while for the enclosed cases, these values ranged from 73.1 to 72.8%. In other words, the restriction on cable rating due to the J-tube is eased significantly. This improvement in rating is significant for OWFs where the J-tube is the potential thermal pinch point along the export circuit, especially at high wind speeds, since a huge OWF output may be reached.
The conductor temperature distributions for the ventilated and unventilated J-tubes at a load of 915 A are presented in Figure 8. It is apparent that the temperature in the air section experiences a significant drop when the J-tube becomes ventilated, and the lowest conductor temperature points are located in positions right to the vents. The main reason for the drop of conductor temperature is that the effect of convection inside the J-tube has been enhanced greatly due to the forced ventilation, which enables much more heat to be transferred via convection.
As shown in Table 3, inside the enclosed J-tube the natural convection allows for only a small part of heat to be transferred to the J-tube (13% at 2.5 m/s). Thus, most of the heat generated in the cable is via S2S radiation, and the thermal environment between the cable and the J-tube is poor. In contrast, the inside heat transfer modes changed greatly in the ventilated case, and the inside air convection plays a much greater role in heat transfer. About 60% of heat that is generated in the cable is via convection at 2.5 m/s. The heat via radiation shows a dramatic drop by about 39%, with the remainder transferred longitudinally through the cross sections where the air section meets other two cooler sections. The enhanced effect of convection enables much more total heat to be transferred outside the cable before the limit of the conductor temperature is reached, that is, the thermal environment inside the J-tube has been improved greatly.
The enhanced inside convection is first due to the much larger inside air flowing speed when compared with the enclosed case. As is shown in Table 4, the overall inside air flows much faster than in the enclosed case, and with the increasing external wind speed, the inside air moves more quickly and the effect of convection is also improved.
The inside air velocity profile is shown in Figure 9. Horizontally, the air near the intakes and the cable surface have much larger speed when compared with other places, which helps the heat transfer from the cable to the flowing air. Vertically, the air near the intake is moving the most quickly, thus the small sections of cable right to the vents receive the best cooling effects and experience the most temperature decrease. Although the air speed decreases rapidly while the air flows upward or downward from the intake, the air away from the intake is still motivated to move much faster, which is shown in the mean velocities across several air cross sections with different Z coordinates (Table 5). This change means the sections of cable away from the vents could also directly benefit from the forced ventilation, thus the conductor temperature along the whole air section would clearly decrease.
The increased effect of convection is also related to the much lower inside air temperature compared with the enclosed case. It is clear in Table 4 and Table 5 that, due to the cooler air flowing into the J-tube, the mean air temperature inside the J-tube decreases by more than 10 °C, and the air away from the vents could also become much cooler.
It is also found that nearly all heat transferred outside the cable via convection is further taken away outside the J-tube through the vents, and a small part of heat generated due to the solar radiation on external surfaces is transferred to the ambient via the convection inside the J-tube (7.3% at 2.5 m/s). This is because of the lower inside mean air temperature as compared with the mean J-tube temperature (52.5 °C at 2.5 m/s). This is very different from the enclosed case, where heat generated in the cable is transferred to the J-tube and further, together with the heat that is generated due to the solar radiation, transferred to the ambient via outside convection and radiation.

4.3. Sensitivity Analysis

A comparative sensitivity analysis was undertaken with respect to some important factors. In the analysis the air section length is 3 m, which should not influence the following conclusions about these factors.

4.3.1. Ambient Temperature

In different seasons, the ambient temperature may vary a lot. The rating results in different seasons are shown in Table 6.
The decrease in ambient temperature by 5 °C increases the rating by about 40 A for the ventilated design, while there is less of an improvement for the enclosed design (30 A). The difference in improvement may be because the cooler ambient air can flow into the ventilated J-tube and bring a more obvious improvement for the inside thermal environment, while the cooler air can only directly influence the external surfaces of the enclosed J-tube.

4.3.2. Solar Radiation

In the simulation models, the intensity of solar radiation can be changed by different boundary heat sources applied on external surfaces, and the impact of solar radiation on rating is shown in Figure 10. It is found that the ventilated design is less sensitive to the solar radiation than the unventilated design. For a wind speed of 2.5 m/s, a 100 W/m2 increase in solar radiation reduces the rating by about 97 A for the ventilated design, while a further 31 A reduction is seen for the enclosed case. This is because the thermal environment inside the ventilated J-tube is much better, and the inside convection could also take away a part of the increased heat due to the stronger sunlight. Thus, the solar radiation has smaller impact on the conductor temperature.
In addition, it is apparent that the impact of solar radiation becomes smaller at higher wind speeds. An increase in solar radiation of between 500 and 1500 W/m2 leads to an about 59 A rating decrease at 2.5 m/s, while the change is only about 19 A at 10 m/s. This is because higher wind speed means more effective forced convection on external surfaces. Thus, more generated heat due to the enhanced sunlight can be removed from external surfaces.

4.3.3. J-Tube Emissivity

The emissivity of the J-tube may be affected by finish and the material. The unventilated J-tube rating is quite sensitive to the emissivity. Taking the wind speed of 2.5 m/s as an example, an increase of emissivity from 0.5 to 0.9 produces an increase in rating of 48 A. This is mainly due to the dominance of radiation in heat transfer inside the J-tube, and thus the increased emissivity produces a clear promotion of the inside heat exchange. The second but much less important cause is the larger emissivity, which also allows for more heat to be transferred outside J-tube via radiation, but the proportion of heat via radiation is much lower (about 18% at 2.5 m/s). For the ventilated design, a smaller effect is seen (19 A), which is expected since much more heat transfer inside the J-tube occurs via air convection rather than through radiation.

5. Conclusions

The performance of a forced ventilation design utilizing natural wind for the OWF J-tube was evaluated using a developed 3D CFD model, since no methods for such ventilated J-tube existed previously. The CFD technique was first applied to enclosed J-tubes, and the results showed that the CFD model for the enclosed design predicted overall close but slightly more conservative ratings, as compared to the existing methods in [4]. This is a validation of the CFD method.
As expected, the application of the CFD model to the ventilated design resulted in a significant improvement in rating due to the forced ventilation, which ranged from 18.8 to 27.5% for wind speeds from 2.5 to 10 m/s. The ventilated design produced up to 86.9–92.9% of the free air rating for wind speeds from 2.5 to 10 m/s. It was also found that the inside heat transfer modes changed a lot due to the forced ventilation—the heat via convection accounted for more than 60% of the total heat generated in the cable in the air section, while this proportion was less than 20% in the enclosed case. The effect of convection would also enhance with the increased external wind speed and the decreased ambient air temperature. In addition, the sensitivity analysis also found that the impacts of solar radiation and J-tube emissivity were smaller for the ventilated J-tube when compared with the enclosed J-tube.
This rating upgrade is believed to be significant for OWFs where the rating of the J-tube may limit the OWF output, especially at high wind speeds. Benefits also include the capital saved, as there is no need to add extra cables or enlarge the conductor size.
Future works include the experimental verification of the CFD model for a ventilated design. Besides, the application of many other different turbulent models should also be considered, but only if sufficient computer resources are available.

Acknowledgments

The work described in this paper was fully supported by a research grant from Guangdong Electric Power Design Institute Co. Ltd. of China Energy Engineering Group (Project No. EX02061W).

Author Contributions

This paper is a result of the collaboration of all co-authors. Gang Liu conceived the study. Lei You designed the study, established the model, implemented the simulations, and drafted the manuscript. Jian Wang guided and revised the paper. Hui Ma refined the language. Ming Zheng collected the references. All authors read and approved the final manuscript.

Conflicts of Interest

The authors declare no conflict of interest.

Nomenclature

Variables
hcthe average cable surface CHTC, W·m−2·K−1
λthermal conductivity of air, W·m−1·K−1
δgapradius gap of the vertical annulus in the air section, m
RaRayleigh number based on δgap, dimensionless
ARaspect ratio, dimensionless
Kradius ratio, dimensionless
Tambambient air temperature, K
ΔTtemperature difference between two vertical walls in the air section, K
uvelocity in X direction, m/s
vvelocity in Y direction, m/s
wvelocity in Z direction, m/s
Tfluid temperature, K
Thlocal cable surface temperature, K
Tclocal J-tube inside surface temperature, K
qrcable radiative heat flux, W/m2
qbboundary heat source due to solar radiation, W/m2
α0absorptivity to solar radiation, dimensionless
qsunsolar flux, W/m2
hcombequivalent average CHTCs applied on external surfaces, W·m−2·K−1
hncheat transfer coefficients for natural convection, W·m−2·K−1
hfcheat transfer coefficients for forced convection, W·m−2·K−1

Abbreviations

OWFoffshore wind farm
3Dthree-dimensional
CFDcomputational fluid dynamics
2DTwo-dimensional
CHTCconvective heat transfer coefficient
LHTlongitudinal heat transfer
FEFinite Element
Lairlength of the air section
Doouter diameter of the J-tube
S2Ssurface to surface
RANSReynolds-averaged Navier-Stokes
RHTCradiative heat transfer coefficient
HTCheat transfer coefficient

References

  1. Sun, X.J.; Huang, D.G.; Wu, G.Q. The current state of offshore wind energy technology development. Energy 2012, 41, 298–312. [Google Scholar] [CrossRef]
  2. Rodrigues, S.; Restrepo, C.; Kontos, E.; Pinto, R.T.; Bauer, P. Trends of offshore wind projects. Renew. Sustain. Energy Rev. 2015, 49, 1114–1135. [Google Scholar] [CrossRef]
  3. Pilgrim, J.A.; Catmull, S.; Chippendale, R.D.; Lewin, P.L.; Stratford, P.; Tyreman, R. Current rating optimisation for offshore wind farm export cables. In Proceedings of the Cigre Session 2014, Paris, France, 24–29 August 2014. [Google Scholar]
  4. Chippendale, R.D.; Pilgrim, J.A.; Goddard, K.F.; Cangy, P. Analytical thermal rating method for cables installed in J-Tubes. IEEE Trans. Power Deliv. 2017, 32, 1721–1729. [Google Scholar] [CrossRef]
  5. Hartlein, R.A.; Black, W.Z. Ampacity of electric power cables in vertical protective risers. IEEE Trans. Power Appar. Syst. 1983, PAS-102, 1678–1686. [Google Scholar] [CrossRef]
  6. Anders, G.J. Rating of cables on riser poles, in trays, in tunnels and shafts-a review. IEEE Trans. Power Deliv. 1996, 11, 3–11. [Google Scholar] [CrossRef]
  7. Junginger, M.; Faaij, A.; Turkenburg, W.C. Cost Reduction Prospects for Offshore Wind Farms. Wind Eng. 2004, 28, 97–118. [Google Scholar] [CrossRef]
  8. Heptonstall, P.; Gross, R.; Greenacre, P.; Cockerill, T. The cost of offshore wind: Understanding the past and projecting the future. Energy Policy 2012, 41, 815–821. [Google Scholar] [CrossRef]
  9. Keyhani, M.; Kulacki, F.A.; Christensen, R.N. Experimental Investigation of free convection in a vertical rod bundle—A general correlation for Nusselt numbers. J. Heat Transf. 1985, 107, 611–623. [Google Scholar] [CrossRef]
  10. Liu, G.; Guo, Y.X.; Xin, Y.L.; You, L.; Jiang, X.F.; Zheng, M.; Tang, W.H. Analysis of Switching Transients during Energization in Large Offshore Wind Farms. Energies 2018, 11, 470. [Google Scholar] [CrossRef]
  11. You, L.; Wang, J.; Liu, G.; Liu, Y.G.; Zheng, M. Calculation on Carrying Capacity of Landing Section of Submarine Cable Laying in Full-water Cable Trench Way. Guangdong Electr. Power 2017, 10, 11–16. [Google Scholar]
  12. Wang, P.Y.; Liu, G.; Ma, H.; Liu, Y.G.; Xu, T. Investigation of the ampacity of a prefabricated straight-through joint of high voltage cable. Energies 2017, 10, 2050. [Google Scholar] [CrossRef]
  13. International Electrotechnical Commission. Electric Cables—Calculation of the Current Rating Part 1-1: Current Rating Equations (100% Load Factor) and Calculation of Losses—General; IEC 60287-1-1; IEC Press: Geneva, Switzerland, 2006. [Google Scholar]
  14. Bergman, T.L.; Lavine, A.S.; Incropera, F.P.; Dewitt, D.P. Fundamentals of Heat and Mass Transfer, 7th ed.; Wiley: Jefferson City, MO, USA, 2011; pp. 862–870. [Google Scholar]
  15. Holman, J.P. Heat Transfer, 10th ed.; McGraw-Hill: New York, NY, USA, 2010; pp. 293–298, 332–335. [Google Scholar]
  16. Wilcox, D.C. Turbulence Modeling for CFD, 3nd ed.; DCW Industries: La Cañada Flintridge, CA, USA, 2006; pp. 39–40, 128–130. [Google Scholar]
  17. Velusamy, K.; Sundararajan, T.; Seetharamu, K.N. Interaction Effects Between Surface Radiation and Turbulent Natural Convection in Square and Rectangular Enclosures. J. Heat Transf. 2001, 6, 1062–1070. [Google Scholar] [CrossRef]
  18. Long, C. Essential Heat Transfer; Pearson Education: Harlow, UK, 1999; p. 112. [Google Scholar]
  19. Kuzmin, D.; Mierka, O.; Turek, S. On the Implementation of the k-ε Turbulence Model in Incompressible Flow Solvers Based on a Finite Element Discretization. Int. J. Comput. Sci. Math. 2007, 1, 193–206. [Google Scholar] [CrossRef]
  20. Grotjans, H.; Menter, F.R. Wall Functions for General Application CFD Codes. In Computational Fluid Dynamic 1998, Proceedings of the Fourth European Computational Fluid Dynamics Conference (ECCOMAS), Athens, Greece, 7–11 September 1998; Wiley: Chichester, UK, 1998; pp. 1112–1117. [Google Scholar]
  21. International Electrotechnical Commission. Electric Cables—Calculation of the Current Rating—Part 2-1: Calculation of Thermal Resistance; IEC 60287-2-1; IEC Press: Geneva, Switzerland, 2006. [Google Scholar]
Figure 1. Diagram of a typical enclosed J-tube system [4].
Energies 11 00545 g001
Figure 2. Computational domain and boundary conditions from different views for the enclosed J-tube system: (a) view along the negative Z coordinate, and (b) view along the positive Y coordinate.
Energies 11 00545 g002
Figure 3. Computational domain and boundary conditions from different views for the ventilated J-tube system: (a) view along the negative Z coordinate; and, (b) view along the positive Y coordinate.
Energies 11 00545 g003
Figure 4. Temperature profiles for different three-dimensional (3D) methods.
Energies 11 00545 g004
Figure 5. Ratings for different air section lengths.
Energies 11 00545 g005
Figure 6. Ratings for different wind speeds.
Energies 11 00545 g006
Figure 7. Comparisons of ratings at different wind speeds.
Energies 11 00545 g007
Figure 8. Conductor temperature profiles when the wind speed is 10 m/s.
Energies 11 00545 g008
Figure 9. Inside air velocity profiles at an external wind speed of 10 m/s: (a) velocity profile in a horizontal cross section at z = 1000 mm; and, (b) velocity profile in a vertical cross section at y = 25 mm.
Energies 11 00545 g009
Figure 10. Ratings for different intensities of solar radiation.
Energies 11 00545 g010
Table 1. Design parameters of the considered submarine cable.
ComponentMaterialRadius (mm)Thermal Conductivity (W·m−1·K−1)
ConductorCopper13.3385
Conductor ScreenSemicon XLPE15.10.286
InsulationXLPE32.10.286
Insulation ScreenSemicon XLPE33.30.286
Water TapePolymer34.30.167
SheathLead37.535.3
Inner SheathSemicon PE40.40.286
Inner LinerPP41.90.167
FillerPE47.90.286
ArmourSteel53.918
ServingPP57.90.167
Table 2. Comparison of local heat transfer coefficients (HTCs) and temperatures at the center of the air section (at 667 A).
MethodCFD2DQuasi-3DFE
CHTC (W·m−2·K−1)1.337 (17.66%)2.224 (26.49%)2.224 (26.49%)2.242 (26.65%)
RHTC (W·m−2·K−1)6.232 (82.34%)6.172 (73.51%)6.172 (73.51%)6.170 (73.35%)
Total HTC (W·m−2·K−1)7.569 (100%)8.396 (100%)8.396 (100%)8.412 (100%)
Conductor Temperature (°C)89.69188.05487.89287.564
Table 3. Heat transfer modes for the heat generated in the cable in the air section.
Parameter2.5 m/s10 m/s
VentilatedEnclosedVentilatedEnclosed
Rating755 A635 A915 A717 A
Total225.98 W (100%)161.35 W (100%)329.91 W (100%)204.40 W (100%)
Convection135.64 W (60.0%)20.76 W (12.9%)254.02 W (77.00%)33.41 W (16.35%)
Radiation75.95 W (33.6%)117.05 W (72.5%)65.15 W (19.74%)147.66 W (72.24%)
LHT14.39 W (6.4%)23.54 W (14.6%)10.74 W (3.26%)23.33 W (11.41%)
Table 4. Mean air temperatures and velocities inside the ventilated and enclosed J-tubes.
Wind Speed (m/s)Mean Air Velocity (m·s−1)Mean Air Temperature (°C)
VentilatedEnclosedVentilatedEnclosed
2.50.2740.02545.85558.578
50.6310.02841.52553.734
7.50.9530.03039.99051.447
101.2760.03239.08750.356
Table 5. Mean air temperatures and velocities on different air cross sections.
Z Coordination (m)Mean Air Velocity (m·s−1)Mean Air Temperature (°C)
VentilatedEnclosedVentilatedEnclosed
0.50.2140.01948.75357.968
1.50.1550.02945.83960.710
2.50.1900.03051.79060.014
Table 6. Continuous ratings in different seasons.
SeasonAmbient Temperature (°C)Ventilated DesignUnventilated Design
2.5 m/s10 m/s2.5 m/s10 m/s
Summer35 °C755 A915 A635 A717 A
Spring/Autumn30 °C797 A958 A671 A750 A
Winter25 °C836 A993 A704 A780 A

