Experimental Determination of Gas Relative Permeability Considering Slippage Effect in a Tight Formation


Abstract
:1. Introduction
2. Experimental
2.1. Core Samples Preparation
2.2. Fluid Preparation
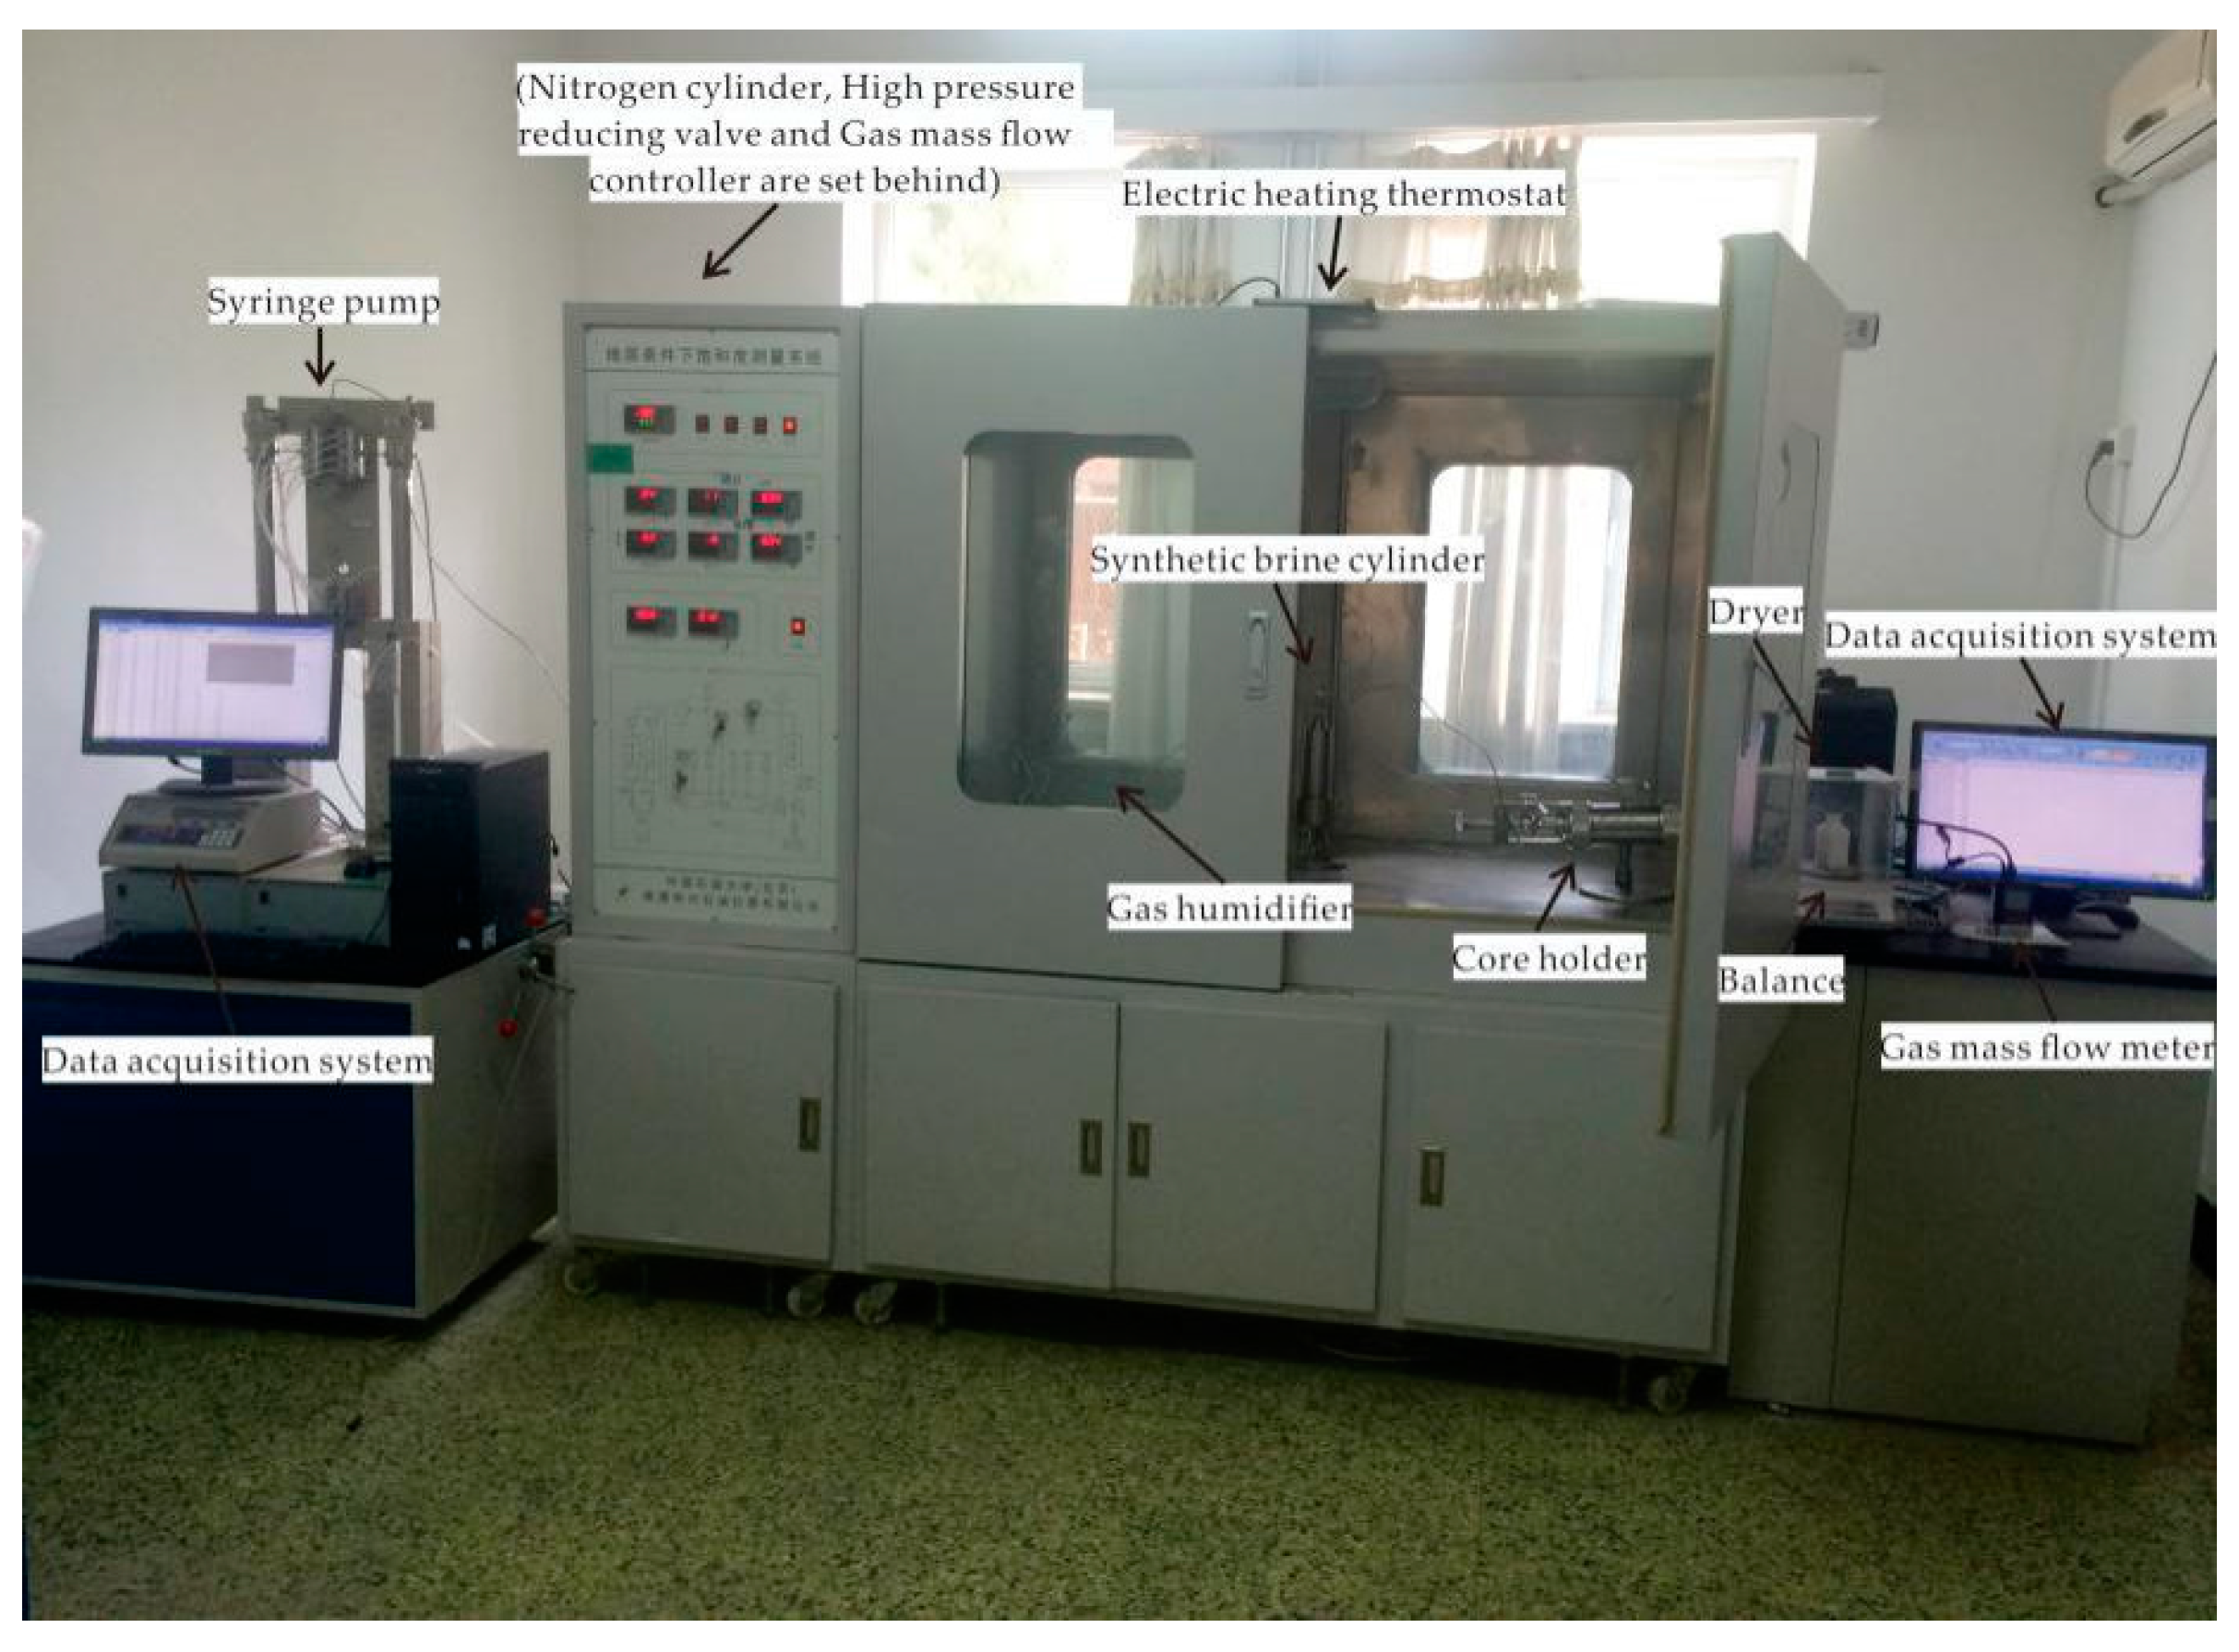
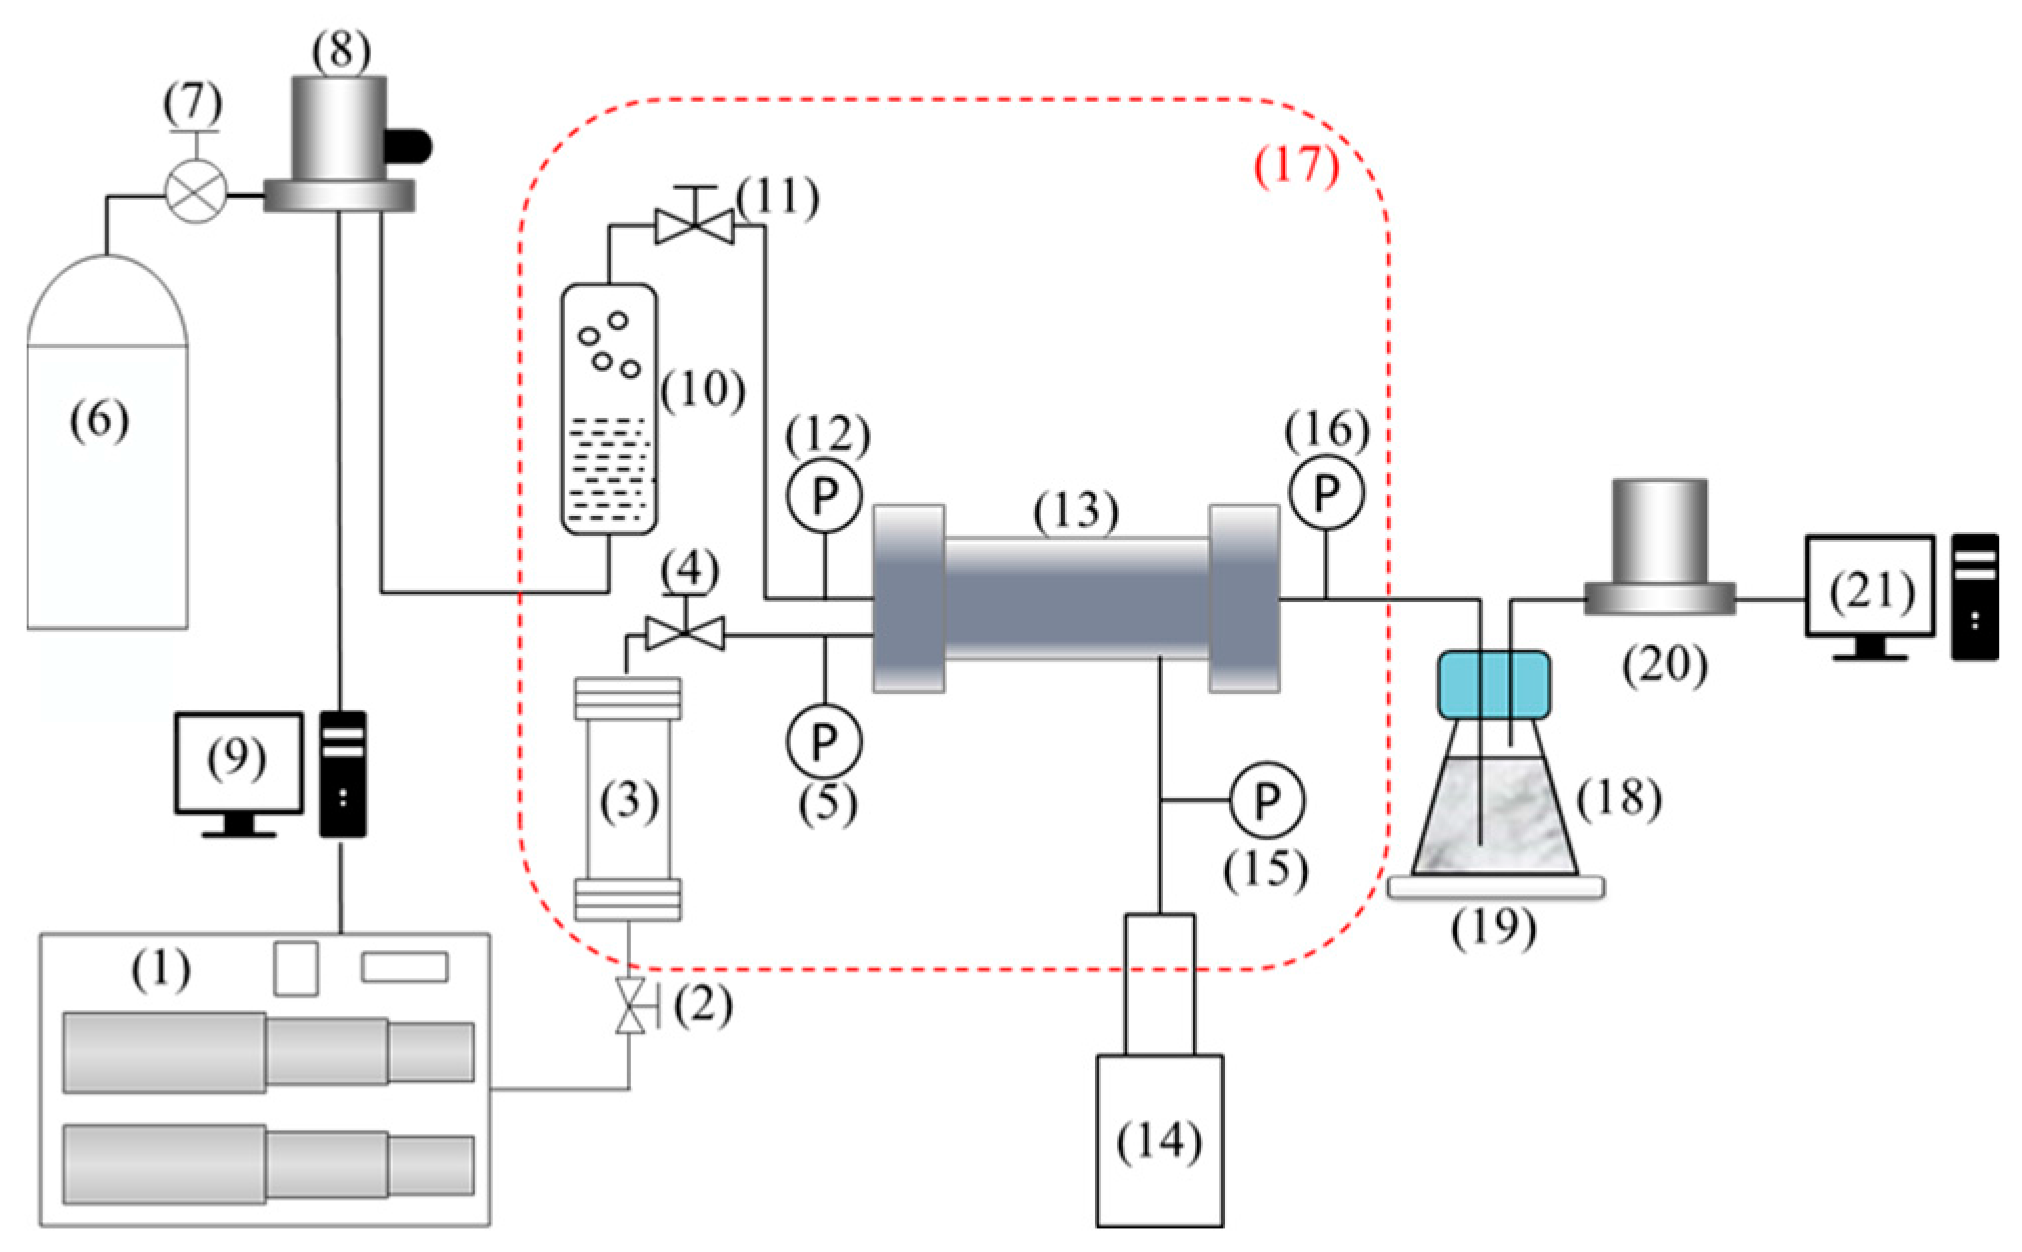
2.3. Apparatus
2.4. Experimental Procedure
- (1)
- Prepare the synthetic brine and nitrogen as mentioned in Section 2.2, and inject the synthetic brine into the cylinder;
- (2)
- Vacuum the core sample for 12 h and saturate it by injecting synthetic brine into it under 30.0 MPa for 12 h;
- (3)
- Place the saturated core sample into the core holder and increase experimental temperature through the temperature control system to programmed temperature. Confining pressure has also been loaded in this step since the confining pressure is crucial for accurately estimating reliable permeability of tight sandstone under reservoir conditions [20];
- (4)
- Inject the synthetic brine until the injected pressure is stable and record the pressure at the inlet and outlet of the core sample as well as the rate of produced liquid for determining absolute permeability of the core sample;
- (5)
- With an outlet pressure of 0.10 MPa, the nitrogen is injected until no more brine is produced and the gas flow rate and injection pressure are recorded for calculating the effective gas permeability at an irreducible water saturation (). As such, the endpoints of the relative permeability curve, i.e., [,] and [,], can be obtained;
- (6)
- By considering the injection pressure being less than 4.50 MPa (see GB/T 28912-2012), the synthetic brine and gas with specific rate ratio are injected until the flow is stable. Two criteria are employed to determine whether the stable flow is reached or not: (a) injection pressure at the inlet keeps steady and (b) the gas flow rate at the outlet is constant;
- (7)
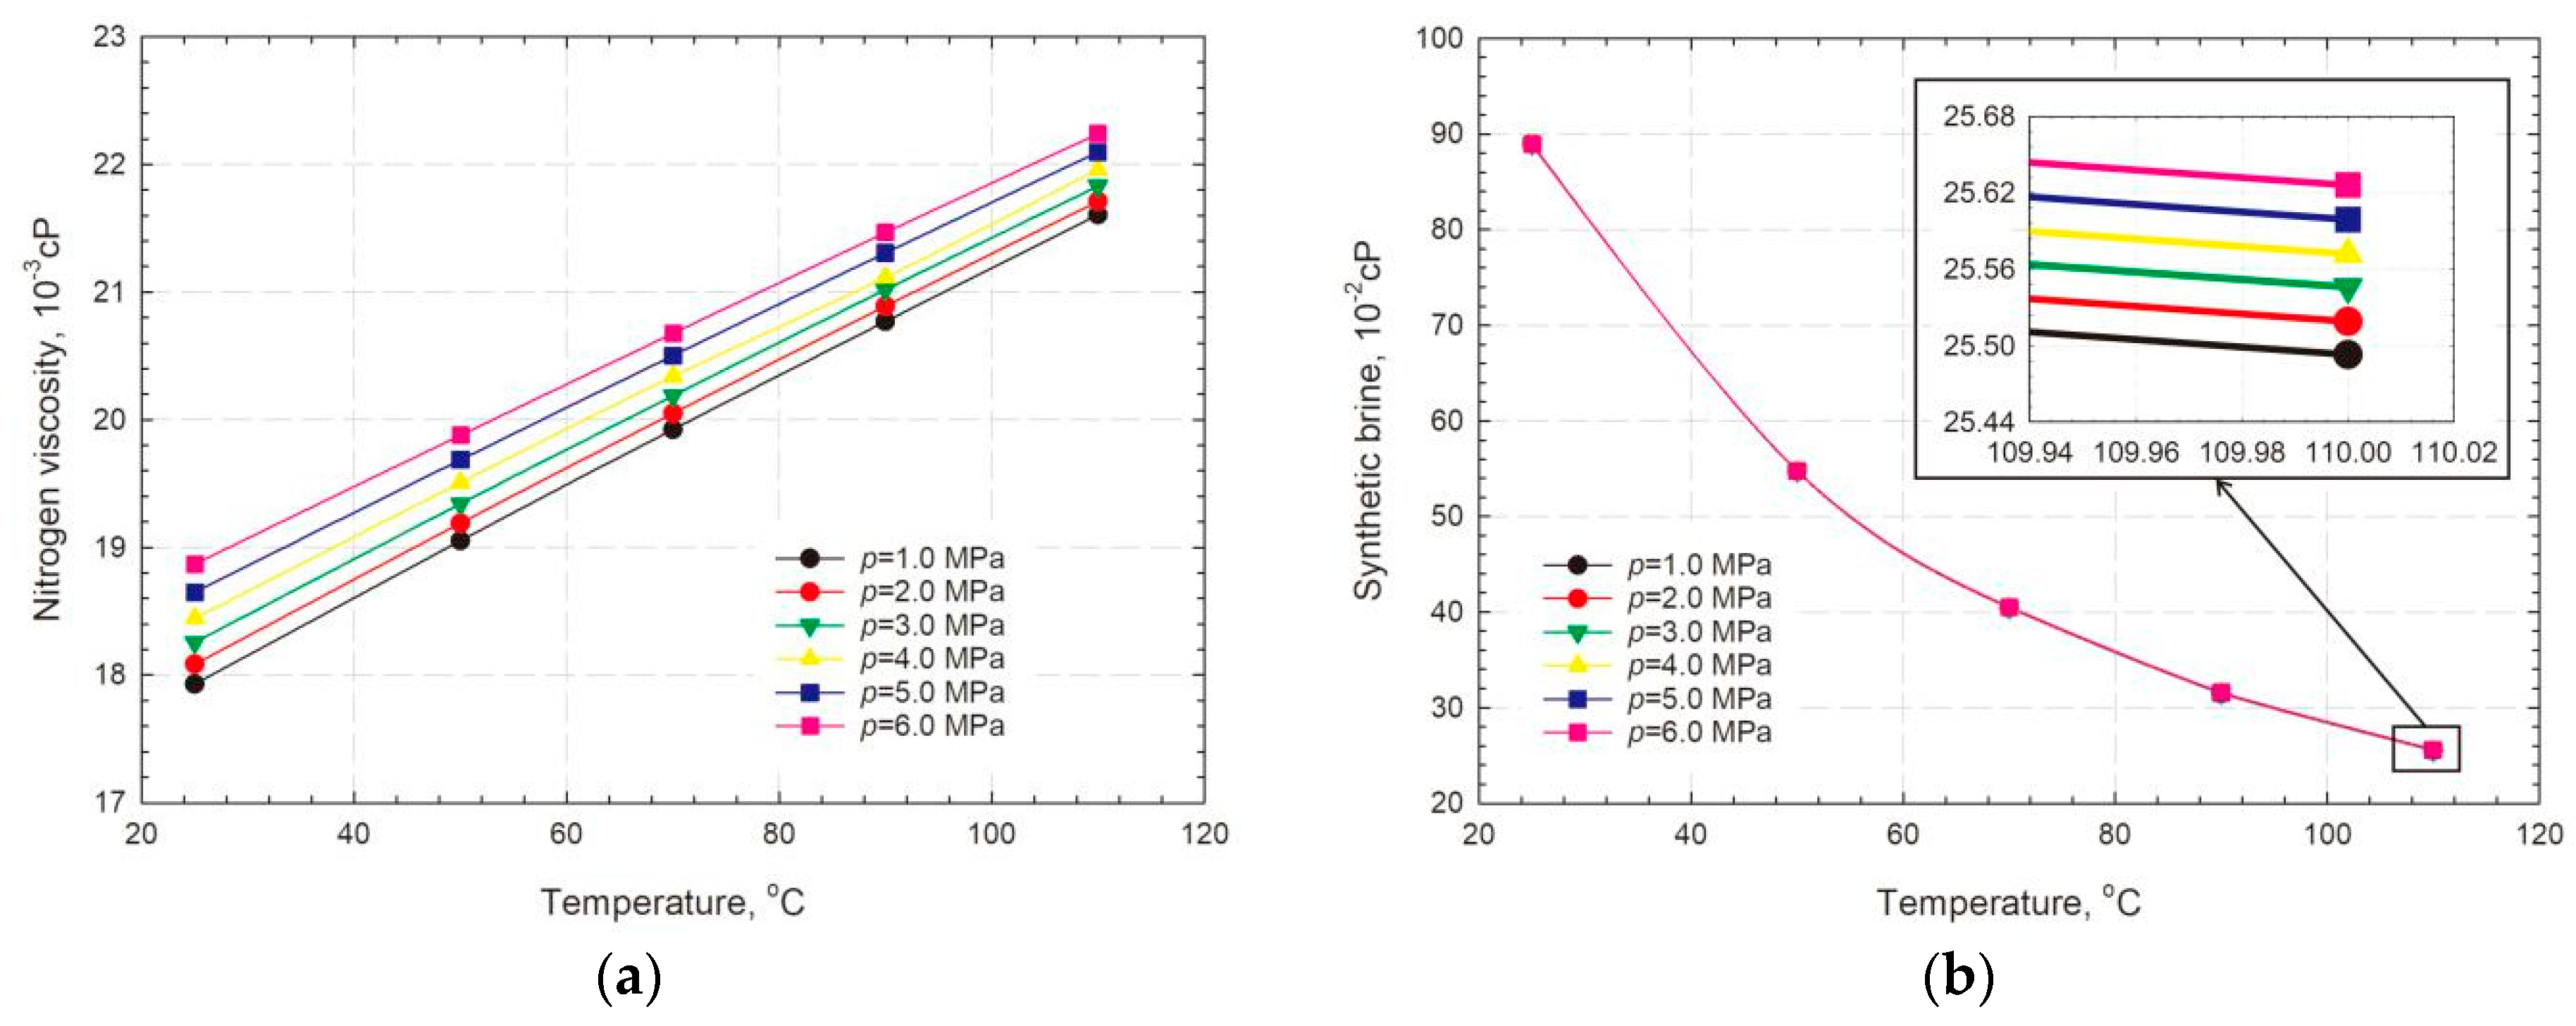
- After the stable state is reached, the injection pressure, gas, and water flow rate are recorded for determining the corresponding effective gas phase and water phase permeability, respectively. Note that the gas and water viscosity, used in Equations (2) and (3), is dynamically varied according to experimental pressure and temperature as shown in Figure 3a,b. The water saturation at current circumstance can be determined by weighting the produced water volume. In this case, two points, i.e., [,] and [,] (), on the relative permeability curves can be obtained;
- (8)
- More points, i.e., [,] (), on the gas–water relative permeability curves can be determined by dynamically changing the ratio of water flow rate to gas flow rate and repeating Steps 6–7; and,
- (9)
- Terminate the experiment when gas relative permeability is less than 0.005 (see GB/T 28912-2012).
2.5. Determination of Relative Permeability
3. Results and Discussions
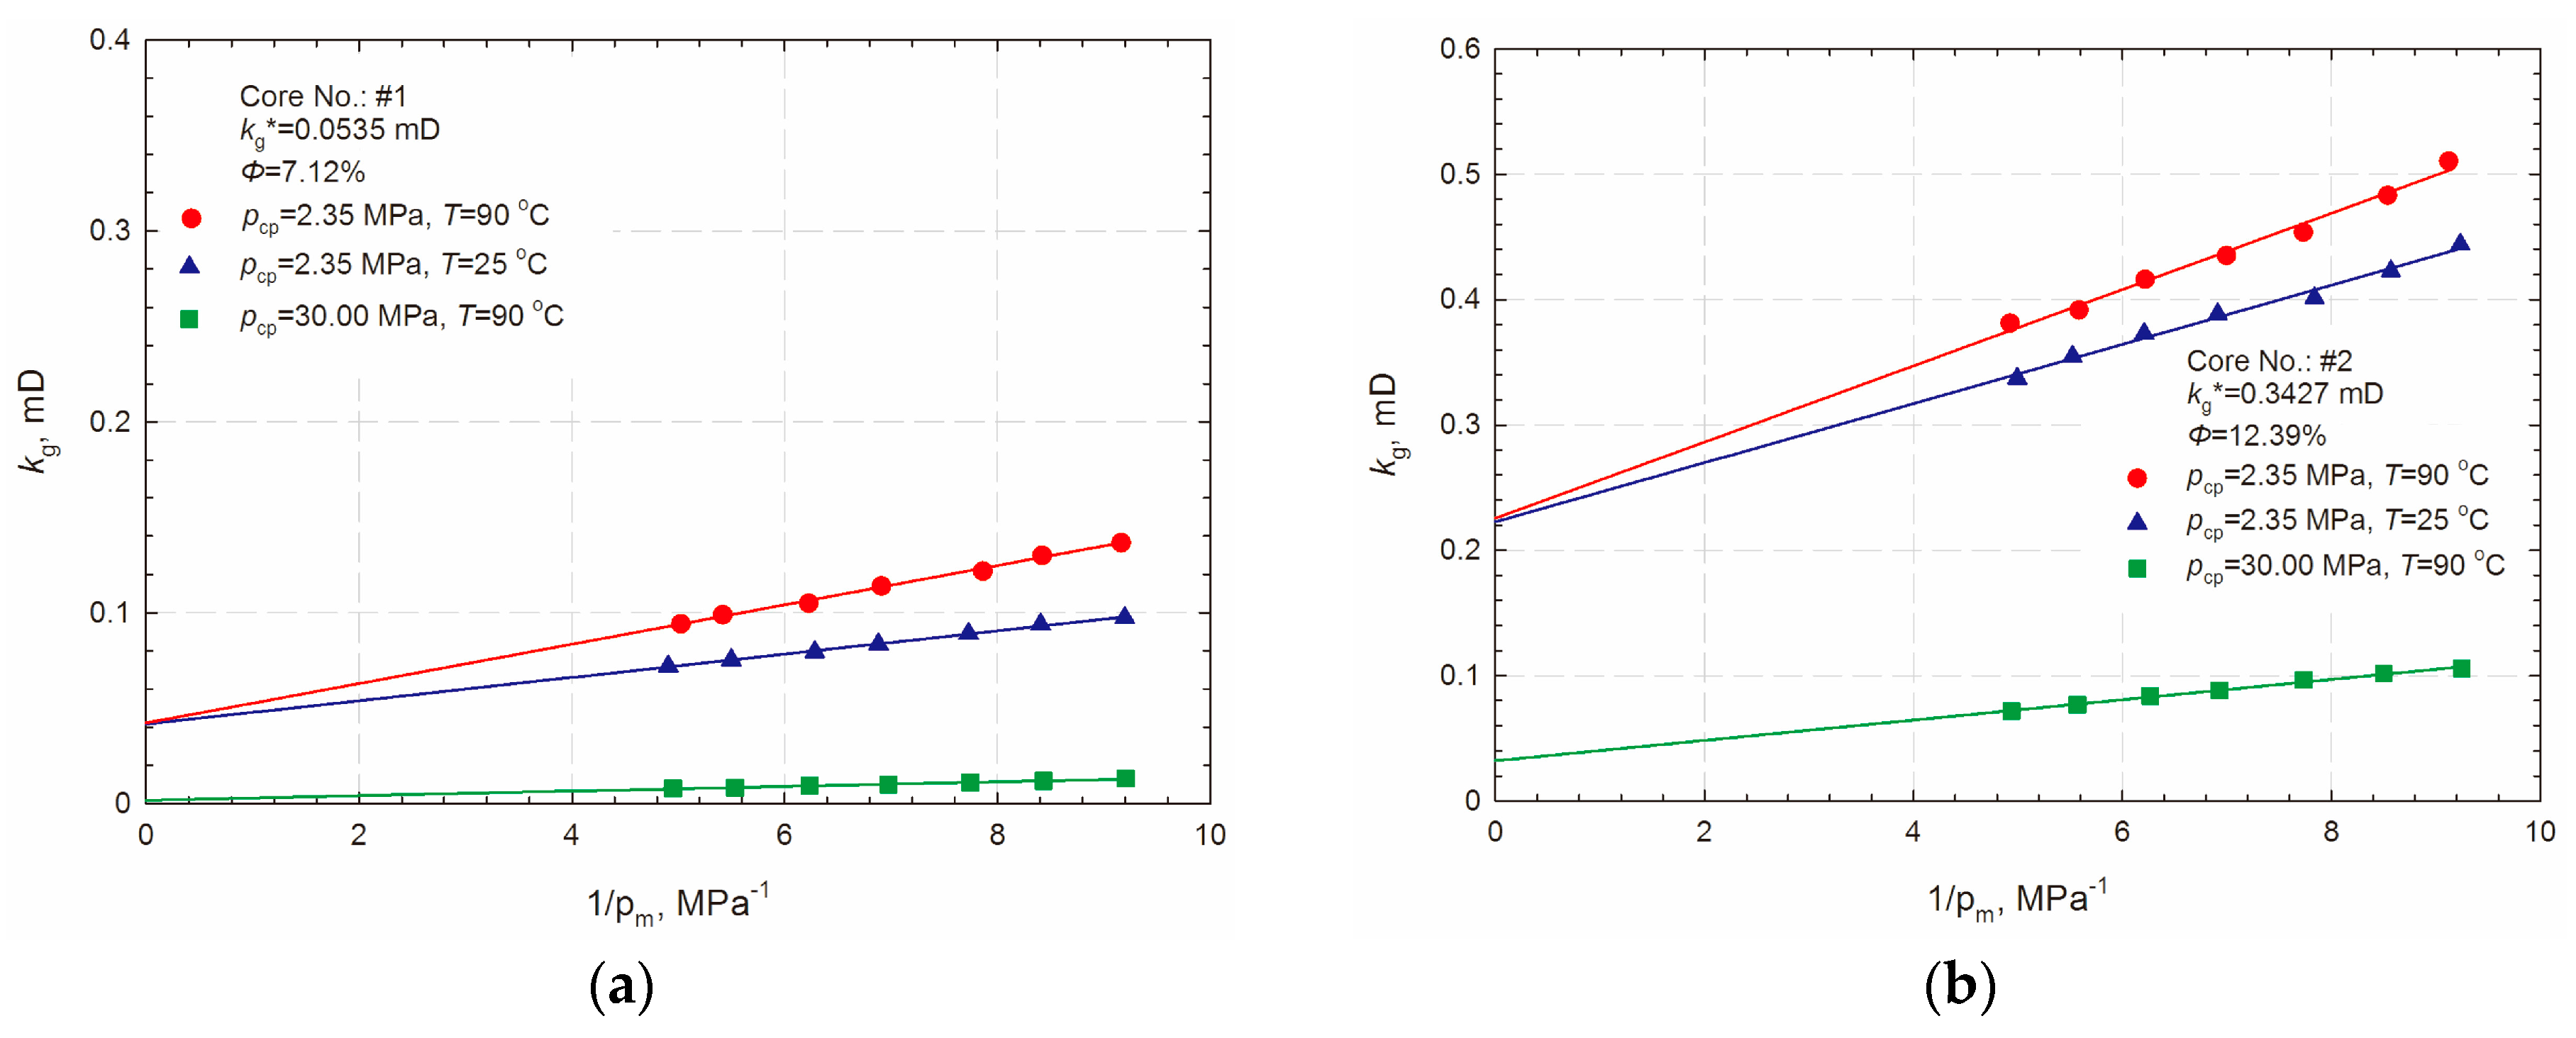
3.1. New Correlations: vs.
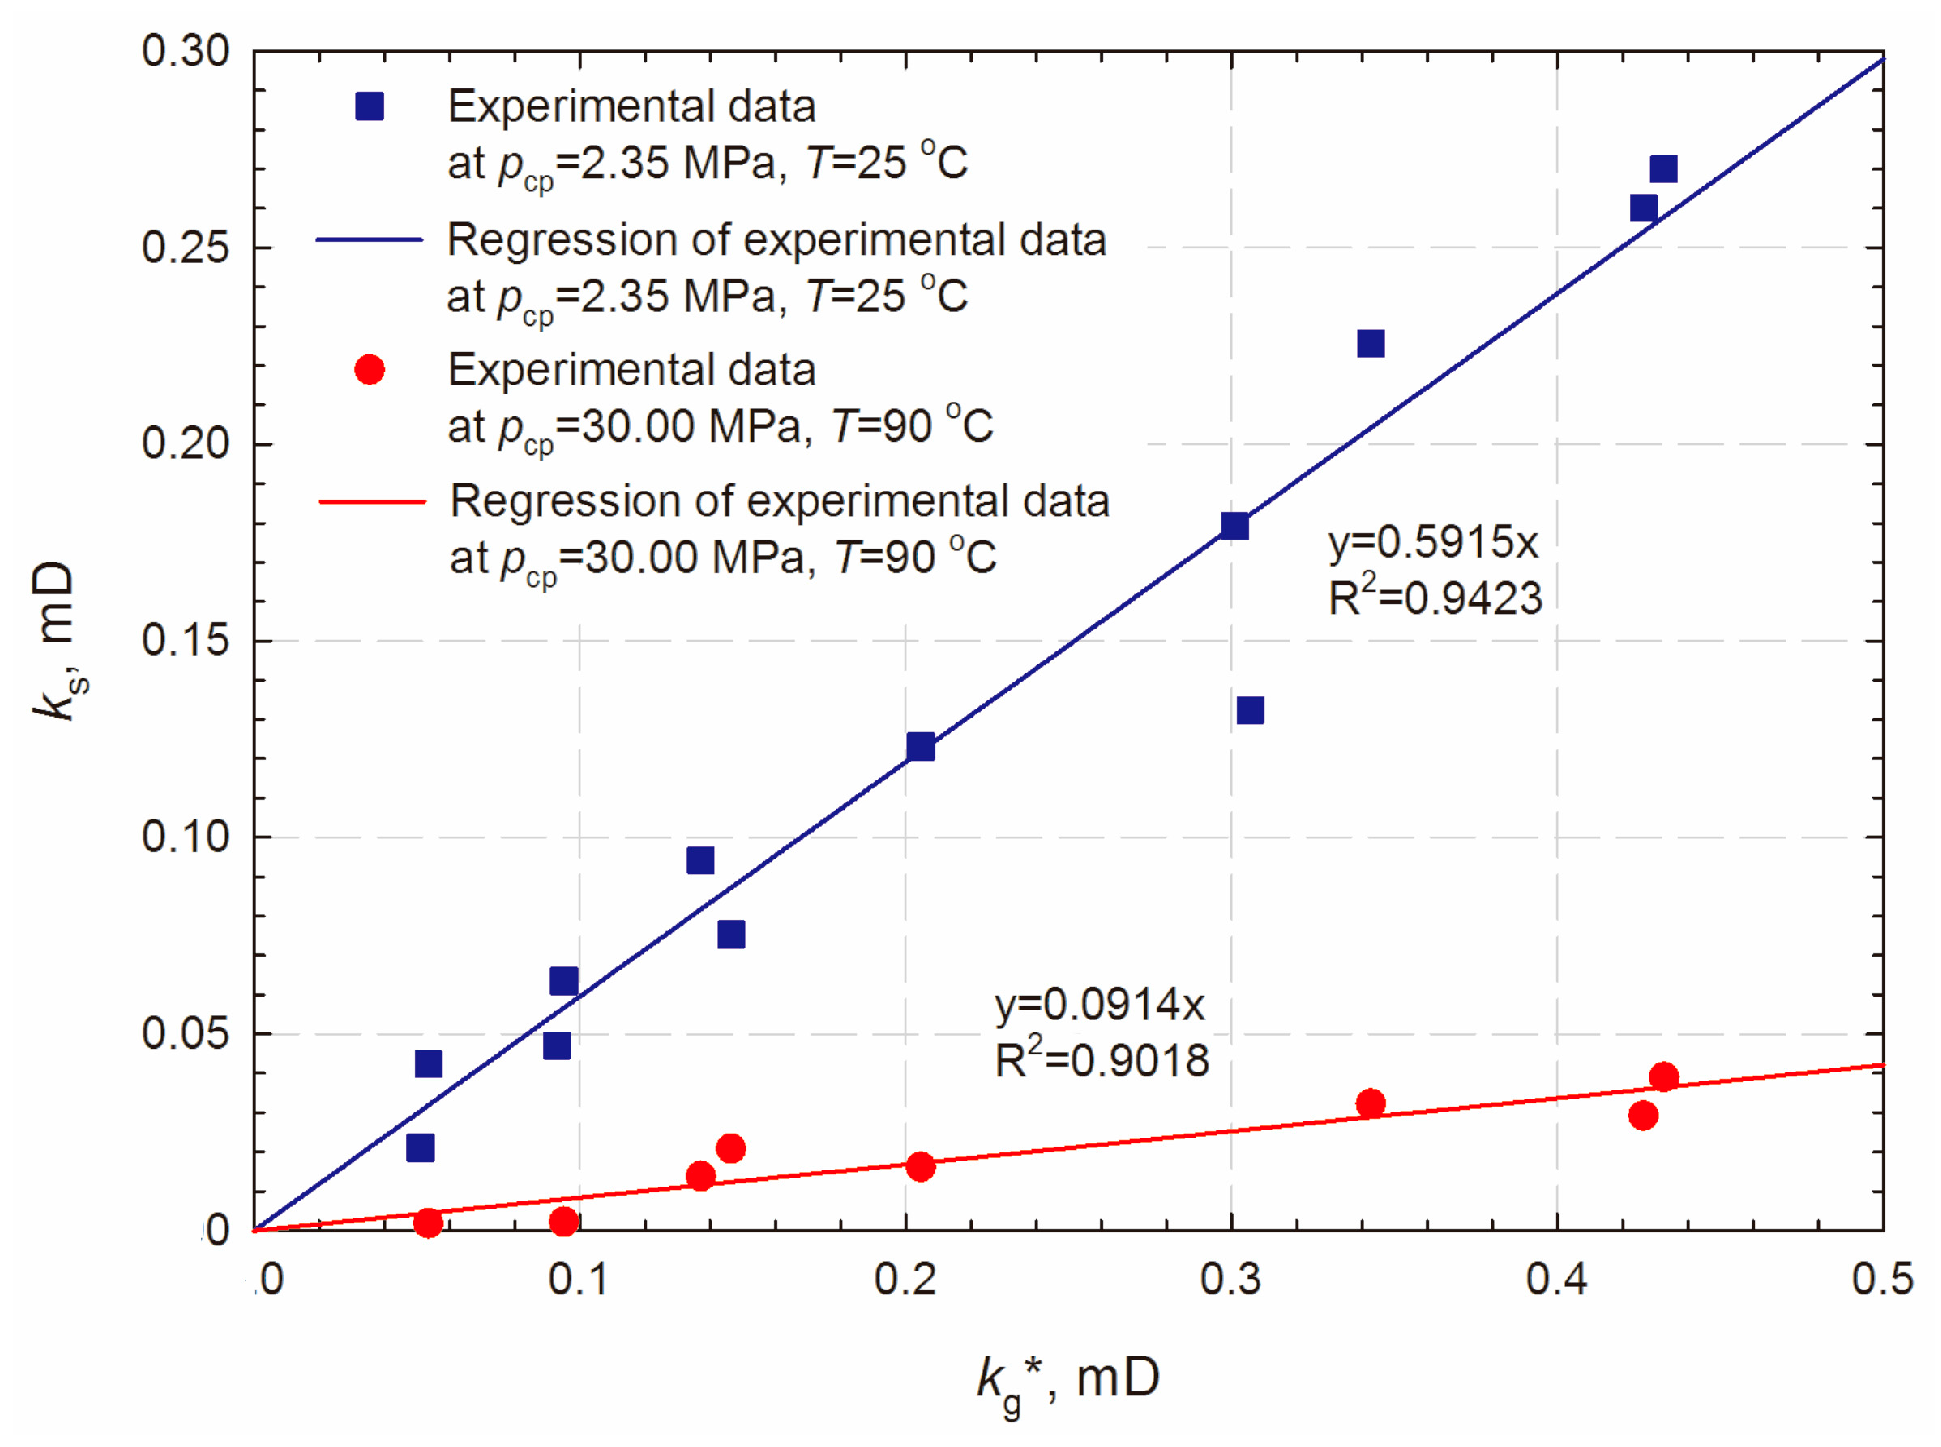
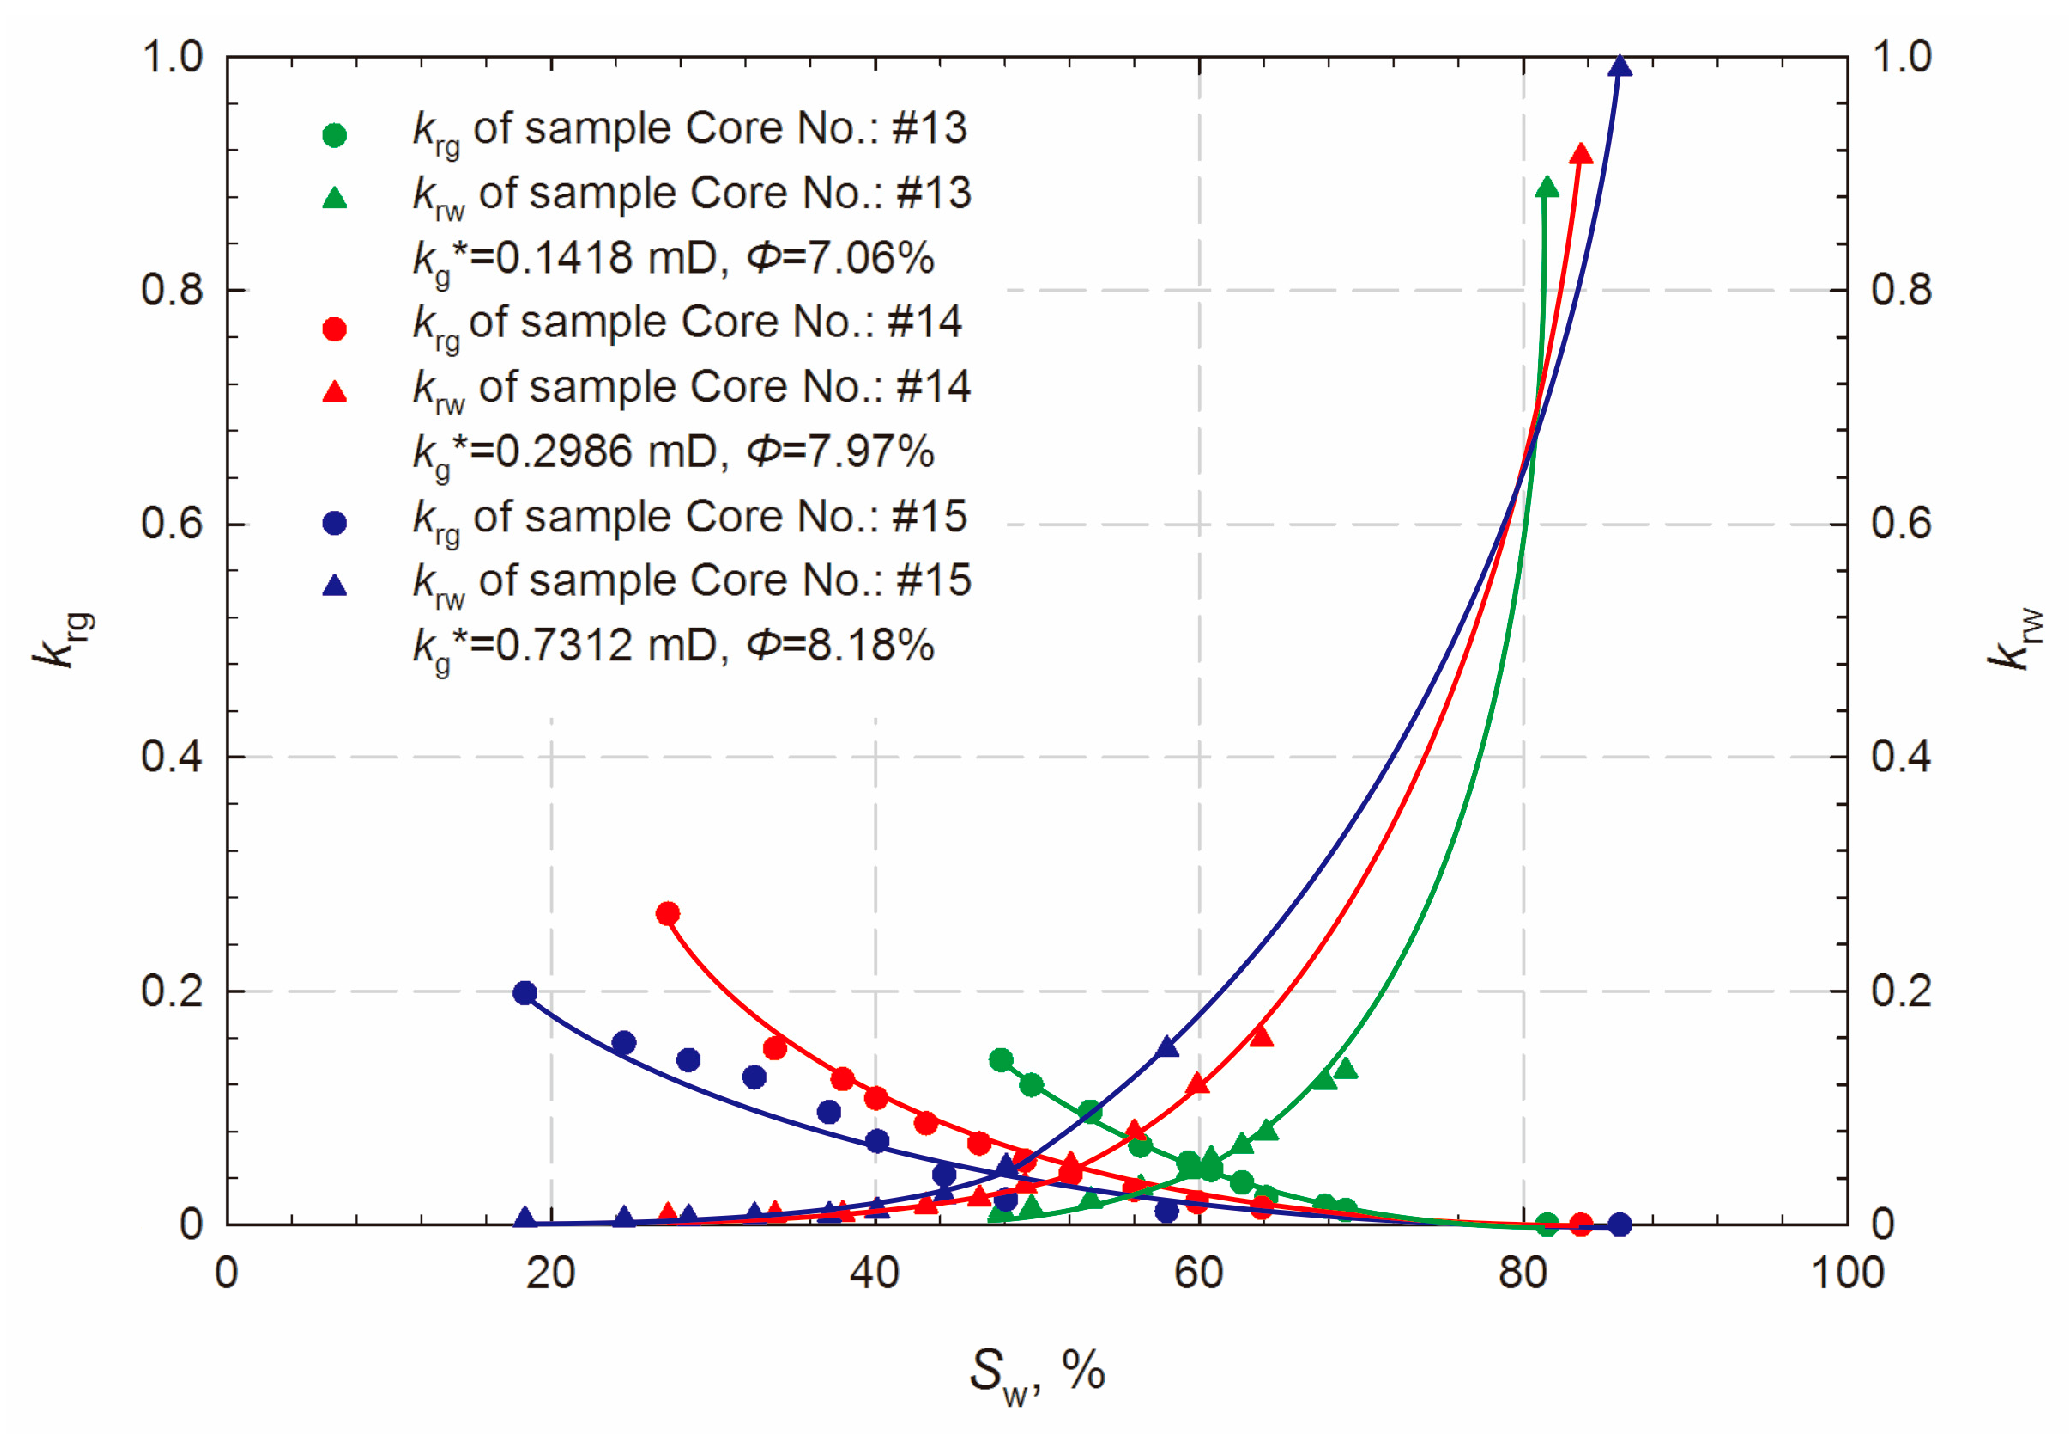
3.2. Calibration of Gas Relative Permeability
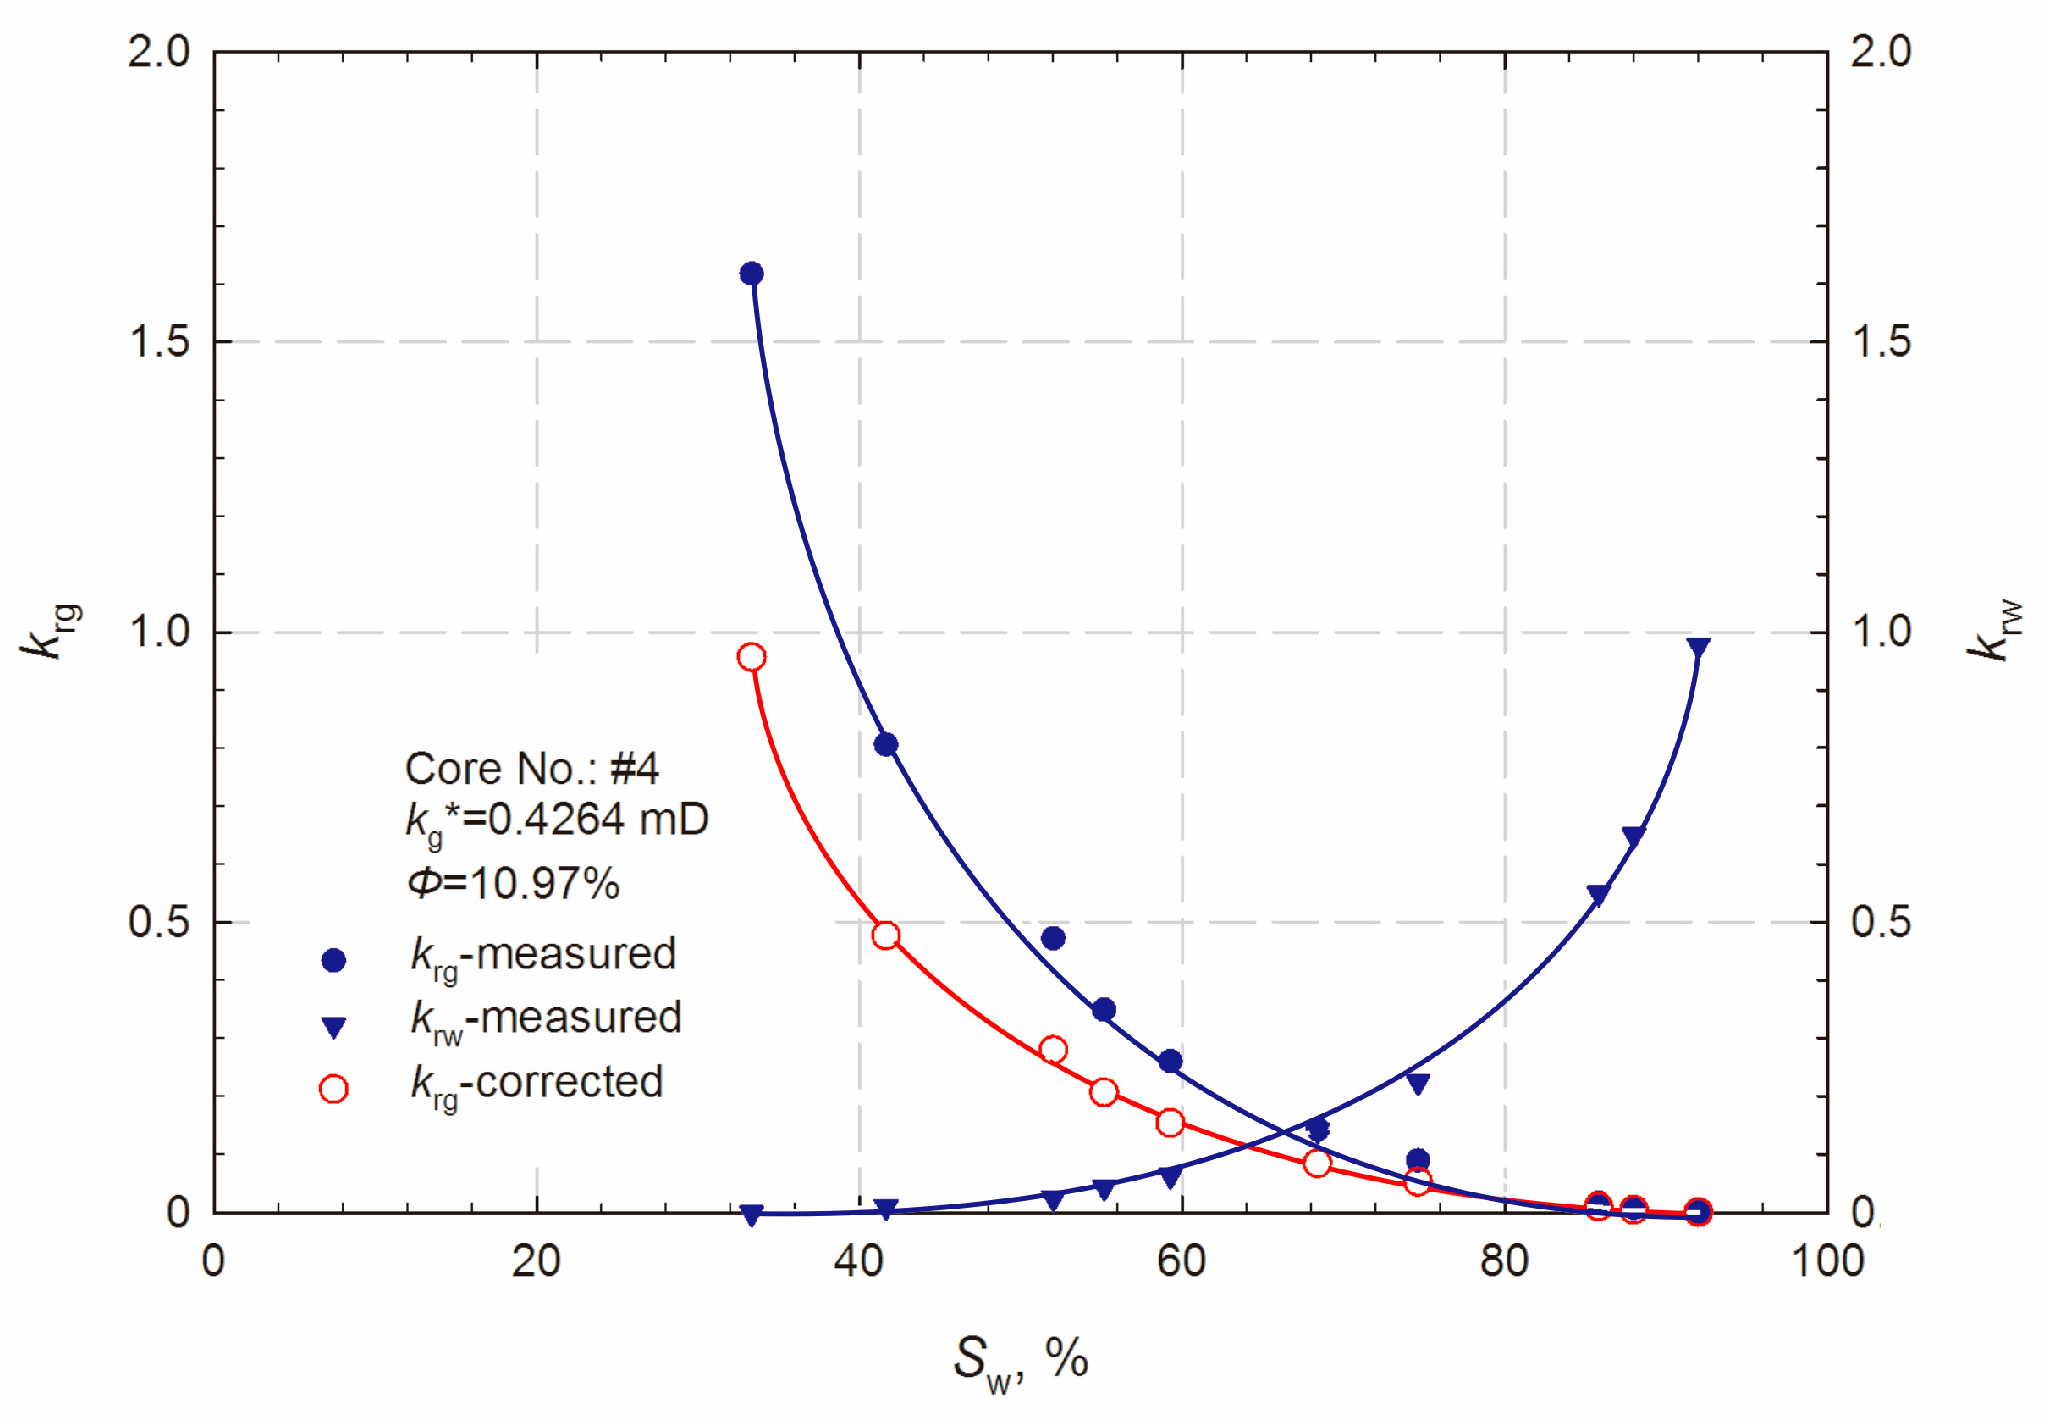
3.3. Gas–Water Relative Permeability Sensitivity Analysis
3.3.1. Effect of
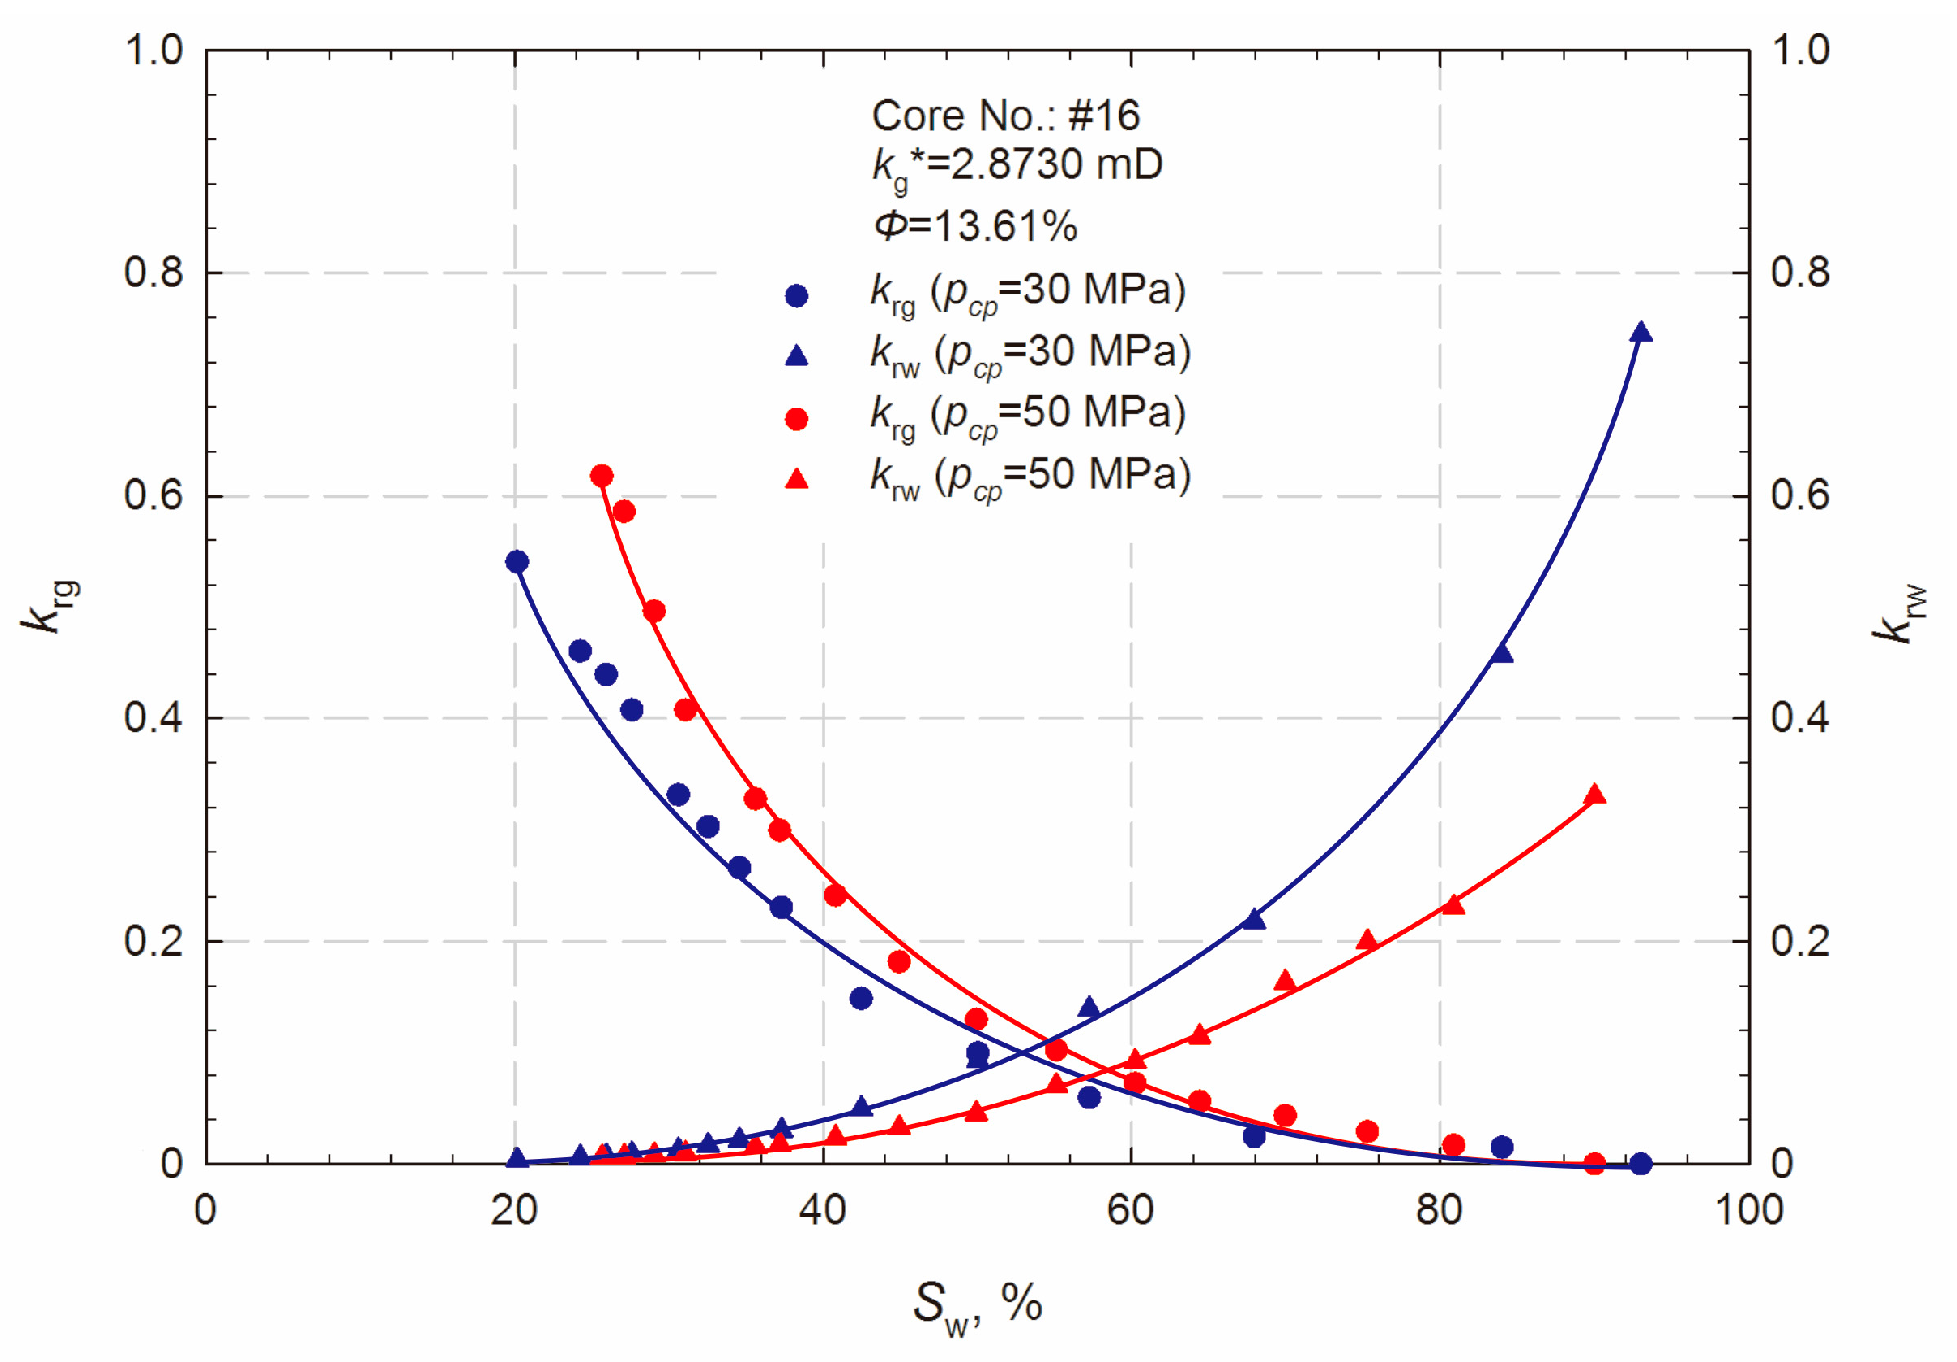
3.3.2. Effect of Confining Pressure
3.3.3. Effect of Temperature
4. Conclusions
Acknowledgments
Author Contributions
Conflicts of Interest
References
- Arora, A.; Bachle, A. Storage of Natural Gas by Adsorption Process. In Proceedings of the SPE/IATMI Asia Pacific Oil and Gas Conference and Exhibition, Nusa Dua, Indonesia, 20–22 October 2015. SPE 176129. [Google Scholar]
- Economides, M.; Oligney, R.; Valko, P. Unified Fracture Design: Bridging the Gap between Theory and Practice; Orsa Press: Alvin, TX, USA, 2002. [Google Scholar]
- Daal, J.; Economides, M.J. Optimization of Hydraulically Fractured Wells in Irregularly Shaped Drainage Areas. In Proceedings of the SPE International Symposium and Exhibition on Formation Damage Control, Lafayette, LA, USA, 15–17 February 2006. SPE 98047. [Google Scholar]
- Nehring, R. Growing and Indispensable: The Contribution of Production. In Understanding, Exploring, and Developing Tight-Gas Sands; Cumella, S.P., Shanley, K.W., Camp, W.K., Eds.; The American Association of Petroleum Geologists: Tulsa, OK, USA, 2008; Volume 3, pp. 5–12. [Google Scholar]
- Dai, J.; Ni, Y.; Wu, X. Tight Gas in China and Its Significance in Exploration and Exploitation. Pet. Explor. Dev. 2012, 39, 277–284. [Google Scholar] [CrossRef]
- Byrnes, A.P.; Sampath, K.; Randolph, P.L. Effect of Pressure and Water Saturation on the Permeability of Western Tight Sandstones. In Proceedings of the 5th Annual U.S. Department of Energy Symposium on Enhanced Oil and Gas Recovery, Tulsa, OK, USA, 22–26 August 1979. [Google Scholar]
- Ward, J.S.; Morrow, N.R. Capillary Pressure and Gas Relative Permeabilities of Low Permeability Sandstone. SPE Form. Eval. 1987, 2, 345–356. [Google Scholar] [CrossRef]
- Kamath, J.; Boyer, R.E. Critical Gas Saturation and Supersaturation in Low Permeability Rocks. SPE Form. Eval. 1995, 10, 247–254. [Google Scholar] [CrossRef]
- Shanley, K.W.; Cluff, R.M.; Robinson, J.W. Factors Controlling Prolific Gas Production from Low-Permeability Sandstone Reservoirs: Implications for Resource Assessment, Prospect Development, and Risk Analysis. AAPG Bull. 2004, 88, 1083–1121. [Google Scholar] [CrossRef]
- Wang, Y.; Chen, Z.; Morah, V.; Knabe, R.J.; Appel, M. Gas-Phase Relative Permeability Characterization on Tight-Gas Samples. Petrophysics 2012, 53, 393–400. [Google Scholar]
- Klinkenberg, L. The permeability of porous media to liquids and gases. In Proceedings of the Drilling and Production Practice, New York, NY, USA, 1 January 1941. [Google Scholar]
- Fulton, P.F. The Effect of Gas Slippage on Relative Permeability Measurements. Prod. Mon. 1951, 15, 14–19. [Google Scholar]
- Estes, R.K.; Fulton, P.F. Gas Slippage and Permeability Measurements. J. Pet. Technol. 1956, 8, 69–73. [Google Scholar] [CrossRef]
- Sampath, K.; Keighin, C.W. Factors Affecting Gas Slippage in Tight Sandstones of Cretaceous Age in the Uinta Basin. J. Pet. Technol. 1982, 34, 2715–2720. [Google Scholar] [CrossRef]
- Thompson, A.H.; Raschke, R.A. Estimation of Absolute Permeability from Capillary Pressure Measurements. In Proceedings of the SPE Annual Technical Conference and Exhibition, Dallas, TX, USA, 27–30 September 1987. SPE 16794. [Google Scholar]
- Li, S.; Dong, M.; Li, Z. Measurement and Revised Interpretation of Gas Flow Behavior in Tight Reservoir Cores. J. Pet. Sci. Eng. 2009, 65, 81–88. [Google Scholar] [CrossRef]
- Thomas, R.D.; Ward, D.C. Effect of Overburden Pressure and Water Saturation on Gas Permeability of Tight Sandstone Cores. J. Pet. Technol. 1972, 24, 120–124. [Google Scholar] [CrossRef]
- Rushing, J.A.; Newsham, K.E.; Van Fraassen, K.C. Measurement of the Two-Phase Gas Slippage Phenomenon and Its Effect on Gas Relative Permeability in Tight Gas Sands. In Proceedings of the SPE Annual Technical Conference and Exhibition, Denver, CO, USA, 5–8 October 2003. SPE 84297. [Google Scholar]
- Lei, G.; Dong, P.; Wu, Z.; Mo, S.; Gai, S.; Zhao, C.; Liu, Z.K. A Fractal Model for the Stress-Dependent Permeability and Relative Permeability in Tight Sandstones. J. Can. Pet. Technol. 2015, 54, 36–48. [Google Scholar] [CrossRef]
- Walls, J.D.; Nur, A.M.; Bourbie, T. Effects of Pressure and Partial Water Saturation on Gas Permeability in Tight Sands: Experimental Results. J. Pet. Technol. 1982, 34, 930–936. [Google Scholar] [CrossRef]
- Wei, K.K.; Morrow, N.R.; Brower, K.R. Effect of Fluid, Confining Pressure, and Temperature on Absolute Permeabilities of Low-Permeability Sandstones. SPE Form. Eval. 1986, 1, 413–423. [Google Scholar] [CrossRef]
- Li, K.; Horne, R.N. Gas Slippage in Two-Phase Flow and the Effect of Temperature. In Proceedings of the SPE Western Regional Meeting: Bakersfield, CA, USA, 26–30 March 2001. SPE 68778. [Google Scholar]
- Liu, G.; Bai, Y.; Fan, Z.; Gu, D. Determination of Klinkenberg Permeability Conditioned to Pore-Throat Structures in Tight Formations. Energies 2017, 10, 1575. [Google Scholar] [CrossRef]


| Group No. | Core No. | , mD | Porosity, % | Length, cm | Diameter, cm |
|---|---|---|---|---|---|
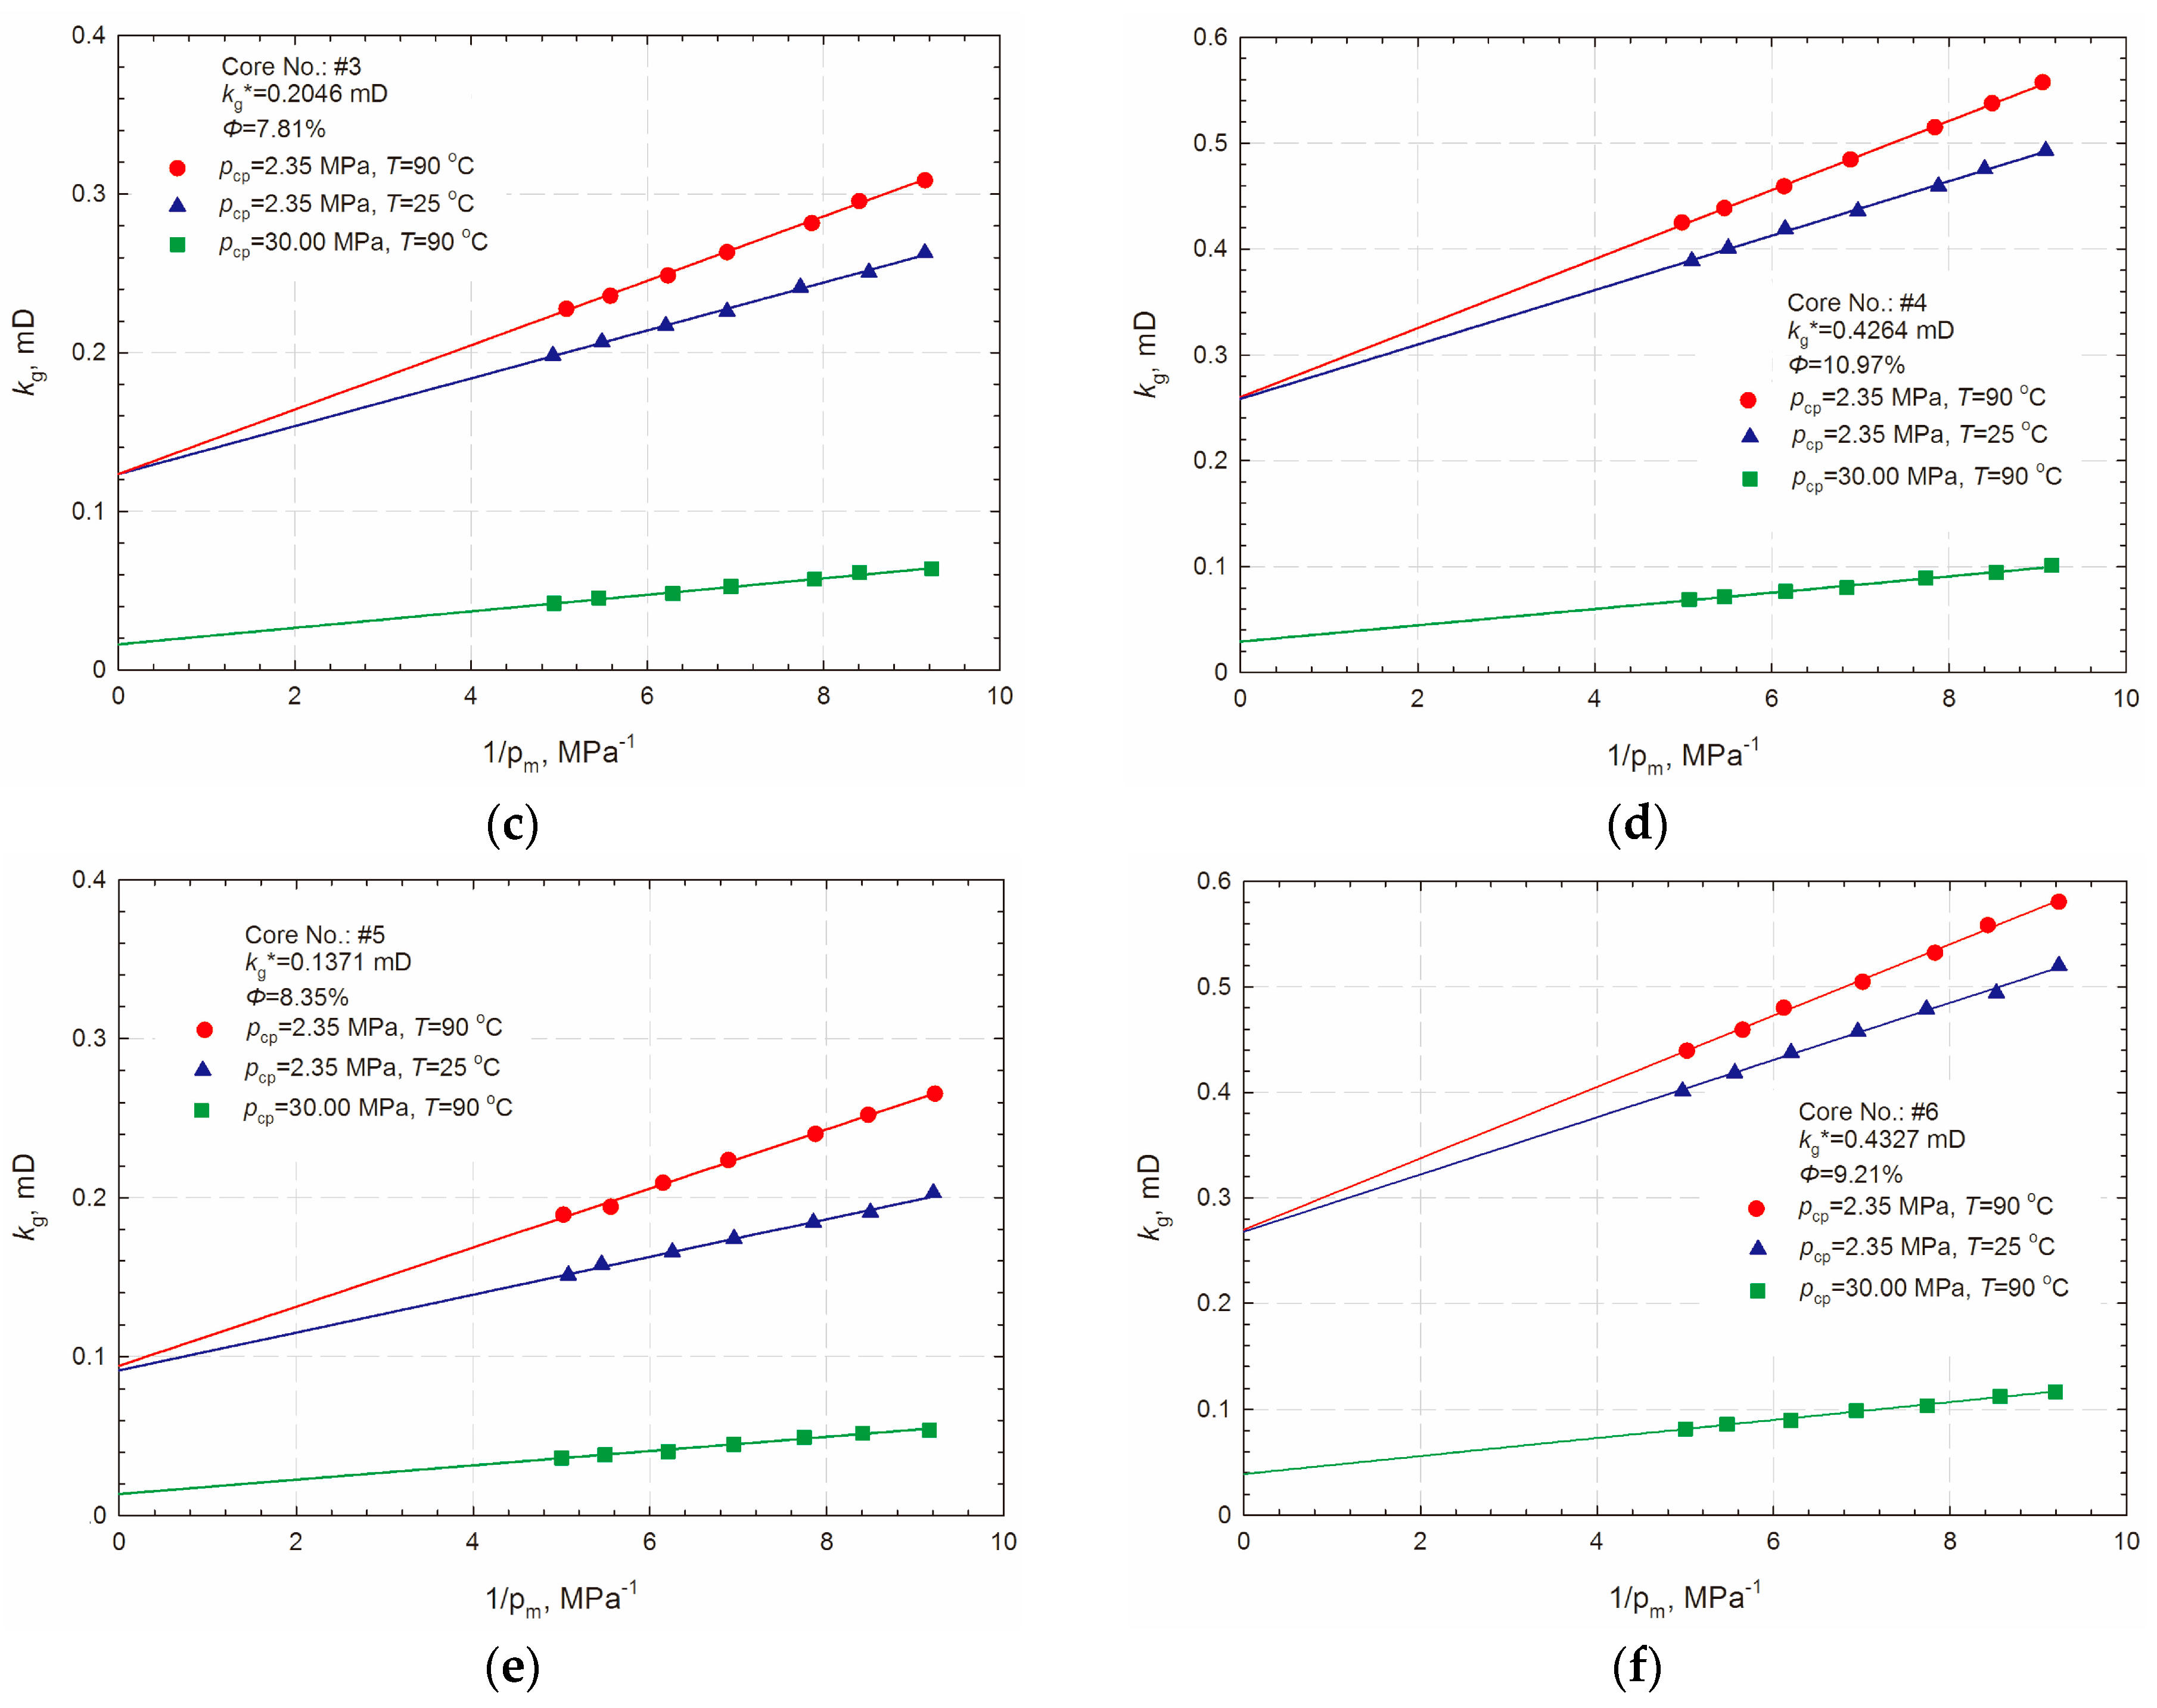
| Group #1 | #1 | 0.0535 | 7.12 | 6.942 | 2.511 |
| #2 | 0.3427 | 12.39 | 7.215 | 2.517 | |
| #3 | 0.2046 | 7.81 | 6.872 | 2.515 | |
| #4 | 0.4264 | 10.97 | 6.928 | 2.509 | |
| #5 | 0.1371 | 8.35 | 6.927 | 2.512 | |
| #6 | 0.4327 | 9.21 | 7.237 | 2.513 | |
| #7 | 0.0952 | 4.45 | 7.452 | 2.516 | |
| #8 | 0.1464 | 8.10 | 6.844 | 2.514 | |
| #9 | 0.3010 | 9.81 | 6.738 | 2.512 | |
| #10 | 0.0511 | 5.85 | 7.328 | 2.521 | |
| #11 | 0.0929 | 7.36 | 6.924 | 2.512 | |
| #12 | 0.3058 | 9.89 | 6.668 | 2.514 | |
| Group #2 | #13 | 0.1418 | 7.06 | 7.076 | 2.514 |
| #14 | 0.2986 | 7.97 | 6.786 | 2.508 | |
| #15 | 0.7312 | 8.18 | 7.452 | 2.516 | |
| #16 | 2.8730 | 13.61 | 7.084 | 2.516 | |
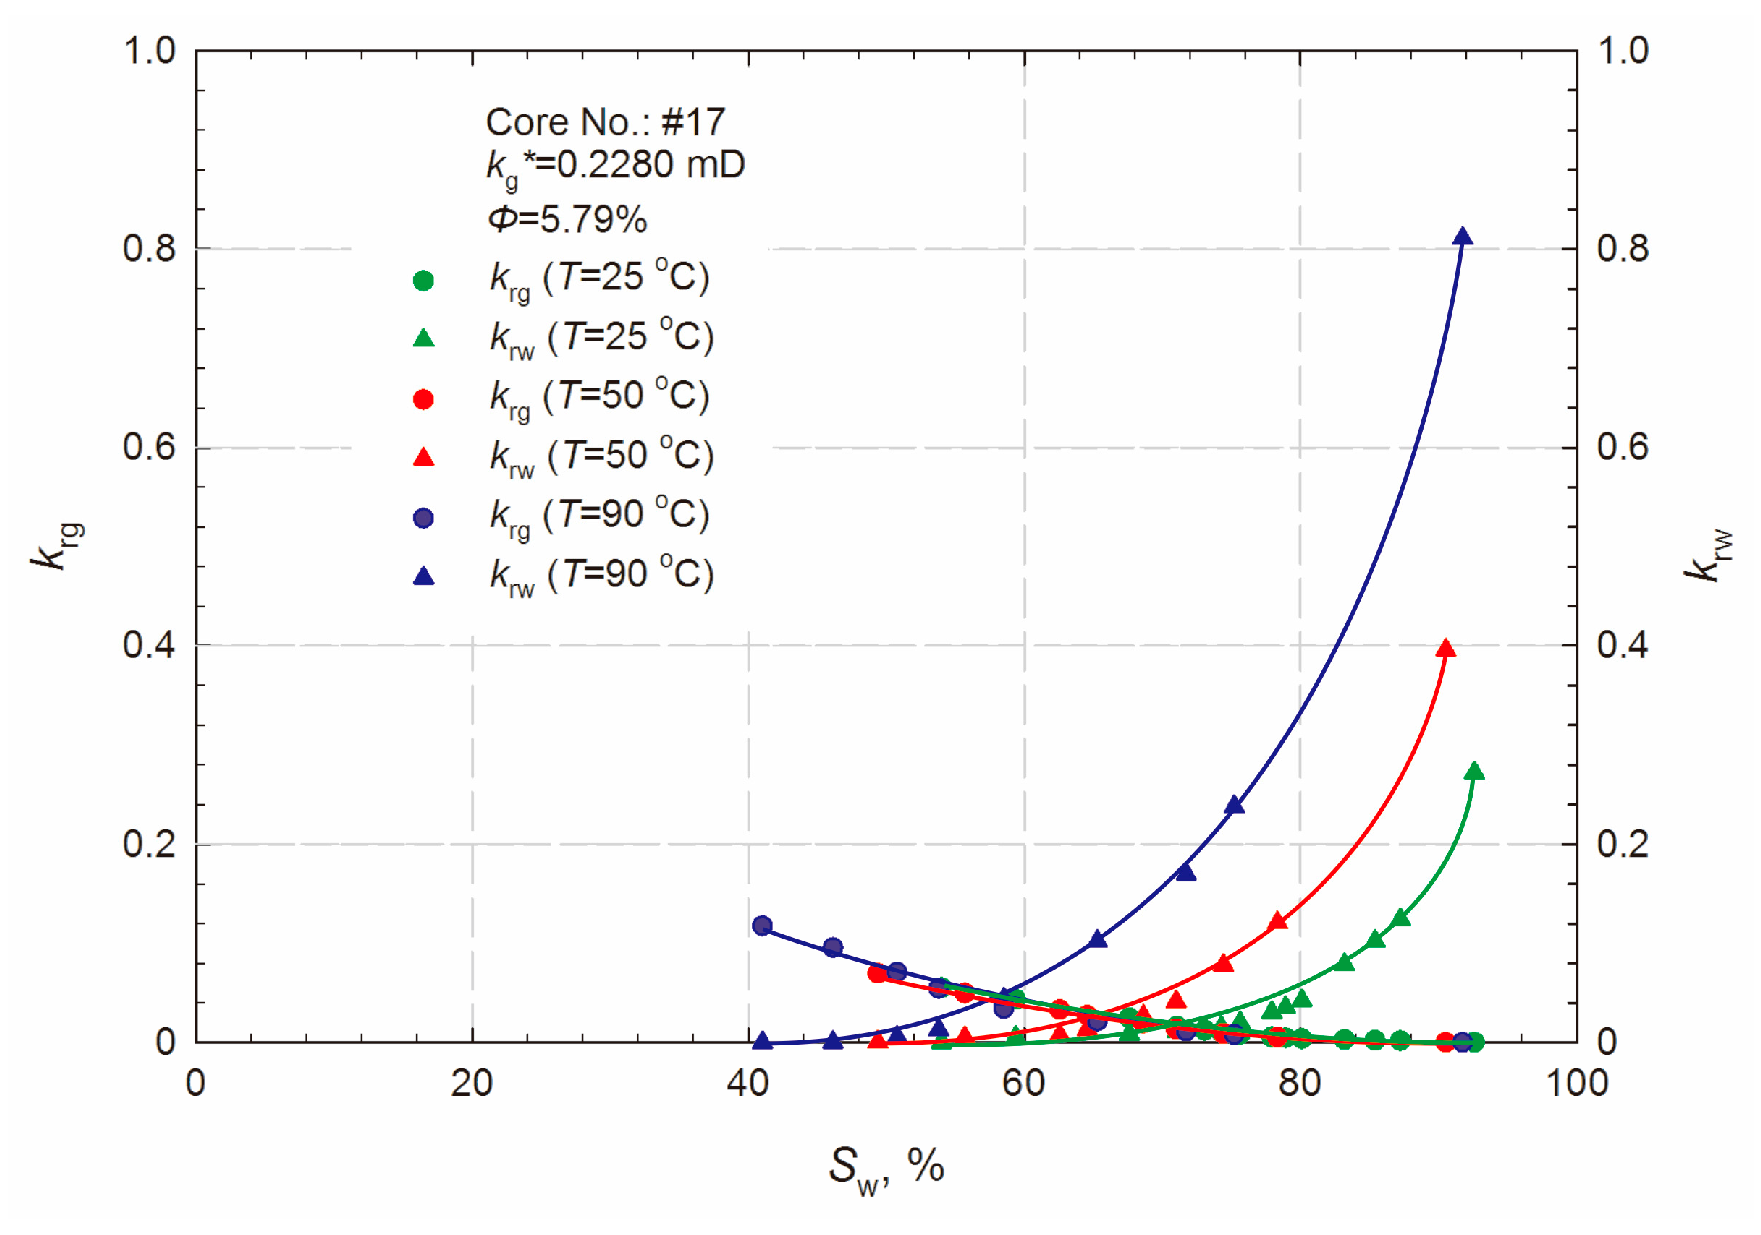
| #17 | 0.2280 | 5.79 | 6.766 | 2.512 |
| Core No. | , mD | Confining Pressure, MPa | Temperature, °C | Pressure Drop, MPa |
|---|---|---|---|---|
| 13 | 0.1418 | 30 | 90 | 8 |
| 14 | 0.2986 | 30 | 90 | 8 |
| 15 | 0.7312 | 30 | 90 | 8 |
| 16 | 2.8730 | 30 | 90 | 4 |
| 50 | 90 | 4 | ||
| 17 | 0.2280 | 30 | 25 | 4 |
| 30 | 50 | 4 | ||
| 30 | 90 | 4 |
© 2018 by the authors. Licensee MDPI, Basel, Switzerland. This article is an open access article distributed under the terms and conditions of the Creative Commons Attribution (CC BY) license (http://creativecommons.org/licenses/by/4.0/).
Share and Cite
Liu, G.; Fan, Z.; Lu, Y.; Li, S.; Feng, B.; Xia, Y.; Zhao, Q. Experimental Determination of Gas Relative Permeability Considering Slippage Effect in a Tight Formation. Energies 2018, 11, 467. https://doi.org/10.3390/en11020467
Liu G, Fan Z, Lu Y, Li S, Feng B, Xia Y, Zhao Q. Experimental Determination of Gas Relative Permeability Considering Slippage Effect in a Tight Formation. Energies. 2018; 11(2):467. https://doi.org/10.3390/en11020467
Chicago/Turabian StyleLiu, Guangfeng, Zhaoqi Fan, Yang Lu, Siying Li, Bo Feng, Yu Xia, and Qimeng Zhao. 2018. "Experimental Determination of Gas Relative Permeability Considering Slippage Effect in a Tight Formation" Energies 11, no. 2: 467. https://doi.org/10.3390/en11020467
APA StyleLiu, G., Fan, Z., Lu, Y., Li, S., Feng, B., Xia, Y., & Zhao, Q. (2018). Experimental Determination of Gas Relative Permeability Considering Slippage Effect in a Tight Formation. Energies, 11(2), 467. https://doi.org/10.3390/en11020467