Article

Optimal Capacity Configuration of a Hybrid Energy Storage System for an Isolated Microgrid Using Quantum-Behaved Particle Swarm Optimization

1
School of Electrical Engineering, Shandong University, 17923 Jingshi Road, Jinan, Shandong 250061, China
2
State Grid Jinan Power Supply Company, 238 Luoyuan Street Road, Jinan, Shandong 250012, China
*
Author to whom correspondence should be addressed.
Energies 2018, 11(2), 454; https://doi.org/10.3390/en11020454
Submission received: 29 December 2017 / Revised: 5 February 2018 / Accepted: 9 February 2018 / Published: 21 February 2018
(This article belongs to the Section D: Energy Storage and Application)

Abstract

:
The capacity of an energy storage device configuration not only affects the economic operation of a microgrid, but also affects the power supply’s reliability. An isolated microgrid is considered with typical loads, renewable energy resources, and a hybrid energy storage system (HESS) composed of batteries and ultracapacitors in this paper. A quantum-behaved particle swarm optimization (QPSO) algorithm that optimizes the HESS capacity is used. Based on the respective power compensation capabilities of ultracapacitors and batteries, a rational energy scheduling strategy is proposed using the principle of a low-pass filter and can help to avoid frequent batteries charging and discharging. Considering the rated power of each energy storage type, the respective compensation power is corrected. By determining whether the charging state reaches the limit, the value is corrected again. Additionally, a mathematical model that minimizes the daily cost of the HESS is derived. This paper takes an isolated micrgrid in north China as an example to verify the effectiveness of this method. The comparison between QPSO and a traditional particle swarm algorithm shows that QPSO can find the optimal solution faster and the HESS has lower daily cost. Simulation results for an isolated microgrid verified the effectiveness of the HESS optimal capacity configuration method.

1. Introduction

The optimal configuration of capacity is the key to a microgrid’s integrated control and energy management [1]. The energy configuration has a significant influence on the effective utilization of renewable energy, and the stability and economics of a microgrid, especially for an isolated microgrid. On the one hand, if the grid does not have sufficient energy storage capacity, the excess power generated by wind turbines or photovoltaic (PV) panels cannot be adequately stored. This would cause energy waste. On the other hand, if the capacity is large, the cost of investment will increase. In addition, the energy storage device may be in a low charge state for a long time, which will have a negative impact on its life and performance.
Common types of energy storage include: battery, ultracapacitor, superconducting energy storage and flywheel energy storage, etc. Many researchers have investigated optimal capacity configurations of energy storage devices. In most studies on the optimal capacity configuration of hybrid energy storage systems, a microgrid is considered a grid-connected operation. Their objective was to calculate the capacity and smooth fluctuations in the tie-line power flow [2,3]. However, the isolated microgrid has higher requirements for the control of an energy storage system. It is difficult to deal with the change of operating conditions and the longer use of single storage [4]. Related research [5,6] shows that the combination of high-power density energy storage devices, such as ultracapacitors and batteries, can make full use of their complementary characteristics, and improve the power output of energy storage. Due to the high energy density of the battery and the high power density of the ultracapacitors, this paper selects the ultracapacitor and the battery as hybrid energy storage systems (HESSs) for an isolated microgrid.
The primary target of an isolated microgrid is to enhance the accouplement between the generated power and the load. To optimize the HESS capacity in an isolated microgrid with respect to the load characteristics, a hybrid configuration scheme for the ultracapacitors and batteries based on cost analysis was proposed in [7]. An optimization model was constructed in [8], which considered the lowest average annual cost of the HESS based on life-cycle cost. From the perspective of intelligent algorithms, simulated annealing was combined with particle swarm optimization (PSO) in [9] to calculate the HESS capacity. Reference [10] moved away from a single cost target, and proposed a multiobjective optimization method. An adaptive weighted PSO was used to find the optimal solution. The traditional particle swarm optimization algorithm has more control parameters, which cannot converge to the global or even local optimal solution. If the control parameter is not suitable, it is highly likely that the optimal solution will not be found in the optimization process. Quantum-behaved particle swarm optimization (QPSO) has fast convergence rates and less control parameters, so it has been applied to power network planning, digital filters design [11,12].
In this paper, an isolated microgrid (Figure 1) that has typical loads, a HESS and renewable energy resources is considered. A new QPSO method is used to optimize HESS capacity. Based on the low-pass filtering principle, an energy scheduling strategy is proposed to allocate the energy of batteries and ultracapacitors. The objective is to minimize the daily cost of the HESS while guaranteeing that the HESS and microgrid can maintain normal operations. A traditional PSO and QPSO is compared. Through the analysis of the configuration results of a case study in north China, the superiority of QPSO algorithm is proved compared with traditional PSO. A simulated model of a microgrid verified the rationality of the HESS optimal capacity configuration method.

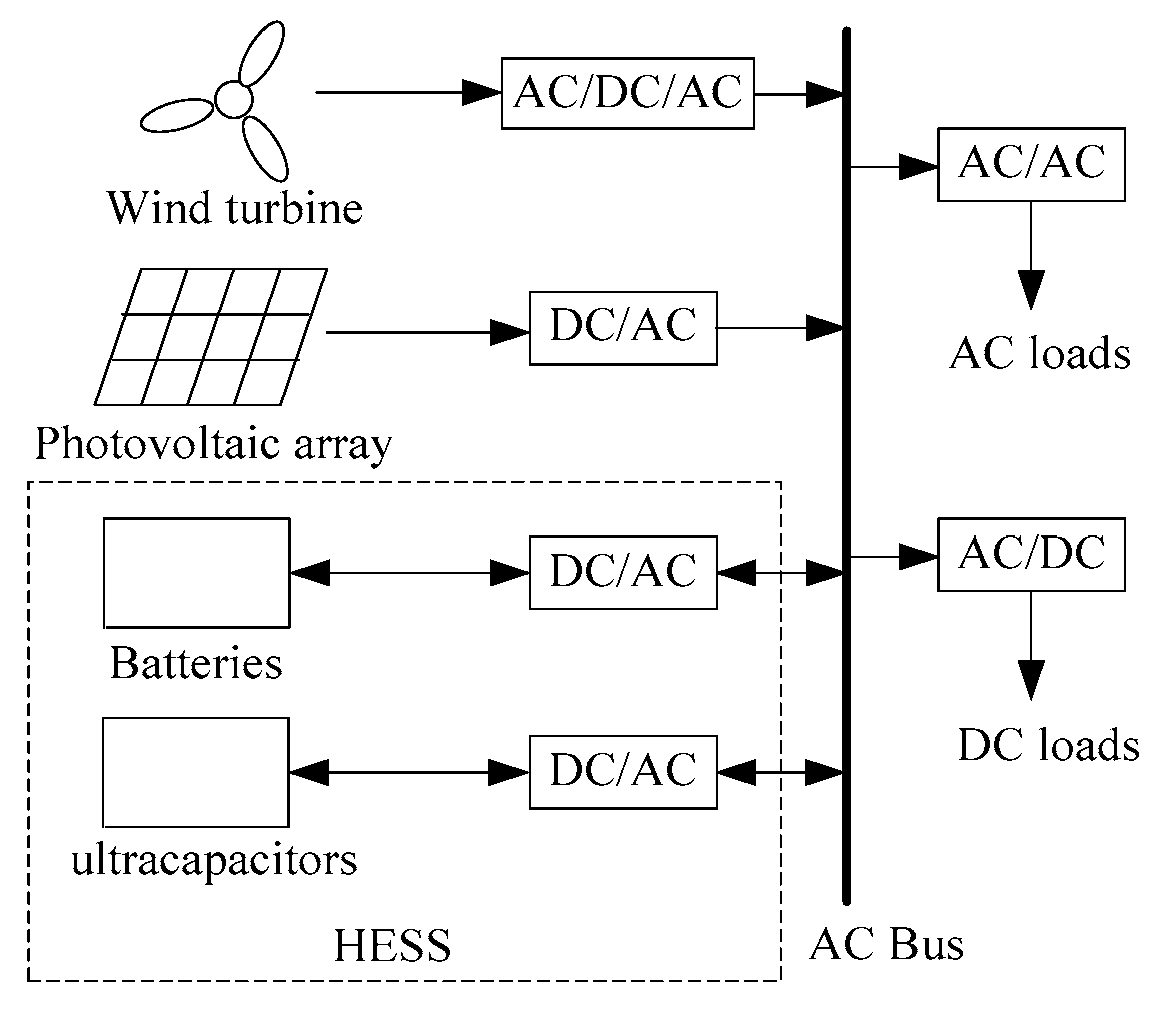
2. Mathematical Models of Microsources

This paper presents mathematical models of wind and photovoltaic power generation [13,14].
The actual power of the wind turbine is denoted as Pwt,t, defined as:
P w t , t = { 0 , v ( t ) < v c i v ( t ) 3 v c i 3 v r 3 v c i 3 P r , v c i < v ( t ) < v r P r , v r < v ( t ) < v c o 0 , v ( t ) > v c o
v ( t ) = v r e f ( t ) ( h h r e f ) α
where vr is rated wind speed; vci is cutting wind speed; vco is cut-out wind speed; v(t) is actual wind speed; Pr is rated power; vref(t) is reference wind speed; h is tower height; href is reference height (9 m), and α = 1/7.
The power of a single photovoltaicunit (PV) is denoted as Ppv,t, defined as:
P p v , t = P S T C G [ 1 + k ( T C T S T C ) ] G S T C
where GSTC is the radiation intensity (1 kW/m2); PSTC is maximum test power; G is practical light intensity; TSTC is reference temperature (298 K); and TC is practical temperature; k is power coefficient (−0.47%/K).
Considering in charging and discharging processes the energy changes, the state of charge (SoC) for the energy storage system is modelled as follow.
During charging:
S o C b a t / u c , t = S o C b a t / u c , t 1 P b a t / u c , t Δ t η b a t / u c , c / E b a t / u c
And during discharging:
S o C b a t / u c , t = S o C b a t / u c , t 1 P b a t / u c , t Δ t / ( E b a t / u c η b a t / u c , d )
Here, SoCbat/uc,t is the SoC of batteries or ultracapacitors at time t; Pbat/uc,t is the output power; ηbat/uc,c and ηbat/uc,d are the charging and discharging efficiencies. When Pbat/uc,t is positive, batteries or ultracapacitors are discharged. Ebat/uc is the capacity of each energy storage device and Δt is the duration of each interval.

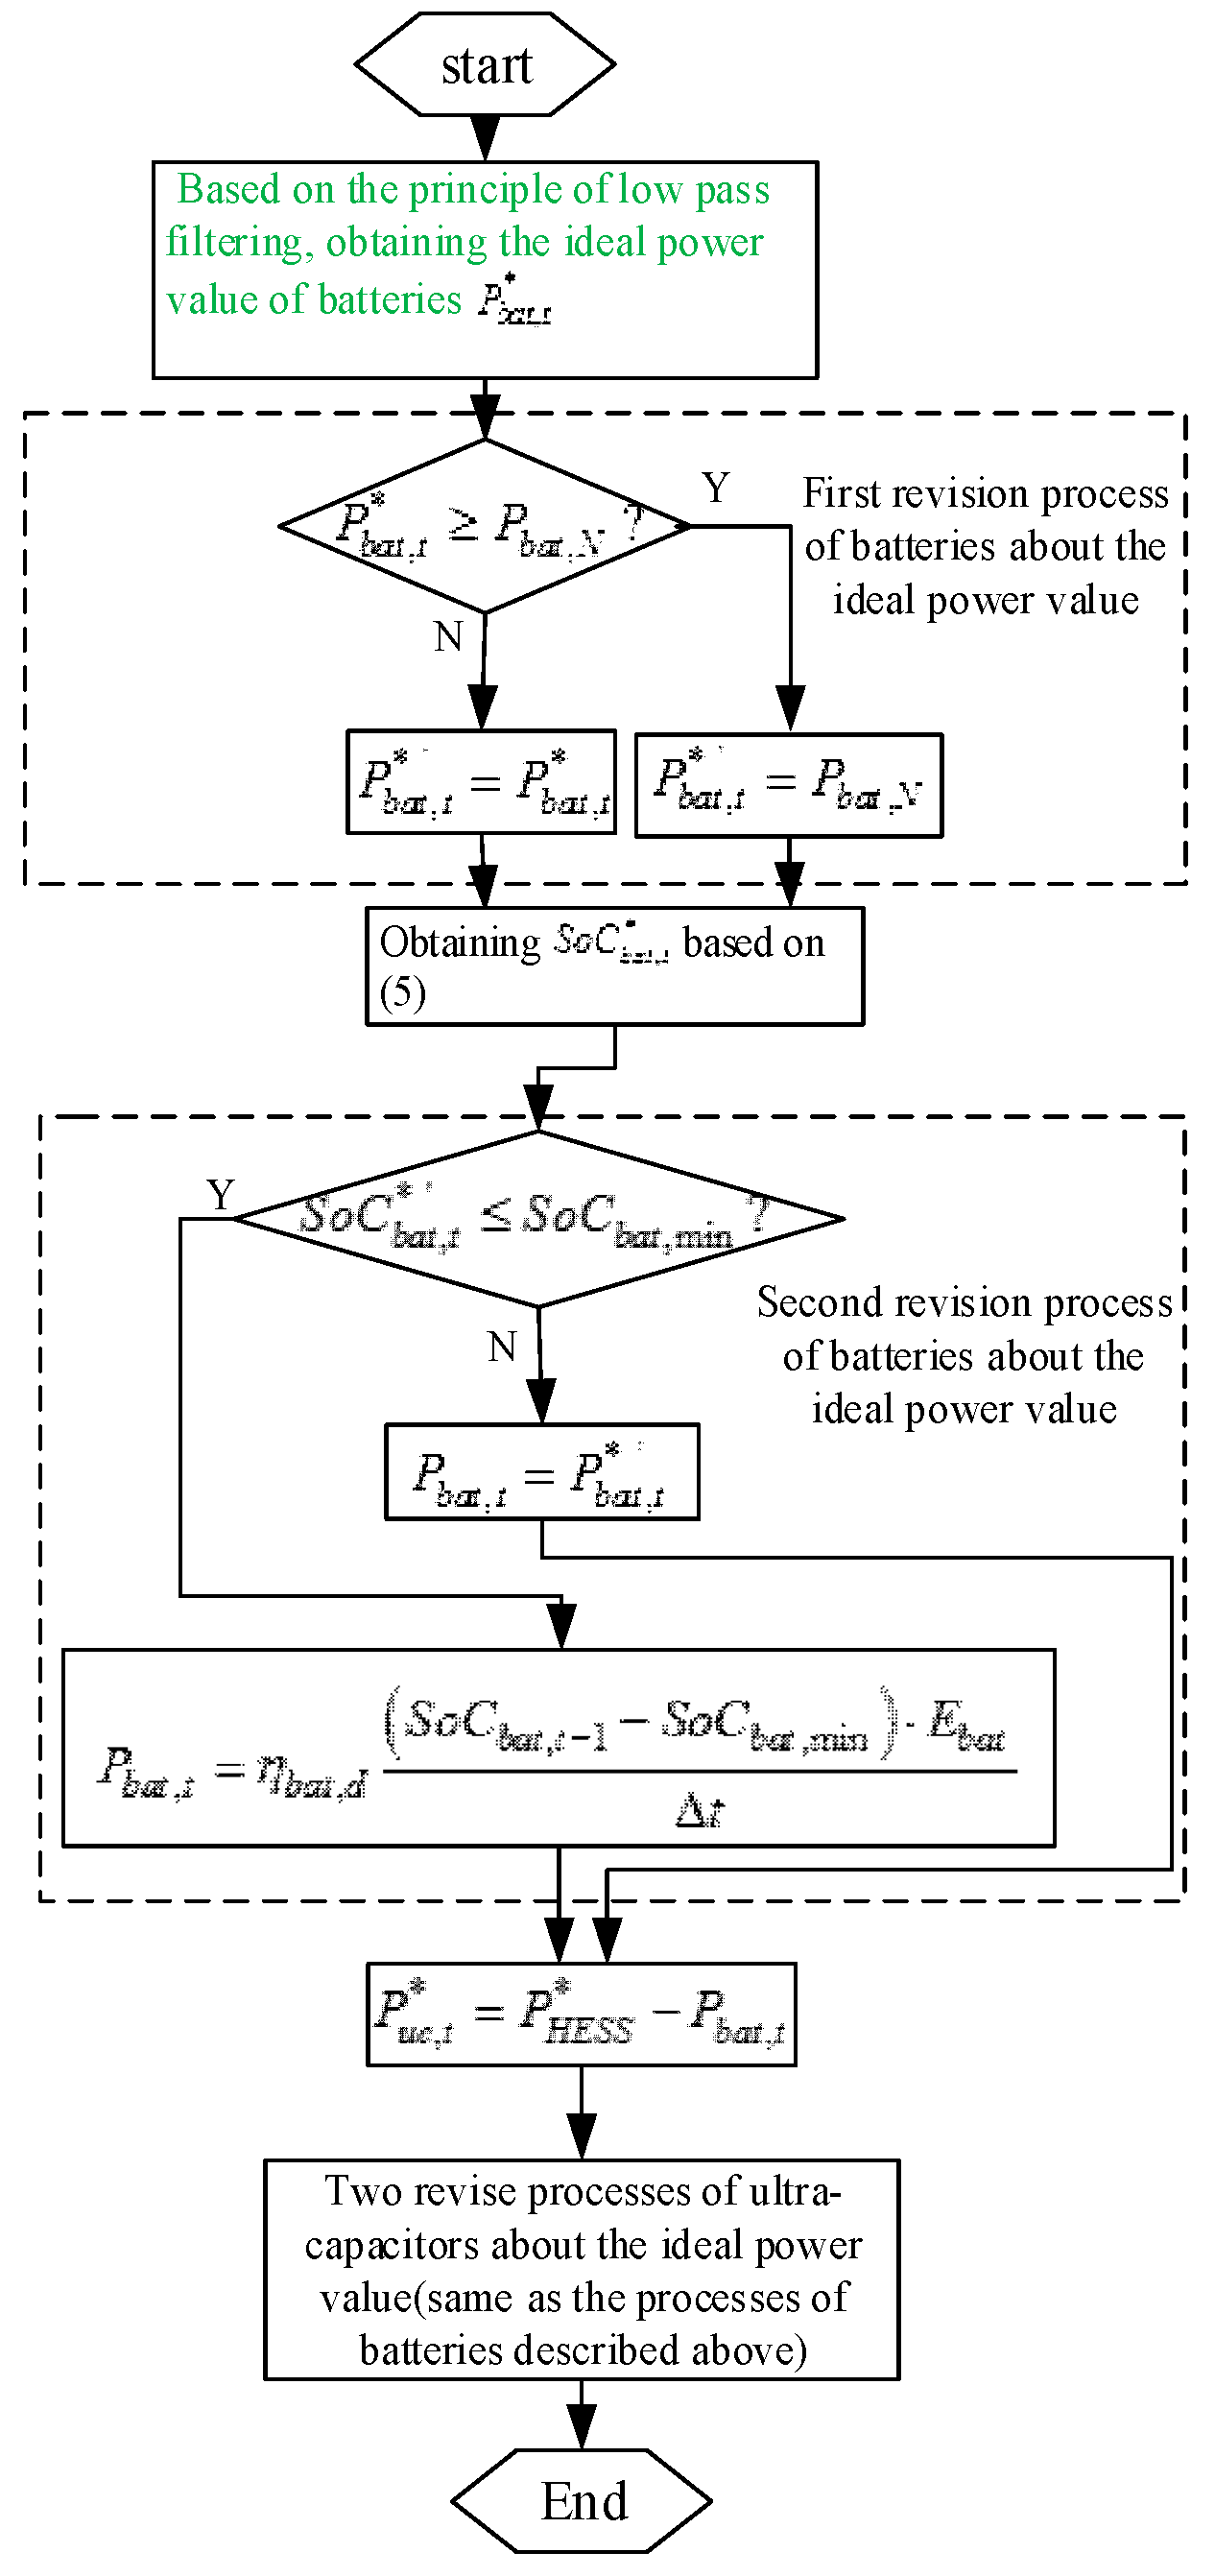
3. Energy Scheduling Strategy

The function of hybrid energy storage is to regulate the energy and balance the supply and demand of the isolated microgrid. That is:
Δ P t = P l o a d , t ( P w t , t + P p v , t )
where ΔPt is the missing power; Pload,t is the load power.
Based on the different characteristics of ultracapacitors and batteries, an energy scheduling strategy is proposed due to the fluctuation of wind and PV output [15]. Ultracapacitors are used to compensate for frequent power fluctuations, because an ultracapacitor has high response speed and high power density. Batteries are used to compensate for slight fluctuations in power, because a battery has slow response and low power density. Low-pass filtering is used. The frequent charging and discharging of the batteries are avoided with the help of ultracapacitors.
The optimal power of the battery ( P b a t , t * ) is obtained by low-pass filtering principle. Then, P b a t , t * is corrected considering the rated power. By determining whether the SoC reaches its limit after compensation, the value is corrected again. These revision processes are described in Figure 2, which considers the battery discharge process.
P*′bat,tis the first corrected value. Pbat,N is the rated battery power. The ideal battery power is:
P b a t , t * = T L T L + Δ t P b a t , t 1 + Δ t T L + Δ t P H E S S , t *
where
f L = 1 / ( 2 π T L )
In Figure 2, Pbat,t−1 is the actual battery power. The time constant of the first-order low-pass filter is TL. fL is the compensation boundary frequency for accumulators and ultracapacitors. It can be obtained through analyzing the frequency spectrum of P H E S S * . The frequency range of batteries control power components is 0~fL. Ultracapacitors control power components with frequencies higher than fL.

4. Optimization Model and QPSO Algorithm

4.1. Objective Function

The objective is to minimize the daily HESS cost, considering the one-time investment cost, operational costs, and maintenance costs. That is:
min C d = 1 365 ( C P + C O + C M )
where Cd is average daily cost of hybrid energy storage device; CP is total annual investment cost; CO is annual operating cost; and CM is annual maintenance cost. They all affect the choice of capacity. That is:
C P = E b a t C b a t f P b a t + E u c C u c f P u c
C O = E b a t C b a t f O b a t + E u c C u c f O u c
C M = E b a t C b a t f M b a t + E u c C u c f M u c
where Cbat ($/kWh) is battery price, fObat is operation coefficient, fMbat is maintenance coefficient, fPbat is battery depreciation coefficient. Cuc, fOuc, fMuc, fPuc are price, coefficients of the ultracapacitors respectively. The depreciation coefficient is:
f P = d ( 1 + d ) l ( 1 + d ) l 1
l is the service life. d is the depreciation rate.

4.2. Constraint Condition

4.2.1. HESS Constraints

SoC should be within reasonable limits, which is capacity restriction:
S o C b a t , min S o C b a t , t S o C b a t , max
and
S o C u c , min S o C u c , t S o C u c , max
The initial SoC can be set to 0.5 to guarantee that the energy storage system is discharged normally when power is in short supply.
For the battery charging and discharging, Pbatc,t,max and Pbatd,t,max are the maximum allowable values, defined as:
P b a t c , t , max = min { P b a t , N , ( S o C b a t , max S o C b a t , t 1 ) E b a t η b a t , c Δ t }
and
P b a t d , t , max = min { P b a t , N , η b a t , d ( S o C b a t , t 1 S o C b a t , min ) E b a t Δ t }
Pucc,t,max and Pucd,t,max are the equivalent values for the ultracapacitors, defined as:
P u c c , t , max = min { P u c , N , ( S o C u c , max S o C u c , t 1 ) E u c η u c , c Δ t }
and
P u c d , t , max = min { P u c , N , η u c , d ( S o C u c , t 1 S o C u c , min ) E u c Δ t }

4.2.2. Constraints on the Microgrid Operation

The energy produced at any moment in the power system is equal to the consumed. That is:
P p v , t + P w t , t + P b a t , t + P s c , t + S l a c k , t P l a c k , t = P l o a d , t + S w a s t e , t P w a s t e , t
Slack,t is power shortage, and Swaste,t is power surplus. They can take values either 0 or 1. They cannot be 1 at the same time. Plack,t is system loss power. Pwaste,t is surplus power.
The reliability of power supply is reflected by the loss of power supply probability (LPSP). The smaller LPSP, the more reliable the system is. The waste rate of energy is reflected by surplus of power supply probability (SPSP). The smaller the SPSP, the more solar power generation is used. LPSP and SPSP are defined as:
L P S P = t = 1 24 P l a c k , t / t = 1 24 P l o a d , t L P S P max
and
S P S P = t = 1 24 P w a s t e , t / ( t = 1 24 P w t , t + t = 1 24 P p v , t ) S P S P max
The HESS capacity should satisfy the LPSP and SPSP indexes, i.e., both should be less than LPSPmax and SPSPmax.

4.2.3. QPSO Algorithm

A QPSO algorithm is used for solving the above optimization model. Euc and Ebat are the optimal variables. Equation (10) is the fitness function. The results of Ebat and Euc should be obtained under the constraints that minimize (10). The form of the constraint is the penalty functions.
The particle swarm optimization algorithm, as a swarm intelligence optimization algorithm, is not only simple and easy to implement, but also has a fast convergence speed, which is a robust global search algorithm. Compared to the traditional deterministic optimization algorithm, the particle swarm algorithm does not depend on the problem characteristics, and does not require the objective function or constraint function to be analytic, more do not require differentiable objective function is continuous or higher order. Therefore, the use of traditional optimization methods are unable or difficult to deal with the highly nonlinear, nondifferentiable, multimodal, multivariate problems, especially when the objective function is discontinuous or micro, or is affected by the noise without clear explicit mathematical form. As such, using the particle swarm algorithm for solving has great advantage. But traditional the PSO algorithm has some shortcomings. For example, it is sometimes difficult to converge to a global or local optimum and the standard PSO algorithm is not guaranteed to converge to the global optimal solution or local optimal solution with probability 1. From the perspective of quantum mechanics, QPSO presents a method for solving optimization problems. Each particle is in a quantum state in QPSO. Each state is represented by its wave function, not the position and velocity vector used in the PSO [16]. In QPSO, there is no velocity vector. Xi,j(k + 1) is defined as the position of particle i at the (k + 1)th iteration. It is updated using.
{ X i , j ( k + 1 ) = p i , j ( k ) ± β | C j ( k ) X i , j ( k ) | ln 1 u i , j ( k ) u i , j ( k ) ~ ( 0 , 1 )
β = ( 1.0 0.5 ) k max k k max + 0.5
where i (1 ≤ iM) is the ith particle. M represents potential solutions, is the total number of particles. The type and quantity of the samples need to be enough to avoid the early convergence of the algorithm. j (1 ≤ j ≤ 2) is the dimension of the solution space. kmax is the maximum number of iterations. β is the contraction-expansion coefficient, used to control the convergence speed. Except for the population size (M) and number of iterations (k), this is the only controlled parameter. Parameter β is usually fixed or linearly reduced. pi,j(k) represent the local attractor and is:
{ p i , j ( k ) = ϕ j ( k ) P i , j ( k ) + [ 1 ϕ j ( k ) ] G j ( k ) ϕ j ( k ) ~ ( 0 , 1 )
where ϕ j ( k ) is a random number uniformly distributed in (0, 1). Cj(k) are the centres of the best positions of the swarm, represented as:
C j ( k ) = 1 M i = 1 M P i , j ( k )
Pi,j(k) is the best position of particle i, that is:
P i ( k ) = { X ( k ) f [ X i ( k ) ] < f [ P i ( k 1 ) ] P i ( k 1 ) f [ X i ( k ) ] f [ P i ( k 1 ) ]
G(k) is the global best position of the swarm, defined as:
G j ( k ) = P g ( k ) ,   g = arg min 1 i M { f [ P i ( k ) ] }
where f is the fitness function and g∈{1, 2, …, M}.
The steps of the algorithm are as follows:
(a)
Initialize particles.
(b)
Set the personal best positions, Pi(0) = Xi(0). The fitness value of each initial particle was evaluated and the position of the optimal individual in the group was recorded as the global initial optimal position.
(c)
Calculate the positions of random points using (24), and update new particles using (23).
(d)
Calculate the fitness values using (9), based on the aforementioned energy scheduling strategy.
(e)
Update the individual and global optimal location of the particle using (26) and (27).
(f)
Determine whether the termination condition is satisfied. If they are, the output is calculated, otherwise return to Step (c).
The optimal capacity of the battery and ultracapacitors can be obtained through the above method, but the local temperature characteristics still need to be considered in the actual selection of the battery and ultracapacitors. The output capacity of the battery can be adjusted according to the local actual temperature conditions [17]:
Δ Q max ( T ) = Δ Q max ( 25 ° C ) × exp [ E a ( ϕ ) R ( 1 298 1 T ) ]
where Δ Q max ( T ) is the difference between the actual output capacity and the nominal capacity at T; Δ Q max ( 25 ° C ) is the difference between the actual output capacity and the nominal capacity at 25 ° C ; E a ( ϕ ) is activation energy; R is the gas time constant; T is local temperature.
Temperature not only affects the selection of battery capacity, but also affects the actual working conditions of ultracapacitors. When temperature changes, the change of ultracapacitor series resistance (ESR) is the main factor affecting the actual working conditions of ultracapacitors. The higher the temperature, the lower the resistance of the series resistance, the higher the actual output voltage of the capacitor [18]. The relationship between the series resistance of different ultracapacitors and temperature is not determined mathematically. In practice, it is necessary to find the corresponding data manual of ultracapacitors.

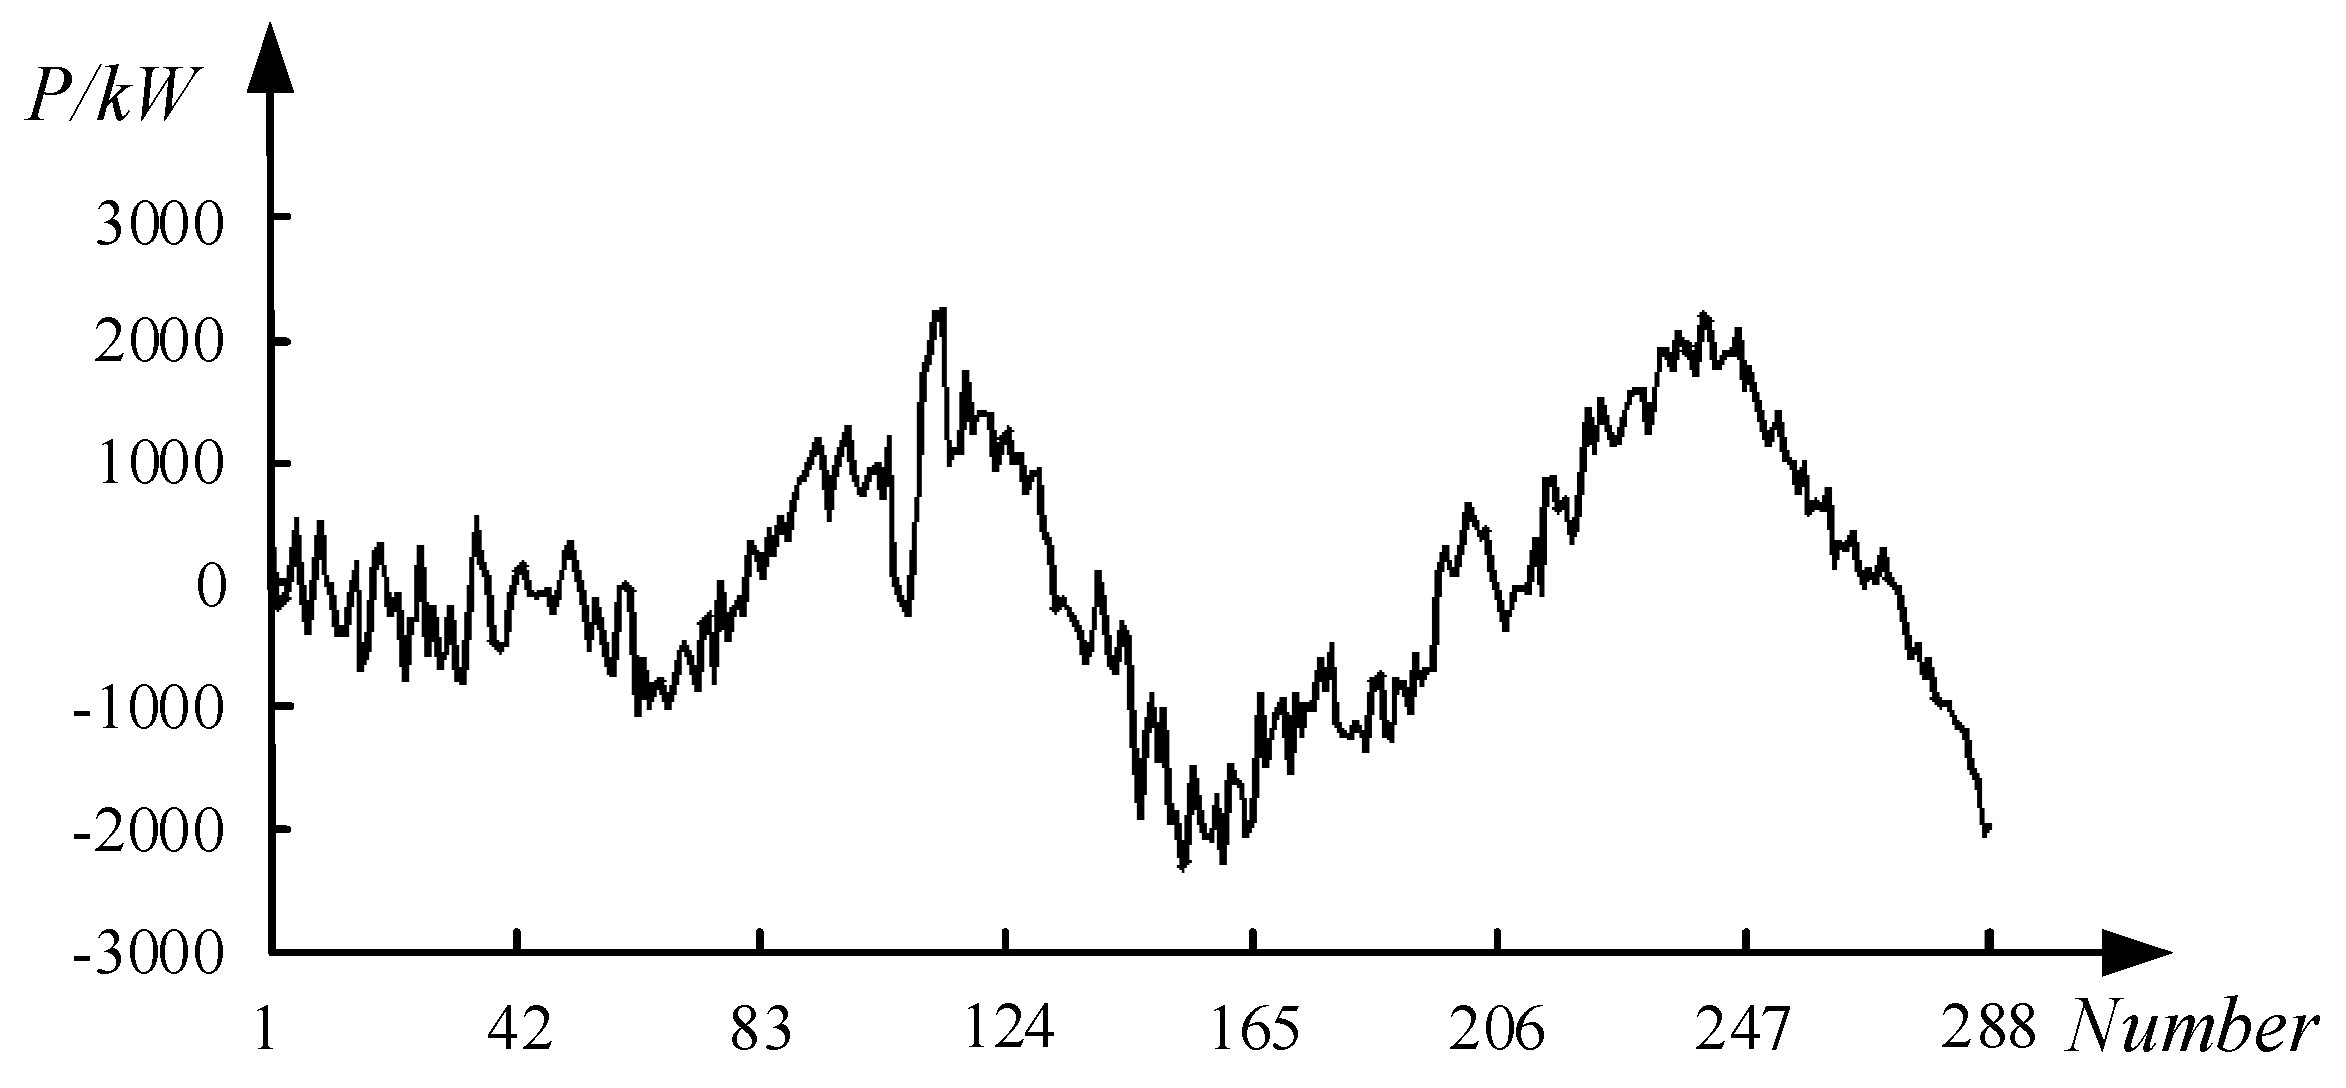
5. Case Study and Analysis

This paper used the case of an isolated microgrid in north China to verify the proposed method. The wind speed data at the sampling interval of 5 min in the current area can be calculated by the formulas (1) and (2). According to the annual average meteorological data of local light intensity and temperature, Homer software was used to simulate the light data with a 1-h interval. The light data of 5 min sampling interval is obtained by data fitting, and the output power of PV can be calculated by formula (3). The daily load data of 1 h was processed by the same method, and 10% random fluctuation was added to get the corresponding daily load curve. The actual power of the load and the calculated wind/PV output for one day are shown in Figure 3. For this example, the project life was 15 years and the interval time was 5 min. LPSPmax was 4%. SPSPmax was 12%. The details of HESS are shown in Table 1.

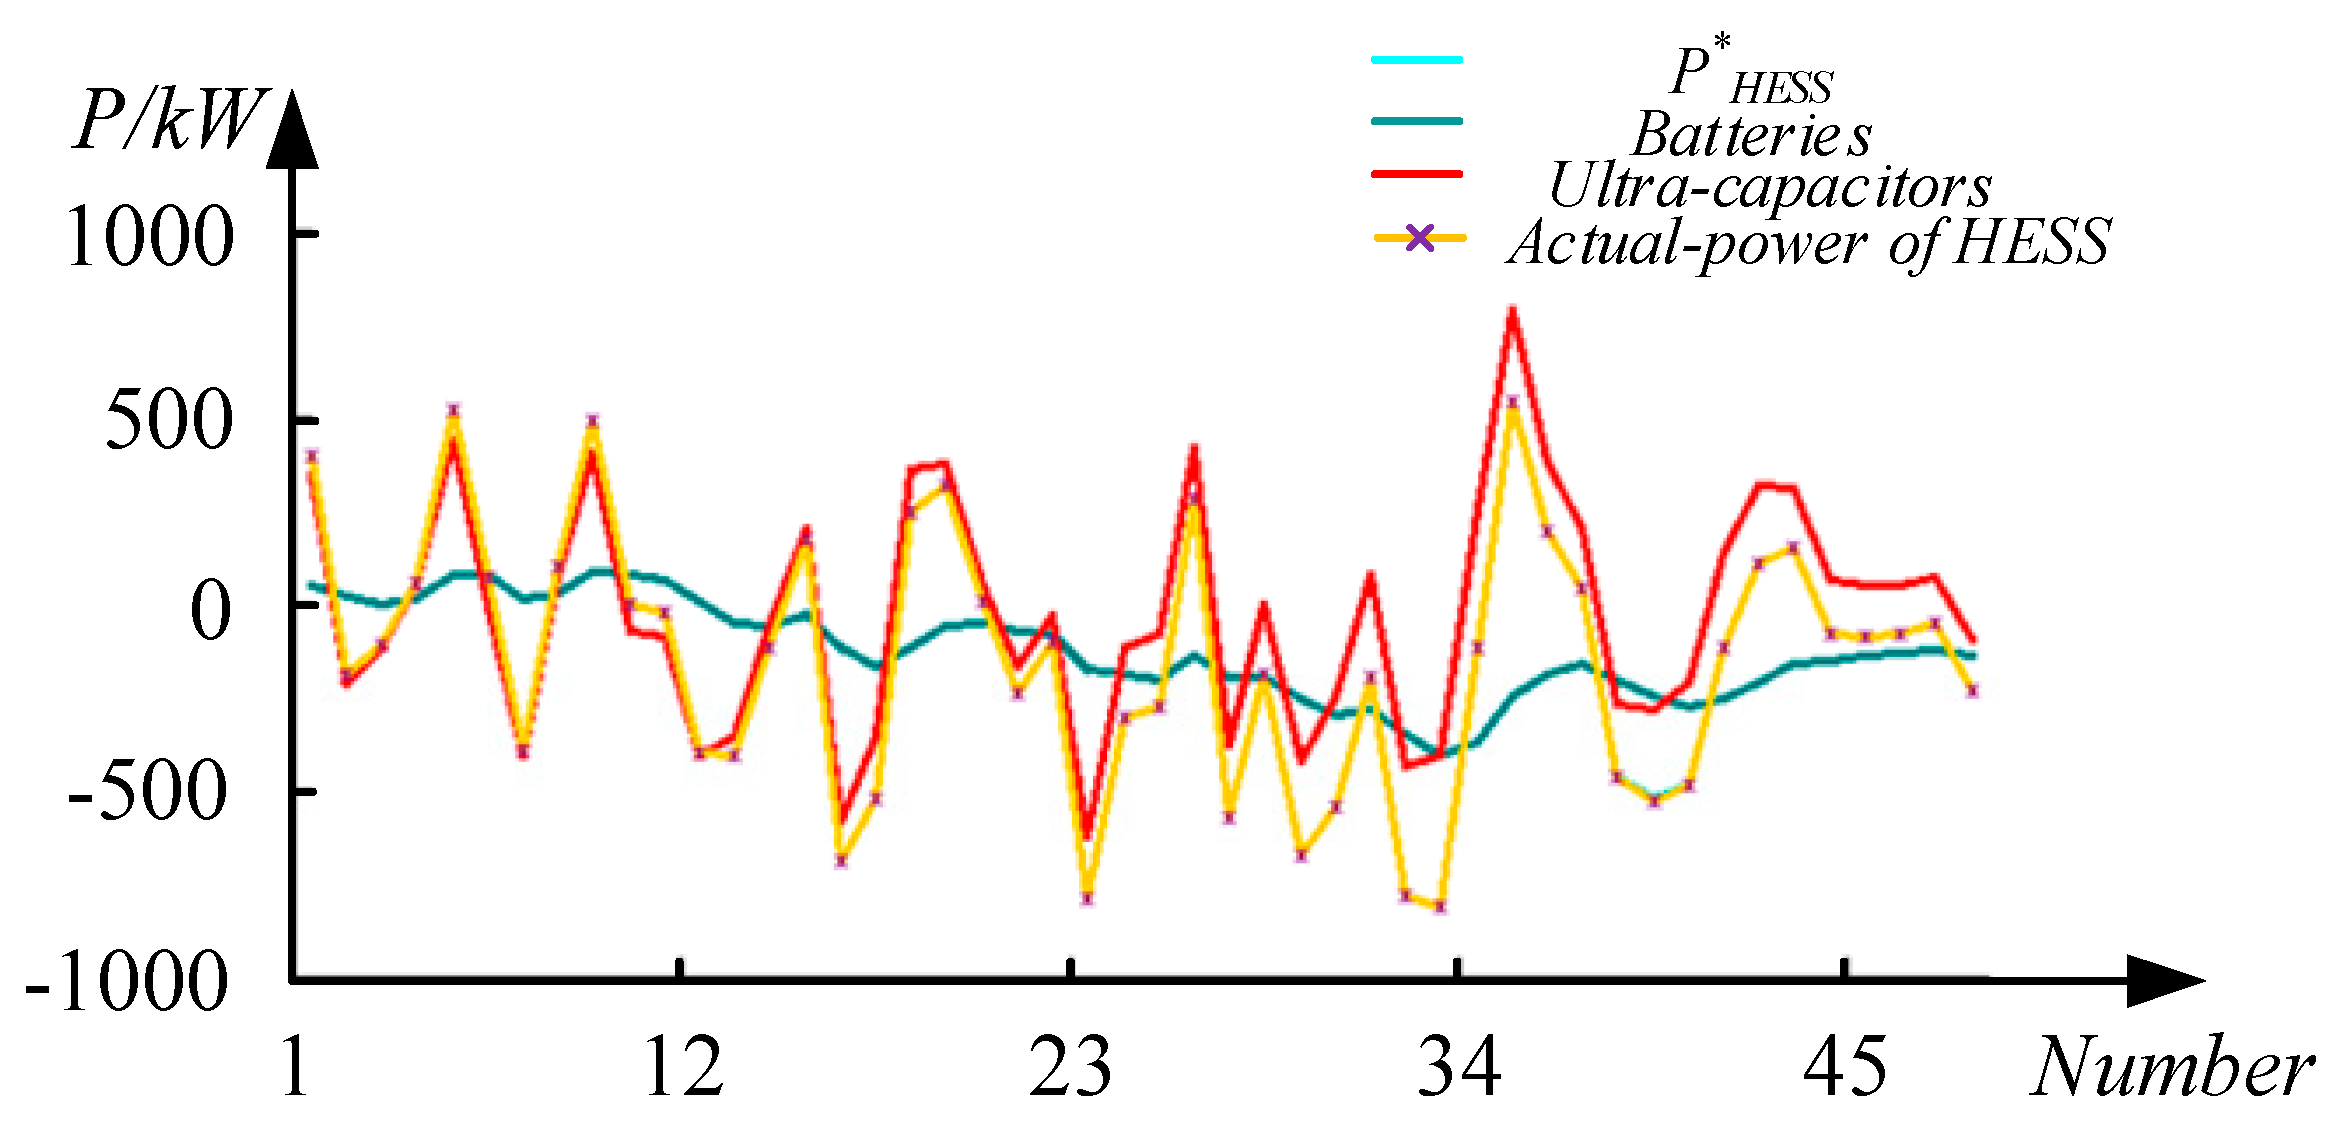
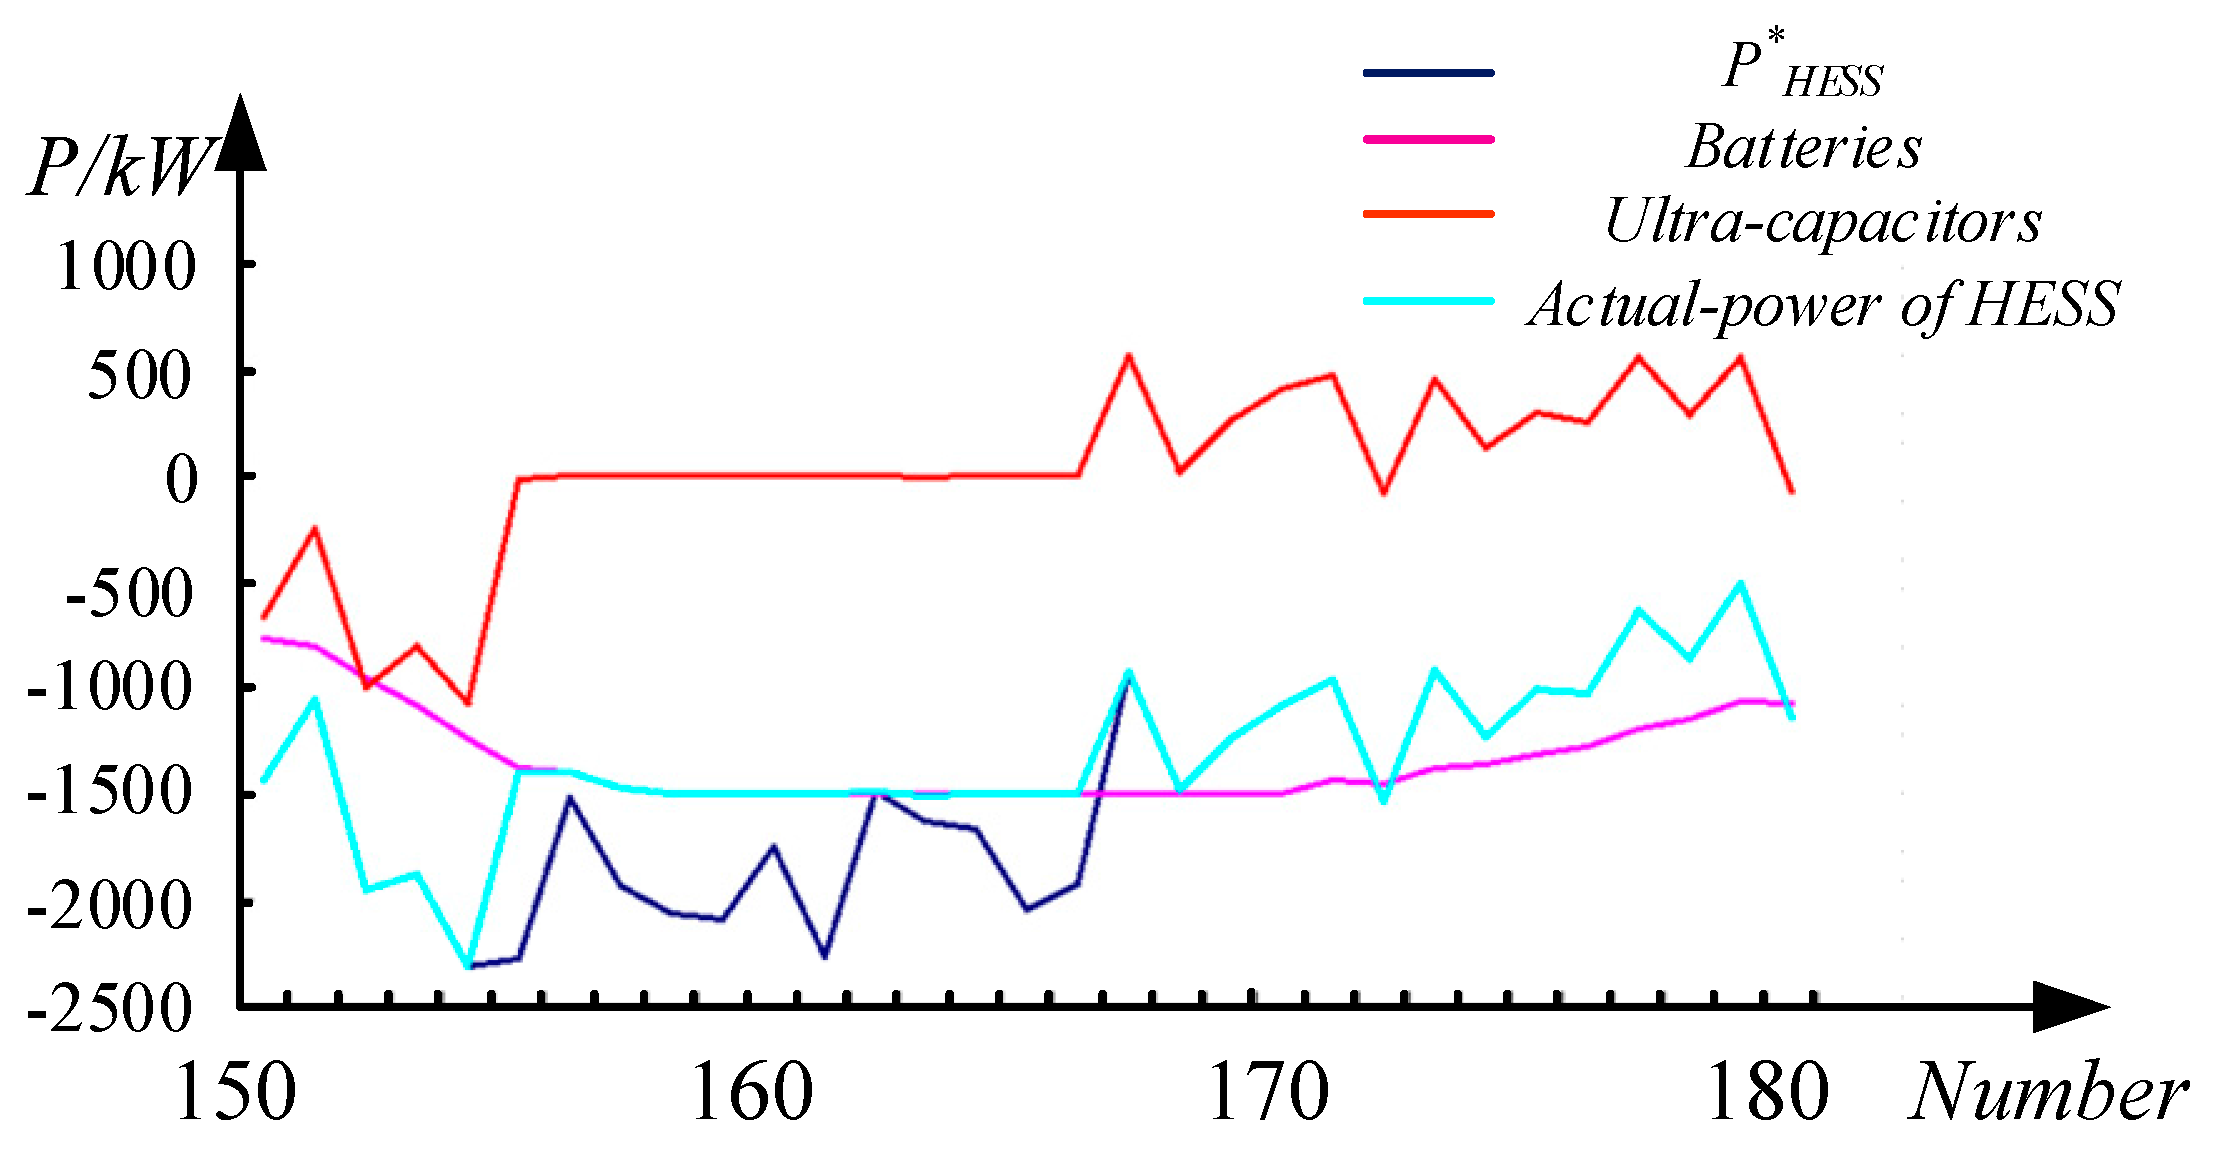
5.1. Optimization Results and Analysis

The ideal power value of the HESS is shown in Figure 4.
The spectral analysis of P H E S S * is conducted based on the discrete Fourier transform, and the results are shown in Figure 5.
Figure 5 shows that the power amplitudes at lower frequencies are larger than that at high frequencies. A frequency of 0.000081 Hz is used to identify the batteries and ultracapacitors.
In this paper, the population size was M = 100, and the maximum number of iterations was set to 200. The battery capacities were 7807.84 kWh, the ultracapacitor capacities were 1985.16 kWh, and the daily cost was $5902.36.
The outputs of the HESS are shown in Figure 6. It shows that the battery power fluctuations are less abrupt. The ultracapacitors are frequently charged and discharged. This is consistent with the above spectrum analysis results.
There were large fluctuations in the ultracapacitor power amplitude for sample points around 100 and 247—this may be because there were shock loads. Batteries are limited for their maximum capacity and could not adequately compensate for these sudden load changes. Ultracapacitors reacted to the power imbalance because they have high power density.
Figure 7 and Figure 8 show the actual HESS power and P H E S S * curves for sample points 1–48 and 150–180 in Figure 8.
The actual HESS power and P H E S S * coincide in Figure 7. This indicates that the actual HESS power could exactly track P H E S S * at the beginning of a day. The power instructions could not be revised because the energy changes are within a reasonable range.
There were differences between the actual HESS power and P H E S S * in Figure 8. Limited by the batteries’ rated power, the maximum charging power of the batteries was 1500 kW. Therefore, the surplus power could not be completely absorbed because the ultracapacitors were limited by SoCuc,max. However, in the iterative operation of the algorithm, the energy overflow rate constraint of the system is implicit in the operation process in the form of penalty function, enough to satisfy the system requirements.

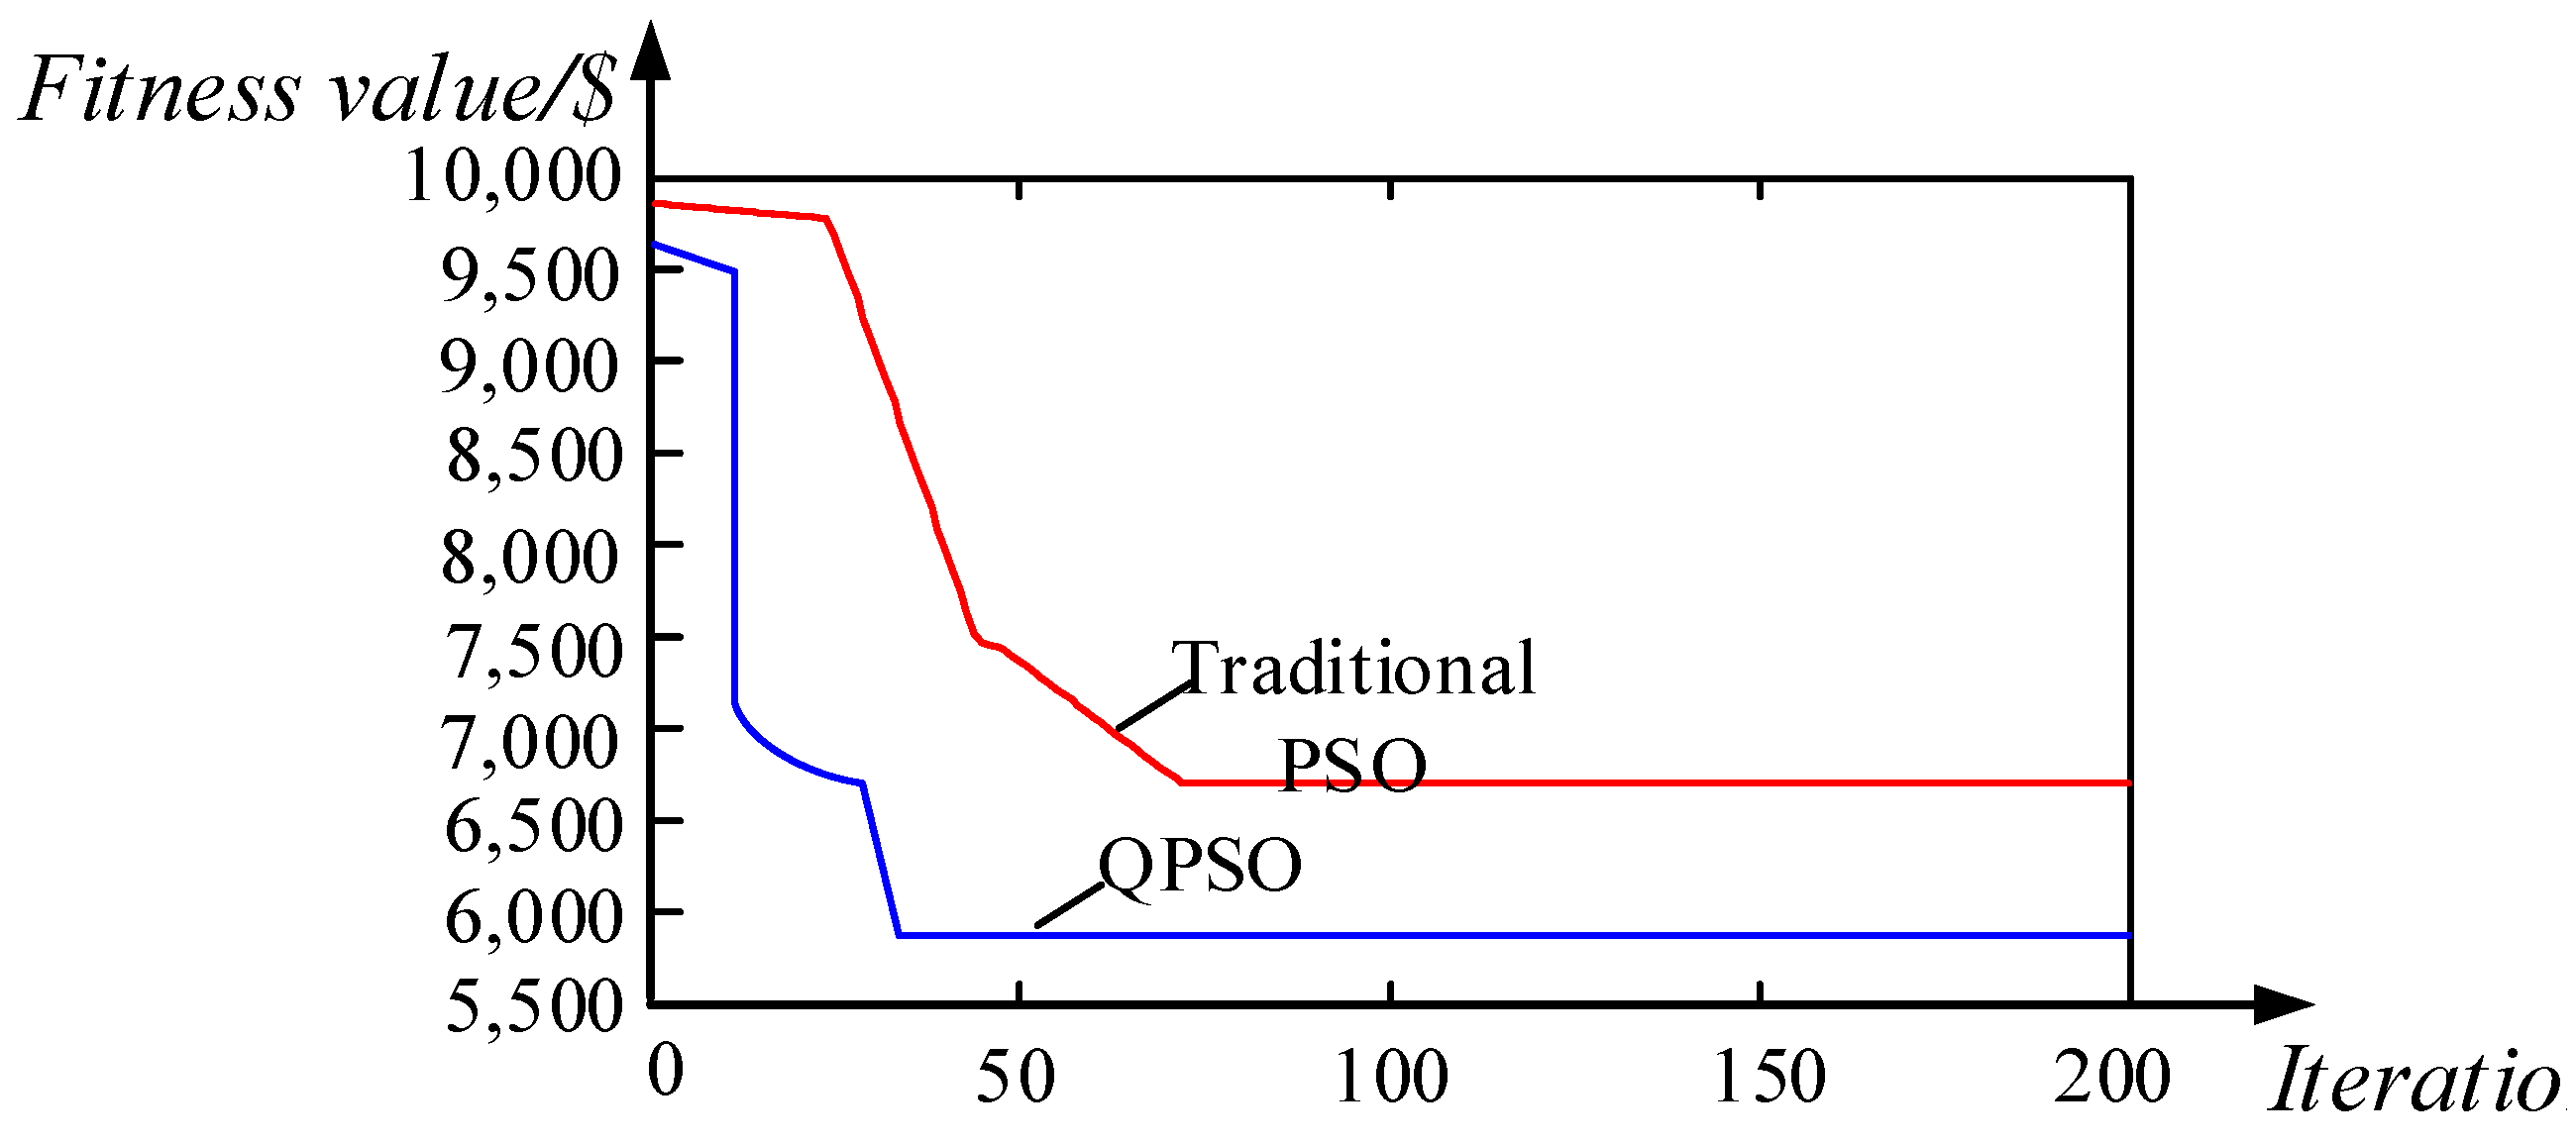
5.2. Comparison of Traditional PSO and QPSO

The capacity configuration results are shown in Table 2 and Figure 9.
QPSO found the optimal result after 47 iterations, whereas PSO took 73 iterations. Using traditional PSO the battery capacities were 9084.26 kWh. The ultracapacitor capacities were 2196.52 kWh. The daily cost was $6708.83, which is higher than these of QPSO. QPSO have a faster convergence rate and a better fitness value than traditional PSO. The cost of the HESS was reduced using QPSO.

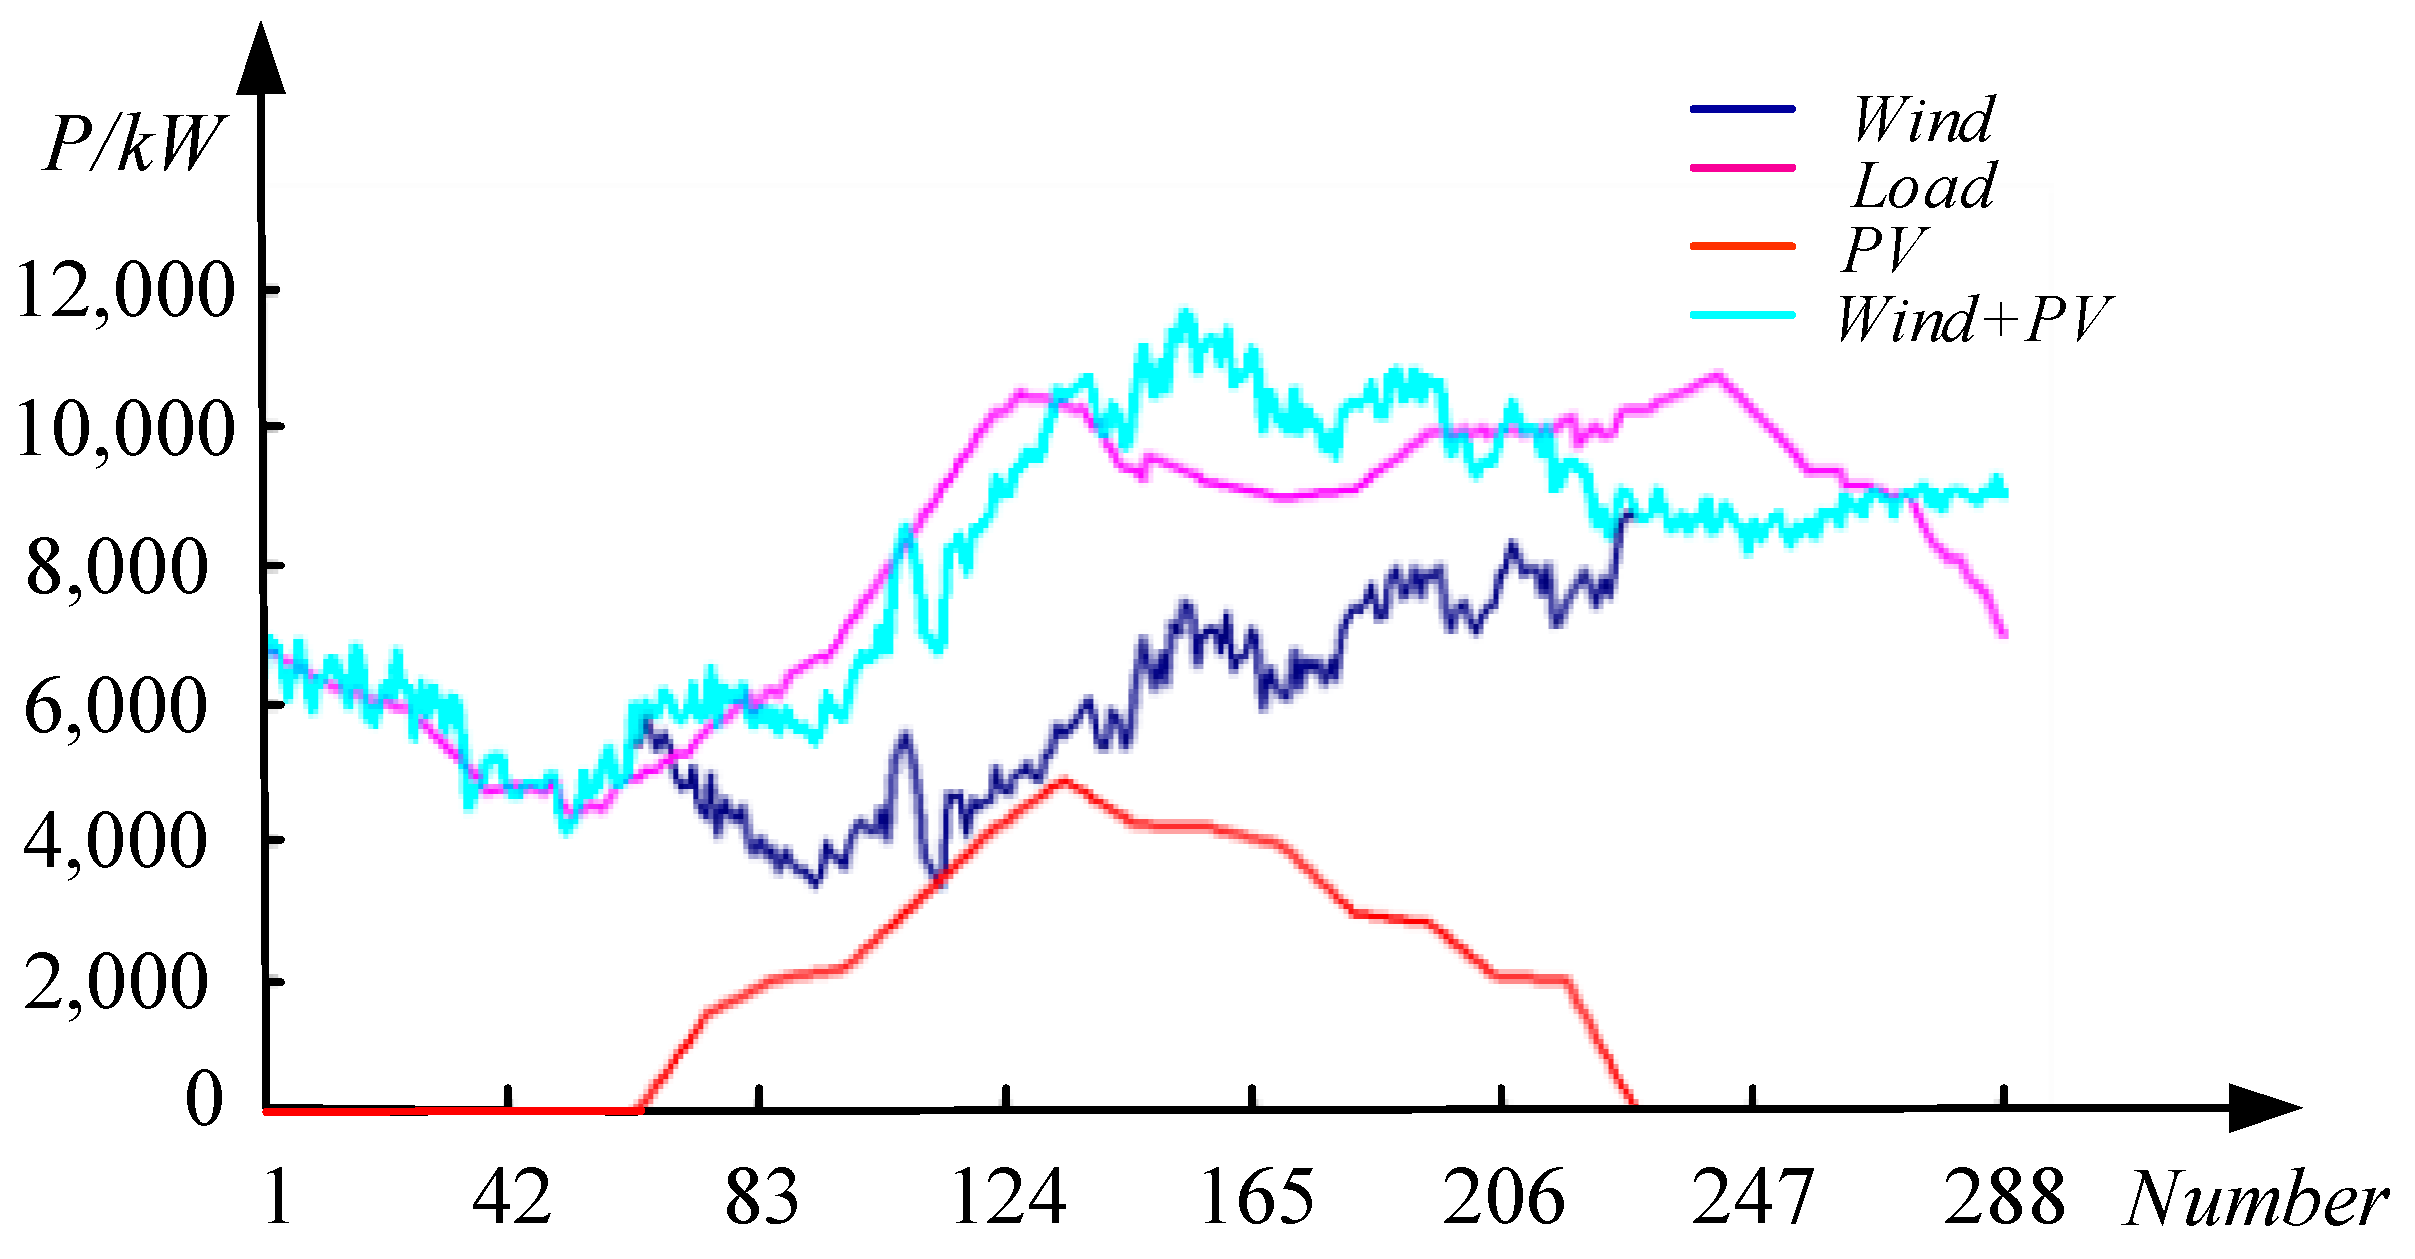
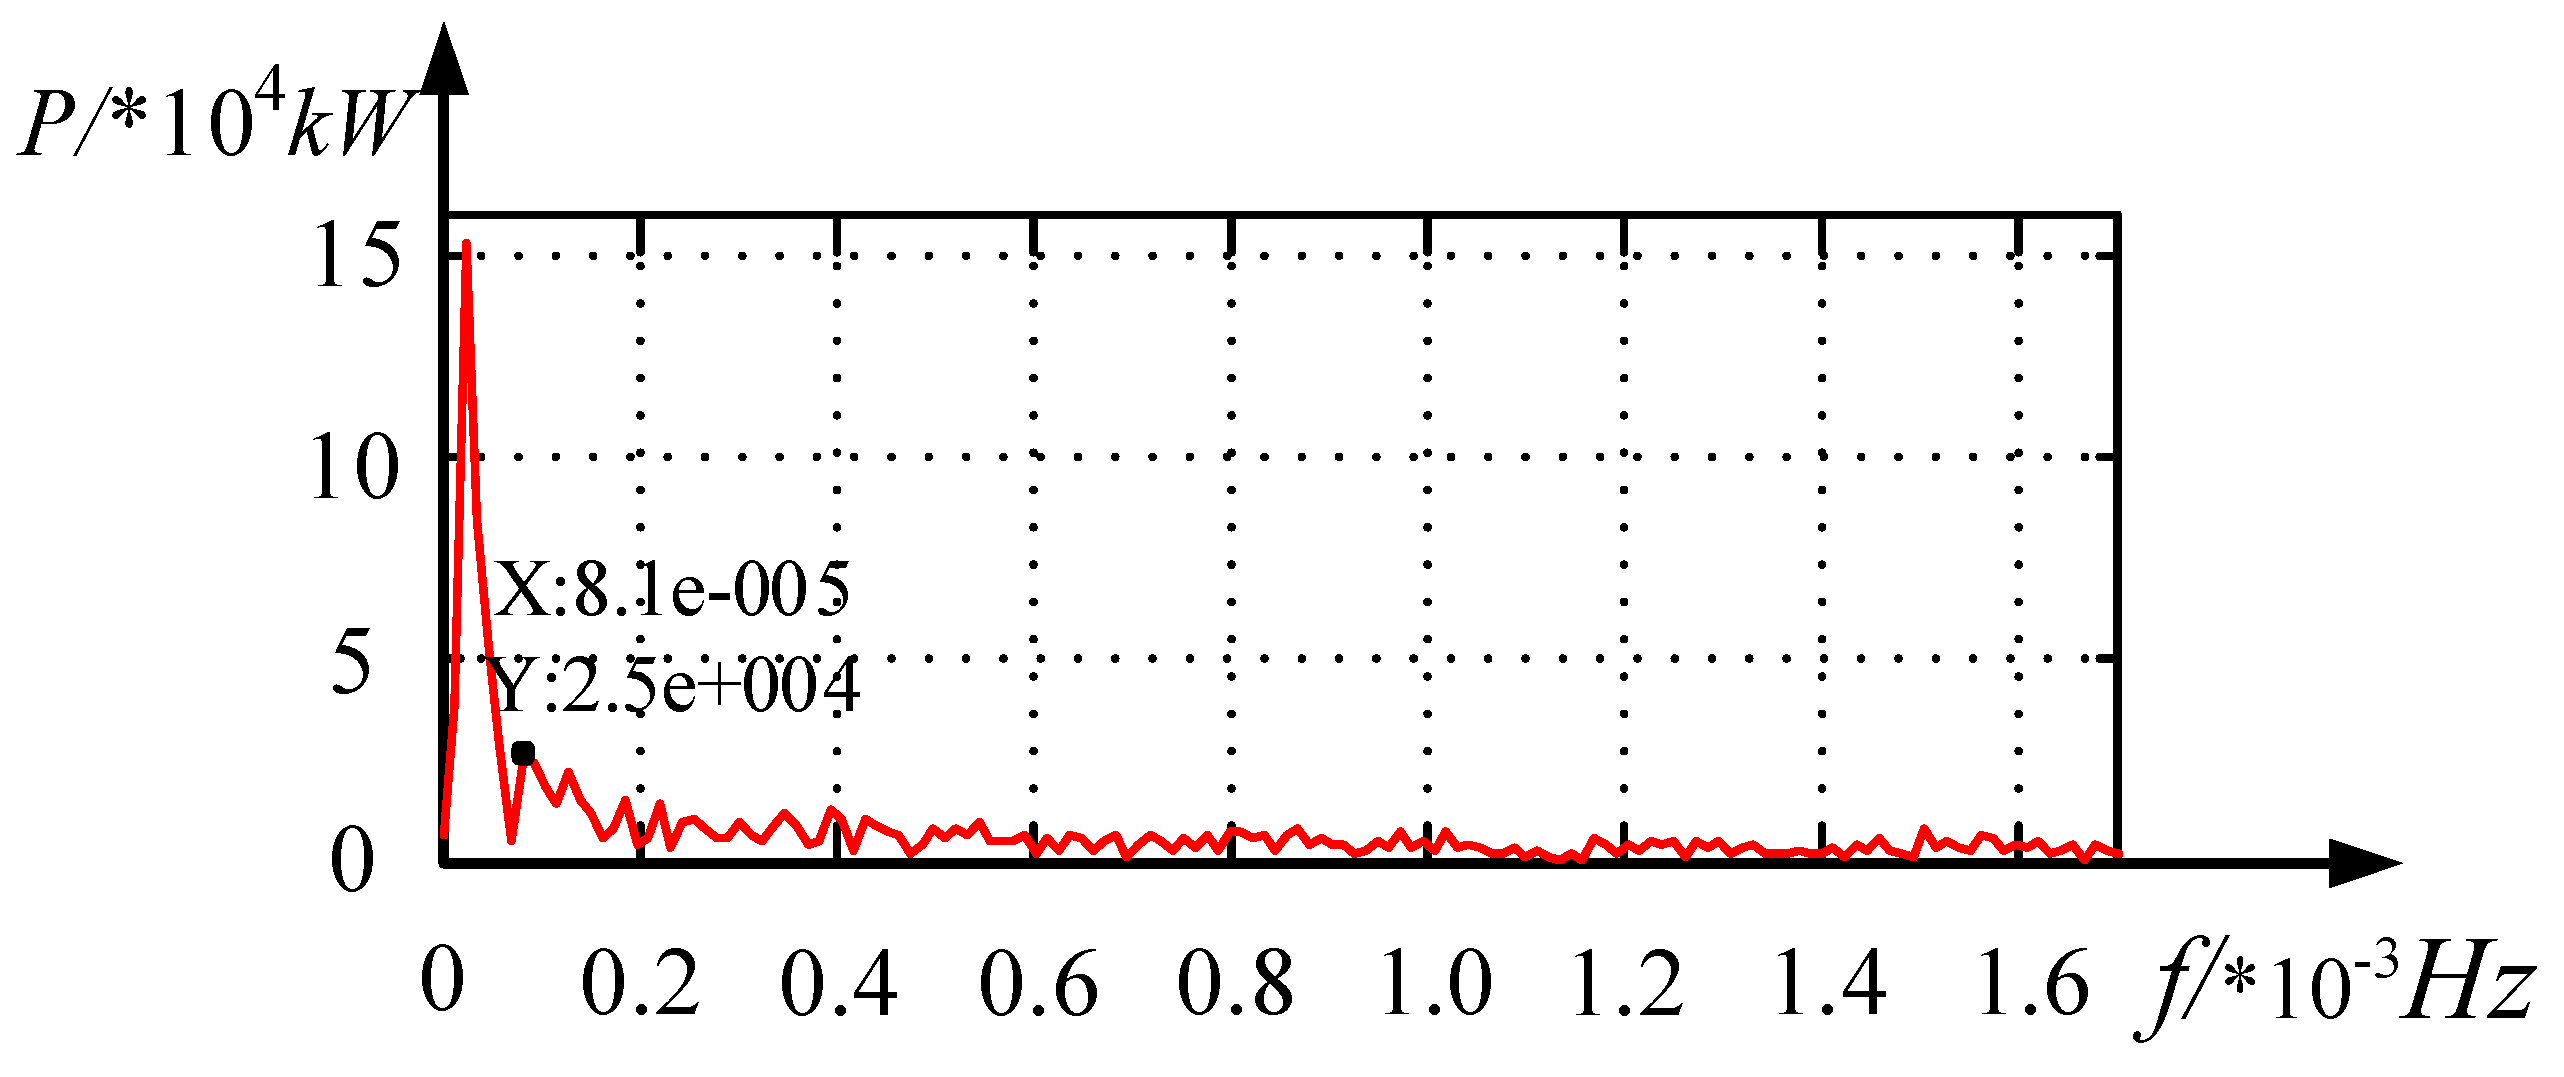
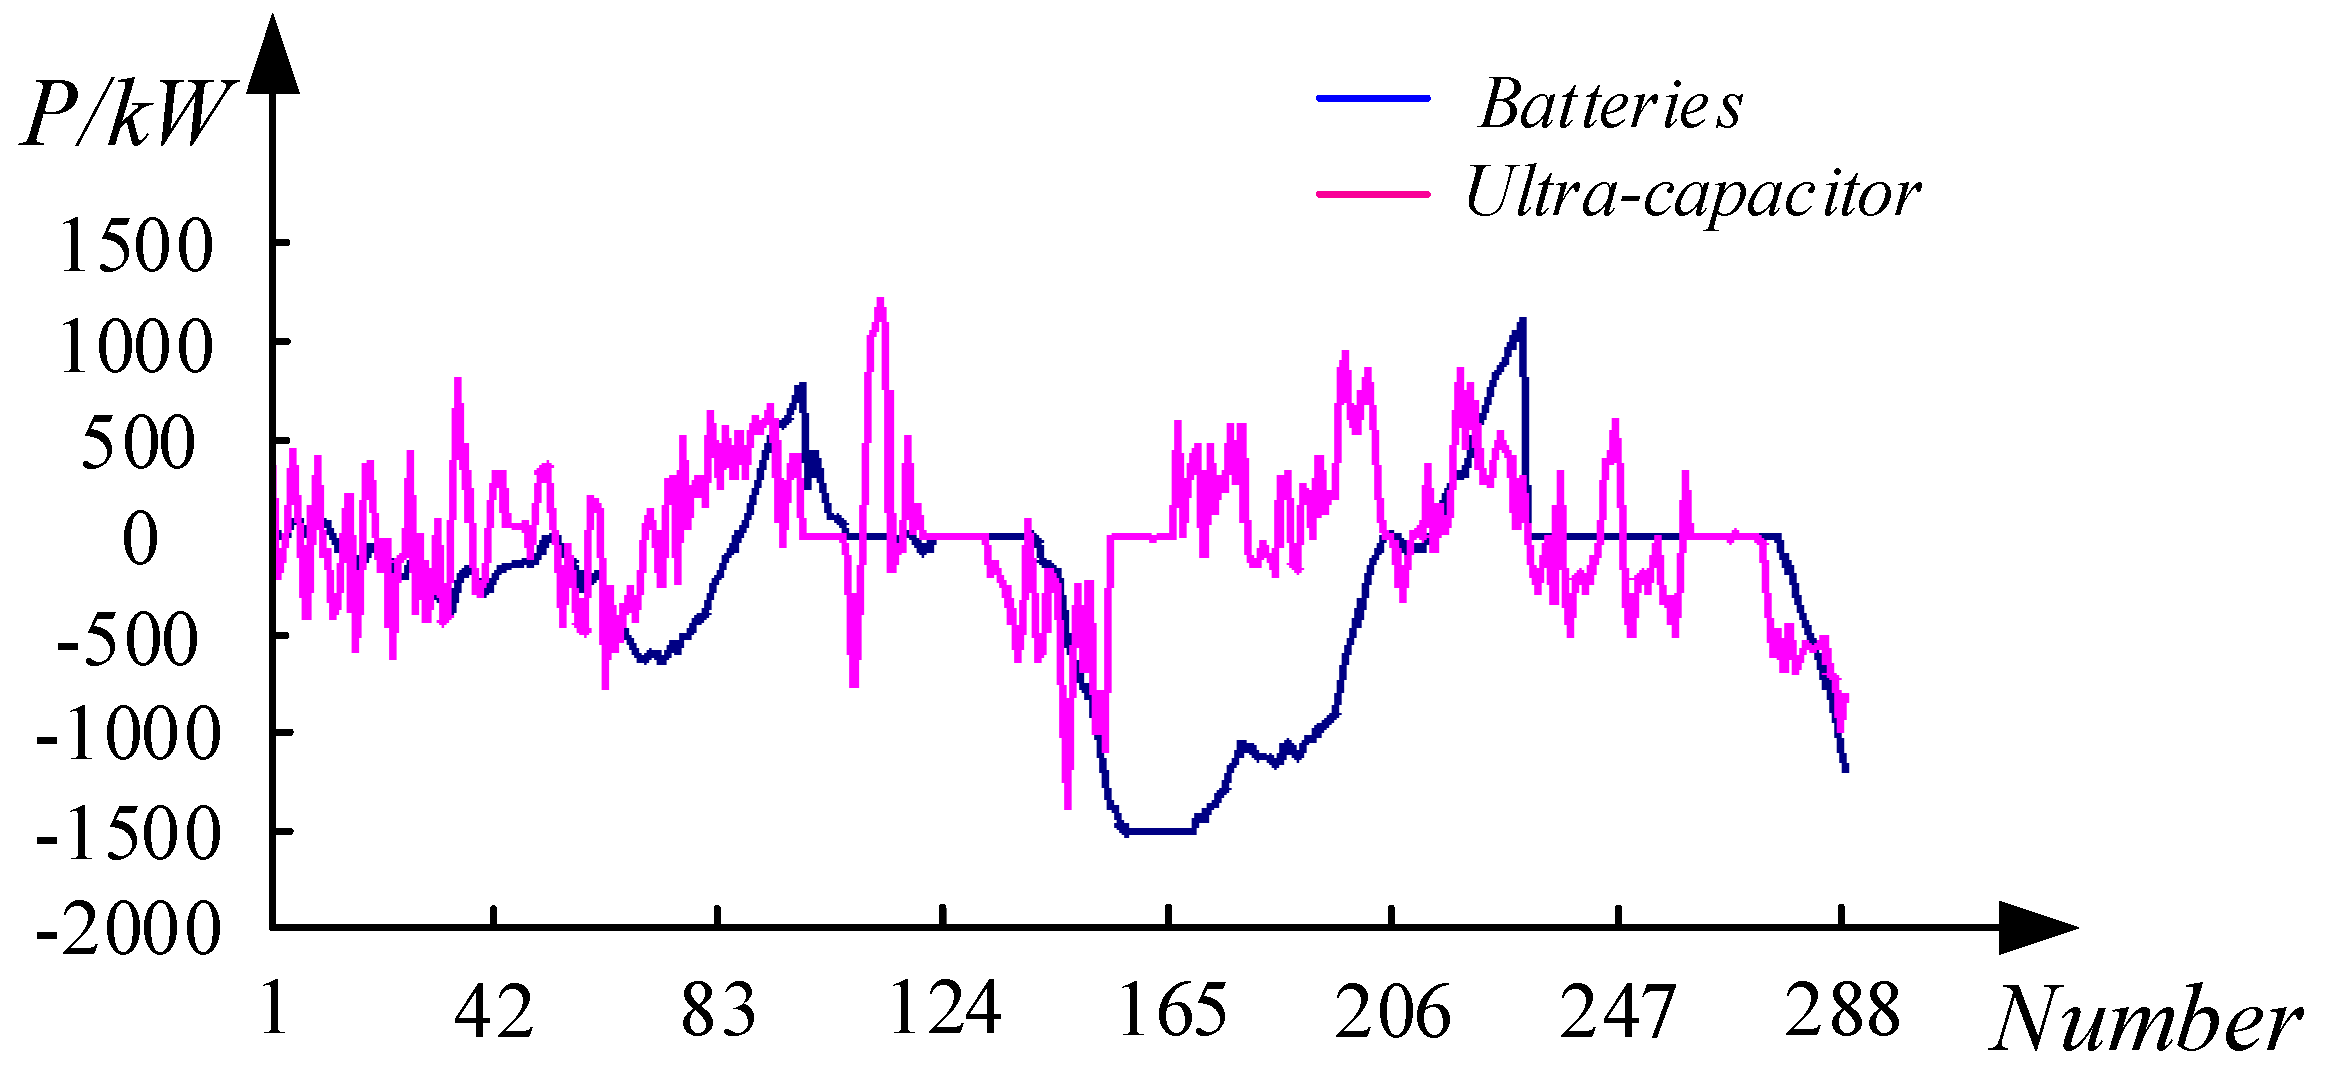
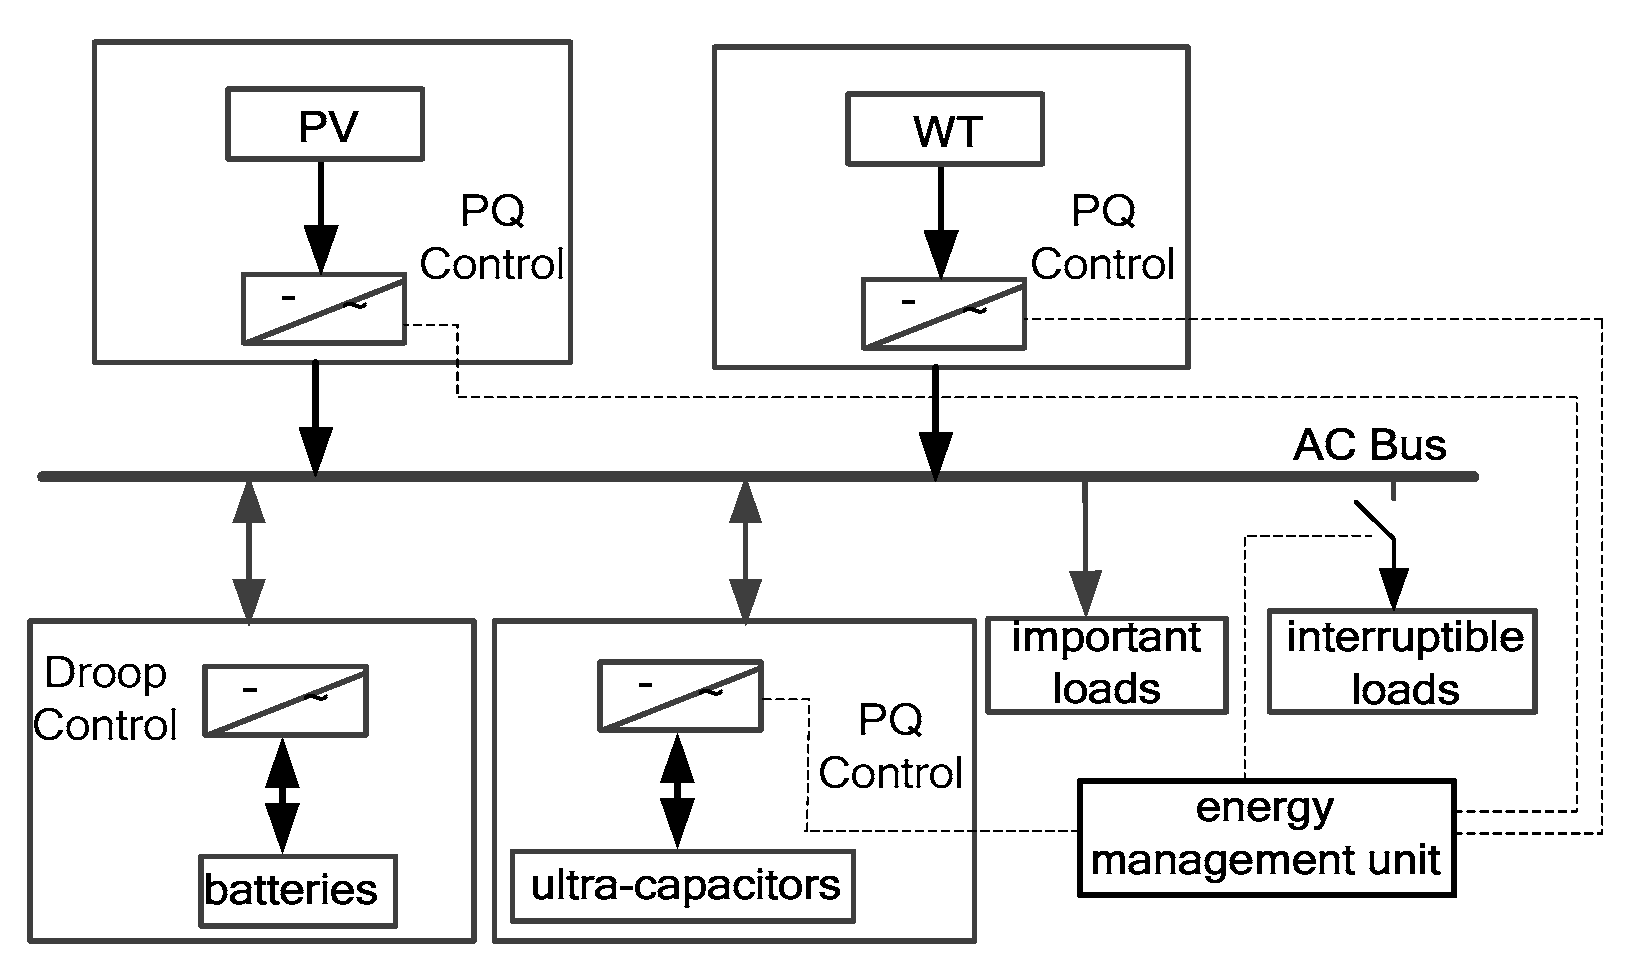
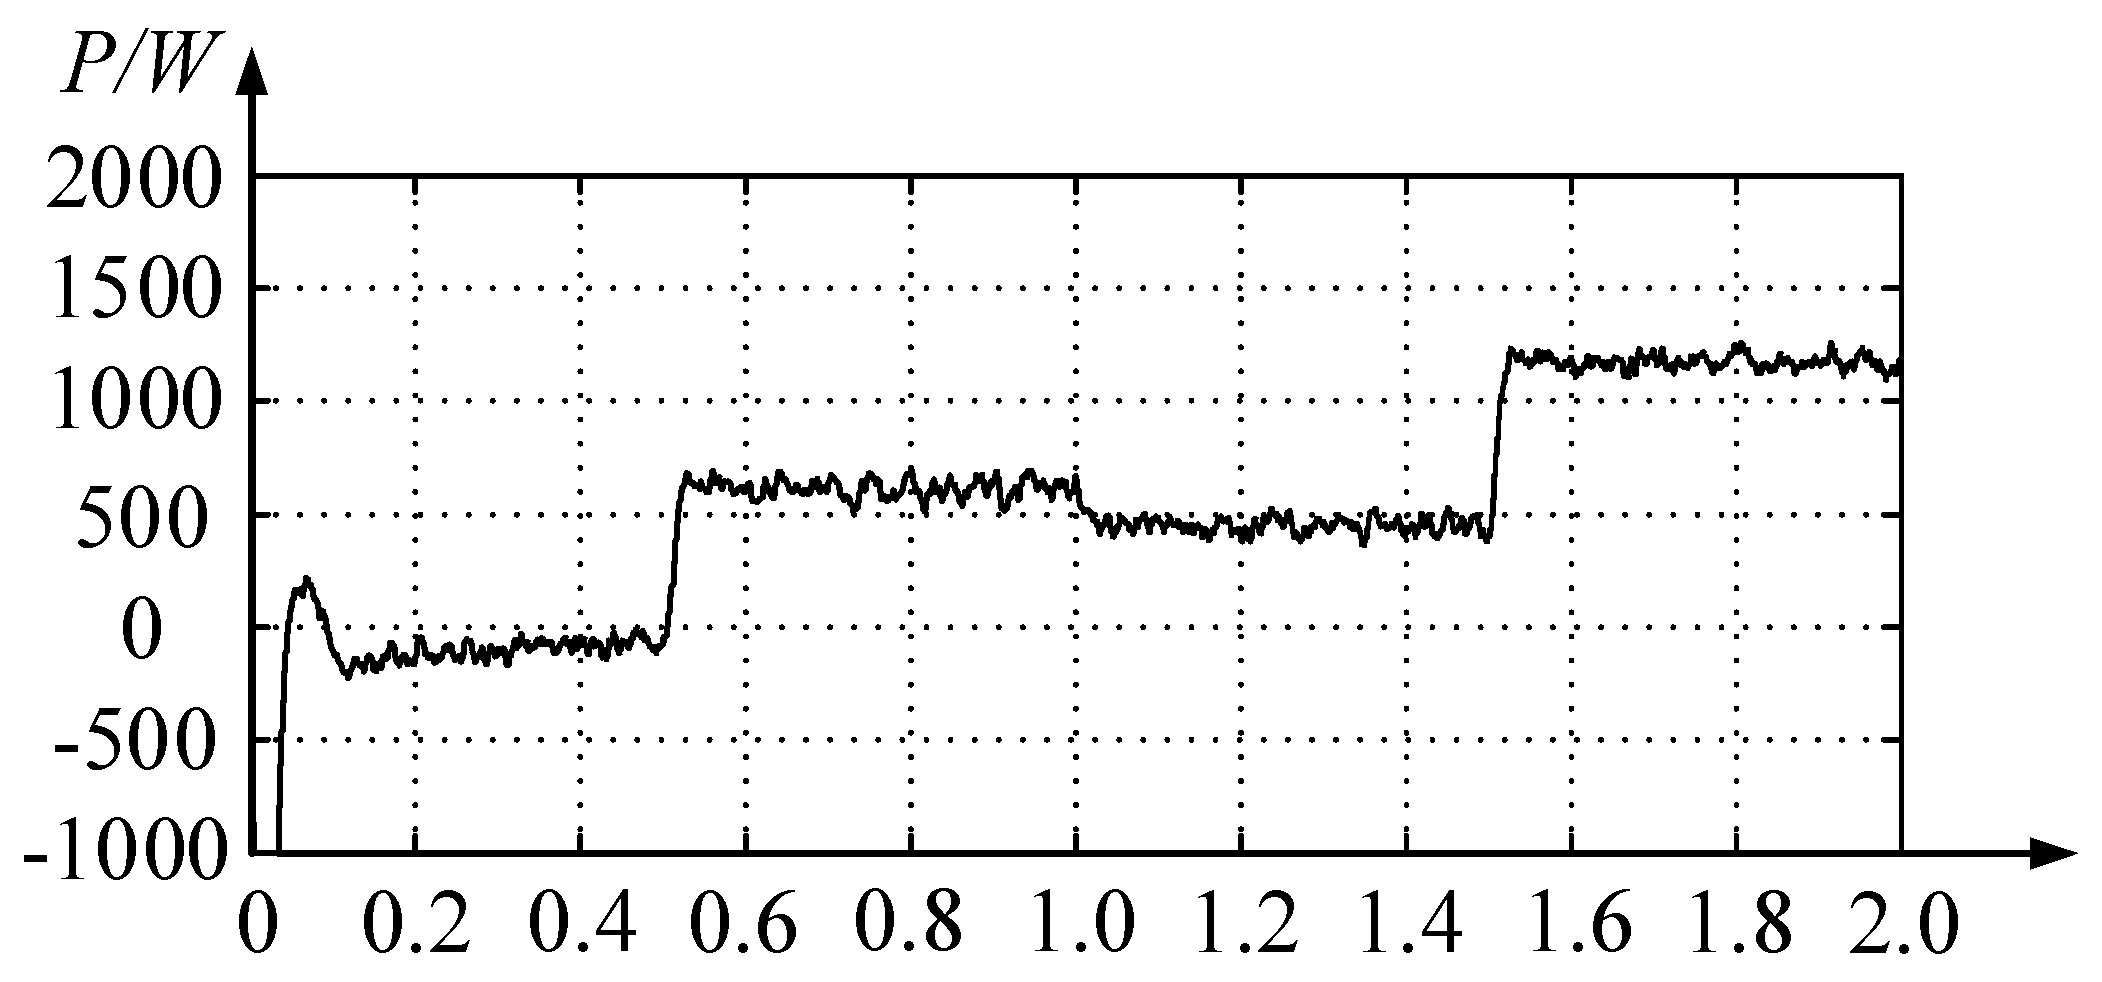
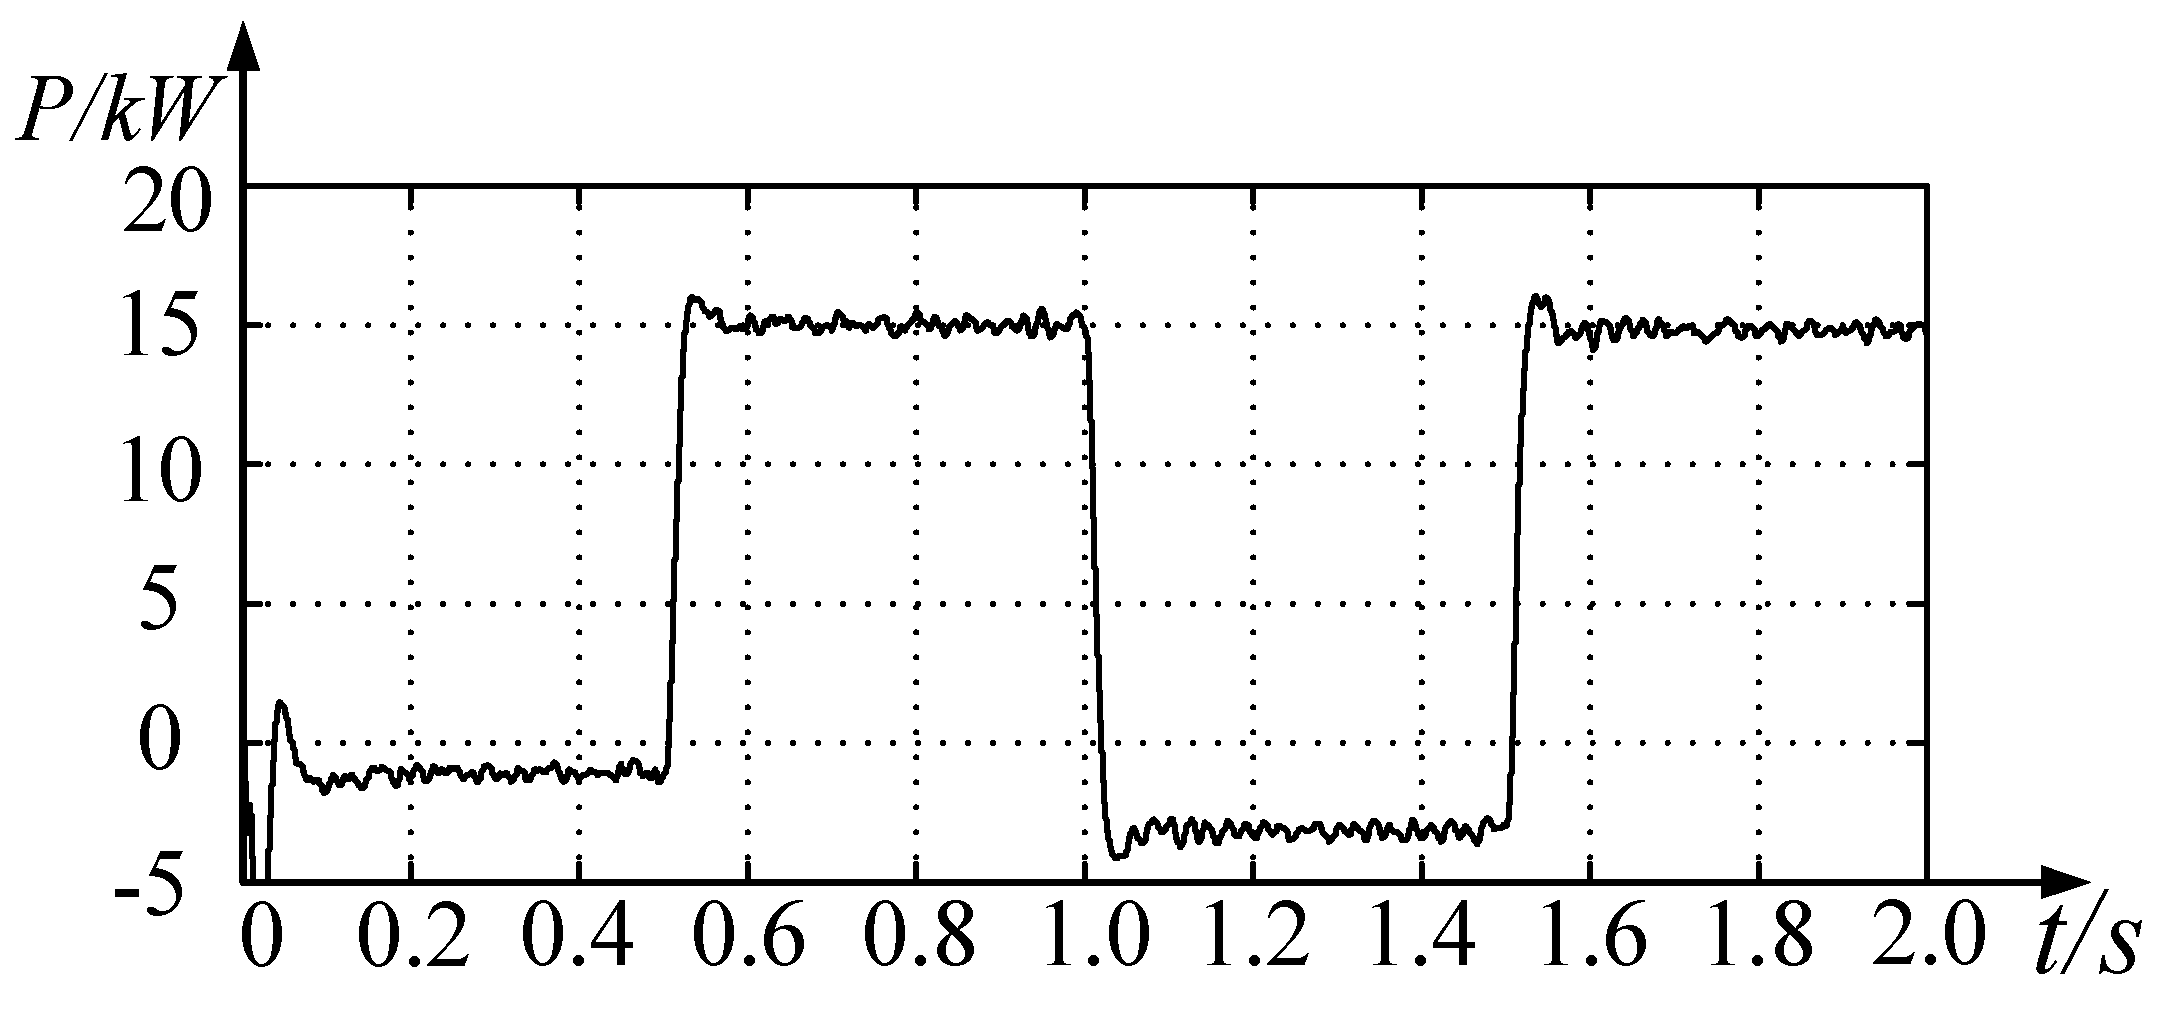
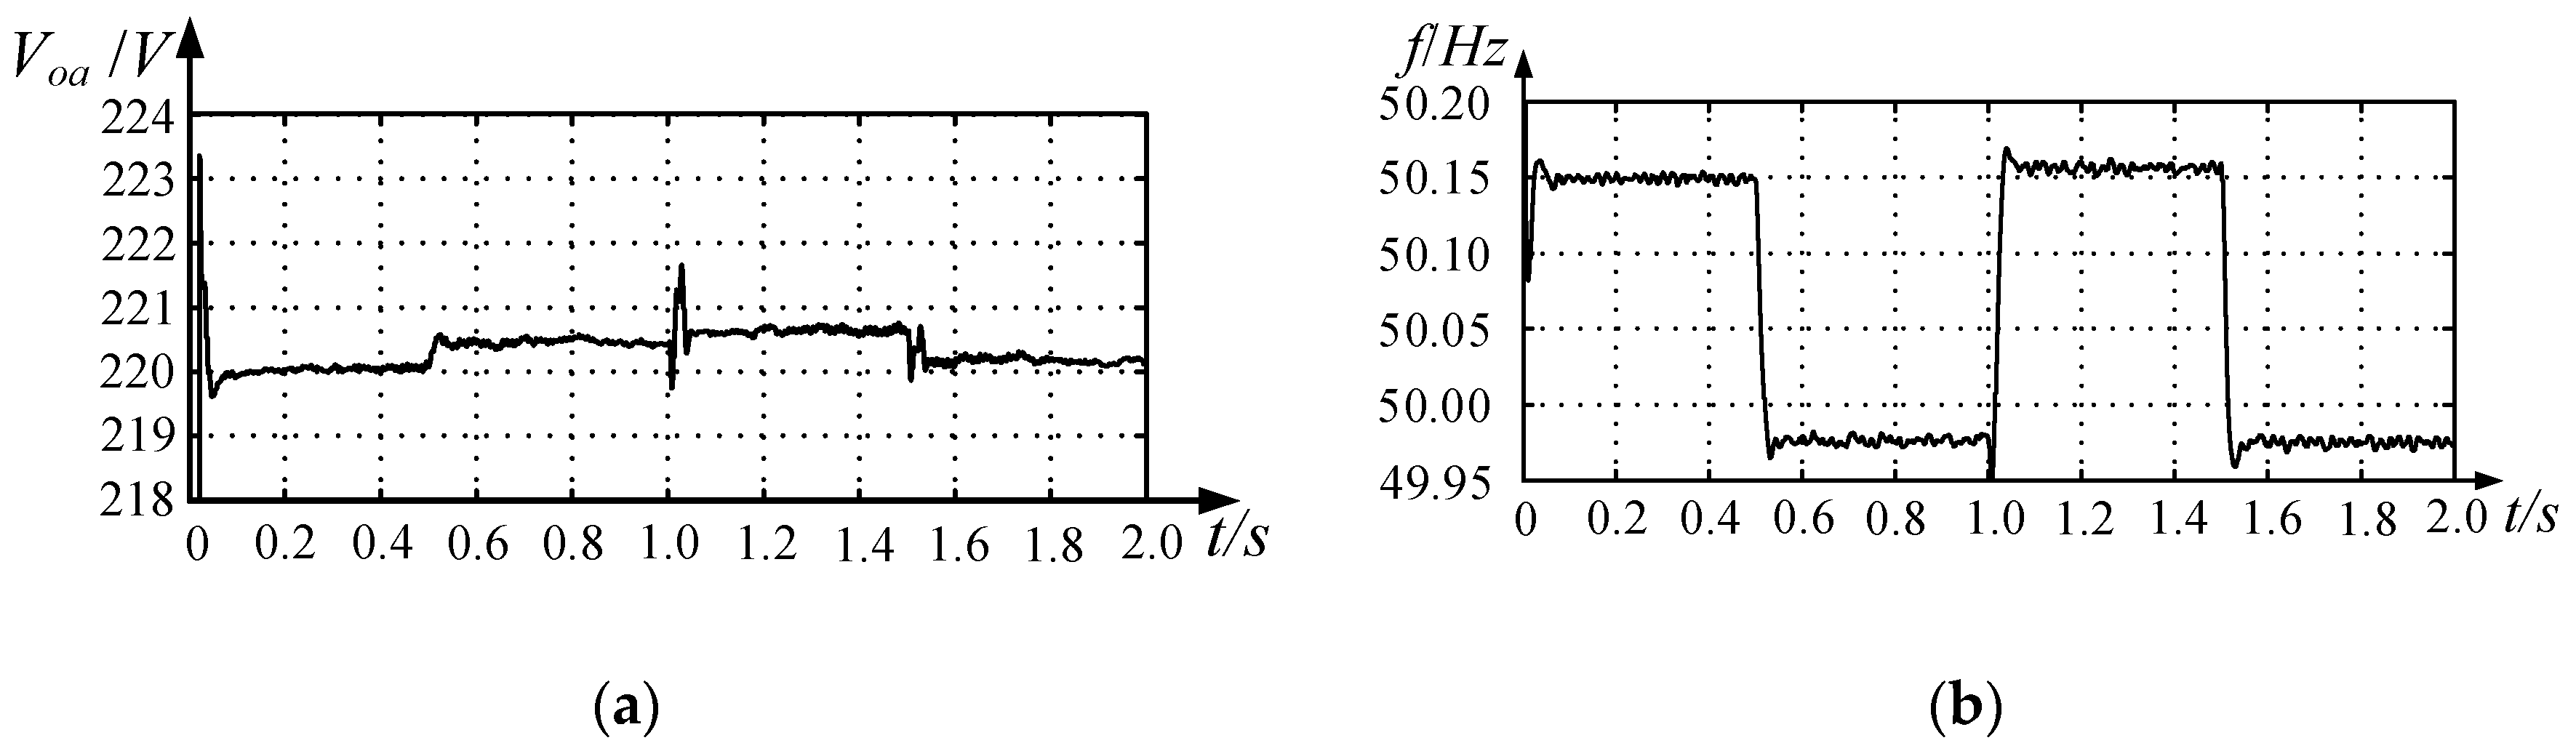
6. Simulation of a Microgrid

To verify the effectiveness of the HESS optimal capacity configuration method from the perspective of control, the simulation model has been built in MATLAB/Simulink shown in Figure 10.
The simulation parameters are shown in Table 3. The valid value of rated voltage of the AC bus was 220 V, and the rated frequency was 50 Hz.
The time constant of the low-pass filter was TL = 10 s. The battery output power is shown in Figure 11, and the ultracapacitor output power is shown in Figure 12.
Comparing Figure 11 and Figure 12, the batteries and ultracapacitors were charged from 0 s to 0.5 s because the outputs of the renewable energy resources were higher than the load. From 0.5 s to 2 s, the batteries were discharged and the ultracapacitors went through three stages (discharge, charge, discharge). Although the HESS was charged from 1 s to 1.5 s, the batteries discharged because of the existence of the ultracapacitor. The system bus RMS voltage and frequency are shown in Figure 13.
Figure 13 shows that although the microsources and load changed during the simulation, the system bus RMS voltage remained at 220 V, and the frequency was between 49.95 and 50.2 Hz. During 0–0.5 s and 1–1.5 s, the load demand was less than the outputs of the microsources, the HESS charged, and the system frequency increased. During 0.5–1s and 1.5–2s, the load demand was higher than the output, the HESS discharged, and the system frequency was slightly less than the rated frequency of 50 Hz.
Therefore, when there are large power imbalances, the ultracapacitors optimize the battery charging and discharging processes. The HESS can also better maintain the system voltages and frequencies, so that they are near the rated values and have smaller fluctuations.

7. Conclusions

This paper provides a QPSO method for determining the optimal configuration of the HESS for an isolated microgrid. Based on the different characteristics of ultracapacitors and batteries, an energy scheduling strategy is proposed which use low-pass filter for capacitance distribution. Configuration results for an example in north China demonstrated the following:
(1)
An energy scheduling strategy can make full use of the characteristics of the fast response speeds and high power densities of ultracapacitors. Frequent charging and discharging of batteries is avoided. A reasonable cooperation strategy between batteries and ultracapacitors is achieved.
(2)
QPSO has the advantages of good global convergence and fast convergence rate compared with traditional PSO. QPSO found the optimal solution using less iterations and reduced the daily cost of the HESS. The capacity configuration results obtained by PSO were larger than the results obtained by QPSO.
(3)
The simulation results indicate that the HESS keeps the microgrid system stable when there are large power imbalances. This verifies the effectiveness of the proposed HESS optimal capacity configuration method.
This paper considers the capacity of the energy storage system. The fault diagnosis and predictive control can also be added. However, the battery’s online detection technology is very mature now. For example, the method of detecting the internal resistance of a battery can monitored online. For an ultracapacitor, with the increase of using time, the change of temperature and aging, an ultracapacitor’s occurrence of fault can be divided into the following three categories: (1) loss of capacitance (more than 20%); (2) effect of over pressure; and (3) the open circuit failure [19]. The use of ultracapacitors can be determined by detecting the changes in current and voltage in the charging and discharging process. In future work, system optimization and fault diagnosis can be combined to make the system more efficient and stable.

Acknowledgments

This research was supported by the National Science Foundation of China [grant number 51577109].

Author Contributions

Hui Wang proposed the idea, designed the method; Tengxin Wang wrote the paper; Xiaohan Xie and Zhixiang Ling performed the simulation and verified validity of the method.

Conflicts of Interest

The authors declare no conflict of interest.

References

  1. Kwhannet, U.; Sinsuphun, N.; Leeton, U.; Kulworawanichpong, T. Optimal allocation of energy storage in micro-grid system. In Proceedings of the 2010 International Conference on Power System Technology, Hangzhou, China, 24–28 October 2010; pp. 1–6. [Google Scholar]
  2. Lee, H.S.; Shin, B.Y.; Han, S.C.; Jung, S.Y. Compensation for the power fluctuation of the large scale wind farm using hybrid energy storage applications. IEEE Trans. Appl. Supercond. 2012, 22, 5701904. [Google Scholar]
  3. WEE, K.W.; Choi, S.S.; Vilathgamuwa, D.M. Design of a least-cost battery-super capacitor energy storage system for realizing dispatchable wind power. IEEE Trans. Sustain. Energy 2013, 4, 786–796. [Google Scholar] [CrossRef]
  4. Turton, H.; Moura, F. Vehicle-to-grid systems for sustainable development: An integrated energy analysis. Technol. Forecast. Soc. Chang. 2008, 75, 1091–1108. [Google Scholar] [CrossRef]
  5. Dougal, R.A.; Liu, S.Y.; White, R.E. Power and life extension of battery-ultracapacitor hybrids. IEEE Trans. Compon. Packag. Technol. 2002, 25, 120–131. [Google Scholar] [CrossRef]
  6. Deng, J.X.; Shi, J.; Liu, Y.; Tang, Y.J. Application of a hybrid energy storage system in the fast charging station of electric vehicles. IET Gener. Transm. Distrib. 2016, 10, 1092–1097. [Google Scholar] [CrossRef]
  7. Ma, T.; Lashway, C.R.; Song, Y.; Mohammed, O. Optimal renewable energy for future hybrid power system. In Proceedings of the 2014 17th International Conference on Electrical Machines and Systems (ICEMS), Hangzhou, China, 22–25 October 2014; pp. 2827–2832. [Google Scholar]
  8. Nian, Y.; Liu, S.; Wu, D.; Liu, J. A method for optimal sizing of stand-alone hybrid PV/Wind/Battery system. In Proceedings of the 2nd IET Renewable Power Generation Conference, Beijing, China, 9–11 September 2013; pp. 1–4. [Google Scholar]
  9. Zhou, T.P.; Sun, W. Optimization of battery-Supercapacitor hybrid energy storage station in wind/Solar generation system. IEEE Trans. Sustain. Energy 2014, 5, 408–415. [Google Scholar] [CrossRef]
  10. Tan, X.G.; Wang, H.; Zhang, L.; Zou, L. Multi-objective optimization of hybrid energy storage and assessment indices in microgrid. Autom. Electr. Power Syst. 2014, 38, 7–14. [Google Scholar]
  11. Cao, C.D.; Chang, X.R. Application of improved quantum particle swarm optimization in power Network planning. In Proceedings of the 2011 International Conference on Mechatronic Science, Electric Engineering and Computer (MEC), Jilin, China, 19–22 August 2011; pp. 2073–2077. [Google Scholar]
  12. Sun, J.; Fang, W.; Xu, W.B. A quantum-behaved particle swarm optimization with diversity-guided mutation for the design of two-dimension IIR digital filters. IEEE Trans. Circuits Syst. II-Express Briefs 2010, 57, 141–145. [Google Scholar] [CrossRef]
  13. Koutroulis, E.; Kolokotsa, D.; Potirakis, A. Methodology for optimal sizing of stand-alone photo-voltaic/wind generator systems using genetic algorithms. Sol. Energy 2006, 80, 1072–1088. [Google Scholar] [CrossRef]
  14. Ding, M.; Wang, B.; Zhao, B.; Chen, Z.N. Configuration Optimization of Capacity of Standalone PV-Wind-Diesel-Battery Hybrid Microgrid. Power Syst. Technol. 2013, 37, 575–581. [Google Scholar]
  15. Xie, X.; Wang, H.; Tian, S.; Liu, Y. Optimal capacity configuration of hybrid energy storage for an isolated microgrid based on QPSO algorithm. In Proceedings of the 2015 5th International Conference on Electric Utility Deregulation and Restructuring and Power Technologies (DRPT), Changsha, China, 26–29 November 2015. [Google Scholar]
  16. Sun, J.; Feng, B.; Xu, W.B. Particle Swarm Optimization with particles having quantum behavior. In Proceedings of the 2004 Congress on Evolutionary Computation Conference, Portland, OR, USA, 19–23 June 2004; pp. 325–331. [Google Scholar]
  17. Li, N.; Gao, F.; Hao, T.; Ma, Z.; Zhang, C. SOH Balancing Control Method for MMC Battery Energy Storage System. IEEE Trans. Ind. Electron. 2017. [Google Scholar] [CrossRef]
  18. Liu, K.; Zhu, C.; Lu, R.; Chan, C.C. Improved Study of Temperature Dependence. Equivalent Circuit Model for Supercapacitors. IEEE Trans. Plasma Sci. 2013, 41, 1267–1271. [Google Scholar]
  19. Bharath, K.V.S.; Pandey, K. Fuzzy-Based Multi-Objective Optimization for Subjection and Diagnosis of Hybrid Energy Storage System of an Electric Vehicle. In Proceedings of the International Conference on Intelligent Communication, Control and Devices, Singapore, 18 September 2016; pp. 299–307. [Google Scholar]
Figure 1. Schematic diagram of an isolated microgrid.
Energies 11 00454 g001
Figure 2. Power revision processes for batteries and ultracapacitors.
Energies 11 00454 g002
Figure 3. Wind, photovoltaicunit (PV) output and load curve for an isolated microgrid.
Energies 11 00454 g003
Figure 4. Ideal power value of the hybrid energy storage systems (HESS), P H E S S * .
Energies 11 00454 g004
Figure 5. Spectral analysis of P H E S S * .
Energies 11 00454 g005
Figure 6. Charging and discharging power of the HESS.
Energies 11 00454 g006
Figure 7. P H E S S * and actual HESS power for sample points 1–48.
Energies 11 00454 g007
Figure 8. Actual HESS power and P H E S S * for sample points 150–180.
Energies 11 00454 g008
Figure 9. Comparison of optimization using two methods.
Energies 11 00454 g009
Figure 10. Simulation model of microgrid.
Energies 11 00454 g010
Figure 11. Battery output power.
Energies 11 00454 g011
Figure 12. Ultracapacitor output power.
Energies 11 00454 g012
Figure 13. System voltage and frequency: (a) system voltage; (b) system frequency.
Energies 11 00454 g013
Table 1. Parameters of the battery and ultracapacitor.
ParametersBatteryUltracapacitor
Rated power/kW15002000
SoCmax0.800.95
SoCmin0.200.05
Charging efficiency/%7098
Discharging efficiency/%8098
Depreciation rate/%6.708.00
Operation coefficient0.100.01
Maintenance coefficient0.020
Price/$/kWh6704000
Table 2. Comparison of optimal configuration results using quantum-behaved particle swarm optimization (QPSO) and traditional particle swarm optimization (PSO).
AlgorithmBatteries/kWhUltracapacitors/kWhFitness (Daily Cost)/$Iterations
Traditional PSO9084.262196.526708.8373
QPSO7807.841985.165902.3647
Table 3. Simulation conditions.
TimeWT
Power (P/kW)
PV
Power(P/kW)
PV
Power (P/kW)
0–0.5 s9.62.410.5
0.5–1 s21.13.740.2
1–1.5 s23.56.727.3
1.5–2 s12.24.132.1

