Article

A Comprehensive Energy Analysis and Related Carbon Footprint of Dairy Farms, Part 1: Direct Energy Requirements

Department of Agricultural Science, University of Sassari, Viale Italia 39, 07100 Sassari, Italy
*
Author to whom correspondence should be addressed.
Energies 2018, 11(2), 451; https://doi.org/10.3390/en11020451
Submission received: 22 December 2017 / Revised: 8 February 2018 / Accepted: 13 February 2018 / Published: 20 February 2018

Abstract

:
Dairy cattle farms are continuously developing more intensive systems of management which require higher utilization of durable and not-durable inputs. These inputs are responsible of significant direct and indirect fossil energy requirements which are related to remarkable emissions of CO2. This study aims to analyze direct energy requirements and the related carbon footprint of a large population of conventional dairy farms located in the south of Italy. A detailed survey of electricity, diesel and Liquefied Petroleum Gas (LPG) consumptions has been carried out among on-farm activities. The results of the analyses showed an annual average fuel consumption of 40 kg per tonne of milk, while electricity accounted for 73 kWh per tonne of milk produced. Expressing the direct energy inputs as primary energy, diesel fuel results the main resource used in on-farm activities, accounting for 72% of the total fossil primary energy requirement, while electricity represents only 27%. Moreover, larger farms were able to use more efficiently the direct energy inputs and reduce the related emissions of carbon dioxide per unit of milk produced, since the milk yield increases with the herd size. The global average farm emissions of carbon dioxide equivalent, due to all direct energy usages, accounted for 156 kg CO2-eq per tonne of Fat and Protein Corrected Milk (FPCM), while farms that raise more than 200 heads emitted 36% less than the average value. In this two-part series, the total energy demand (Part 1 + Part 2) per farm is mainly due to agricultural inputs and fuel consumption, which have the largest quota of the annual requirements for each milk yield class. These results also showed that large size farms held lower CO2-eq emissions when referred to the mass of milk produced.

1. Introduction

The consumption of fossil fuels has increased since preindustrial revolution and thus the associated emissions of carbon dioxide into the environment due to human activities. Carbon dioxide is classified [1] as a greenhouse gas (GHG) for its effects on climate change, and is the most abundant and most lasting GHG in Earth’s atmosphere. Similarly, intensive livestock production and the entire agricultural sector are responsible for emitting significant quantities of greenhouse gas into the environment. The Food and Agriculture Organization [2] attributed about 18% of global GHG emissions to the livestock sector considering the whole production chain—from land use to feed production. However, latest studies attribute to the livestock production lower quotas from 2–4% [3] to 3–8% [4] of the total GHG emissions in developed countries. The animal production efficiency and the system boundary considered is strictly associated to the environmental load [5]. The impact of GHG emissions from the Italian livestock chain accounts for about 3% of the total national emission, with the northern regions responsible for 65%, central regions for 9% and southern regions for 26%, while 56% of the entire livestock emissions are ascribable to the dairy sector [6].
Specifically, for the dairy sector, the end of the milk quota system in the European Union (EU) will rise the milk production per farm and decrease the price of milk by 22% for EU farms [7,8]. These previsions lead to focus not only on the production cost control but also on the environmental load of dairy farms. The reduction of greenhouse gas emissions from the livestock sector is a critical issue for a more sustainable dairy production. To achieve this aim, farmers, policy makers and consumers need clear information around the energy and environmental influence of the milk products. A scientific literature and databases review of current studies reveal that a large amount of information about dairy farms and GHG emissions have become available in latest years, but these outcomes are largely fragmented [9].
Dairy livestock sector is changing to more energy requiring forms of management which result in higher environmental and economic loads. Intensive mechanization level has decreased the incidence of labor requirement for dairy farms activities and reduced the usage of appliances which require the consumption of fossil fuel. Analyzing the total energy demand in the life cycle of milk, the main contributor to the energy use is milk production which requires almost 40% of whole consumptions [10]. The efficient use of direct energy (diesel or gasoline fuel, electricity and Liquefied Petroleum Gas (LPG)) is one of the solutions to decrease the environmental burden and the associated cost in the milk production sector. Investigation conducted in European dairy farms showed that the direct energy consumption, around 25% of the non-renewable primary energy use, is due to on-farm electricity for milking, milk refrigeration, manure handling, ventilation, and lighting, followed by diesel usage for on-farm activities, at about 15% [10]. Modeling diesel and electricity requirements in dairy farms allowed estimating the associated carbon dioxide emissions and costs of milk production in function of farm characteristics [11,12]. Energy consumptions are strictly associated to the efficiency of the production system considered [13,14,15,16] as well as related to the technological level, type of management and herd dimensions [17,18,19,20,21,22]. Ludington and Johnson (2003) [23], in a study involving 32 US dairy farms, found a consumption of electricity between 800 and 1200 kWh cow−1 per year, while in European farms other studies reported an electricity consumption of 401 kWh lactating cow year−1 in Italy [24], 420 kWh lactating cow year−1 in France [25] and 90 kWh per tonne of milk in Germany [26]. The use of direct energy in the common dairy LCA study is generally expressed as total energy needed for the farm, without a detailed subdivision among different fossil fuel sources and on-farm activities.
The aims of this work focused on the analysis of direct energy uses and the related carbon footprint of a sample of 285 conventional dairy farms located in the southern regions of Italy. The study also analyzed the distribution of energy requirements and the amount of the related CO2 emissions among on-farm activities.

2. Material and Methods

2.1. Data Sources

A Sample of 285 conventional dairy farms members of four dairy plant cooperatives located in southern Italy (Basilicata, Sardegna, Calabria, Sicilia e Puglia) was involved in this study.
To evaluate the inputs–outputs and the potential environmental impacts (carbon footprint) of the milk production system, a partial Life Cycle Assessment methodology was applied [27,28,29,30]. The LCA include four phases: goal and scope definition, inventory analysis (LCI), impact assessment (LCIA) and interpretation of results.

2.2. Goal and Scope Definition

The aims of this study were to assess the direct energy intensity (electricity, diesel and LPG) of milk production at farm level, to estimate the emission of GHG related to the use of fossil fuels and to identify the distribution of energy usages among the different on-farm operations.

2.3. System Boundaries

The next activity carried out was to identify all the energy streams, for each fossil fuel associated to on-farm processes. The system boundary was set at farm level, from cradle to farm gate and included all the equipment and facilities exploited for: cultivation for on-farm feed requirement; manure management; feed preparation and distribution; milk extraction (milk harvesting and refrigeration); and water pumping and irrigation.

2.4. Functional Unit and Allocation

In specialized dairy farms, the main product harvested is milk, which may be stated in various units (mass, volume). In this study, a quality corrected functional unit has been used, which considers the composition of the milk and its mass: 100 and 1000 kg of Fat and Protein Corrected Milk (FPCM), which allow comparing the results of this study with other international findings.
The International Dairy Federation (IDF) 2010 [31] equation was applied to determine the FPCM, which considers the percentage of protein, the percentage of fat content and the yearly milk production (kg):
kg FPCM = Milk kg × ((0.1226 × Fat %) + (0.0776 × Protein %) + 0.2534).
In this study, no allocation between milk and meat production were accounted since the dairy farms were specialized only for milk production, hence meat productions were firmly associated to the sale of culled cows and surplus calves.

2.5. Inventory Analysis (LCI)

A specific inquiry form was developed to record all the energy audit information and the characteristics among the investigated farms. The questionnaires were filled in by a team of qualified technicians through direct measure and manager interviews, and included a comprehensive description of farm characteristics, level of mechanization, on-farm feed production, energy bills and management. Moreover, an inventory of the monthly fuels, LPG and electricity consumptions receipts were recorded.
The inquiry form was divided into nine sections:
  • Section 1—General information includes the global data of the dairy farms such as hectares of cultivated land, herd size, milk quality and quantity, type of herd management, workforce, employees and position (city, province).
  • Section 2—Slurry storage facility is where the type and power of the appliances found in the slurry storage facilities have been considered.
  • Section 3—On-farm feed preparation and distribution considers the whole activities related to feeding operations, together with the power of the equipment used and associated usage times.
  • Section 4—Energy consumptions comprises the energy usages receipt of electricity supply, Liquefied Petroleum Gas (LPG) and fuel.
  • Section 5—Fleet equipment embodies a list of the total machinery (tractors, self-propelled and tools) utilized for on-farm activities.
  • Section 6—Agronomic data considers the data associated to field cultivations as type of crops and the related yields, type of harvesting and cultivated hectares.
  • Section 7—Water usage is related to pumping activities for water supply at farm level and for irrigation purposes. These two activities were retained divided during the final assessments with the final aim to identify the requirements of fossil fuels of each task.
  • Section 8—Milking and milk cooling comprises the overall data associated to the type of milking parlor, power of the appliances, milk tank dimensions, number of milking groups, use of energy saving devices such as Heat Recovering System (HRS), Milk Pre-cooler (MP) and Variable Drive Speed (VDS).
  • Section 9—Field operations considers the power of tractors and the self-propelled machinery, type of activities carried out, operational times and the tools used.

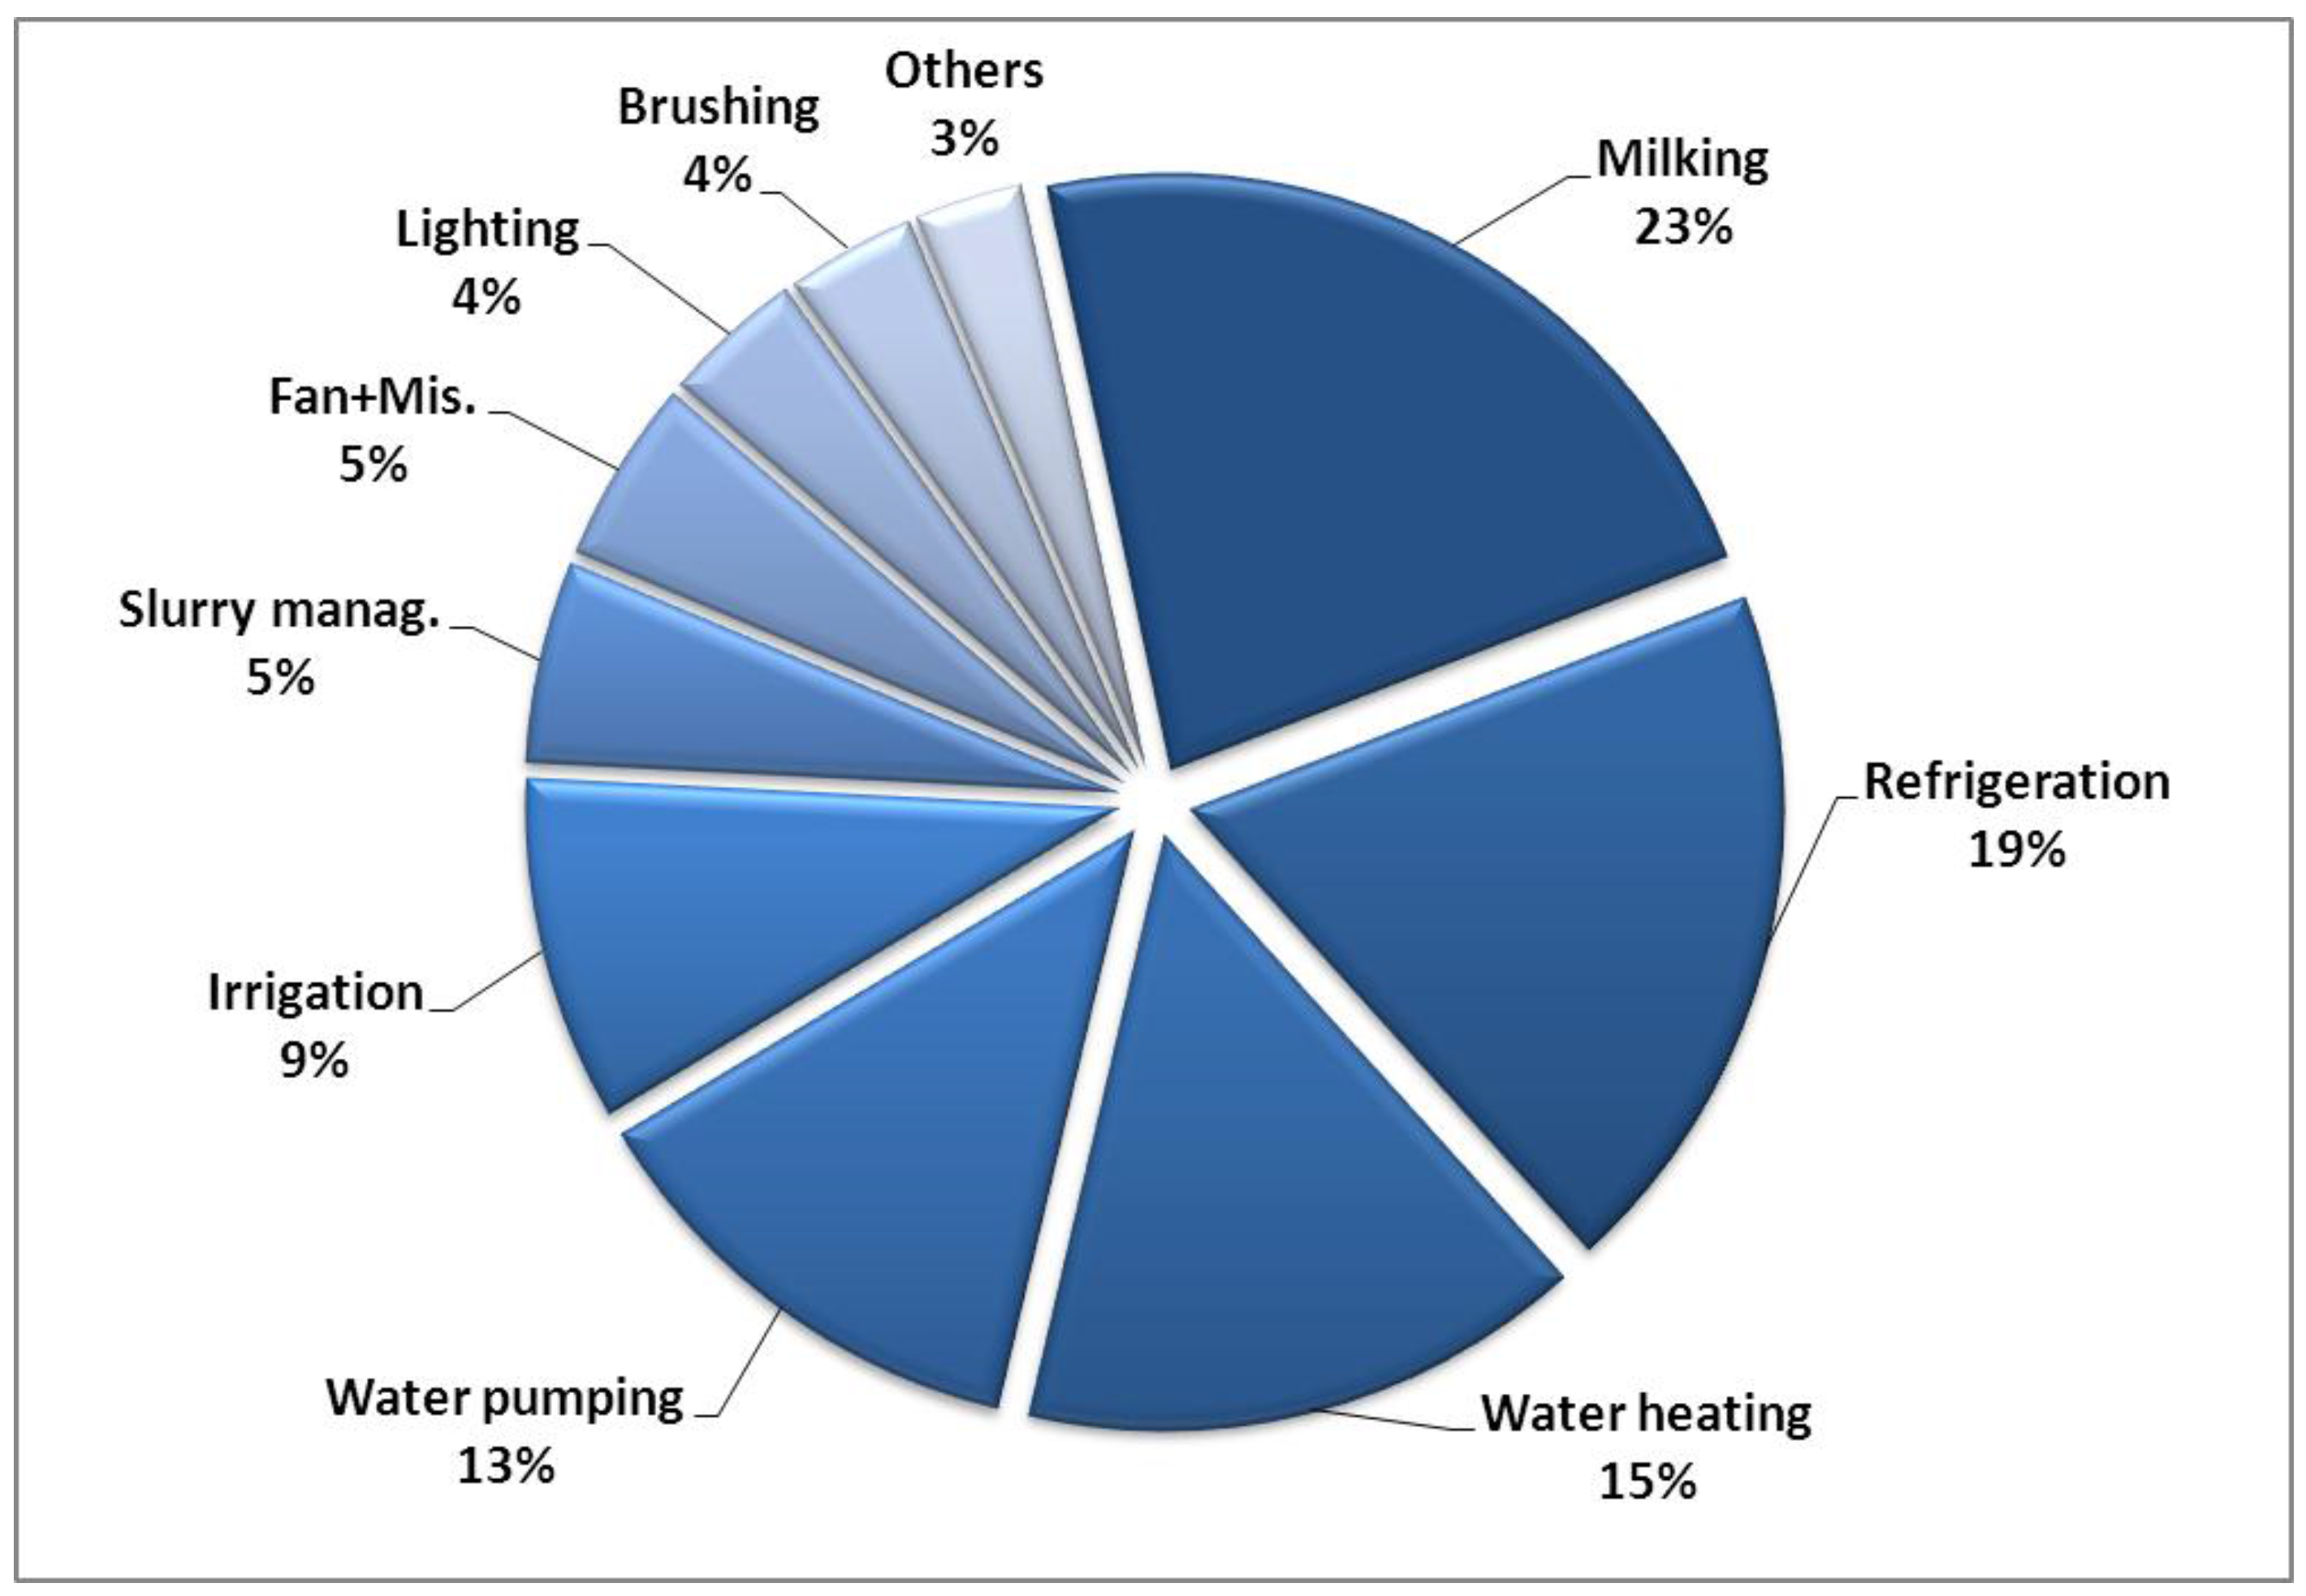
2.6. Electricity Audit
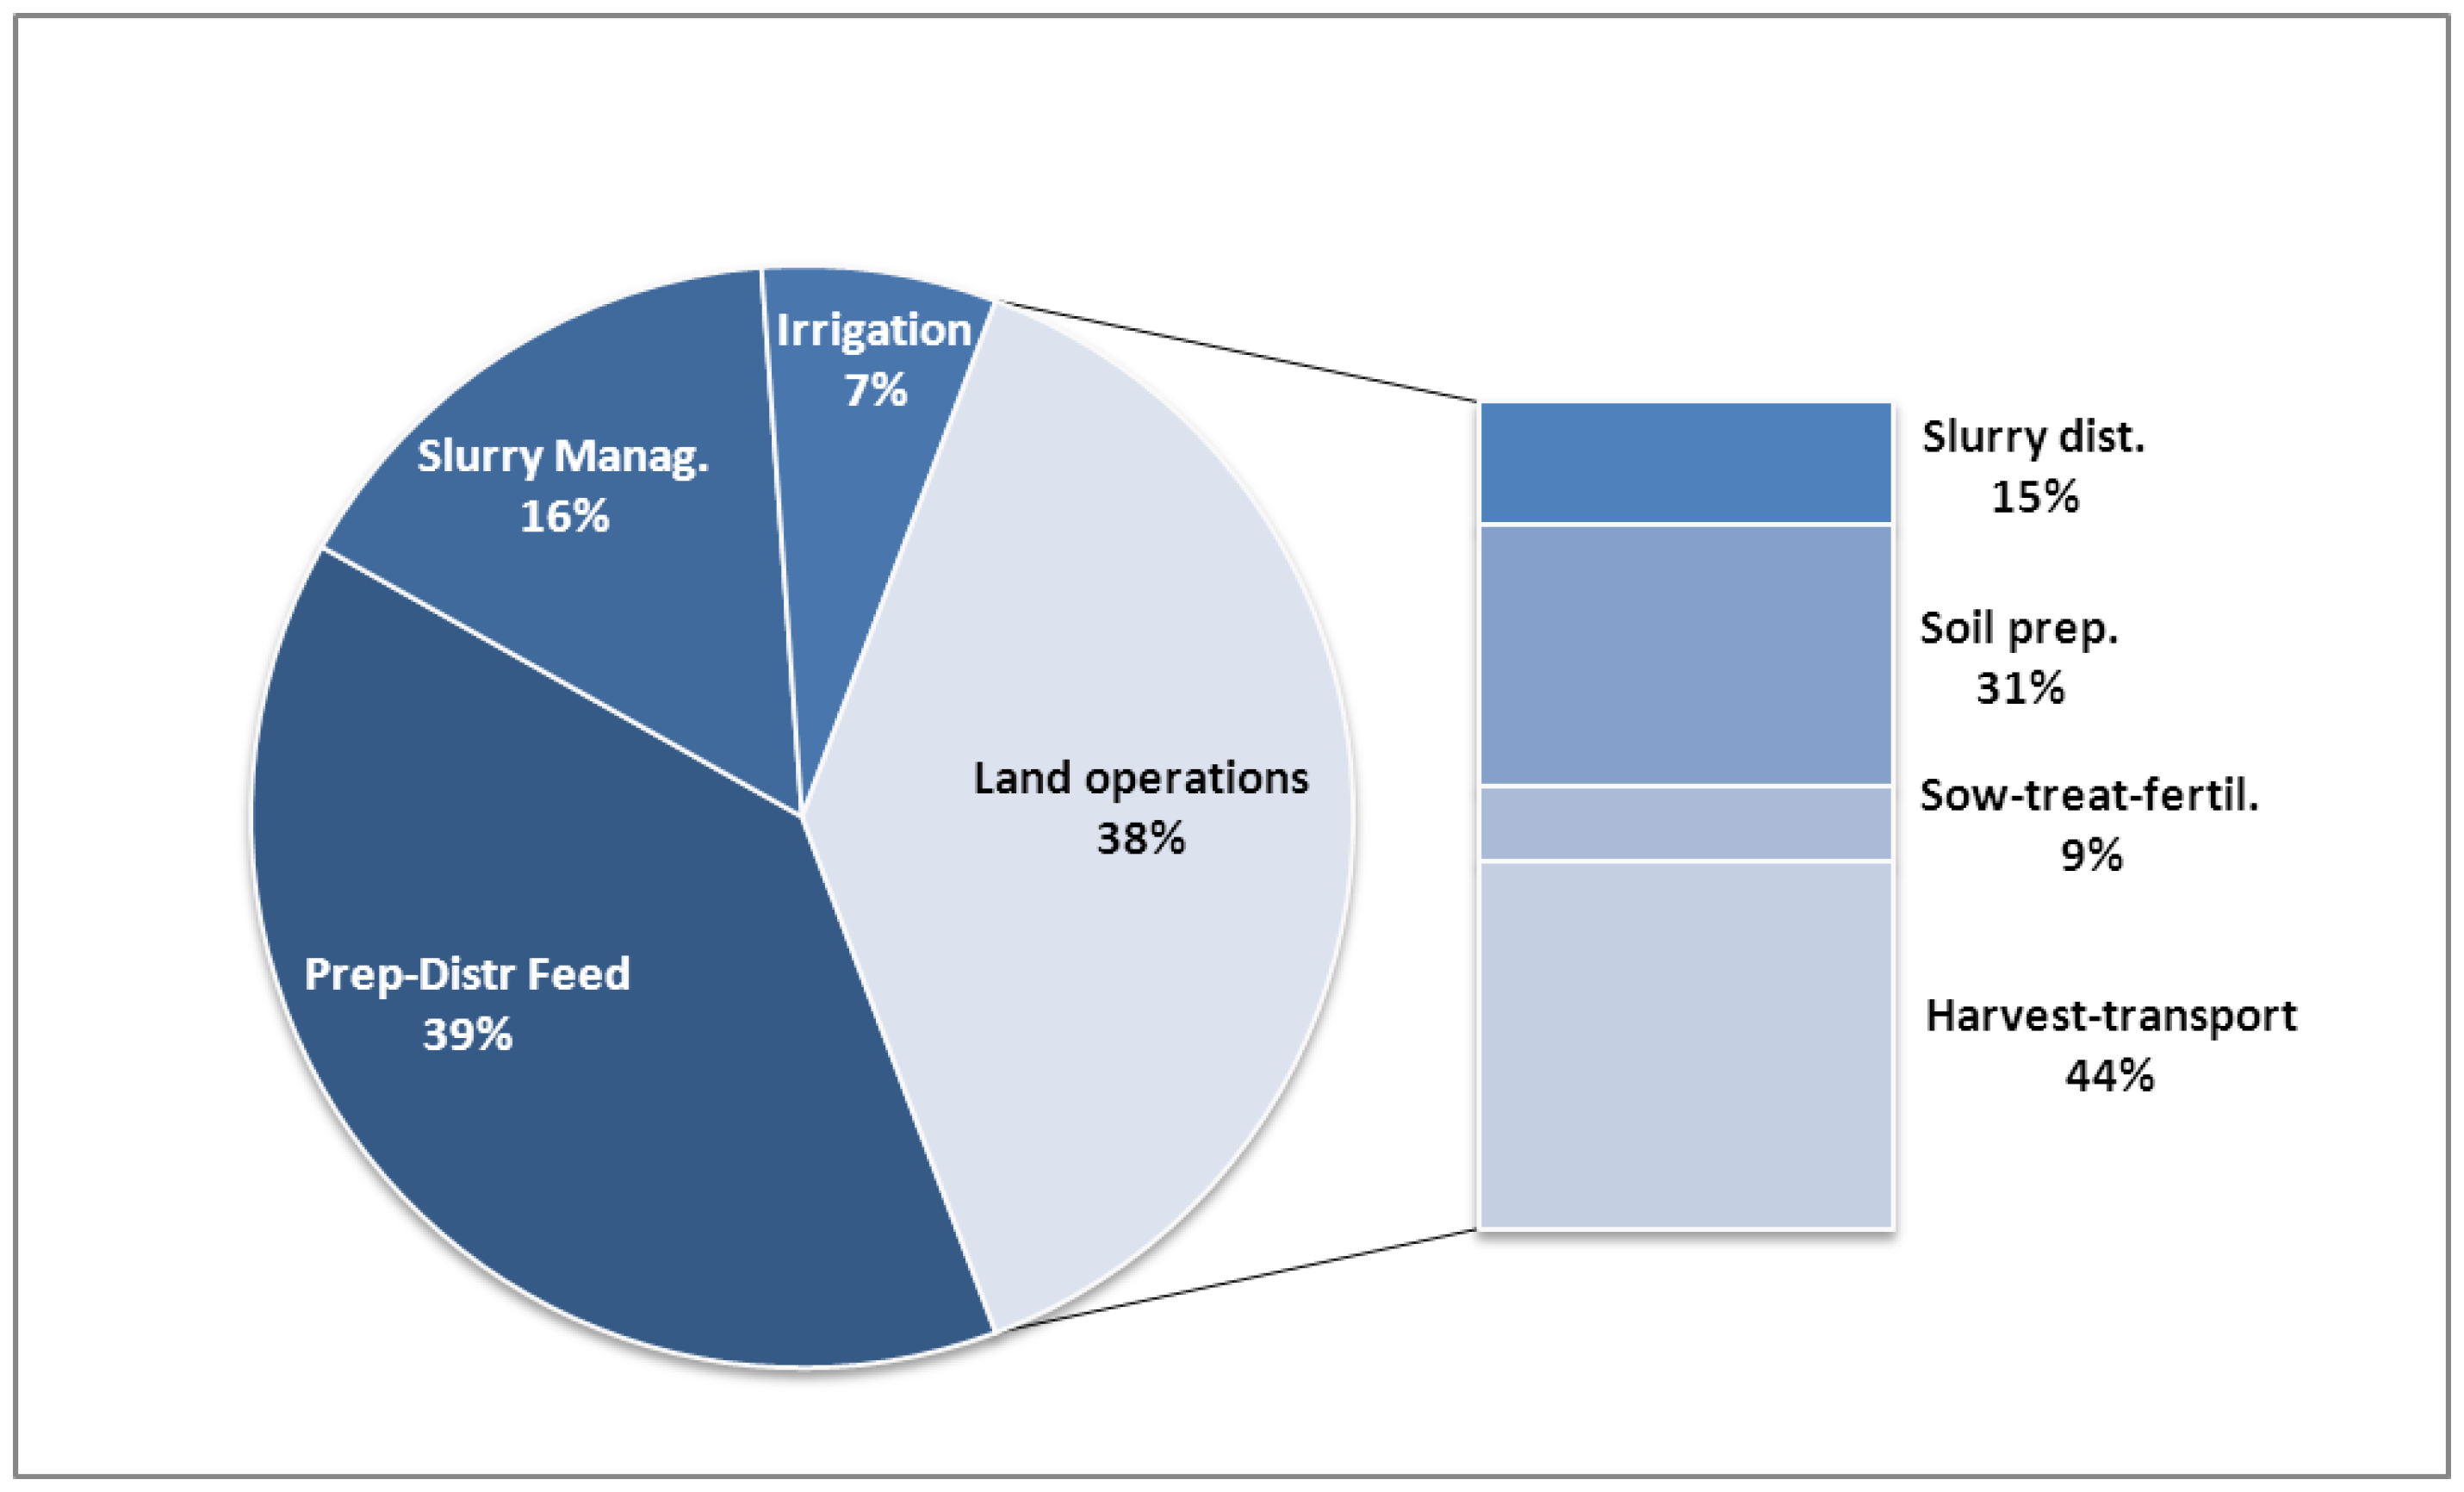
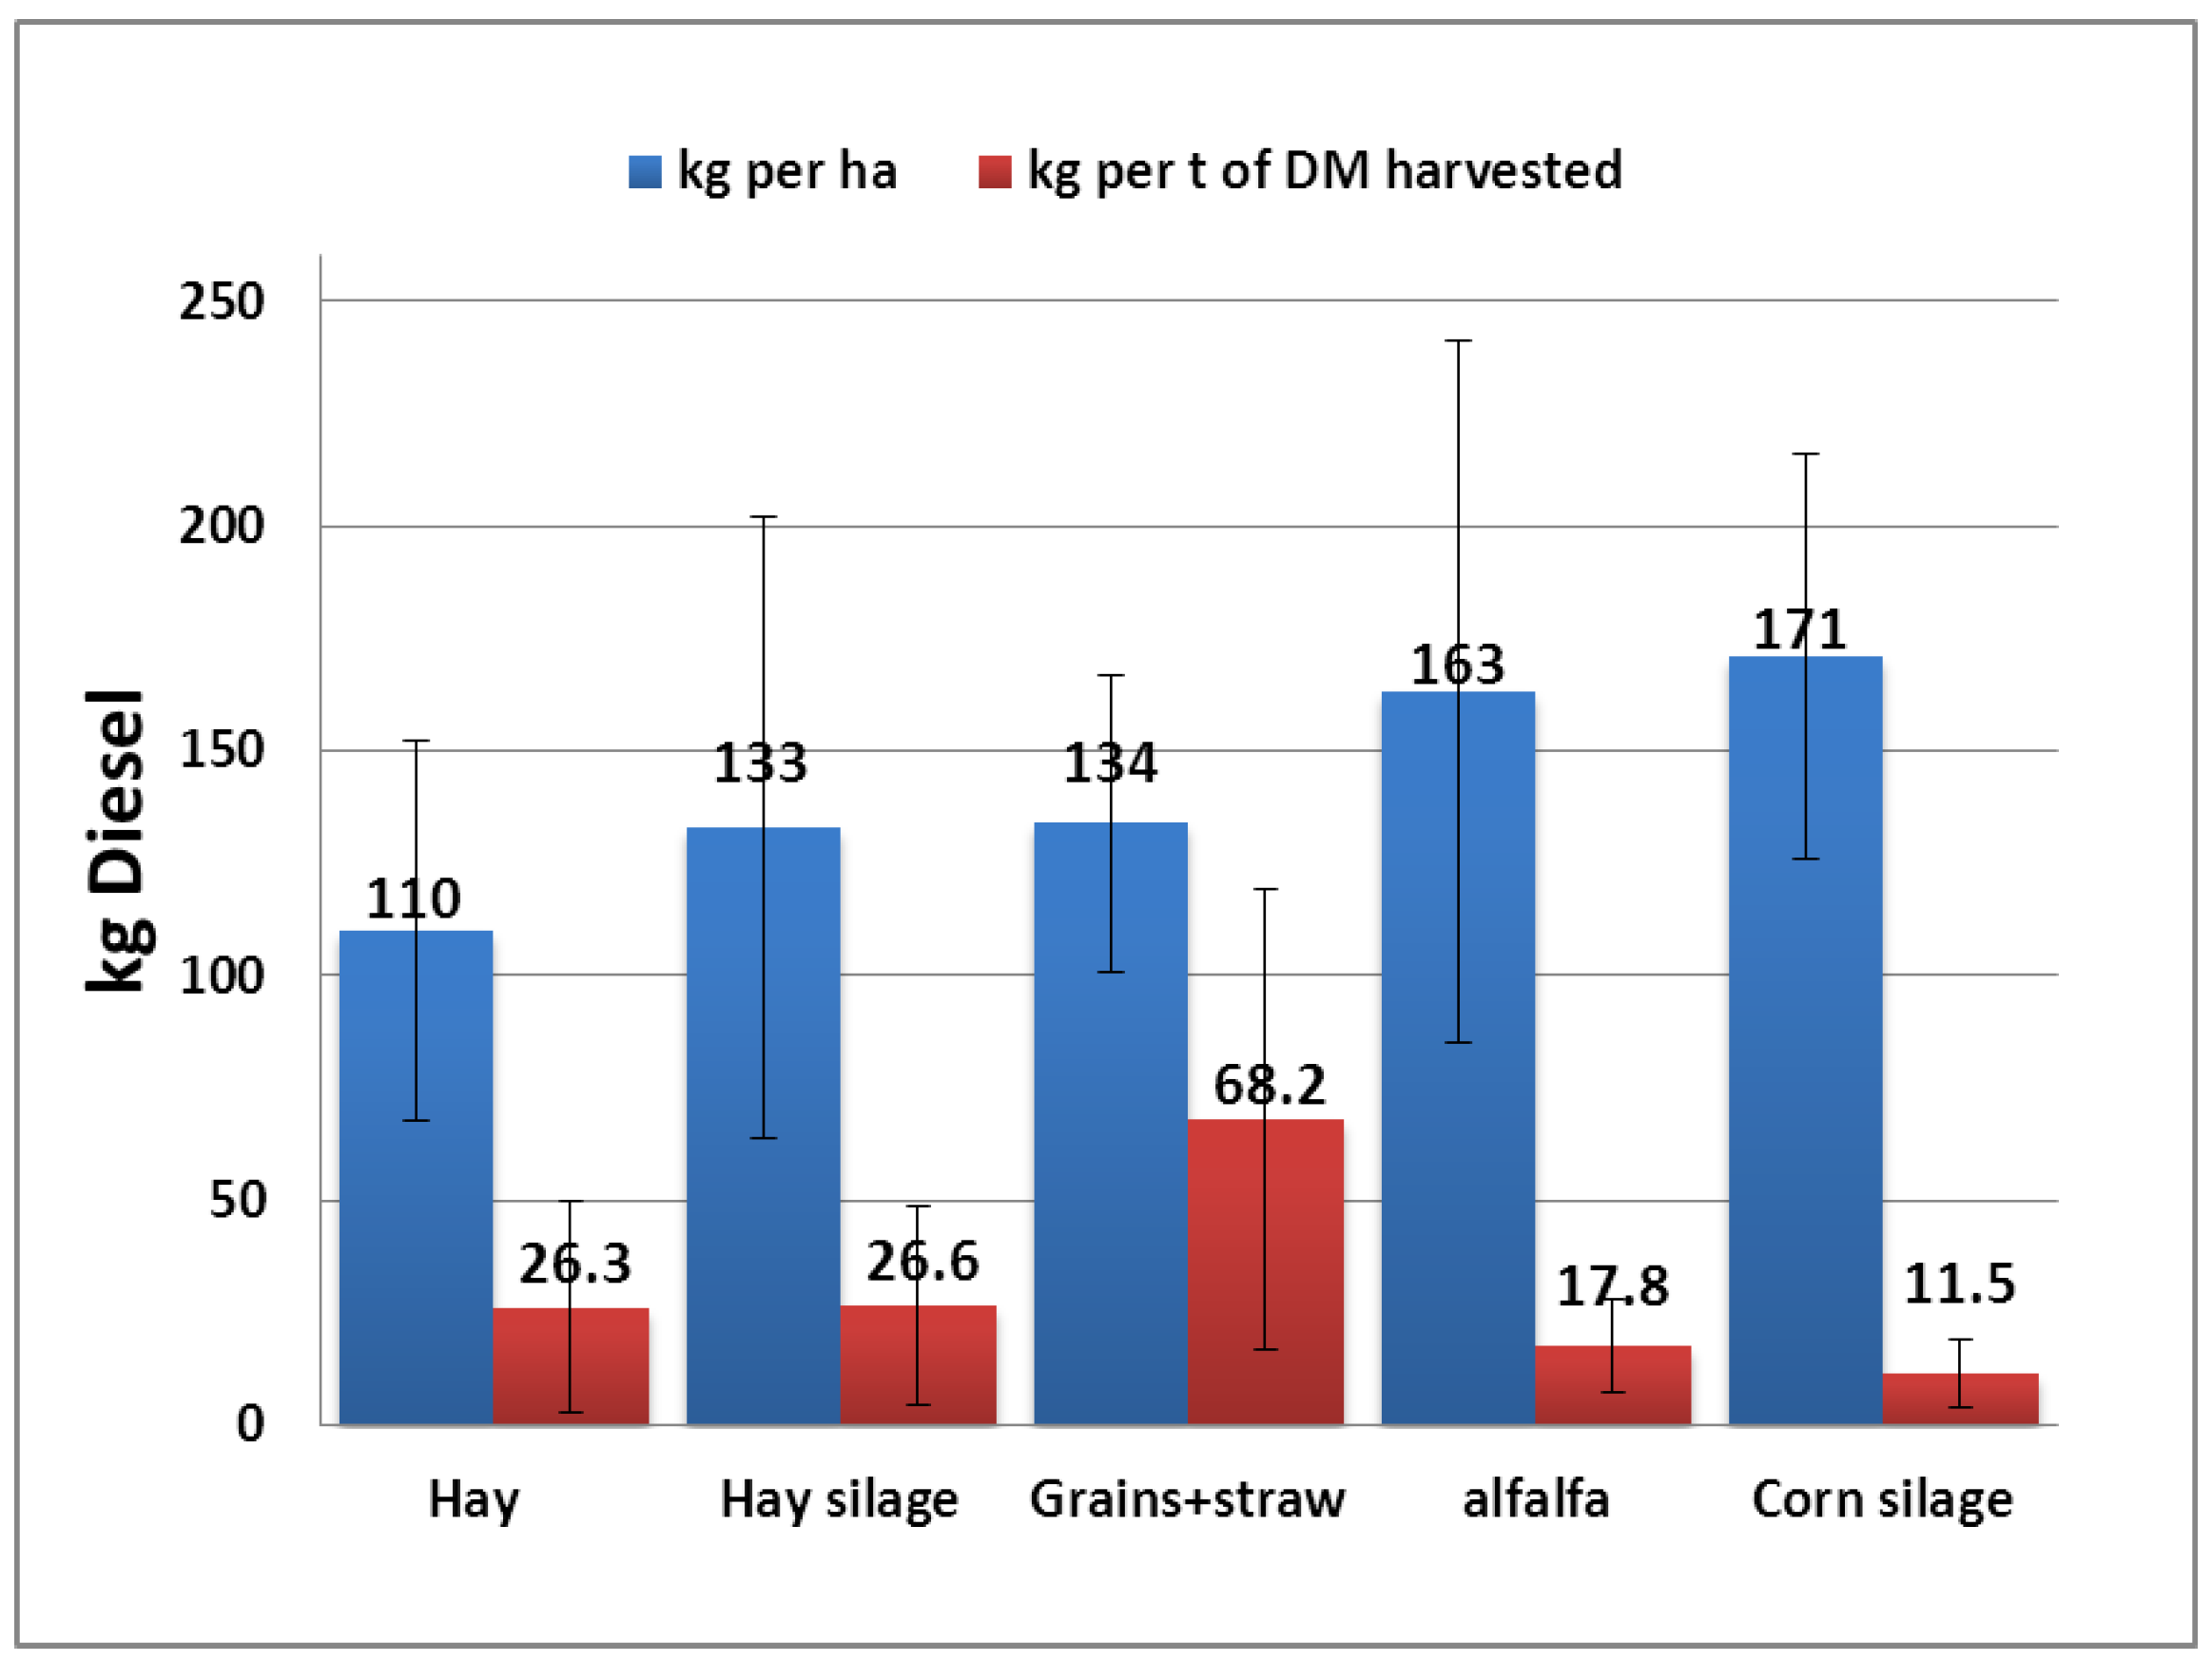
To estimate the energy consumptions pertaining to the different on-farm activities, a systematic electricity auditing of overall electrical appliances was carried, reporting the power of each equipment and its usage routine (hours per day and days per year). Furthermore, the resulting data and the electricity bills were compared to evaluate the accuracy of the estimation. The following on-farm electrical appliances have been investigated.
Milking: Motor’s power and using routine of vacuum pumps, milk pump and air compressor were assessed together to determine the global electrical consumption related to milking operations. When available, Variable Drive Speed (VDS) systems were considered for assessing the electrical consumption of the vacuum pump. The electrical requirements of the air compressor and the milk pump were set as a 4% of the vacuum pump consumptions.
Milk Cooling: The following equation was used to assess the yearly energy requirement (REel) of the milk cooling tank.
R E e l = m × c p × ( t 1 t 2 ) C O P × η   × 3.6     [ kWh   y 1 ]
where m (kg year−1) represents the mass of cooled milk, cp (MJ kg−1 °C−1) the milk specific heat value, COP the coefficient of performance, t1 and t2 (°C) the initial and final milk temperatures, η the efficiency of the refrigeration system and 3.6 the conversion factor from MJ to kWh. The amount of energy required from the milk tank might be reduced using pre-coolers plates (PCP) which allow decreasing the temperature of the milk conveyed to the tank. The amount of this reduction is related to the temperature of the cooling medium. When the PCP was available a reduction of 16 °C of the initial milk temperature was set in t1.
Water heating: The water temperatures used to clean and disinfect the milking system and the cooling tank were collected to assess the electrical consumptions. The quantities of hot cleaning water were set to 12 kg of water per milking unit per milking [32], plus 150–200 kg per day for the refrigeration tank. The electrical needs related to water consumptions were calculated through the following equation:
H W e l = m × c w × ( t 1 t 2 ) η × 3.6   [ kWh   y 1 ]
where m (kg year−1) is the mass of cleaning water, t1 and t2 (°C) the initial and final water temperatures, cw (MJ kg−1 °C−1) the water specific heat value, η the efficiency of the electric boiler, and 3.6 the conversion factor from MJ to kWh.
Additionally, the availability of a Heat Recovery System (HRS) has been considered when assessing the ∆t values and the final water temperature required.
Brushing: Refers to the use of mechanized brushes for increasing cow’s comfort. Type and power of the brushing systems were collected during farm’s inventory, while the usage time was set at 6 minutes/day per milking cow [33].
Lighting: Type, power and using time of different type of lamps were inventoried to assess electricity illumination expenditure.
Ventilation and misting: These systems are automatically switched on when the cowshed temperature is above 20–25 °C to reduce cow’s heat stress during the warmest seasons. Power and using time were collected by farm interview.
Water supply: Electricity usages for water pumping included on-farm water consumptions for milking parlor, cowsheds, and irrigation requirements. Power of pumps and using time were also collected.
Manure management: Use of equipment for slurry removal from cowshed and the successive storage and treatment.
Other: Energy requirements related to marginal on-farm operations such as water treatment, electrical equipment for feeding procedures and high pressure cleaning.

2.7. Diesel Audit

To assess the tractor fuel usage due to each on-farm operation, the using time of the self-propelled machinery, the power of the tractors and the diesel consumption at partial load for each operation were collected. The following equation was to assess diesel fuel usage (Q) as suggested by Grisso et al., 2004 [34]: Q = (0.22 X + 0.096) Ppto (L h−1), where (Ppto, kW) is the rated power of the machinery and (X, decimal) is the partial load related to each operation. Values from 0.30 to 0.50 were set for light and medium-light operations, while values from 0.50 to 0.65 were selected for the heaviest ones. The results obtained from the equation were transformed in kg of diesel fuel per unit of time using a conversion factor of 0.835 kg·L−1.
Moreover, the estimation of diesel fuel consumptions have been grouped into four main areas associated with: field operations, which include manure distribution, soil tillage, sowing, fertilization, treatments, harvesting and storage of products; manure management, which encompasses the operations related to the overall management of slurry removal from farm facilities and the subsequent treatment; feeding operations, associated with feed preparation and distribution through the use of machinery and mixer wagons; and irrigation, related to the operations carried out for water pumping by means of diesel pumps.
Field operations were assessed per each on-farm cultivated crop, independently. In fact, diesel fuel usage was analyzed based on the type of activity conducted, the hourly time spent by the machinery and the unit of land extent. The results have been reported to the crop yield information to obtain direct energy use per unit of each product harvested (kg diesel· tonne of feed−1) and per unit of cultivated crop (kg diesel· cultivated hectare−1).

2.8. Energy Carbon Footprint

The contribution of the carbon dioxide to the GHG effect was assessed using The Global Warming Potential (GWP). The contribution of CO2 to the climate change is equal to 1 for all time horizons available, as defined by IPCC 2014 [1]. The emissions of carbon dioxide from direct energy uses were assessed by multiplying the total consumptions to the following emission factors: 0.4103 kg CO2-eq kWh−1 [35], based on the Italian energy mix used to produce electricity from “well-to-user”; 3.15 kg CO2-eq kg−1 [36] to estimate the emissions from diesel fuel combustion from “well-to-wheel”; and 2.87 kg CO2-eq kg−1 to assess the emissions from LPG (well-to-user).

2.9. Energy Efficiency and Carbon Indicators

The data obtained from farms interview were organized in a Microsoft Excel work sheet. The initial analyses were carried out to identify faults and errors in the database. Further assessments were performed to define direct energy efficiency and carbon indicators, which provide a common basis to compare the diverse farm performances.
The EUIs (Energy Utilization Indices) [23,37,38] adopted to express on-farm electricity usage were referred to the cultivated land extent (kWh hectare−1), the herd dimension (kWh head−1 and kWh lactating cow−1) and the amount of milk produced (kWh kg FPCM−1). The requirements of diesel fuel and LPG for the EUIs measured were: kg head−1, kg Lactating Cow−1 (LC), kg·hectare−1 and kg per kg FPCM. Energy Carbon Footprint (ECF) was expressed as emission of CO2-eq per unit: kg CO2-eq LC−1, kg CO2-eq head−1, kg CO2-eq per kg FPCM−1, and kg CO2-eq hectare−1.

3. Results and Discussion

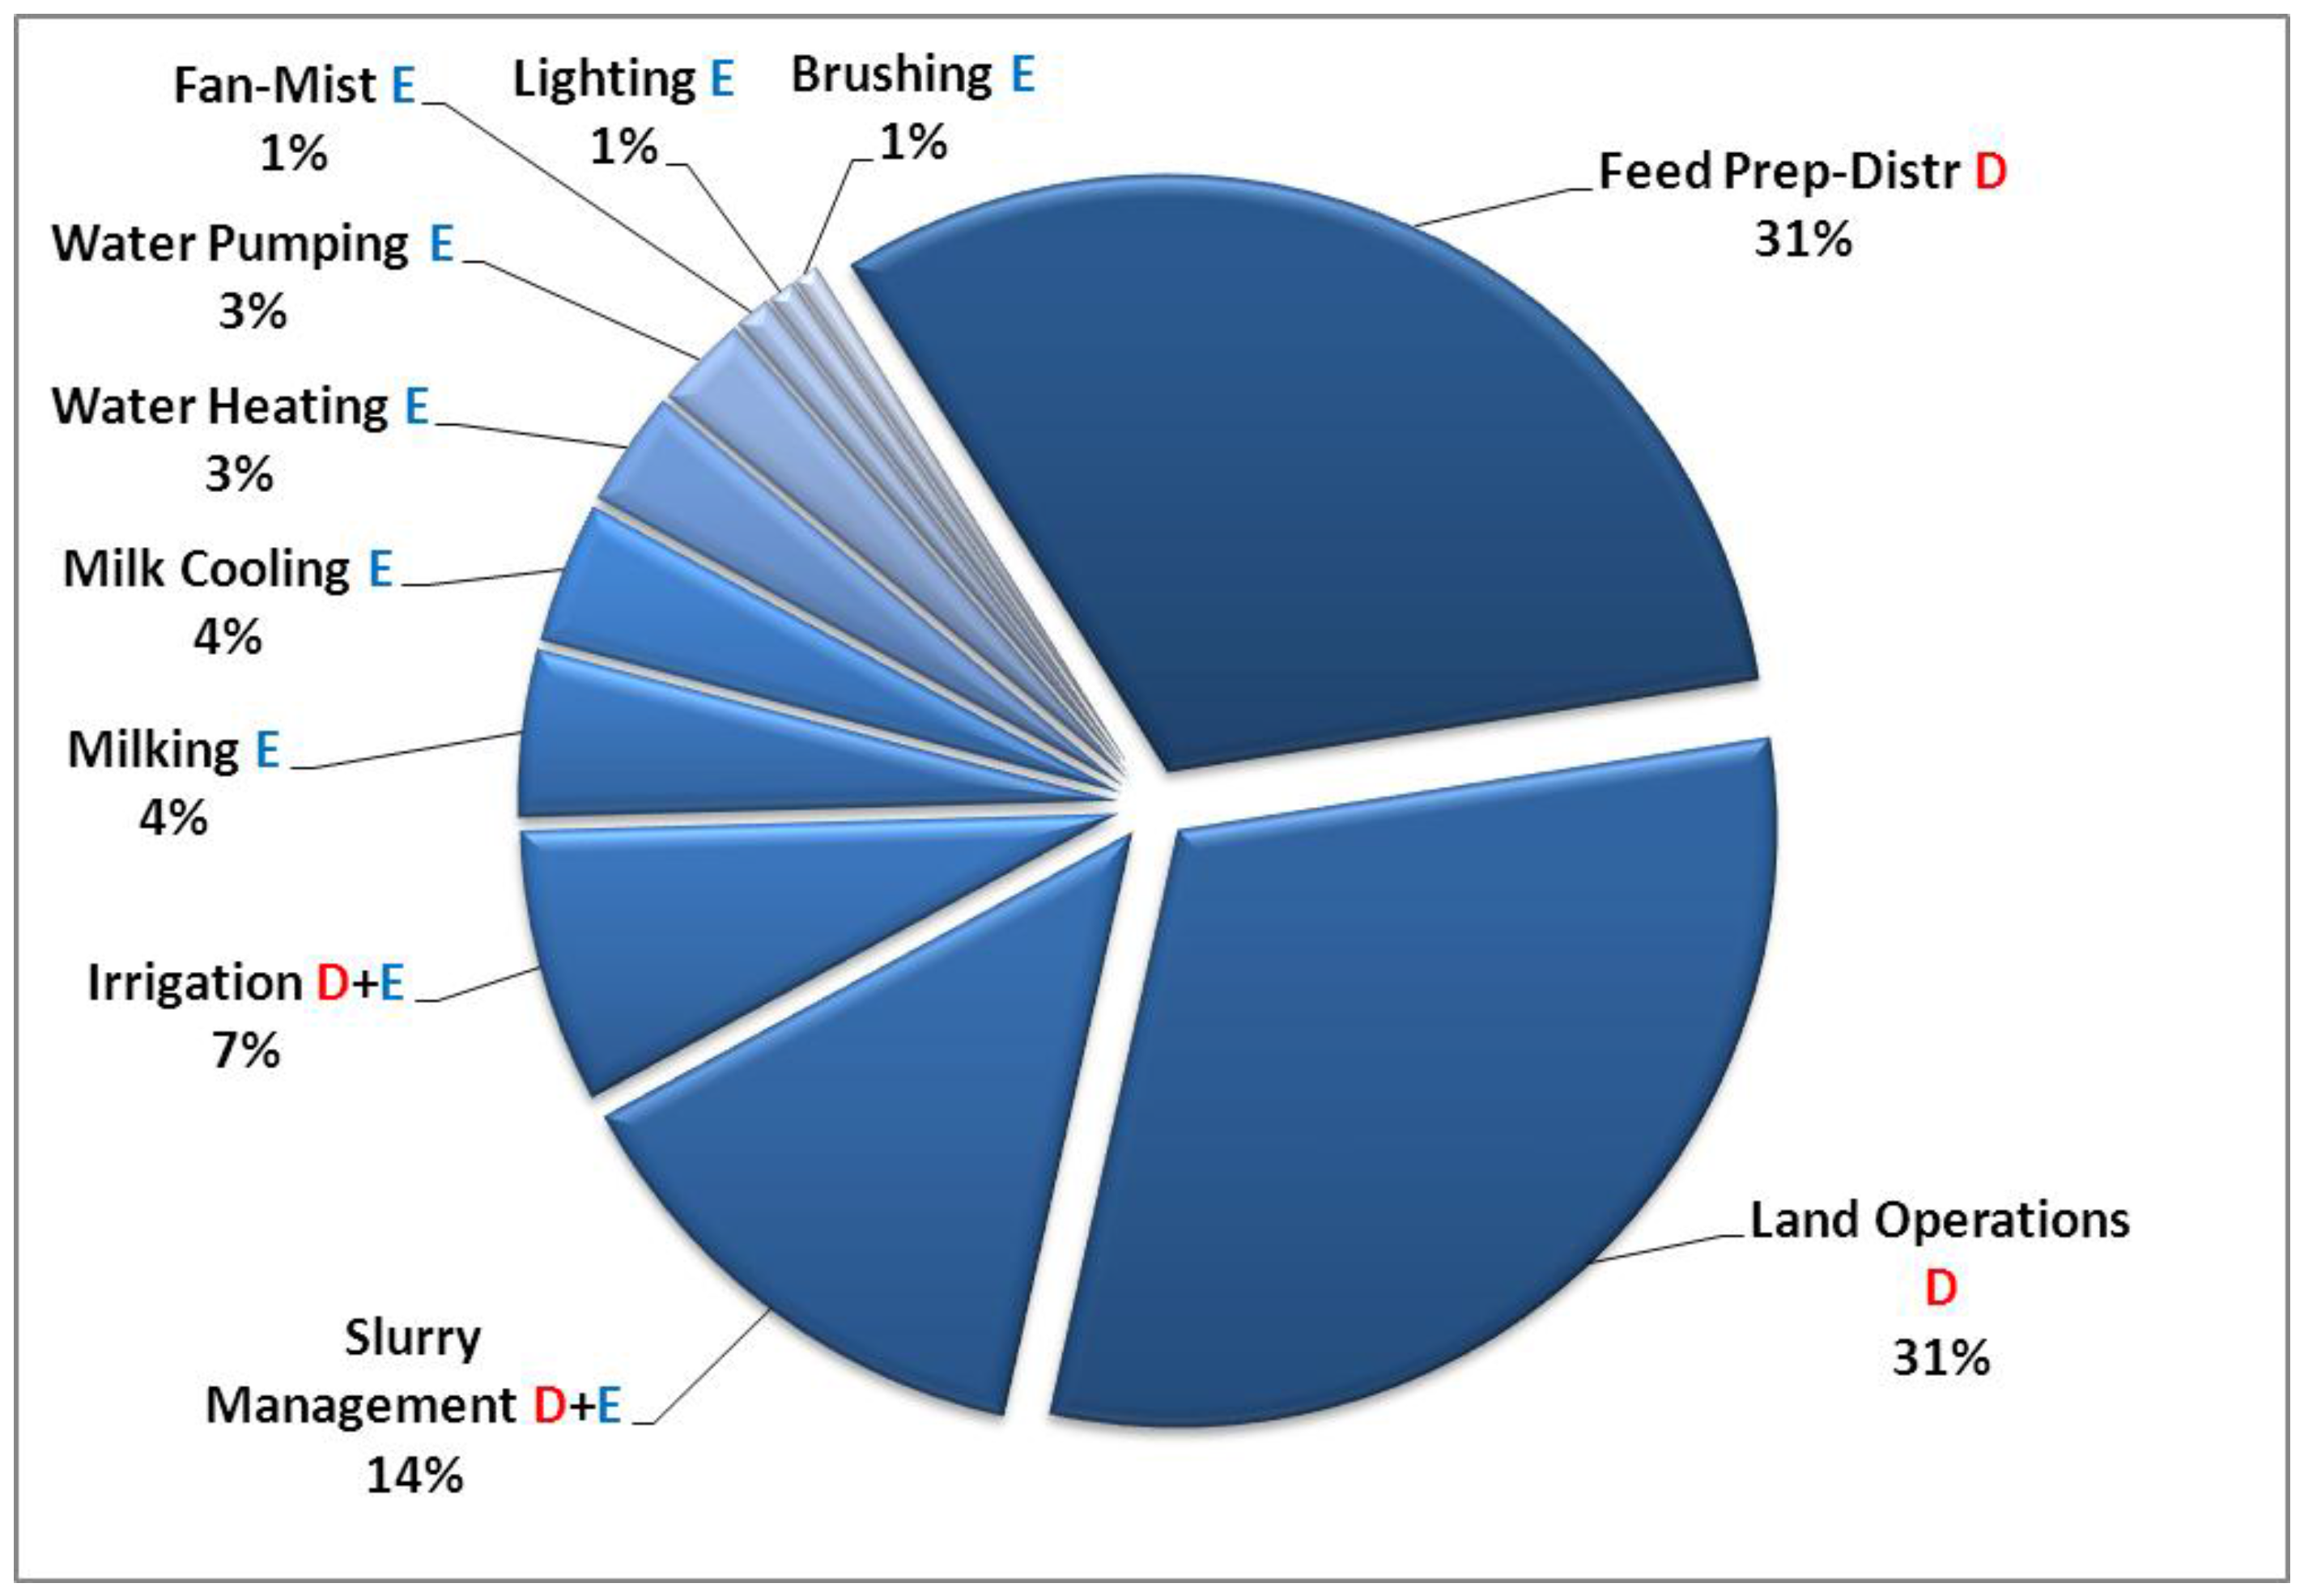
3.1. Direct Energy Intensity

The average yearly energy consumed (Table 1) by farms accounted for 13,675 kg of diesel, 26,245 kWh of electricity and 115 kg of LPG. Diesel fuel requirements were about 260 kg·LC−1, 369 kg per hectare cultivated and 40 kg per tonne of FPCM. For the electricity, the EUI were 491 kWh per lactating cow and 73 kWh per tonne of milk. The annual energy indicators associated with LPG usages amounted to 2 kg per lactating cow and 0.4 kg per tonne of FPCM. Expressing the above mentioned data in terms of primary energy requirements, Table 1 shows a global consumption of 7678 MJ per head, 16,514 MJ per LC and 2522 MJ of primary energy per tonne of FPCM.
Battini et al. [39] quantified lower diesel usage in four typical dairy farms located in the Po Valley (North Italy), ranging from 154 to 183 kg of diesel fuel per lactating cow.
The analysis of the electricity usages indicates that milk harvesting and refrigeration were the most demanding processes, requiring 23% and 19% of the annual electricity consumption, respectively (Figure 1). The other processes that affect significantly the electricity consumptions were: water heating (15%), water pumping (13%), and pumping for irrigation (9%), followed by slurry management and fan-misting (5% each), lighting and cow brushing (4% each). The total activities carried out at the milking parlor level accounted for 57% of the total electricity requirement. The results obtained from the electricity analysis are higher (17% expressed in terms of kWh for lactating cows and 24% higher if referred to the unit of milk) than those found from a French study conducted by L’Institut de l’Elevage (2009) [25] which investigated 60 dairy farms (milk yield 7.2 t cow−1 year−1). Comparable results were obtained in 60 Italian dairy farms (milk yield 8 tonne cow−1 year−1) located in the Emilia Romagna region [40]: 510 kWh per cow per year and 0.064 kWh per kg of milk per year. Although, a study conducted in 41 German dairy farms shows an average EUI of 90 kWh per tonne of milk, a value that is 23% higher of the present results [26]. The EUI of 44 kWh per tonne of milk obtained from Sardinian dairy farms [24] is lower than the results of the present study. The differences in farm mechanization level and milk yield expressed per raised head significantly affect the EUI.
Moreover, diesel fuel requirements related with on-farm and field operations (Figure 2), feed preparation and distribution represent 39% of the overall diesel fuel utilization; field activities associated to crop cultivation accounted for 38%; slurry treatment for 16%; and irrigation pumping for 7% of the total.
Feeding operations were also evaluated by Kraatz (2012) [41] in German dairy farms, showing higher levels of input requirement in feed supply corresponding to about 50% of the on-farm energy intensity.
Diesel usages for land operations are allocated into four phases which contributed to the total consumption in the following way: 15% for manure distribution; 31% for soil preparation; 9% for sowing, crop treatments and fertilization; and crop harvesting and transportation represent the most demanding procedures, necessitating 44% of the total (Figure 2). However, the purchase of feed from the outside of the farm may occur. This aspect has been considered in Part 2 [42] of this paper-series since animal feed represents an indirect energy items.
The most representative crop selections in the investigated farms were grass and legume crops for forage production (52%), maize for corns silage (33%) and cereals for the production of grains (26%).
Additional assessments about diesel consumption were assessed for each cultivated crop. Obviously, crops which required more mechanized actions accounted for higher fuel demand: 110 kg ha−1 for hay production; 133 kg ha−1 for hay silage; 134 kg ha−1 to harvest cereal grains; 163 kg ha−1 for alfalfa products (hay and silo hay); and, the largest value, 171 kg ha−1, related to corn silage.
When diesel fuel requirements per land extent (ha) were reported to the associated crop yield, stated as tonne of harvested Dry Matter (DM), the assessment revealed reversal outcomes. In fact, corn silage and alfalfa crops held the highest diesel fuel consumptions per cultivated hectare (Figure 3), but with the lowest amounts of diesel requirements per unit of product harvested (11.5 and 17.8 kg tDM−1, respectively). The production of cereal grain presented the highest consumption of fuel per unit of product harvested (about 68 kg tDM−1) since the production yield of cereal grain was commonly low (from 1.8 t ha−1 to 3.1 t ha−1). Grass forage and spring silage required a consumption of 26.3 and 26.6 kg of diesel per tonne of DM produced, respectively. These results were also expressed as useful energy based unit (g of diesel per MJ), analyzing the consumption of diesel fuel for the respective energy content of each feed [43], expressed in terms of megajoules of metabolizable energy per kilogram of dry matter (MJ/kg DM). Thus, corn silage and alfalfa showed, respectively, 1.10 and 1.98 g of diesel MJ−1, while hay silage and hay required about 2.21 and 2.92 g of diesel MJ−1, respectively. The highest value was obtained for the production of grains with about 5.68 g of diesel MJ−1 of product harvested.

3.2. Carbon Dioxide Emissions

The yearly CO2 emissions related to electricity consumptions accounted for 201 kg CO2-eq LC−1 and 30 kg CO2-eq per tonne of FPCM (Table 2).
The yearly emissions from diesel fuel combustion accounted for 819 kg CO2-eq per lactating cow and 125 kg CO2-eq per tonne of FPCM per year. This index accounted for 1162 kg CO2-eq ha−1 per year when referred to the cultivated land extent. Furthermore, the emission associated to the utilization of LPG were negligible: 1 kg CO2-eq per tonne of FPCM and 7 kg CO2-eq per lactating cow.
The on-farm average emission of CO2-eq, ascribable to the overall energy usages, was around 54 tonnes of CO2-eq per year, which corresponded to 1027 kg CO2-eq per lactating cow and 156 kg CO2-eq per tonne of milk.
Lower levels of carbon dioxide emissions, related to energy consumptions, were found [24] in a study conducted in 20 Italian conventional dairy farms emitting 834 kg CO2-eq per lactating cow and 85 kg CO2-eq per tonne of milk sold. Milk yield and herd size affect carbon dioxide emission indices when emissions are reported per unit of milk sold.
The overall CO2-eq emissions associated to diesel fuel and electricity ascribed to each on-farm activities is shown in Figure 4. Diesel consumptions represent the most pollutant source, accounting for 72% of the total carbon emissions, while electricity represents about 27%. Feed management and land operations contribute each for 31% of the total energy carbon footprint followed by slurry management (9%), while electricity requirements accounted for a lower quantity of the overall CO2 emissions. Milk harvesting and refrigeration both denote 4% of CO2 emissions, while water pumping and water heating amounted about 3% each.
Further analyses were carried out to identify more accurate energy related indices per farm characteristics, as herd size and annual milk yield per lactating cow. As shown in Table 3, the energy consumptions and the associated emissions of CO2-eq were classified based on four categories of herd size, from less than 50 heads to over 200 heads.
The group “50–100” held the highest number of farms (100), whereas only 44 farms were located in the group “greater than 200”. Larger farms, with higher yield of milk (tonnes LC−1 per year), were associated with lower levels of CO2 emissions per unit of FPCM: 10 kg CO2-eq per 100 kg FPCM per farms with more than 200 heads versus 24 kg CO2-eq per 100 kg FPCM in farms with fewer than 50 heads. It resulted that larger farms were capable to produce milk emitting 2.4 times less CO2 than smaller farms in terms of emissions from on-farm direct energy consumption.
Global results were also grouped based on the annual milk yield production per lactating cow, as shown in Table 4; where direct energy consumptions and associated emissions of CO2-eq were referred to four categories, from less than 5 t of milk to over 9 t of milk per cow.
The majority of farms were located in the class “7 to 9 t of FPCM” and “≥9 t of FPCM” groups, 88 and 85, respectively, while 40 farms held to the group “less than 5 t of FPCM”. The results of this analysis indicated that farms with higher milk yields (milk tonnes·LC−1) were related with higher herd dimension.
The analysis demonstrated that the direct energy carbon footprint was higher in farms belonging to the lowest milk yield class: 36 kg CO2-eq per 100 kg of milk in farms with yield lower than 5 t per cow; 16 kg CO2-eq 100 kg FPCM−1 in farms belonging to yield class between 5 and 7 t; 12 kg CO2-eq 100 kg FPCM−1 in farms with milk yield between 7 and 9 t and reaching the minimum value of 10 kg CO2-eq 100 kg FPCM−1 when milk yield was greater than 9 t.
Dairy farms which held higher level of milk production were capable to produce milk emitting around 3.6 times less CO2 than farms with lower milk yield (group “>9” vs. group “<5”).
Characterization and typification of mechanization, structural and energy profiles of dairy farms were observed and discussed by Todde et al., in 2016 [18], underlining how the high technological investments, the locations and the management significantly affect small and large size farms.
In this two-part series, a comprehensive analysis of direct and indirect (Part 1 and Part 2) energy requirements and related carbon footprint of conventional dairy farms has been carried out. The overall results are reported in Part 2 [42], where total direct and indirect energy demand, expressed in GJ per farm, has been shown as well as the related carbon emissions.

4. Conclusions

The intensification of the management of dairy farms is strictly associated with higher demands of energy and increasing carbon dioxide emissions.
This study carried out a detailed survey in a very large population of conventional dairy farms located in the south of Italy, where diesel, electricity and LPG requirements and the related carbon dioxide emissions have been analyzed.
The outcomes of the analyses, related to the two most relevant on-farm sources of energy, showed an annual average fuel consumption of 40 kg per tonne of FPCM, while electricity amounted for 73 kWh per tonne of milk produced. The LPG requirements were negligible in all investigated farms, where the annual average farm consumption was about 115 kg.
Expressing the direct energy inputs in the corresponding primary energy units, diesel requirement results the main resource utilized in on-farm activities (on average 1840 MJ t−1 of milk), accounting for 72% of the total fossil primary energy requirement, while electricity represents only 27% of primary energy uses.
Further analyses revealed a positive trend as herd size and milk yield increased: large farms were able to use more efficiently the direct energy inputs and reduce their carbon footprint per unit of milk sold.
The global average farm emissions of CO2-eq, due to the overall energy consumptions, accounted for 156 kg CO2-eq per tonne of FPCM, while farms that rise more than 200 heads emitted about 100 kg CO2-eq per tonne of FPCM (36% less than the average). The results of this study highlighted that large size farms held lower carbon dioxide emissions when reported to the amount of milk produced.
The analysis of the direct energy requirements at farm level also helps to underline the critical points where mitigation plans are required. These outcomes point out the need to apply saving strategies mainly in diesel requirements, specifically for the activities associated with feed preparation and distribution, crop cultivation and irrigation procedures, which represent the most direct energy demanding operations. The activities related to feed management and field operations required the largest part of total diesel fuel combustion. It is obvious how significant it is to size properly the on-farm fleet equipment according to the real operational requirements. In fact, high levels of diesel fuel consumptions per cultivated hectare may come from high power coefficient of utilization which are expressed as KW ha−1. Moreover, the use of new efficient machineries or adopting minimum tillage techniques, which reduced the depth in tillage or the number of field operations, could reduce the fuel requirements for crop production.
The requirement of electricity of the involved dairy farms were mainly associated to the activities linked with milk harvesting, milk refrigeration and water heating. The use of energy saving technologies, such us variable speed drives connected to the vacuum pumps, heat recovery systems from cooling tanks and milk pre-coolers plates allowed saving 2–13 kWh per tonne FPCM.
Reducing the consumption of electricity, diesel fuel and LPG requirement leads to reducing the anthropogenic gas emissions into the environment, decreasing the associated direct energy costs for dairy farms and improving the efficient use of natural resources.

Acknowledgments

This work is part of the “Dairy Carbon Footprint Project” funded by the “Filiera AQ s.r.l”. The authors are grateful to the 3A, ProgettoNatura, Granlatte and Assolac dairy plant co-operative and their technician who kindly collected and provided the farm data.

Author Contributions

Giuseppe Todde, Lelia Murgia, Maria Caria and Antonio Pazzona conceived and designed the experiments; Giuseppe Todde, Lelia Murgia, and Maria Caria did data collection; Giuseppe Todde, Lelia Murgia and Maria Caria analyzed the data and wrote the paper; Giuseppe Todde, Lelia Murgia, Maria Caria and Maria Caria revisioned the article for the final approval of the version to be published.

Conflicts of Interest

The authors declare no conflict of interest.

References

  1. Intergovernmental Panel on Climate Change. Climate Change 2014: Synthesis Report. Contribution of Working Groups I, II and III to the Fifth Assessment Report of the Intergovernmental Panel on Climate Change; Core Writing Team, Pachauri, R.K., Meyer, L.A., Eds.; IPCC: Geneva, Switzerland, 2014; p. 151. [Google Scholar]
  2. Food and Agriculture Organization. Livestock’s Long Shadow; Environmental Issues and Options; Animal Production and Health Division: Rome, Italy, 2006. [Google Scholar]
  3. Gill, M.; Smith, P.; Wilkinson, J.M. Mitigating climate change: The role of domestic livestock. Animal 2010, 4, 323–333. [Google Scholar] [CrossRef] [PubMed]
  4. Capper, J.L.; Cady, R.A.; Bauman, D.E. The environmental impact of dairy production: 1944 compared with 2007. J. Anim. Sci. 2009, 87, 2160–2167. [Google Scholar] [CrossRef] [PubMed]
  5. Flachowsky, G.; Hachenberg, S. CO2-Footprints for Food of Animal Origin—Present Stage and Open Questions. J. Verbrauch. Lebensm. 2009, 4, 190–198. [Google Scholar] [CrossRef]
  6. Pulina, G.; Atzori, A.S.; Battacone, G.; Francesconi, A.H.D.; Mele, M.; Ronchi, B.; Stefanon, B.; Sturaro, E.; Trevisi, E. Italian animal footprint: L’impatto ecologico delle attività zootecniche italiane. Manag. Delle Util. 2012. Available online: http://hdl.handle.net/10807/21191 (accessed on 16 September 2017).
  7. Bouamra-Mechemache, Z. Impact of a gradual increase in milk quotas on the EU dairy sector. Eur. Rev. Agric. Econ. 2008, 35, 461–491. [Google Scholar] [CrossRef]
  8. Lips, M.; Rieder, M. Abolition of Raw Milk Quota in the European Union: A CGE Analysis at the Member Country Level. J. Agric. Econ. 2005, 56, 1–17. [Google Scholar] [CrossRef]
  9. Food and Agriculture Organization. Greenhouse Gas Emissions from the Dairy Sector: A Life Cycle Assessment; Animal Production and Health Division: Rome, Italy, 2010. [Google Scholar]
  10. Israel Defense Forces. Environmental/Ecological Impact of the Dairy sector: Literature Review on a Dairy Products for an Inventory of Key Issues, List of Environmental Initiatives and Influence on the Dairy Sector; Bulletin of International Dairy Federation: Belgium, 2009; p. 436. [Google Scholar]
  11. Todde, G.; Murgia, L.; Caria, M.; Pazzona, A. Dairy Energy Prediction (DEP) model: A tool for predicting energy use and related emissions and costs in dairy farms. Comput. Electron. Agric. 2017, 135, 216–221. [Google Scholar] [CrossRef]
  12. Upton, J.; Murphy, M.; Shalloo, L.; Groot Koerkamp, P.W.G.; De Boer, I.J.M. A mechanistic model for electricity consumption on dairy farms: Definition, validation, and demonstration. J. Dairy Sci. 2014, 97, 4973–4984. [Google Scholar] [CrossRef] [PubMed]
  13. Pagani, M.; Vittuari, M.; Johnson, T.G.; De Menna, F. An assessment of the energy footprint of dairy farms in Missouri and Emilia-Romagna. Agric. Syst. 2016, 145, 116–126. [Google Scholar] [CrossRef]
  14. Vigne, A.; Martin, O.; Faverdin, P.; Peyraud, J.L. Comparative uncertainty analysis of energy coefficients in energy analysis of dairy farms from two French territories. J. Clean. Prod. 2012, 37, 185–191. [Google Scholar] [CrossRef]
  15. Van der Werf, H.M.G.; Kanyarushoki, C.; Corson, M.S. An operational method for the evaluation of resource use and environmental impacts of dairy farms by life cycle assessment. J. Environ Manag. 2009, 90, 3643–3652. [Google Scholar] [CrossRef] [PubMed]
  16. GrÖnroos, J.; Seppala, J.; Voutilainen, P.; Seuri, P.; Koikkalainen, K. Energy use in conventional and organic milk and rye bread production in Finland. Agric. Ecosyst. Environ. 2006, 117, 109–118. [Google Scholar] [CrossRef]
  17. Todde, G.; Caria, M.; Gambella, F.; Pazzona, A. Energy and Carbon Impact of Precision Livestock Farming Technologies Implementation in the Milk Chain: From Dairy Farm to Cheese Factory. Agriculture 2017, 7, 79. [Google Scholar] [CrossRef]
  18. Todde, G.; Murgia, L.; Caria, M.; Pazzona, A. A multivariate statistical analysis approach to characterize mechanization, structural and energy profile in Italian dairy farms. Energy Rep. 2016, 2, 129–134. [Google Scholar] [CrossRef]
  19. Gaudino, S.; Goia, I.; Grignani, C.; Monaco, S.; Sacco, D. Assessing agro-environmental performance of dairy farms in northwest Italy based on aggregated results from indicators. J. Environ Manag. 2014, 140, 120–134. [Google Scholar] [CrossRef] [PubMed]
  20. Atzori, A.S.; Tedeschi, L.O.; Cannas, A. A multivariate and stochastic approach to identify key variables to rank dairy farms on profitability. J. Dairy Sci. 2013, 96, 3378–3387. [Google Scholar] [CrossRef] [PubMed]
  21. Guerci, M.; Knudsen, M.T.; Bava, L.; Zucali, M.; SchÖnbach, P.; Kristensen, T. Parameters affecting the environmental impact of a range of dairy farming systems in Denmark, Germany and Italy. J. Clean. Prod. 2013, 54, 133–141. [Google Scholar] [CrossRef]
  22. Meul, M.; Nevens, F.; Reheul, D.; Hofman, G. Energy use efficiency of specialised dairy, arable and pig farms in Flanders. Agric. Ecosyst. Environ. 2007, 119, 135–144. [Google Scholar] [CrossRef]
  23. Ludington, D.; Johnson, E. Dairy Farm Energy Audit Summary Report; Energy Research and Development Authority: Albany, NY, USA, 2003.
  24. Murgia, L.; Todde, G.; Caria, M.; Pazzona, A. A partial life cycle assessment approach to evaluate the energy intensity and related greenhouse gas emission in dairy farms. J Agric. Eng. 2013, 44, e37. [Google Scholar] [CrossRef]
  25. Institut de l’Elevage. Les Consommations D’energie en Bâtiment D’elelevage Laitier; Reperes de Consommations et Pistes D’economies; Collection: Synthese, Janvier, 2009. [Google Scholar]
  26. Jäkel, K. Analyse der Elektroenergieanwendungund Einsparpotentialeam Beispielsächsischer Milchviehanlagen; Forschungsbericht Agrartechnik; Mertin-Luther-Universitat: Halle, Germany, 2003; p. 414. [Google Scholar]
  27. ISO 14064-1. Greenhouse gases—Part 1: Specification with Guidance at the Organization Level for Quantification and Reporting of Greenhouse Gas Emissions and Removals; European Standard: Iceland, Norway, 2012. [Google Scholar]
  28. ISO/TS 14067. Technical Specification. Greenhouse Gases—Carbon Footprint of Products—Requirements and Guidelines for Quantification and Communication; European Standard: Iceland, Norway, 2013. [Google Scholar]
  29. ISO 14040. Environmental management—Life Cycle Assessment—Principles and Framework; European Standard: Iceland, Norway, 2006. [Google Scholar]
  30. ISO 14044. Environmental Management—Life Cycle Assessment—Requirements and Guidelines; European Standard: Iceland, Norway, 2006. [Google Scholar]
  31. Israel Defense Forces. A Common Carbon Footprint Approach for Dairy, The IDF Guide to Standard Lifecycle Assessment Methodology for the Dairy Sector; Bulletin of International Dairy Federation: Belgium, 2010; p. 445. [Google Scholar]
  32. Southern California Edison. Dairy Farm Energy Management Guide: California; WSU Energy Program: Olympia, WA, USA, 2004. [Google Scholar]
  33. DeVries, T.J.; Vankova, M.; Veira, D.M.; Keyserlingk, M.A.G. Usage of Mechanical Brushes by Lactating Dairy Cows. J. Dairy Sci. 2007, 90, 2241–2245. [Google Scholar] [CrossRef] [PubMed]
  34. Grisso, R.D.; Kocher, M.F.; Vaughan, D.H. Predicting tractor fuel consumption. Appl. Eng. Agric. 2004, 20, 553–561. [Google Scholar] [CrossRef]
  35. Istituto Superiore per la Protezione e la Ricerca Ambientale. Produzione Termoelettrica ed Emissioni di CO2. Fonti Rinnovabili e Impianti Soggetti a ETS; ISPRA: Rome, Italy, 2011.
  36. ENEA. Inventario Annuale Delle Emissioni di Gas Serra su Scala Regionale, Le Emissioni di Anidride Carbonica dal Sistema Energetico; Rapporto 2010; ENEA: Kista, Sweden, 2010. [Google Scholar]
  37. Edens, W.C.; Pordesimo, L.O.; Wilhelm, L.R.; Burns, R.T. Energy Use Analysis of Major Milking Center Components at a Dairy Experiment Station. Appl. Eng. Agric. 2003, 19, 711–716. [Google Scholar] [CrossRef]
  38. By, P.; Wells, D.C.; Physics, D.O. Total Energy Indicators of Agricultural Sustainability: Dairy Farming Case Study; Technical Paper 2001/3; Ministry of Agriculture and Forestry: Wellington, New Zealand, 2001; ISBN 0-478-07968-0. ISSN 1171-4662.
  39. Battini, F.; Agostini, A.; Tabaglio, V.; Amaducci, S. Environmental impacts of different dairy farming systems in the Po Valley. J. Clean. Prod. 2016, 112, 91–102. [Google Scholar] [CrossRef]
  40. Rossi, P.; Gastaldo, A. Consumi energetici in allevamenti bovini da latte. Inf. Agrar. 2012, 3, 45–47. [Google Scholar]
  41. Kraatz, S. Energy intensity in livestock—Modeling of dairy farming systems in Germany. Agric. Syst. 2012, 110, 90–106. [Google Scholar] [CrossRef]
  42. Todde, G.; Murgia, L.; Caria, M.; Pazzona, A. A Comprehensive Energy Analysis and Related Carbon Footprint of Dairy Farms, Part 2: Investigation and Modeling of Indirect Energy Requirements. Energies 2018, 11, 451. [Google Scholar] [CrossRef]
  43. Gospel of Luke. Basis of Feed Value Calculations. 2018. Available online: https://portal.mtt.fi/portal/page/portal/Rehutaulukot/feed_tables_english (accessed on 20 January 2018).
Figure 1. Distribution of electricity requirements among on-farm operations.
Energies 11 00451 g001
Figure 2. Distribution of diesel fuel utilization among on-farm activities.
Energies 11 00451 g002
Figure 3. Diesel fuel consumption per cultivated crop and unit of crop harvested.
Energies 11 00451 g003
Figure 4. Distribution of GHG emissions from electricity (E) and diesel (D) to on-farm operations.
Energies 11 00451 g004
Table 1. Energy data summary on a yearly basis, averages and standard deviation (N = 285).
Energy SourcesAverageHeadLCHectaret FPCM
Diesel (kg)13,675 ± 15,085123 ± 156260 ± 235369 ± 35140 ± 56
Electricity (kWh)26,245 ± 42,479227 ± 107491 ± 242816 ± 108773 ± 48
LPG (kg)115 ± 5081 ± 52 ± 104 ± 150.4 ± 1.3
Primary Energy
Diesel (MJ)629,050 ± 693,9105568 ± 717611,960 ± 10,81016,974 ± 16,1461840 ± 2576
Electricity (MJ)238,042 ± 385,2852059 ± 9704453 ± 21957401 ± 9859662 ± 435
LPG (MJ)5819 ± 25,70551 ± 253101 ± 506202 ± 75920 ± 66
Total Energy (MJ)872,911 ± 1,104,9007678 ± 839916,514 ± 13,51124,577 ± 26,7642522 ± 3077
Table 2. Emission data summary on a yearly basis, averages and standard deviation (N = 285).
Energy SourceAverageHeadLCHectaret FPCM
Diesel (kg CO2-eq)43,076 ± 47,519387 ± 492819 ± 7391162 ± 1104125 ± 177
Electricity (kg CO2-eq)10,768 ± 17,42993 ± 44201 ± 99335 ± 44630 ± 20
LPG (kg CO2-eq)314 ± 14253 ± 137 ± 2910 ± 421 ± 4
Total emissions (kg CO2-eq)54,158 ± 61,380483 ± 4961027 ± 7611507 ± 1393156 ± 182
Table 3. Primary energy consumption and carbon dioxide emissions on a yearly basis, averages and standard deviation for herd size classes (N = 285).
Herd Size Class (N Heads)<5050–100101–200>200
Farms (n)661007544
Heads (n)33 ± 1171 ± 15142 ± 28371 ± 219
Lactating cows (n)16 ± 734 ± 965 ± 16164 ± 95
Farm milk production (t FPCM)93 ± 48241 ± 99578 ± 1991543 ± 902
Milk yield (kg LC−1)6139 ± 26427039 ± 20158896 ± 19959494 ± 1699
Cultivated land (ha)20 ± 1329 ± 1645 ± 2990 ± 56
LPG (kg)32 ± 10899 ± 376112 ± 318243 ± 1041
LPG (MJ)1619 ± 54655009 ± 19,0265667 ± 16,09112,296 ± 52,675
LPG (kg CO2-eq)93 ± 311285 ± 1079323 ± 912698 ± 2989
Diesel (kg)4296 ± 37248244 ± 654415,339 ± 895037,251 ± 21,642
Diesel (kg head−1)130 ± 94118 ± 94106 ± 48102 ± 30
Diesel (MJ)197,616 ± 171,304379,224 ± 301,024705,594 ± 411,7001,713,546 ± 995,532
Diesel (kg CO2-eq)13,533 ± 11,73225,968 ± 20,61548,316 ± 28,194117,339 ± 68,174
Electricity (kWh)9709 ± 532515,894 ± 729026,799 ± 884973,627 ± 93,013
Electricity (kWh head−1)300 ± 139 225 ± 93191 ± 63180 ± 85
Electricity (MJ)88,061 ± 48,298144,159 ± 66,120243,067 ± 80,260667,798 ± 843,628
Electricity (kg CO2-eq)3984 ± 21856521 ± 299110,996 ± 363130,209 ± 38,163
Total MJ·100 kg FPCM−1381 ± 434256 ± 240180 ± 112159 ± 62
Total MJ·head−18.760 ± 4.7037.541 ± 4.4836.642 ± 2.3546.382 ± 1.506
Total kg CO2-eq·head−1536 ± 311468 ± 303414 ± 157399 ± 97
Total kg CO2-eq 100 kg FPCM−124 ± 3016 ± 1611 ± 710 ± 4
Table 4. Primary energy consumption and carbon dioxide emissions on a yearly basis, averages and standard deviation for milk yield classes (N = 285).
Milk Yield Class (kg·LC−1)<50005000–70007000–9000>9000
Farms (n)40728885
Heads (n)55 ± 3587 ± 95131 ± 176191 ± 140
Lactating cows (n)26 ± 1741 ± 4659 ± 7486 ± 63
Milk production (t)94 ± 50255 ± 298488 ± 646899 ± 670
Milk yield (kg LC−1)3762 ± 8356091 ± 5798094 ± 60410,501 ± 1371
Land (ha)29 ± 2630 ± 2940 ± 3955 ± 40
LPG (kg)49 ± 14277 ± 306189 ± 80883 ± 242
LPG (MJ)2479 ± 71853896 ± 15,4849563 ± 40,8854200 ± 12,245
LPG (kg CO2-eq)140 ± 407222 ± 879543 ± 2320238 ± 696
Diesel (kg)7902 ± 92038910 ± 986213,666 ± 17,73120,437 ± 15,512
Diesel (MJ)363,492 ± 423,338409,860 ± 453,652628,636 ± 815,626940,102 ± 713,552
Diesel (kg CO2-eq)24,891 ± 28,98828,067 ± 31,06643,048 ± 55,85464,376 ± 48,864
Electricity (kWh)10,640 ± 5,43120,384 ± 23,31729,782 ± 67,71834,891 ± 25,376
Electricity (MJ)96,505 ± 49,259184,883 ± 211,485270,123 ± 614,202316,461 ± 230,160
Electricity (kg CO2-eq)4366 ± 22288364 ± 956712,220 ± 27,78514,316 ± 10,412
Total MJ 100 kg FPCM−1559 ± 570266 ± 179189 ± 84155 ± 67
Total kg CO2-eq 100 kg FPCM−136 ± 3916 ± 1212 ± 610 ± 4

