1. Introduction
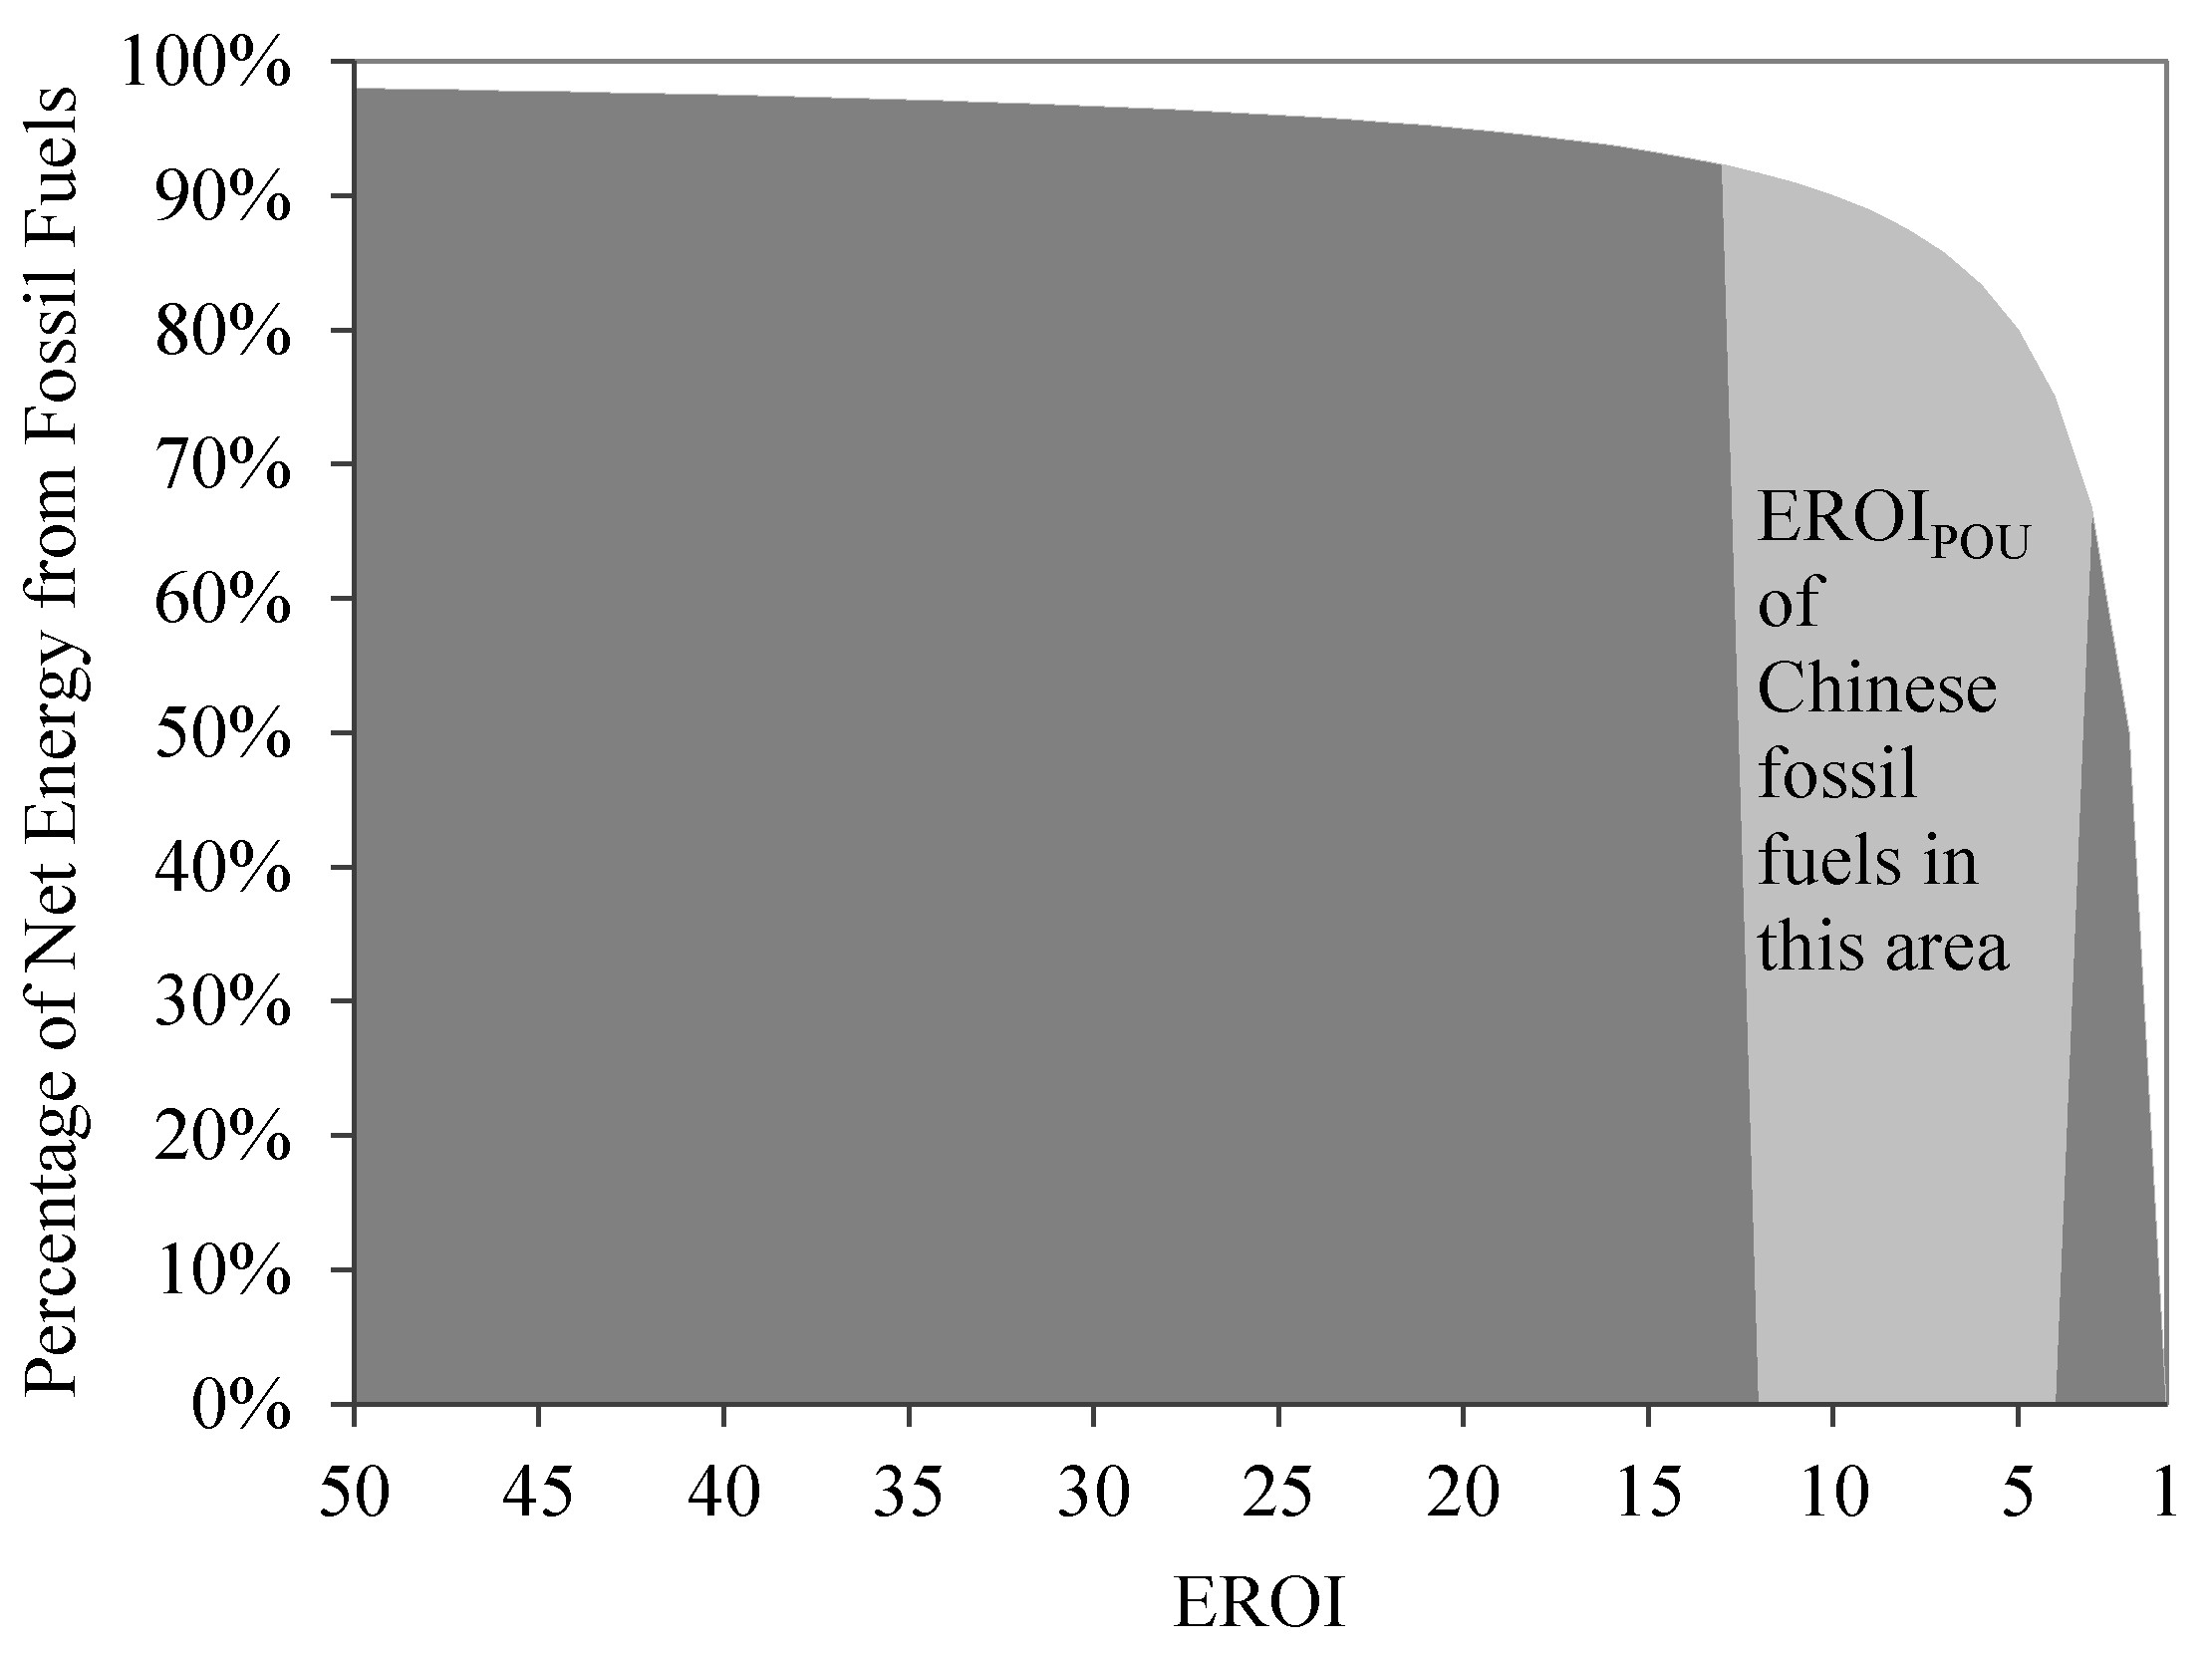
The most important role of energy systems is to provide sufficient energy to support the growth of society and the economic system. However, not all primary energy carriers can be delivered to the end user because energy-producing industries use energy during its production. For example, if producing ten units of energy requires the use of two units of energy, only eight units of energy are actually delivered to users. These remaining eight units are considered the net energy yields (NEY). Thus, NEY is defined as the energy produced minus the energy required to create that output. Given net energy is real energy consumed at final end, an approach that does not consider the energy required to create net energy cannot provide a proper assessment of energy consumed. Odum [
1] stated that in economic and social systems, net energy is the valued energy return on investment (EROI).
EROI is a concept that originated from ecology [
2]; it was implicit in Hall et al.’s [
3] study of the petroleum yield associated with a given amount of effort, although their study used the term net energy. Hall et al. [
3] and Cleveland et al. [
4] proposed the concept of EROI and defined it as the ratio of energy output to energy input in the energy production process. EROI links NEY and total primary energy supply (TPES); when EROI declines, the NEY of TPES declines as well. The greater that an energy source’s EROI is, the greater that the NEY are that it can provide to the rest of society to generate goods and services. In 1984, Cleveland et al. [
4] noted that the EROI value for a given energy source must be greater than 1:1 for its use to make sense in an economy; they also noted that fuels (or energy carriers) with higher EROI values play a greater economic role than do fuels (or energy carriers) with lower EROI values because of the importance of net fuel supply. Brand-Correa et al. [
5] calculated the national EROI for the UK for the period 1997–2012, and the results showed that national EROI in the UK decreased during the period (range of value: 13.8:1–5.6:1), indicating that 9.8% (on average) of the UK’s extracted/captured energy does not go into the economy or into society for productive or well-being purposes. Hall et al. [
6] found that the EROI of corn-based ethanol was approximately 3:1 at the mine mouth/farm gate. Lambert et al. [
7] identified the saturation point at which increases in per capita energy availability (greater than 150 GJ) and EROI (greater than 20:1) is not associated with further improvements to welfare as defined by the human welfare index. Wang et al. [
8] used the input-output table calculated EROI of oil sands, and the results showed that EROI of both mining oil sands (range of value: 3.9–8) and in situ oil sands (range of value: 3.2–5.4) displayed upward trend over the past 7 years. Wang et al. [
8] claimed that the low EROI of oil sand will would leads to more energy being consumed to extract one unit of energy output, and greater energy consumption leads to more emissions. Brandt et al. [
9] found the same result that decreasing EROI lead to climate impacts of oil extraction.
Calculating the EROI of the extraction or mining step only does not accurately describe the NEY of a specific fuel. If the EROI of extraction and mining is approximately 30:1, the EROI of the entire energy conversion chain could be less than 30:1 because long energy conversion chains require more direct and indirect inputs. In addition, many studies have calculated EROI values, but only a few can be compared. The definition of EROI is hampered by the same lack of consistent parameters as energy inputs and outputs calculations, sometimes making it very difficult to compare different results. Hall et al. [
6] published a study that calculated three different EROIs for the transportation system of the United States: standard, point of use, and extended EROIs. Hall et al. [
10] also introduced the concept of point-of-use EROI, which equals the ratio of the “energy return to society” to the “energy required to obtain and deliver that energy”. Murphy et al. [
11] further clarified the factors assessed in the EROI calculations in their study into the following categories [
10,
11]: standard EROI (EROI
ST), point-of-use EROI (EROI
POU), and extended EROI (EROI
EXT). Brandt et al. [
12] has provided additional boundary definition for measuring net energy, namely
α,
β,
γ,
δ and Ω. System boundary
β contains one energy production stage and one processing stage, constituting one production process with two stages (extraction and refining). System boundary
γ contains two productions with two stages. System boundary
δ contains all the productions with all stages and non-energy sectors. System boundary Ω contains all the physical flows for every energy and material transformation process, as well as all service provision processes. Comparing these two boundary definitions, the point of use EROI is similar to system boundary
δ.
China’s EROI has been the subject of a few studies. Kong et al. [
13] calculated the EROI of the Shenhua direct coal liquefaction project in China without Carbon Capture and Storage (CCS), the results of which indicated that, if the energy inputs for CCS technology are considered at the plant level, the EROI is less than 1:1. Another study by Kong et al. [
14] calculated the EROI for the Datang coal gasification project; the results of their study showed that imported natural gas generally had a higher EROI than coal-based synthetic natural gas, even when environmental inputs were not considered. Hu et al. [
15] and Xu et al. [
16] calculated the EROI
ST (standard EROI) of the Daqing oilfield, which is China’s largest oilfield. Hu et al.’s results showed that the EROI
ST for the Daqing oilfield was 10:1 in 2001 but declined to 6.5:1 in 2009 and was projected to decrease further to 4.7:1 in 2015. Xu et al.’s [
16] results revealed that Daqing’s EROI would decline to 2.9, and its monetary return on investment (MROI) will decline to 1.8 by 2025. Although these researchers’ analyses resulted in different EROI values, the EROI
ST and net energy trends suggest that the Daqing oilfield will likely face various issues in the future. However, while the above four studies calculated the EROI
ST values of projects or oil fields, they might not be representative of China as a whole. Another study by Hu et al. [
17] calculated and forecasted the EROI
ST of China’s conventional fossil fuels and found that the net energy produced will likely increase until approximately 2020 and then will decline after 2020, likely because the EROI
ST of China’s fossil fuels is projected to continue to decrease.
Some of these studies focused on the EROI
ST analysis, while others studied a specific oil field or project. All these studies concluded that the EROI
ST of China’s fossil fuels is low and decreasing compared to those of most other nations. However, energy supply is associated with numerous sources, and energy conversion chains (not only in China) have become increasingly long and complex. Thus, the energy inputs actually required to produce energy are not only associated with energy extraction or an individual project, but they include the inputs of delivering energy in a usable form and, in some cases, even the inputs associated with its use [
6]. If we use EROI as determined previously to replace the EROI of the whole fossil fuels industry in China, EROI will become seriously overvalued.
Hall [
18] provided the following description:
“A reasonable question is what would be the EROI of a fuel at the point where it is used, since there may be very different efficiencies for different fuels between the source and the point at which it is used. Unfortunately, such studies are rare, and we must remember to always start with a source of energy from nature. Otherwise we are just determining internal efficiencies, not EROI.”
EROIPOU is an expanded analysis that considers the energy required not only to extract energy but also to deliver a unit of energy. It is a more comprehensive EROI that includes direct and indirect energy inputs in the steps of producing, processing, purchasing and delivering energy. When we calculate EROIPOU in this study, we assume that the indirect energy inputs are not only used to create a piece of equipment but also to transport and process the energy. In other words, indirect energy inputs are accrued at each point in the conversion chain. From the perspective of the energy conversion chain, energy is involved in many processes before it can be used within the economic system. From the perspective of the macroscopic energy economy, the ability of the entire energy industry to meet the net energy needs of the economy is embodied in the concept of EROI. Thus, the EROI must cover the entire energy conversion chain, which is why EROIPOU is used.
This study aims to build a model to calculate the EROIPOU of conventional fossil fuels in China and to identify the mathematical relationship between NEY and EROIPOU. Using a simulated EROIPOU dynamic function, we further aim to predict the impacts of a decline in the EROIPOU from China’s NEY from 2016 to 2030.
2. Material and Methods
2.1. Modeling the Point-of-Use EROI
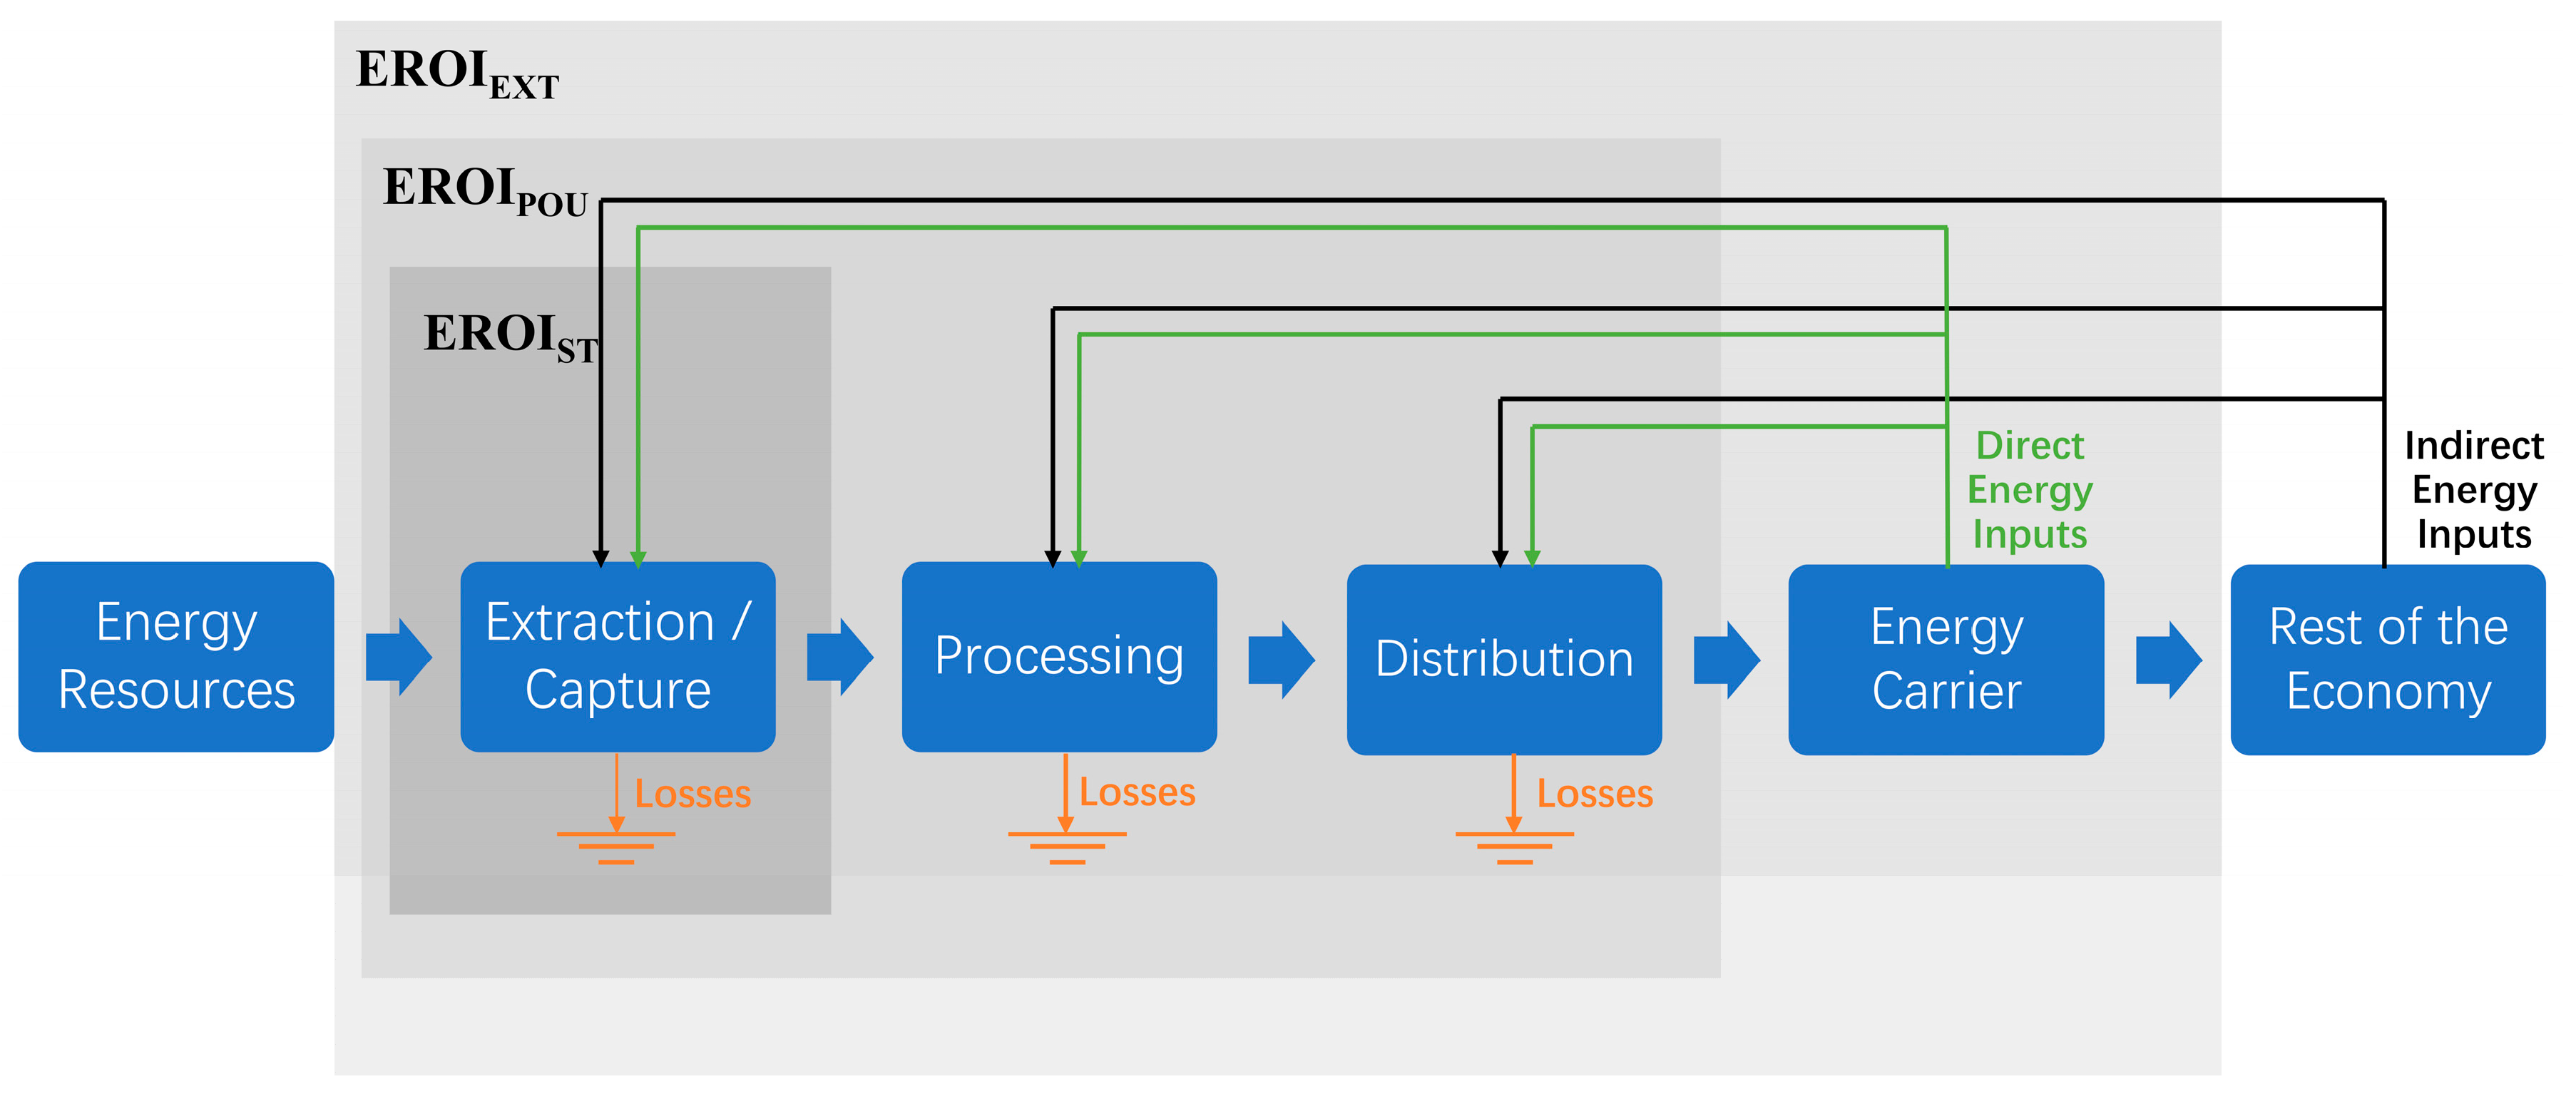
Net energy yields are associated not only with exploitation and extraction but also with the entire energy conversion chain that delivers useful net energy to a location where it is used to generate economic goods and services, which is also the case for EROI. In recent years, significant research has been performed on EROI, but these studies have tended not to be comparable with one another because the difference between the boundaries are the most important and most easily overlooked variable (see
Figure 1).
Coughlin [
19] defined the full fuel cycle (FFC) metric, which considers the complete energy production chain and estimates the total energy required to deliver one unit of energy to a point of use. One of the benefits of this approach is that it provides a clear definition of what must to be calculated, i.e., the direct and indirect energy inputs, without overlooking the details of the entire energy production chain. Coughlin provided an example calculation of the multiplier
μ (only one fuel, which supplies all of the energy used in the economy, so
μ is the ratio of total production to total final consumption:
. ). We utilized the FFC concept to calculate the EROI
POU of fossil fuels in China from 1996 to 2015. Most long-term data come from the International Energy Agency (IEA) [
20] as estimates of the direct energy consumed by the energy industry to produce energy.
Our calculations vary slightly from those in the original FFC metric. First, Coughlin indirectly calculated the EROI for natural gas only; however, we calculated the EROIPOU of coal, oil and natural gas directly. Second, Coughlin did not calculate the indirect energy inputs, such as the energy inputs (or monetary inputs) associated with importing energy; however, we included these inputs for all fossil fuels.
Net energy equals energy outputs minus energy inputs. In this case, the baseline variables include
F (primary energy carrier),
N (the net energy used by the economic system, or NEY),
C (the direct and indirect energy inputs required to obtain
N), and
L (the energy losses during energy production and processing). The net energy that can be used by the economic system is as follows:
where the variable “
i” represents a specific fossil fuel production and processing chain, and “
n” represents the total number of energy production and processing chain stages for a specific fossil fuel. However, in reality, energy comes from different fossil fuels, including coal, oil and natural gas, and these fuels are processed differently; thus, the production and processing chains require energy inputs and involve inevitable losses. If we extend the energy inputs of fossil fuels from the wellhead or mine mouth to the final consumer, the energy inputs increase, and the EROI decreases compared to the energy inputs of fossil fuels at the wellhead or mine mouth. Thus, EROI
POU can be defined as the ratio of the total energy production at the source less losses to the sum of all the energy inputs in each step of the production chain. Based on these definitions, EROI
POU can be expressed as follows.
The net energy from fossil fuels in China is
. Thus,
. represents the total amount of fossil fuels used by the entire economy. Additionally,
. represents the different types of energy inputs in different production and processing chain stages in the energy industry, and
. represents energy losses. The equation that provides the relationships among
F,
C and
N represents a simple expansion of Equations (1) and (2).
Equation (3) does both apply to one primary energy carrier and to all energy carriers. We didn’t count energy losses as energy inputs and outputs when we calculated EROI
POU. We realized that energy losses are not energy inputs because these losses cannot provide energy profits to a society [
10]. Energy outputs also should get rid of energy losses because the economy cannot utilize this energy.
In this analysis, the units of direct and indirect energy inputs are million tons of oil equivalents (mtoe, 1 mtoe = 4.1816 × 10
16 joules) which were used in this study. The direct energy inputs can be classified into two categories: the energy consumed by transportation; and the energy industry’s own use. King et al. [
21] used energy industry’s own use (EIOU) data from the International Energy Agency (IEA) [
20] as an estimate of the energy directly consumed by the energy industry to produce energy, i.e., the consumption of oil or gas to produce the same. Based on the definition of EIOU from the IEA, EIOU includes the primary and secondary energy consumed by transformation industries for heating, pumping, traction, and lighting purposes. Following this idea, we use EIOU data from the IEA to calculate direct energy inputs into China’s energy industry from 1996 to 2015.
Indirect energy input is the energy required to produce materials and infrastructure. These values can be derived from financial costs that can be translated into energy costs using energy intensities (i.e., energy used per monetary unit for that type of activity and measured in megajoules/monetary unit) [
10,
22]. This relationship is generally used to derive the indirect inputs at each step. In this study, the indirect energy inputs consist of two parts: money spent for imported fuels and money investment in energy industry.
All these direct and indirect energy inputs are required to produce net energy, i.e., they can be considered energy inputs during energy conversion steps. The details of the EROI
POU calculations are summarized in
Table 1, and the data set for all the years are provided in
Appendix A (
Table A1,
Table A2 and
Table A3).
2.2. Forecasting Point-of-Use EROI for Fossil Fuels in China
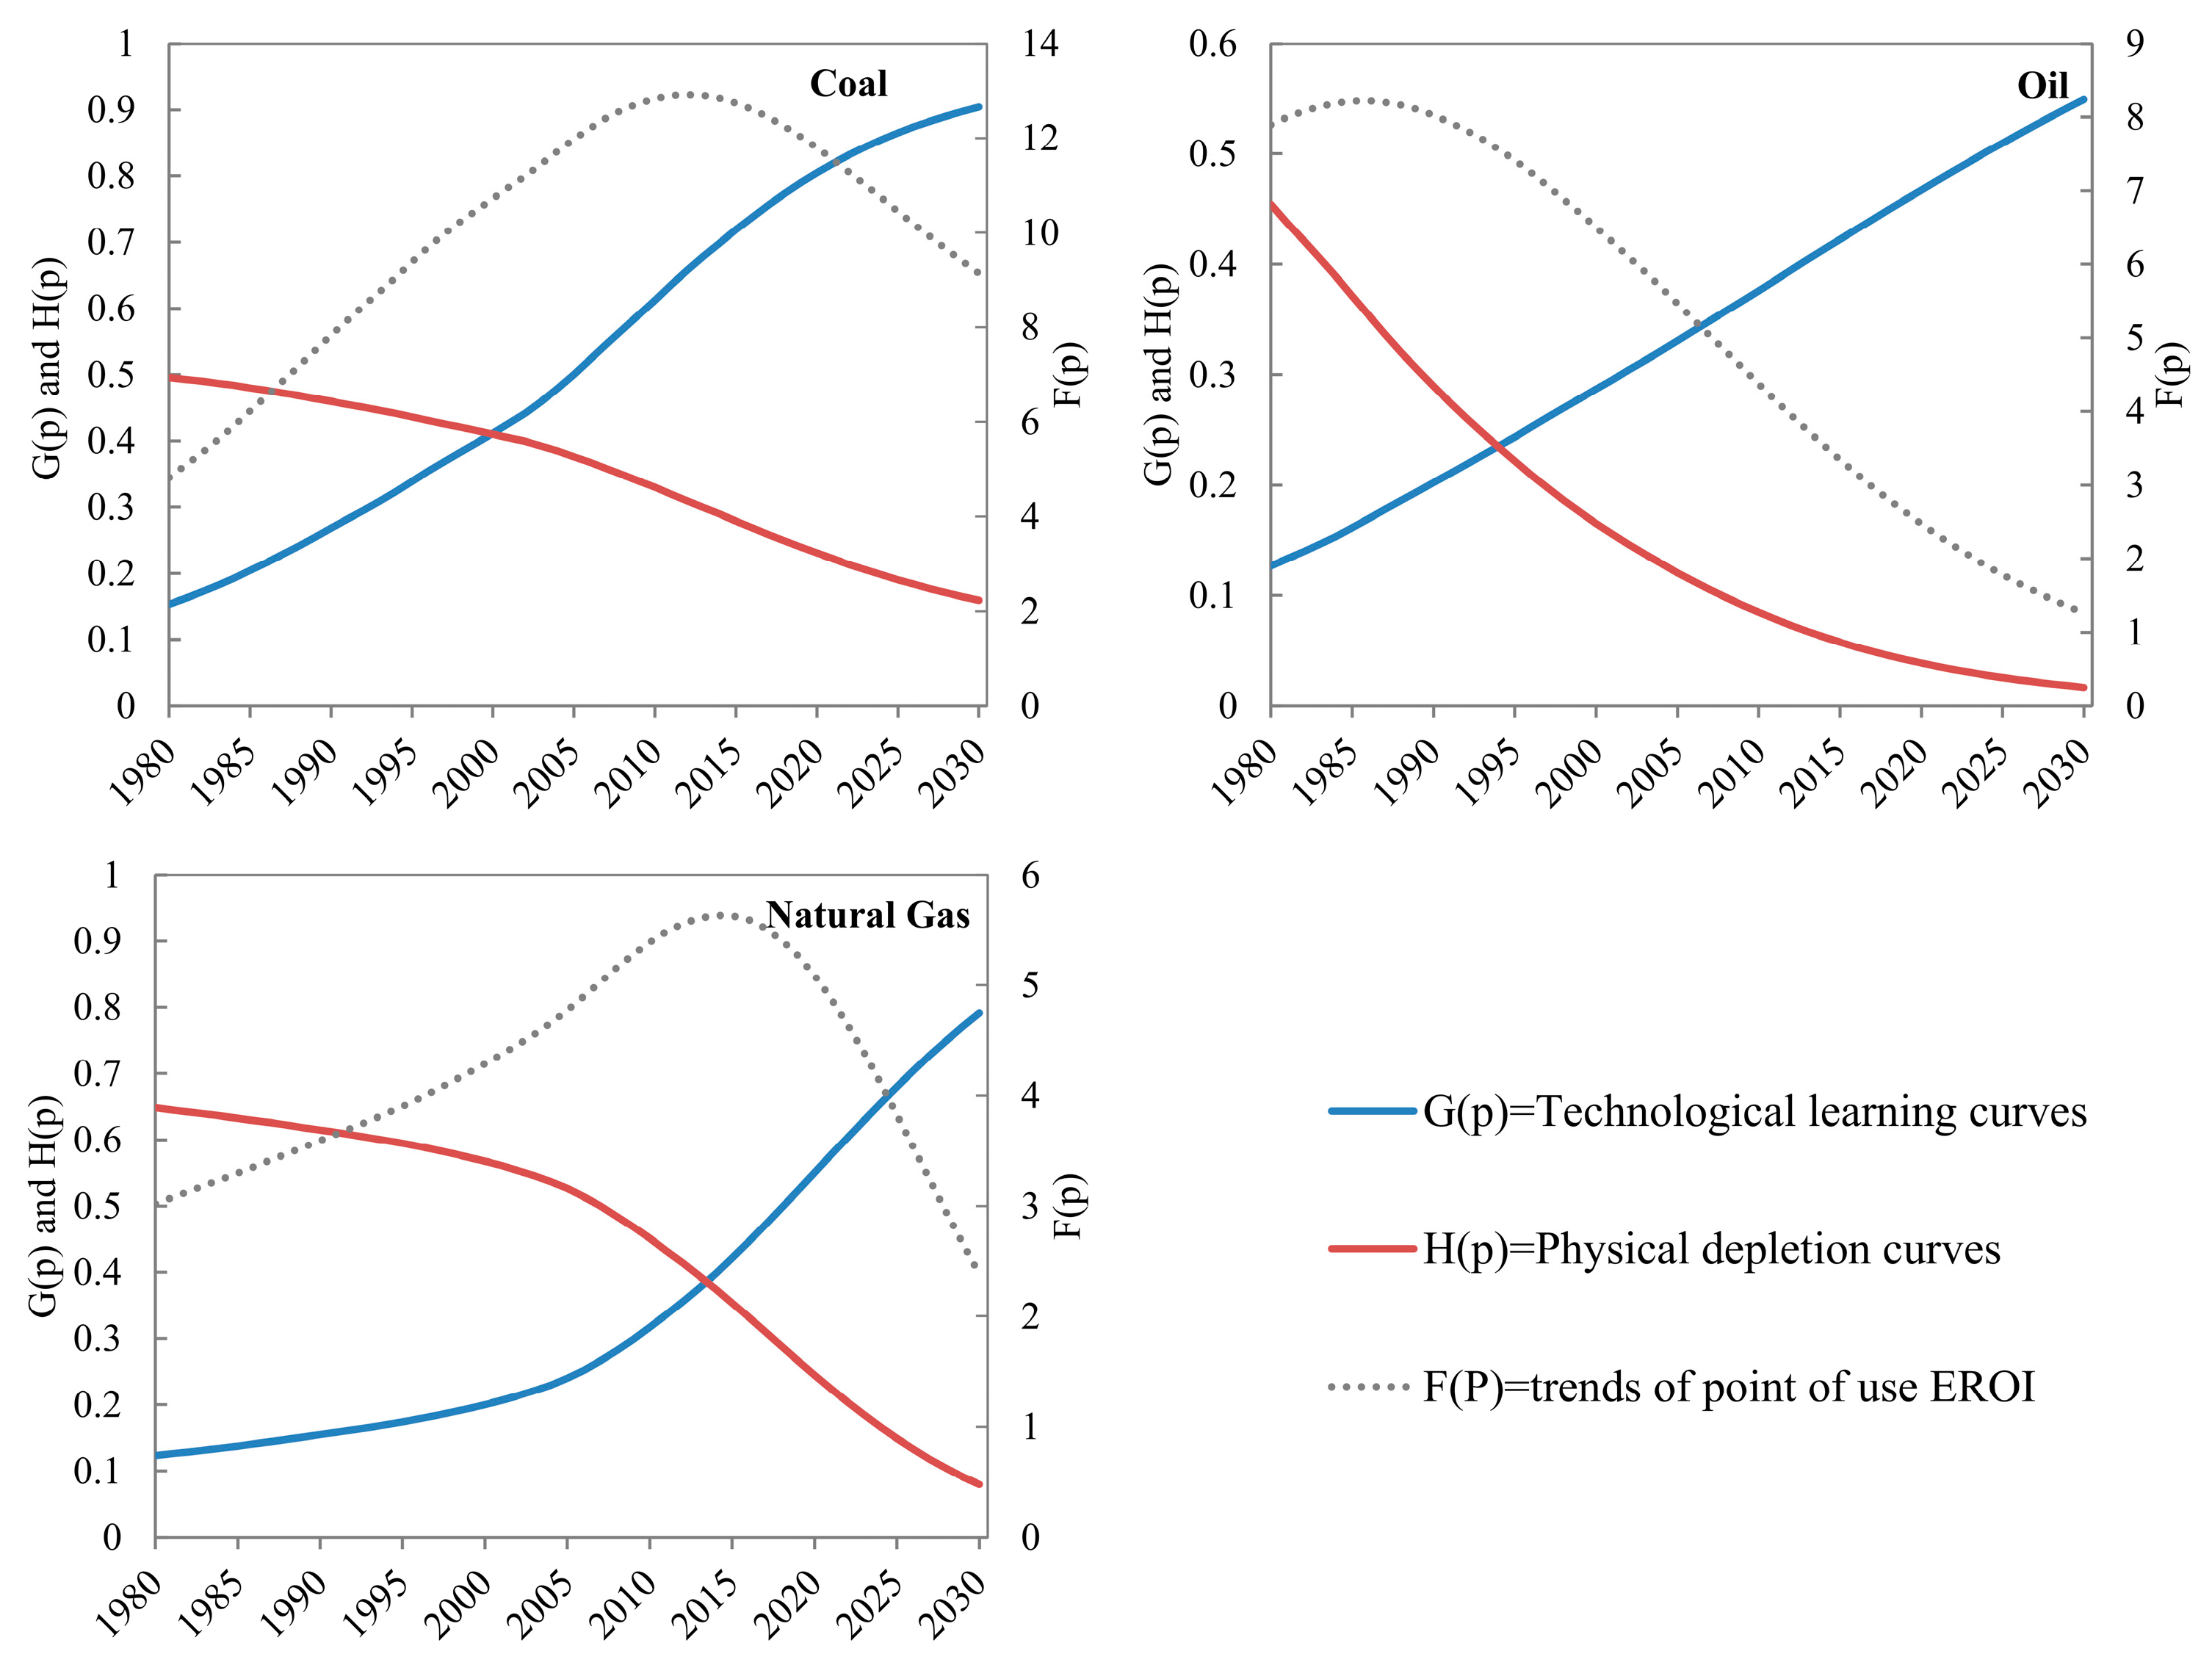
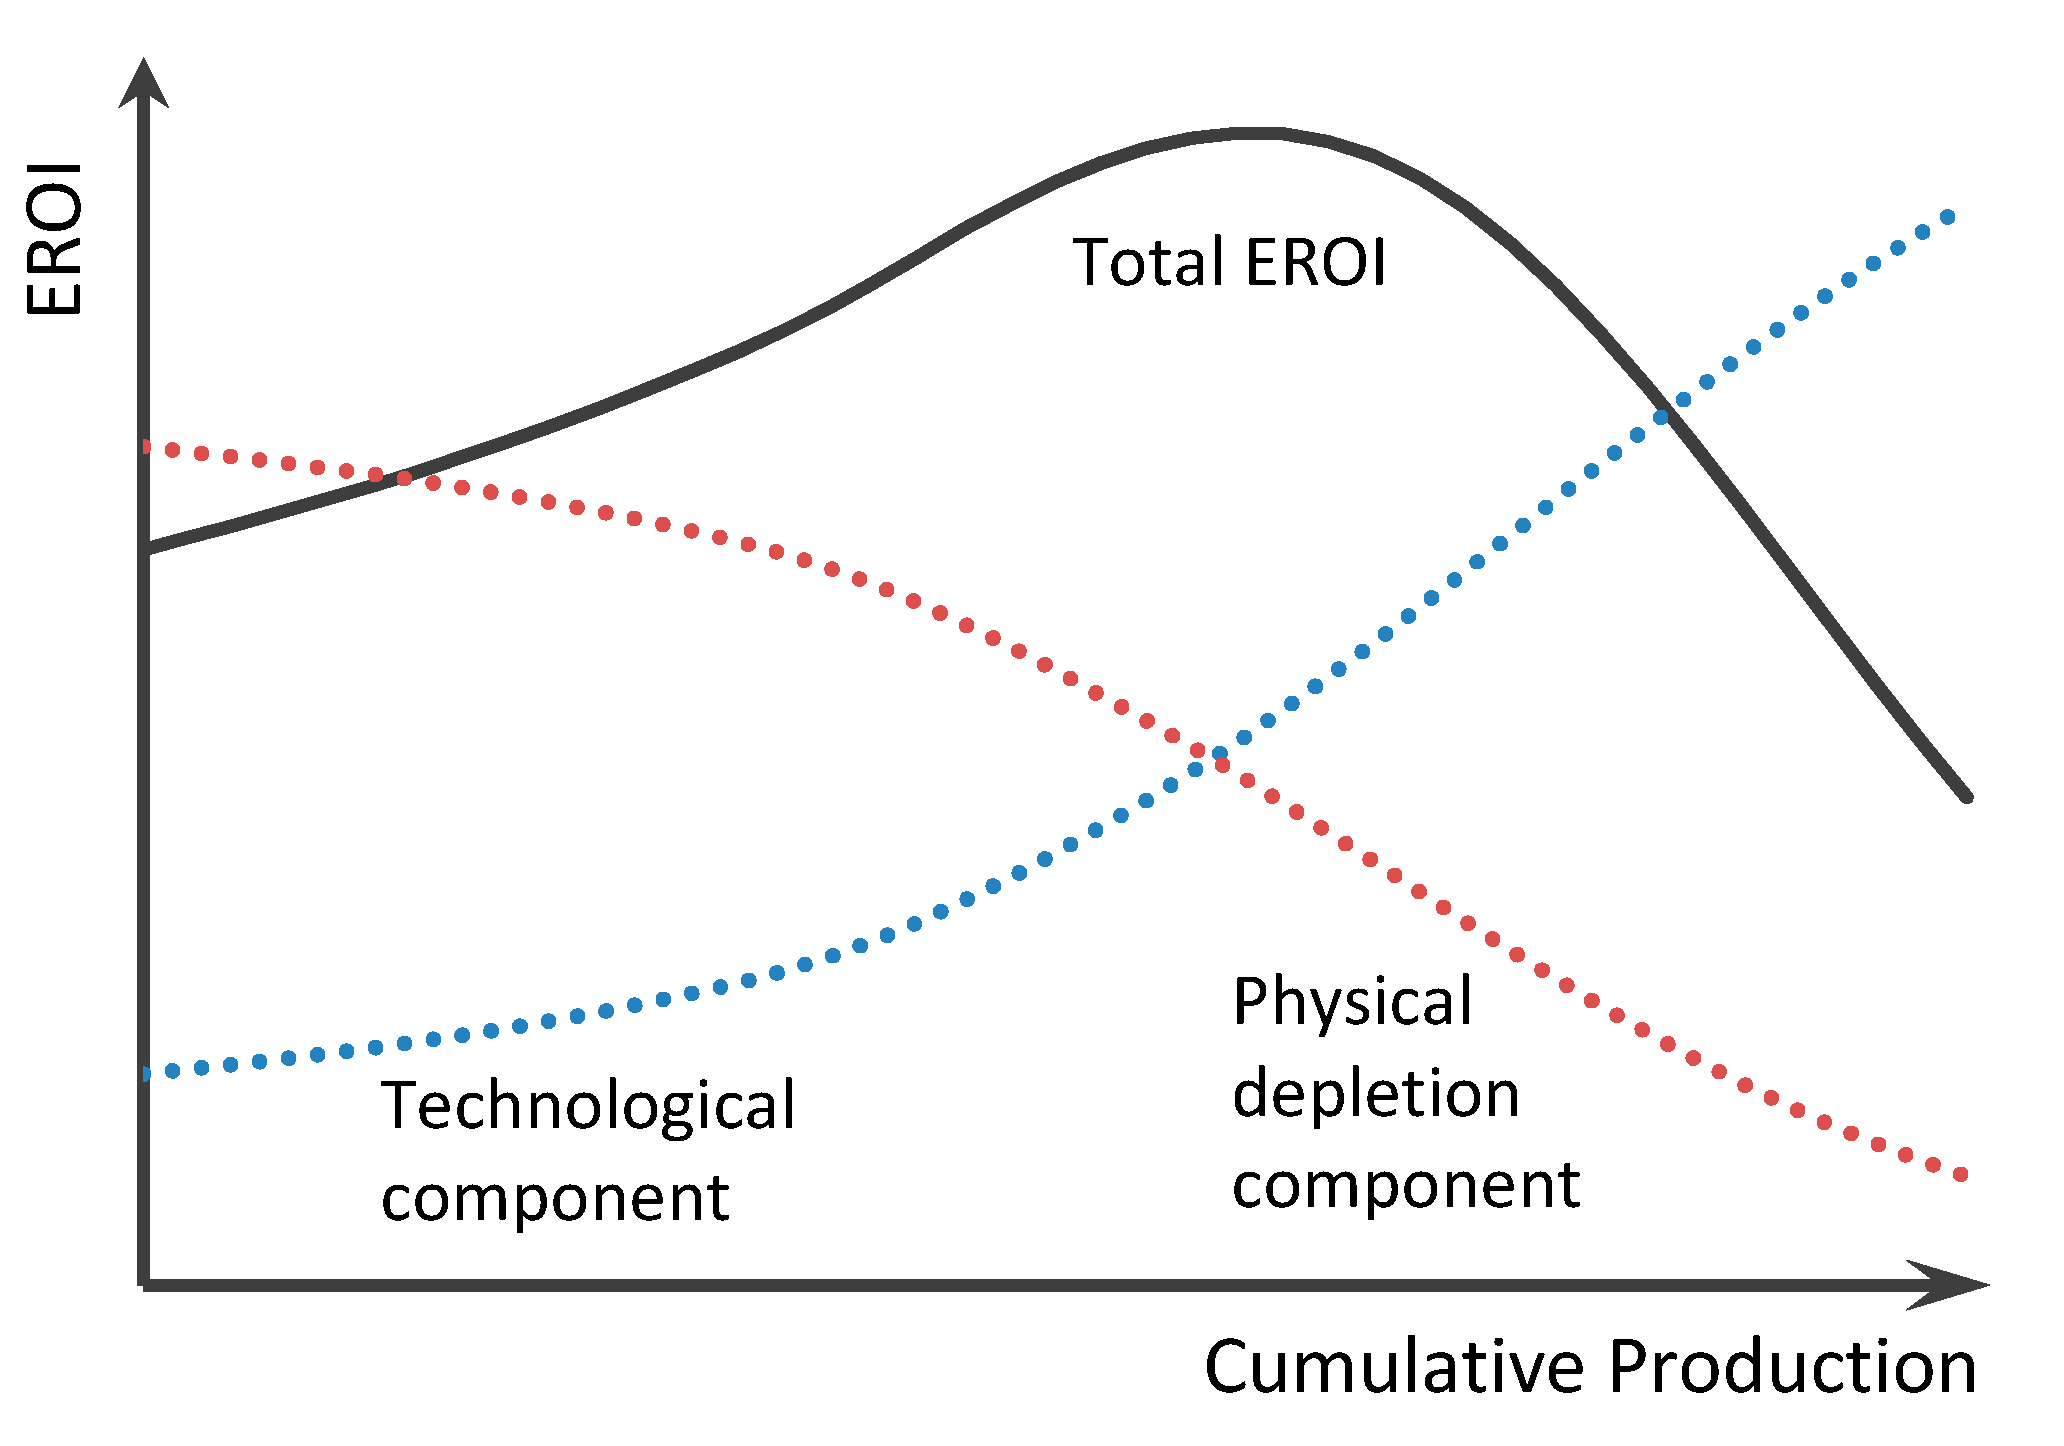
Dale et al. [
23] proposed a dynamic equation to describe the EROI of a given energy resource as a function of its cumulative production. In this function, the EROI of a resource initially increases before reaching some point of production, Pmax, at which point the energy return reaches its maximum value and begins to decline, eventually dropping to less than the break-even limit represented by an EROI value of 1:1. This curve is applicable to all non-renewable energy.
According to Dale et al. [
23] assumption, two factors influence this EROI function: technology and physical depletion (see
Figure 2). Assume this EROI function is a product of two components: one is technological,
G(
p), and serves to increase energy returns as a function of cumulative resource production (which is a proxy measure of experience, i.e., technological learning); and the other,
H(
p), represents diminishing energy returns due to declining physical resource quality. At the regional level, some fields might have lower returns. However, the aggregation of many peaking functions will yield a global peaking function, which can be separated into these two components. The function
f(
p) can be represented along with the two components:
where
. is a scaling factor that increases the EROI, and
p is cumulative production normalized to the size of the ultimately recoverable resource (URR), representing cumulative production divided by URR.
Technology increases are subject to diminishing marginal return processes and approach fundamental theoretical limits. Thus, technology component can be expressed as follows:
where 0 <
1. Here,
. represents the initial value of the immature technology and
. represents the rate of technological learning through experience, which will depend on a number of social and physical factors.
The physical resource component of the EROI function is assumed to decrease to an asymptotic limit as a function of production. We assume that this decline in EROI,
, will follow an exponential curve decay:
where 0 <
1. Here,
. represents the potential EROI value of the virgin resource, assuming an optimal production technology; and
. represents the exploitation source.
Best-fit values for the parameters were found using a residual sum of squares minimization procedure; factors were weighted to represent the historical EROI estimates [
4,
24] for the production of conventional oil, gas and coal in China. Fitted lines are shown in
Figure 3 and
Figure 4 based on EROI
POU in this study. Parameters in Equations (4)–(6) are shown in
Table 2.
2.3. Data Sources for Calculating EROIPOU
The data associated with total primary energy supply (TPES), the energy industry’s own use in mines, and extraction and processing (refineries and other transformation) energy losses in China were obtained from the IEA Energy Balances from 1996 to 2015. Losses include losses from gas distribution, transformation and transport.
We derived the indirect energy inputs (fossil fuel imports) by multiplying inputs by what we believe are appropriate energy intensity factors because economic data do not account for energy factors. The energy intensity associated with capital and materials is measured by the quantity of energy used to produce a dollar’s worth of output in the industrial sector of the economy [
17]. These data include the monetary inputs of non-energy materials purchased by the industrial sector. The IEA calculated this value as TPES/GDP (toe/thousands 2010 USD), and we use these data as well.
Two difficulties in obtaining continuous and accurate energy inputs data in this study. First, data associated with the cost of natural gas imports are difficult to obtain. Due to the diversity of imported natural gas sources (China imports LNG and pipeline gas from different countries) and the price of natural gas imports not regularly changing with international market prices (China mainly uses long-term contracts and take-or-pay contracts to import natural gas), the National Bureau of Statistics only calculates and release the cost of coal and oil imports. Nevertheless, these data play an important role that cannot be ignored in this article. We can use TPES/GDP to convert these costs into indirect energy inputs because they are related to energy, regardless of how many of these data have a significant impact on the final results. Furthermore, maintaining the integrity of the parameters has a significant impact on the analysis of the results. Second, the data associated with the energy consumed by the transportation of fossil fuels are difficult to obtain. Most of China’s fossil energy reserves are located in western China but consumed in northern central and eastern China and therefore must be transported long distances. However, these data are difficult to collect, primarily because transportation of fuels is decentralized and the modes of transportation are diverse (road, rail and pipeline transportation).
In this study, the indirect energy inputs consist of two parts: the cost of imported fuels and investment in energy industry. The data on investment in the energy industry come from China’s Energy Statistical Yearbook. The costs of oil and coal imports can be obtained directly from the National Bureau of Statistics website; however, the cost of natural gas imports cannot be directly obtained. Given this situation, we collected information, official news and reports from the website to estimate these values (including pipeline gas imports and LNG imports). The costs of natural gas, oil and coal imports are listed in
Table 3. The data on investment in the energy industry already transformed to indirect energy inputs are shown in row
C6 of
Appendix A (
Table A1,
Table A2 and
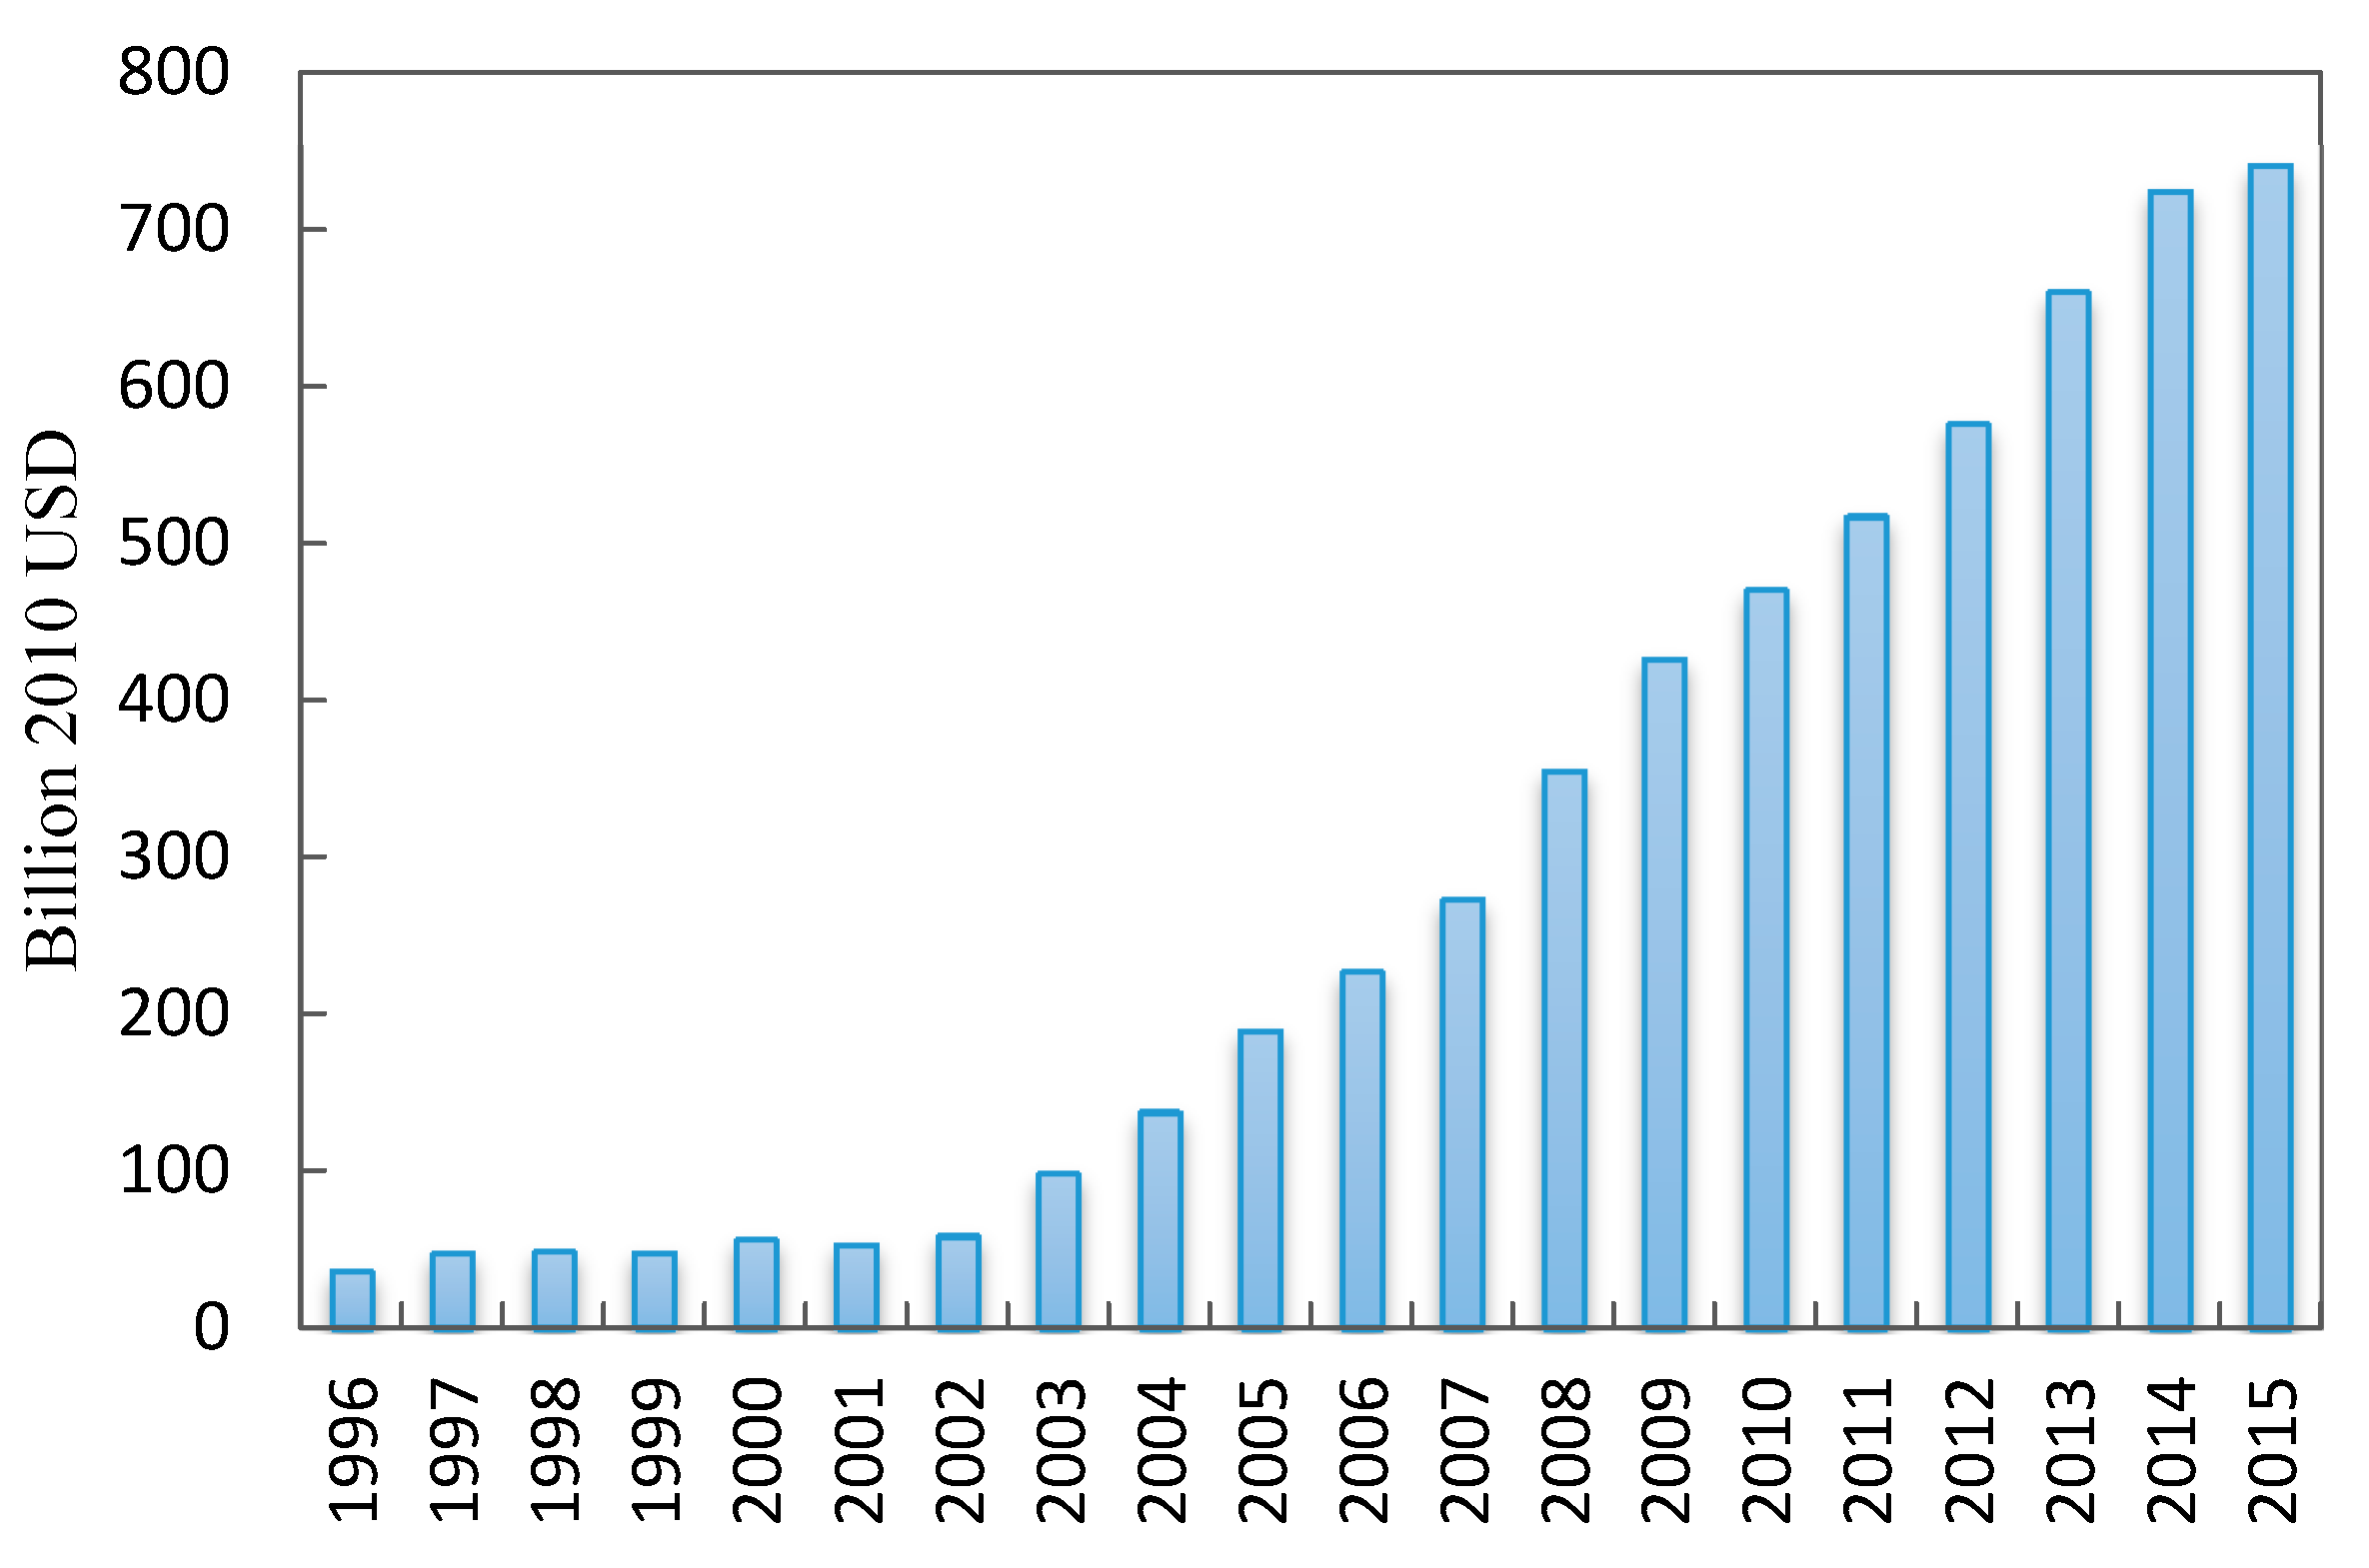
Table A3), and investment in the energy industry already includes the energy infrastructure construction, for example, regasification terminals for importing LNG, pipelines for importing oil and gas, etc. With the increase of China’s energy consumption, investment is becoming increasingly prominent role in energy industry (see
Figure 3).
To be clear, the imported LNG cost underwent massive increase from 2005 to 2006 (see
Table 3). One reason for this data jump is that the natural gas price increased even more rapidly after 2005 [
25,
26]. Another reason is that China’s importing of large LNG started in 2006. First, the LNG regasification terminal in Guangdong (province of China) was completed in 2006 and opened the window of China’s natural gas market onto the international market [
27]. Australia’s first shipment of LNG to China was achieved in 2006. China’s LNG imports have grown from 0.66 million cubic meters in 2005 to more than 935 million cubic meters in 2006. Further, there is a similar problem in imported pipeline gas costs from 2009 to 2010, mainly because China started importing pipeline natural gas in 2009 to meet an increase in demand. The first pipeline for imports of natural gas was the second West-to-East gas pipeline, which was constructed in 2009. In recent years, natural gas consumption of China is rising rapidly. This increase is a result of China’s pursuit of a national energy strategy that boosts natural gas consumption to diversify its energy mix and to reduce greenhouse gas pollution. For these reasons, China accelerates the construction of natural gas pipelines, which will ship natural gas from central Asia and Russia to China.
Additionally, we utilized a GDP deflator and exchange rate to change all the data from current United States dollar (USD) to 2010 USD. For example, the unit in
Table 3 is current USD but is transformed into 2010 USD by a GDP deflater when calculating EROI
POU. The GDP deflator and exchange rate data are from the World Bank.
According to study of Mudge et al. [
28], transportation by train uses approximately 900 BTU/ton-mile, or 0.59 MJ per ton-kilometer; transportation by truck uses approximately 3400 BTU/ton-mile and 3.587 MJ per ton-mile, or 2.229 MJ per ton-kilometer; and transportation by fuel pipeline requires 500 BTU/ton-mile and 0.528 MJ per ton-mile, or 0.328 MJ per ton-kilometer. Freight traffic data from the China Statistical Yearbook [
29] and China Development Report [
30] reflect the movements of oil, natural gas and coal from ports, mines and oil fields to the point of use (see
Table 4). Thus, we can calculate the energy used in different processes. According to the China Statistical Yearbook and the China Energy Statistical Yearbook [
31], gas transport through pipelines is converted from volume to tonnage using the conversion ratio of 1000 cubic meters equal to one ton. Comparing
Table 3 with
Table 4, the data trend becomes even more confusing. Why do these massive data jumps of natural gas imports in
Table 3 not have an impact on the data about natural gas transportation in
Table 4? The reasonable interpretation is that the transportation data shown in
Table 4 are not only for imported natural gas but are also for domestic natural gas transportation.
The TPES of fossil fuels minus energy losses is considered the energy output in this study. The sum of the EIOU, energy consumed by transport and indirect monetary inputs is considered the total energy input.
2.4. Data Sources for EROIPOU Predictions
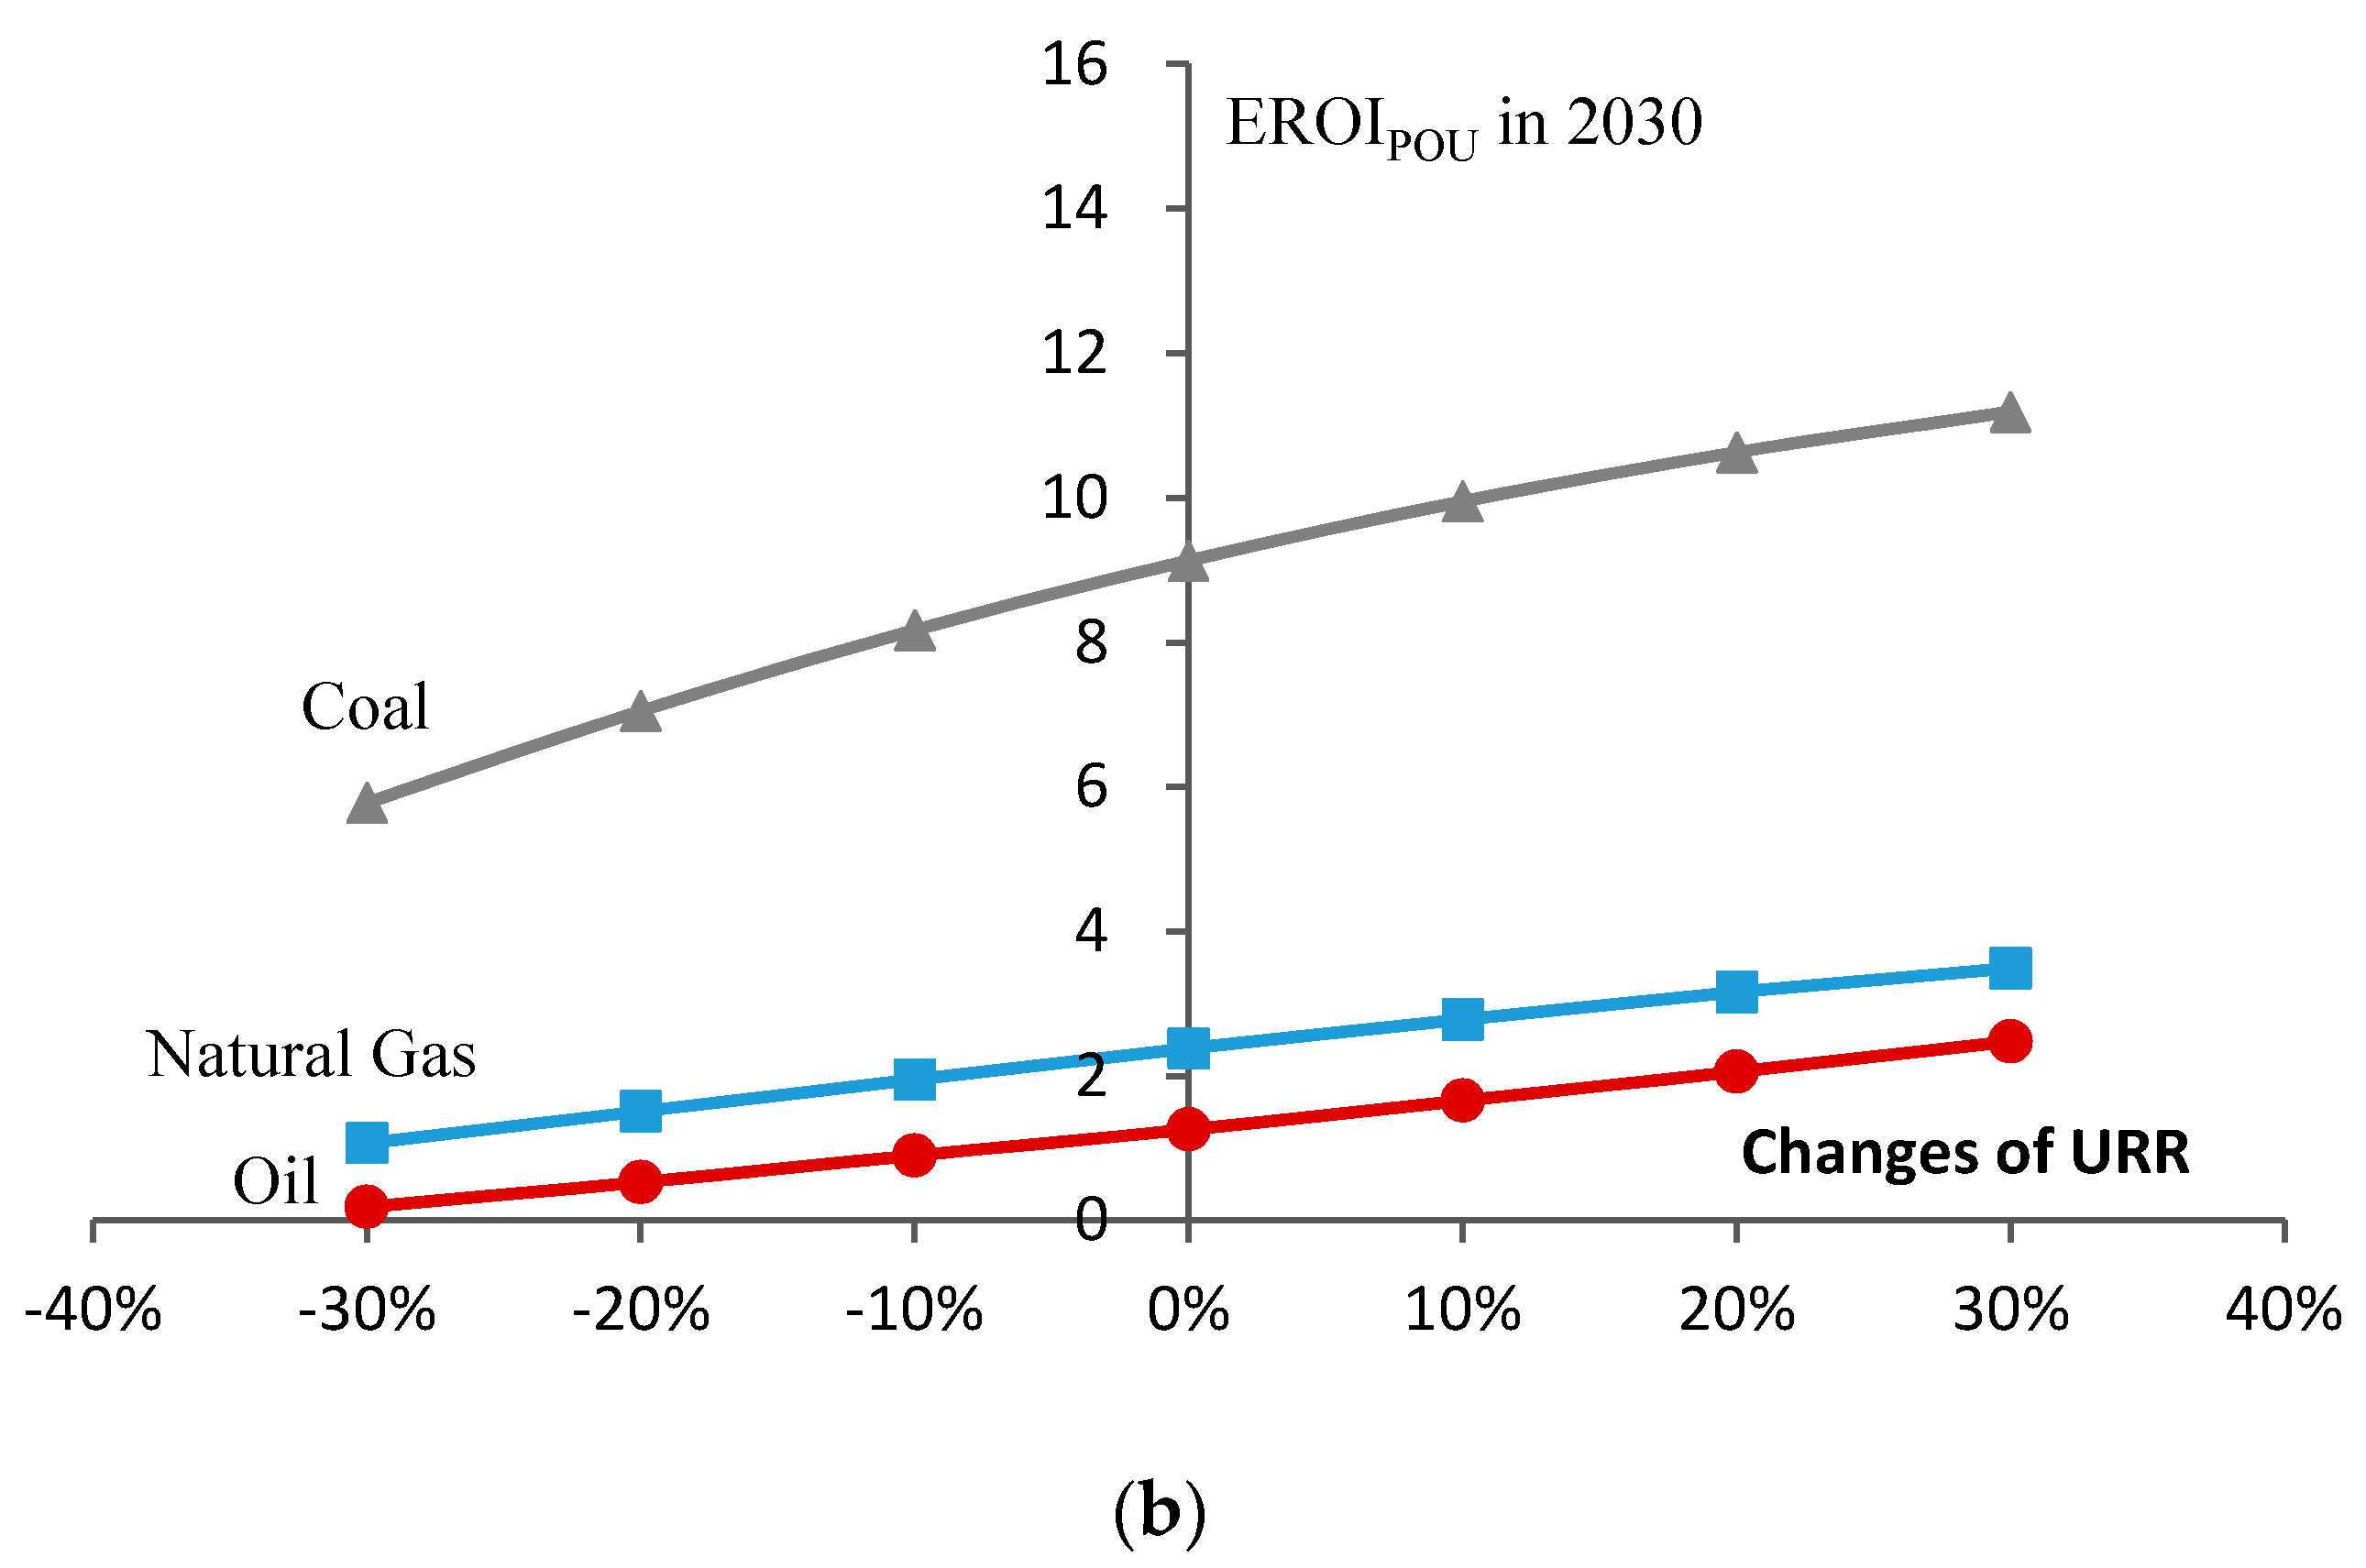
The dynamic function of the EROI is a product of two components: technological and physical depletion, both of which are functions of cumulative production. Dale et al. [
32] conjectured that EROI trends would decline after cumulative production equals one quarter of URR. Although this quantitative relationship is hard to prove because of the lack of long-term real data of EROI, it illustrates that EROI is a function of the cumulative production of a resource. This means that if we want to predict EROI, we must first predict the cumulative production of fossil fuels.
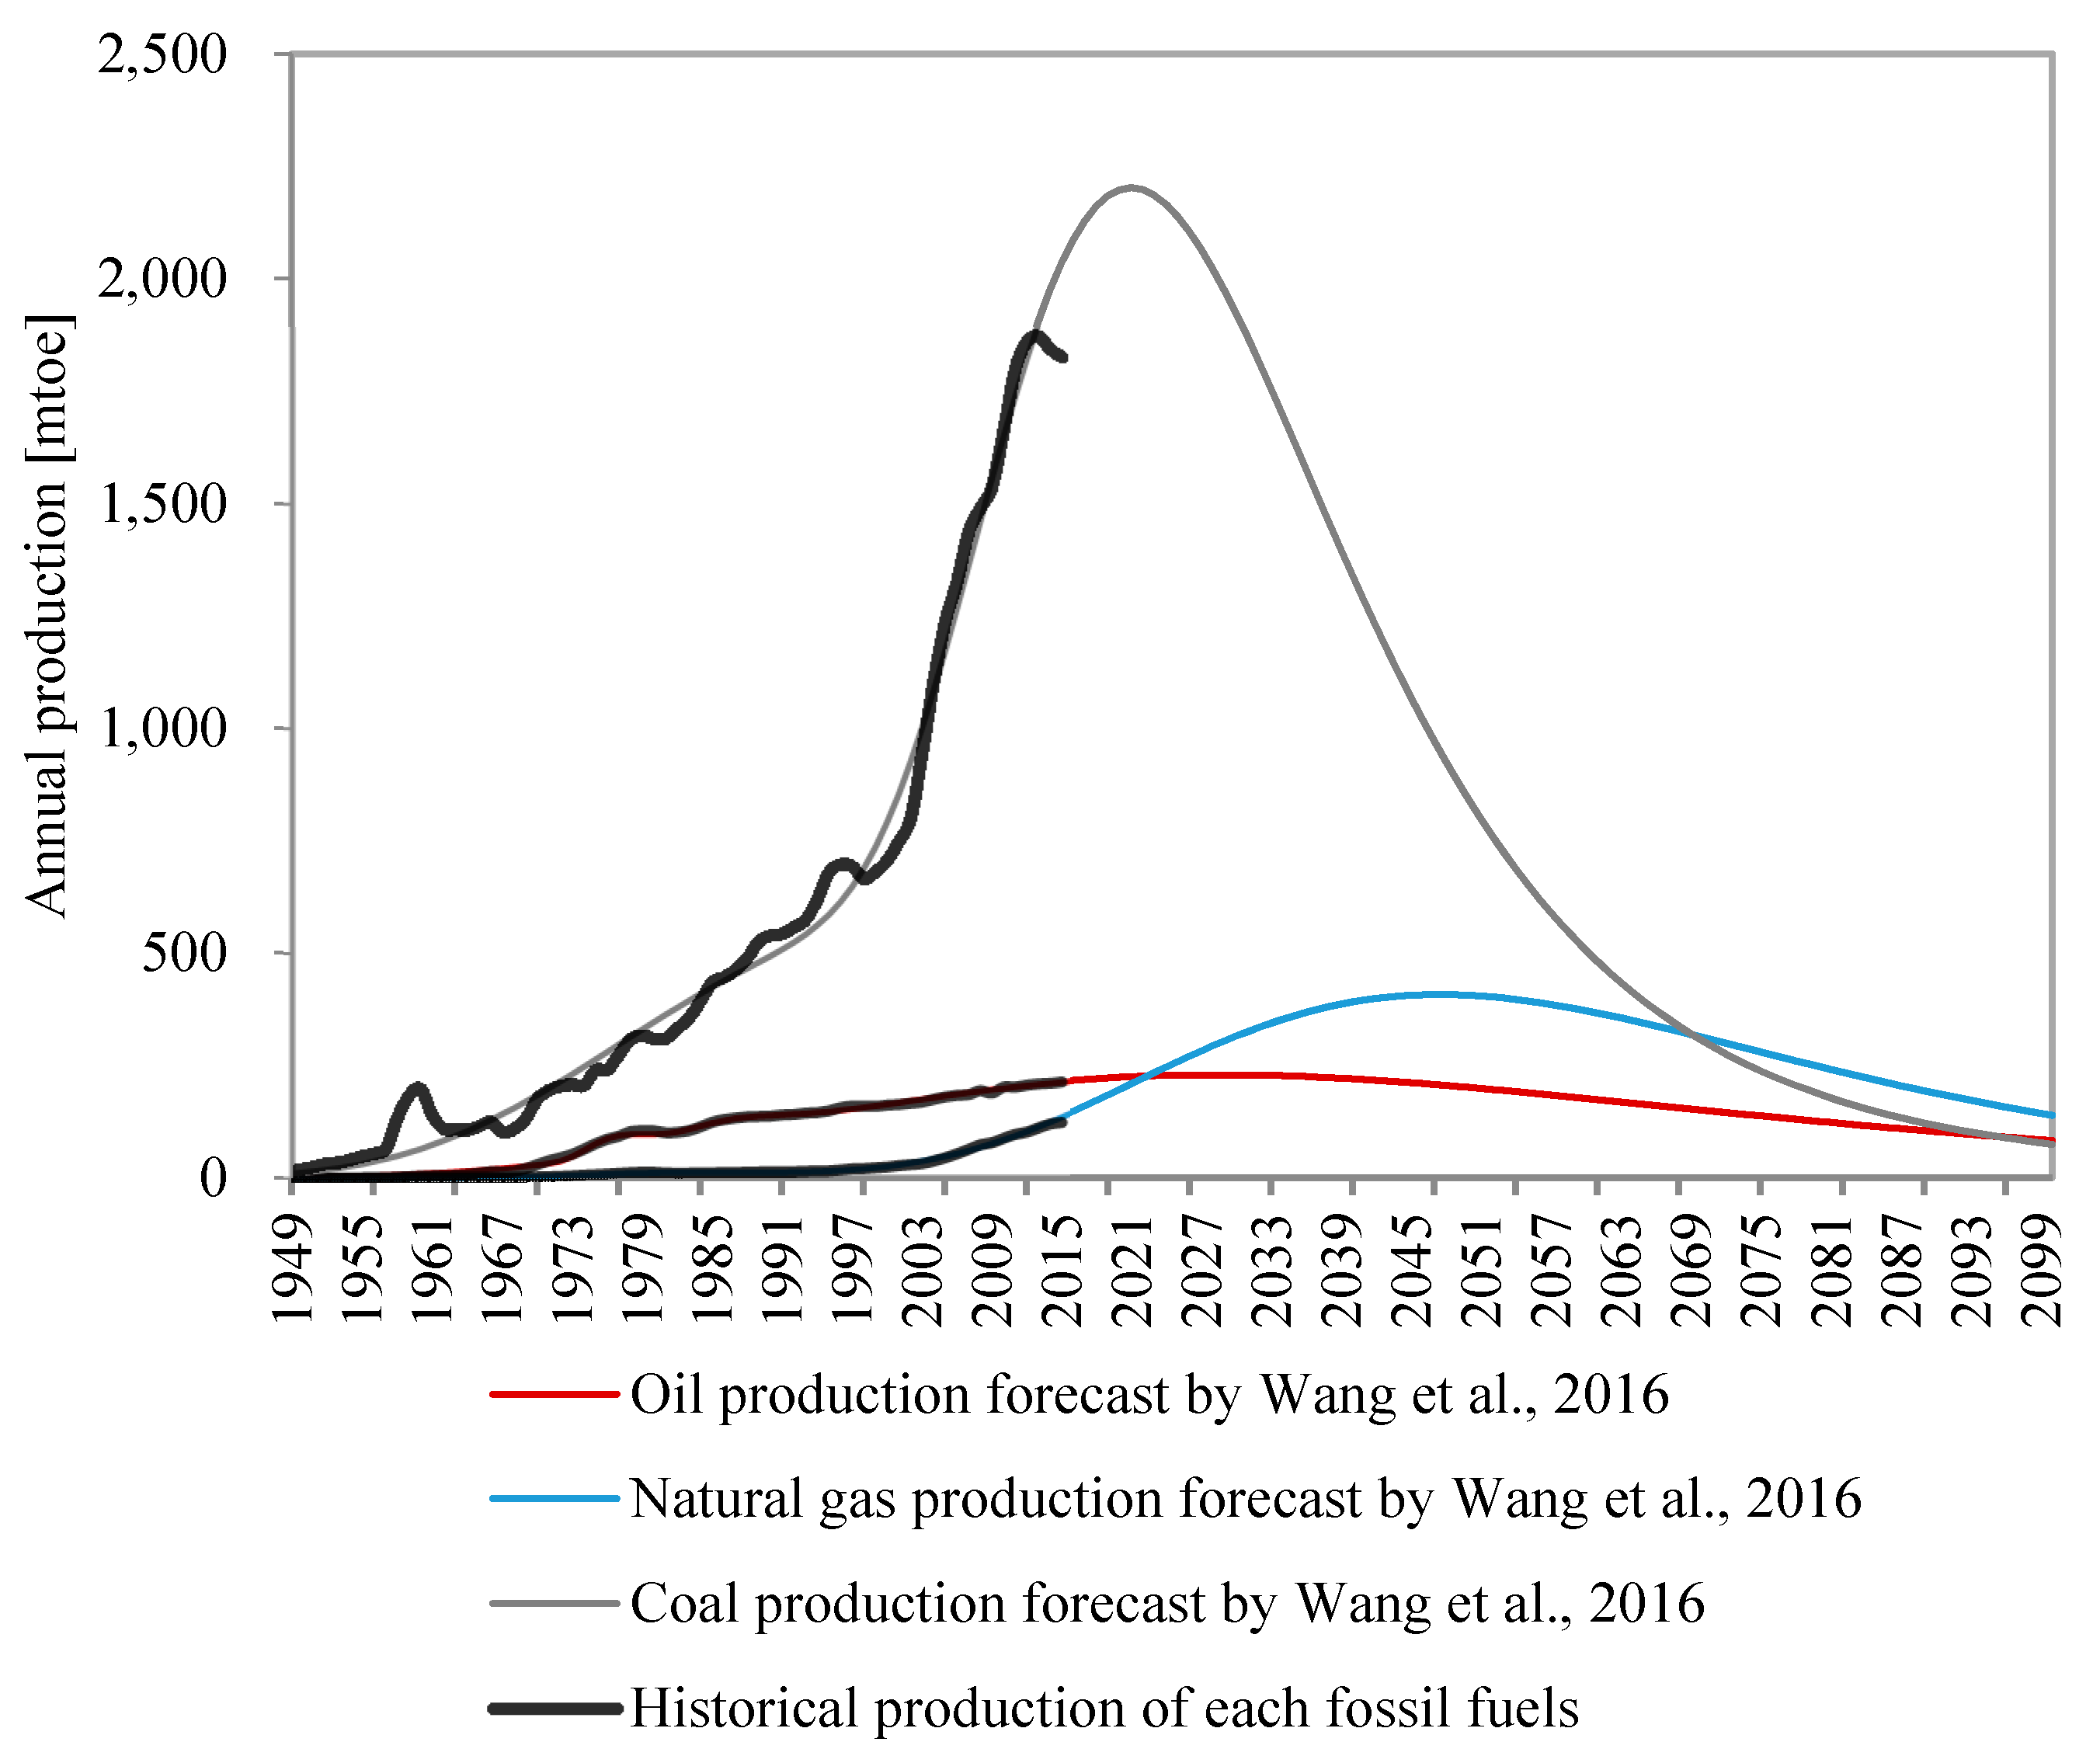
Many different mathematical functions can be obtained and used to forecast the cumulative production of fossil fuels (some bell-shaped models that forecast production per year can also be used), such as the Hubbert, Gompertz, Richards and log-normal models. Wang et al. [
33] performed a comprehensive analysis of Richards’ models and identified the key factors that affect the results of the models. The Richards model is a more general and flexible model that can be either symmetric or asymmetric depending on the key factors. Wang et al. also illustrated how these factors influence the forecast results by applying varying techniques to China’s conventional fossil fuel resource estimates. Based on study’s analyses of Wang et al., suggested that positively skewed curves should be favored in analyses of local and regional production, not only because of their lower sensitivity to changes in curvature but also because positively skewed curve shapes are more common in analyses of local and regional production per Brandt [
9]. Based on the above analysis, we considered curve shape, URR, cycle number and maximum depletion rate constraints in this study. Thus, the fossil fuel production predictions in China are from Wang et al.’s analysis; in addition, an inflection point of 0.37 is considered to produce a positively skewed curve. The results are presented in
Table 5 and
Figure 4.
To clarify, there are two reasons why we didn’t include unconventional fossil fuels EROIPOU: first, China’s unconventional fossil fuels production was very low before 2015, and the impact on the EROI calculation was limited; second, the boundaries between conventional and unconventional is not very clear during extraction result in the inputs data can’t be separate.
3. Results
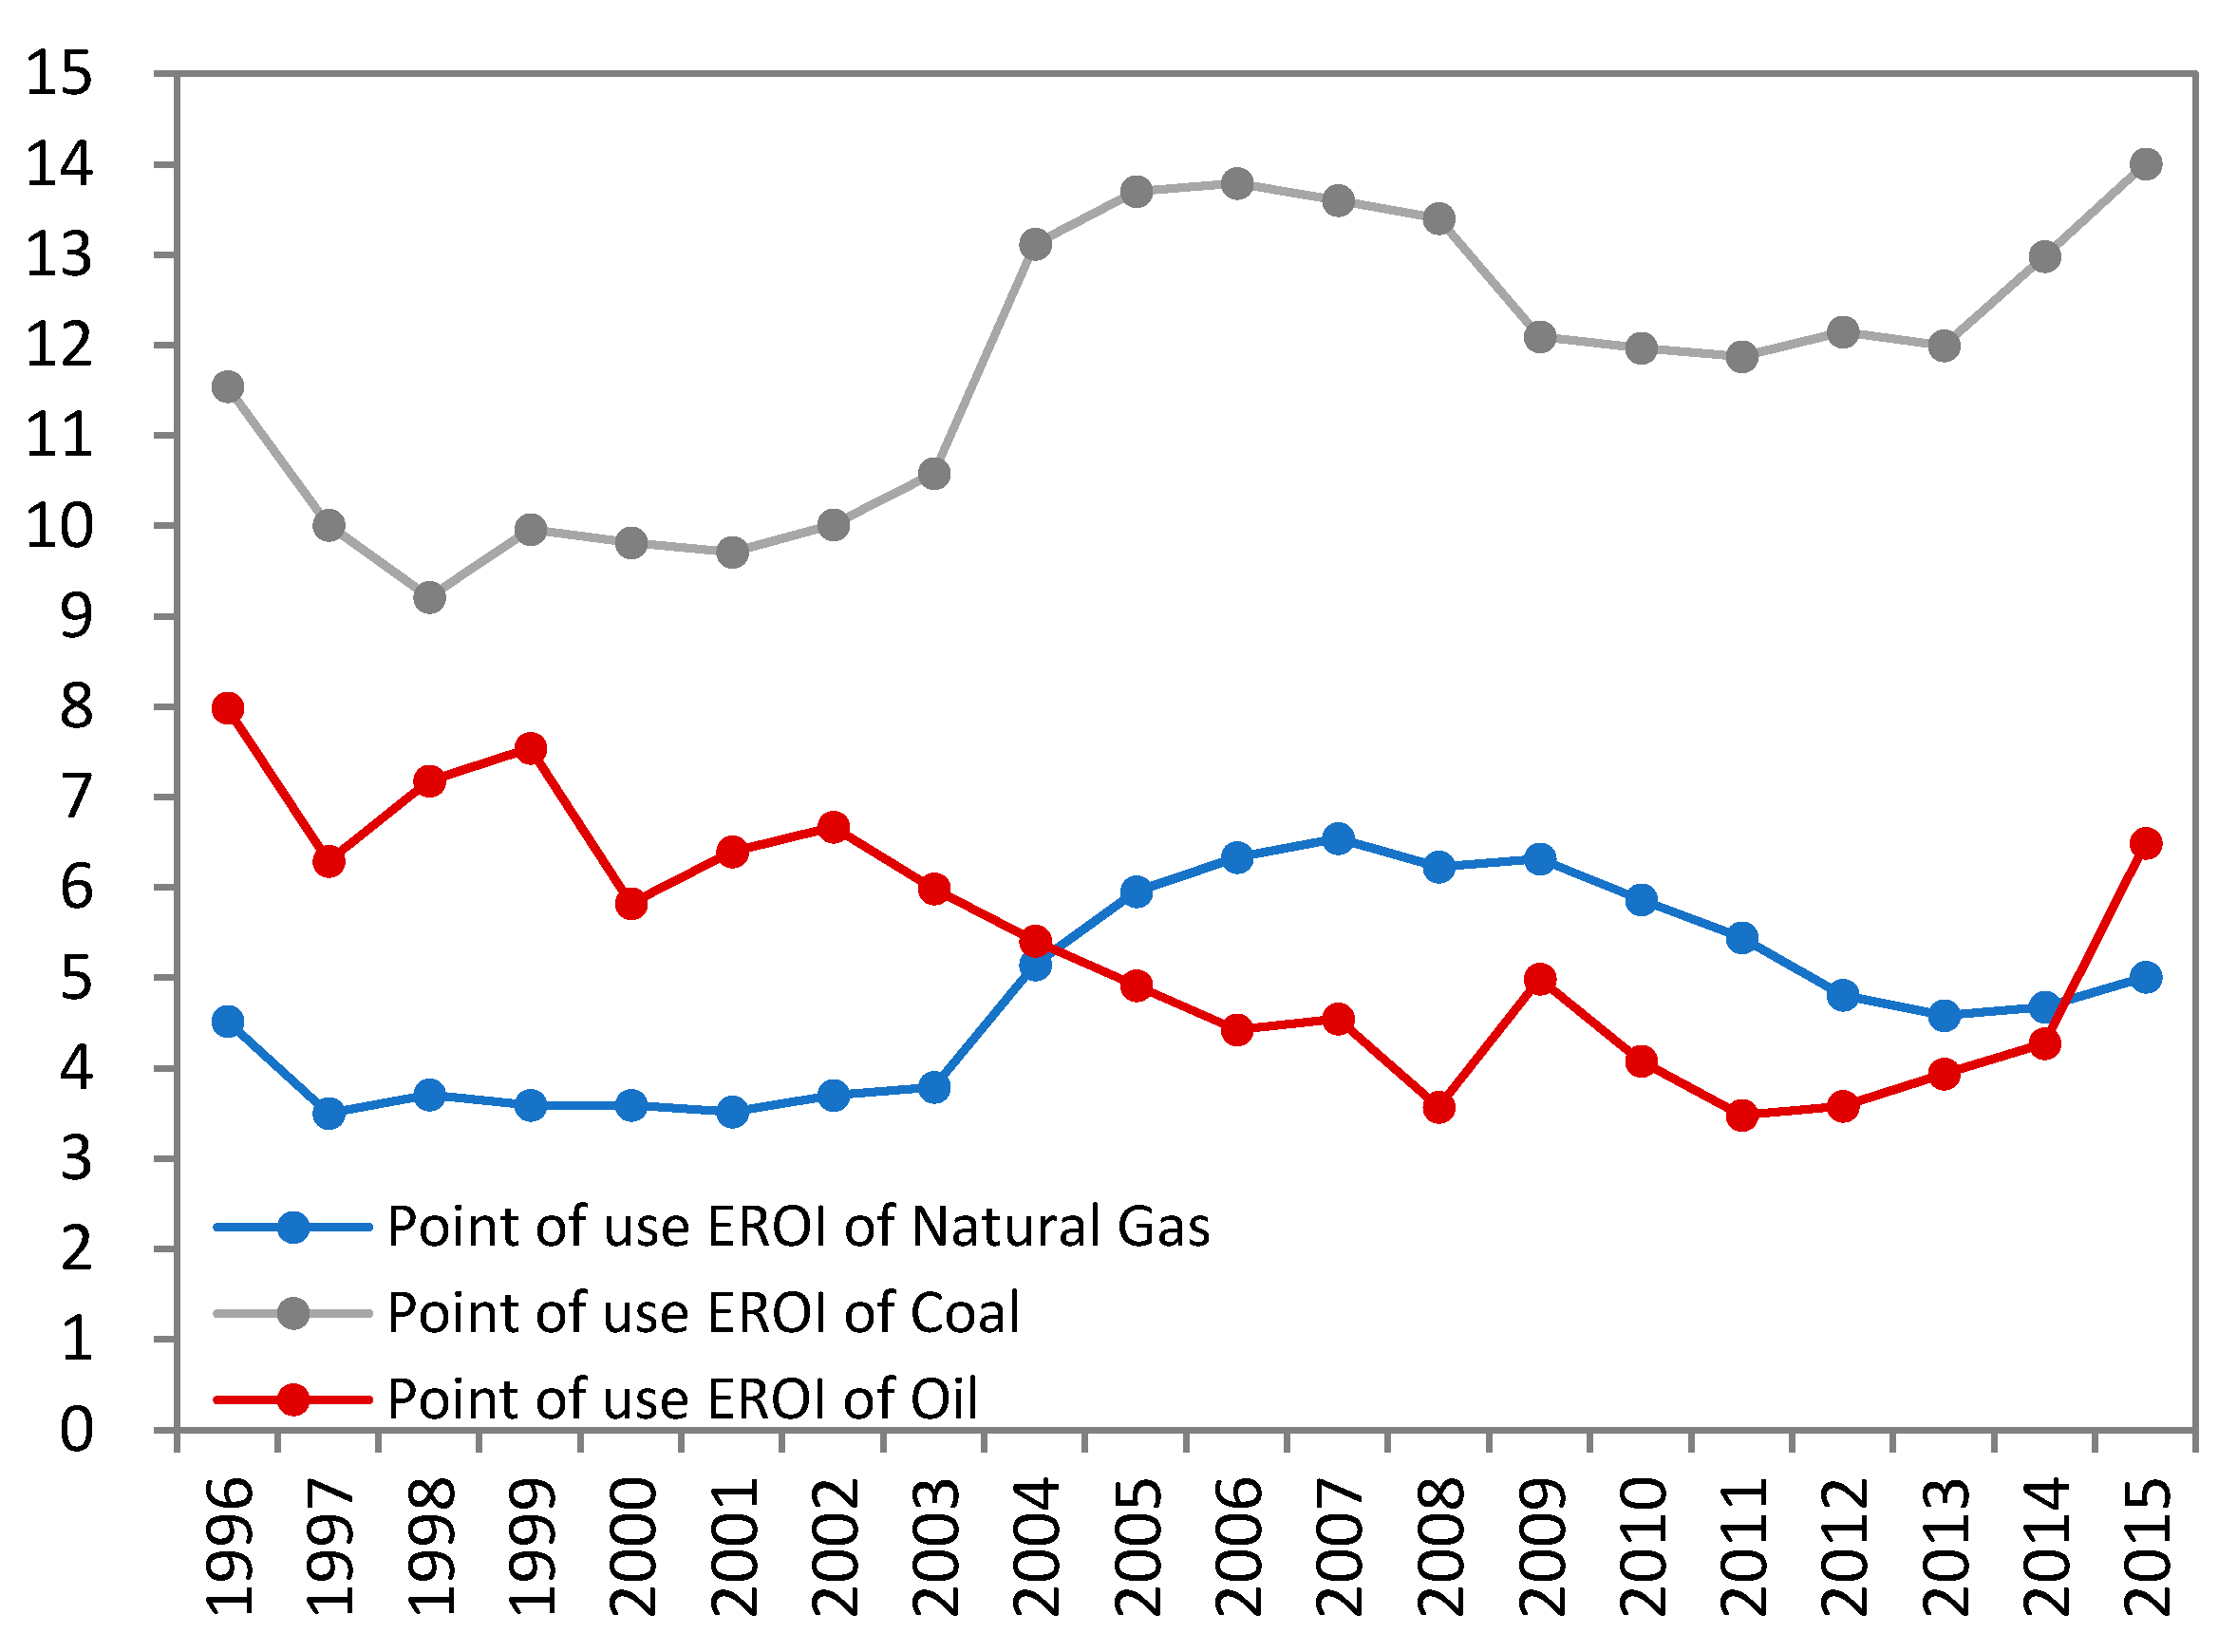
The NEY and EROI
POU values of conventional fossil fuels in China were calculated using Equations (2) and (3); detailed example calculations of EROI
POU and NEY are provided in
Table 1. Based on our calculations, the EROI
POU of China’s conventional oil declined from 8:1 to 6.5:1 from 1996 to 2015 (see
Figure 5). In general, the EROI
POU of coal tended to increase slightly but irregularly; however, it was associated with large value fluctuations in the range of 8.0:1 to 3.5:1 during the period from 1996 to 2015. The EROI
POU trends for natural gas exhibited increases in the early years but then decreased later in the study period.
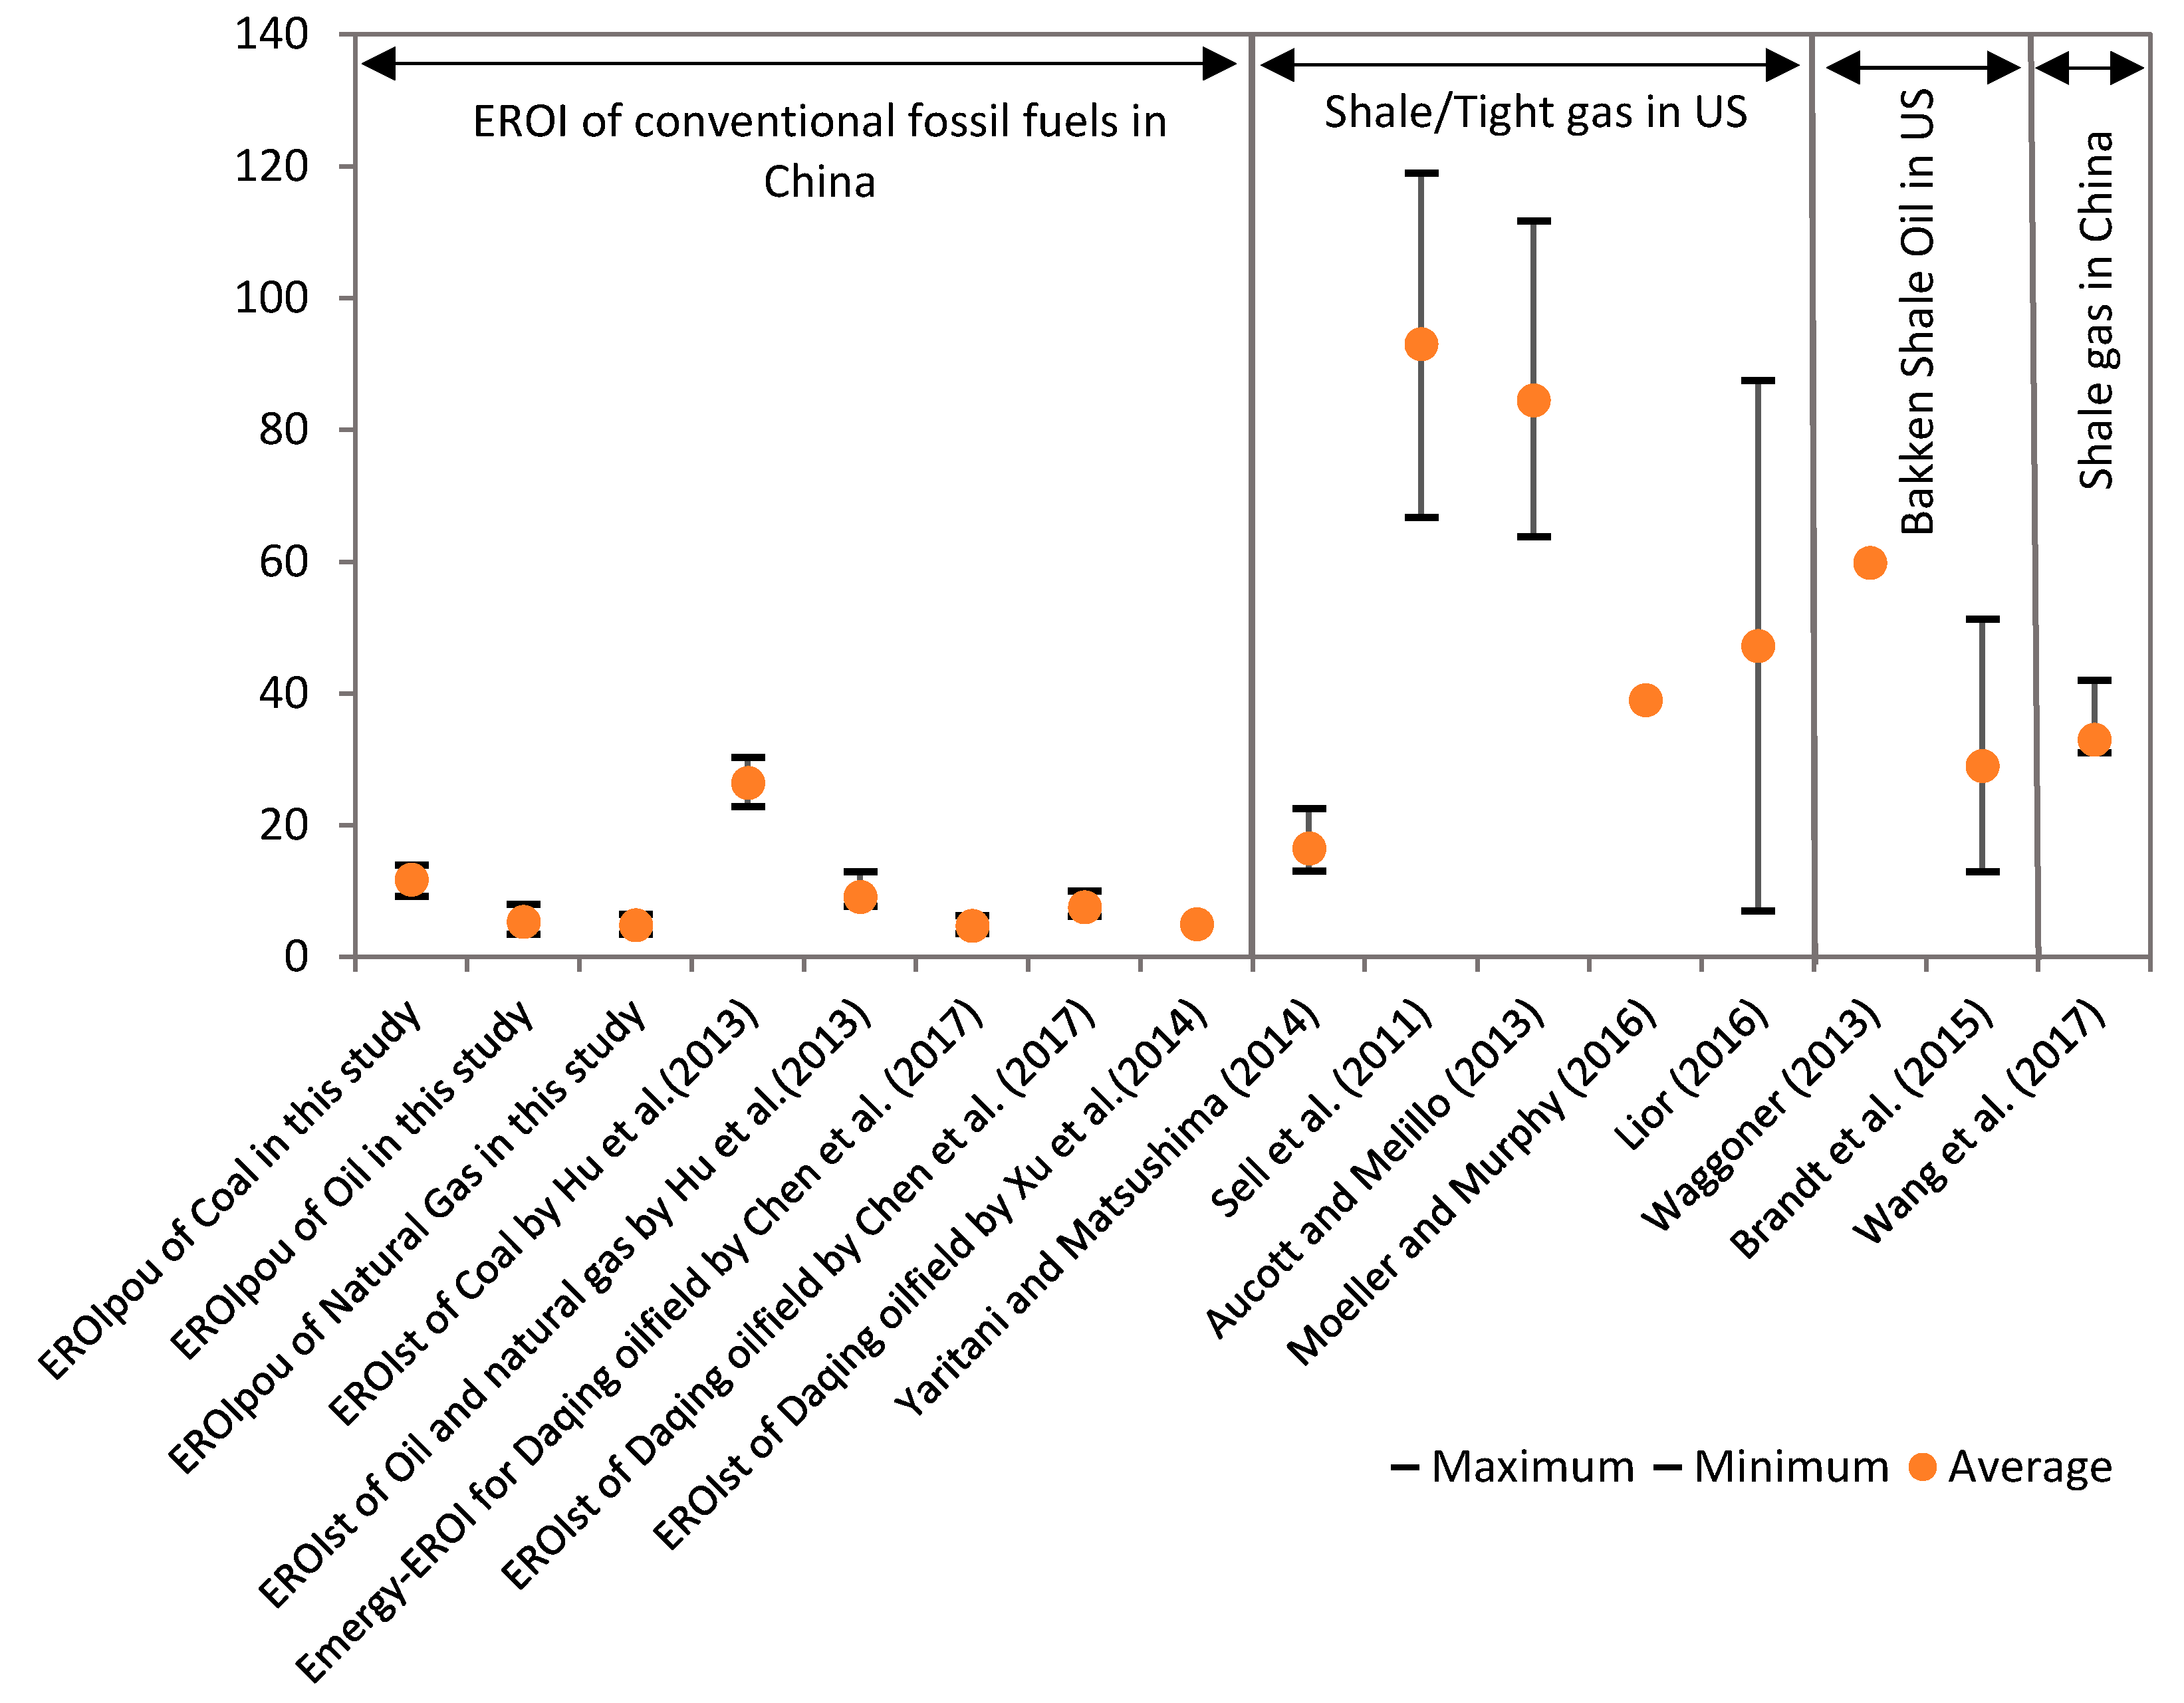
A comparison of this study and other related studies (unconventional oil & gas with same development techniques and conventional oil & gas in China) is shown in
Figure 6. EROI
POU in the present study is less than other EROI
ST values (see
Figure 6). EROI
POU values in this study are less than those proposed by Hu et al. [
17] because the EROI
POU in this study has large boundaries. In addition, Chen et al. [
15] (Emergy-EROI) and Xu et al. [
16] calculated the EROI
ST for Daqing oilfield, the results indicate that EROI
POU of oil in this study was similar to the EROI
ST in the because the Daqing oilfield is largest oilfield in China. It is also among the world’s largest oil fields. It has obviously made a tremendous contribution to China’s oil industry and has maintained a long-term stable yield. Compare EROI
POU of China’s conventional fossil fuels with EROI of unconventional fossil fuels [
34,
35,
36,
37,
38,
39,
40,
41] from another country, it can be seen that the EROI for China’s conventional fossil fuels is lower than the EROI of unconventional fossil fuels based on current literature.
Figure 6 also shows the EROI of U.S. shale oil & gas and China’s conventional oil & gas. We can see that the estimated EROI of China’s shale gas wells is within the range of estimated EROI for U.S. shale oil, but is much higher than the EROI of China’s conventional oil & gas. Based on the above analyses, it can be concluded that conventional fossil fuels are not a sustainable choice for China to develop in future from the perspective of net energy.
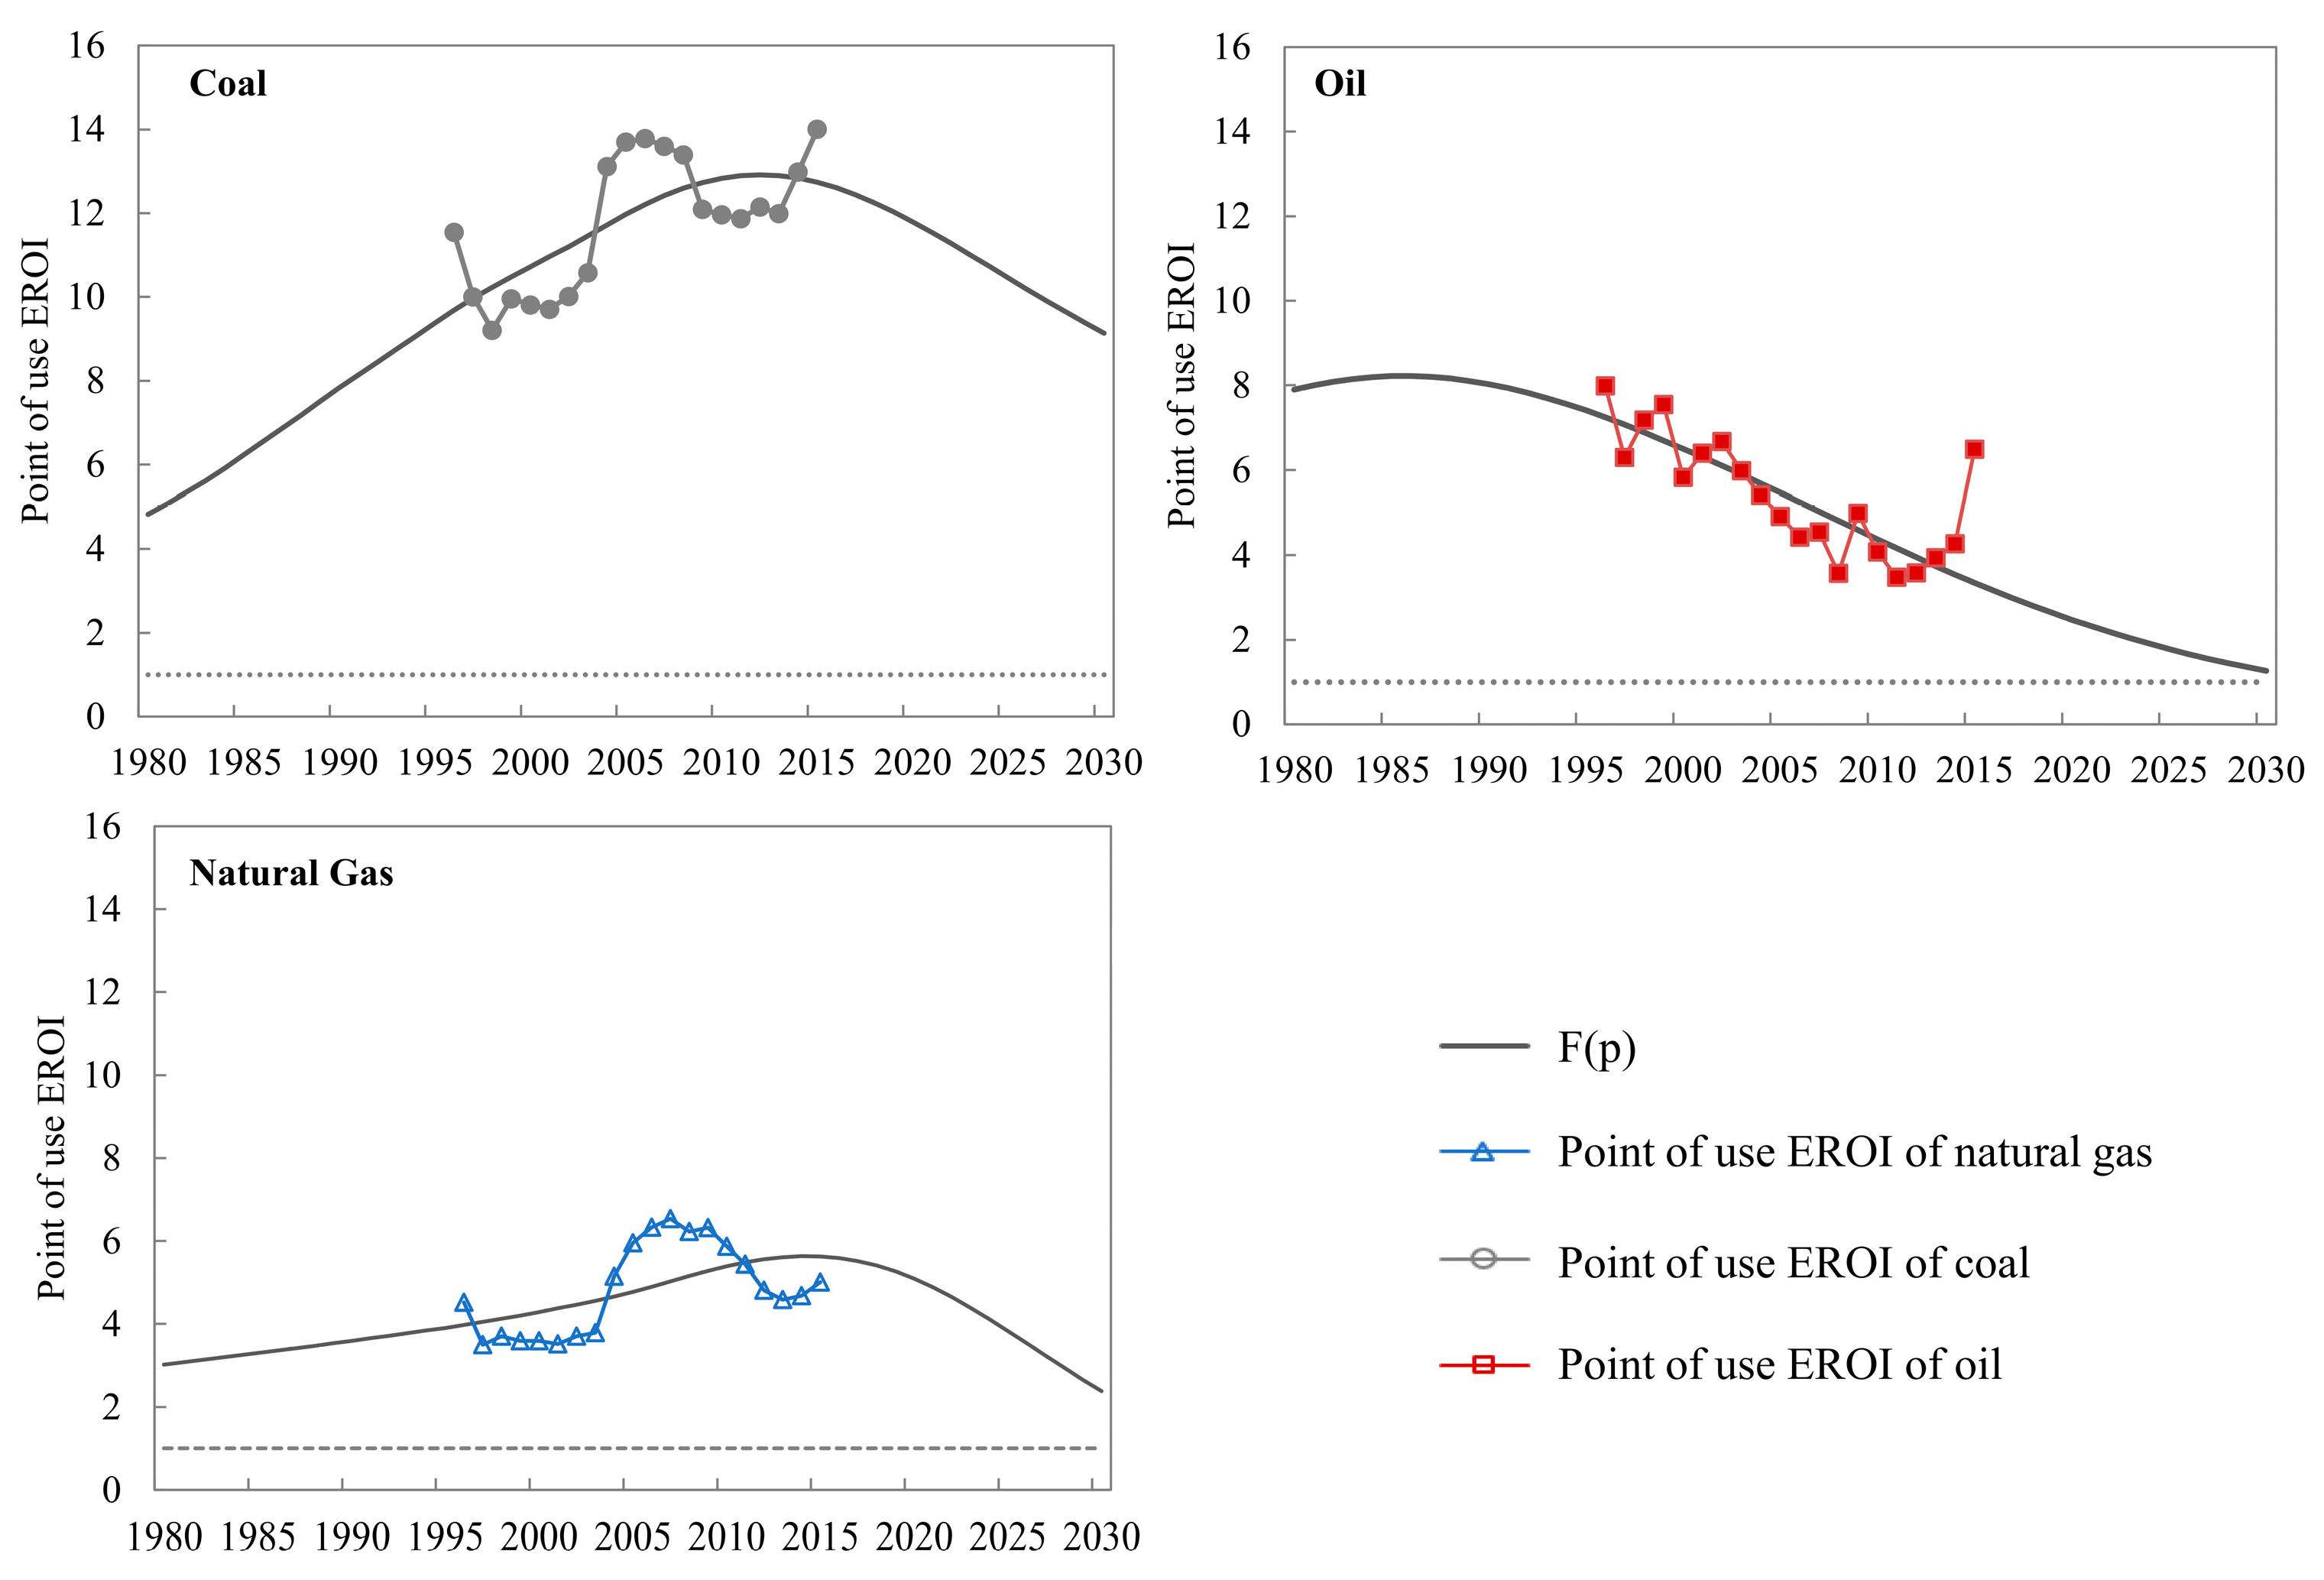
Based on the dynamic EROI function, we discovered that EROI
POU of conventional fossil fuels in China peaked during the study period (see
Figure 7). In particular, the EROI
POU of conventional oil continued to decline between 1996 and 2015. The EROI
POU of conventional oil in China will reach a breakeven point in 2030, indicating that EROI
POU will reach 1:1 in 2026, which is significant because when the EROI of an energy-producing process falls to less than approximately 10:1, the net energy delivered to society from that process begins to decline exponentially [
6,
37,
42,
43]. A resource with an EROI value less than 1:1 will not be able to produce net energy; i.e., all the energy produced is used to produce that energy [
15]. The primary reason for the decline in the EROI
POU of conventional oil and natural gas is caused by the rapid decrease in the physical depletion curves (see
Figure 8). From the conventional oil and natural gas perspective, although physically depleted, oil and natural gas have higher initial values than coal, but they still have a higher depletion rate. The EROI
POU of conventional fossil fuels is similar to a balanced game between technology and physical depletion. The EROI
POU reaches a peak when the technological curve intersects the physical depletion curve.
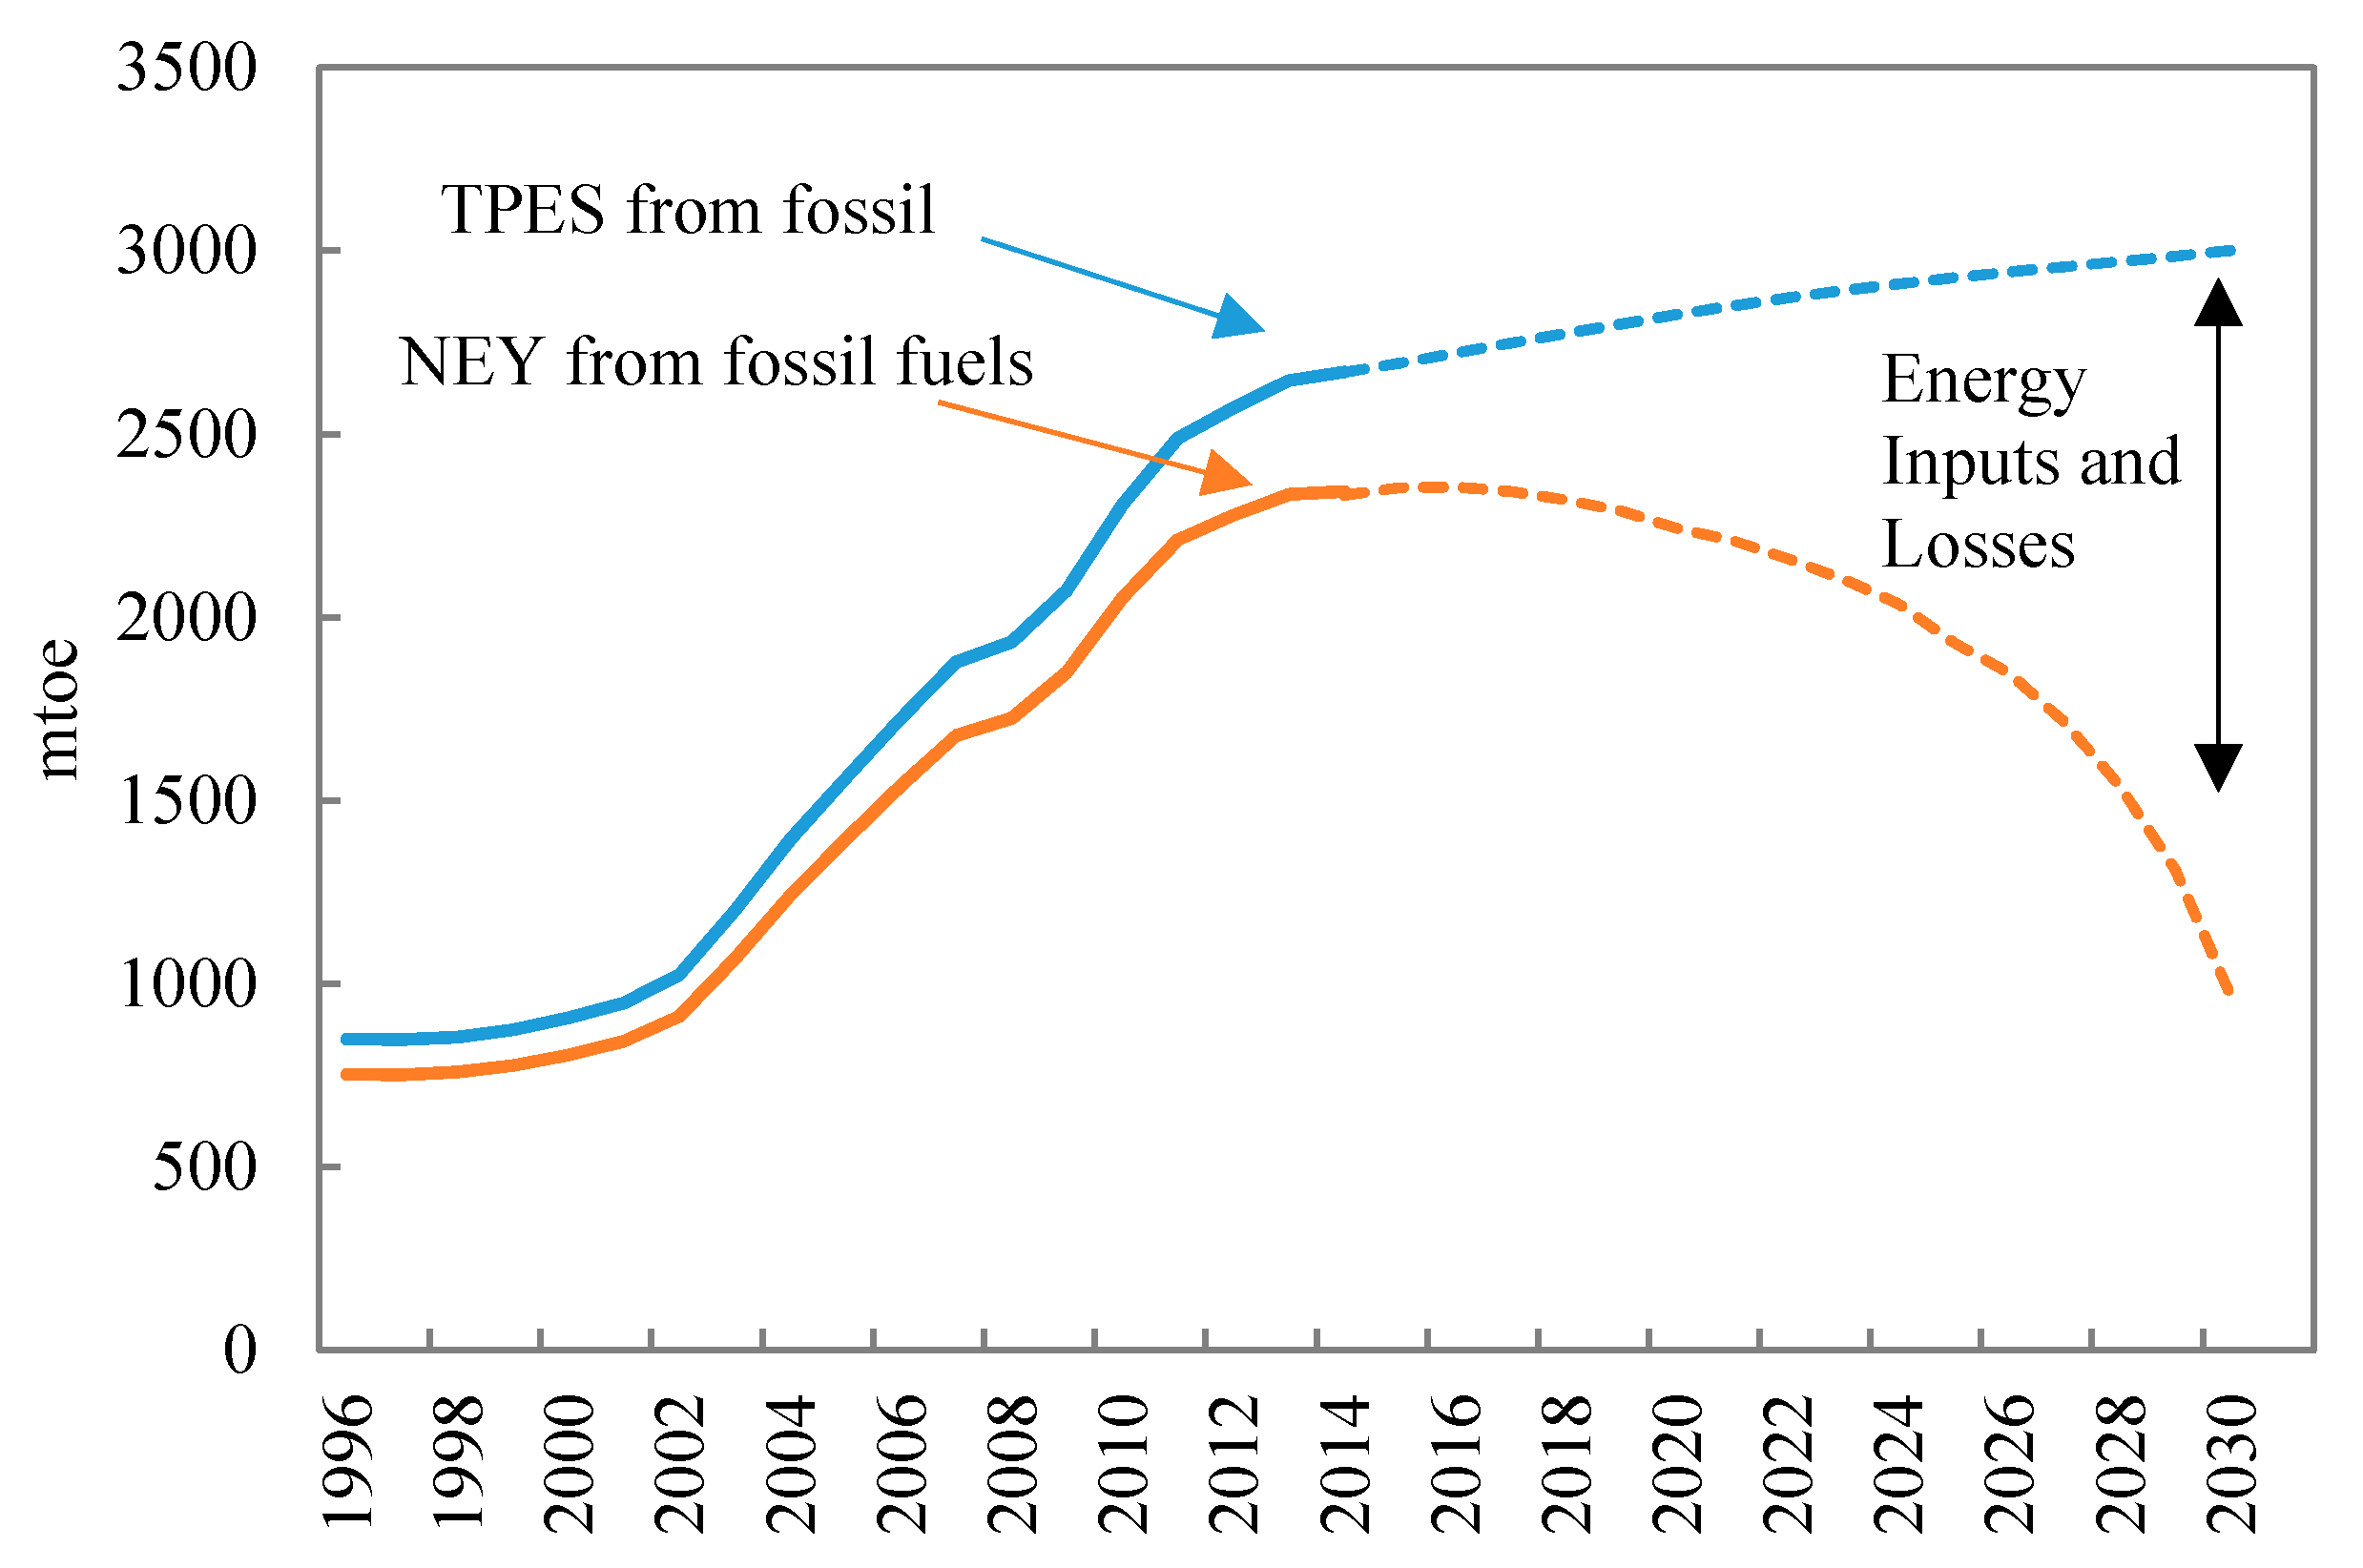
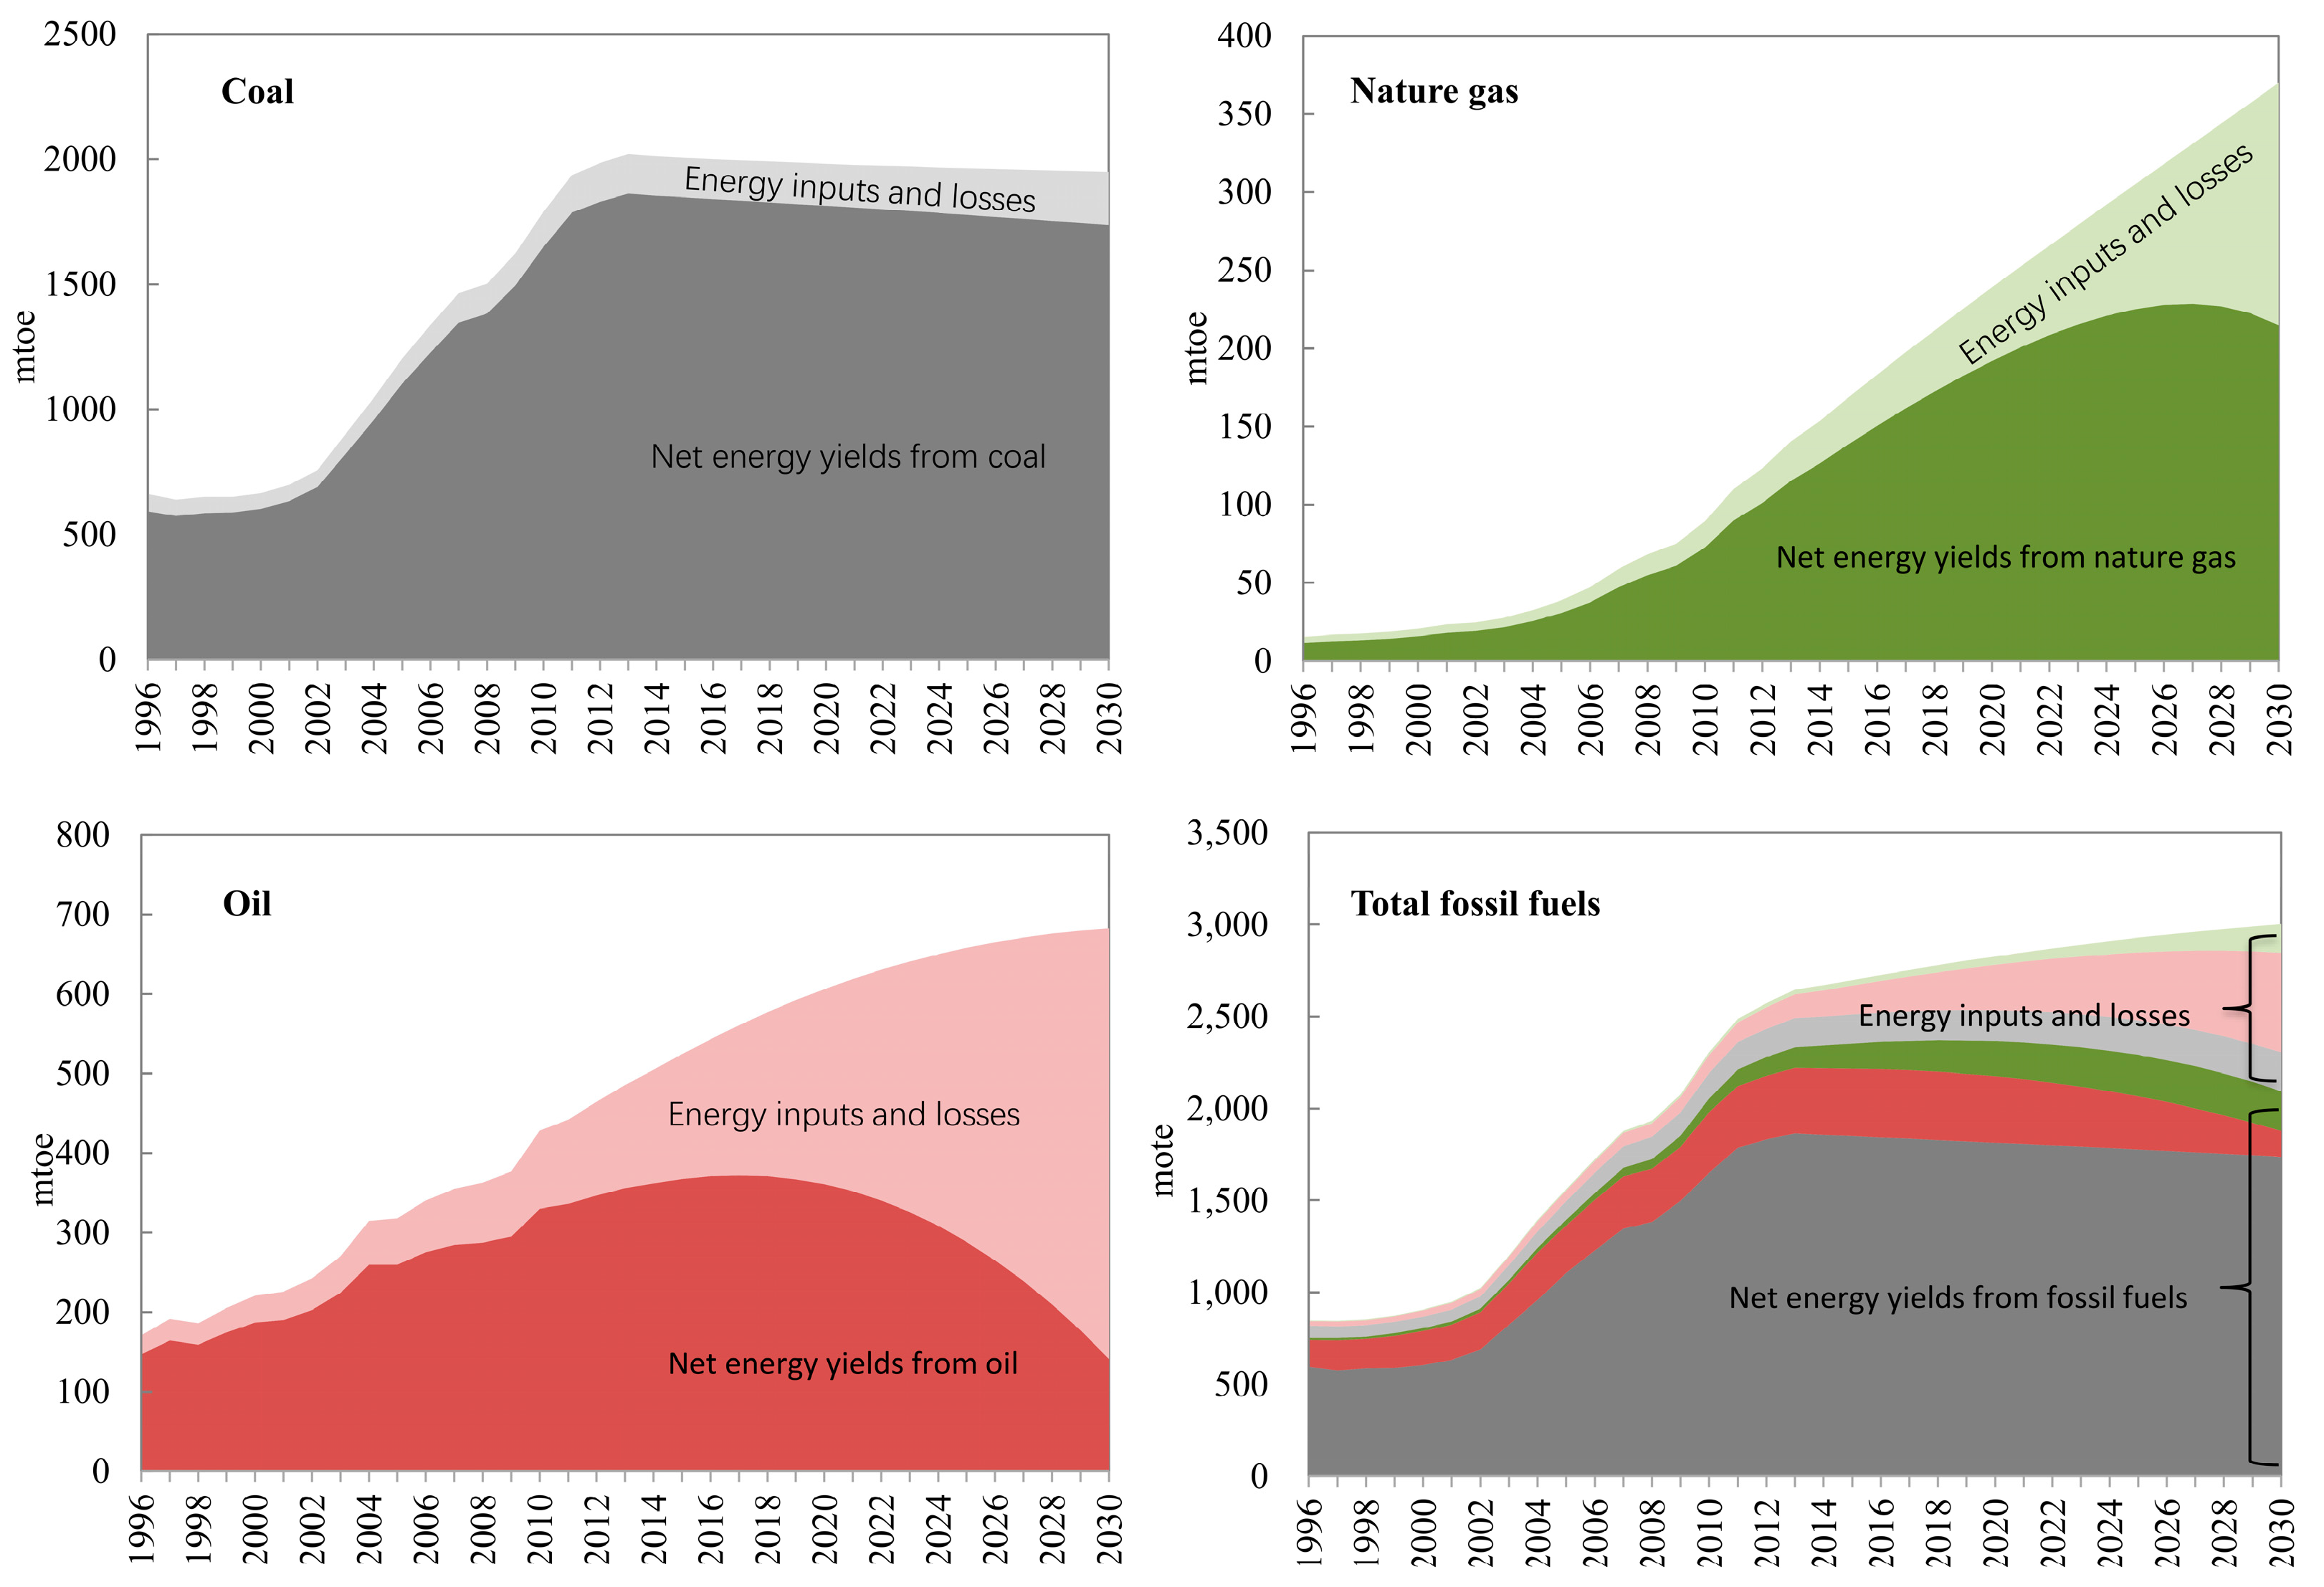
Figure 9 shows that the total conventional fossil fuels supply in China was 2973 mtoe in 2015, NEYs was 2354 mtoe, which accounted for 87.4% of the total fossil fuel supply. Notably, in 2015, approximately 20.8% of one unit of fossil fuel was required to produce, process, and move the fuel to its end-use location. These inputs are particularly high in China compared to those in other countries. The gap between TPES and NEY continues to grow larger as the EROI
POU declines which will lead to fewer NEYs from Chinese conventional fossil fuels.
To predict Chinese NEYs in the future using Equation (3), the first step is to estimate the future total fossil fuel consumption and EROI
POU. The new policies scenario in the World Energy Outlook 2016, published by the IEA, incorporates existing energy policies, as well as an assessment of the results likely to stem from the implementation of announced intentions, including those in the climate pledges submitted for the United Nations Climate Change Conference in 2015 [
20]. Additionally, this scenario considers some of the policies that are being implemented in further efforts by the Chinese government to reform the economic and energy structure (assumptions of a new policy scenario in WEO-2016 include the following: (1) NDC GHG targets are to achieve peak CO
2 emissions around 2030, to make the best efforts to peak early, and to lower CO
2 emissions by unit of GDP by 60–65% from 2005 levels by 2030; (2) NDC energy targets are to increase the share of non-fossil fuels in primary energy consumption to around 20% by 2030; (3) there are efforts to restructure the economy and to shift emphasis away from investment and export-led growth toward the services sector and domestic consumption; (4) emissions trading schemes cover the power and industry sectors from 2017; (5) the use of natural gas is expanded; and (6) energy price reform is undertaken, including more frequent adjustments to oil product prices and increases in natural gas prices by 15% for non-residential consumers), for example, to achieve peak CO
2 emissions in approximately 2030 and to expand the use of natural gas and renewable energy. Given the above situation, in this study, fossil fuel consumption in the WEO-2016 new policies scenario was considered China’s future energy consumption. Combined with the EROI
POU of future Chinese fossil fuels, NEYs could be predicted using Equation (3) (see
Figure 9). The results show that the NEYs of Chinese fossil fuels peaked in 2016 because of a sharp decline in EROI
POU, which is a dangerous signal for the Chinese energy industry; however, few people have noticed this trend.
5. Conclusions
Measuring the EROI from the energy extraction stage to the energy point-of-use stage provides a complete estimate of NEYs. This study aims to build a model to calculate the EROIPOU of conventional fossil fuels in China and to identify the mathematical relationship between NEY and EROIPOU.
Based on our calculations, the EROIPOU of both coal (range of value: 14:1–9.2:1), oil (range of value: 8:1–3.5:1) and natural gas (range of value: 6.5:1–3.6:1) display downward trends in the future 15 years. However, the EROIPOU of China’s conventional natural gas peaked in next years; and the EROIPOU of China’s conventional oil and coal have already passed their peak points and will continue to decline until they eventually reach less than 1:1 before 2030.
In addition, EROI of unconventional fossil fuels is higher than China’s conventional fossil fuels EROI from the result of other studies. Based on these analyses, it can be concluded that shale gas & oil could be a good choice for China to develop in future to solve its conventional fossil fuels shortage from the perspective of EROI.
Using a simulated EROIPOU dynamic function, we further predict the impacts of a decline in the EROIPOU on China’s NEY supply in the future. The EROIPOU of China’s conventional fossil fuels will rapidly decrease in the next 15 years and will be accompanied by a slowdown in the growth of China’s net fossil fuels supply; this slowdown eventually resulted in the NEY shortage. Most organizations predict fossil energy supplies, such as the new policy scenario from WEO-2016, which simply considers the TPES of Chinese fossil fuels and ignores the impact of the EROIPOU decrease on NEY. The impact of the decrease in EROIPOU cannot be ignored in this situation. China should speed up energy reforms moves to reduce dependence on conventional fossil fuels and developing new energy with a higher EROIPOU. And this must faster than IEA’s new policy scenario in WEO-2016.


