Article

Development and Test of Solutions to Enlarge the Power of PV Irrigation and Application to a 140 kW PV-Diesel Representative Case

by
Rita H. Almeida
1,2,*,
Isaac B. Carrêlo
1,
Eduardo Lorenzo
1,
Luis Narvarte
1,
José Fernández-Ramos
3,
Francisco Martínez-Moreno
1 and
Luis M. Carrasco
1
1
Instituto de Energía Solar—Universidad Politécnica de Madrid, 28031 Madrid, Spain
2
Instituto Dom Luiz, Faculdade de Ciências, Universidade de Lisboa, 1749-016 Lisboa, Portugal
3
Departamento de Electrónica, Universidad de Málaga, 29071 Málaga, Spain
*
Author to whom correspondence should be addressed.
Energies 2018, 11(12), 3538; https://doi.org/10.3390/en11123538
Submission received: 8 November 2018 / Revised: 10 December 2018 / Accepted: 14 December 2018 / Published: 19 December 2018
(This article belongs to the Section A: Sustainable Energy)

Abstract

:
The current state of the art of photovoltaic (PV) irrigation systems is limited to PV peak powers below 40 kWp, which does not cover the irrigation needs of farmers, co-operatives, irrigator communities, and agro-industries. This limitation of power is due to two main technical barriers: The quick intermittence of PV power due to the passing of clouds, and the maladjustment between PV production and water needs. This paper presents new solutions that have been developed to overcome these barriers and their application to the design and performance of a 140 kWp hybrid PV-diesel system for the drip irrigation of 195 ha of olive trees in Alter do Chão, Portugal. The performance of the solutions was analysed during two years of real operation. As the performance of the PV system is not only affected by intrinsic-to-design characteristics, but also by circumstances external to the system, new performance indices were developed. As an example, the percentage of use of PV electricity, PVSH, was 78% and 82% in 2017 and 2018, respectively, and the performance ratio of the PV part, PRPV, was 0.79 and 0.80. The economic feasibility was also analysed based on experimental data, resulting in savings in the levelized cost of electricity of 61%.

1. Introduction

Diesel generation typically supplies electricity at about 3.5 kWh per liter, which represents a fuel consumption cost of around 0.3 €/kWh. Meanwhile, photovoltaic (PV) electricity prices have declined below 0.1 €/kWh [1]. Thus, PV hybridization with pre-existing diesel-based irrigation systems is becoming increasingly attractive, as pointed out by several authors in [2,3,4,5].
The history of PV water pumping to provide drinking water or to irrigate starts in 1973, when Dominique Campana coordinated the installation of the first one in Corsica, France, including a Guinard DC pump fed by Philips PV modules [6,7]. However, from this first experience till now, the PV pumping technology has been limited to less than 40 kWp of peak power (the power at standard test conditions, STC [8]). For example, the most important PV pumping programs in the 70’s were reviewed by Newkirk [9], who indicated that the biggest one was a 25 kWp in the USA. Between 1979 and 1981, the United Nations Development Program implemented a pilot project to test and evaluate PV pumping systems, with powers ranging from 100 Wp to 300 Wp, used in small-scale irrigation systems in Mali, the Philippines, and Sudan [10]. Between 1977 and 1990, around 200 systems were installed in Mali, with a total installed power of 220 kWp [7,11]. In the early 1990s, the European Commission launched the Solar Regional Program (PRS) in the Sahel countries to improve water access for the population (both in quantity and quality), as well as improving their economic conditions through the irrigation of vegetables and fruit trees [11,12]. This project allowed the installation of 1040 systems, with a total PV power of 1.3 MWp [11,12], being the bigger system of 3.9 kWp [13]. This program was the first in the PV pumping field that included technical specifications and quality control procedures [11]. Also, in the early 1990s, the German Cooperation Agency (GTZ) developed the “PVP Program”, with the objective of demonstrating the maturity of the technology and its real costs. The program installed 90 PV pumping systems, with a total power of 180 kWp, in Argentina, Brazil, Indonesia, Jordan, the Philippines, Tunisia, and Zimbabwe (according to Anhalt, cited in [11]).
During the 1990s and the beginning of this century, some other national projects arose in India [7], Morocco [7,14], Brazil [15], and Mexico [16]. In the case of Morocco, the biggest system had 5.3 kWp [17]. In Brazil, 2500 systems were installed, with an average power of 280 Wp [15]. Finally, in Mexico, the maximum power of the system reported was 848 Wp [16]. The technological evolution in these programs went from dedicated inverters and centrifugal pumps specifically dedicated to PV applications to both standard frequency converters and AC centrifugal pumps [18,19]. This contributed to an increase in the reliability and efficiency of the systems due to the use of well-proven components. Since this equipment was extensively used in industrial applications, a decrease in price was also verified and the availability of spare parts and the access to maintenance tasks significantly improved.
In the last few years, a large number of national and international programs were launched to promote PV water pumping systems for irrigation. For example, the 2016 IRENA (International Renewable Energy Agency) report on Solar Pumping for Irrigation [5] mentions three of them: India intends to install 100,000 PV pumps by 2020, Morocco 100,000 by 2022, and Bangladesh 50,000 by 2025. For instance, in India, the fuel prices have increased by more than 250% since 2000, which has led the Government of India to support and promote solar pumping systems [20]. In Bangladesh, according to [21], the government installed 10,000 PV pumping systems until 2016. Furthermore, in Chile, 1480 systems with PV sizes from 1 kW to 3 kW were installed in 2013–2014 [22]. An international big project also deserves attention: Powering Agriculture: An Energy Grand Challenge for Development [23]. It is a project devoted to all kinds of support in what concerns the energy-water-food nexus in developing countries and it includes, but it is not limited to, low-power PV water pumping systems for irrigation.
Lastly, it is important to underline that the last reviews published about PV water pumping systems (including PV water pumping systems for irrigation) are still reporting only small-power systems [24,25,26,27]. For example, the largest system presented in the review of Wazed was 11 kWp [26], while the largest one in the Sontake review was 15 kWp [27]. A review of the current commercial products (see for example [28]) shows that the market is offering PV irrigation systems under 40 kWp.
The limitation of power in the current state of the art products is due to two main technical barriers identified by the European Innovation Partnerships on Water (EIP-Water) [
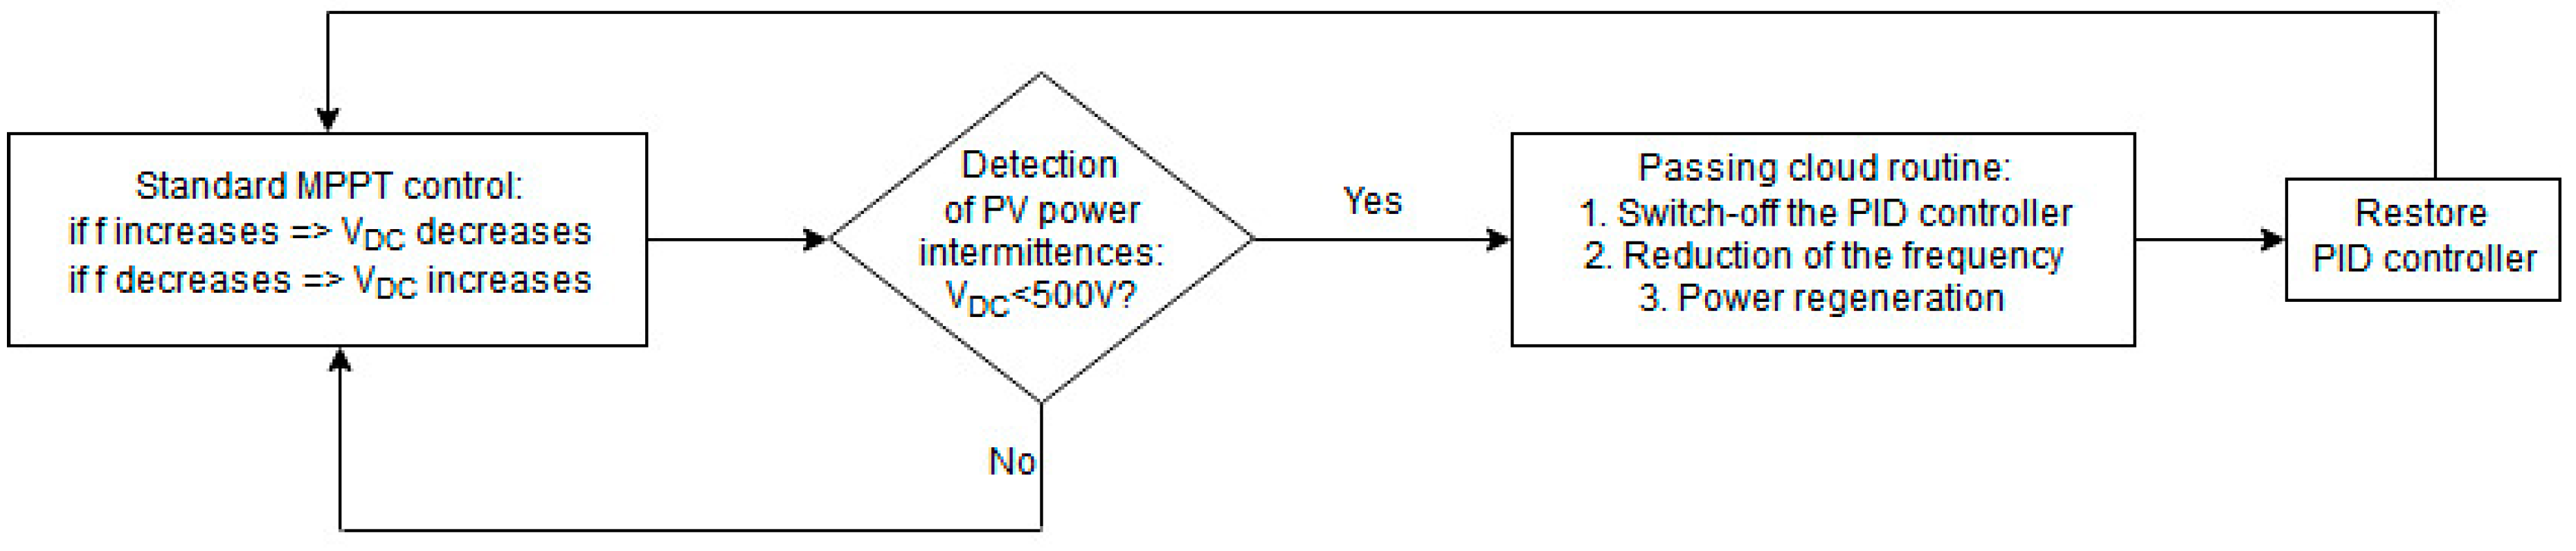
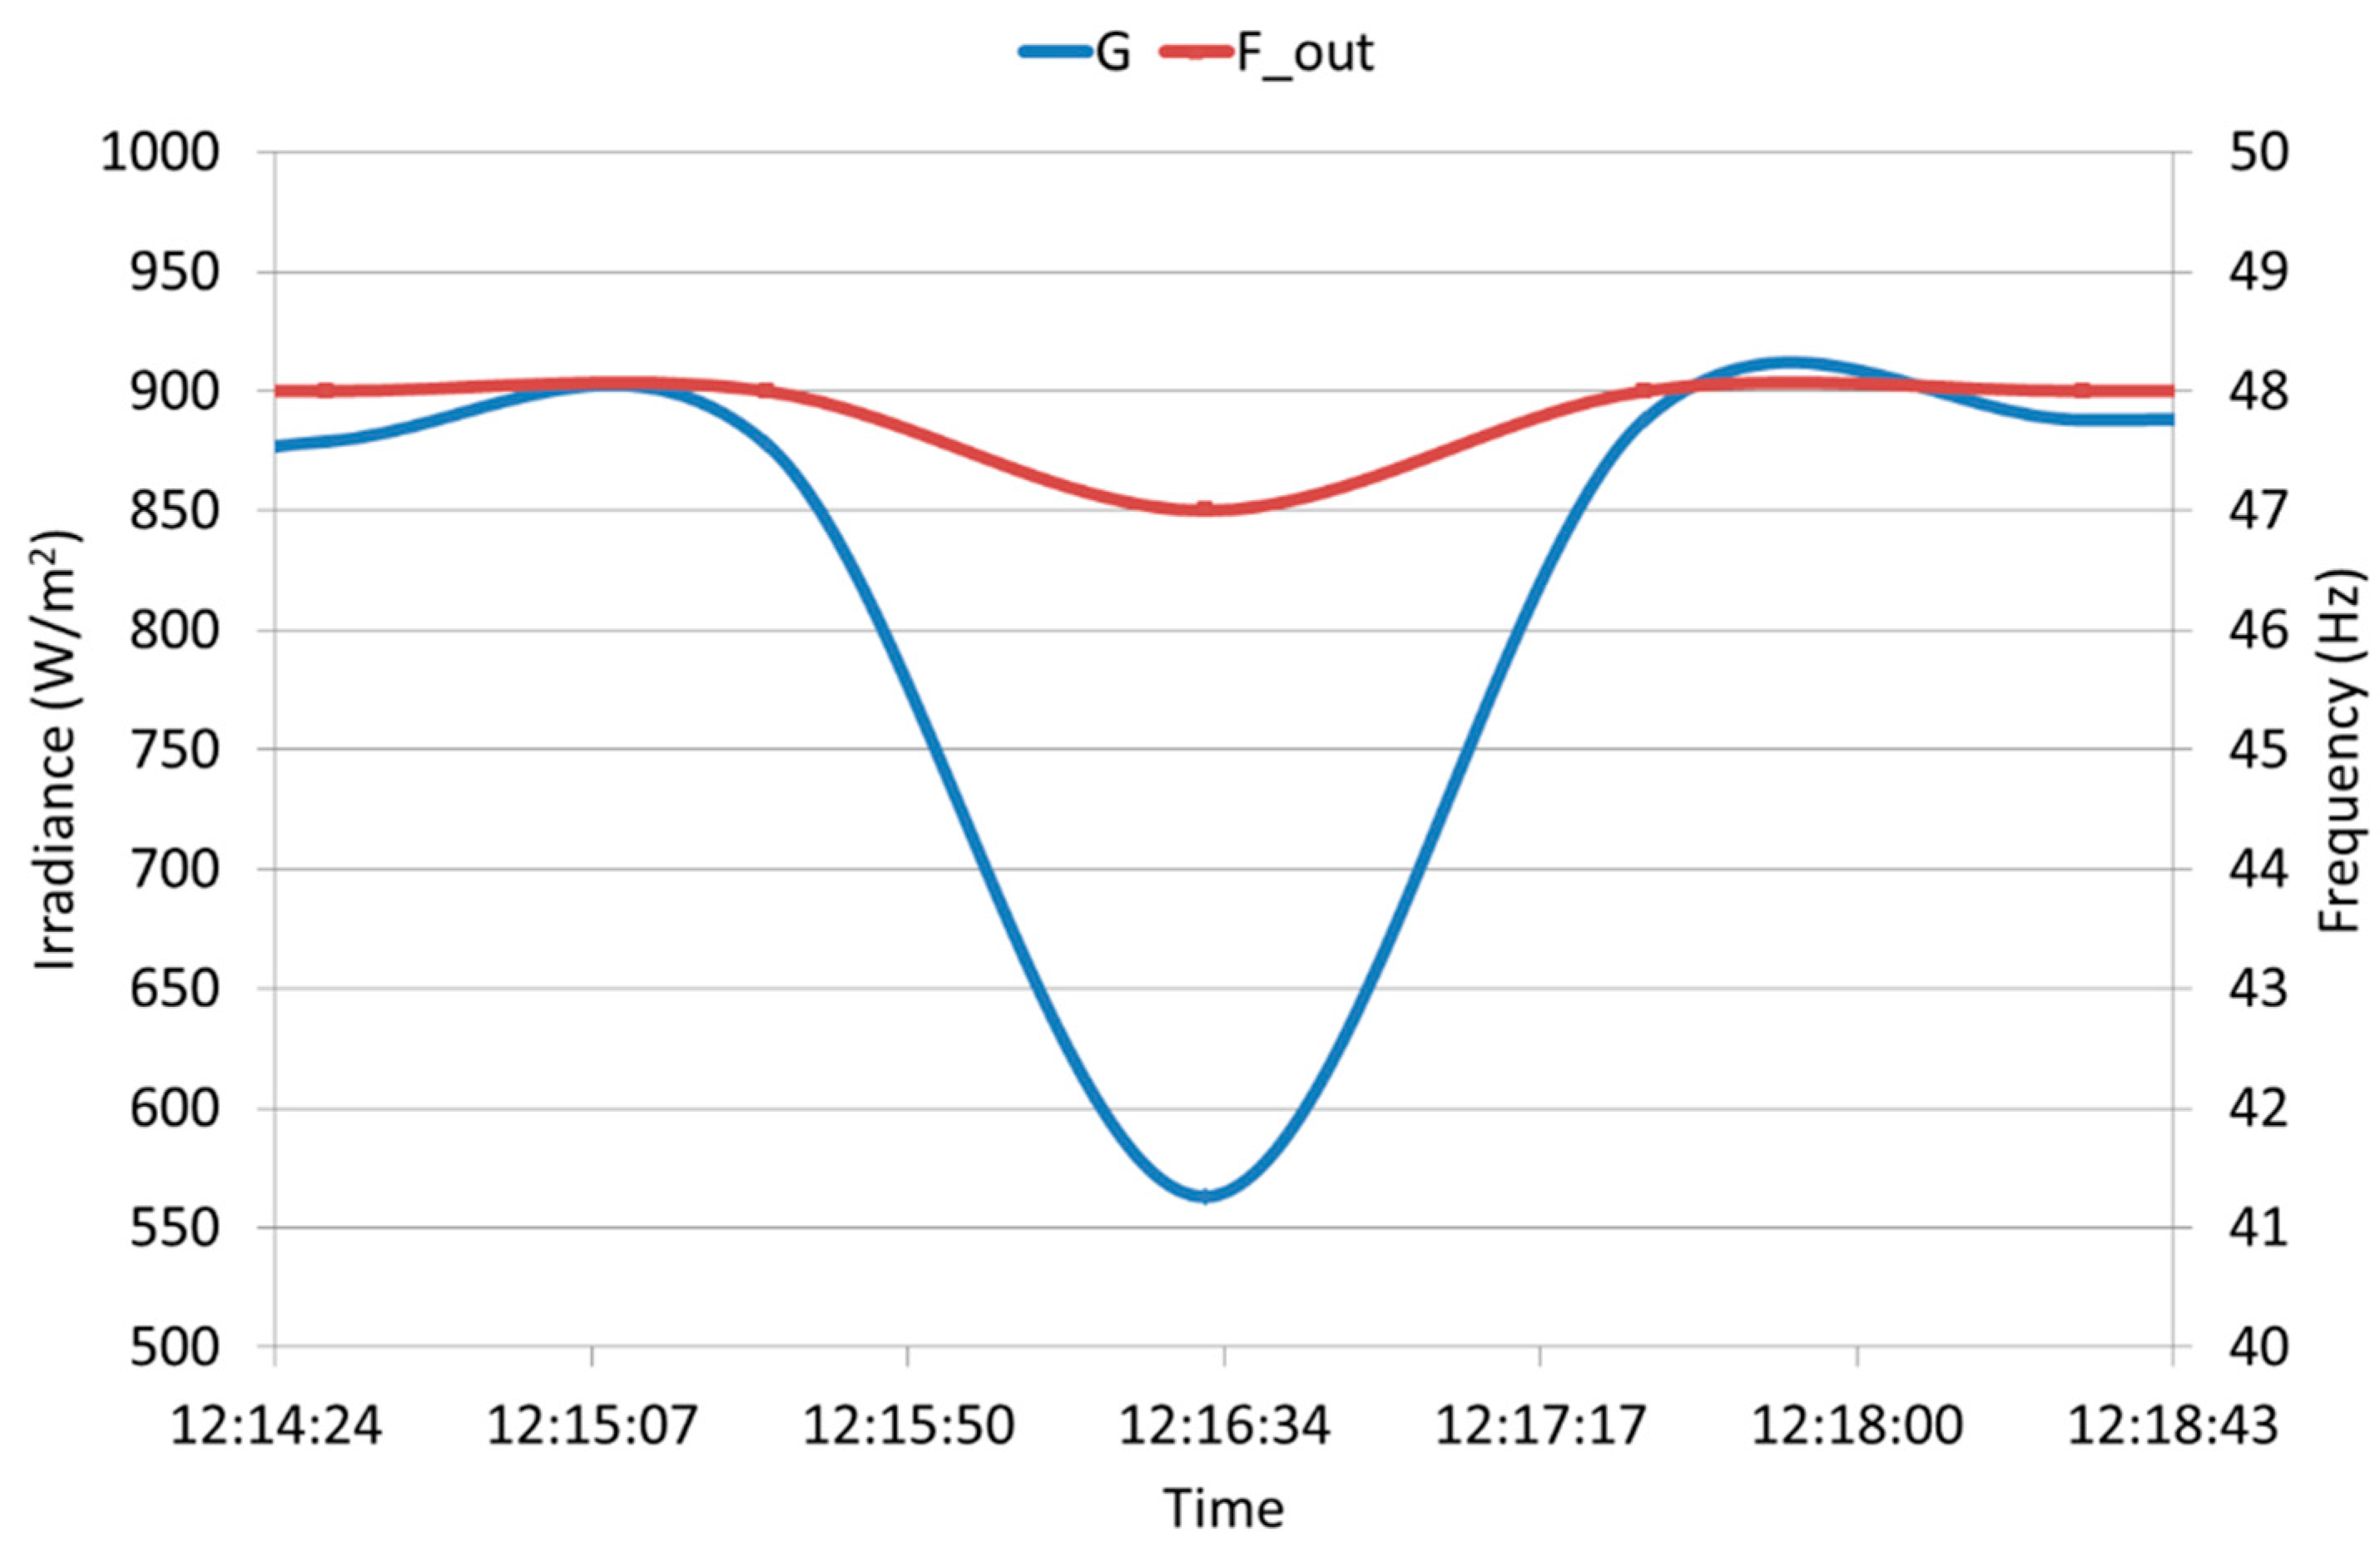
29]. On the one hand, the quick intermittence of PV power due to the passing of clouds (up to 80% of PV power variation in one minute [30]) can translate into control instabilities, leading to a sudden motor shutdown, encompassing the water hammer and AC overvoltage that seriously threatens the integrity of both the hydraulic and electric components [31]. On the other hand, PV production and water needs must match as far as possible in time [32,33] to maximize economic returns [34]. Moreover, where drip irrigation is concerned, the hydraulic pressure, and hence the electric power delivered to the pump, must be kept essentially constant [35].
The main novelty of this paper is that we have developed solutions for these two technical barriers and have applied them to the design and implementation of a large-power hybrid PV-diesel irrigation system that has been analysed during two years of operation in the framework of a European project [36]. Instabilities due to PV power intermittences have been addressed by specific control algorithms without the need of batteries [37], and the match between PV production and water needs for irrigation has been solved by using one-horizontal axis trackers. To ensure economic feasibility, batteries have been disregarded [
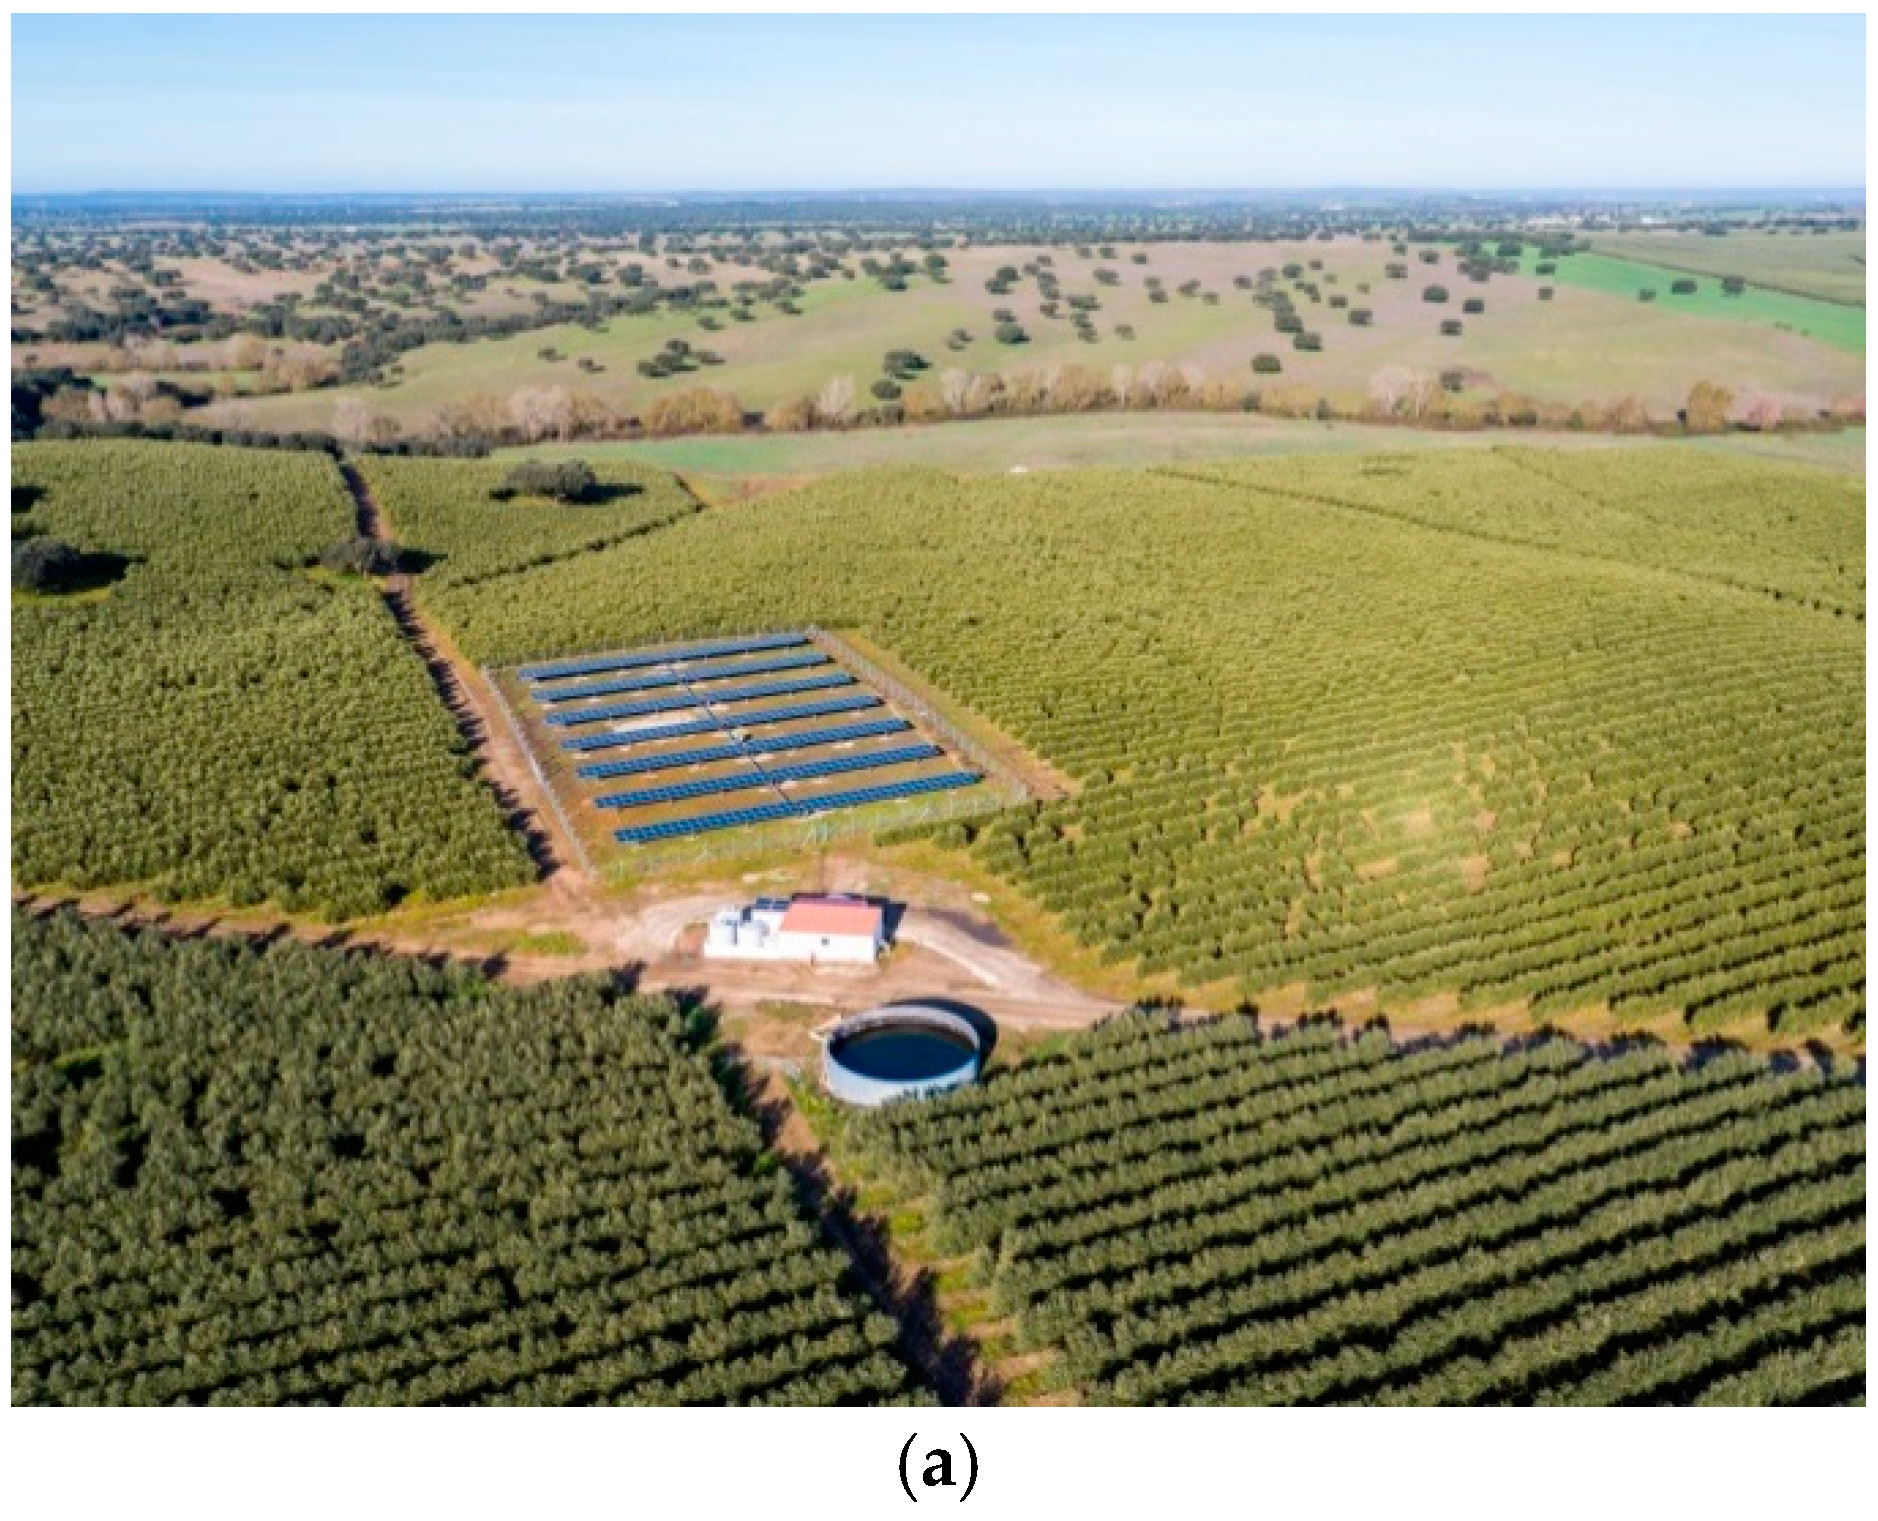
38]. These new solutions have allowed an increase of the range of powers to the ones that satisfy the irrigation needs of farmers, co-operatives, irrigator communities, and agro-industries. In fact, the hybrid PV-diesel irrigation system presented in this paper has a 140 kWp PV generator, which was the power required for the drip irrigation of 195 ha of olive trees in Alter do Chão (Portugal) belonging to the company ELAIA, which is part of the Sovena Group, one of the biggest producers of olive oil in the world.
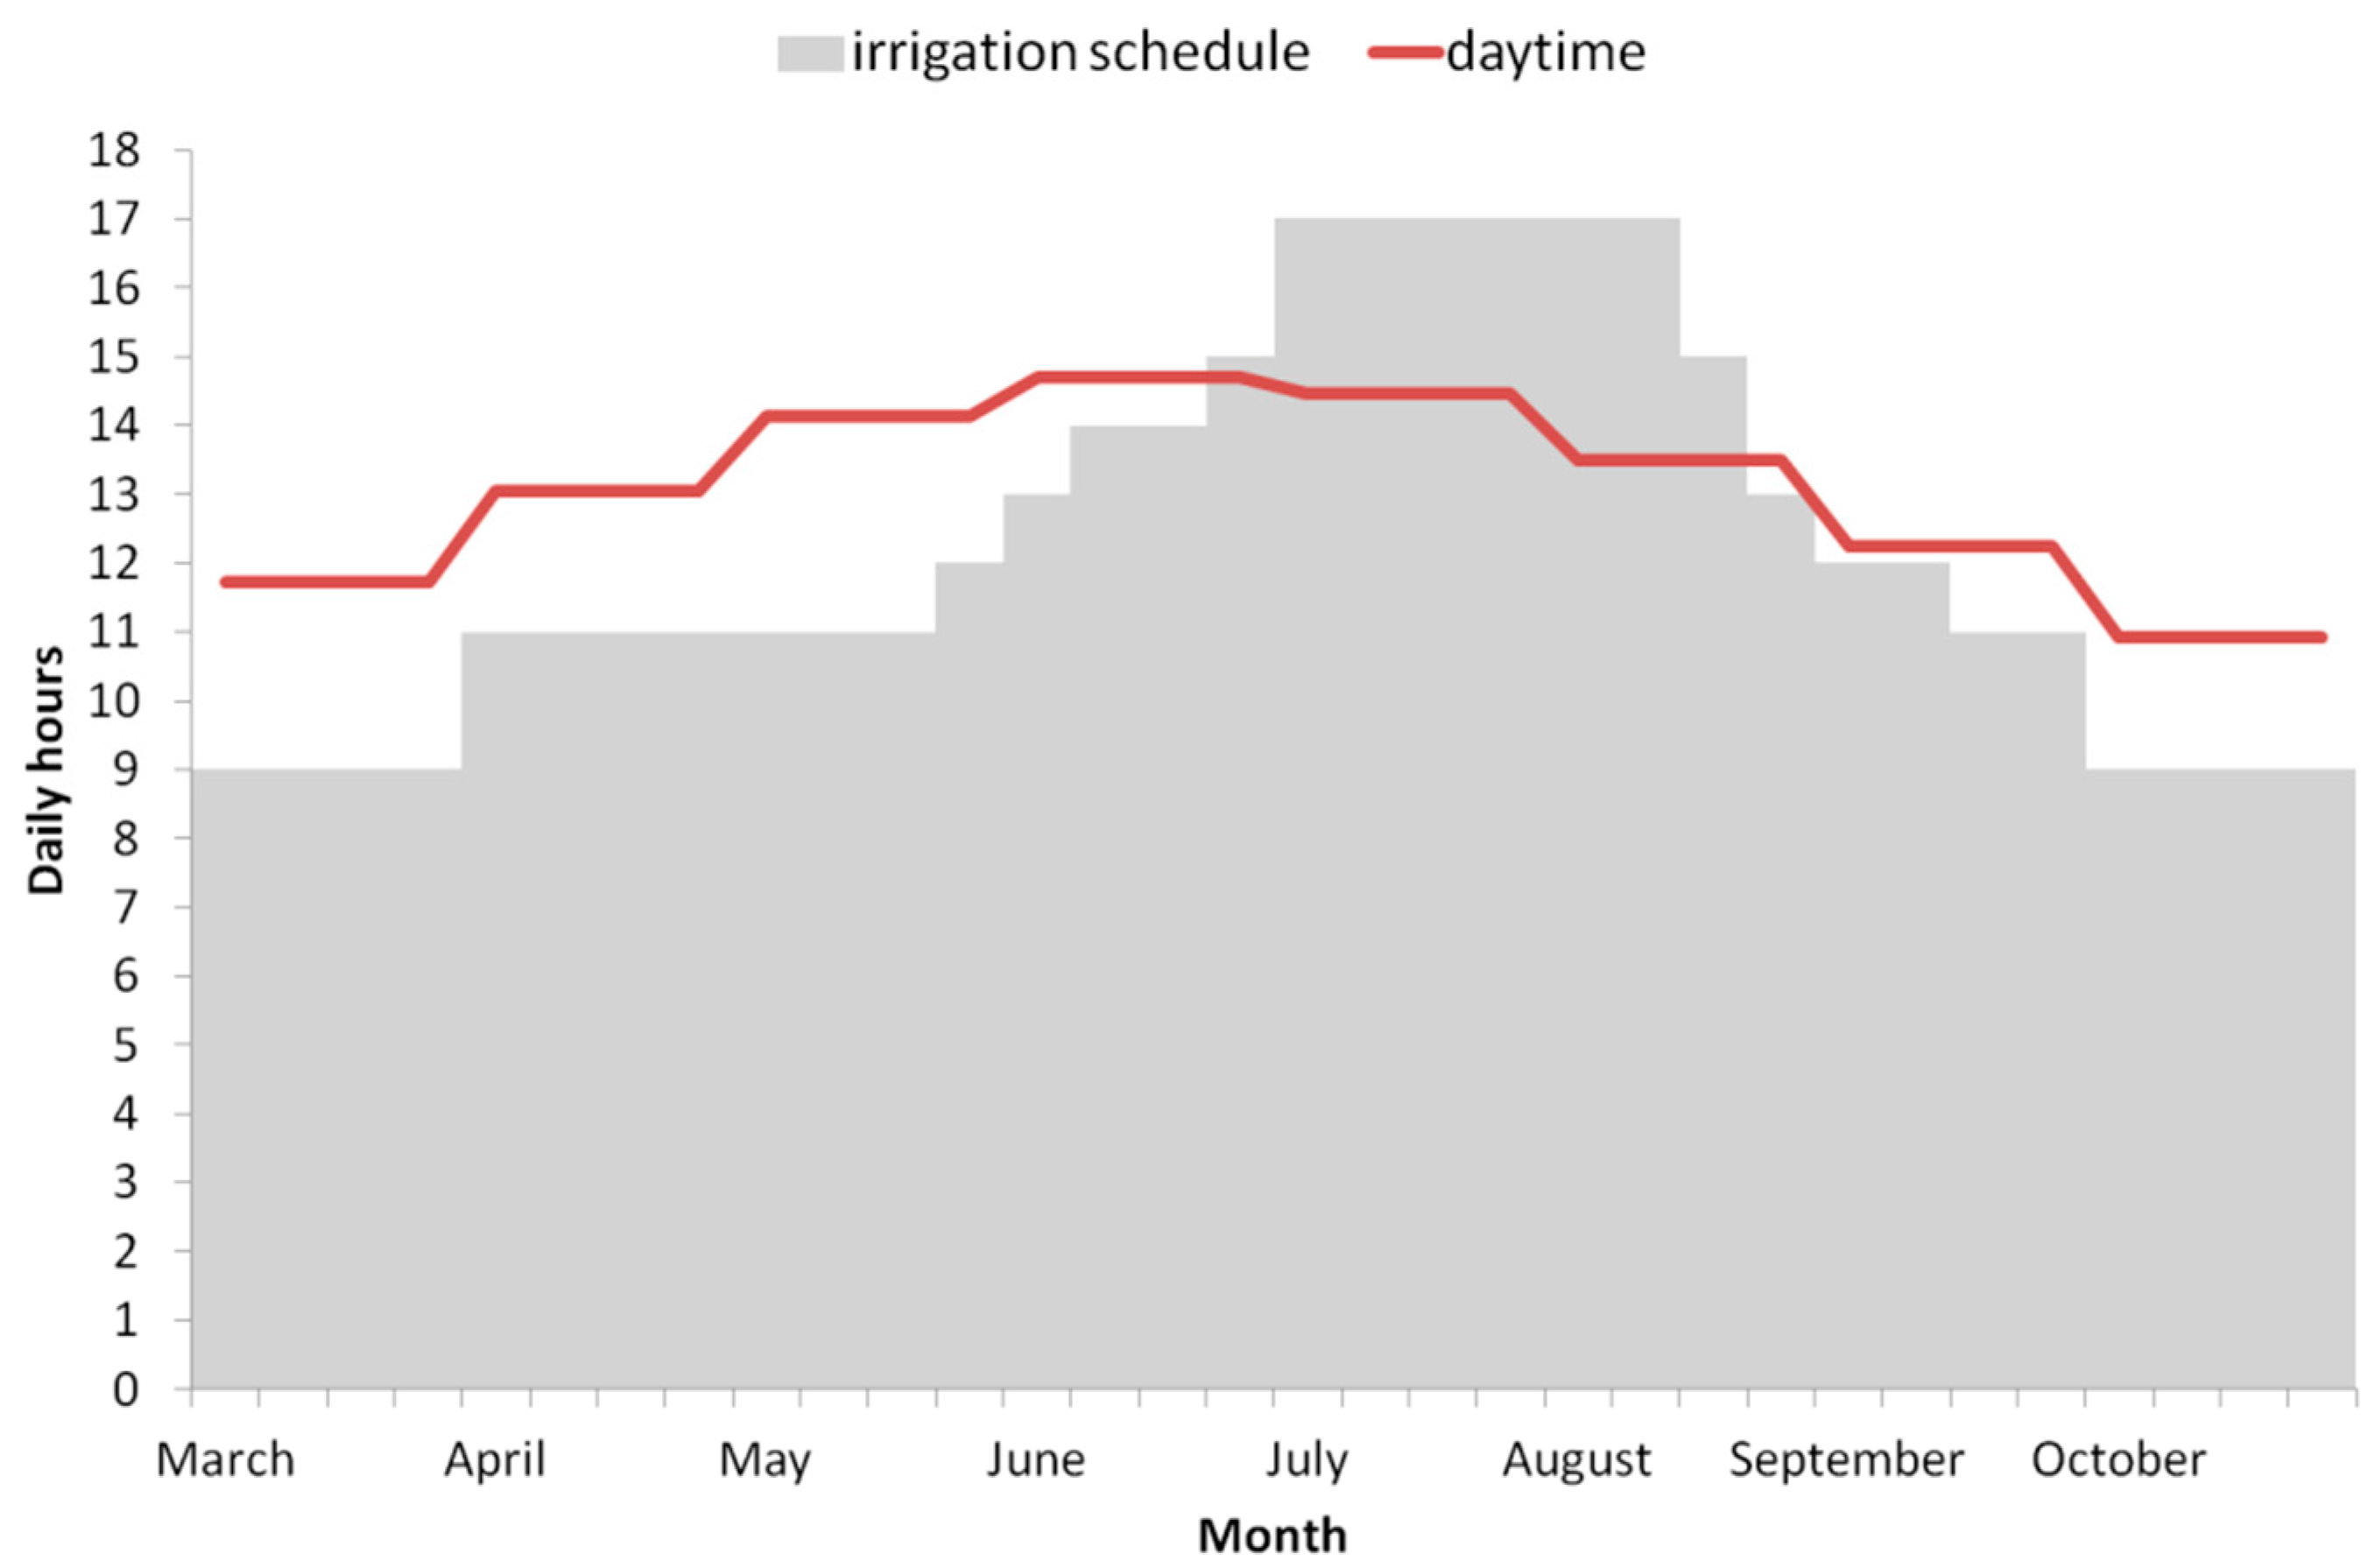
The second novelty of this paper is that the design has paid attention to the problem of integrating the novelty of PV into the pre-existing irrigation system, including the diesel generator. The pre-existing network requires up to 17 h to irrigate all the sectors of the farm due to the diameter of the distribution pipes, so irrigation with just the PV generator is impossible and hybridization with the existing diesel generator is required. A specific configuration based on hydraulic hybridization has been developed to maximize the use of PV electricity [39].
Furthermore, a third novelty is that, apart from the technical quality of the components, the performance of the PV system is not only affected by intrinsic-to-design characteristics (for example, pumping at a given head requires the irradiance to be higher than a certain threshold, which implies corresponding irradiation losses), but also by circumstances external to the system. In fact, the PV system only works when water is both available at the source and required by the plants [40]. The corresponding useful period (and, again, corresponding irradiation losses) substantially varies from case to case and from year to year. Therefore, to evaluate the performance of PV irrigation systems and, in particular, the performance of the system presented, new performance indices for distinguishing between the PV system quality and PV system use have been developed.
Finally, the economic feasibility of the new large-power hybrid PV-diesel irrigation system has been analysed based on actual operation data to determine whether the hypothesis that large PV power systems can be more competitive in the market than both small ones and alternative power sources can be confirmed.
This paper is structured as follows: Section 2 includes a description of the Alter do Chão irrigation system, both the pre-existing only-diesel system and the current hybrid PV-diesel system. Section 3 is dedicated to the presentation of performance indices for hybrid PV systems. Section 4 is about the in-the-field performance of the system during the irrigation campaigns of 2017 and 2018. Section 5 presents the study of the economic feasibility and the conclusions are summarized in Section 6.

2. The Alter Do Chão Irrigation System

2.1. The Pre-Existing Only-Diesel System

The yearly and daily evolution of the electric power requirements of the irrigation system needs to be deeply understood to address the PV system design. The pre-existing system (Figure 1a) was made up of two centrifugal pumps (Caprari MEC-MRS 100-2D 45 kW) fuelled by a 250 kVA diesel generator through a soft-starter and a 55 kW frequency converter (FC). The power of the diesel generator changes from year to year because it is rented to an external company that provides different models according to the availability. This is the reason for its oversized power. The farm has no access to the grid, so the electricity is only provided by the diesel generator.
The first pump is always kept at a nominal frequency (50 Hz) while the second one is controlled by the FC in such a way that the water pressure at the water outlet to the plants, p1, is kept constant at 5.7 bar. Since the water filter at the input of the irrigation network progressively becomes clogged with water impurities, the pressure at the output of the pumps, p2, and, in turn, the AC power demand, PAC, increases over time. There is also a filter cleaning device (fcd) that automatically reverses the water flow (from the output to the input of the filter) when the differential pressure at the filter, p2-p1, reaches 1 bar until the filter becomes clean. That typically happens once an hour and takes 5 min. During such short cleaning periods, the p1 suddenly decreases (because water is used for cleaning and not to irrigate the plants) and, consequently, PAC increases up to a certain limit imposed by the FC. Figure 1b shows this cycling evolution of p1, p2, and PAC. In addition, the system also includes a fertirrigation device, which is not included in the figure.
On the other hand, the pipe network is divided into seven different irrigation sectors covering areas corresponding from 27 ha to 30 ha and requiring water flows from 217 m3/h to 244 m3/h. The irrigation period (IP) is typically from May to October. Each day, every sector is activated sequentially and consequently the water flow varies from 217 m3/h to 244 m3/h following a timetable which is drawn up weekly by the operator responsible for the irrigation in accordance with the water needs of the olive trees (related to the difference between the evapotranspiration and the rain). It must be understood that, for a given volume of water, the irrigation time is a consequence of the section of the pipe network. This is implemented practically by means of an irrigation controller (Agronic 4000, from the Spanish company Progrés, Lleida, Spain), which automatically commands the shifts of the irrigation sectors and the diesel generator. This way, the daily irrigation time varies from week to week and the PAC required varies throughout the day in accordance with the different water requirements of the activated sector (this variation is in addition to the cycling behaviour due to the filter cleaning system). The key information to bear in mind is that, apart from the power peaks associated to the filter cleaning requirements, the PAC varies from 70 kW to 80 kW of stable power due to the different power demands of the sectors. The intensive cultivation of olive trees usually has its maximum water demand in July (around 500 m3/Ha), which obliges the irrigation operator to schedule approximately 2.5 h of irrigation per shift, per day. The irrigation lasts 17 h/day during this month, longer than the daily sun hours. Figure 2 shows an example of the weekly irrigation scheduling for a typical year. The figure also shows the sunlight hours, which are sometimes shorter than the irrigation schedule. This is the main reason for using a hybrid, i.e., not only PV, irrigation system.
The water inlet to the pumps is made up of a 300 m3 regulation tank (about one and a half hours of consumption) which, in turn, receives water from an external dam. In years with severe droughts, water is often restricted. These restrictions can affect both the daily volume and availability throughout the day. Sometimes water is not only scarce, but mainly available at night.
It is worth commenting that this pre-existing irrigation system is a representative case of the complexity of the irrigation infrastructures of modern agro-industries constituting the potential market for large-power PV irrigation systems.

2.2. The Hybrid PV-Diesel System

Inspired by concepts of the diffusion of innovations theory [41], we tried to minimise the technical risk perceived by the irrigation operator, applying a methodology of design of the new hybrid PV-diesel system, which contains the following steps:
  • The previous existing irrigation system and the new final PV-diesel hybrid irrigation system were defined;
  • to determine the novelty level, a comparison between the systems defined in the previous step was performed, recognizing the differences that are most significant, and determining the novelty level by analysing to what extent they will be seen by the users as an advantage or a disadvantage; and
  • a final design of the new PV hybrid irrigation system was established, aiming to reduce, as much as possible, the novelty level, especially in those aspects that could be seen as a disadvantage by the users.
Following this methodology, the PV system design adheres to three main considerations. First, the pipe network and the irrigation scheduling are fully preserved. Consequently, and according to Figure 2, a stand-alone PV is not enough and the hybridization with the pre-existing diesel system is required (possible changes in the pipe network to reduce the irrigation hours per day are not economically feasible).
Second, hybridization in the hydraulic part of the system was implemented (to reduce as much as possible the operation of the diesel motor) by means of a 140 kWp PV generator, a new pump identical to the pre-existing ones (motor-pump 3), and two additional 55 kW FCs (two Omron 3G3RX-A4550 acting as PV master FC and PV slave FC), as Figure 3 shows. A contactor was added to enable the change of energy source of the motor-pump 2 that can now be fed by the PV or diesel generators. We have also implemented an emergency button to allow the quick disconnection of all this new equipment, thus restoring the original “only diesel” configuration to obtain the confidence of the irrigator operator. This third pump could be avoided, but it allows a better uniformity of the irrigation in the transition between operating modes, a requirement strongly required by the irrigation operator, even though this additional pump barely affects the economic feasibility of the new system.
Third, to maximize the use of PV energy and therefore to minimize the diesel consumption, three operating modes were available: “Only PV” (Pumps 1 and 2 fed by the PV generator), “Hybrid” (Pump 1 fed by the PV generator and Pump 3 connected to the diesel generator), and “Only Diesel” (Pumps 2 and 3 fed by the diesel generator). Table 1 includes the ON/OFF status of the main components of the system in each case. The rotation between these modes follows the dynamics of the PV power available in accordance with the threshold values established in Figure 4. In practice, the ISC and VOC of a reference module are used for measuring the PV operation conditions: In-plane irradiance, G, and cell temperature, TC. Then, the available PV power at the output of the FC, PAC, is calculated [42] by a dedicated programmable logic controller (PLC) as:
P AC = P * G G * × η P × η T × η DC / AC
where P* is the nominal power of the PV generator; η P is the ratio real power versus nominal power of the PV generator, which includes the losses due to mismatching, dirtiness, and ageing of the PV generator; ηT = 1 + γ(TcTc*) is the thermal efficiency of the PV generator (γ is the power temperature coefficient of the PV modules, G is the effective irradiance on the PV generator, Tc is the cell temperature, and Tc* is the cell temperature at standard test conditions, i.e., 25 °C); and η DC / AC is the efficiency of the FC.
It must be noted that the threshold for changing from the “Only PV” to “Hybrid” modes is somewhat higher than the required stable PAC (80 kW). This is necessary to assure the stable behavior of the system. As revealed, during the initial tests, below this value, the surge in power demand due to the cleaning of the filters often translates into control instabilities.
Figure 5 shows (a) an aerial view of the hybrid PV-diesel system, and (b) the three motor-pumps and the water filter bench.
The system is carefully monitored by means of one-minute records of: G, Tc, DC power (PDC), p1, water flow, AC frequency, voltage, and current of each FC.

2.3. The PV Generator

The PV generator design obeys two key ideas. First, a horizontal axis tracker was selected because it provides a good adaptation between solar radiation availability and water needs [32]. This is for two different reasons. On the one hand, the daily profiles of G are reasonably constant during the IP, which obviously matches well with the constant power requirement of drip irrigation. An in-depth look at the constancy of irradiance profiles has been published previously [43]. On the other hand, the yearly evolution of daily irradiation is better adapted to the water required by the plants with this tracker than with a fixed structure facing to the equator [38]. In fact, during the IP, to pump the same water volume with both structures, the peak power of the static needs to be twice the one of this tracker [43].
Second, the size of the PV generator was selected so that on clear days, the PV generator suffices for powering all the irrigation system at midday on the equinox days, which is used as the limits of the irrigation period. Figure 6 shows the daily profile of G, for the equinox and for the summer solstice. Note that due to the irradiance profile of this tracker, G remains equal to or larger than the midday value, Gmd, during 9 h in the equinox and 11 h in the summer solstice. Then, assuming the irradiance on a surface perpendicular to the Sun is G* = 1000 W/m2 and ignoring the diffuse component, the Gmd on these days is given by:
G md = G * × cos ( φ )
where φ is the latitude of Alter do Chão. Now, introducing (2) into (1) and making reasonable assumptions for η P = 0.96, η T = 0.9, and η DC / AC = 0.95, this assures that PAC ≥ 80 kW leads to P* ≥ 125 kWp. For reasons of modularity (PV modules of 250 Wp, strings of 20 modules, and trackers with 7 rows), the final P* was established as 140 kWp.

2.4. The “Passing-Cloud” Algorithm

To avoid sudden instabilities in the FC due to PV power intermittences caused, for example, by passing clouds and, furthermore, to avoid changes of operation modes from “Only PV” to “Hybrid” or even to “Only diesel”, which requires an excessive number of starts of the diesel generator, control algorithms have been developed to support these intermittences without the need of batteries. The design criteria of excluding batteries is because of their high cost, which reduces the economic feasibility of the system, and also because batteries are unreliable devices in the system, reducing the robustness of the whole system.
FCs in PV irrigation systems usually have routines for tracking the maximum power point voltage of the PV generator (that is the same as the voltage of the DC bus of the FC) to maximize PV production [18,44,45]. Furthermore, they control the operating voltage of the PV generator and the frequency of the centrifugal motor-pump with a proportional-integral-derivative controller (PID) [46]. The DC voltage was regulated to have the maximum output frequency. The PID parameters were tuned to allow a stable and fast response against changes in the available PV power [44]. This tuning is a balance between a fast response and stability: The faster the response, the greater the probability of having instabilities when the available PV power changes. So, when, for example, a cloud passes over the PV generator, producing an intermittency in the PV power, the PID controller may not be fast enough and a specific algorithm is needed to avoid the instability and its corresponding abrupt stop of the FC and the associated water hammers and overvoltage between the frequency converter and the motor-pump, which reduces the lifetime of the system [37]. The control algorithm consists of the following steps:
  • Fast detection of an irradiance fluctuation by monitoring the DC voltage in the internal DC bus of the FC. When a cloud passes, the DC voltage decreases and if it goes down below the minimum DC voltage allowed by the FC (typical 400 V), an undervoltage alarm is activated and the FC stops abruptly. Therefore, to avoid it, when the DC voltage goes down below 500 V, Step 2 is activated. The speed of the detection is crucial, so it is necessary to have a feedback control signal without delay. Standard FCs offer feedback signals with delays in the range of 100 ms, which is excessive for reacting against an irradiance fluctuation. So, in our system, a direct and fast sensor of the DC voltage has been added to the FC;
  • once the fall in irradiance is detected, the PID controller is switched-off and power regeneration in the centrifugal pump is produced by reducing its frequency to keep the DC-bus voltage of the FC stable. This avoids any abrupt stop of the FC since it eliminates the occurrence of undervoltage errors; and
  • the PID controller is restored with the original parameters for normal operation at this new frequency. If the cloud has not passed in one minute, a soft controlled stop is done.
Figure 7 shows a diagram illustrating this control strategy.

2.5. Operation Scenarios

The annual performance of the PV hybrid system is very dependent on the corresponding water availability [47], which typically varies between two extremes.
On the one hand, an optimistic scenario defined by the absence of water restrictions. Then, the plant’s water needs are fully covered and water is available throughout the day (the system can only work in either the “Only PV” or “Hybrid” modes). On the other hand, a pessimistic scenario, defined by severe water restrictions. Then, water provision to the plants is restricted to assure survival and minimum production. Table 2 shows the result of combining water availability and PV potential for these two scenarios. The details of the water restrictions in these scenarios have been suggested by the previous experience of the irrigator operator. PV energy, EPV; volume of water pumped by the PV and by the diesel, V m PV and V m diesel , respectively; and the diurnal working time, WTday, in “Only PV” or “Hybrid” modes are given for each month and for the full irrigation period. It is worth noting that the figures for these scenarios are restricted to the irrigation period and daytime. Additional water can be pumped by diesel during the night, but this has been disregarded here because it is not related to PV hybridization. Simulations have been carried out with a freely-available software tool called SISIFO [48]. Solar climate data are as given by PVGIS [49] and corresponding daily irradiance profiles were derived using SISIFO, by selecting the Erbs model [50] for the decomposition of monthly global values in direct and diffuse components, the Collares-Pereira and Rabl model [51] were selected to derive the instantaneous irradiance from daily irradiation values, and the Perez model [52] was selected for transposition from horizontal to in-plane diffuse irradiances. The Martinez shading model [17] was also used in this simulation, the soiling and ground reflectance were established at 2% and 0.3, respectively, and the simulation time step was 1 min. Regarding the ambient temperatures, the simulation tool could generate the time series using a cosine type interpolation model. Table 3 includes some other parameters of the simulation.
Note that water restrictions in the pessimistic scenario mean that only 39% of the PV potential was finally used.

3. Performance Indices for Hybrid PV-Diesel Systems

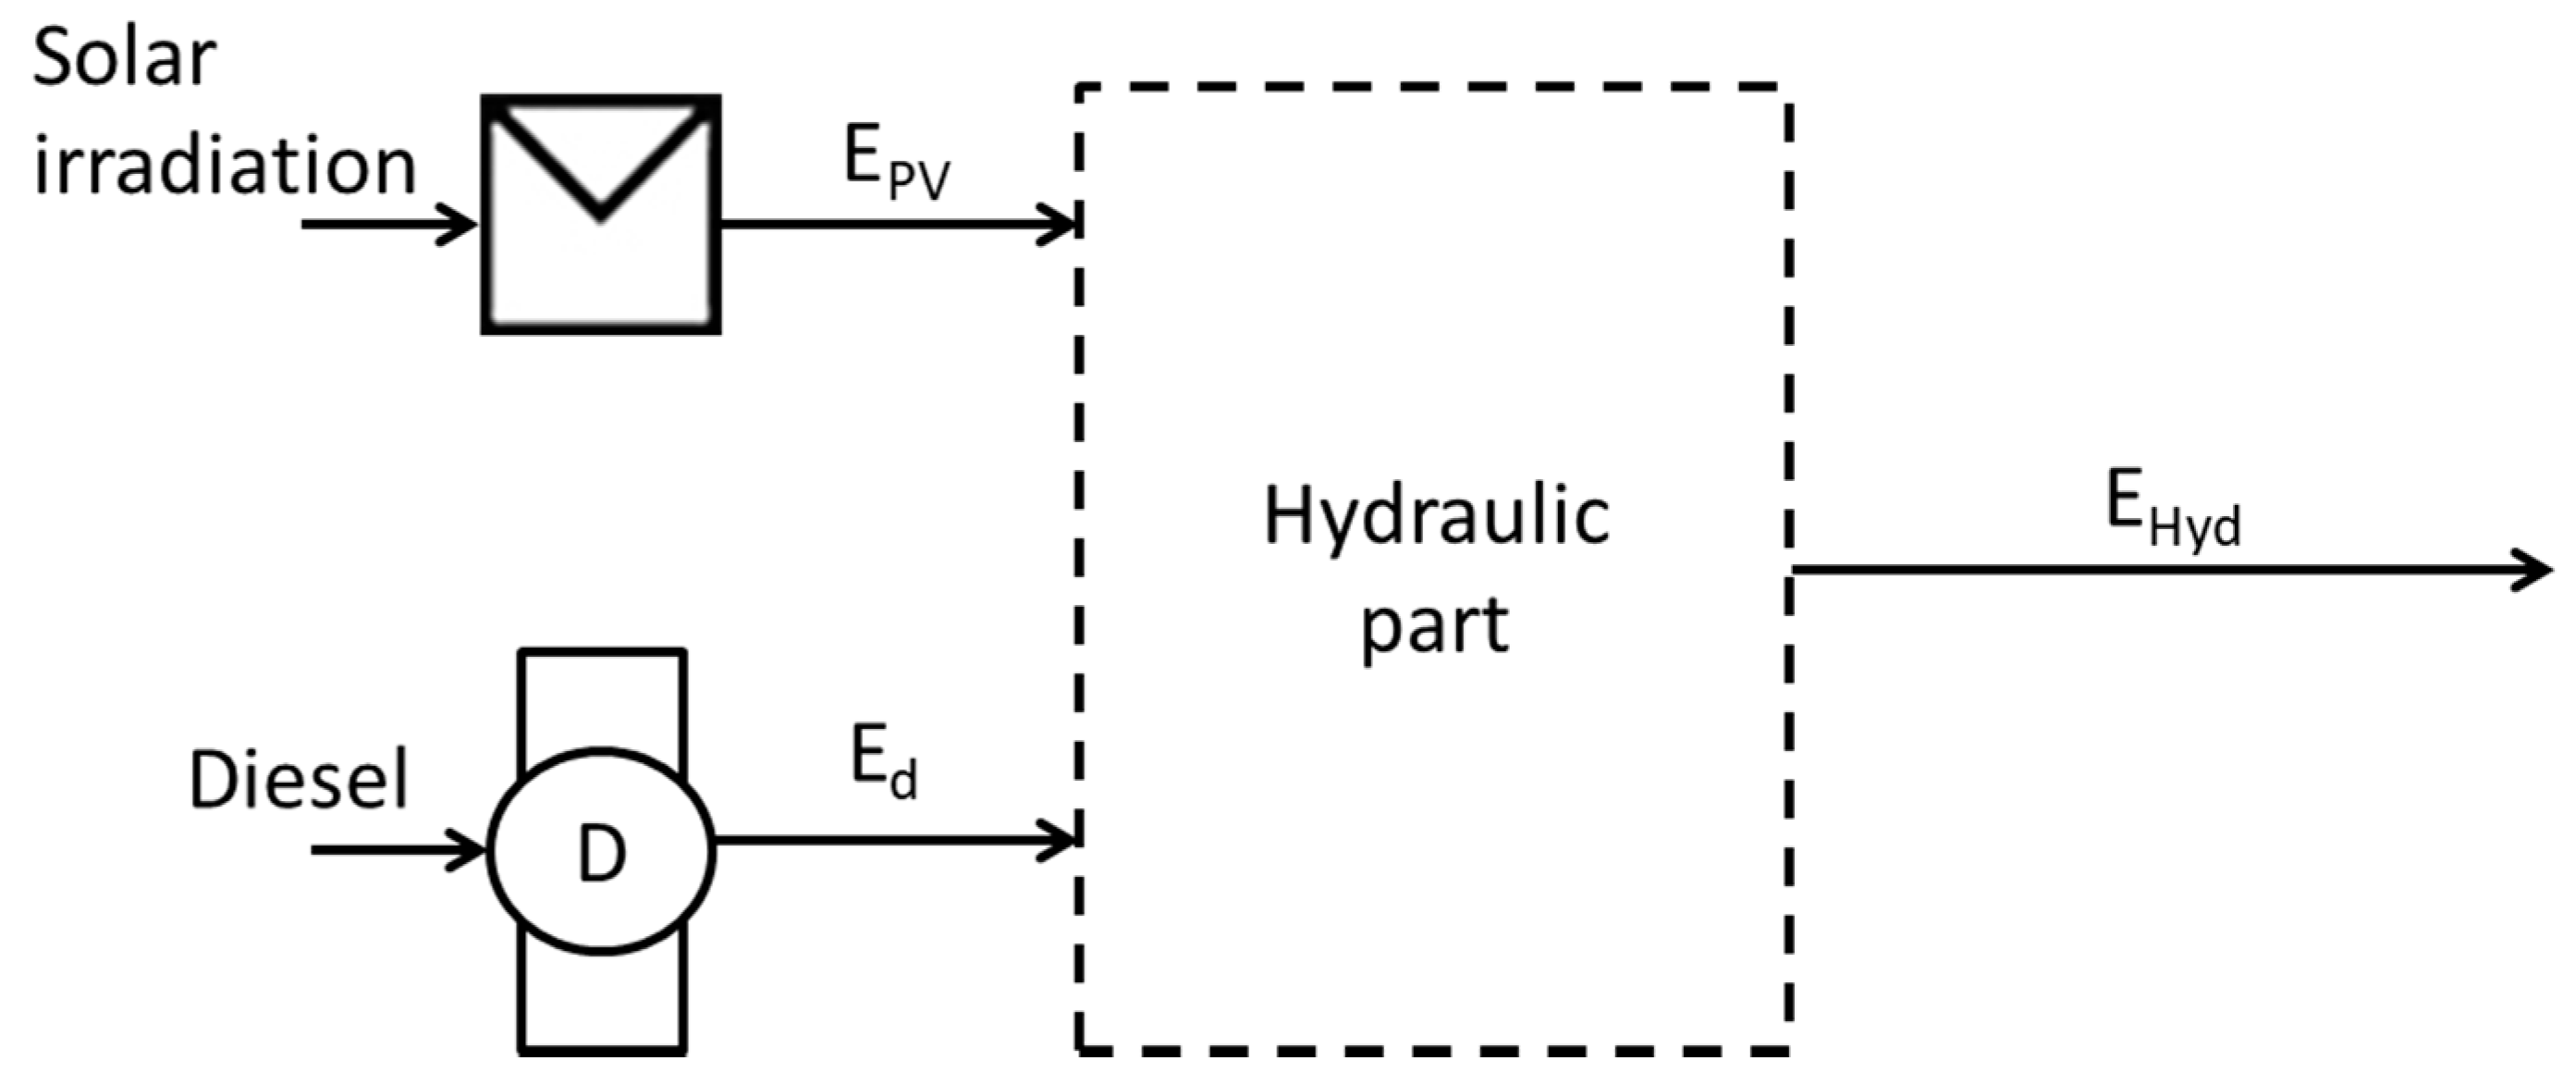
This section proposes a set of indices for qualifying the design and operation of a general PV-diesel hybrid system. First, the energy balance is described in Figure 8 and quantified by means of three ratios defining the PV share (PVS), the PV performance (PR, the index most used by the PV community, [53]), and the hydraulic efficiency ( η Hyd ), respectively. The following equations apply:
P V S = E PV E PV + E d
P R = E PV P * / G * × 1 G d t
η Hyd = E Hyd E PV + E d
where EPV and Ed are the energy supplied by the PV generator and the diesel generator, respectively, EHyd is the hydraulic energy, and ηHyd is the efficiency of the hydraulic system. The following comments apply.
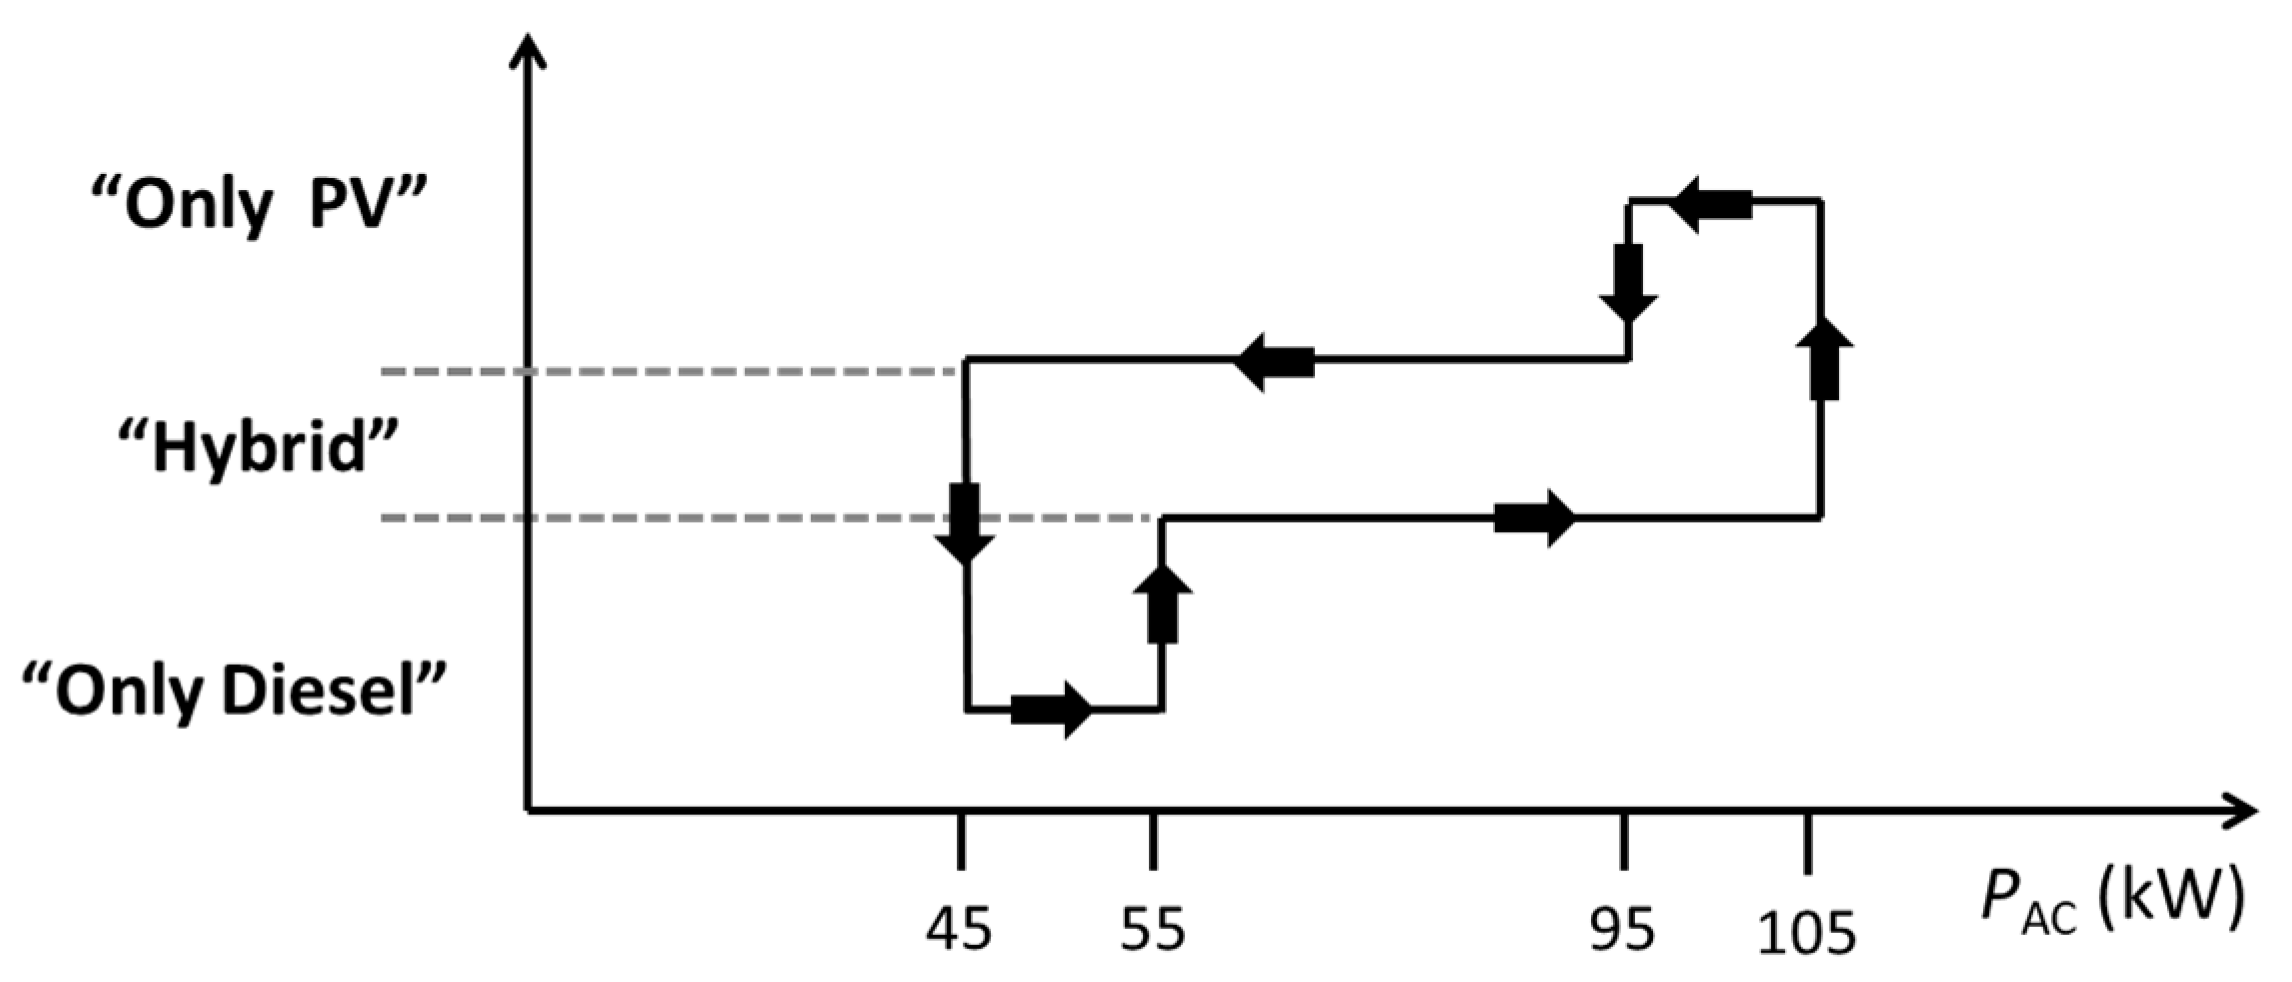
On the one hand, from the PV engineering point of view, the two operational modes involving diesel are different. In the case of systems designed for being powered mainly by PV during the daytime, the “Only Diesel” mode becomes relevant mainly at night-time and is somewhat out of PV’s concerns. On the other hand, the “Hybrid” mode only occurs during daytime and is directly related to the design of the PV system. Therefore, it is interesting to distinguish between a PVS characteristic of the overall operation, which is of interest to the user, and a PVSH characteristic solely to the “Hybrid” mode. That can be easily done by defining a hybrid diesel ratio, HDR, as:
H D R = E d H E d H + E d O
where E d H and E d O are the energy supplied by the diesel generator in the “Hybrid” and “Only Diesel” operation modes, respectively. Then, Equation (4) can be rewritten as:
P V S = E PV E PV + E d H / H D R
and:
PVSH = PVS(HDR = 1)
Furthermore, the PR is widely used in general PV environments and provides an indication of both the technical quality of the PV system’s equipment and the efficient use of the available irradiation. It is interesting to distinguish between irradiation losses for three essentially different reasons: The non-irrigation period, the intrinsic characteristics of the PV system design, and the external circumstances. For that, multiplying and dividing by the same factors, the PR could be expressed as follows:
P R = E PV P * / G * × 1 G d t × IP G d t IP G d t × G useful d t G useful d t × G used d t G used d t
where IP is the irrigation period determined by the crop and its water needs; Guseful is the available useful irradiance during the IP determined by the relationship between the P*, the PV generator structure, and the type of irrigation system—water pool or constant pressure; and 
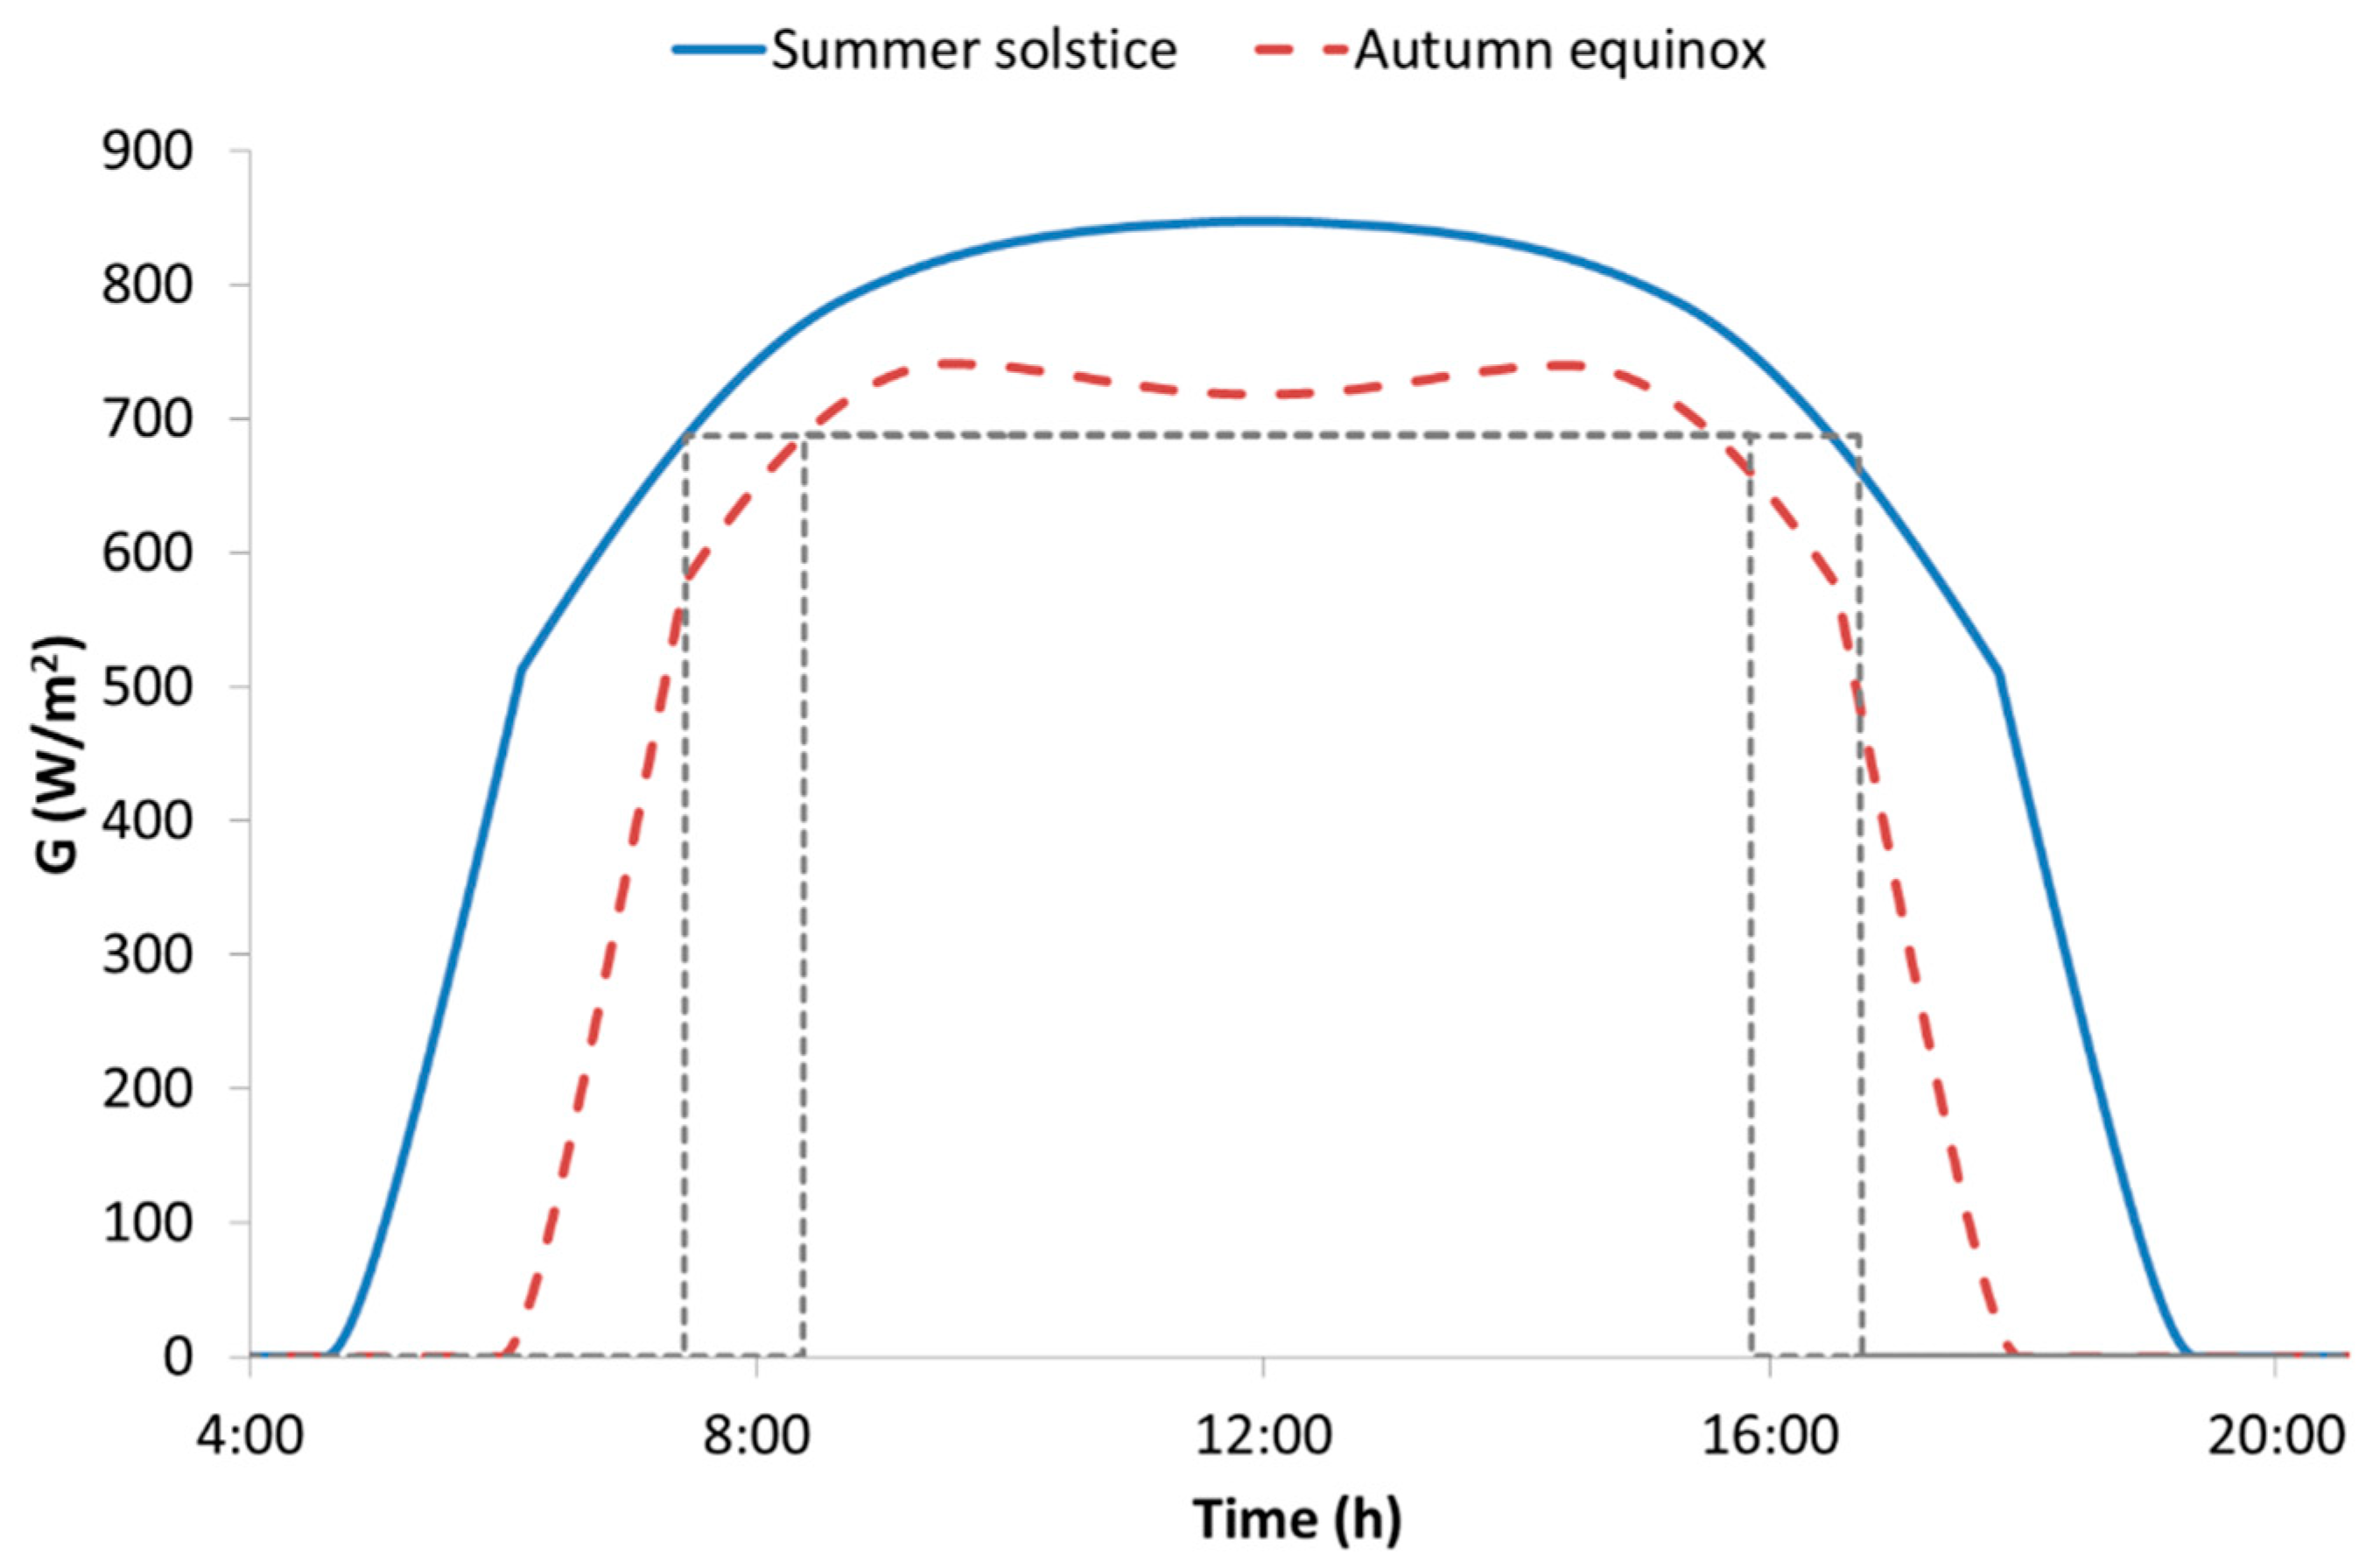
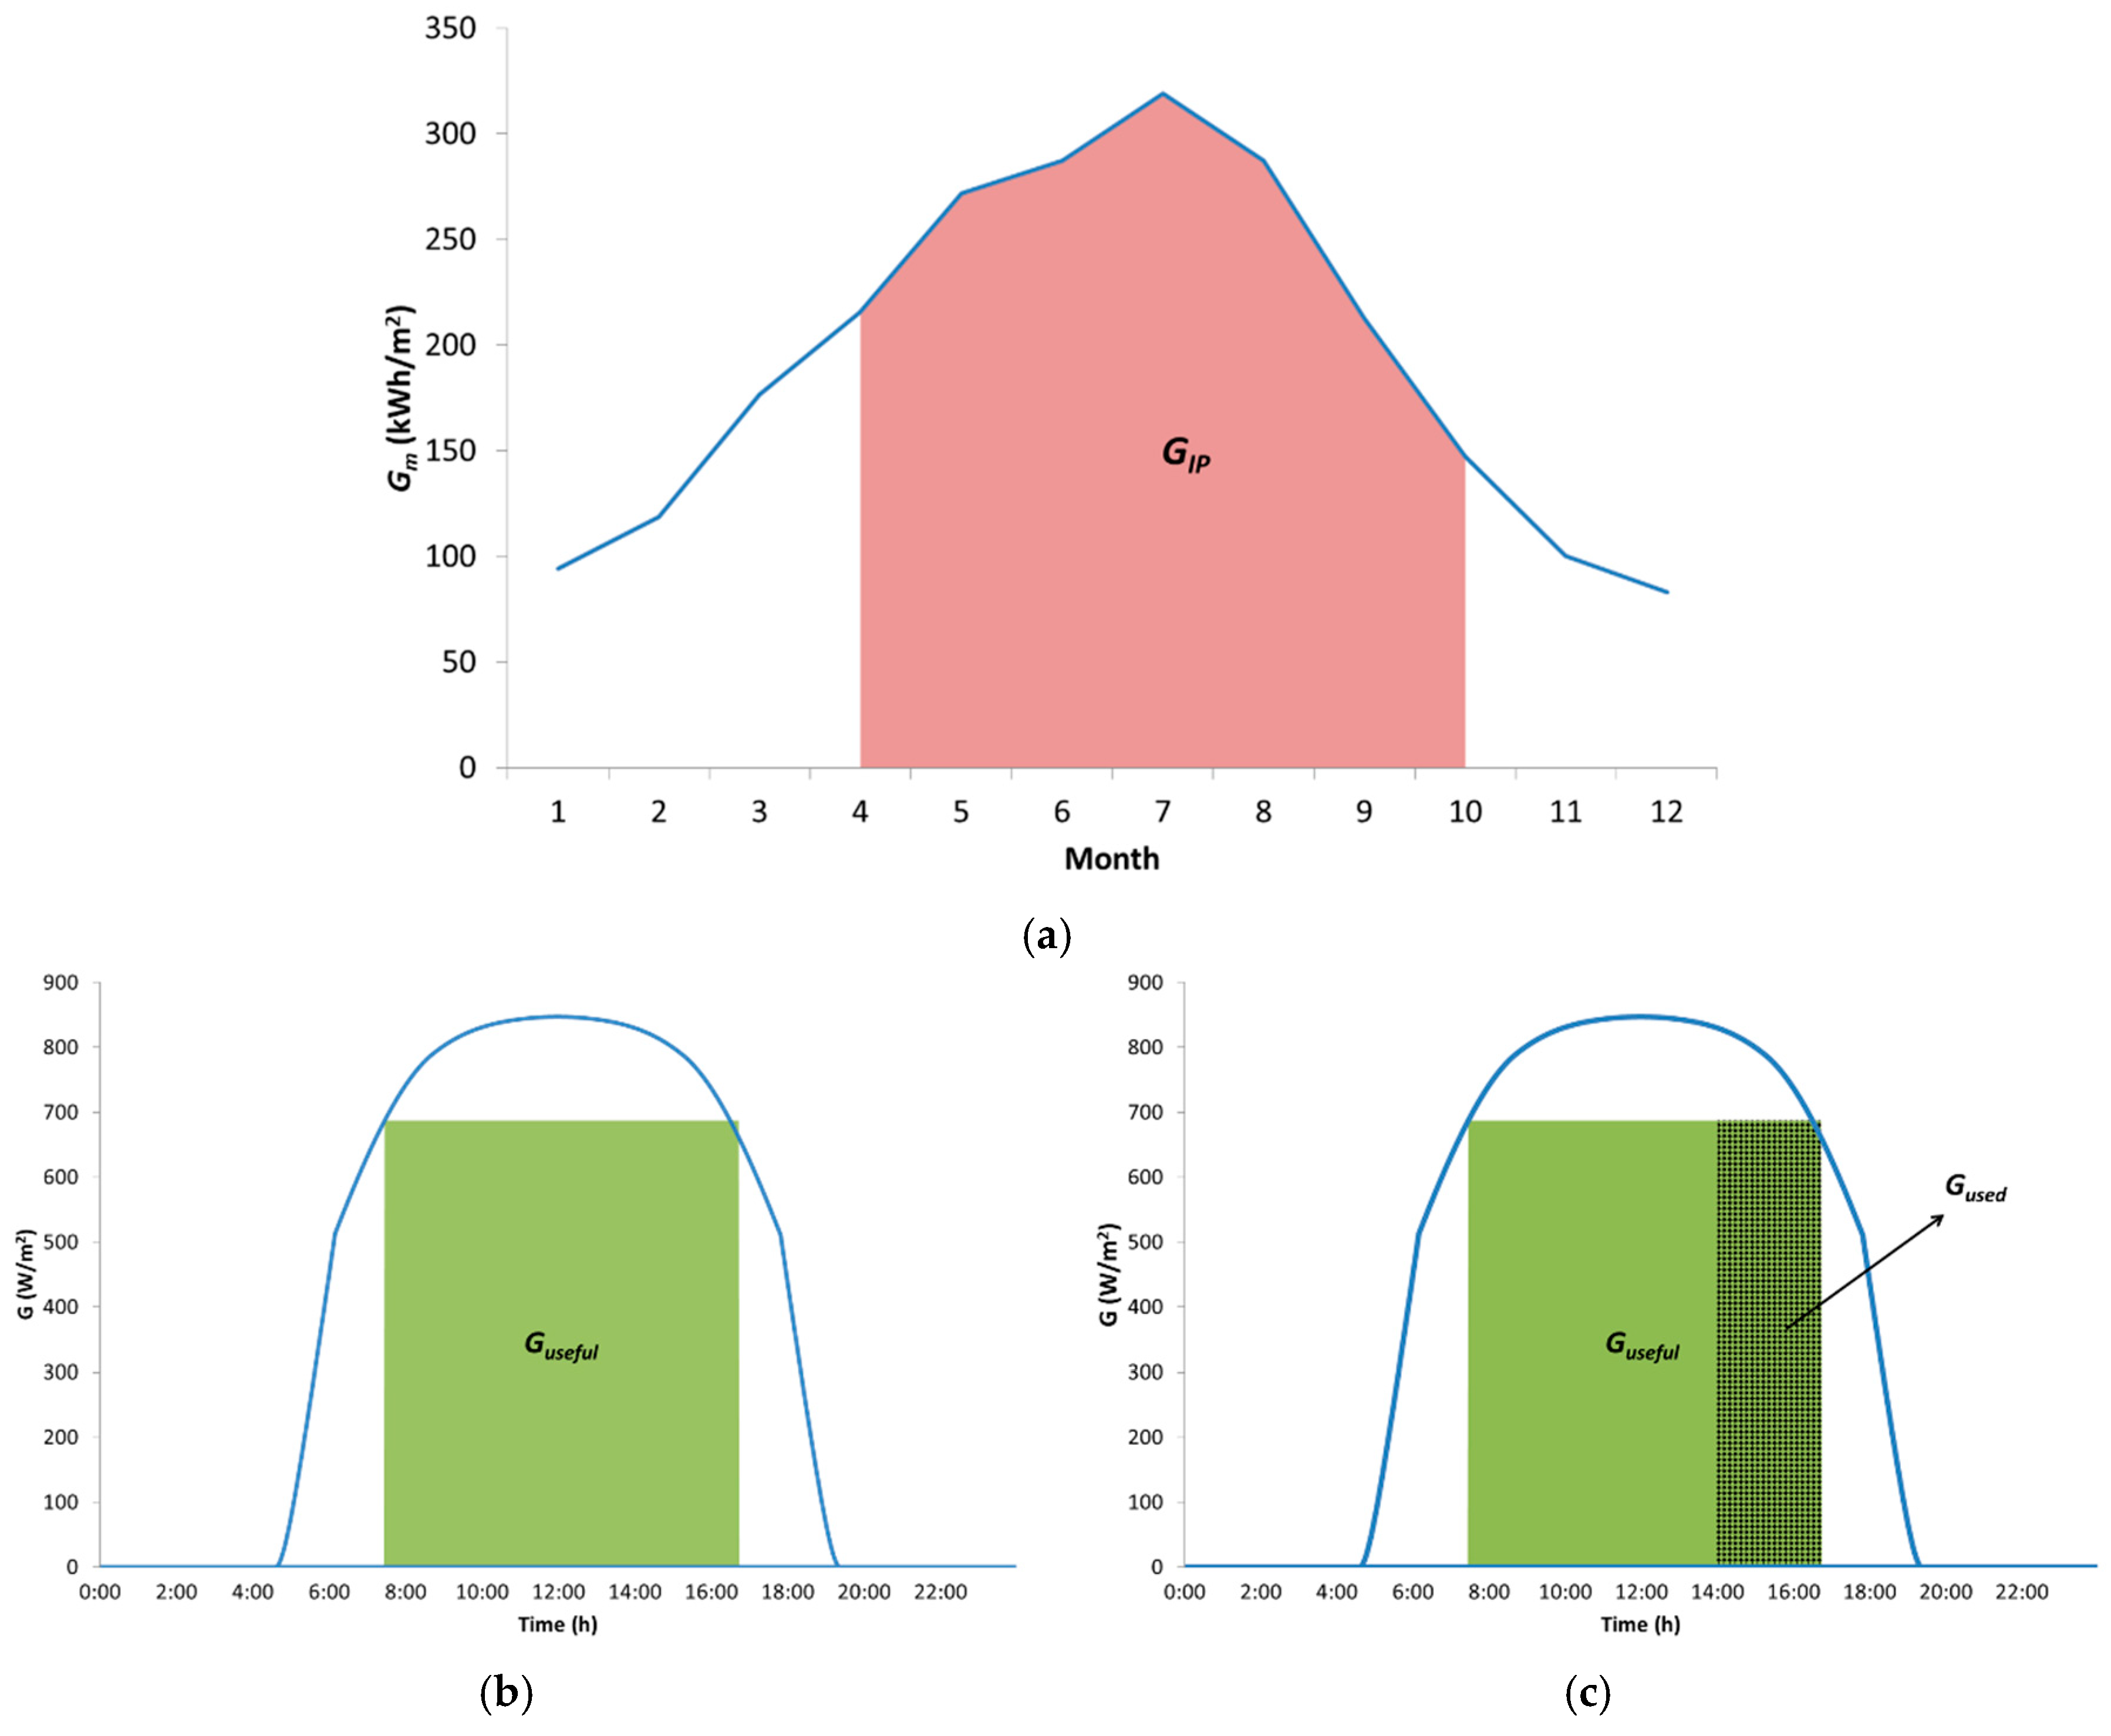
Gused is the irradiance effectively used by the system. To clarify these concepts, G during IP GIP, Guseful, and Gused are shown in Figure 9 for a constant pressure system, like that analyzed in this paper. It can be shown that GIP is the total irradiance during the irrigation period determined by the water needs of the olive trees (Figure 9a). 
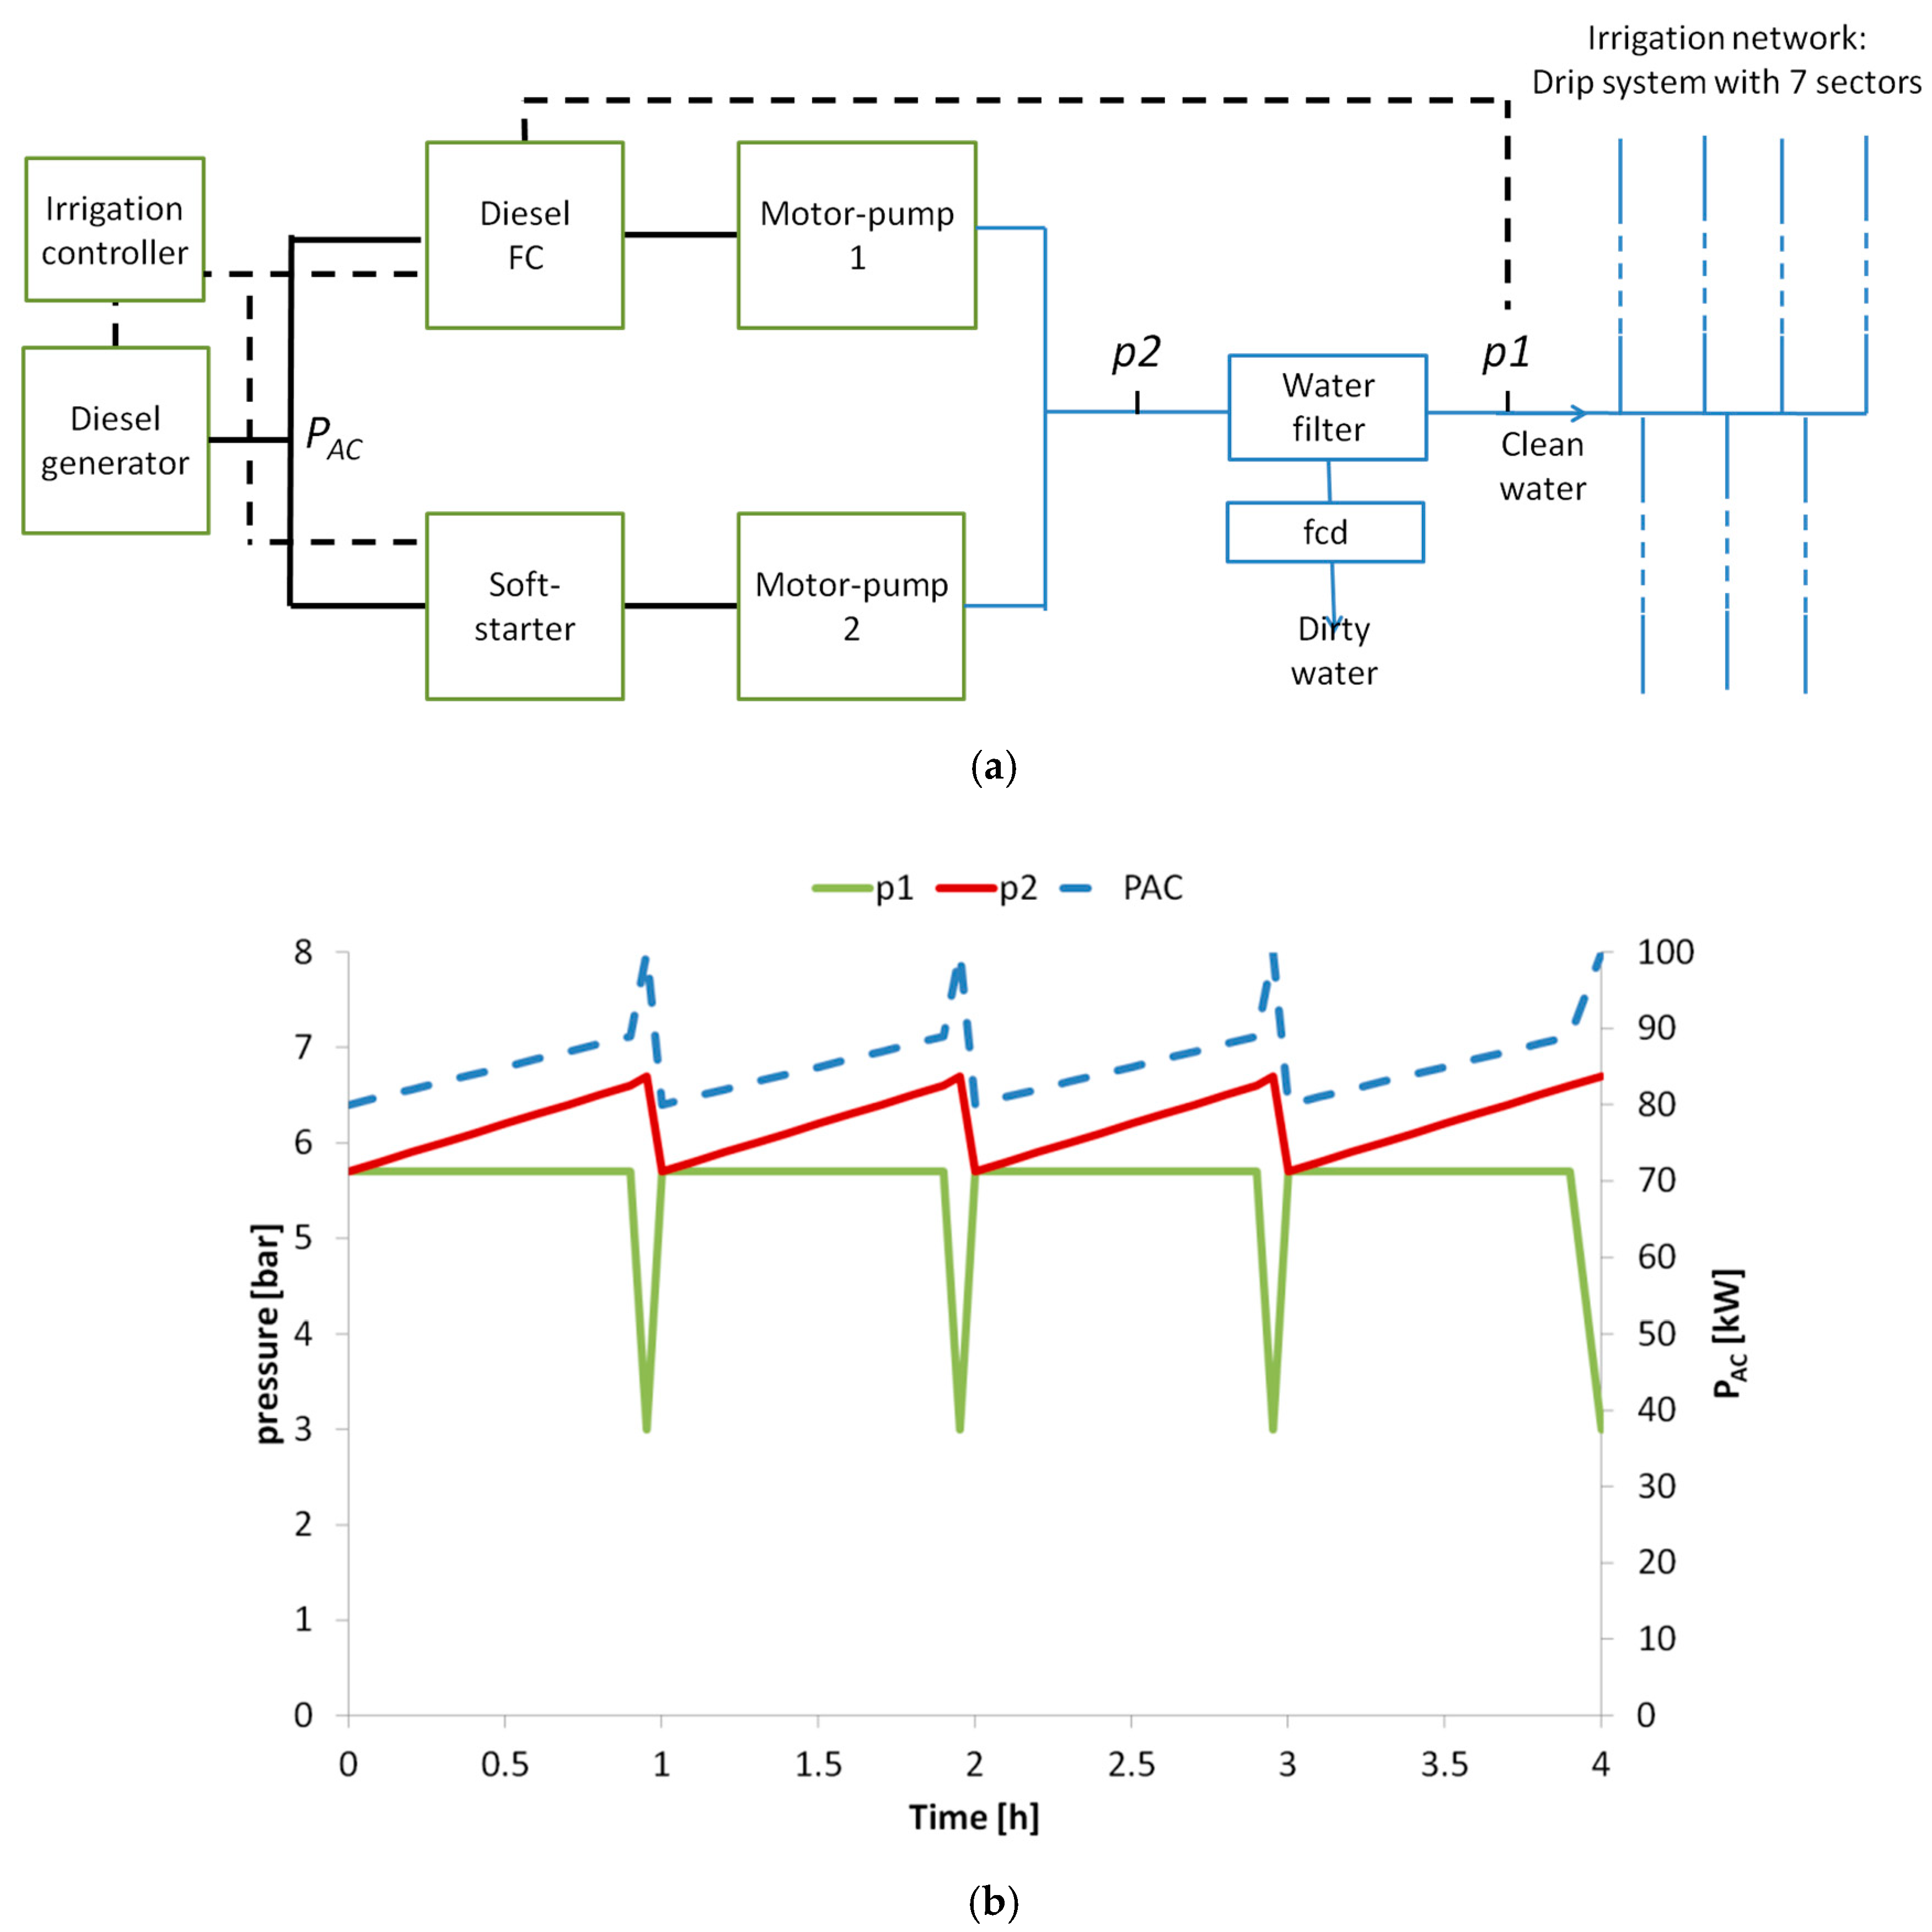
Guseful is the irradiance required to deliver the 80 kW needed to pump at a constant pressure of 5.7 bar (Figure 9b). It is worth noting that with irradiances below Guseful, it will not be able to pump because the required pressure would not be reached and irradiances higher than Guseful will be partially wasted because the system works at constant pressure. Finally, Gused is the part of Guseful that has been used effectively due to the availability of water and the irrigation scheduling (Figure 9c). In this last figure, the irradiance from 7 am to 14 pm was wasted due to the irrigation scheduling or the lack of water during this day and not because of technical problems in the PV system or the needs of the crop.
Now, it is possible to rewrite Equation (9) as:
P R = P R PV × U R IP × U R PVIS × U R EF
where:
P R PV = E PV P * / G * × 1 G used d t This is the PR considering only losses strictly associated with the PV system itself, i.e., actual versus nominal peak power, dirtiness, thermal, and DC/AC conversion losses. It is intrinsic to the technical quality of the PV component and its maintenance.
U R IP = IP G d t G d t This is the ratio of the total irradiation throughout the irrigation period to the total annual irradiation (Figure 9a). It is intrinsic to a given crop. Note that it is one if the analysis is done on a month inside the irrigation period.
U R PVIS = G useful   d t IP G d t This is the ratio of the irradiation strictly required to keep PAC equal to the stable AC power requirement (80 kW, see Section 2.1) to the total irradiation throughout the IP (Figure 9b). It is intrinsic to the PV irrigation system design; specifically, it depends on the type of irrigation system (direct pumping or pumping to a water pool), the ratio between the PV peak power and the stable PV power required for irrigation, and on the tracking geometry.
U R EF = G used   d t G useful   d t This is the ratio of the irradiation required to keep PAC stable during the irrigation scheduling to the same irradiation during the IP.
Finally, when the PV system is hybridized with already existing diesel facilities, as in the Alter do Chão case, the diesel-efficiency, which is usually expressed in terms of the specific fuel consumption (liters per kWh), which is not a matter for the PV engineer and can be disregarded.
It might be thought that using as much as nine indices for describing the performance of a PV system is just too complex. However, we think this is in coherence with the intrinsic complexity of large modern irrigation and not particularly cumbersome to implement within the automatic control frame characteristic of this type of irrigation. Moreover, it must be understood that the set of these nine indices constitute a general evaluation frame that becomes reduced for simpler irrigation. For example, for stand-alone PV systems pumping to a water pool throughout the year, which is likely the most commonly imagined PV pumping system, Ed = 0; PVS = 1, URIP = 1, and UFEF = 1. Hence, the relevant indices are just the PR and URPVIS.

Performance Indices for the Two Scenarios

Table 4 shows the values of the performance indices for the two scenarios. At first glance, one can expect a higher PVSH in the optimistic scenario, although this does not happen because the lower the number of irrigation hours, the higher the PVSH (if the irrigation is centered at midday).
The annual PR for the optimistic scenario was 0.37, while that for the pessimistic scenario, was 0.15. These values might be surprising when considering typical values in the grid connection, which is currently the most extended PV application, range from 0.75 to 0.90 [54,55,56,57]. However, it must be understood that the economic framework of grid and diesel electricity generation differs considerably. The typical cost of diesel electricity is about 0.3 €/kWh. Thus, assuming that the PV electricity cost for being competitive in a grid connection is about 0.05 €/kWh, it is easy to deduce that PV can compete with diesel electricity for PR > 0.8/(0.3/0.05) = 0.13. A detailed analysis shows that the P R PV is similar in both cases; the URIP is lower in the pessimistic scenario due to the low use of the system both on a monthly and daily basis; the monthly URPVIS is the same in both cases since this index is only related to the design of the PV irrigation system. Finally, the UREF is 1 in the optimistic scenario since the system maximises the use of PV, which does not happen in the pessimist scenario. The ηHyd remains unchanged.

4. In-the-Field Performance

4.1. Commissioning of the System

Commissioning tests were carried out after the PV system was set up in 2016. A visual and infrared inspection of the PV arrays and characterization of the energy behaviour of the main system components (STC power of the PV generator, and FCs and motor pumps efficiencies) were carried out. Table 5 summarizes the key results in comparison with the expectations established at the design phase. The hydraulic efficiency was 5% lower than expected (45% versus 50%). Possible reasons are related to the filter cleaning dynamics and with a slightly improper position of the pumps due to some space restrictions. We are investigating this point further.
Despite the system being in routine and proper operation since 2016, full monitoring data are only available from 2017.

4.2. Real Performance in 2017

A brief analysis of the 2017 irrigation campaign is presented. It was critically influenced by a very dry year [58] (yearly pluviometry 46% less than the average [59]). Due to this lack of water, the system only worked for 94 days totalling 943 h (from the end of April to the end of September), which represents 66% less than what it could work according to its potential. Note that in the months of August and September, the system only pumped for 85 h (37 h in August and 48 h in September, 89% less than the optimistic scenario).
Table 6 and Table 7 show the results in a similar way to Table 2 and Table 4, respectively, in this case, for the real data measured on the farm. The volume of pumped water was 68% less than the optimistic scenario and very similar to that of the pessimistic one. The main difference between the pessimistic scenario and the real data was that in the latter, the “Only Diesel” mode was included due to water restrictions during the sunlight hours, which obliges the user to irrigate during the night.
In this case, real data on the irradiance and cell temperature were considered and for this reason, the URPVIS was different from that obtained in the scenarios. The annual values of PVS and PVSH were 0.49 and 0.78, respectively (lower than in the scenarios due to the use of the system during the night, leading to an UREF of 0.29), and the ηHyd was 0.46 (lower than before for the reasons explained in Section 4.1).

4.3. Real Performance in 2018

The system was also monitored throughout the current irrigation campaign (2018). In this case, water restrictions were not affecting the campaign (the daily mean working time was between 9 and 16 h), but a problem in the fertirrigation system from May to July negatively affected the performance of the system. Since there was the need to minimize the transition between the operating modes, irrigation was done mainly during the night. The real operational data and the performance indices are presented in Table 8 and Table 9, respectively.
The month of August deserves attention. It is the only month in which the system was working without external influences. In this month, the system worked, on average, 16 h per day. This implies that the “Only Diesel” mode is needed since the system needs to run also during the night. Even so, the number of working hours in the “Only PV” mode was similar to the one of the optimistic scenario (which supposes 11 h of irrigation per day, 7.7 h in the “Only PV” mode. Furthermore, it is interesting to verify that the obtained indices are very close to the ones of the optimistic scenario. For example, the PVSH was 0.82 (versus 0.85 in the optimistic scenario) and the PR was 0.56 (0.08 higher than in the optimistic scenario due to the higher URPVIS, which was equal to 0.68 in 2018 and to 0.57 in the scenario).
Finally, the hydraulic efficiency should be discussed. The obtained value (0.55) was greater than expected (0.50) and higher than the one measured during the characterization of the system (0.45) and during 2017 (0.46). A possible explanation to this can be related with the water source—in 2018, more water was available and it was cleaner than before (which decreased the losses represented in Table 5 due to both “cleaning and other” and “filter”).
Finally, the good performance of the passing-cloud algorithm was monitored. As an example, Figure 10 shows one of the events. As can be observed, the irradiance decreased by 36% in just 1 min but the frequency only varied 2%, avoiding any stop.

4.4. Discussion of the Results

Two main aspects should be discussed. First, the values of the PR are surprising when they are compared with the values of PR published in the literature for PV grid-connected systems. For example, reference [42] reports literally, regarding PV grid-connected systems, that “reported experimental PR values range from 0.65 to 0.8” while the values measured in this PV irrigation system ranged from 0.11 to 0.22. A fast, but understandable, conclusion would be that large-power PV irrigation technology is just starting and the technology is not mature yet. However, this conclusion is erroneous because the reason of the differences of performance between these two PV applications is not the quality, but the system in which they are integrated. The grid where PV systems are connected is normally very reliable and, therefore, every kWh produced by the PV generator can be injected. So, any difference between the potential and real production is only a responsibility of the quality of the PV system. On the other, in the case of the PV irrigation systems, even if they are of very high quality, there are many situations in which, although a kWh could be produced by the PV generator, it cannot be generated. Some situations are related to the hydraulic system: If the irrigation network works at a constant pressure and water flow (like drip systems), that is to say, at constant power, the PV generator will just produce this power, even if the irradiance at this moment would allow a higher PV power. Other situations are related with the water needs of the crop: If a certain crop requires irrigation from May to September, the PV power during the rest of the months will be wasted, even if the PV generator is able to produce. Finally, other situations are related to the lack of water or the behaviour of the farmer: If the farmer decides to irrigate from late in the afternoon till midnight, the PV system will be stopped during the major part of the day. Therefore, we have proposed three different utilization ratios for these three groups of situations. Note that, for example, the utilization ratio related with the third situation mentioned above, UREF, was 0.29 in 2017 and 0.44 in 2018. It can be seen that, due to lack of water or to the use of the farmer, the PV system worked just 29% and the 44% of the time that it could have worked. These figures are similar to the ones published in the literature for PV irrigation systems. For example, [60,61] do not report PR values, but energy efficiencies of the PV irrigation systems of 1.2%–5.25% and 3.26%–4.41%, respectively. If the efficiency of the PV module is eliminated from these figures, the reported efficiencies are 8%–35% and 21.7%–29.4%.
The second discussion is related to the ways of improving these PR values, which is the same as improving the values of the different utilization ratios:
  • URIP was related with the irrigation period of the crop. In this PV irrigation system, it had a value of 68% in 2017, i.e., the system was not working during one third of the year. This value could be enlarged growing crops not only during the summer, but in spring and autumn. Training of the farmers for this strategy should be done.
  • URPVIS was related with the design of the irrigation network that, in this case, was based on drip systems that work at a constant power. This led to a value of this factor of 69% in 2017. The improvement of this factor is only possible by changing the irrigation network. Efforts for smart designs of the irrigation networks from the energy point of view can be found in the literature [62,63,64]. This would require a control strategy to select the most appropriate combination of irrigation sectors according to the availability of PV power.
  • UREF was related to the use of the PV irrigation system. In this system, it took a value of 29% in 2017. The main means to improve this value are two-fold: To assure water sources with enough capacity to avoid events of a lack of water and to train farmers to plan the irrigation schedules centered at midday.

5. Economic Analysis

Experimental data of diesel consumption and water use are available for the irrigation campaigns of 2016 and 2017 (this data is measured by ELAIA operators and, consequently, were not dependent on the monitoring system installed with the PV part of the system). Irrigation in both years was very different due to the previously mentioned lack of water in 2017. On the other hand, 2016 was a standard year from the point of view of irrigation since it was possible to give to the plants all the water they need.
Accordingly, two different situations were studied along 25 years (the period of warranty of the PV modules, normally used for PV investments): Case study A considers that all the 25 years were equal to 2016, while case study B is a combination of 2016 and 2017 data and considers that each five years there was a year like 2017 and the remaining ones were like 2016. As pointed out in [65], in one out of 10 years, in semi-arid areas, there was a drought event caused by seasonal rainfall below minimum seasonal plant water requirement. This means that case study A can be seen as an optimistic solution and case study B as a pessimist one.
The economic feasibility study was carried out based on four different indicators: The net present value (NPV), the internal rate of return (IRR), the payback period (PBP), and the levelized cost of energy (LCOE).

5.1. Net Present Value, Internal Rate of Return, and Payback Period

To estimate the NPV, the IRR, and the PBP for an investment, the annual cash flows (CF) need to be calculated for the whole lifetime of the system. In this study, profit is the economic savings derived from reducing diesel consumption due to the use of the PV system. In other words, the viability of the PV system was evaluated in terms of the variation in the CF before and after the installation of the PV generator. CF for the year, n, is given by:
C F PV ,   n = { I I C , n = 0 S n O P E X D I , n 0
where IIC is the initial investment cost also known as CAPEX—capital expenditures, Sn is the annual savings by not using the diesel generator, OPEX (operating expense) is the annual operational expense, and DI is the debt interests. In more detail, the Sn is given by:
S n = P V E n × C E C n
where P V E n is the energy that, after the installation of the PV system, is not consumed by the diesel generator, and CECn is the annual price of the diesel. CECn is calculated by the following equation:
C E C n = C E C n 1 × ( 1 + h + s )
where h is the inflation rate and s is an additional spread. This spread is applicable over the diesel price to reflect the most exact price evolution of this commodity throughout the 25 years.
Regarding the OPEX, costs related to the maintenance, insurance, and security costs associated only to the PV system were considered. Finally, to calculate the DI, the following equation was used [66]:
D I n = I I C × D C R
where CR is the capital repayment and it is associated with the loan maturity (l) that in this case, was considered as six years. D is the debt ratio that was considered 70% and the CR is given by the following equation [66]:
C R = I I C × D l
The variation in CF for the year, n, when substituting the diesel energy (ΔCFn) is given by the following [66]:
Δ C F n = C F PV ,   n ( 1 + r ) n
where r (the real interest rate) can be calculated by the following equation [66]:
r = ( i h ) ( 1 + h )
where i is the interest rate.
With the ∆CFn, it is possible to calculate the NPV (Equation (18)) [66]. The NPV is the sum of all the cash flows discounted to the present using the time value of money [66]. If the NPV is greater than zero, it is expected that value will be created for the investor. If it is less than zero, it is expected that value will be destroyed for the investor:
N P V = n = 0 N Δ C F n
Finally, it is possible to calculate the IRR as well as the PBP. The first one is defined as the real interest rate that would make the NPV equal to zero after the 25 years of the lifetime of the project (i.e., the real interest rate at which the initial investment is returned at the end of the lifetime of the project). The PBP is defined as the number of years (n) for which NPV is equal to zero (i.e., the period required for the initial investment to be returned with the present value of cash flow, disregarding the real interest rate).

5.2. Levelized Cost of Energy

The levelized cost of energy (LCOE) is the most common indicator used by entities to compare different energy technologies. According to [67], the sum of the annual values of the LCOE (LCOEn) multiplied by the energy generated annually (En) should be equal to the sum of the values of the costs of the project (see Equation (19)):
n = 0 N L C O E n × E n ( 1 + r ) n = n = 0 N C o s t s n ( 1 + r ) n
If we rearrange Equation (19) [67,68], assuming a constant value per year, the LCOE is given by the following equation:
L C O E = n = 0 N C o s t s n ( 1 + r ) n n = 0 N E n ( 1 + r ) n
where the numerator is the total lifecycle cost of the system and the denominator, the lifetime energy production. Based on this equation, we can calculate different LCOEs for each energy source. For a PV application (LCOEPV), we consider the costs as the following:
L C O E PV = I I C + n = 1 N O P E X n ( 1 + r ) n n = 0 N P V E n ( 1 + r ) n
In the case of a hybrid system, the LCOE of the system (LCOECS) is given by:
L C O E CS = I I C + n = 0 N C E C n × P E n + O P E X n ( 1 + r ) n n = 0 N ( P V E n + P E n ) ( 1 + r ) n
where PEn is the energy consumed by the diesel generator.
On the other hand, the LCOE of the previous system (LCOEPS), in this case, the only-diesel system, is calculated as:
L C O E PS = n = 0 N C E C n × ( P V E n + P E n ) + O P E X n ( 1 + r ) n n = 0 N ( P V E n + P E n ) ( 1 + r ) n
It can be observed that, in the previous system, the total energy provided by the diesel generator is the addition of PVEn and PEn.

5.3. Results

Table 10 includes the main economic data used in both study cases. The IIC of the system was 170,277.03 € (1.22 €/Wp), while the OPEX at year zero (OPEX0) was 3064.8 €. The values for h [69] and i [70] are the average value along the last 10 years, r is calculated based on these two values and s is an estimated value based on information obtained from the different end-users.
It can be seen in Table 11 that the economic results are very interesting: An IRR of 15 and 13%, a PBP of 8.8 and 10.1 years (less than half of the lifetime of the system), and an LCOEcs of 0.12 and 0.15 €/kWh in case studies A and B, respectively. The LCOE of the only-diesel system, LCOEPS, was 0.32 €/kWh, which means that the savings were 61% in case study A and 53% in case study B.

6. Conclusions

Technical solutions to enlarge the power of PV irrigation systems were developed and applied to the design of a 140 kWp hybrid PV-diesel system for the drip irrigation of 195 ha of olive trees in Portugal. The solutions, design, and the performance evaluation of this large-power system was presented in this paper.
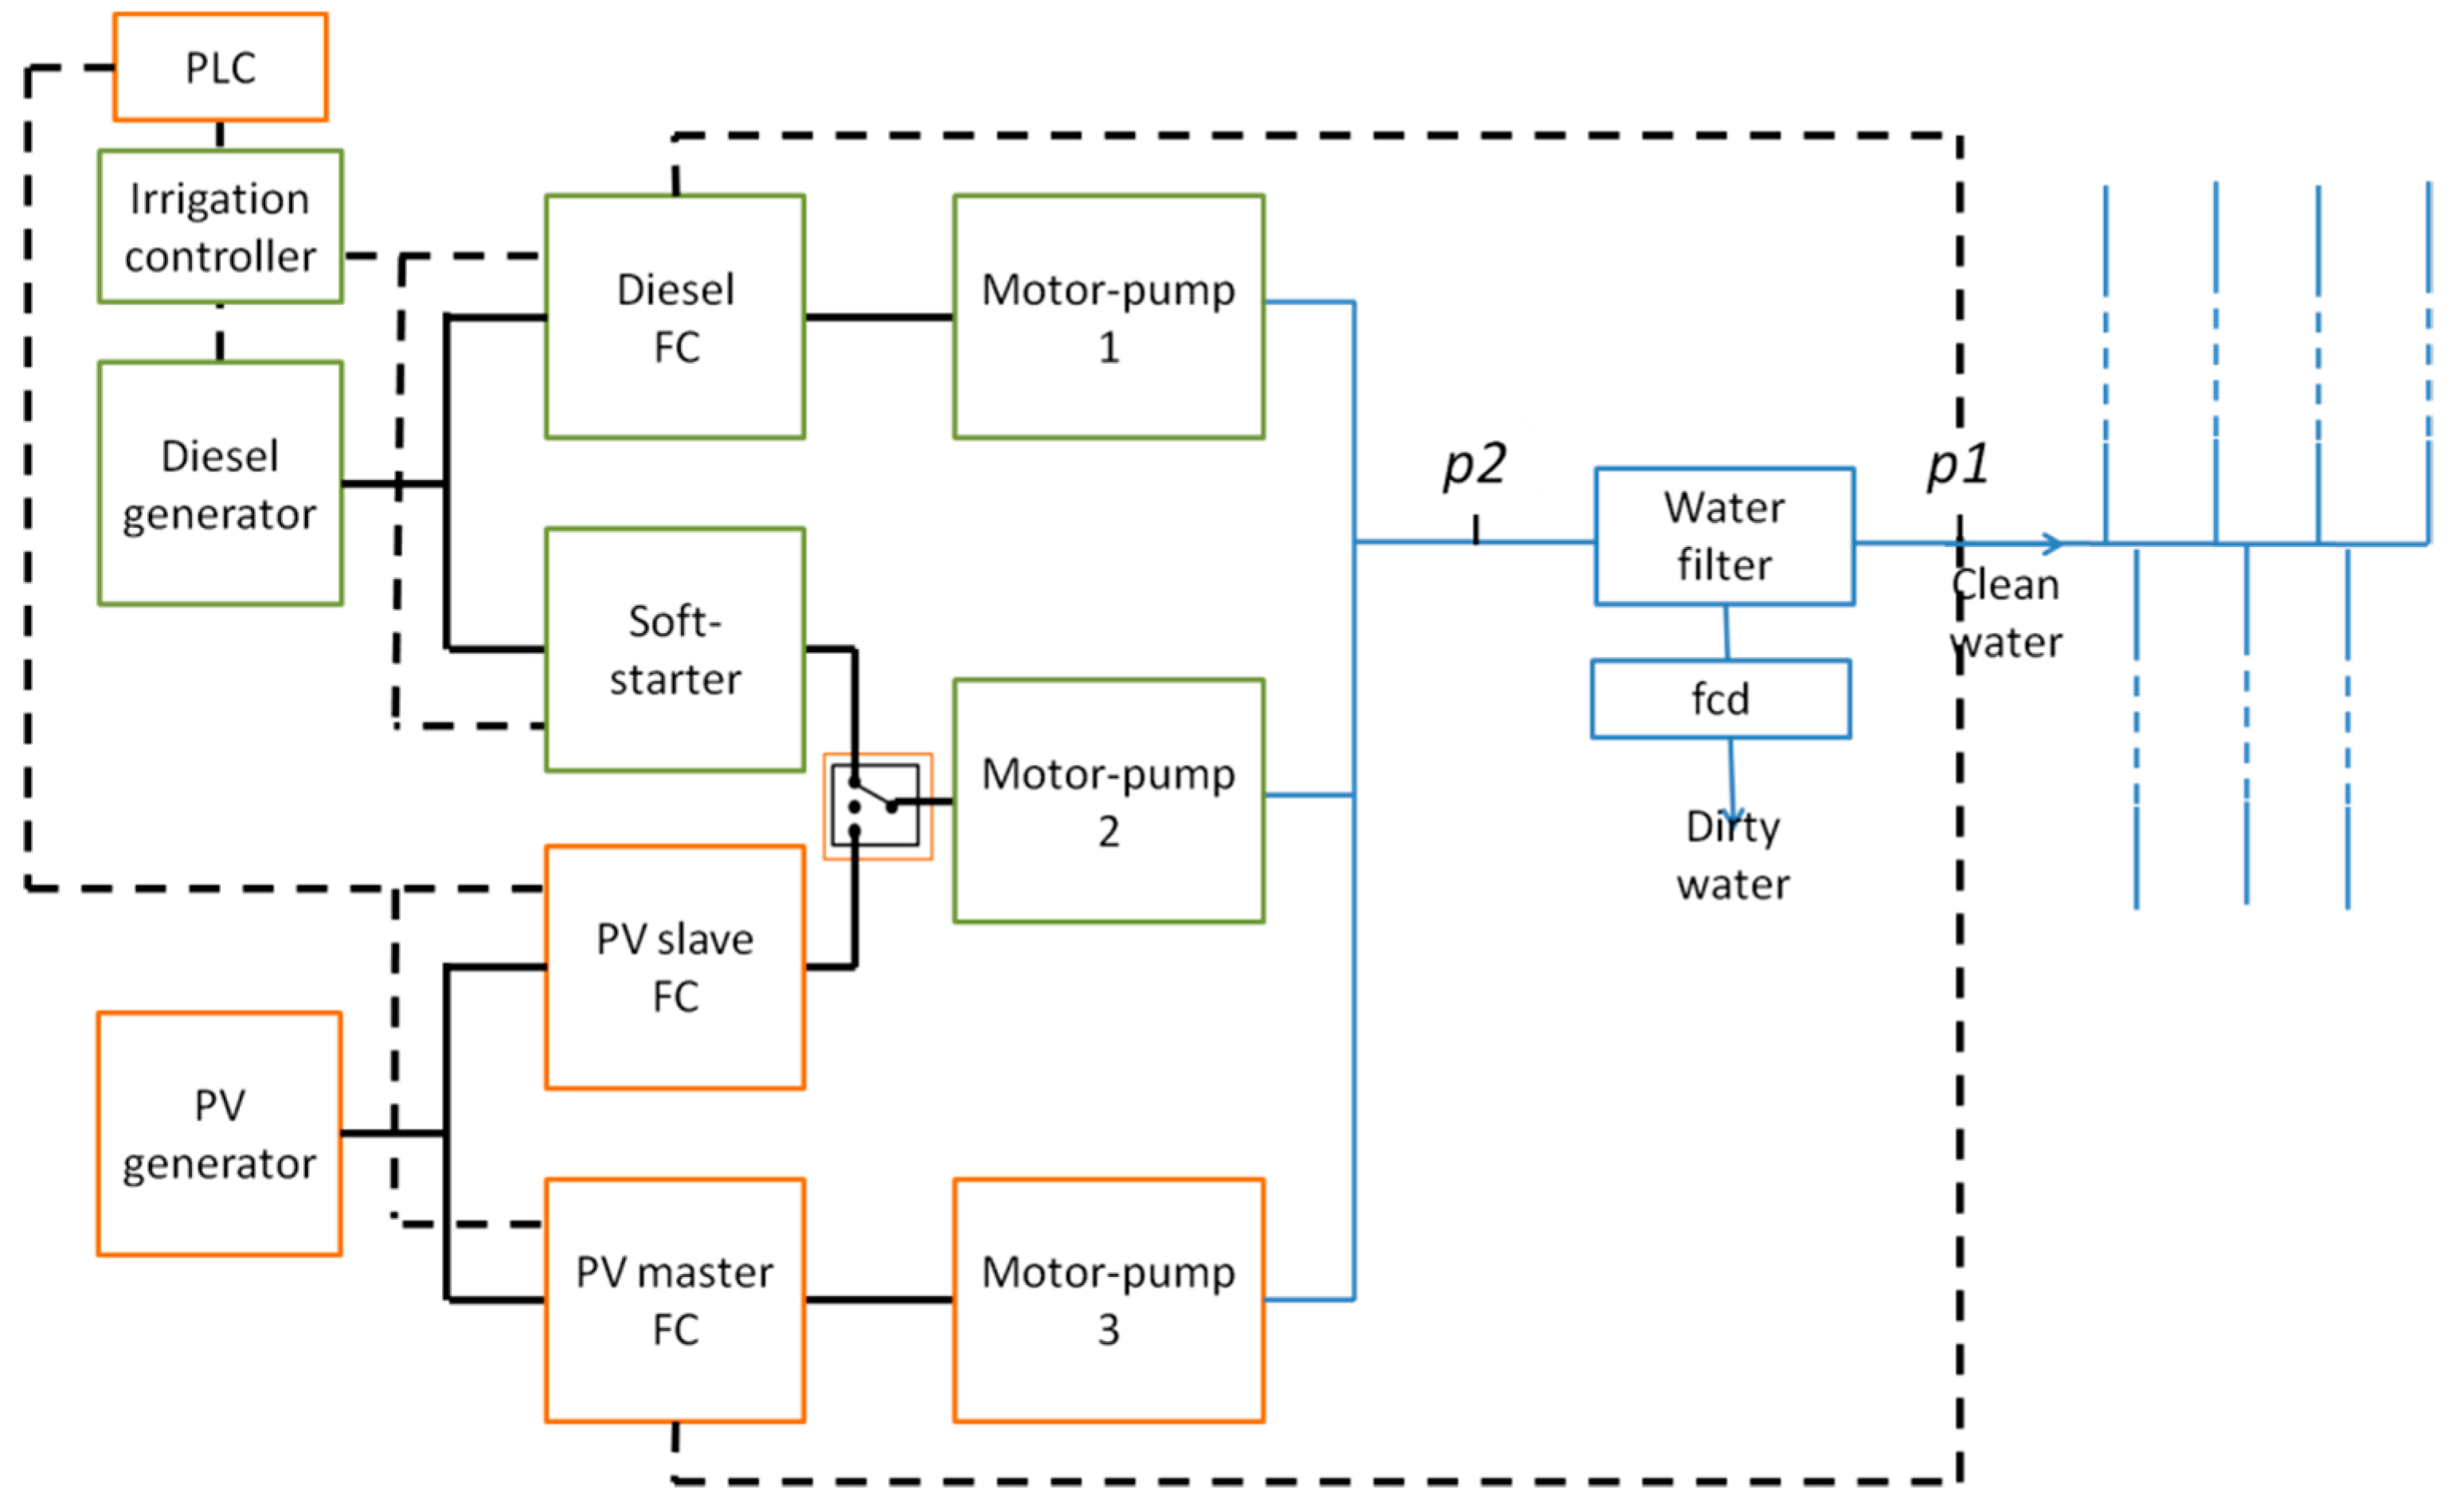
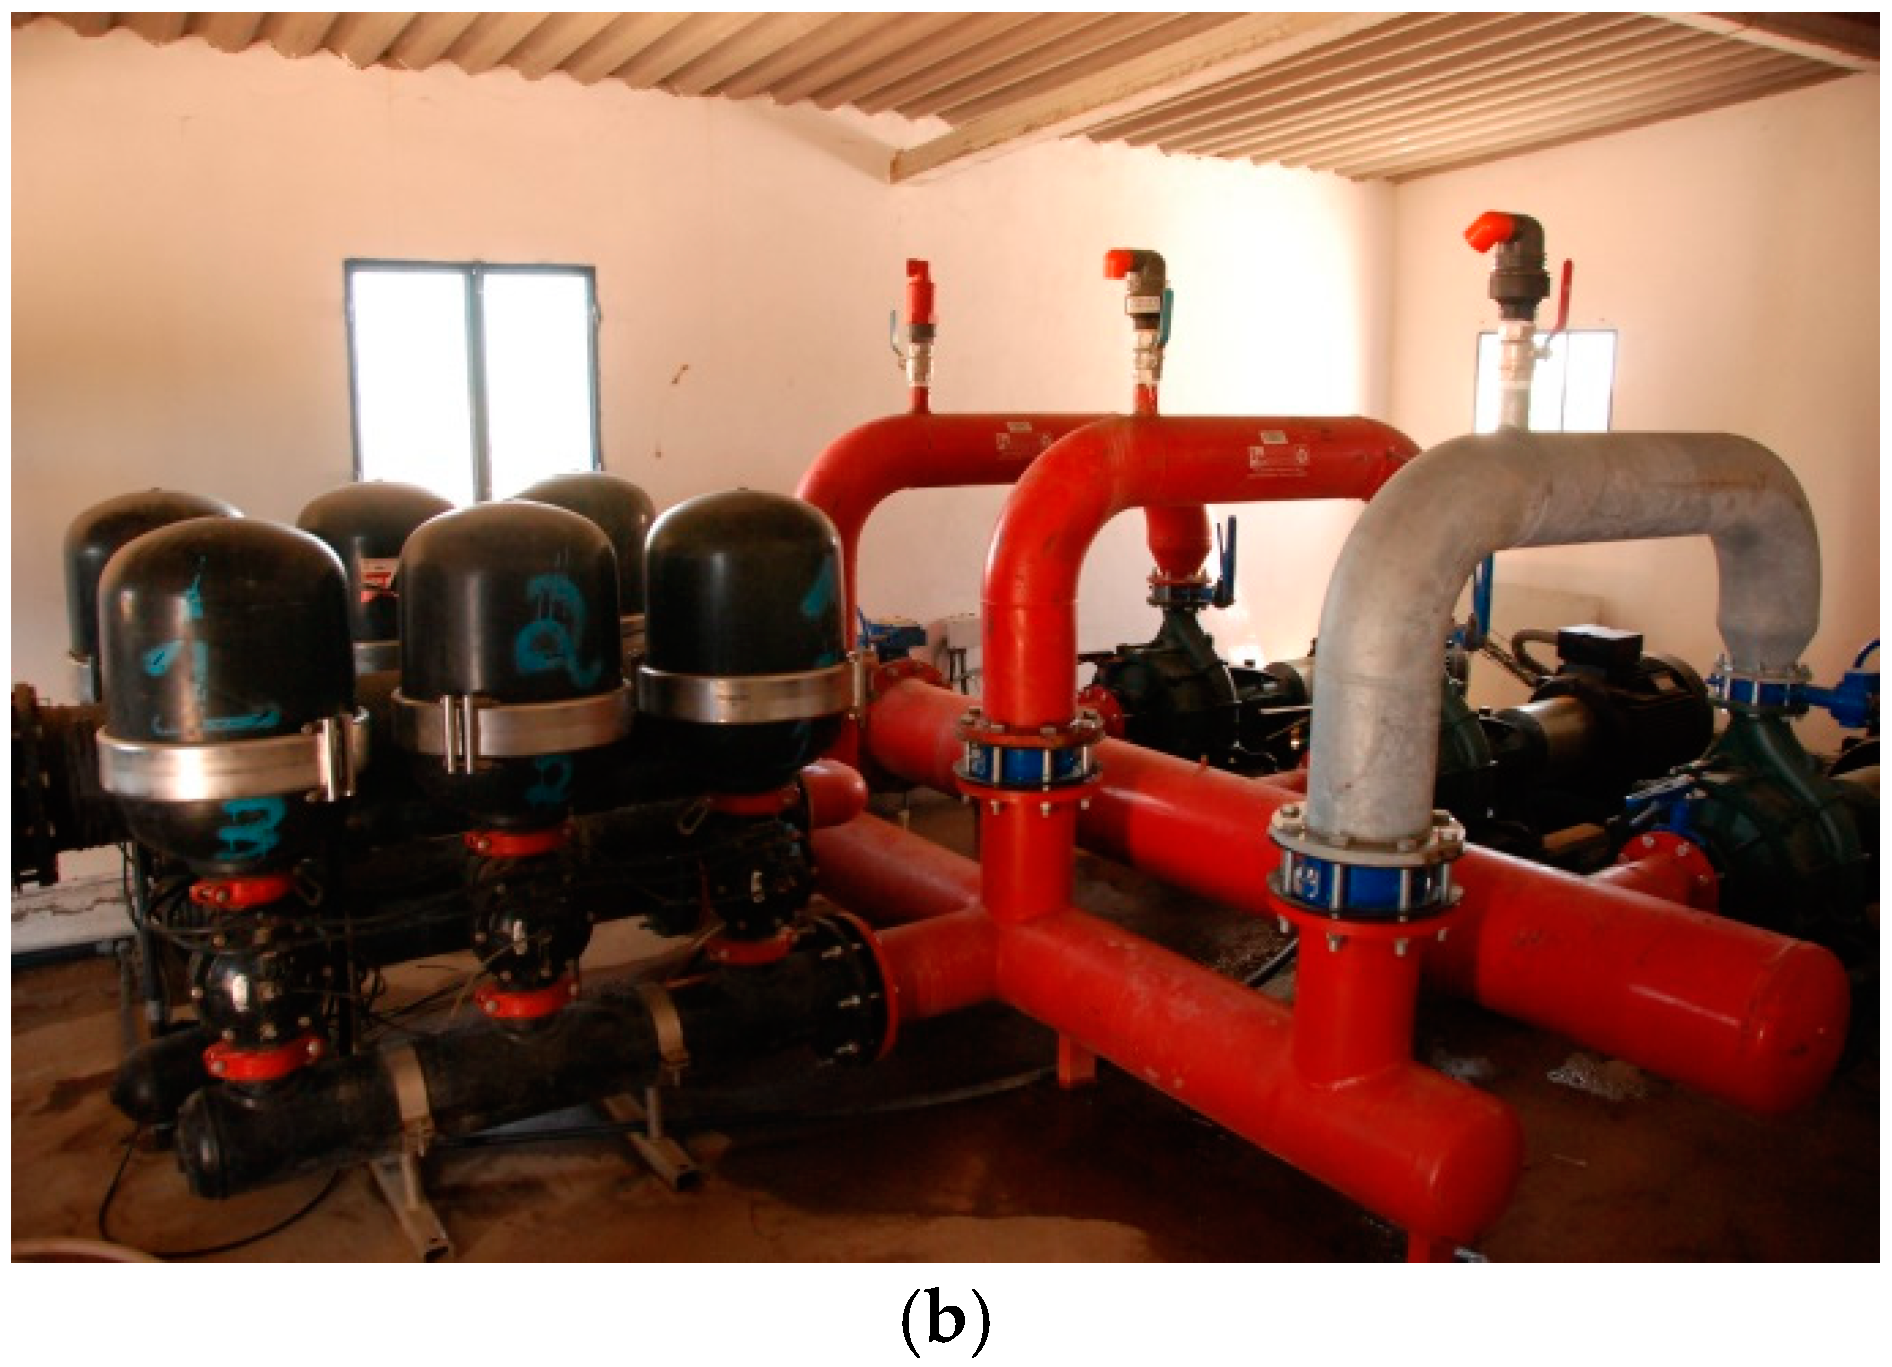
The design paid particular attention to the problem of integrating the PV novelty into the already existing diesel (a 250 kVA generator), pumps (two 45 kW), and pipe network facilities. Consequently, the system design adheres to three main considerations: Preservation of the existing facilities and irrigation scheduling; addition of a new pump and one horizontal axis tracked 140 kWp PV generator; and implementation of three different operation modes, “Only PV”, “Hybrid” PV-diesel, and “Only Diesel”, which are automatically controlled in accordance with the available PV power.
A set of indices for evaluating the performance of hybrid PV systems was proposed. The PR of the PV system was factorized to distinguish between the losses associated to the technical quality of the PV components and the losses associated to other external circumstances, like the irrigation period of the crop, the design of the pre-existing irrigation system, and external factors associated to water availability and the behaviour of the irrigator. Target performance values were established by means of a simulation exercise carried out for two different water availability scenarios to consider periodic events of a lack of water. In the optimistic scenario, the percentage of use of the PV electricity regarding the total energy consumption, PVSH, was 67% while in the pessimistic scenario, it was 88%. The standard performance ratio was 0.37 and 0.15, respectively. The values of the performance ratio just considering the quality of the PV system, PRPV, were 0.86 and 0.85, respectively, similar to the values of the PV grid-connected systems.
The performance during the 2017 irrigation campaign was characterized by a PVSH of 78% and a PR during the irrigation period of 0.16 (extremely influenced by a UREF of 0.29). In 2018, the use of diesel was higher than initially expected due to a problem in the fertirrigation system. This problem was solved only August and it is interesting to verify that in this month, the system worked, on average, 16 hours a day with a PVSH of 82%. The PR during this month was 0.56 and the UREF was 99%.
An economic analysis of the feasibility of the system was carried out based on the experimental data collected in 2016 and 2017. The analysis was done for 25 years of operation, building two different scenarios combining these two years of operation. The main economical outputs for an investor were calculated: Net present value, NPV, internal rate of return, IRR, payback period, PBP, and levelized cost of electricity, LCOE, considering the savings due to the partial substitution of diesel by PV as incomes. The main results were that the IRR ranges from 15% to 13%, PBP from 8.8 to 10.1 years, and LCOE from 13 to 15 c€/kWh, leading to savings in the cost of electricity from 61% to 53%.

7. Patents

Two Spanish patents have been granted (which are currently under application for WO patent):
  • UPM, WO 2018/134453 A1 (ES2607253B2)—Control device and method for photovoltaic pump systems, 26/7/2018 (01/03/2018).
  • UPM, WO 2018/134454 A1 (ES2608527B2)—Photovoltaic pumping system hydraulically hybridized with the electrical grid or with diesel groups for irrigation uses, 26/7/2018 (24/07/2017).

Author Contributions

Conceptualization, R.H.A., E.L., L.N. and J.F.-R.; Data curation, R.H.A. and I.B.C.; Formal analysis, R.H.A., I.B.C. and F.M.-M.; Funding acquisition, L.N.; Investigation, R.H.A., I.B.C., F.M.-M. and L.M.C.; Methodology, E.L., L.N. and J.F.-R.; Project administration, L.N.; Software, R.H.A., I.B.C. and J.F.-R.; Supervision, E.L., L.N. and J.F.-R.; Validation, R.H.A., I.B.C. and L.M.C.; Visualization, R.H.A. and I.B.C.; Writing—original draft, R.H.A. and I.B.C.; Writing—review & editing, R.H.A., E.L. and L.N.

Funding

This work has been possible thanks to the funding from the European Union’s Horizon 2020 research and innovation programme in the project MArket uptake of an innovative irrigation Solution based on LOW WATer-ENergy consumption (MASLOWATEN), under grant agreement n°640771, as well as the financial support by MIT Portugal Program on Sustainable Energy Systems and the Portuguese Science and Technology Foundation (FCT), grant PD/BD/105851/2014, and IDL project (UID/GEO/50019/2013).

Conflicts of Interest

The authors declare no conflict of interest.

References

  1. IRENA. Renewable Power Generation Costs in 2017; International Renewable Energy Agency: Abu Dhabi, United Arab Emirates, 2018. [Google Scholar]
  2. Carroquino, J.; Dufo-López, R.; Barnal-Augustin, J.L. Sizing of off-grid renewable energy systems for drip irrigation in Mediterranean crops. Renew. Energy 2015, 76, 566–574. [Google Scholar] [CrossRef]
  3. Ammar, H.; Melit, A.; Adouane, M.; Bouziane, M.T. Techno-economic evaluation of a hybrid PV/diesel water pumping system for different pumping heads. In Proceedings of the 3rd International Renewable and Sustainable Energy Conference, Marrakech, Morocco, 10–13 December 2015. [Google Scholar]
  4. Bakelli, Y.; Gherbi, B.; Taghezouit, B.; Hazil, O.; Mahammed, H. Techno-economic evalualution of different hybrid photovoltaic/diesel pumping systems with water tank storage. In Proceedings of the 8th International Conference on Modelling, Identification and Control, Algiers, Algeria, 15–17 November 2016. [Google Scholar]
  5. IRENA. Solar Pumping for Irrigation: Improving Livelihoods and Sustainability; The International Renewable Energy Agency: Abu Dhabi, United Arab Emirates, 2016. [Google Scholar]
  6. Palz, W. The French Connection: The rise of the PV water pump. Refocus Int. Renew. Energy Mag. 2001, 2, 46–47. [Google Scholar]
  7. Barlow, R.; Nelis, B.M.; Derrick, A. Solar Pumping: An Introduction and Update on the Technology, Performance, Costs, and Economics; World Bank Technical Paper Number 168; World Bank: Washington, DC, USA, 1993. [Google Scholar]
  8. Lorenzo, E. Standard conditions and NCOT, in Solar Electricity: Engineering of Photovoltaic Systems; Progensa: Sevilla, Spain, 1994; p. 94. [Google Scholar]
  9. Enochian, R.V. Solar- and Wind-Powered Irrigation Systems; United States Department of Agriculture: Washington, DC, USA, 1982.
  10. Halcrow, W. Small-Scale Solar-Powered Irrigation Pumping Systems—Technical and Economical Review; World Bank: Washington, DC, USA, 1981. [Google Scholar]
  11. Fedrizzi, M.C.; Sauer, I.L. Bombeamento Solar Fotovoltaico, Histórico, Características e Projectos. In Encontro de Energia no Meio Rural; SciELO: Campinas, Brazil, 2002. [Google Scholar]
  12. van Campen, B.; Guidi, D.; Best, G. Solar Photovoltaics for Sustainable Agriculture and Rural Development; FAO: Rome, Italy, 2000. [Google Scholar]
  13. Comite Permanent Inter-Etats de Lutte Contre la Secheresse au Sahel. Programme Regional d’Utilisation de l’Energie Solaire Photovoltaique dans les Pays du Sahel; Comite Permanent Inter-Etats de Lutte Contre la Secheresse au Sahel: Ouagadougou, Burkina Faso, 1989. [Google Scholar]
  14. Pigueiras, E.L.; Sauro, F.P.; Fernández, L.N.; Fedrizzi, M.C.; Zilles, R.; Aandam, M.; Zaoui, S. Boas Práticas na Implantação de Sistemas de Bombeamento Fotovoltaico; Instituto de Energía Solar, Universidad Politécnica de Madrid: Madrid, Spain, 2005. [Google Scholar]
  15. Galdino, M.A. PRODEEM—The Brazilian Programme for Rural Electrification Using Photovoltaics. In Proceedings of the RIO02—World Climate & Energy Event, Rio de Janeiro, Brazil, 6–11 January 2002. [Google Scholar]
  16. Espericueta, A.D.C.; Foster, R.E.; Ross, M.P.; Hanley, C.; Gupta, V.P.; Avilez, O.M.; Rubio, A.R.P. Ten-Year Reliability Assessment of Photovoltaic Water Pumping Systems in Mexico, in Solar 2004; American Solar Energy Society: Portland, OR, USA, 2004. [Google Scholar]
  17. Narvarte, L.; Lorenzo, E.; Aandam, M. Lessons from a PV Pumping Programme in South Morocco. Prog. Photovolt. Res. Appl. 2005, 13, 261–270. [Google Scholar] [CrossRef]
  18. Abella, M.A.; Lorenzo, E.; Chenlo, F. PV Water Pumping Systems Based on Standard Frequency Converters. Prog. Photovolt. Res. Appl. 2003, 11, 179–191. [Google Scholar] [CrossRef]
  19. Valler, L.R.; Melendez, T.A.; Fedrizzi, M.C.; Zilles, R.; de Moraes, A.M. Variable-speed drives in photovoltaic pumping systems for irrigation in Brazil. Sustain. Energy Technol. Assess. 2016, 15, 20–26. [Google Scholar] [CrossRef]
  20. Tiwari, A.; Kalamkar, V. Effects of total head and solar radiation on the performance of solar water pumping system. Renew. Energy 2018, 118, 919–927. [Google Scholar] [CrossRef]
  21. Shoeb, M.A.; Shafiullah, G. Renewable Energy Integrated Islanded Microgrid for Sustainable Irrigation—A Bangladesh Perspective. Energies 2018, 11, 1283. [Google Scholar] [CrossRef]
  22. Guzmán, A.B.; Vicencio, R.B.; Ardila-Rey, J.A.; Ahumada, E.N.; Araya, A.G.; Moreno, G.A. A Cost-Effective Methodology for Sizing Solar PV Systems for Existing Irrigation Facilities in Chile. Energies 2018, 11, 1853. [Google Scholar] [CrossRef]
  23. Powering Agriculture: An Energy Grand Challenge for Development (Fact Sheet). Available online: https://poweringag.org/frontpage (accessed on 15 October 2018).
  24. Li, G.; Jin, Y.; Akram, M.W.; Chen, X. Research and current status of the solar photovoltaic water pumping system—A review. Renew. Sustain. Energy Rev. 2017, 79, 440–458. [Google Scholar] [CrossRef]
  25. Chandel, S.S.; Naik, M.N.; Chandel, R. Review of performance studies of direct coupled photovoltaic water pumping systems and case study. Renew. Sustain. Energy Rev. 2017, 76, 163–175. [Google Scholar] [CrossRef]
  26. Wazed, S.M.; Hughes, B.R.; O’Connor, D.; Calautit, J.K. A review of sustainable solar irrigation systems for Sub-Saharan Africa. Renew. Sustain. Energy Rev. 2018, 81, 1206–1225. [Google Scholar] [CrossRef]
  27. Sontake, V.C.; Kalamkar, V.R. Solar photovoltaic water pumping system—A comprehensive review. Renew. Sustain. Energy Rev. 2016, 59, 1038–1067. [Google Scholar] [CrossRef]
  28. Lorentz, Technical Datasheet of PSk2, Lorentz. Available online: https://www.lorentz.de/products-and-technology/technology/smartsolution-hybrid-power (accessed on 15 October 2018).
  29. EIP Water. European Innovation Partnership Water—Strategic Implementation Plan; EIP Water: Brussels, Belgium, 2012. [Google Scholar]
  30. Marcos, J.; Marroyo, L.; Lorenzo, E.; Alvira, D.; Izco, E. Power output fluctuations in large scale PV plants: One year observations with one second resolution and a derived analytic model. Prog. Photovolt. Res. Appl. 2011, 19, 218–227. [Google Scholar] [CrossRef]
  31. Fernández-Ramos, J.; Narvarte-Fernández, L.; Poza-Saura, F. Improvement of photovoltaic pumping systems based on standard frequency converters. Sol. Energy 2010, 84, 101–109. [Google Scholar] [CrossRef]
  32. Sallem, S.; Chaabene, M.; Kamoun, M.B.A. Energy management algorithm for an optimum control of a photovoltaic water pumping system. Appl. Energy 2009, 86, 2671–2680. [Google Scholar] [CrossRef]
  33. Arab, A.H.; Chenlo, F.; Benghanem, M. Loss-of-load probability of photovoltaic water pumping system. Solar Energy 2004, 76, 713–723. [Google Scholar] [CrossRef]
  34. Odeh, I.; Yohanis, Y.G.; Norton, B. Economic viability of photovoltaic water pumping systems. Sol. Energy 2006, 80, 850–860. [Google Scholar] [CrossRef]
  35. Hartung, H.; Pluschke, L. The Benefits and Risks of Solar-Powered Irrigation—A Global Overview; Food and Agriculture Organization of the United: Rome, Italy, 2018. [Google Scholar]
  36. MASLOWATEN, MASLOWATEN Project. 2017. Available online: http://maslowaten.eu/ (accessed on 10 November 2017).
  37. Ramos, J.F.; Fernandez, L.N.; de Almeida, R.H.T.; Carrêlo, I.B.; Moreno, L.M.C.; Pigueiras, E.L. Method and Control Device for Photovoltaic Pumping Systems. Patent ES 2 607 253 B2, WO 2018/134453 A1, 1 March 2018. [Google Scholar]
  38. Developed under MASLOWATEN Project, Technical Specifications for Photovoltaic Irrigation Systems. Available online: https://maslowaten.eu/?page_id=1055&lang=en (accessed on 10 October 2018).
  39. Ramos, J.F.; Fernandez, L.N.; de Almeida, R.H.T.; Carrêlo, I.B.; Moreno, L.M.C.; Pigueiras, E.L. Hotovoltaic Pumping System Hydraulically Hybridized with the Electrical Grid or with Diesel Groups for Irrigation Uses. Patent ES 2608527 B2, WO 2018/134454 A1, 2017. [Google Scholar]
  40. Yu, Y.; Liu, J.; Wang, H.; Liu, M. Assess the potential of solar irrigation systems for sustaining pasture lands in arid regions—A case study in Northwestern China. Appl. Energy 2011, 88, 3176–3182. [Google Scholar] [CrossRef]
  41. Rogers, E.M. Diffusion of Innovations; The Free Press: New York, NY, USA, 1962. [Google Scholar]
  42. Luque, A.; Hegedeus, S. Handbook of Photovoltaic Science and Engineering; John Wiley & Sons Ltd.: Chichester, UK, 2003. [Google Scholar]
  43. Almeida, R.H.; Narvarte, L.; Lorenzo, E. PV arrays with delta structures for constant irradiance daily profiles. Sol. Energy 2018, 171, 23–30. [Google Scholar] [CrossRef]
  44. Brito, A.U.; Zilles, R. Systematized Procedure for Parameter Characterization of a Variable-speed Drive Used in Photovoltaic Pumping Applications. Prog. Photovoltais Res. Appl. 2006, 14, 249–260. [Google Scholar] [CrossRef]
  45. Tafticht, T.; Agbossou, K.; Doumbia, M.L.; Chériti, A. An improved maximum power point tracking method for photovoltaic systems. Renew. Energy 2008, 33, 1508–1516. [Google Scholar] [CrossRef]
  46. Astrom, K.J.; Hagglund, T. Advanced PID Control; ISA: Research Triangle Park, NC, USA, 2009. [Google Scholar]
  47. Wettstein, S.; Muir, K.; Scharfy, D.; Stucki, M. The environmental mitigation potential of photovoltaic-powered irrigation in the production of south african maize. Sustainability 2017, 9, 1772. [Google Scholar] [CrossRef]
  48. Instituto de Energía Solar—Universidad Politécnica de Madrid, SISIFO—Simulación de Sistemas Fotovoltaicos. Available online: http://sisifo.info (accessed on 12 February 2018).
  49. European Commission, Joint Research Centre, Photovoltaic Geographical Information System (PVGIS). Available online: http://re.jrc.ec.europa.eu/pvgis/ (accessed on 8 November 2017).
  50. Erbs, D.; Klein, S.; Duffie, J. Estimation of the diffuse radiation fraction for hourly, daily and monthly-average global radiation. Sol. Energy 1982, 28, 293–302. [Google Scholar] [CrossRef]
  51. Collares-Pereira, M.; Rabl, A. The average distribution of solar radiation-correlations between diffuse and hemispherical and between daily and hourly insolation values. Sol. Energy 1979, 22, 155–164. [Google Scholar] [CrossRef]
  52. Perez, R.; Stewart, R.; Arbogast, C.; Seals, R.; Scott, J. An anisotropic hourly diffuse radiation model for sloping surfaces: Description, performance validation, site dependency evaluation. Sol. Energy 1986, 36, 481–497. [Google Scholar] [CrossRef]
  53. Luque, A.; Hegedeus, S. Energy Yield of Grid-Connected PV Systems. In Handbook of Photovoltaic Science and Engineering; John Wiley & Sons Ltd.: Chichester, UK, 2002; p. 965. [Google Scholar]
  54. Jahn, U.; Grimmig, B.; Nasse, W. Analysis of Photovoltaic Systems; Report IEA-PVPS T2-01: 2000; International Energy Agency: Paris, France, 2000. [Google Scholar]
  55. Leloux, J.; Narvarte, L.; Trebosc, D. Performance Analysis of 10,000 Residential PV Systems in France and Belgium. In Proceedings of the 26th European Photovoltaic Solar Energy Conference and Exhibition, Hamburg, Germany, 5–9 September 2011. [Google Scholar]
  56. Reich, N.H.; Mueller, B.; Armbruster, A.; van Sark, W.; Reise, C. Performance ratio revisited: Is PR > 90% realistic? Prog. Photovolt. 2012, 20, 717–726. [Google Scholar] [CrossRef]
  57. Purohit, I.; Purohit, P. Performance assessment of grid-interactive solar photovoltaic projects under India’s national solar mission. Appl. Energy 2018, 222, 25–41. [Google Scholar] [CrossRef]
  58. Instituto Português do Mar e da Atmosfera, Situação de Seca Meteorológica—31 October 2017; IPMA: Lisbon, Portugal, 2017. (In Portuguese)
  59. PORDATA—IPMA/MM, PORDATA—Precipitação Total, PORDATA. Available online: https://www.pordata.pt/DB/Portugal/Ambiente+de+Consulta/Tabela (accessed on 30 October 2018).
  60. Boutelhig, A.; Hanini, S.; Arab, A.H. Performances’ investigation of different photovoltaic water pumping system configurations for proper matching the optimal location, in desert area. Energy Convers. Manag. 2017, 151, 439–456. [Google Scholar] [CrossRef]
  61. Benghanem, M.; Daffallah, K.O.; Alamri, S.N.; Joraid, A.A. Effect of pumping head on solar water pumping system. Energy Convers. Manag. 2014, 77, 334–339. [Google Scholar] [CrossRef]
  62. Tarjuelo, J.M.; Rodriguez-Dias, J.A.; Abadía, R.; Camacho, E.; Rocamora, C.; Moreno, M.A. Efficient water and energy use in irrigation modernization: Lessons from Spanish case studies. Agric. Water Manag. 2015, 162, 67–77. [Google Scholar] [CrossRef]
  63. García, I.F.; Moreno, M.A.; Días, J.A.R. Optimum pumping station management for irrigation networks sectoring: Case of Bembezar MI (Spain). Agric. Water Manag. 2014, 144, 150–158. [Google Scholar] [CrossRef]
  64. Jiménez-Bello, M.A.; Alzamora, F.M.; Soler, V.B.; Ayala, H.J.B. Methodology for grouping intakes of pressurised irrigation networks into sectors to minimise energy consumption. Byosyst. Eng. 2010, 105, 429–438. [Google Scholar] [CrossRef] [Green Version]
  65. Rockström, J.; Karlberg, L.; Wani, S.P.; Barron, J.; Hatibu, N.; Oweis, T.; Bruggeman, A.; Farahani, J.; Qiang, Z. Managing water in rainfed agriculture—The need for a paradigm shift. Agric. Water Manag. 2010, 97, 543–550. [Google Scholar] [CrossRef]
  66. Crundwell, F. Finance for Engineers; Springer-Verlag London Limited: London, UK, 2008. [Google Scholar]
  67. Ouedraogo, B.I.; Kouame, S.; Azoumah, Y.; Yamegueu, D. Incentives for rural off grid electrification in Burkina Faso using LCOE. Renew. Energy 2015, 78, 573–582. [Google Scholar] [CrossRef]
  68. Branker, K.; Pathak, M.; Pearce, J. A review of solar photovoltaic levelized cost of energy. Renew. Sustain. Energy Rev. 2011, 15, 4470–4482. [Google Scholar] [CrossRef]
  69. Trading Economics, Portugal Inflation Rate, Trading Economics. Available online: https://tradingeconomics.com/portugal/inflation-cpi (accessed on 10 October 2018).
  70. Trading Economics, Portugal Interest Rate, Trading Economics. Available online: https://tradingeconomics.com/portugal/interest-rate (accessed on 10 October 2018).
Figure 1. (a) Pre-existing irrigation system configuration: The electric power at the output of the diesel generator, PAC, is controlled to keep the hydraulic pressure constant at the input of the irrigation network, p1. Black and blue lines represent the electricity and water, respectively. (b) Cycling evolution of the AC power (PAC) and pressure (p1 and p2) due to water filtering and filter cleaning periods.
Energies 11 03538 g001
Figure 2. Hours per day of irrigation scheduling and daytime.
Energies 11 03538 g002
Figure 3. Hybrid irrigation system configuration. A PV generator, a new motor-pump, and two FCs have been added to the pre-existing configuration of Figure 1. The new components are marked in orange, while the previous ones are in green.
Energies 11 03538 g003
Figure 4. Available PV power thresholds with hysteresis for the different operating modes—“Only PV”, “Hybrid”, and “Only Diesel”.
Energies 11 03538 g004
Figure 5. (a) Aerial view of the hybrid PV-diesel drip irrigation system. (b) Detail of the three motor-pumps and the water filter bench. The additional third pump is easily identifiable.
Energies 11 03538 g005aEnergies 11 03538 g005b
Figure 6. Incident irradiance profile on the tracker during the autumn equinox and the summer solstice.
Energies 11 03538 g006
Figure 7. The “passing-cloud” control strategy (f is the frequency and VDC the DC bus voltage).
Energies 11 03538 g007
Figure 8. Energy flows involved in a hybrid PV-diesel irrigation system.
Energies 11 03538 g008
Figure 9. Graphical representation of the different irradiations considered: (a) G IP is the irradiation during the irrigation period, (b) G useful is the useful irradiation during the IP determined by the design of the PV irrigation system; and (c) G used is the irradiation used effectively by the system.
Energies 11 03538 g009
Figure 10. Passing clouds’ routine on 2nd August 2018.
Energies 11 03538 g010
Table 1. ON(1)/OFF(0) status of the different operating modes.
DieselPV
ModeSoft-StarterFCMaster FCSlave FC
“Only PV”0011
“Hybrid”0110
“Only Diesel”1100
Table 2. PV energy and volume of water pumped (from PV and from diesel) in the optimistic and pessimist scenarios for “Only PV” and “Hybrid” modes. Diurnal working hours are also given for “Only PV” and “Hybrid” modes with the threshold of 95 kW to transit between these two modes.
Optimistic Scenario
MonthEPV (kWh) V m PV (m3) V m diesel (m3)WTday
“Only PV”“Hybrid”
March923533,48033,4800.09.0
April10,95639,72039,4800.011.0
May18,73567,92019,2006.55.2
June19,86072,00021,6007.06.0
July22,57481,84014,8809.04.0
August19,16569,48012,3607.73.3
September10,75839,00038,5200.110.7
October923533,48033,4800.09.0
Total120,517436,920213,000
Pessimistic Scenario
May13,33948,36037206.01.0
June17,87464,80014,4007.04.0
July11,12240,32005.40.0
August324411,76001.60.0
September1622588058800.01.6
Total47,201171,12024,000
Table 3. Parameters of the simulation.
ParameterValue/Option
Solar Climate DataPVGIS
PV module characteristicsCell materialCrystalline silicon
Nominal power of each PV module (Wp)250
Power modelOnly temperature effect
Coefficient of variation of power with temperature−0.420
Nominal operating cell temperature—NOCT45
Real power vs nominal power (%)96
Tracker characteristicsSeparation between trackers in E-W direction3
Maximum rotation angle (°)45
Axis orientation (°)0
Axis inclination (°)0
Separation between tracker rows in N-S direction1
Module inclination (°)0
Backtracking optionYes
Wiring lossesDC (%)1.5
AC (%)3
FCDC/AC conversion (%)95
Hydraulic partMotor-pump (%)69
Filter (%)80
Cleaning and other (%)90
Table 4. Simulated performance indices for the optimistic and pessimist scenarios.
Optimistic Scenario
MonthPVSHPR P R PV URIPURPVISUREF η Hyd
March0.500.370.901.000.411.000.50
April0.500.360.891.000.411.000.50
May0.780.490.871.000.571.000.50
June0.770.490.851.000.581.000.50
July0.850.510.831.000.611.000.50
August0.850.480.841.000.571.000.50
September0.500.360.861.000.421.000.50
October0.500.450.891.000.501.000.50
IP0.670.450.861.000.671.000.50
Annual0.670.370.860.830.671.000.50
Pessimistic Scenario
May0.930.350.871.000.570.710.50
June0.820.450.851.000.580.900.50
July1.000.250.841.000.610.490.50
August1.000.080.841.000.570.170.50
September0.500.050.861.000.420.150.50
IP0.880.250.851.000.560.520.50
Annual0.880.150.850.600.560.520.50
Table 5. Expected and actual STC power of the PV generator and FCs and motor-pumps efficiencies.
STC Power (kW)Efficiency
FCs (Electric)Motor-Pumps and Filter (Hydraulic)
Expected134.7 (−3.8% of nominal)0.950.50
Actual136.9 (−2.2% of nominal)0.930.45
Table 6. Real operational data in 2017.
MonthEPV (kWh) V m PV (m3) V m diesel (m3)WTday (h)
“Hybrid”“Only Diesel”“Only PV”“Hybrid”“Only Diesel”
April1960588023464140.50.60.1
May12,48037,44013,10514,0153.92.32.5
June11,70132,618671442,9024.31.17.2
July629317,559362014,8042.30.62.6
August1872500168918490.70.10.4
September15253958306530490.30.60.6
Total35,832102,45729,54077,034
Table 7. Real performance indices in 2017.
MonthPVSHDRPVSHPR P R PV URIPURPVISUREF η Hyd
April0.680.850.710.070.831.000.620.130.45
May0.580.480.740.330.811.000.650.630.45
June0.390.140.830.280.781.000.690.510.47
July0.470.200.830.140.781.000.700.260.46
August0.660.270.880.050.811.000.690.080.46
September0.400.500.560.040.811.000.750.070.45
IP0.490.280.780.160.791.000.690.290.46
Annual0.490.280.780.110.790.680.690.290.46
Table 8. Real operational data in 2018.
MonthEPV (kWh) V m PV (m3) V m diesel (m3)WTday (h)
“Hybrid”“Only Diesel”“Only PV”“Hybrid”“Only Diesel”
May347810,652227156,2131.20.37.7
June504015,936449740,8422.50.98.0
July11,42536,021629059,1582.50.98.6
August20,94855,54714,32241,2267.42.26.5
Total40,891127,50027,379197,439
Table 9. Real performance indices in 2018.
MonthPVSHDRPVSHPRPRPVURIPURPVISUREF η Hyd
May0.150.040.820.120.871.000.590.220.54
June0.260.100.780.190.831.000.630.370.56
July0.350.100.850.300.851.000.640.560.56
August0.530.260.820.560.831.000.680.990.55
IP0.360.120.820.220.801.000.600.440.55
Table 10. Economic data for the Alter do Chão PV-diesel drip irrigation system.
Values
IIC (€)170,277.03
IIC per Wp (€/Wp)1.22
OPEX0 (€)3064.8
h (%)1.19
i (%)0.82
r (%)−0.37
s (%)3
Table 11. Economic results of the Alter do Chão PV-diesel drip irrigation system.
Case StudyAB
NPV (€)634,767549,184
IRR (%)1513
PBP (years)8.810.1
LCOECS (€/kWh)0.130.15
Savings (%)6153

