Article

Renewable and Sustainable Energy Transitions for Countries with Different Climates and Renewable Energy Sources Potentials

1
Institute of Building Environment and Facility Engineering, School of Civil Engineering, Dalian University of Technology, Dalian 116024, China
2
Department of Mechanical Engineering, Aalto University School of Engineering, P.O. BOX 14100, FI-00076 Aalto, Finland
3
Dipartimento Energia, Politecnico di Torino, Torino, Corso Duca degli Abruzzi 2, 10129 Torino, Italy
4
Condens Heat Recovery Oy, Puhelinkatu 12, 13110 Hämeenlinna, Finland
*
Author to whom correspondence should be addressed.
Energies 2018, 11(12), 3523; https://doi.org/10.3390/en11123523
Submission received: 21 September 2018 / Revised: 28 November 2018 / Accepted: 10 December 2018 / Published: 18 December 2018

Abstract

:
Renewable energy sources (RES) are playing an increasingly important role in energy markets around the world. It is necessary to evaluate the benefits from a higher level of RES integration with respect to a more active cross-border transmission system. In particular, this paper focuses on the sustainable energy transitions for Finland and Italy, since they have two extreme climate conditions in Europe and quite different profiles in terms of energy production and demand. We developed a comprehensive energy system model using EnergyPLAN with hourly resolution for a reference year for both countries. The models include electricity, heat and transportation sectors. According to the current base models, new scenarios reflecting an RES increase in total fuel consumption have been proposed. The future shares of renewables are based on each nation’s potential. The outcomes of the new scenarios support the future national plans, showing how decarburization in an energy system can occur in relation to the European Roadmap 2030 and 2050. In addition, possible power transmission between Italy and Finland were investigated according to the vision of an integrated European energy system with more efficient cross-border activities.

Graphical Abstract

1. Introduction

The transition from conventional energy sources towards a renewable and sustainable energy system is currently the subject of much discussion throughout the world [1]. The liberalization of the energy market was introduced in EU at the end of 20th century, and in 2011 the European Commission [2] decided that no member state should remain isolated from electricity and gas networks after the year 2015. European countries should share their natural resources, especially in a complementary manner among neighbors, and act together to achieve lower energy costs. However, the previous century was characterized by centralized and large-scale power plants using traditional fossil fuels to supply power to limited surrounding areas. This paradigm has gradually been superseded by distributed energy systems (DES), which are becoming more popular, especially as the share of renewable energy sources (RES) continually increases in the energy market [3]. New EU targets specify that the share of RES should increase year by year with respect to future energy management, and this is also a reflection of the low carbon emission policy, such as the Paris Agreement, which is supported by the United Nations Framework Convention on Climate Change (UNFCCC). In addition, RES will play a relevant role in the energy market by affecting electricity prices [4,5]. Each power supplier sells electricity at a marginal cost of production and the market price is set according to the mechanism of merit order [6]. All renewable energies have nearly zero marginal costs; and the other costs, mainly operating costs, are also quite low. RES are the first choice in the ranking of merit order, which helps form a cost-effective electricity market [4,5].
Nowadays, RES account for 23.5% of all electricity and comprise 14% of the energy sector in the EU. The number of installations and investments in RES will increase in the near future, because the EU would like to be the world leader in the utilization of RES [5]. The future energy frameworks for 2030–2050 are based on the development of renewable energies and securing their supply. To achieve this objective, the EU’s Energy 2020 strategies should be fulfilled, with the agreed targets being reached by 2020 [7]. This strategy has always been working according to the already achieved results; in 2012, greenhouse gas emissions were reduced by 18% in comparison to 1990 levels. The share of RES was 13% greater than the total primary energy consumption, bringing 44% of the world’s renewable electricity to the EU. Meanwhile, the energy intensity and carbon density of the EU’s economy decreased by 24% and 28%, respectively [7]. Such progress formed the starting point to defining the 2030 policy framework, where the European Energy market should be able to achieve a 40% reduction in greenhouse gas emissions (also compared to the 1990 level). Meanwhile, renewable energy consumption should account for at least 27% in the total energy structure, and at least 27% in energy savings should be achieved compared to the business-as-usual scenario [7]. Furthermore, the European Commission also set a long-term energy policy via the Energy Roadmap 2050, where the environmental aspect plays a central role. The new scenario is an ambitious one for reducing greenhouse gas emissions by 80%–95%. The year 2050 is presently a timely benchmark for the policies to address this climatic challenge, which could encourage greater low-carbon investments in each sector [8,9]. In light of such developments, the EU Emissions Trading System (EU ETS) is working to combat greenhouse gas emissions by opening a trading market. The system covers 45% of the total greenhouse gas emissions and it is open for all EU members as well as Iceland, Liechtenstein, and Norway [10].
Child and Breyer [11] discussed the definition of transition and transformation in terms of energy systems, and they suggested that changes of physical forms be denoted as transformations, while changes to large socio-technical systems as transitions, when highlighting the ways that society motivates, facilitates, and benefits from the change on a higher level. Energy transition is being discussed more extensively in many countries and regions of the world, not only due to the depletion of fossil fuels, but also because of the challenge of climate change and irreversible pollution [12]. Reducing the use of fossil fuels while promoting RES is crucial for attaining the sustainable development goals [13]. Ruppert-Winkel et al. [14] developed a heuristic three-phase-model (3PM) for regional energy transition simulation, and it was successfully used in three case studies in Germany. They focused on how the transition towards a local, renewable energy-based system could be implemented in Marin County. Lange et al. [15] analyzed the transition to marine renewable energies based on the Irish governance setup and the current capacity. They believed that the situation of the governance setup and power balances across domains should be studied for the energy transition, which is reflected in this research as analyzing the benchmark case and transition scenarios based on the RES potentials. Lind and Espegren [16] showed how the city of Oslo can assume the lead in sustainable energy transition through innovative ideas and solutions. They analyzed various energy and climate measures and their potential to transform Oslo into a low-carbon city. These studies built case specific models for cases, but they mainly focused on the local energy transition in a city level, which cannot reflect the situation of the whole country. Guidolin and Guseo [17] studied some quantitative aspects of the energy transition in Germany. Especially they analyzed the competition and substitution between nuclear power and renewable energies. Anil et al. [18] addressed an hourly model for Turkey’s energy transition until 2050 towards 100% renewable energy considering electricity demand development, technical and financial assumptions and resource availability of RES. Mediavilla et al. [19] studied the transition towards renewable forms of energy in Spain. They used a dynamic model to evaluate the depletion patterns of world fossil fuels and their possible replacement by RES. Zakeri et al. [20] proposed a market-based energy system model to simulate Nordic and German energy markets using MATLAB. They examined the impact of integrating a variable renewable energy in Germany with the Nordic power market in terms of power transmission and electricity price. Vidadili et al. [21] explored sustainable development in Azerbaijan through the transition to renewable energy and proposed appropriate measures to shift the country away from oil-based production. Although these studies have provided insights into the proper energy transition in terms of different energy forms, there are also limitations. One is that few studies considered the energy supply and demand data with hourly resolution for the country level when modelling the energy transition. The other is that the energy transition models did not consider the RES potentials in the long run or they were not accurate even reflecting the current energy market as the base case. All these problems will be fixed in this paper to make the long term energy transition model more accurate the reliable.
China has also been making intensive efforts to address energy transition and climate change issues because of the huge amount of energy consumption and greenhouse gas emissions. Chai and Zhang [22] highlighted the energy dilemma in China’s modernization process and studied the technological and policy options for making the transition to a sustainable energy system in China using a low carbon energy model (LCEM). They concluded that China needs to take further actions to strengthen the research and development of innovative sustainable energies, to create stronger economic incentives for them, and to improve the integration levels. Sun et al. [23,24] analyzed the role of RES in China’s sustainable energy transition, and presented that renewable energy development is required to reach the Intended Nationally Determined Contribution (INDC) for the post-2020 period. They reviewed the potential of renewable energy in China and how it could be utilized to meet the INDC goals. Eight alternative scenarios with 40% renewable electricity are explored using the EnergyPLAN. The results show that renewables can help reach the 20% share of non-fossil energy in primary energy and 40%–50% share in electricity production. But China still should implement new policies to promote integrated development of wind and solar power. Several other Asian countries, such as India [25,26], Thailand [27], Japan and Korea, are also adopting their own measures to achieve sustainable energy transitions [28]. Mohammad and Khan [29] studied how one of the most non-renewable countries—Saudi Arabia—is acting concerning the global challenge of energy supply vs. resources for energy generation, emphasizing the use of solar energy. In addition, some researchers also tried to evaluate the effects of social and political aspects on the renewable energy transition. Dóci et al. [30] reported that renewable energy communities are grassroots initiatives that contribute to meet consumption needs and environmental goals and thus conduce to the spread of renewables. Therefore they explored the potential of renewable energy communities as social niches to contribute to the energy system transition. For this purpose, they propose three proxies for measuring the transition potential of social niches based on technological innovations from literature. Steg et al. [31] also considered the human dimensions of the sustainable energy transition, and they propose a general framework to understand and encourage sustainable energy behaviors. Dumas et al. [32] however studied the political issues arising from the energy transition and indicated the effects of political competition on the renewable energy transition in the long run. These studies promoted the energy transition studies in Asia, but unfortunately the models did not consider the possible power transmission between neighbouring countries, and the proper aggregation method for energy supply and demand considering different climate zones in each country. Therefore, this study proposed a novel aggregation method which can be used to map the local energy supply and demands to the country level.
It was widely acknowledged that the future energy systems should integrate more and more RES to respond to the climate change. This is also the important way to the efficient energy systems, which gradually abandons the fossil fuels. According to the literature review, previous studies usually focused on one sector or part of the energy market, however, the energy transition study should consider the energy supplies and demands of the whole energy market. Sometimes it is quite difficult to obtain the detailed energy supply and demand data for several energy sectors in the country level, therefore, this study proposed an aggregation method to scale up the energy profiles based on the typical data of typical cities. Few researchers had considered the energy transition considering the relatively accurate profiles of supplies and demands in hourly resolution as well as RES potentials in the country level. Therefore, this paper tries to bridge the above mentioned gaps by studying the renewable and sustainable energy transition for two countries with different profiles in the supplies and demands, RES potentials as well as the different climates by using the EnergyPLAN. We will define the base scenarios and energy transition scenarios with different RES shares for two countries according to the RES potentials, and to examine whether and how the transitions could happen, and their influences to climate change. The possible interlinks between the two countries are also considered in the energy system modelling in order to examine the possible influences of the energy transmission and more efficient cross-border activities on the energy transition. These are the main new contributions to the existing pool of knowledge in this respect.
Since the transition to RES is becoming more extensive, it is necessary to model and simulate the transition for a wider region than just one sector or one country, especially when considering the different climate conditions and different portfolios of energy supply and demand data. Therefore, the objective of this study is to model the actual energy markets for different climate regions, taking Italy and Finland as examples since they have two extreme climate conditions in the EU and very different supply and demand profiles. In addition, Finland is one of the leading countries in RES utilization, while Italy has a larger potential market for integrating RES solutions. This paper analyzes the different energy policies, the energy balances, and the final energy consumption rates for a chosen reference year in both countries considering the different energy transition scenarios. The energy system models were developed using EnergyPLAN, and future possible RES integration scenarios for both countries were introduced by changing the model inputs regarding the share and portfolio of renewables. The impact of the share of RES on the total energy consumption and total CO2 emissions are also analyzed. Moreover, the model can be used to analyze whether the two countries could be complementary in terms of electricity demand and market price in a future European market regarding cross-border power transmission.

2. General Comparison of the Climate Conditions and Populations of Italy and Finland

Italy is located in southern Europe and its climate is highly diverse due to the varied terrain. Italy has seven different climatic zones, ranging from humid subtropical, humid continental, oceanic, to warm and temperate Mediterranean, with average winter temperatures varying from 0 °C on the Alps to 12 °C on the islands, but temperatures can climb up to 30 °C in some areas [33]. At the end of 2013, Italy had more than 60.7 million inhabitants and a population density of 202 persons per square kilometer, though not at all equally distributed throughout the country [34].
Finland, which lies in the boreal zone, is one of the world’s northernmost countries, and it is characterized by warm summers and cold winters. The country has two different continental climates: a temperate continental climate, which is influenced by the moderating effects of the Baltic Sea, and a cool continental climate in the Arctic region of the north. The winter season is long, with snow covering the land until late March or even April, and the temperature can fall to −30 °C even in the coastal areas, whereas the average summer temperature remains above 10 °C [35]. The population of Finland is currently 5.5 million, mostly concentrated in the southern parts of the country. It has a population density of 18 persons per square kilometer, which is the lowest in the EU [36]. In addition, Finland’s nominal GDP per capita is almost double that of Italy [34,35].
From a European perspective, and when thinking about the integral European energy market, an energy market analysis can be an interesting point of comparison. The differences in climate and populations are linked to different heating, cooling, and electricity demands. The different locations affect energy resources and the criteria for choosing a specific energy transition pathway.

3. Energy System Modeling for Italy

EnergyPLAN version 11.4 was adopted for energy system modeling, since it was developed to model planning strategies for different energy systems based on technical and economic analyses. The model can be applied on a national level as well as a local one, and it is possible to include a wide variety of energy technologies and to specify the types of desired interactions between the heating and electricity systems [36]. The model implementation phase starts with filling out input data sheets, which mainly include: (1) demand: the annual demands for electricity, annual productions and demands for heating and cooling, fuel consumption for heating, industry, transport, and non-energy uses; (2) supply: installed capacity of each energy technology for electricity and heat production, for central power plants as well as for intermittent renewable sources and fuel consumption in each plant; (3) cost: fuel costs, fixed and variable costs for each installed technology. The analysis was carried out using an hourly resolution for the chosen reference year of 2013. It is possible to choose between a technical energy system analysis and a market-economic energy system analysis, and the last step has to do with regulations and final results, which consist of energy balances, levels of fuel consumption, CO2 emissions, and system cost calculations.

3.1. Demand Data

3.1.1. Electricity Demand

According to International Energy Agency (IEA), Italy is the fourth largest electricity consumer in Europe after Germany, France, and the UK [33]. In 2013, the electricity demand in Italy was 318.5 TWh, as declared by TERNA (Rete Elettrica Nazionale), the Italian electricity transmission system operator [37]. From the website of the European Network of Transmission System Operators (ENTSO—E) it is possible to download the country package for the reference year and obtain the hourly distribution of the electricity demand [38]. The hourly electricity demand of Italy in 2013 is shown in Figure 1. This electricity demand also includes electric heating and cooling. The figure shows that the trend was smooth throughout the year, with peaks in the last months of the year because of the need for artificial lighting and during the warmest summer period because of the demand for cooler air, most of which was satisfied by electrical technologies. The cross-border exchange varies every year, depending on the national production.

3.1.2. Heat Demand

The total heat demand is the sum of the heat demand for individual heating and district heating. Approximately 66% of Italian families use independent heating sources via a type of technology installed in their own flat, while only 15% of them use a centralized heating system [39]. Natural gas and biomass are the preferred energy sources for individual heating, and they account for 83% of the total fuel consumption, as shown in Figure 2 [40]. The input data for individual heating is linked to the annual fuel consumption (TWh/year) for each type of boiler technology. Furthermore, in the individual heating input data sheet, the solar thermal contribution to each type of boiler must be analyzed for the production of domestic hot water (DHW) [41]. According to Italian National Agency for New Technologies, Energy and Sustainable Economic Development (ENEA) [42], an average yearly solar thermal energy density of 700 kWh/m2 can be chosen as the base point and the estimated solar thermal energy input for individual heating is 2.3 TWh/year [41]. The amount of heat storage has been chosen for one day based on the typical dimensions of a water tank for an individual building [43].
In Italy, district heating is a rather young technology compared to other European countries. According to the annual report of the Italian Association of Urban Heating (AIRU), 209 grids were in operation and district heating was active in 179 municipalities throughout the northern regions and in certain parts of central Italy in 2013 [44]. In 2013, the Italian district heating production was 10,966 GWh, while the thermal energy needed to fulfill the heat demand was 9200 GWh [44]. In addition, the heat demand input data sheet requests yearly heat demand data both for individual heating and for district heating. It is much more difficult to find reliable data for the total heat demand in Italy as well as in other European countries. However, we can use some aggregated methods to calculate them as follows.
Italy has six major climate zones [45], depending on the heating degree days (HDD) [46,47] and tundra climate zone above the tree line in the Alps. Therefore it is not easy to study common heat demand behavior during the year. The 8000 Italian municipalities are spread across six major climate zones. To model the heat demand distribution, one city in each climate zone has been selected as shown in Table 1. Zone A and tundra climate zone are so small that no city was chosen for the model. In addition, there are few municipalities in Zone F compared to Zone E; therefore, they are included in Zone E in the heat demand calculation.
First, we calculate the heat demand distribution for each typical city using the hourly temperatures (HDD) of that city, and then we obtained the annual heat demand for each person living in the city per year. Therefore we can get the heat demand distribution for the climate zone represented by the city. Finally the total heat demand distribution is calculated by the summation of all heat demand in different climate zones. The hourly temperatures of the reference year for each typical city can be found in Wunderground [48] and other detailed data can be found for Messina [49]. It is also possible to deduce the heat demand per person for Naples, Rome, and Milan by using Equation (1) if only hourly temperatures are available:
Q city = Q Messina Q tap HDD Messina × HDD city + Q tap
where Qcity is the annual heat demand for a specific city in MWh/person·year; HDD are the heating degree days for a specific city; Qtap is the heat demand needed for hot water production, usually presumed to be 30% of the heat demand for a specific city [46]. Therefore, the annual heat demand for the typical city in each zone has been calculated and is shown in Table 2.
Hereafter, we can scale up the hourly distribution for each city using the HDD distribution for that particular city and the number of inhabitants in each zone. The same procedure has been applied to estimate the hourly heat demand distribution in Zones D, E, and F. Finally, the annual heat demand for the whole country is the sum of the estimated annual heat demand in each zone, as shown in Figure 3. It clearly shows that the heat load is highly dependent on the climate, and in summer time when space heating is not needed, the heat load will maintain a minimum but stable level for the DHW preparation.

3.1.3. Cooling Demand

According to the National Institute for Statistics (ISTAT), only one-third of families have air conditioning (AC) systems [39]. Many of the buildings do not even have an AC system. In general, the most common AC technologies are heat pumps (HP) and electricity. The electricity for cooling is estimated to be equal to 18 TWh/year in southern Europe [50]. The cooling from district heating involves transporting heat to the users and locally producing cooled water via absorption HP, driven by hot and superheated water. It is not so popular because of the high costs for transport and production, limited working times, and the low retail price. However, we estimate that the annual cooling production is 105 GWh, but considering the losses related to the network, 102 GWh is the actual energy input of the network [44].

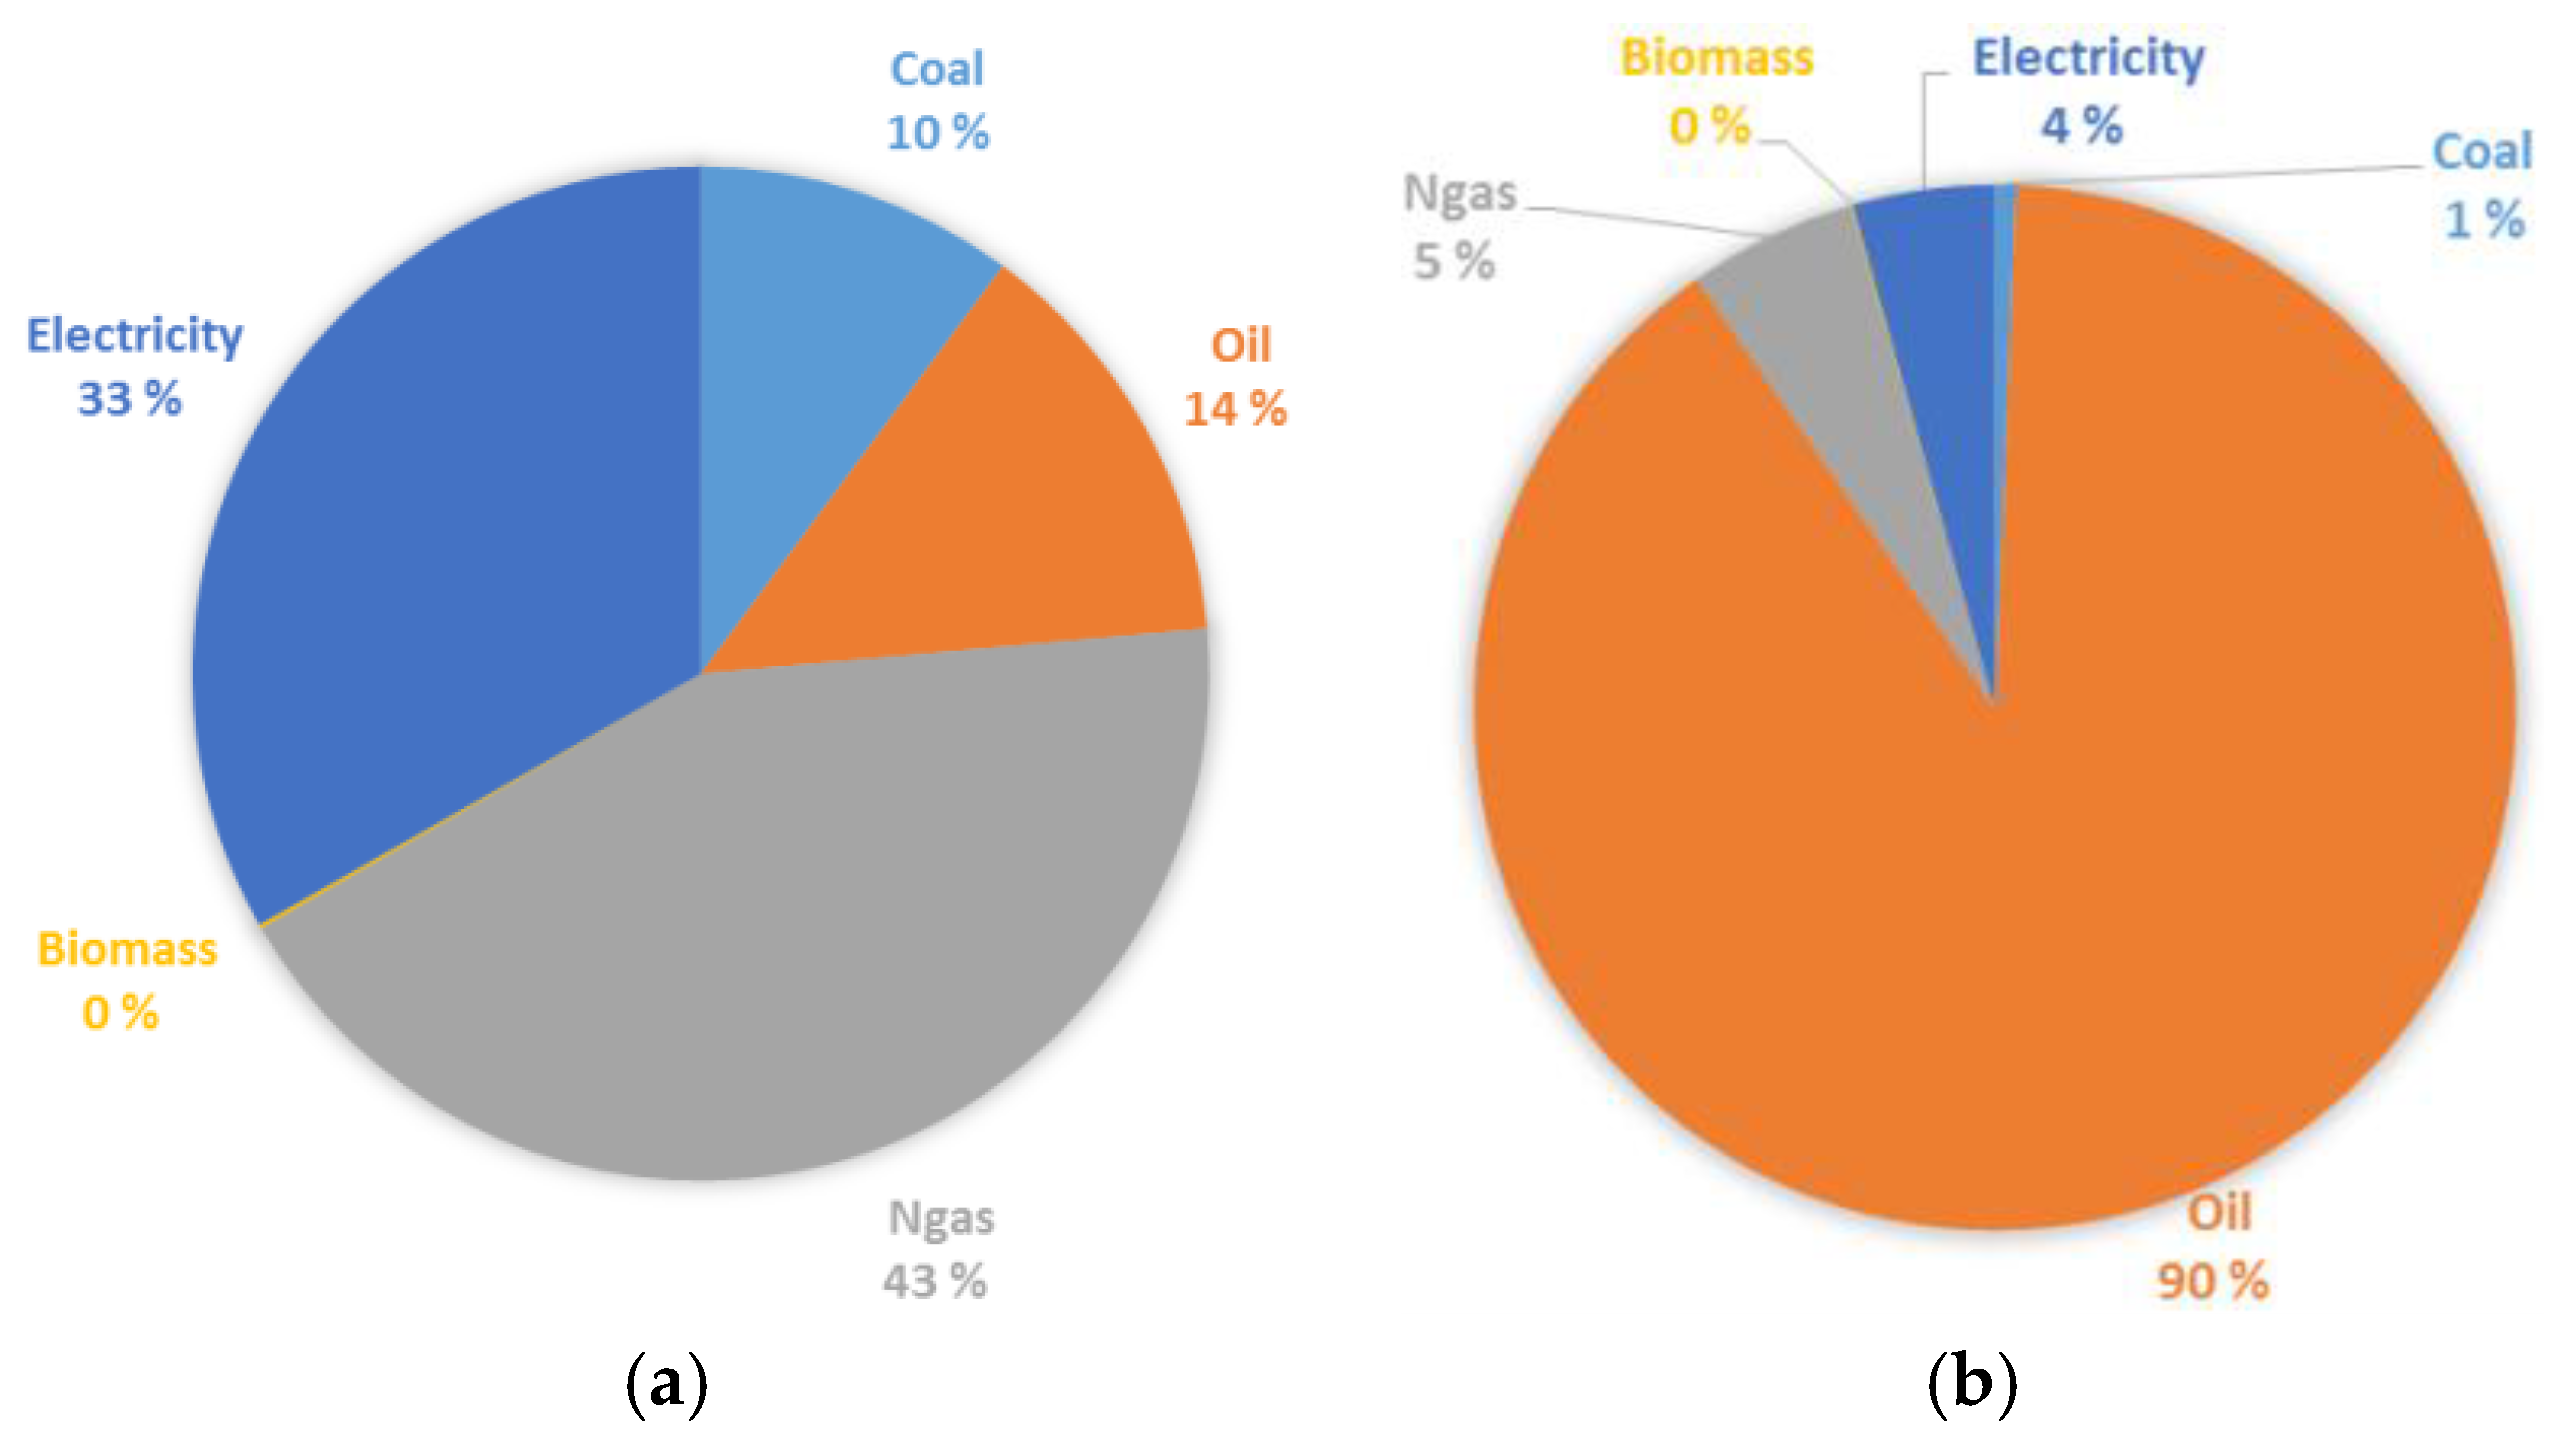
3.1.4. Industry and Other Fuel Consumption

The share of each fuel used in the industry is shown in Figure 4a, and it highlights the role of natural gas in the Italian energy market [51]. In addition, various types of energy can include any fuel that has not been accounted for in industry, such as fuels for non-energy uses, agriculture, and bunkers [36], shown in Figure 4b.

3.1.5. Transport

According to the ENEA [51], energy consumption in the transport sector has dropped by 2% in comparison with the previous year, from 38.6 to 37.8 Mtoe (million tons of oil equivalent). Oil dominates the fuel consumption used for transport, as shown in Figure 5.

3.2. Supply Data

After having defined the energy demand, we now focus on the supply data and analyze the energy production from different technologies.

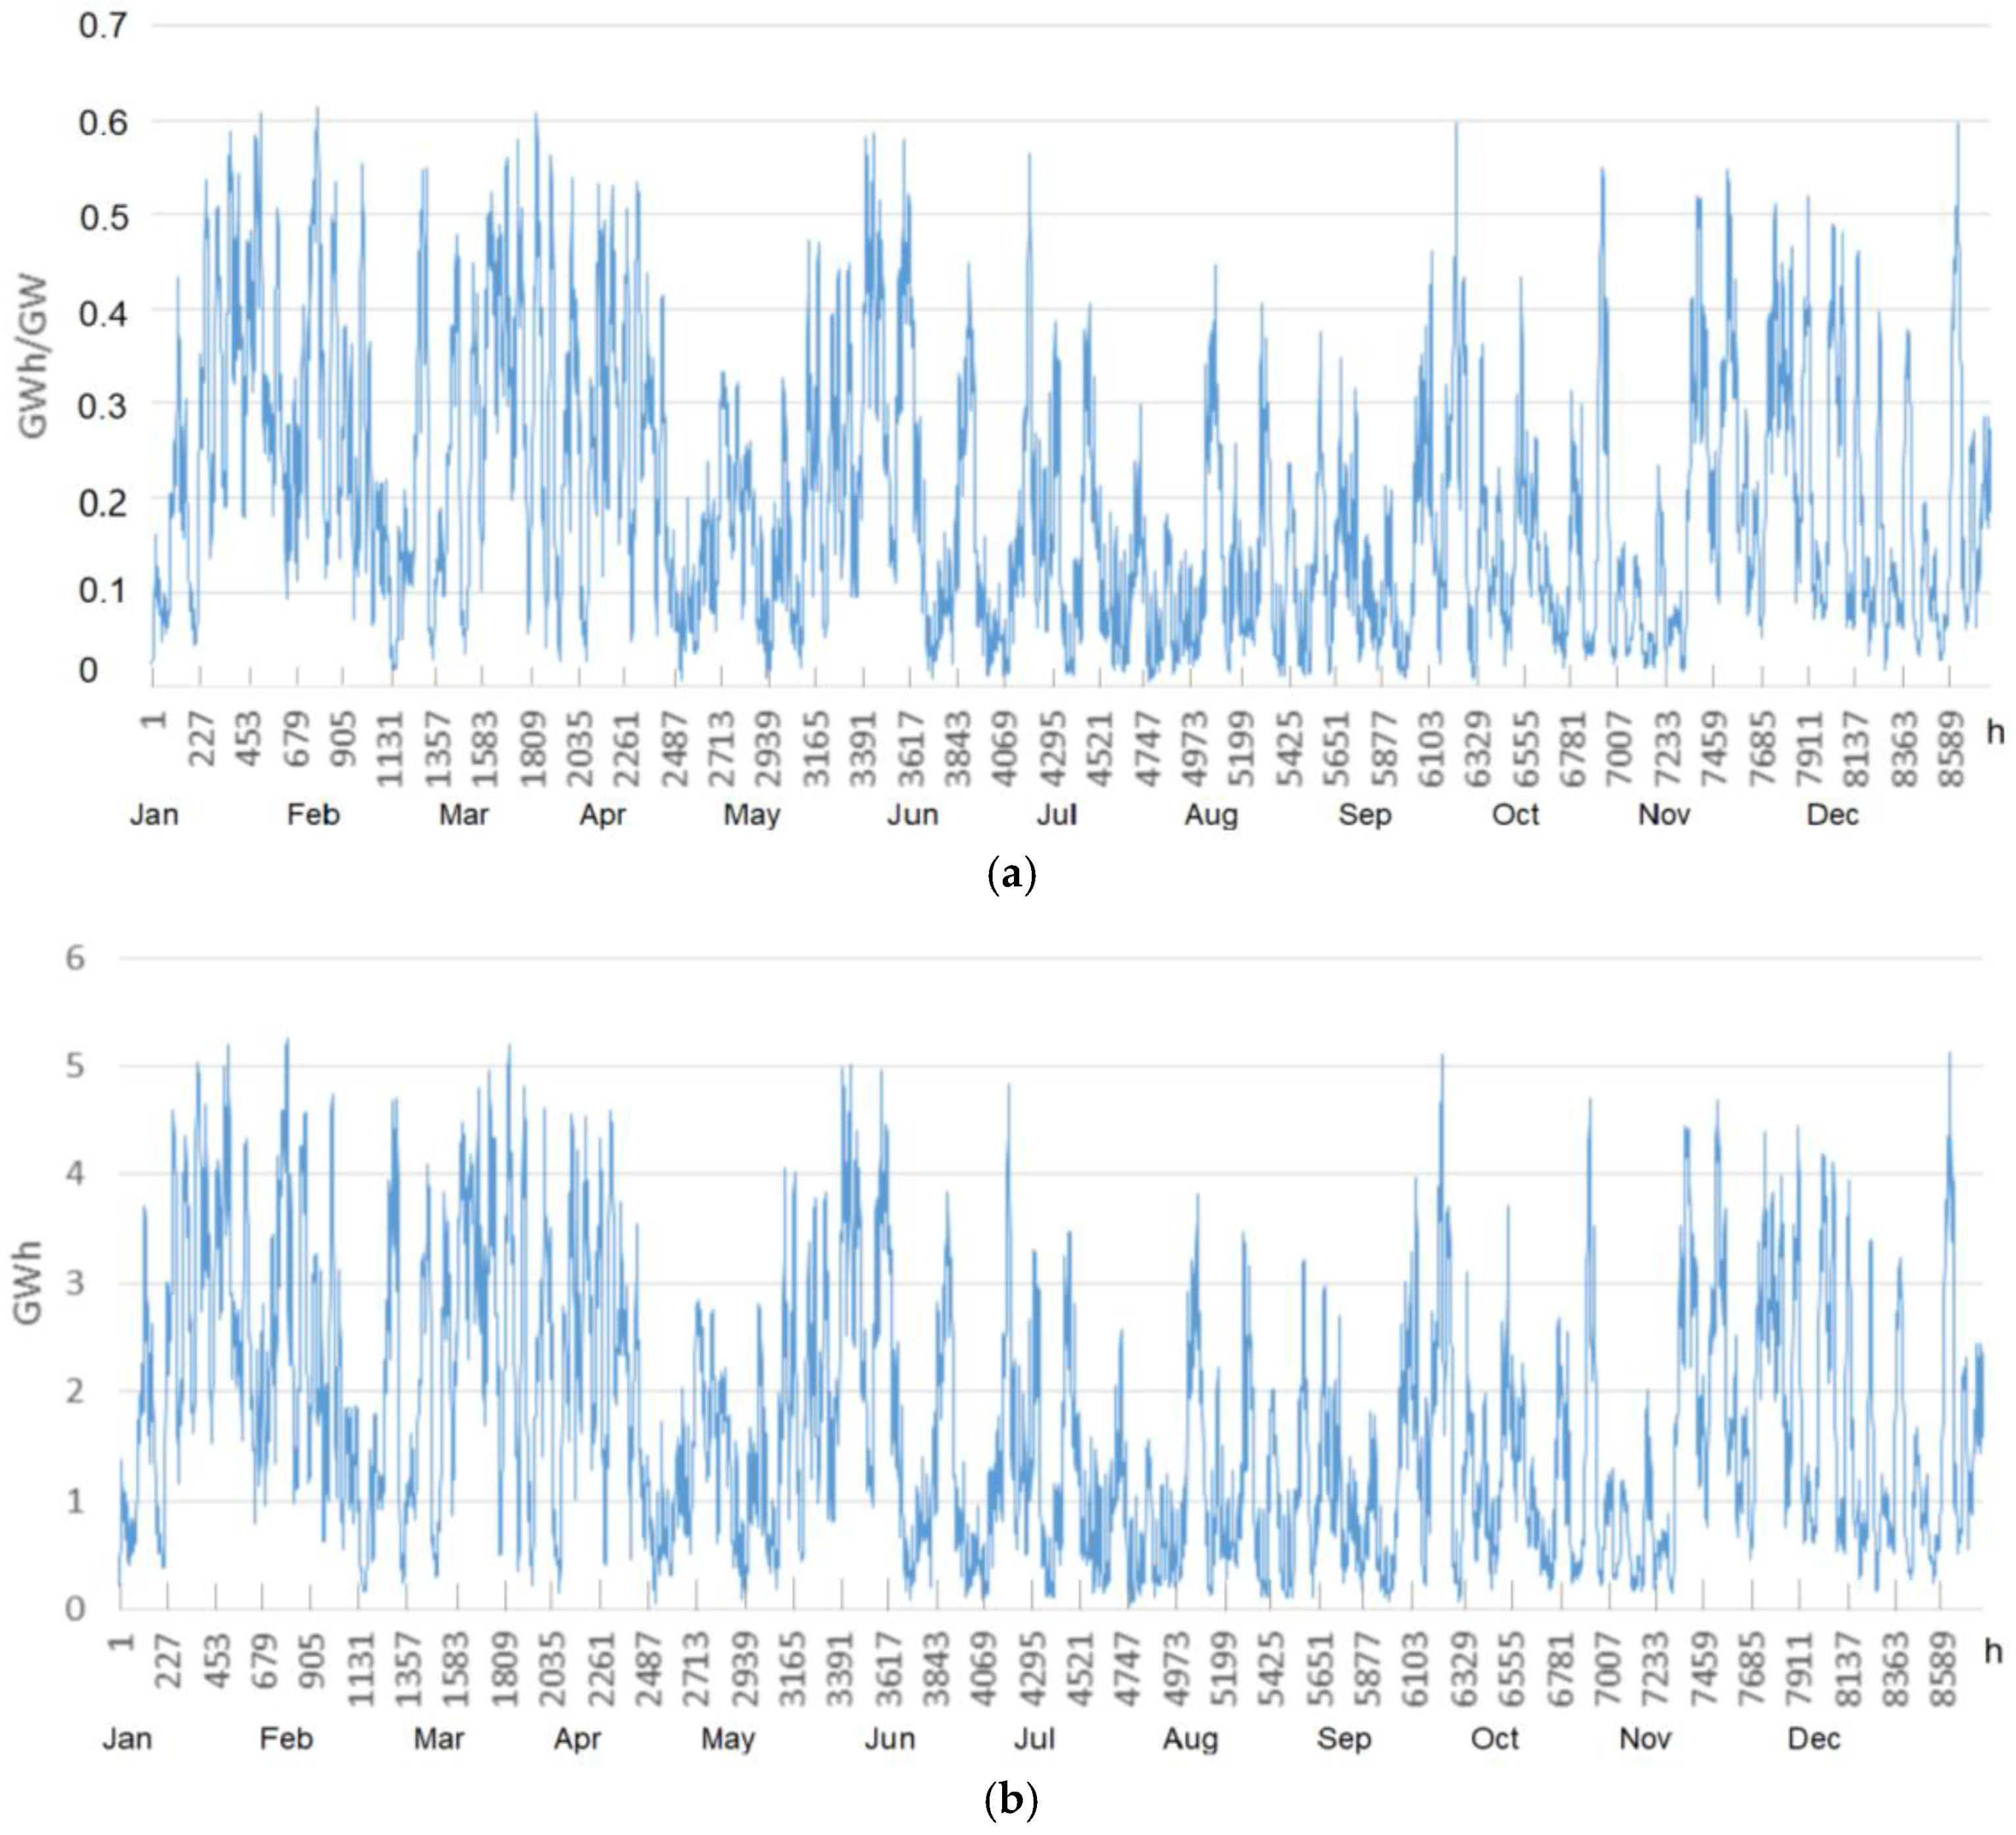
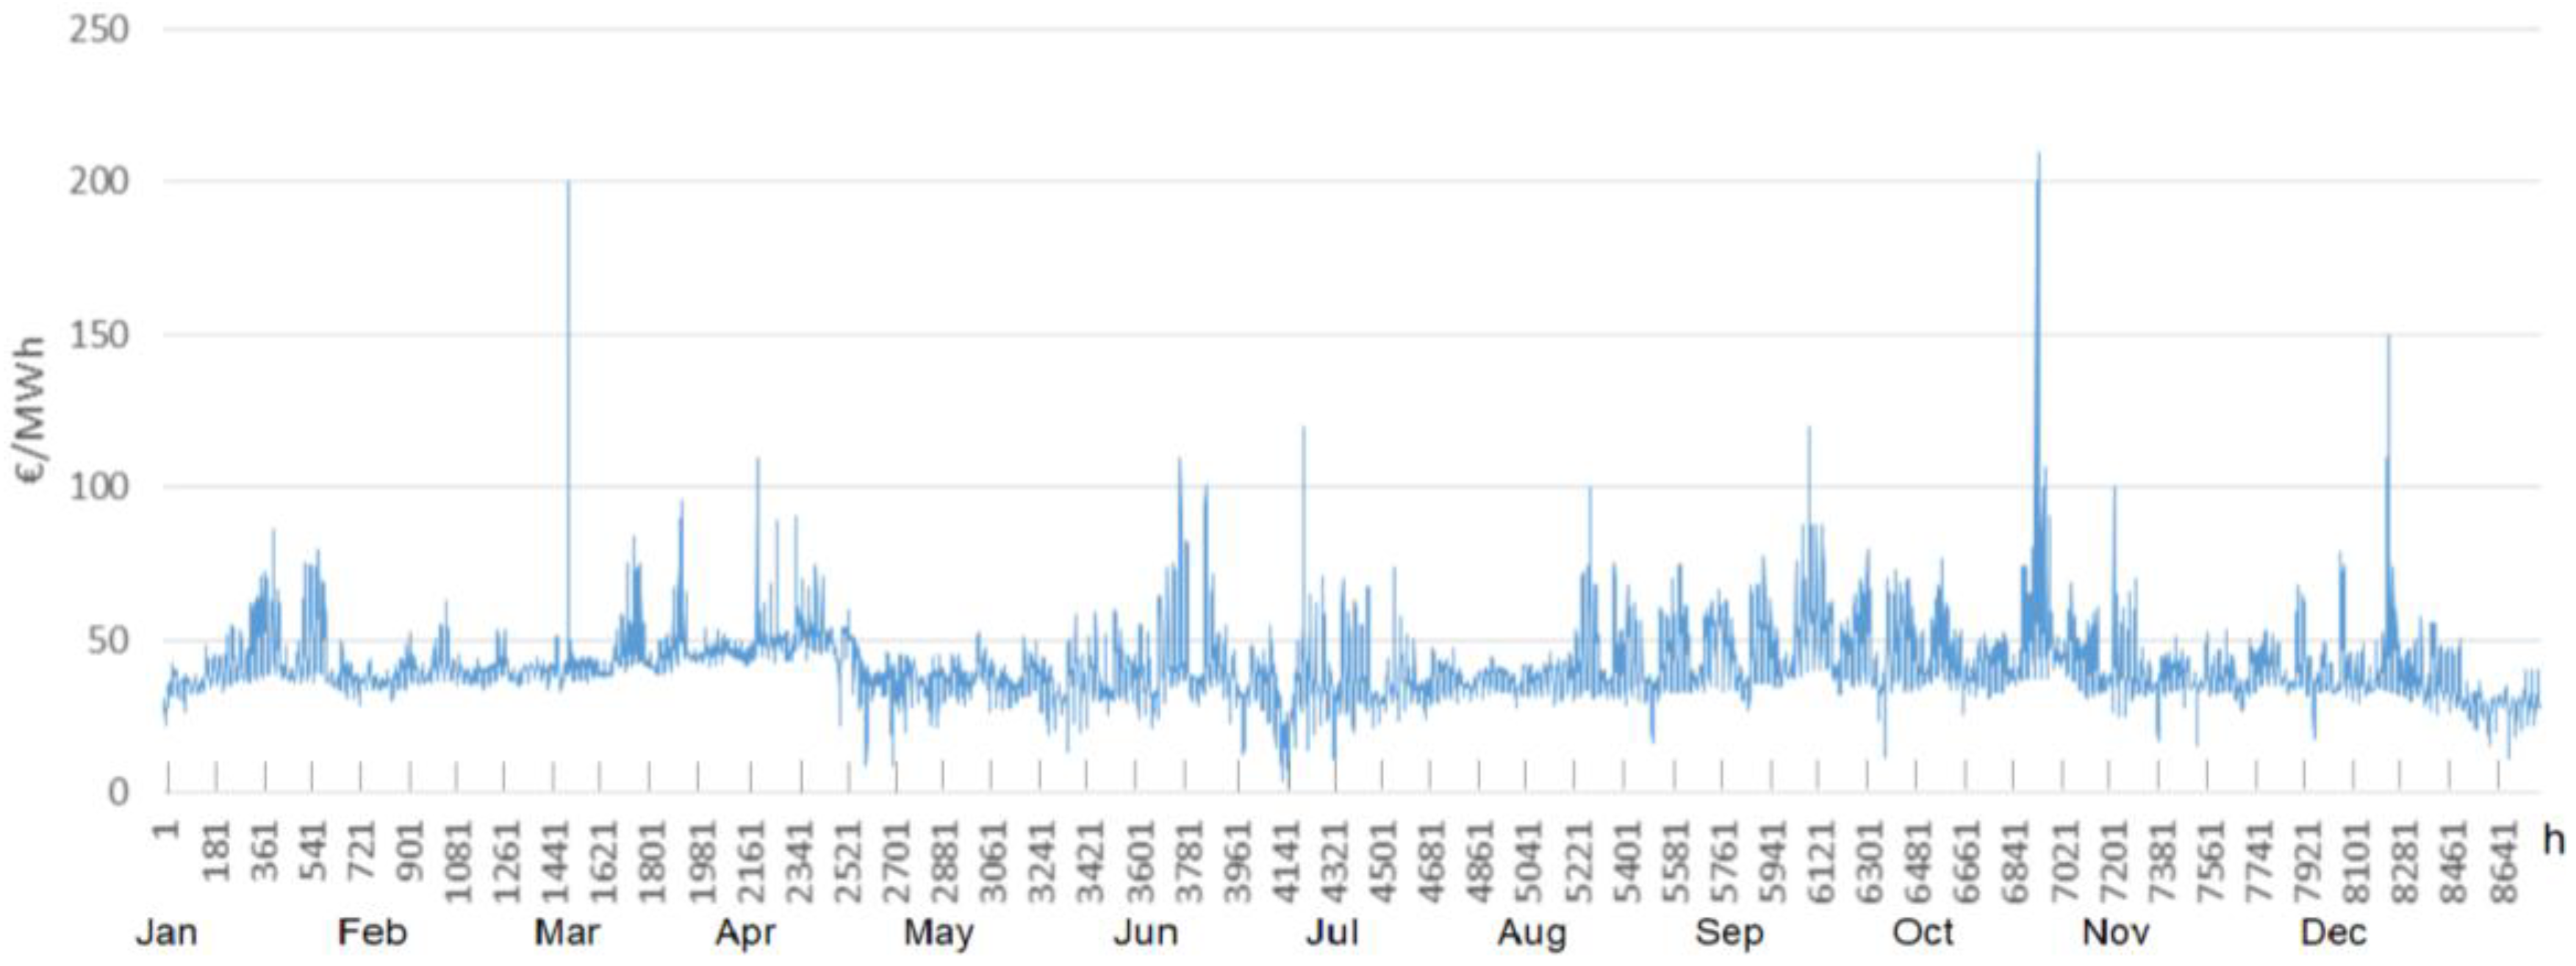
3.2.1. Electricity Supply

Here we focus on the input data of electricity production from RES and from other conventional technologies, such as condensing plants. During the past decade, renewable energies have changed the Italian energy system drastically, and nowadays Italy is a leading country for producing electricity using RES [51]. In the EU 2020 policy, the gross final energy consumption covered by RES production must reach 17% by 2020 [33]. This part of energy consumption includes the direct use of RES and the part of electricity and heat that is produced from renewables. For the reference year of 2013, 8.9% was the share covered by RES-E, while 10.6% was covered by RES-T [33], which means that the target has already been reached. In 2013, 600,000 RES-E units were recorded when accounting for photovoltaic collectors, wind power plants, hydropower plants, and geothermal energy, but the distribution is irregular along the peninsula depending on different climate conditions and potentials.

Solar

At the end of 2013, the total installed capacity of photovoltaic panels was 18,053 MW, and most of those power plants had capacities ranging from 3 kW to 20 kW, while a small proportion of them were large plants with capacities of between 200 kW and 1 MW or greater than 1 MW. The production was 21,589 GWh, which accounted for 19% of the total electricity production from RES-E [33]. Northern Italy installed more photovoltaic panels than the southern part of the country, but it produced less electricity because of the different solar irradiation densities. According to TERNA [52], we can obtain the actual generation figures for each renewable source for each hour of the reference year. Therefore, the hourly distribution of photovoltaic electricity has been calculated and shown in Figure 6a. It is clear that solar production follows the seasonal change, but Italy has a large potential of solar energy even in the winter time, which is quite different with Finland.
The specific hourly distribution, which means the ratio between hourly production and the total installed capacity, have been calculated and is shown in Figure 6b. This ratio is required by EnergyPLAN, and it shows the amount of real energy produced in comparison with the maximum that can be extracted; its value is between 0 and 1. In this case, the ratio is 0.14, which means the equivalent time of actual use of the photovoltaic power plant was 1241 h during the reference year.

Wind

In Italy, there were 1386 wind power plants at the end of 2013. Most of them were small in size, with power outputs of less than 1 MW. The installed capacity was 8561 MW and the production was 14,897 GWh, mostly from large power plants with capacities lager than 10 MW [41]. More wind turbines have been installed in southern Italy and they produce the majority of the wind power in the country. The hourly distributions of wind power can also be obtained from TERNA as shown in Figure 7. Like many other countries, the wind energy distribution of Italy seems quite stochastic, but in general the wind speed is a bit higher in winter time. Using the overall capacity and final production levels from all installed wind turbines, we can calculate their ratio as being equal to 0.20 for Italy and estimate the average equivalent working hours as being equal to 1793. Moreover, the specific hourly distribution of wind power can be used in the EnergyPLAN datasheet.

Geothermal

Geothermal production has not experienced changes in recent years. The installed capacity is about 773 MW, and most of this production is accounted for by small plants with capacities of approximately 20 MW. The geothermal electricity production was 5659 GWh in 2013 [41]. The constant hourly distribution was used in the EnergyPLAN database. The geothermal power station has the role of maintaining the grid’s stability, and it is considered to be running at base load; therefore, the geothermal power plant does not participate in active regulation. The geothermal electricity production is the total obtained when multiplying the capacity, the hourly distribution, and the correction factor. Once the annual production rate and the installed capacity were known; we found the calculated correction factor to be 0.834 and the equivalent hours of work 7020.

Nuclear Power

Four nuclear power plants have been built in Italy, but none of them have been working since the Fukushima accident in 2011.

Hydropower

Italy has about 3250 hydropower plants, with a total installed capacity of 22,009 MW, of which 17,023 MW is from dammed hydropower while the rest is from river hydropower [53]. In 2013, the total hydropower production was 52,773 GWh, most of that coming from plants larger than 10 MW [53]. According to TERNA [53], it is possible to estimate these two levels of productions as the sum of the hourly distribution for the whole reference year, as shown in Figure 8. It can be found the hydropower production is higher in summer time.
After analyzing the different contributions to electricity production from the different renewable sources installed in Italy, we can calculate their share of RES electricity production, as shown in Figure 9. In 2013, the total amount of electricity produced from RES was 95 TWh, which was capable of covering 30% of the national electricity demand during the reference year. Hydropower dominates RES electricity production with a share of 55%, followed by solar power and wind, whose shares are 23% and 16%, respectively, while geothermal production only contributes 6%.

Condensing Power

The condensing power was 52,566.7 MW. According to TERNA documentation on condensing power generation, they were able to produce 94,327.8 GWh during the reference year [53,54].

3.2.2. Combined Heat and Power Supply

This input datasheet is devoted to combined heat and power (CHP) plants and the production of heat to fulfill the demands of district heating networks. In Italy, district heating is not a widespread technology; only a small part of the district heating demand is met by CHP. The total CHP installed capacity was 18,632.5 MW, while electricity production was 88,355.2 GWh. According to AIRU [44], the 10.3 TWh of heat produced for the district heating network is associated with:
(1)
Cogeneration power plants fed by fossil fuels: 851 MW;
(2)
Cogeneration power plants fed by biomass: 78 MW;
(3)
Auxiliary boilers fed by fossil fuels: 4726 MW (thermal);
(4)
Auxiliary boilers fed by biomass: 336 MW (thermal);
(5)
Geothermal: 240 GWh as heat production;
(6)
Waste treatments;
(7)
HPs.
The last two production technologies have not played a significant role in total production. For this reason, we consider the heat produced for the district heating network to only be associated with CHP plants and auxiliary boilers.

3.2.3. Thermal Plant Supply and Fuel Mix

The fuel distribution is divided into coal, oil, natural gas and biomass for condensing, and CHP plants [52]. The auxiliary boilers for district heating production are fed by 90% natural gas and 10% biomass.

3.2.4. CO2 Emission Data

One of the final outputs of the EnergyPLAN has to do with total system emissions, hence the CO2 emission intensity of each fuel is needed. In this study, the CO2 content in fuels, measured in kg/GJ, has been modeled following the default values available in the EnergyPLAN database.

3.3. Model Results for the Base Case of Italy

We carried out a market exchange analysis after obtaining the required input data. In this case, further input will be needed for the model to identify the market prices and to determine the response of the market prices to the changes of imports and exports. Input is also needed in order to determine the marginal production costs of an individual electricity production unit.
Figure 10 shows the hourly market prices [55]. The power prices in Italy are generally higher than in other EU states because of the high level of imports and the predominance of gas-fired, combined-cycle CHP plants. Italy’s dependence on gas imports remains at about 90%.
On the other hand, the maximum import/export capacity between Italy and its neighboring countries is shown in Table 3 [56]. However, we found that the imported electricity is more than the exported for Italy. With higher RES share, the imported electricity is reduced but the exported electricity is increased, and the electricity price is lowered. In EnergyPLAN modeling, EEEP refers to the Exportable Excess Electricity Production and CEEP to Critical Excess Electricity Production. The latter should not be exported because it exceeds the capacity of the transmission line. In fact, such production is not allowed, since it will cause a breakdown in the electricity supply. The model allows for the removal of CEEP, and a balance can be achieved by reducing the CHP and boiler production rates.
The main results refer to the balance between consumption and production in both the electricity sector and the heat sector, and an analysis of the different shares from different production plants. The validation of the model and trust in the results have been compared to the annual energy balance for the reference year published by IEA [33], ISTAT [34], and TERNA [53]. In particular, we can obtain the annual production rates for heat and power from different energy resources. For electricity production, we can obtain the following detailed production balance, with the shares being shown in Figure 11. It can be seen that import dependence is at a high level. In the absence of nuclear energy, combustion is the primary electricity production source, which provides more than 58% electricity, followed by the renewables, which contributes 29% electricity. As to the heat, CHP and boilers account for 98%, and the rest are geothermal energy.
(1)
Electricity consumption: 318.5 TWh [39];
(2)
Electricity production: (a) condensing power plants: 94.9 TWh; (b) CHP power plants: 88.52 TWh; (c) RES: 93 TWh;
(3)
Import: 44.4 TWh;
(4)
Export: 2.37 TWh.
From the heat production shown on the output datasheet, we can conclude the following:
(1)
District heating Demand: 9.2 TWh [44];
(2)
District heating Production: 10.97 TWh [44] (including network losses);
(3)
CHP Power Plants: 7.52 TWh;
(4)
Auxiliary Boilers: 3.21 TWh;
(5)
Geothermal: 0.24 TWh.
Other significant results from the base model provided in the EnergyPLAN are as follows: the total fuel consumption including import and export was 1986.29 TWh/year and total CO2 emissions were 402.62 Mt/year, which are quite consistent with the ENEA report for the reference year [51]. Therefore, the model was validated by the real data, and the model results can form the basis for configuring and analyzing future scenarios with higher RES shares.

4. Energy System Modeling for Finland

System modeling was also conducted for the Finnish energy market during the reference year following the same procedure with the Italian model.

4.1. Demand Data

4.1.1. Electricity Demand

The total electricity demand in Finland was 84 TWh in 2013, as reported by Statistics Finland [57]. Electricity demand is quite variable in Finland, and electricity consumption per capita is the second-highest among IEA member countries after Canada, mainly due to the dark, cold winters and economic activities [35]. Although about half of all space heating is covered by district heating, 13.23 TWh of heating energy are from individual heating, while the total amount of electricity used within the residential sector is growing due to the increasing number of HP [58]. The hourly electricity demand for Finland can be downloaded from NordPool [58], as shown in Figure 12. We found that the electricity demand peaks during the winter because of low outdoor temperatures and limited daylight hours. It is less uniform than the Italian electricity distribution.

4.1.2. Heat Demand

Because of its cold climate, Finland’s heat demand per capita is among the highest of all IEA member countries [35]. To the best of our knowledge, heating technologies are strongly related to greenhouse gas emissions; however, Finland does not have a high rate of CO2 emissions. One of the main reasons has to do with the important role of district heating, which covers almost 50% of the total heat demand, while the district heating share in Helsinki is 93%. About 2.6 million Finns live in houses heated by district heat. The heat demand of the rest of the population should be modeled as individual heating [59]. The fuel used for individual heating can be found in Figure 13 [60]. It is quite clear that biomass is the most common fuel used for individual heating, while electric heating is still popular in new detached houses because it is easy to use, cost-effective, and does not require high maintenance.
The share of solar thermal energy has not been modeled, even if solar energy has great potential in Finland, because the main contribution is only in summertime, when the heat demand is quite low. This technology could contribute more to the overall heating production when coupled with long-term heat storage systems. Finnish district heating is mainly based on CHP systems producing heat and electricity. The total produced heat has been modeled as in centralized CHP systems. In 2013, the produced heat was 36.8 TWh and the heat demand was 33.2 TWh considering the network losses [60].
An aggregation procedure similar to the one developed for the Italian model has been followed to obtain the hourly heat demand distribution for Finland, and the results are shown in Figure 14. In this case, the procedure was simpler for two main reasons. The Finnish climate is more uniform and there are not significant differences in HDD between the two climate zones. Moreover, the population is mostly concentrated in the coastal area and mainly around Helsinki. As a consequence, the heat demand can be modeled according to the HDD of Helsinki based on its hourly temperature for the reference year. The population-weighted average number of HDD was 5000 during the whole reference year [61]. Note that our calculations for the HDD for a Finnish city differ from the Italian case because the presumed indoor temperature in Finland is 17 °C. According to Figure 14, the hourly heat demand is much higher in winter than summer, and the summer time is much shorter than Italy.

4.1.3. Cooling Demand

In Finland, district cooling is still a relatively young technology that was only introduced in the 1990s. In 2013, the cooling energy used was only 1.2 TWh, and it has been estimated that the cooling demand will not experience significant growth by 2030 [62]. Therefore, we did not complete this particular input datasheet.

4.1.4. Industry and Other Fuel Consumption

The total fuel consumption in the industrial sector of Finland was 105.3 TWh in 2013, and the share of each fuel used is shown in Figure 15 [57]. Again, biomass dominated the fuel consumption in this sector with a 53% share. Finland is among the leading countries in the use of biomass for energy production, and nearly two-thirds of all industrial energy is consumed in wood and paper industry [35].

4.1.5. Transport

Figure 16 shows the fuel used for transport in Finland, although the transport system is based on diesel and gasoline. The share of biofuel is higher than that of gas, and the most commonly used biofuel is biodiesel. Nowadays, all transport fuels distributed in Finland contain bio components, and the bio-ethanol content is increasing to meet environmental targets of 20% for the renewable energy content of fuels for this sector by 2020.

4.2. Supply Data

4.2.1. Electricity Supply

The electricity demand is fulfilled partly by condensing power plants and nuclear energy and partly by intermittent renewable energies, such as wind and hydropower. This has to do with the types of resources available in Finland.

Nuclear Power

In the late 1980s, the Finnish government made the decision to include nuclear power in the national energy system, and nowadays four reactors are active in two main power plants. Nuclear power plays a large role in the plants’ power production and meets the constant need for base-load power [63]. In 2013, the installed capacity was 2752 MW, with an efficiency level of 0.4 [60]. The share of nuclear power in total electricity production will increase when the fifth reactor is ready for commercial operation. This technology, with high load factors, has a low electricity price, low levels of radioactive emissions, and will help the country achieve low levels of CO2 emissions. The distribution is considered constant because it is a base-load electricity generation technology.

Wind

In Finland, many costal sites and coastal waters of the Baltic Sea would be suitable for the generation of wind power, but at the end of 2013 only 211 wind turbine generators were working, mostly along the west coast, and the nominal capacity was 258 MW [60,64]. During the reference year, the total amount of electricity produced from wind turbines was 774 GWh. The hourly distribution used in the model is shown in Figure 17, which shows that the wind production is higher in November and December in Finland.

Hydropower

Hydropower is the most important form of renewable energy in the Nordic countries, and in Finland it is the second largest source of renewable energy after bioenergy [35]. Approximately 207 hydropower plants were operating in Finland in 2013, including micro, small, and large hydropower plants, most of which were located in the north and center of the country in the vicinity of the lakes. The total capacity recorded for the reference year was 3125 MW [60]. The total annual production was 12.67 TWh. The distribution pattern is shown in Figure 18, which is quite different from Italy’s hydropower distribution, because Finland has two peaks in terms of hydropower production, they are January and February as well as the summer time.

Solar

The yearly amount of solar energy produced in Finland amounts to about 1000 kWh per square meter, and it varies dramatically over a year. Moreover, solar energy is not present in large scales and throughout the energy market; therefore it has not been modeled in this study.

4.2.2. Combined Heat and Power Supply

CHP is one of the most important and efficient technologies in the whole Finnish energy system, and the development of district heating in particular has progressed in tandem with the development of CHP. CHP accounts for about one-quarter of the total electricity demand of the country [59]. According to Statistics Finland [60], the power generation capacity at peak load in 2013 was 5830 MW for CHP, and the capacity feeding the district heating network was 3500 MW. The total installed capacity of CHP can produce almost 80% of the total heat produced for the network.

4.2.3. Thermal Plant Supply and Fuel Mix

According to Statistics Finland, it is useful to obtain the rates of fuel consumption for the production of heat and electricity with respect to the adopted technologies [60]. The share of the fuel underlines the importance of biomass in the national energy markets, especially in relation to CHP power plants. The heat supplied by CHP plants using biogas and wood has a higher feed-in tariff for an additional bonus for this kind of renewable heat.

4.2.4. CO2 Emission Data

Similarly to the Italian model, the CO2 content in the fuels, as measured in kg/GJ, has been modeled following the default values available in the EnergyPLAN database.

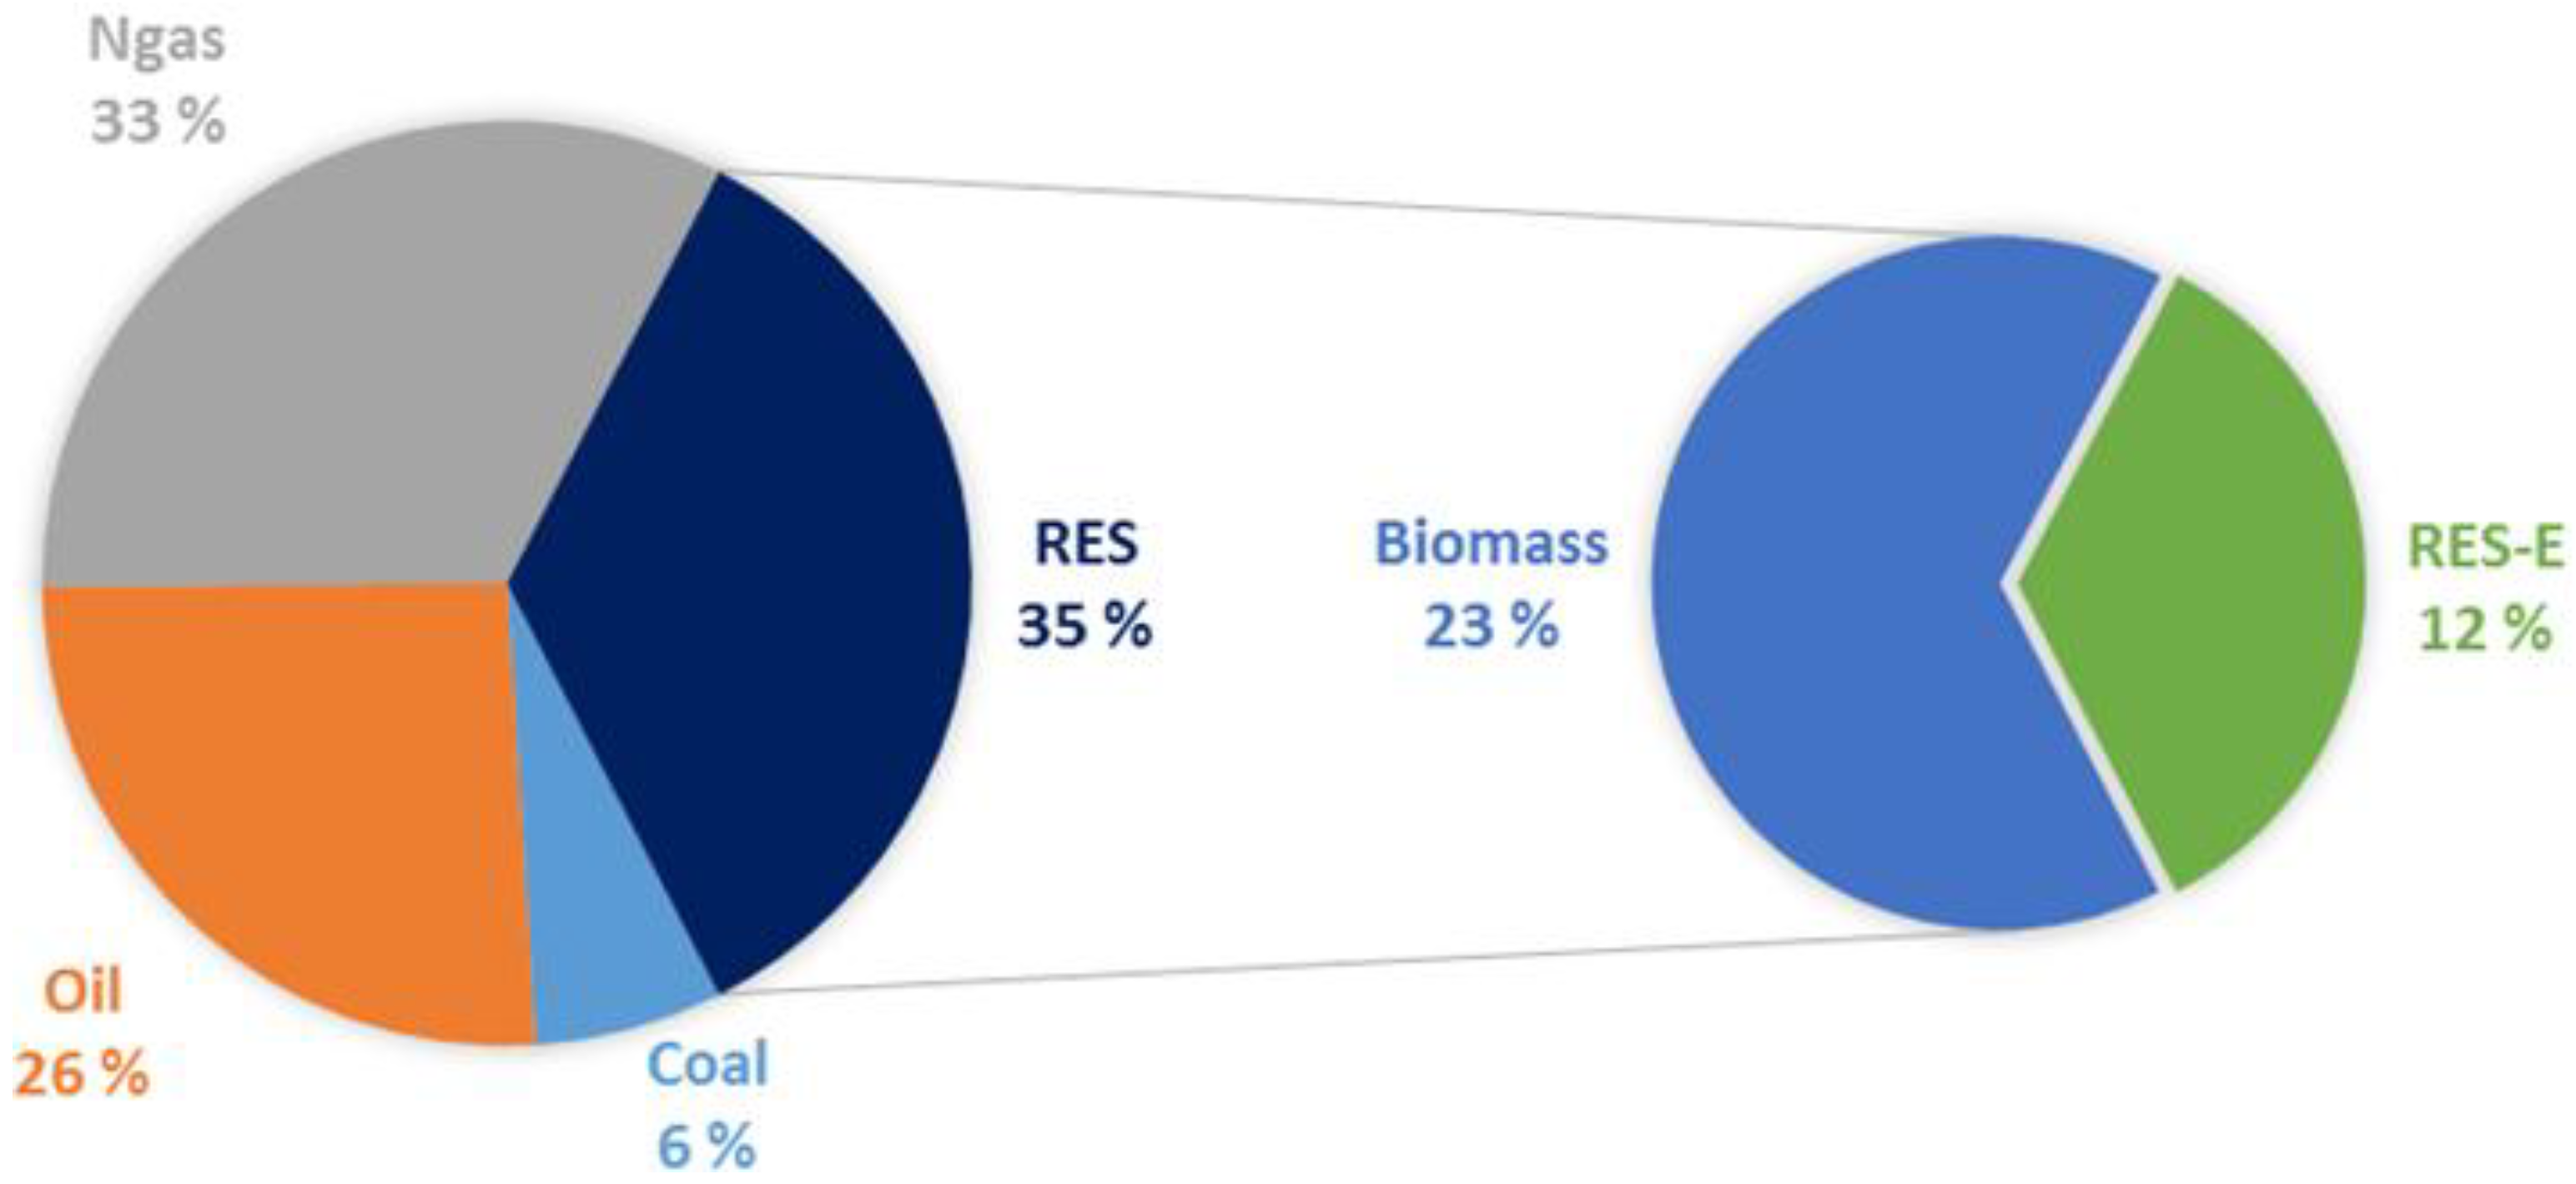
4.3. Model Results for the Base Case of Finland

In order to simulate the market economy, other input data include the market price distribution and the maximum import/export transmission capacity. Since Finland is a member of NordPool, it is convenient to extract the price distribution during the reference year from Nordpool’s website. In particular, the Elspot prices shown in Figure 19 represent the results from the day-ahead implicit auction market [60]. The average electricity price for 2013 was 41.16 €/MWh, which was the highest in the NordPool market, due to a higher share of fossil fuels and imports compared to other countries in the NordPool market.
The maximum net transfer capacity between Finland and the neighboring countries are shown in Table 4.
We obtained the energy balances for Finland in the reference year based on the model output data. Figure 20 shows the share of production from each technology for the electricity and heat sectors. We can find out that condensing power is very limited in Finland, but CHP, RES and nuclear power dominates the electricity production. At the same time, CHP also produces more than 70% district heat with higher energy efficiency. The results come from the model results but not from the actual statistics.
The following detailed electricity balance can be found in the model output datasheets:
(1)
Electricity demand: 84 TWh [57];
(2)
Electricity production: (a) CHP power plants: 23.33 TWh; (b) nuclear: 22.67 TWh; (c) RES: 13.44 TWh; (d) condensing power plants: 8.9 TWh;
(3)
Import: 17.6 TWh;
(4)
Export: 1.87 TWh.
For the heat sector, the detailed balance is as follows:
(1)
District heating Demand: 33.2 TWh [57];
(2)
District heating Production: 36.8 TWh, including: (a) CHP plants produced 26.1 TWh; (b) Auxiliary boilers supplied 10.7 TWh.
These balances have been validated by statistics from the Finnish authorities [57,60]. According to the detailed statistic results shown in Table 5, the share of condensing power, CHP, RES, import/export, and nuclear power are 10.6%, 27.7%, 16.1%, 18.7% and 27%, which are consistent with the modelled results. In 2013, CHP produced 75.7% of heat while heat only boilers produced 24.3% district heat, which are also close to the model output. Therefore, the proposed EnergyPLAN model has a good accuracy to reflect the base case and therefore the cases with higher RES share.
According to the model output, nuclear power plants help reduce the electricity produced from CHP. They also help produce more heat for district heating. Relevant results from the models for future optimizations are as follows: annual fuel consumption was 348.62 TWh/year and CO2 emissions were 48.85 Mt/year.

5. Model Optimization Results from Different Renewable Energy Sources Scenarios for Energy Transition

The scenarios were created by increasing renewable energy production, according to the current national situation and potential and future energy pathways. The sustainable transitions of the energy market point to changes in the national energy structure in the form of a higher RES share. The models of the two actual energy markets formed the starting point (base case) for this analysis. It is possible to devise new scenarios and examine improvements in the energy market as well as the share of RES in the primary energy consumption and carbon emissions in the system by using EnergyPLAN. To reach a higher share of renewables in primary energy consumption, a study on the potential of RES in both countries has to be carried out in order to better understand how this implementation can occur according to national plans.

5.1. Italian Scenarios and Model Results
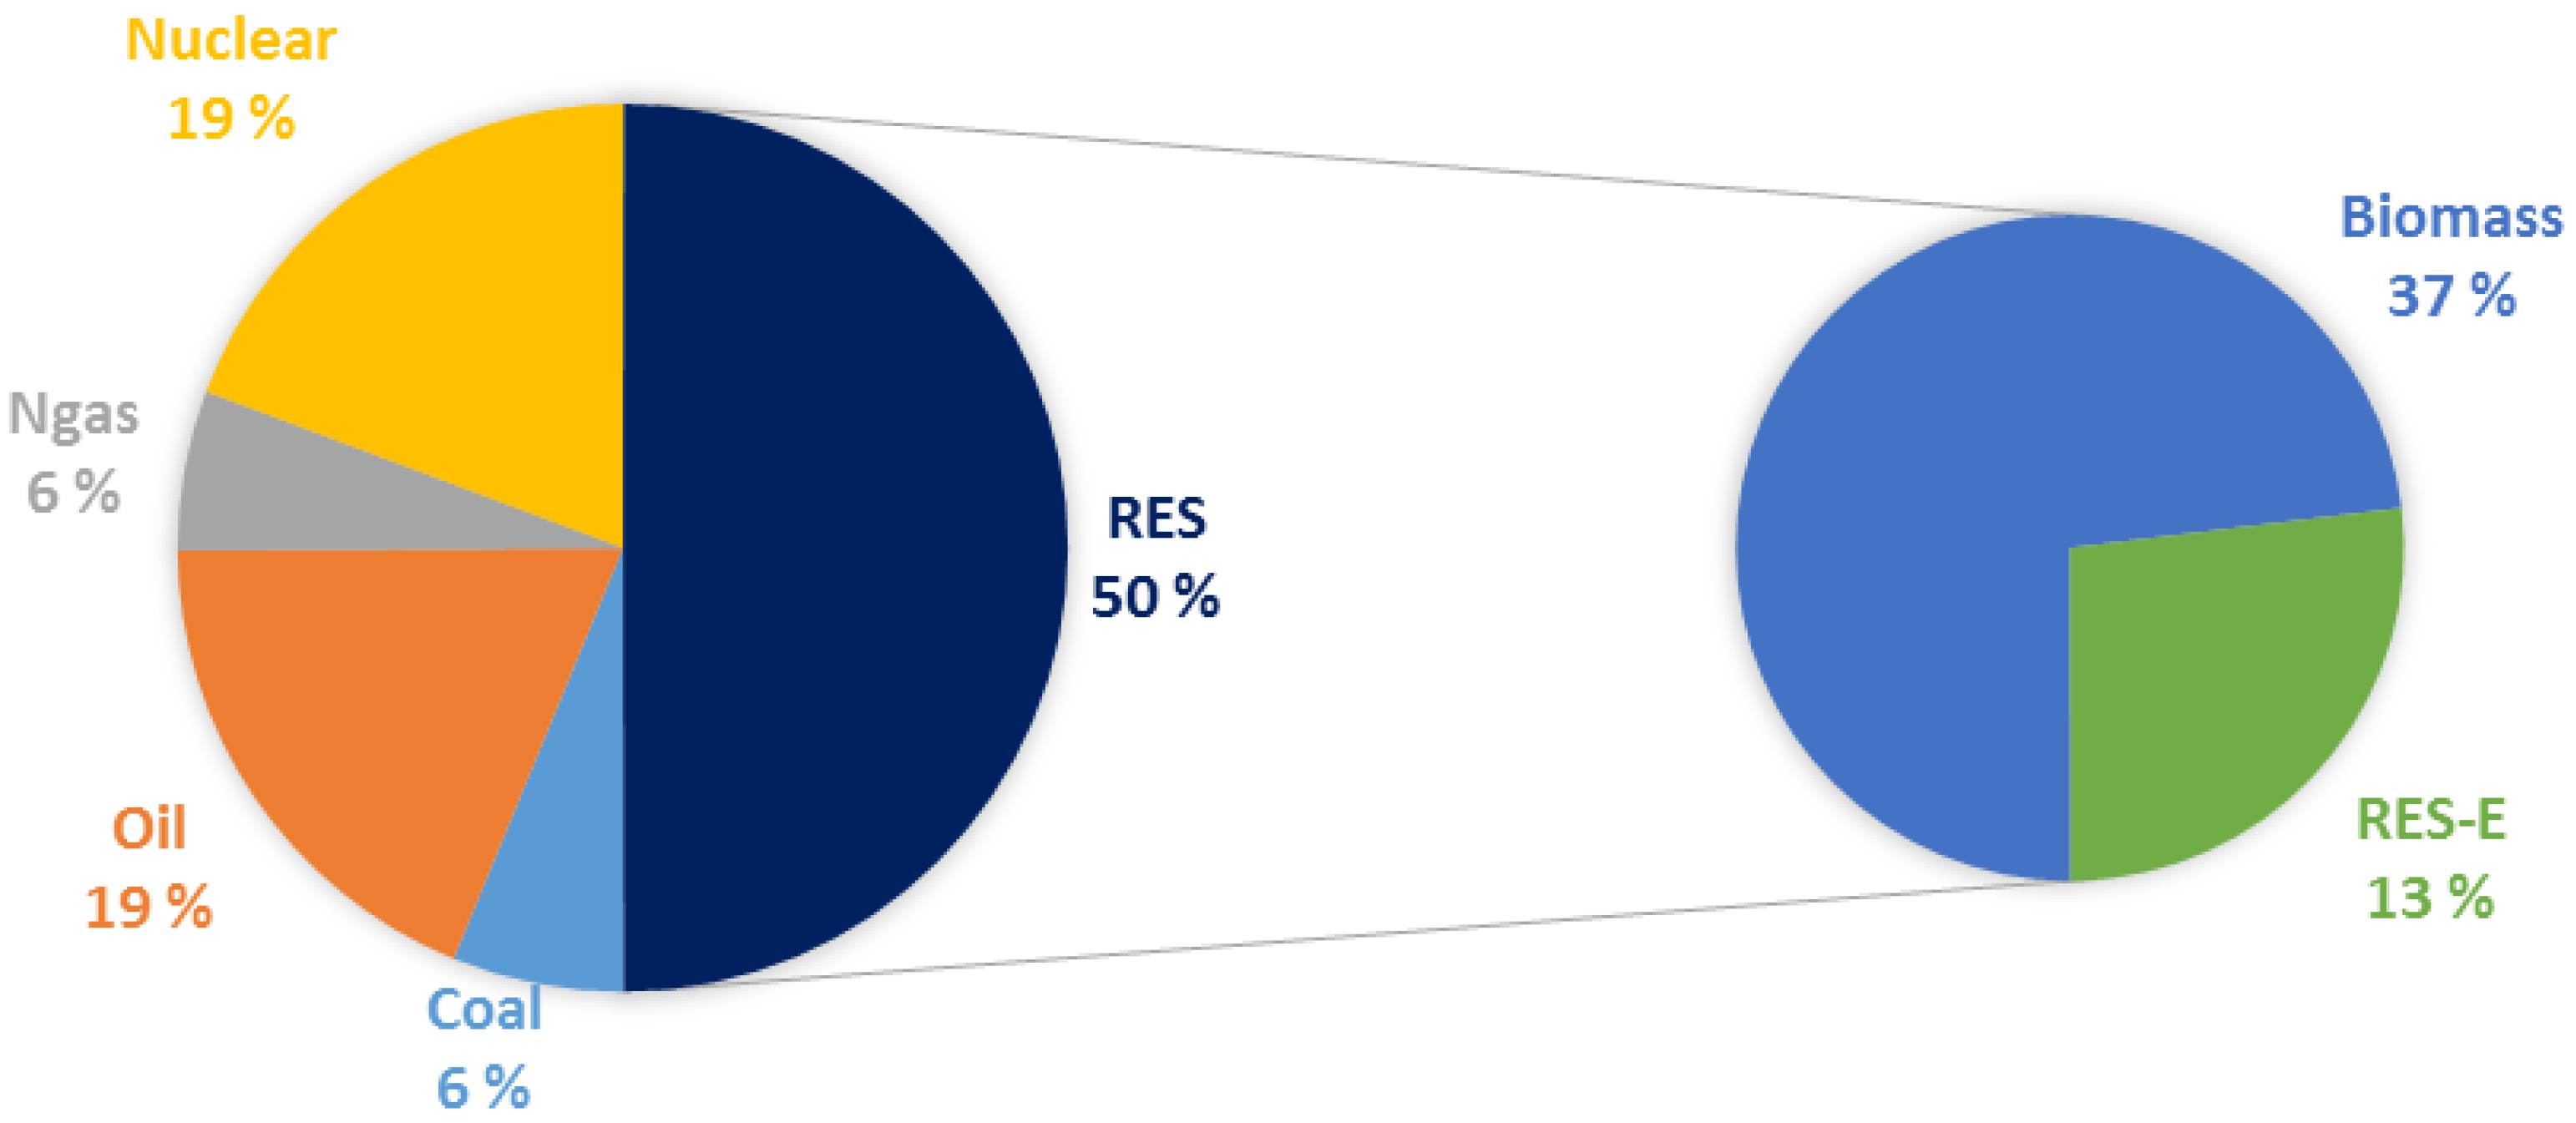
The Italian national energy plan is focused mostly on the following [65]:
(1)
Improving energy efficiency in buildings because of the large number of old houses;
(2)
Introducing energy savings in industrial processes;
(3)
Developing the district heating network in all the municipalities in climate Zones E and F;
(4)
Ensuring the highest share of RES in district heating production, approximately 37%;
(5)
Increasing the use of biomass throughout the whole system, especially biofuels.
This plan does not highlight the role that RES should play, and the Italian government has cut the incentives for PV installations. Nevertheless, RES should increase their share of total energy consumption for a more sustainable energy market, especially in a country like Italy, which has a great amount of imported energy and high energy prices. For this reason, a study was carried out by EnergoClub to evaluate the potential of renewable energies [66] in Italy and their role in future scenarios aimed at reaching a higher share in the market as well as scenarios characterized by energy independence [67]. The analyses show that the potential of various RES technologies and the possible rates of production for the electricity, thermal, and transport sectors. We conclude from the analyses that the total potential of RES can cover or even surpass the current Italian rates of actual consumption in each sector.
The Italian RES potential forms the basis for devising the new scenarios that include 35% (near future) and 60% (in the long run) of the RES share. In this case, the two shares chosen for the future scenarios were lower than the Finnish scenarios because the current RES status and RES potentials are different. We found that in the base model, Italian renewables account for 19% of total energy consumption and the chosen shares represent reasonable increases without making drastic changes to the energy systems.
To the best of our knowledge, few studies have discussed the planned capacities of RES for different sectors in the long run. Therefore, we increased the share of each RES according to its potential and the actual impact of the source on the energy systems. The main aims of the Italian energy market of the future are related to decreasing imports and the dependence on natural gas and reducing the electricity market price.
Figure 21 shows the modeled fuel consumption in the Italian scenario with a 35% RES share. In order to reach 35% RES share, the model focuses its attention on solar technologies, wind power plants, and biomass in power plants and transport, while the estimated potential of hydropower is not so high. Following this procedure, total CO2 emissions account for 300 Mt, with a decrease of 77 Mt, compared to the base model for the reference year. When the RES share is increased to 60% shown in Figure 22, the increase is mainly attributable to the use of biomass, but not RES-E. Oil and natural gas have been decreased by 6% and 16%, respectively, compared to the 35% RES scenario, which ensures a relative independence from natural gas and a dramatic reduction in the imported volume. With 60% RES, CO2 emissions are 184 Mt, which is only 49% of the 2013 level.

5.2. Finnish Scenarios and Model Results

The Finnish national plan for promoting RES still pays great attention to biomass, wind, and hydropower as a means of increasing the share of the existing technology on the actual market. The main expectations for 2020 are as follows [68]:
(1)
Wind power production will rise to 6 TWh, compared to 0.7 TWh in 2013;
(2)
Hydropower will increase to 14 TWh, compared to 12.67 TWh in 2013;
(3)
CHP production from wood chips will be equivalent to at least 28 TWh of fuel;
(4)
Renewable energy production by HP should be increased to 8 TWh;
(5)
The use of biofuels in the transport sector will be increased to 7 TWh and biogas to 0.7 TWh.
These aims can be overlooked when considering the potential of RES in Finland. According to Motiva [69], the total hydropower potential, in addition to the actual installed capacity, is estimated to be more than 600 MW, but this number could even be higher. Technical Research Centre of Finland (VTT) gave a realistic wind power scenario that amounted to 11,013 MW from wind turbines along the west coast in the near future, so that number can also increase [70]. The bioenergy potential of Finland was estimated to be 143 TWh, including 11 TWh for biofuels in the transport sector [71]. Finland can use more solar technologies, especially because the solar irradiation rate in southern Finland has an annual level roughly equal to that of central Europe. However, matching solar energy with demand is much worse in Finland compared to central Europe. A study reported that the maximum or long-term potential of solar energy in Finland is 5.5 TWh for PV panels and 4–5 TWh for solar heating solutions [72].
In the model, increasing the electricity production from RES means that conventional power production should be reduced, and thus the amount of imported energy will be reduced too. Nuclear power still plays the base role in the model, and a maximum export capacity of 2500 MW has been chosen based on the external power market. The share of RES in Finland for the reference year was already 31% according to the modelled annual energy balance. On this basis, it would be interesting to increase the share of RES to 50% or even 75% of the total energy consumption and evaluate the CO2 emissions from the whole system. The modeling of the new scenarios is based on the demand for the reference year, since the total amount of energy consumption could not vary excessively.
As can be seen from Figure 23, to reach the goal of 50% RES share, the capacity increase is mainly based on future projections for wind turbines and hydropower. In addition, the share of biomass has not reached the maximum potential, but the primary change has mainly affected the transport and heating sectors. The planned capacity for HP was also taken into account. In this case, CO2 emissions were 29 Mt, with a decrease of 20 Mt compared to the reference case. In this scenario, the share of biomass increased by 37%, while RES-E accounted for 13%; nuclear and oil still played a large role in the energy market, with both accounting for 19% of energy consumption.
Figure 24 shows that the high potential of biomass in Finland can help the country reach a level of 75% RES in total energy consumption. Moreover, in this scenario the wind and hydro capacity have also increased based on their potential, especially wind power. The level of production resulting from PV panels and solar heating systems was also modeled. In this scenario, the biomass share increased dramatically from 37% to 56%, while there was only a 6% increase in RES-E compared to the 50% RES scenario. Nuclear energy still accounted for 13% of total energy consumption, but the contributions from fossil fuels, namely oil, natural gas, and coal, were quite small. In this way, the future high share of renewable energy use can be reached and the total CO2 emissions will be only 11 Mt. This value is only 22% that of the reference case in 2013.

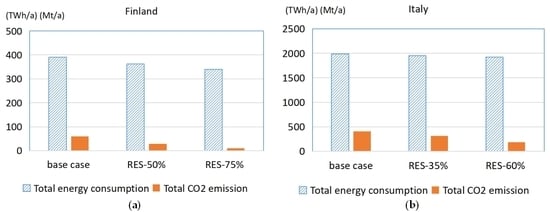
5.3. Results and Discussion

In this study, we developed the EnergyPLAN models for Italy and Finland and validated them with real statistics. The proposed EnergyPLAN model was proved to have a good accuracy to reflect the base case for the reference year of 2013. In addition, we also analyzed the national RES potential of both countries, which will be the input for the higher RES scenarios. According to the European roadmap for 2030 and 2050, the penetration of RES will increase in the European market, giving rise to a more competitive low-carbon energy supply system. In order to show how it can be possible to reach this low carbon goal, new scenarios for both countries have been modeled based on existing base models of the reference year. The results show that biomass is the backbone of RES in Finland, whereas solar, wind, and hydropower are also well developed in Italy. The future scenarios are based on the potential of each RES in both countries. For Italy, the new scenarios are characterized by a share of 35% and 60%, increasing the installed capacity mostly with respect to solar technologies, wind turbines, and geothermal power. Biomass and wind power are the sources that allow Finland to increase its RES to 50% and 75%.
The output results from developed EnergyPLAN model for both countries can be summarized and shown in Figure 25. It can be found that the total energy consumption and the CO2 emission all decrease when when RES shares increase, however the CO2 emissions reduce more clearly than that of total energy consumption. In Finland, the total energy consumption for RES-50% and RES-75% scenario reduces by 7.5% and 13.0% respectively compared to the base case. While in Italy, the reduction of the total energy consumption is only 1.7% and 3.1%, mostly because of the different RES portfolios in these two countries. The CO2 reductions for Finland are 52% and 82% corresponding to the two RES scenarios compared to the base case, while for Italy they are 22% and 54%.
The most important finding is that the RES energy transition may not dramatically reduce the total energy consumption, but it can contribute a lot to the CO2 reduction and help to reach the road map target. The goal of the European Commission for 2050 is the reduction of greenhouse gas emissions by 80%–90% from 1990 levels. At the end of 1990, the total CO2 emissions were 512.5 Mt and 70.3 Mt for Italy and Finland. According to the model outputs, we found that a RES scenario of 60% in Italy can lead to CO2 reductions of 64%; a RES scenario of 75% in Finland’s energy market will allow for 85% CO2 reductions compared to 1990 levels. This can even meet the roadmap 2050 target for Finland.

6. Possible Power Transmission and Discussion

Power transmission between areas makes it possible to minimize the overall productions costs, since power can be produced in areas with the lowest production costs and transferred to regions where the production cost is higher [73]. Although Finland and Italy are not neighboring countries, and they do not have a common transmission grid, it is interesting to study when transmission can be beneficial when considering the connected EU grids and different electricity demands as well as the market prices. Therefore, the electricity demand trends and market prices have been analyzed.
The electricity demand trends for both countries are shown in Figure 26, and the behavior of the electricity demand in the reference year can be compared. The electricity demands have quite different ranges for the two countries; the average hourly demands are 9.56 GWh and 36.32 GWh for the Finnish and the Italian markets, respectively. The trends are not compatible; in summer, the Italian electricity demand reaches a higher value than in winter because of the cooling load, as covered by electric devices, whereas the Finnish trend shows a decrease. In this respect, the two countries are complementary.
A lack of dependence between the two markets can be proved and estimated via the correlation coefficient and the coefficient of determination, starting from the drawing of scatter plots in Figure 27 and Figure 28. The correlation coefficient illustrates the linear relationships between the observed data values:
r = n x y x y n ( x 2 ) ( x ) 2 · n ( y 2 ) ( y ) 2
where n is the number of pairs of data.
It can be assumed that a correlation greater than 0.8 can generally be described as strong, whereas a correlation of less than 0.5 is weak. The correlation coefficient for the two arrays of electricity demand in Italy and Finland is 0.39, showing a weak dependency, as shown in Figure 27. The coefficient of determination is r2, and it gives the proportion of the variance of one variable, which can be predicted based on the other variable. This particular variable means the percent of the data near the best fit line. The coefficient is equal to 0.15 in this study, meaning that only 15% of the total variation in the Italian data can be explained by the linear relationship between Finland and Italy. Likewise, r2 is the measure of how well the regression line represents the data; looking at the scatter plot in Figure 27, it is clear that the data do not follow a well-determined line.
The same analysis can be carried out for the market price data. In this case, the two coefficients are even smaller. The correlation coefficient is equal to 0.27 and the coefficient of determination only 0.07 because of a great amount of value far from the main concentration area. That underlines the lack of dependence between the two market prices, as shown in Figure 28.
The average market prices are 62.97 €/MWh and 41.12 €/MWh for Italy and Finland, respectively. This difference is related to the market itself, the effect of RES, fuel costs, and the share of imports, all of which have already been analyzed though the energy market modeling of both countries.
Based on the difference in market prices and electricity demand trends, we can conclude that transmissions are possible if a transmission grid between the two countries would exist or if a proper intermediate transmission line is established via another country. A study on power transmission can be carried out by imagining that Finland and Italy are interconnected through the neighboring countries in the form of a chain. Power transmission from Finland to Italy would occur when the market price in Finland is lower than that of Italy, as shown in Figure 29.
In order to estimate the benefit from this power transmission, the analysis can be carried out for the day of highest demand in the Italian electricity market, shown in Figure 30. During the reference year, a peak electricity demand of 54.37 GWh occurred on the 26th of July between 11:00 in the morning and noontime. The Italian electricity demand is characterized by a well-defined shape, which underlines the beginning of the day shown in Figure 30a; on the other hand, the Finnish curve is extremely flat. The Finnish market price is lower than the Italian price shown in Figure 30b, so power transmission from Finland to Italy would be possible and meaningful during this day. In this case, the behaviors of market prices also differ; they both have a peak corresponding to the high demand, but the Italian market price shows a drop because of increased electricity production from RES, especially solar power during the midday hours.
In order to estimate the amount of possible power transmission, the import costs and amount of exported electricity have been collected and compared. The Italian import rate for the day of highest demand was 126.9 GWh. If this power transmission brings benefits, then the Finnish market can export electricity to fulfill part of the Italian need and increase its electricity supply to cover part of the Italian demand. Finnish electricity export for that particular day is recorded as 3.5 GWh. If this amount is considered the base amount, then about 3.3 GWh can reach the Italian grid when considering the transmission losses of 5%. We can see that the transmission amount is small in comparison to the amount of total imported electricity. But this is one example to prove the feasibility and the benefits of an integrated European electricity market, characterized by one bidding market and interconnections between countries.
As the share of RES increases, new challenges arise, especially in terms of securing the supply of power. RES in general relies on weather conditions, and sometimes energy production does not meet the demand. The use of storage in the energy market can increase flexibility and reliability. So as not to have negative electricity prices, as happened in Germany last spring, electricity storage is a solution for unforeseen electricity production from RES. Nevertheless, electricity storage technologies remain critical even though sometimes the more-expensive than additional transmission capacity and a good interconnected infrastructure could also decrease the need for them.

7. Conclusions

RES are playing an increasingly important role in the European energy market. They are the key to future policies and offer a roadmap for a more renewable, sustainable, competitive, and cost-effective energy market. This paper studies reasonable energy transition by highlighting RES penetration, especially when considering different climate conditions and different portfolios of energy supply and demand data. However it is quite difficult to obtain the detailed energy supply and demand data for some energy sectors in the country level, therefore this study firstly proposed an aggregation method to scale up the energy profiles based on the data of typical cities. In addition, few researchers had considered the energy transition using the relatively accurate profiles of supplies and demands in hourly resolution as well as RES potentials in the country level. Therefore, this paper bridges these gaps by studying the renewable and sustainable energy transition for two countries with different profiles in the supplies and demands, RES potentials as well as the different climates by using the EnergyPLAN.
We defined the base scenarios and energy transition scenarios with different RES shares for the two countries according to the RES potentials, and examined whether and how the transitions could happen, and their influences to climate change. The results show that biomass is the backbone of RES in Finland, whereas solar power, wind power, and hydropower are also well developed in Italy. The future scenarios are based on the potential of each RES. For Italy, the new scenarios are characterized by a share of 35% and 60%, increasing the installed capacity mostly with respect to solar technologies, wind turbines, and geothermal power. Biomass and wind power are the sources that allow Finland to increase its RES to 50% and 75%. The most important finding is that the RES energy transition may not dramatically reduce the total energy consumption, but it can contribute a lot to the CO2 reduction and help to reach the road map target. Therefore, we concluded that the European aim is concrete and can be achieved if the transition policies obtained in this study are adopted. The possible interlinks between the two countries were also considered in the energy system modelling in order to examine the possible influences of the energy transmission and more efficient cross-border activities on the energy transition. These are the main new contributions to the existing pool of knowledge in this respect.
The new modeled scenarios can be considered for future national plans to better understand where to invest and to estimate the decarburization level. Another possible solution can be market coupling; realizing the goal of a single European energy market will make energy production more flexible and reliable. This analysis has focused on the modeling and input/output data related to achieving higher RES shares and reducing the emissions in energy systems. The next step will include cost evaluation and analyzing how the new investments in RES can be profitable in the long-term and how RES could influence market prices. This study can reflect, to some extent, energy transitions in other EU countries. It provides quantitative results on how to reach EU targets and offers an effective pathway towards achieving a low-carbon energy supply.

Author Contributions

H.W., G.D.P. and R.L. conceived and designed the method; X.W., V.V. and I.H. contributed some materials and valuable suggestions; H.W. and G.D.P. analyzed the data and wrote the paper.

Funding

This work was supported by the China national key research and development program—China-Finland intergovernmental cooperation in science and technology innovation (Funding No. 2016YFE0114500) and Academy of Finland funding (Grant Number No. 299186). We would also like to thank the “Xinghai” talent project of Dalian University of Technology.

Conflicts of Interest

The authors declare no conflict of interest.

References

  1. Lin, B.; Omoju, O.E. Focusing on the right targets: Economic factors driving non-hydro renewable energy transition. Renew. Energy 2017, 113, 52–63. [Google Scholar] [CrossRef]
  2. European Commission. Progress towards Completing the Internal Energy Market; European Commission: Brussels, Belgium, 2014. [Google Scholar]
  3. European Commission. Making the Internal Energy Market Work; European Commission: Brussels, Belgium, 2012. [Google Scholar]
  4. Gourvitch, N. Merit Order Effect; Green Giraffe Energy Bankers: London, UK, 2013. [Google Scholar]
  5. European Commission. Launching the Public Consultation Process on a New Energy Market Design; European Commission: Brussels, Belgium, 2015. [Google Scholar]
  6. Zipp, A. The marketability of variable renewable energy in liberalized electricity markets—An empirical analysis. Renew. Energy 2018, 113, 1111–1121. [Google Scholar] [CrossRef]
  7. European Environment Agency. Share of Renewable Energy in Gross Final Energy Consumption. 2016. Available online: http://www.eea.europa.eu/data-and-maps/indicators/renewable-gross-final-energy-consumption-3/assessment#tab-news-and-articles (accessed on 8 August 2018).
  8. European Commission. A Policy Framework for Climate and Energy in the Period from 2020 to 2030; European Commission: Brussels, Belgium, 2014. [Google Scholar]
  9. European Commission. Energy Roadmap 2050; European Commission: Brussels, Belgium, 2011. [Google Scholar]
  10. European Commission. The EU Emissions Trading System (EU ETS); European Commission: Brussels, Belgium, 2013. [Google Scholar]
  11. Child, C.; Breyer, C. Transition and transformation: A review of the concept of change in the progress towards future sustainable energy systems. Energy Policy 2017, 107, 11–26. [Google Scholar] [CrossRef]
  12. Pye, S.; Sabio, N.; Strachan, N. An integrated systematic analysis of uncertainties in UK energy transition pathways. Energy Policy 2015, 87, 673–684. [Google Scholar] [CrossRef]
  13. Bonneuil, N.; Boucekkine, R. Optimal transition to renewable energy with threshold of irreversible pollution. Eur. J. Oper. Res. 2016, 248, 257–262. [Google Scholar] [CrossRef] [Green Version]
  14. Ruppert-Winkel, C.; Hussain, W.; Hauber, J. Understanding the regional process of energy transition in Marin County, California: Applying a Three-Phase-Model based on case studies from Germany. Energy Res. Soc. Sci. 2016, 14, 33–45. [Google Scholar] [CrossRef]
  15. Lange, M.; O’Hagan, M.; Devoy, R.R.N.; Martin, T.L.; Cummins, V. Governance barriers to sustainable energy transitions—Assessing Ireland’s capacity towards marine energy futures. Energy Policy 2018, 113, 623–632. [Google Scholar] [CrossRef]
  16. Lind, A.; Espegren, K. The use of energy system models for analyzing the transition to low-carbon cities—The case of Oslo. Energy Strat. Rev. 2017, 15, 44–56. [Google Scholar] [CrossRef]
  17. Guidolin, M.; Guseo, R. The German energy transition: Modeling competition and substitution between nuclear power and Renewable Energy Technologies. Renew. Sustain. Energy Rev. 2016, 60, 1498–1504. [Google Scholar] [CrossRef]
  18. Anil, K.; Dmitrii, B.; Onur, P.; Upeksha, C.; Arman, A.; Christian, B. An energy transition pathway for Turkey to achieve 100% renewable energy powered electricity, desalination and non-energetic industrial gas demand sectors by 2050. Sol. Energy 2017, 158, 218–235. [Google Scholar]
  19. Mediavilla, M.; Castro, C.D.; Capellán, I.; Miguel, L.J.; Arto, I.; Frechoso, F. The transition towards renewable energies: Physical limits and temporal conditions. Energy Policy 2013, 52, 297–311. [Google Scholar] [CrossRef]
  20. Zakeri, B.; Virasjoki, V.; Syri, S.; Connolly, D.; Mathiesen, B.V.; Welsch, M. Impact of Germany’s energy transition on the Nordic power market—A market-based multi-region energy system model. Energy 2016, 115, 1640–1662. [Google Scholar] [CrossRef]
  21. Vidadili, N.; Suleymanov, E.; Bulut, C.; Mahmudlu, C. Transition to renewable energy and sustainable energy development in Azerbaijan. Renew. Sustain. Energy Rev. 2017, 80, 1153–1161. [Google Scholar] [CrossRef]
  22. Chai, Q.; Zhang, X. Technologies and policies for the transition to a sustainable energy system in China. Energy 2010, 35, 3995–4002. [Google Scholar] [CrossRef]
  23. Sun, X.Y.; Zhang, B.A.; Tang, X.; Benjamin, C.M.; Mikael, H. Sustainable Energy Transitions in China: Renewable Options and Impacts on the Electricity System. Energies 2016, 9, 980. [Google Scholar] [CrossRef]
  24. Sun, X.Y.; Zhang, B.A.; Zou, L.P.; Wang, R.Z. The Role of Renewable Energy in China’s Sustainable Energy Transition. In Proceedings of the 2nd International Conference on Sustainable Development (ICSD 2016), Xi’an, China, 2–4 December 2016; pp. 327–332. [Google Scholar]
  25. Amrutha, A.A.; Balachandra, P.; Mathirajan, M. Model-based approach for planning renewable energy transition in a resource-constrained electricity system—A case study from India. Int. J. Energy Res. 2018, 42, 1023–1039. [Google Scholar] [CrossRef]
  26. Thapar, S.; Sharma, S.; Verma, A. Local community as shareholders in clean energy projects: Innovative strategy for accelerating renewable energy deployment in India. Renew. Energy 2017, 101, 873–885. [Google Scholar] [CrossRef]
  27. Bundit, F.; Atit, T.; Takashi, O.; Cecilia, T. Transition pathways for a sustainable low-carbon energy system in Thailand. J. Renew. Sustain. Energy 2017, 9, 021405. [Google Scholar]
  28. Mah, N.Y.; Wu, Y.Y.; Ip, C.M.; Hills, P.R. The role of the state in sustainable energy transitions: A case study of large smart grid demonstration projects in Japan. Energy Policy 2013, 63, 726–737. [Google Scholar] [CrossRef]
  29. Mohammad, A.S.; Khan, S.A. Transition towards sustainable energy production—A review of the progress for solar energy in Saudi Arabia. Energy Explor. Exploit. 2018, 36, 3–27. [Google Scholar]
  30. Dóci, G.; Vasileiadou, E.; Petersen, A.C. Exploring the transition potential of renewable energy communities. Futures 2015, 66, 85–95. [Google Scholar] [CrossRef]
  31. Steg, L.; Perlaviciute, G.; van der Werff, E. Understanding the human dimensions of a sustainable energy transition. Front. Psychol. 2015, 6, 805. [Google Scholar] [CrossRef] [PubMed]
  32. Dumas, M.; Rising, J.; Urpelainen, J. Political competition and renewable energy transitions over long time horizons: A dynamic approach. Ecol. Econ. 2016, 124, 175–184. [Google Scholar] [CrossRef]
  33. International Energy Agency (IEA). Energy Policies of IEA Countries—Italy 2009 Review; OECD/IEA2009; IEA: Paris, France, 2010. [Google Scholar]
  34. ISTAT—Istituto Nazionale di Statistiche. Popolazione Residente al 1° Gennaio. 2017. Available online: http://dati.istat.it/Index.aspx?DataSetCode=DCIS_POPRES1 (accessed on 29 May 2018). (In Italian).
  35. International Energy Agency (IEA). Energy Policies of IEA Countries—Finland 2013 Review; OECD/IEA 2013; IEA: Paris, France, 2013. [Google Scholar]
  36. Lund, H. EnergyPLAN—Advanced Energy Systems Analysis Computer Model. 2015. Available online: www.EnergyPLAN.eu (accessed on 29 May 2018).
  37. TERNA—Rete Elettrica Nazionale. Dati Statistici Sull’Energia Elettrica in Italia; TERNA Group: Roma, Italy, 2013. (In Italian) [Google Scholar]
  38. ENTSO-E—European Network of Transmission System Operators for Electricity. 2017. Available online: https://www.entsoe.eu/db-query/country-packages/production-consumption exchange-package (accessed on 29 May 2018).
  39. ISTAT—Istituto Nazionale di Statistiche. I Consumi Energetici Delle Famigli; Istat Ufficio Stampa: Roma, Italy, 2013. (In Italian) [Google Scholar]
  40. ENEA—Agenzia Nazionale per le Nuove Tecnologie, L’energia e lo Sviluppo Economico Sostenibile. 2010. Available online: http://www.enea.it/it/pubblicazioni/rapporto-energia-e-ambiente-1/rapporto-energia-eambiente-2009-2010/i-dati-2009-2010/statistiche-nazionali (accessed on 29 May 2018). (In Italian).
  41. GSE—Gestore Servizi Energetici. Energia da Fonti Rinnovabili—Anno 2013; GSE–Unita Studi e Statistiche: Roma, Italy, 2015. (In Italian) [Google Scholar]
  42. Braccio, G.; Mario, F.D.; Marano, D.; Sabatelli, V. Solare Termico a Bassa e Media Temperatura; ENEA—Agenzia Nazionale per le Nuove Tecnologie, L’energia e lo Sviluppo Economico Sostenibile: Roma, Italy, 2011. (In Italian) [Google Scholar]
  43. Caleffi. Gli Impianti a Pannelli Solari; Idraulica Caleffi: Novara, Italy, 2005. (In Italian) [Google Scholar]
  44. AIRU—Associazione Italiana Teleriscaldamento Urbano. Il Teleriscaldamento Urbano—Annuario 2015; AIRU: Milano, Italy, 2017. (In Italian) [Google Scholar]
  45. Giordano, R.; Allione, C.; Clos, A.; Montacchini, E.; Tedesco, S. The integrated design of building services by an equipped and eco-efficient module (MOTE2). Int. J. Arch. Technol. Sustain. 2016, 2, 13–23. [Google Scholar] [CrossRef]
  46. Frederiksen, S.; Werner, S. District Heating and Cooling; Studentlitteratur: Lund, Sweden, 2013. [Google Scholar]
  47. EuroMeteo. Zone Climatiche Italiane. 2017. Available online: http://www.eurometeo.com/italian/read/doc_zone-climatiche (accessed on 11 October 2017). (In Italian).
  48. Wunderground. 2017. Available online: https://www.wunderground.com/ (accessed on 6 March 2018).
  49. TERNA—Rete Elettrica Nazionale. Individuazione Zone Della Rete Rilevante; TERNA: Roma, Italy, 2008. (In Italian) [Google Scholar]
  50. Pardo, N.; Vatopoulos, K.; Krook-Riekkola, A.; Moya, J.A.; Perez, A. Heating and Cooling Demand and Market Perspective; European Union: Petten, The Netherlands, 2012. [Google Scholar]
  51. ENEA—Agenzia Nazionale per le Nuove Tecnologie, L’energia e lo Sviluppo Economico Sostenibile. Rapporto Annuale Efficienza Energetica; ENEA: Roma, Italy, 2015. (In Italian) [Google Scholar]
  52. TERNA—Rete Elettrica Nazionale. Ex Post Data on the Actual Generation; TERNA: Roma, Italy, 2016. [Google Scholar]
  53. TERNA—Rete Elettrica Nazionale. Impianti di Generazione; TERNA: Roma, Italy, 2013. (In Italian) [Google Scholar]
  54. TERNA—Rete Elettrica Nazionale. Produzione; TERNA: Roma, Italy, 2013. (In Italian) [Google Scholar]
  55. GME—Gestore Mercati Energetici. Dati Storici. 2017. Available online: http://www.mercatoelettrico.org/it/Download/DatiStorici.aspx (accessed on 6 March 2018). (In Italian).
  56. GME—Gestore Mercati Energetici. Vademecum della Borsa Elettrica; GME: Roma, Italy, 2009. [Google Scholar]
  57. Statistics Finland. Use of Fossil Fuels Grew in Electricity and Heat Production in 2013. 2014. Available online: http://www.stat.fi/til/salatuo/2013/salatuo_2013_2014-10-16_tie_001_en.html (accessed on 6 March 2018).
  58. NordPool. Historical Market Data. 2017. Available online: http://www.nordpoolspot.com/historical-market-data/ (accessed on 6 March 2018).
  59. Finnish Energy. District Heating. 2017. Available online: http://energia.fi/en/home-and-heating/district-heating (accessed on 6 March 2018).
  60. Statistics Finland. Statistics Finland Web Databases Energy; Statistics Finland: Helsinki, Finland, 2017. [Google Scholar]
  61. Finnish Meteorological Institute. Heating Degree Days. 2017. Available online: https://en.ilmatieteenlaitos.fi/heating-degree-days (accessed on 14 December 2018).
  62. VTT Technical Research Centre of Finland. High-Efficiency CHP, District Heating and District Cooling in Finland 2010–2015; VTT—Tecnical Research Centre of Finland: Helsinki, Finland, 2015. [Google Scholar]
  63. Ministry of Employment and the Economy. Nuclear Energy in Finland; Ministry of Employment and the Economy: Helsinki, Finland, 2011. [Google Scholar]
  64. Motiva. Electricity Supply and Demand. 2017. Available online: https://www.motiva.fi/en/solutions/energy_use_in_finland/electricity_supply_and_demand (accessed on 14 December 2018).
  65. Italian Ministry for Economic Development. Italian National Renewable Energy Action Plan; Italian Ministry for Economic Development: Roma, Italy, 2010.
  66. Hoesen, J.V.; Letendre, S. Evaluating potential renewable energy resources in Poultney, Vermont: A GIS-based approach to supporting rural community energy planning. Renew. Energy 2010, 35, 2114–2122. [Google Scholar] [CrossRef]
  67. Energoclub. Potenziale Nazionale Delle Fonti Energetiche Rinnovabili. 2017. Available online: http://www.energoclub.org/page/potenziale-nazionale-fer (accessed on 17 December 2018). (In Italian).
  68. Ministry of Employment and the Economy Energy Department. Finland’s National Action Plan for Promoting Energy from Renewable Sources; Ministry of Employment and the Economy Energy Department: Helsinki, Finland, 2010. [Google Scholar]
  69. Motiva. Hydropower. 2017. Available online: http://www.motiva.fi/en/areas_of_operation/renewable_energy/hydropower (accessed on 6 March 2018).
  70. VTT. Wind Energy Statistics in Finland. 2017. Available online: https://www.vttresearch.com/services/low-carbon-energy/wind-energy/wind-energy-statistics-in-finland (accessed on 14 December 2018).
  71. Zakeri, B.; Syri, S.; Rinne, S. Higher renewable energy integration into the existing energy system of Finland—Is there any maximum limit? Energy 2015, 92, 244–259. [Google Scholar] [CrossRef]
  72. Faninger-Lund, H. Road-Map for Solar Energy Technology and Markets in Finland; Solpros: Helsinki, Finland, 2002. [Google Scholar]
  73. Abdollahi, E.; Wang, H.; Lahdelma, R. An optimization method for multi-area combined heat and power production with power transmission network. Appl. Energy 2016, 168, 248–256. [Google Scholar] [CrossRef]
Figure 1. Hourly electricity demand of Italy in 2013.
Energies 11 03523 g001
Figure 2. Fuel consumption for individual heating in Italy.
Energies 11 03523 g002
Figure 3. Hourly heat demand distribution in Italy.
Energies 11 03523 g003
Figure 4. Fuel consumption for (a) industry and (b) various energy uses in Italy.
Energies 11 03523 g004
Figure 5. Fuel consumption for transport in Italy.
Energies 11 03523 g005
Figure 6. (a) Hourly photovoltaic production trend and (b) specific photovoltaic hourly distribution in Italy.
Energies 11 03523 g006
Figure 7. (a) Hourly wind production trend and (b) specific hourly distribution of wind power in Italy.
Energies 11 03523 g007
Figure 8. Hourly distribution of (a) dammed and (b) river hydropower production in Italy.
Energies 11 03523 g008
Figure 9. RES share in the electricity sector in Italy.
Energies 11 03523 g009
Figure 10. Market electricity price for Italy during the year 2013.
Energies 11 03523 g010
Figure 11. Balance of the Italian (a) electricity and (b) heating market in 2013.
Energies 11 03523 g011
Figure 12. Hourly electricity demand for Finland in 2013.
Energies 11 03523 g012
Figure 13. Fuel used for individual heating in Finland.
Energies 11 03523 g013
Figure 14. Hourly heat demand distribution in Finland.
Energies 11 03523 g014
Figure 15. Industrial fuel consumption in Finland.
Energies 11 03523 g015
Figure 16. Fuel consumption for transport in Finland.
Energies 11 03523 g016
Figure 17. Hourly wind production in Finland.
Energies 11 03523 g017
Figure 18. Hourly distribution of hydropower production in Finland.
Energies 11 03523 g018
Figure 19. Electricity price distribution in Finland during 2013.
Energies 11 03523 g019
Figure 20. Balance of the Finnish (a) electricity and (b) heating market in 2013.
Energies 11 03523 g020
Figure 21. Fuel consumption in the Italian scenario with 35% RES.
Energies 11 03523 g021
Figure 22. Fuel consumption in the Italian scenario with 60% RES.
Energies 11 03523 g022
Figure 23. Fuel consumption in the Finnish scenario with 50% RES.
Energies 11 03523 g023
Figure 24. Fuel consumption in the Finnish scenario with 75% RES.
Energies 11 03523 g024
Figure 25. Modeled total energy consumption and CO2 emission for (a) Finland and (b) Italy.
Energies 11 03523 g025
Figure 26. Electricity demand trend for Finland and Italy in 2013.
Energies 11 03523 g026
Figure 27. Scatter plot of the electricity demand in Finland and Italy.
Energies 11 03523 g027
Figure 28. Scatter plot of the market prices in Finland and Italy.
Energies 11 03523 g028
Figure 29. Electricity market price trend for Finland and Italy in 2013.
Energies 11 03523 g029
Figure 30. (a) Electricity demand trends and (b) market prices recorded on the 26 July 2013 for Italy and Finland.
Energies 11 03523 g030
Table 1. Classification of the climate zones.
ZoneHDDTypical City
A<600/
B601–900Messina
C901–1400Napoli
D1401–2100Rome
E2101–3000Milan
F>3001/
Table 2. Annual heat demands of the typical cities.
ZoneCityHDDHeat Demand (TWh/Year)
BMessina70715.34
CNaples103412.64
DRome14156.8
EMilan24021.0
Table 3. Maximum import/export capacity between Italy and the neighboring countries.
CountryNeighboring CountriesMaximum Import/Export (MW)
ItalySwitzerland3850
France2650
Greece500
Slovenia430
Austria220
Table 4. Maximum import/export capacity between Finland and the neighboring countries.
CountryNeighboring CountriesMaximum Import/Export (MW)
FinlandSweden (Northern)1500/1100
Sweden (Central)1200/1200
Estonia1016/1000
Russia1100/-
Table 5. Electricity and heat production by production mode in 2013 by Statistic Finland [57].
ItemElectricity (TWh)Share of Electricity Production (%)District Heat (TWh)Share of Heat Production (%)
Separate production of electricityHydro power12.716.1 (RES)--
Wind power0.8--
Nuclear power22.727.0 --
Condensing power8.910.6 --
Combined heat and power production23.327.7 26.175.7
Separate heat production--8.424.3
Total production68.381.3 34.5100
Net imports of electricity15.718.7 --
Total84100.0 34.5100

