Article

An Experimental Study of Combustion of a Methane Hydrate Layer Using Thermal Imaging and Particle Tracking Velocimetry Methods

1
National Research Tomsk Polytechnic University, Tomsk 634050, Russia
2
Institute of Thermophysics Siberian Branch, Russian Academy of Sciences, 1 Acad. Lavrentiev Ave., Novosibirsk 630090, Russia
3
Nikolaev Institute of Inorganic Chemistry, Siberian Branch, Russian Academy of Sciences, 3 Acad. Lavrentiev Ave., Novosibirsk 630090, Russia
*
Author to whom correspondence should be addressed.
Energies 2018, 11(12), 3518; https://doi.org/10.3390/en11123518
Submission received: 9 November 2018 / Revised: 10 December 2018 / Accepted: 13 December 2018 / Published: 17 December 2018
(This article belongs to the Special Issue Sustainability of Fossil Fuels)

Abstract

:
In this paper, the combustion of methane hydrate over a powder layer is experimentally studied using thermal imaging and Particle Tracking Velocimetry (PTV) methods. The experiments are carried out at different velocities of the external laminar air-flow from zero to 0.6 m/s. Usually, simulation of methane hydrate combustion is carried out without taking into account free convection. A standard laminar boundary layer is often considered for simplification, and the temperature measurements are carried out only on the axis of the powder tank. Measurements of the powder temperature field have shown that there is a highly uneven temperature field on the layer surface, and inside the layer the transverse temperature profiles are nonlinear. The maximum temperature always corresponds to the powder near the side-walls, which is more than 10 °C higher than the average volumetric temperature in the layer. Thermal imager measurements have shown the inhomogeneous nature of combustion over the powder surface and the highly variable velocity of methane above the surface layer. The novelty of the research follows from the measurement of the velocity field using the PTV method and the measurement of methane velocity, which show that the nature of velocity at combustion is determined by the gas buoyancy rather than by the forced convection. The maximum gas velocity in the combustion region exceeds 3 m/s, and the excess of the oxidizer over the fuel leads to more than tenfold violation of the stoichiometric ratio. Despite that, the velocity profile in the combustion region is formed mainly due to free convection, it is also necessary to take into account the external flow of the forced gas U0. Even at low velocities U0, the velocity direction lines significantly deviate under the forced air-flow.

1. Introduction

1.1. The Key Parameters Controlling the Dissociation of Gas Hydrates

Huge deposits of natural gas in the form of methane hydrates are found in the marine sediments [1,2]. Attention to alternative clean energy sources is increasing every year. Today, scientific interest is focused on the methods of extraction of alternative raw materials, technologies for their storage, transportation, as well as methods of efficient combustion of natural fuel [1,2,3]. The complexity of the study of methane hydrates combustion is associated with the presence of three interrelated processes: The dissociation of solid particles of methane hydrate; gas filtration through a multicomponent medium (methane–water–water vapor); and diffusion combustion of methane in the mixing layer (methane–air–water vapor), which is usually implemented over the powder layer. Therefore, it is necessary to consider the features of these processes.
The gas hydrate dissociation rate is determined by the following driving forces: Deviation of temperature and pressure from the equilibrium states, size of particles, and structural characteristics of ice crust [4,5]. Dissociation at positive temperatures has a thin film of water formed on the surface of solid particles. The dissociation rate is quasi-constant for most of the dissociation time. The case of negative temperatures is significantly more difficult to describe due to the emergence of the phenomenon of self-preservation [6]. In the temperature range of 230–268 K, the dissociation rate of methane hydrate decreases by several orders of magnitude and strongly depends on temperature. This annealing temperature region was called the self-preservation region. The lowest dissociation rate of methane hydrate is achieved at the temperature of 265–267 K [6]. A sharp decrease in the dissociation rate is bound with the appearance of a strong fine-grained ice shell without pores on the surface of the granules. Thus, in addition to the expression describing the system deviation from the equilibrium, it is necessary to take into account the structural properties of the ice crust. At atmospheric air pressure, the equilibrium temperature of methane hydrate is approximately equal to 188 K. The mechanism of self-preservation was studied in References [7,8,9,10,11,12,13,14,15,16,17,18,19]. The influence of structural parameters of the ice crust on the dissociation process was studied by scanning electron microscopy (cryo-FE-SEM) [6,15,16,17]. The effect of temperature and pressure on self-preservation was considered in Reference [14]. When the methane hydrate temperature changes, the texture changes, which are clearly visible by scanning electron microscopy, occur on the surface of the ice crust [16,17]. The behavior of mixed methane hydrates at an abnormally low dissociation rate was considered in Reference [19]. Kinetics of methane hydrate dissociation depends on the external heat flux, curvature of granules, and pore characteristics [20,21]. Collective effects of crystallohydrate growth on the free surface of the liquid were studied using thermal imaging technology [22].
When modeling filtration, it is necessary to take into account diffusion and heat transfer for both a porous methane hydrate particle and a porous medium (solid particle powder–methane–water–water vapor) [20,23].

1.2. Combustion of Gas Hydrates

Methods of organization of combustion may vary. Thus, natural hydrate of sedimentary rocks is burned in large reactors. In the tank there is sand with methane hydrate, over which a layer of water is formed during combustion. In this case, the combustion above the layer surface is uneven and unstable, and separate flame tips are formed [24]. Combustion of synthetic hydrate without impurities (sand and clay) is more stable. In this case, the flame height for pure methane hydrate is higher than for natural sedimentary rocks. However, even in this case, periodic flame tips appear on the surface, and their location may change [24]. Combustion of methane hydrate and double hydrate (methane-alcohol) at free gas convection above the surface of the powder layer is also considered in References [25,26,27]. Combustion is shown to lead to a multiple increase in the dissociation rate. In addition, in the presence of combustion, the methane velocity above the layer surface is 10–20 times higher than in the case without combustion [25].
The above combustion option is implemented without the organization of forced air-low. To organize a more stable combustion, a forced flow of oxidizer (air) is used. The methane flow moves perpendicular to the powder surface. Methane is formed by the methane hydrate dissociation. Above the layer surface, there is a laminar air-flow [28,29,30,31]. The complexity of the research is that it is difficult to determine the value of methane velocity, as it depends on the temperature of the powder. The temperature in the experiments can vary from zero to -80 °C in the transverse direction of the layer. In this range, there are several characteristic temperature zones [10,11,12,13,14]: From −80 to −45–50 °C there is a multiple increase in the dissociation rate with temperature growth; from −40 to −5 °C there is self-preservation when the dissociation rate falls by several orders of magnitude and the rate varies greatly with temperature; at about 0 °C and above, there is a very high dissociation rate and a high density of methane flow over the powder. Thus, it is obvious that it is extremely difficult to analyze the methane combustion in the entire specified range of powder temperature and that there may be conflicting results. For the development of calculation models, there is a need in conditions when the temperature of the powder during combustion is quasi-constant over time, which is difficult to organize in practice.
Often the analysis is carried out based on the powder temperature near the upper surface of the methane hydrate layer Ts. It has been experimentally established that depending on temperature Ts there may be both the low speed of flame spreading and the high speed.
The effect of external air velocity on the speed of flame spreading is considered in Reference [29]. The velocity of the external forced air-flow U0 varied in the range 0.1–1.5 m/s. The initial temperature of the powder surface before combustion (in the middle of the tank) was the same for all experiments and was equal to −80 °C. It has been established that the tenfold growth of speed led only to the 20–30% growth of Us, and the high speed of flame spreading mode was absent. Possible causes of such flame behavior will be discussed further in the analysis of experimental data. In another experimental work [31], the ignition was carried out at a certain temperature Ts, which varied for different experiments in the range from −80 °C to −10 °C. The external air velocity was constant U0 = 0.4 m/s. With an increase in the initial temperature Ts, a change in combustion modes was observed: (1) The low speed flame spreading (Ts < −50 °С); (2) the high speed of flame spreading (Ts = −40–50 °С); (3) the low speed of flame spreading (Ts > −50 °С). Surprisingly, the increase in methane velocity VCH4 by only 20–40% (from 0.5 mm/s to 0.6–0.7 mm/s) led to about 100 times increase in the speed of flame spreading Us (from 10–15 mm/s to 1000 mm/s). The authors of the article in Reference [31] attribute such a strong increase in speed to the fact that in the first case the stoichiometric line was absent (lack of fuel for the reaction), and in the second case (the high speed of flame spreading), the stoichiometric line was present and was located above the dark region (the area with no combustion). However, more experimental and theoretical studies are needed to justify such strong Us growth.
Let us consider another method of mixing fuel (methane) and oxidizer (air) [32]. In this paper, the motion of methane and air is organized in opposite directions in a narrow slit, which allows for a good mixing of the oxidant and fuel and provides an approximate stoichiometric ratio. The air velocity and the slit height were selected to perform the stoichiometric ratio. The methane velocity was estimated using the gravimetric method (the fall of the mass of methane hydrate powder over time was recorded using weights). This method proved to be successful, and the maximum flame temperature was about 1700 K. In this case, the calculation has shown that the temperature of the combustion is possible at the mass fraction of water of 0.6. The injection of pure methane (without water vapor) led to a combustion temperature value of about 1950 K. Thus, high concentration of water leads to an underestimation of fuel combustion temperature by 200–250 K.
An experimental study of combustion of a single sphere of methane hydrate was performed in Reference [33]. The rate of change in the sphere diameter decreases with time and depends on the sphere temperature. Theoretical calculation of combustion of a separate sphere taking into account dissociation, formation of a film of water, steam bubbles, and water vapor was considered in Reference [34]. The simulation was performed for a sphere of small diameter of 0.1 mm and for positive temperatures. The curve of change of a square of sphere radius over time had quasi-linear character for the most time of dissociation. Thus, this calculation differs significantly from the experimental conditions [33]. The maximum combustion temperature in the flame in Reference [34] corresponds to approximately 1700–1750 K, which closely corresponds to the data [32]. The mass fraction of vapor near the sphere surface is 0.65–0.7 and decreases rapidly at a distance from the surface, which also closely corresponds to the calculation in Reference [32] (0.65). It is obvious that for a narrow slit [32] and for a large number of methane hydrate particles, water saturation occurs and water concentration in the flame is the same as on the surface of the powder layer (0.65).
The influence of the blowing parameter on the combustion efficiency in the methane-air mixing layer is considered in Reference [35]. Since the considered air flow rates are low and there is a noticeable excess or lack of oxidant, the combustion stability in the diffusion layer will depend on the Richardson number Ri = Gr/Re2 (Gr is Grashof number, and Re is Reynolds number) [29]. The process of mixing the fuel and oxidizer will depend on both buoyancy and forced convection. The modes of non-premixed combustion were considered in Reference [36] depending on the Da numbers. When burning methane hydrate, depending on the temperature of the powder, the thickness of the dynamic layer and the mixing layer, the blowing parameter, and the rate of chemical reaction can vary significantly. In addition, low air velocities and high temperature gradient in the mixing layer lead to the formation of a vortex flow. In this case, knowledge of the mean and local flow parameters is needed to accurately model the transfer processes. This information can be obtained using modern optical non-contact methods of Shadow Photography (SP) [37], Planar Laser Induced Fluorescence (PLIF) [38], Particle Tracking Velocimetry (PTV) [39,40], and Particle Image Velocimetry (PIV) [38]. These optical methods allow for a deeper clarification of the influence of free convection on the evaporation rate and heat transfer and are already are widely used in the study of droplets, films, sprays, micro-channel, heterogenic flows, two-phase (vapor-liquid) flows and emulsions, boundary layers, and crystallization processes in multicomponent solutions.
From the above, it follows that, to increase the efficiency of combustion of methane hydrate, the following problems must be surmounted: (1) Maintaining the powder temperature quasi-constant for the entire volume and during the entire combustion time; (2) the temperature of the powder should provide a high rate of dissociation of the methane hydrate, i.e., to exclude the phenomenon of self-preservation and at the same time to ensure the maximum deviation of temperature and pressure from the equilibrium curve (the driving forces of dissociation); (3) it is necessary to ensure the kinetic combustion condition, as the excess of oxidant and fuel lead to low reaction rates during combustion. To do this, it is necessary to accurately calculate the diffusion mixing layer and to select the optimal conditions for mixing the fuel and oxidizer; and (4) the concentration of steam that enters the combustion region should be reduced.
Analysis of the existing literature has shown that for correct modeling and further development of methane hydrate combustion technologies, additional experimental data on the instantaneous characteristics of the velocity field in the mixing layer are needed. The existing data for the case of pure methane injection through a porous wall are not suitable for the considered problem (methane hydrate combustion). In addition, there are no experimental data on the rate of dissociation during combustion in the organization of forced air-flow.
The aim of this work is to determine the dependences for the dissociation rate when the velocity of the external air flow changes in a wide range and to visualize the velocity field during combustion using the thermal imaging method and the optical contactless Particle Tracking Velocimetry (PTV) method. The obtained experimental data will help to improve and test the existing computational methods.

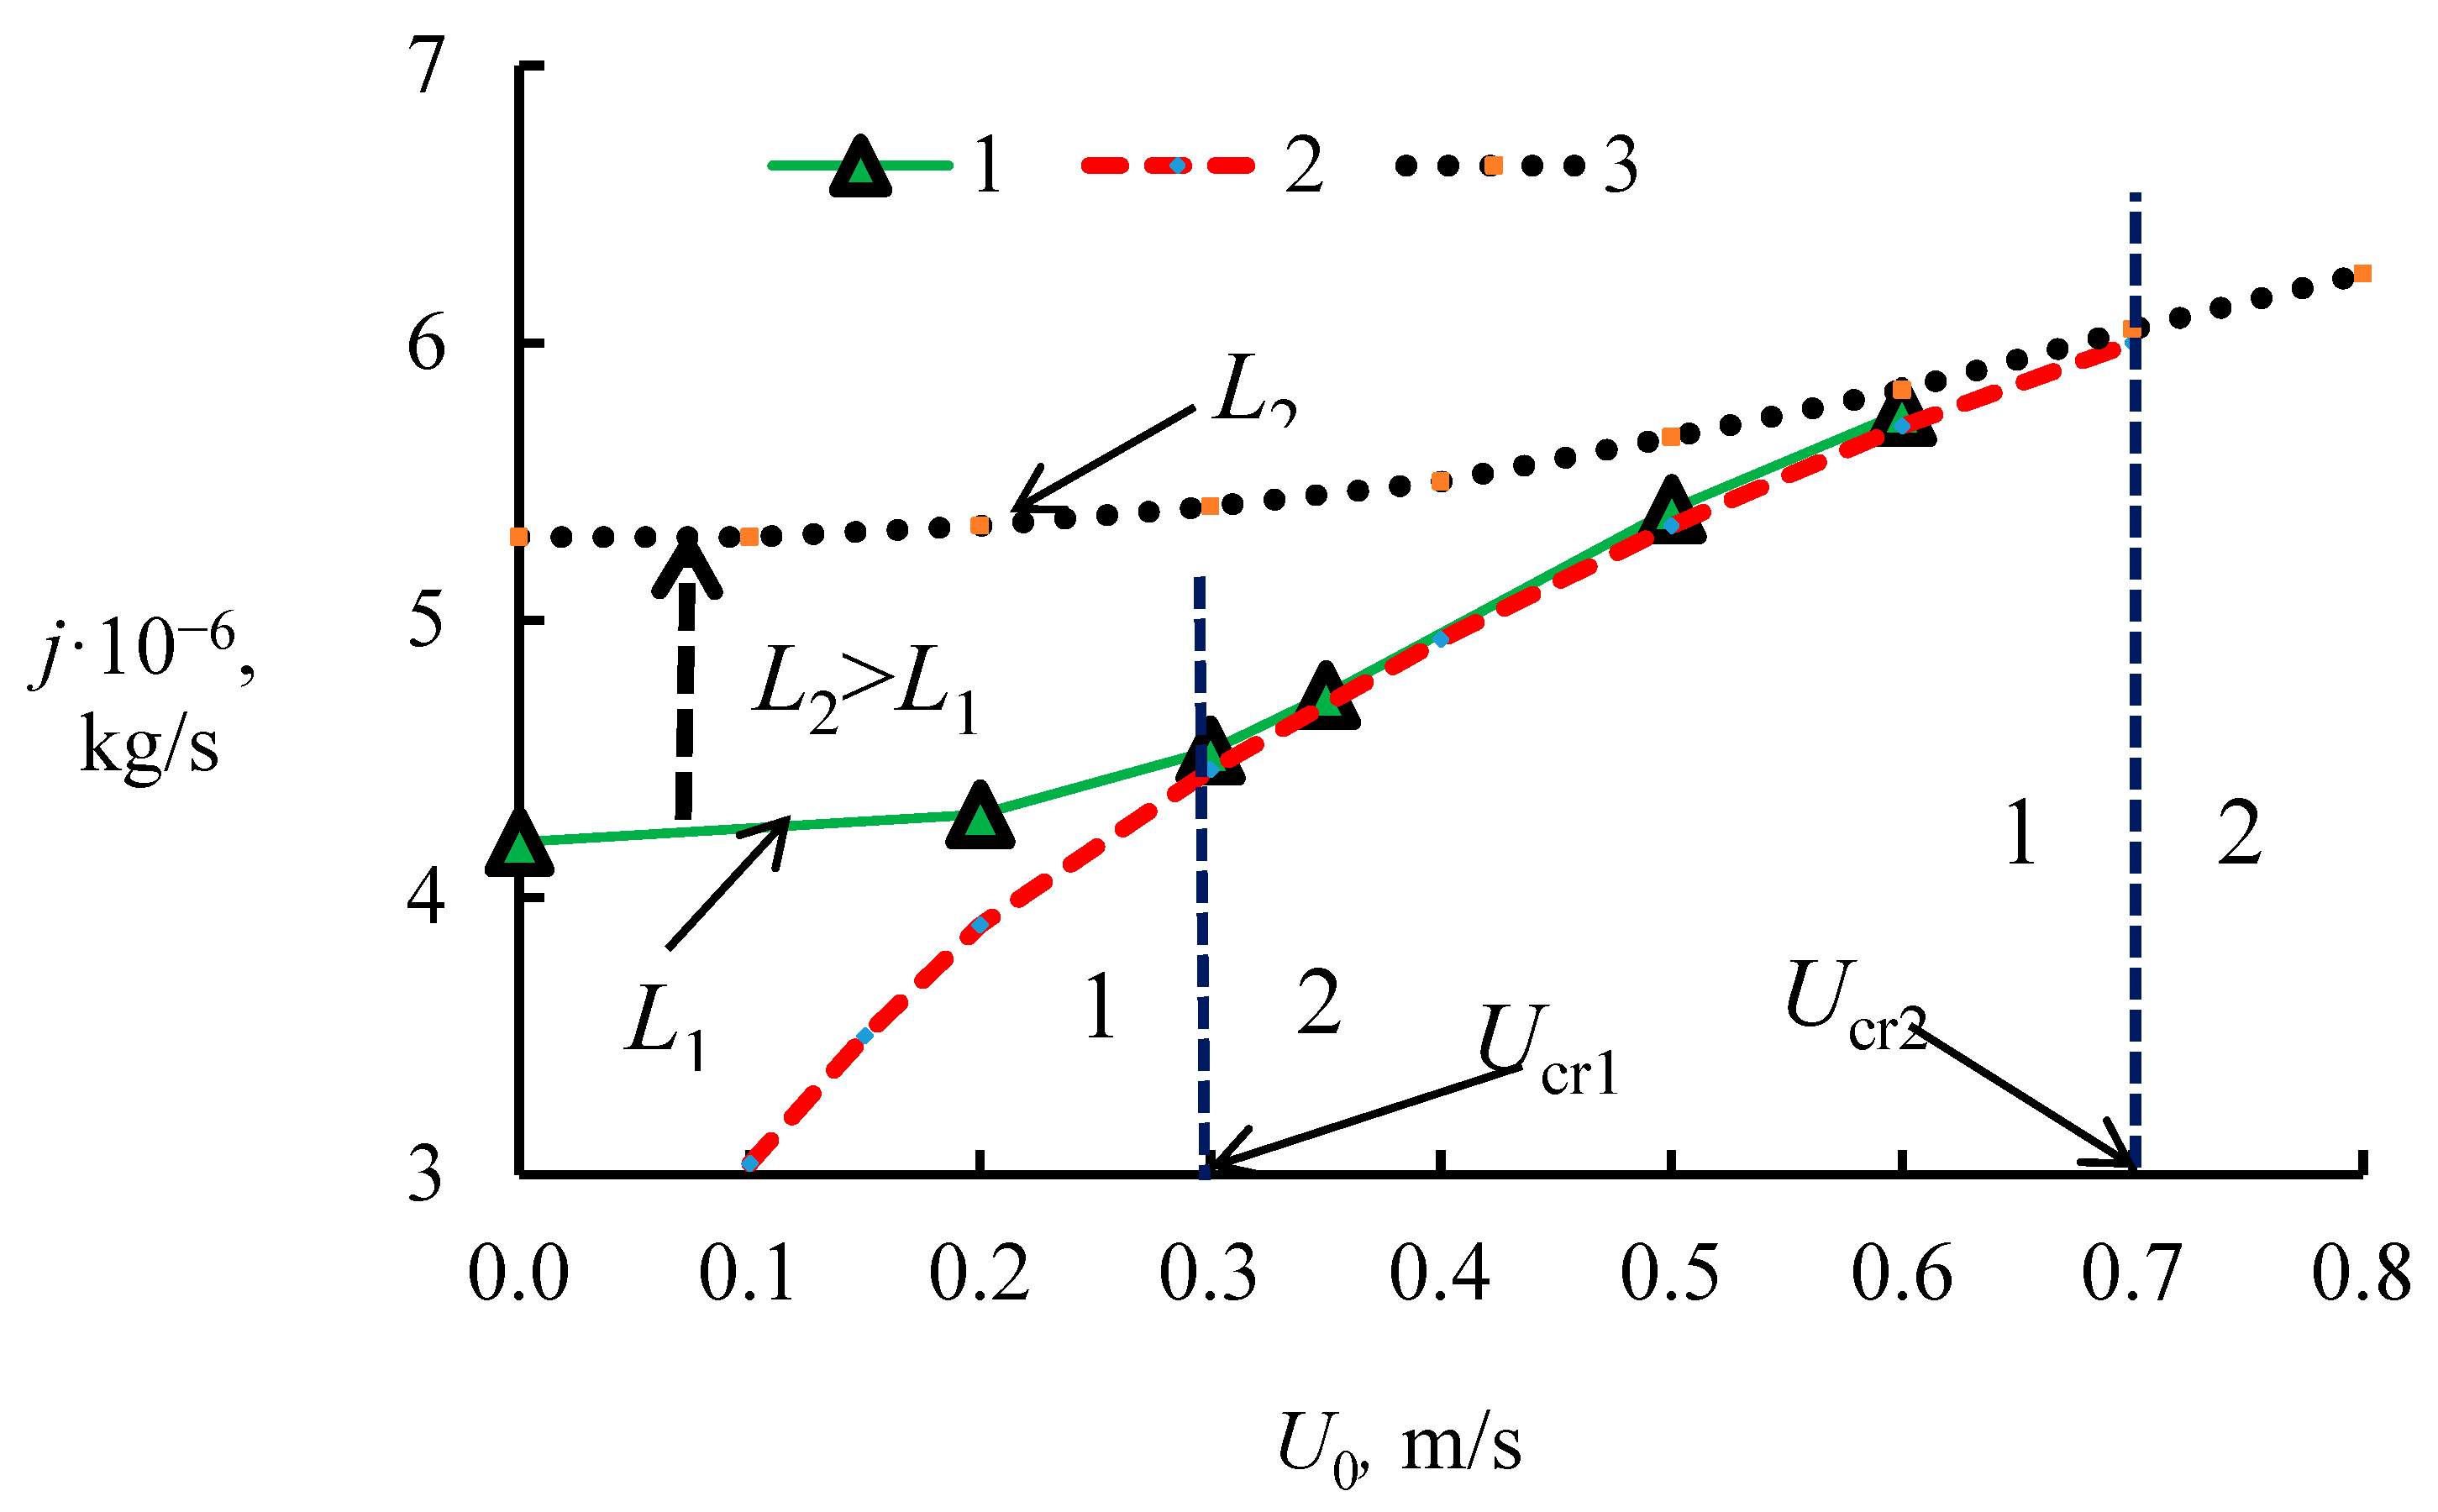
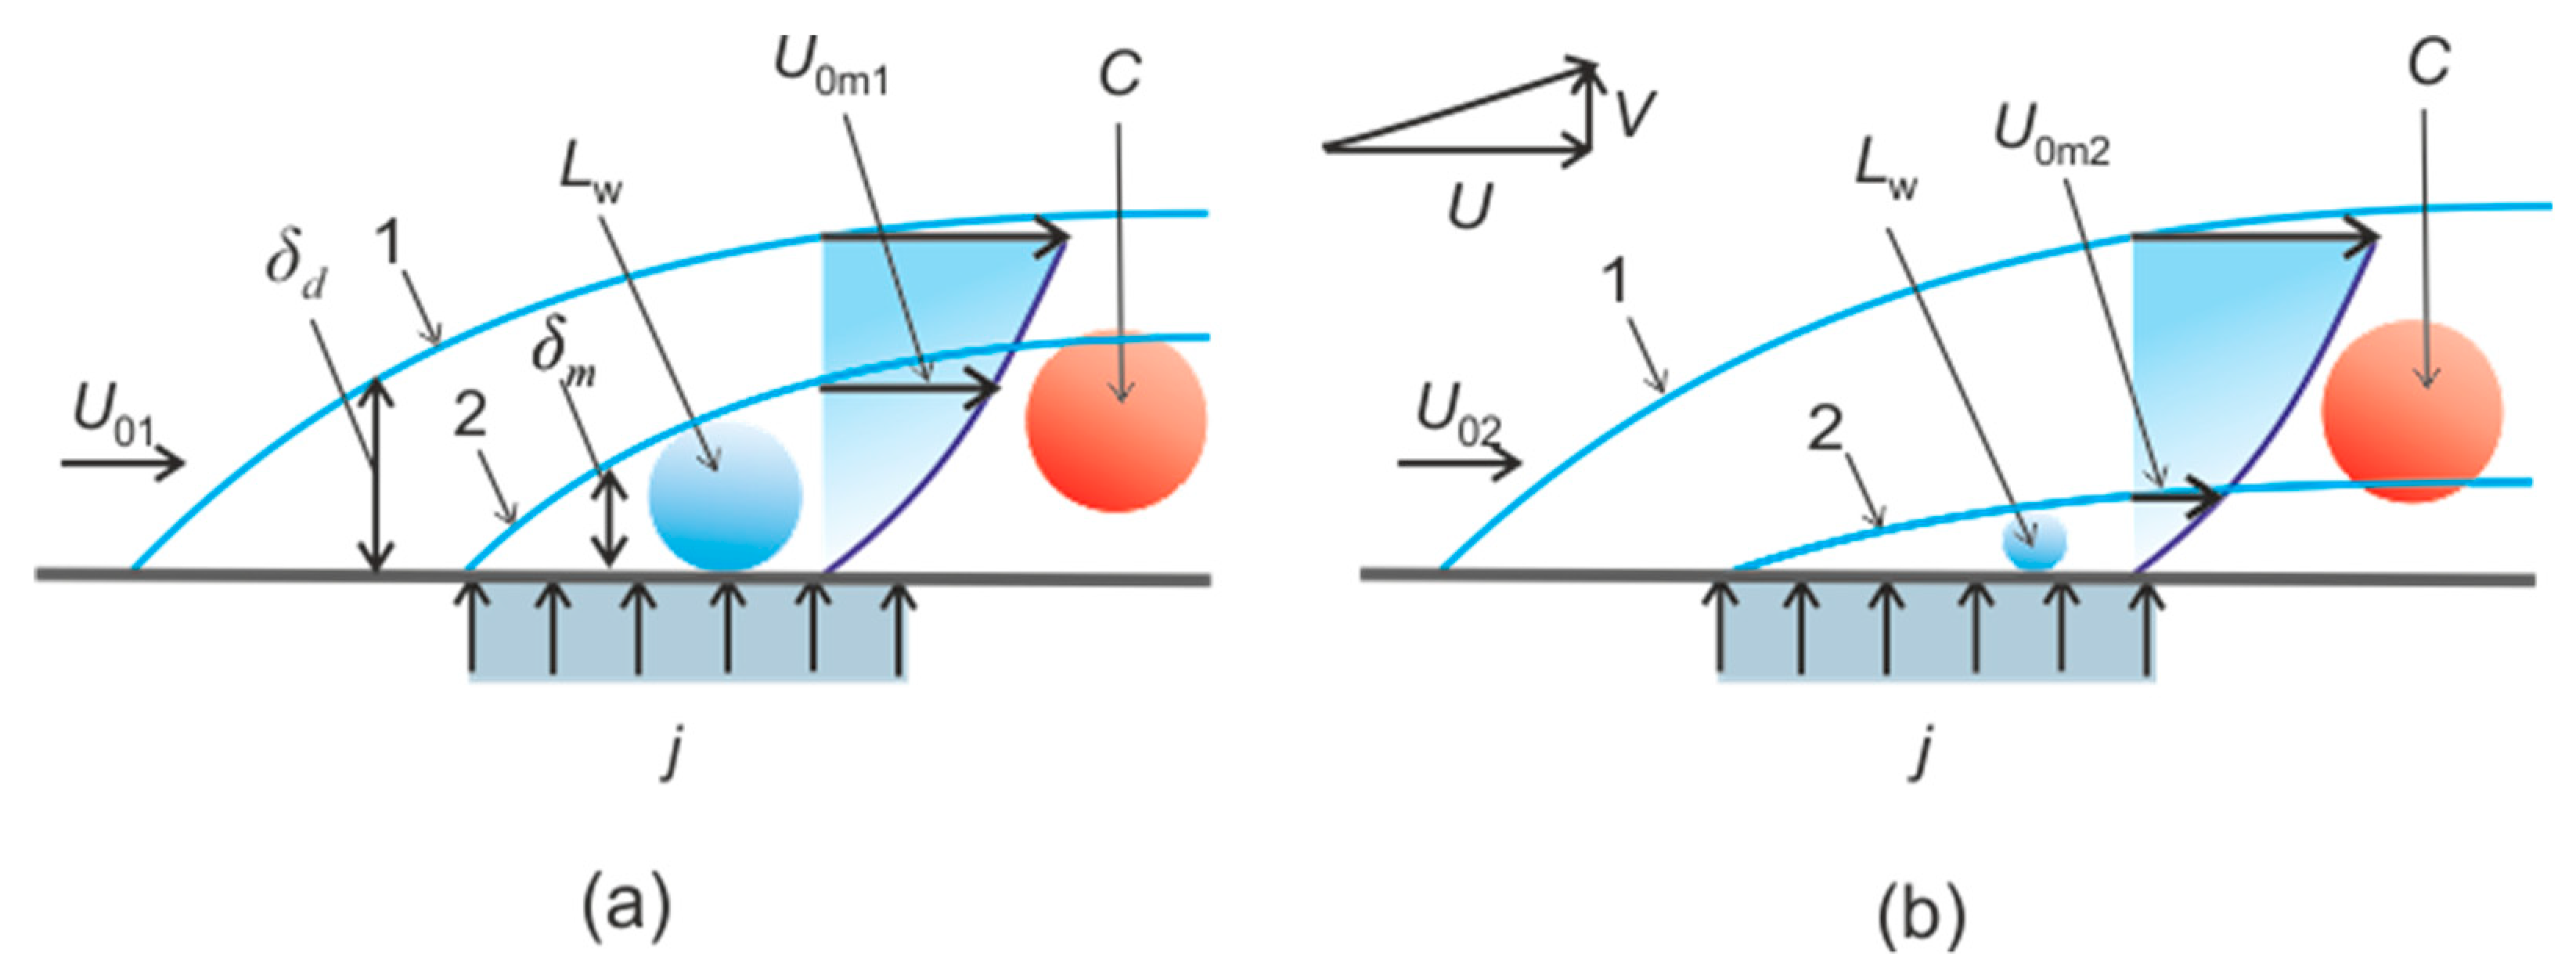
2. The Connection of Dissociation Rate and Heat Transfer

It is well known that the internal kinetics of the process plays an important role only at initial stages of crystal growth/decomposition. In real processes, taking into account the observed crystallization time (relatively long times), the point is not the formation and development of the crystallization nucleus with the size rcr, but the growth of crystals (crystallohydrates) of rather large size r >> rcr. In this case, the rate of growth or dissociation will be determined by heat transfer and diffusion, since the characteristic kinetic time will be several orders of magnitude less. It has been previously shown that only for extremely low pore density (or very small pore radii) it is necessary to take into account the diffusion of methane through the pores and the value of the kinetic constant [20]. These conditions correspond to abnormally low dissociation rates when the values of the dissociation rate j fall by three to four orders of magnitude [6]. In the present work, there are no such low rates, despite the fact that the powder temperature passes through the annealing temperature window from −50 °C to −3 °C. This contradiction is associated with a strong transverse and longitudinal temperature gradient. Experimental data on temperature profiles will be presented further. As a result of uneven temperature, in different places of the powder there will be areas of both high and very low values of j. The total flow j will have a relatively high value.
As mentioned above, the main factor regulating the dissociation dynamics is heat transfer. Thus, it is important to investigate the effect of heat flux q on the dissociation rate. Earlier it has been shown that at free convection the growth of heat flux leads to an increase in j. Combustion led to about 55–65 times increase in q (compared to the dissociation without combustion). The dissociation rate increased only eight–nine times [21,25]. Based on experimental data [21,25], as well as the data of this article, it is possible to associate the heat flux q (W/m2) with the dissociation rate j (kg/s) in expression (1).
j = a1(q)n1, where a1 = 0.012·10−6, n1 = 0.7
This expression relates the processes of diffusion and heat transfer both for the solid phase (methane hydrate granules) and for the gas mixture (air–methane–water vapor).
It is rather difficult to analytically connect the methane transfer with heat transfer, since they are described by different equations. However, it is possible to use a triple analogy and similarity between the transfer of heat, momentum, and diffusion [41,42,43,44]. In fact, this similarity is not performed even when there is gas injection through the wall [42,44]. In our case, blowing is associated with dissociation, which depends on the heat flux and temperature, i.e., the velocity of the injected air cannot be constant. In addition, the presence of free convection will also lead to a significant dissimilarity of dimensionless temperature and concentration profiles in the mixing layer. Therefore, we can use a triple analogy for qualitative evaluation, since the qualitative behavior of j and q is similar in many ways. For example, with an increase in q, j grows as well. For such a comparison, the stationarity condition must also be satisfied, i.e., the change of dC/dt and dT/dt over time must be much smaller than that for the convective terms VρCpdT/dy, UρCpdT/dx and VρdС/dy, UρdС/dx (where C and T are the methane concentration and temperature in the near-wall boundary layer; x, y are the longitudinal and transverse coordinates; and U, V are the longitudinal and transverse velocities. In addition, the three-dimensionality should also be insignificant, i.e., a quasi-plane approximation is considered. Even when burning, the total period of methane hydrate dissociation is large enough and has an order of 50–100 s. Therefore, the process of dissociation can be approximately considered as quasi-stationary.
It is important to note that in this problem there is a transfer of methane both in the powder layer and in the gas mixture above the powder surface. Thus, we have three characteristic processes of diffusion and three characteristic diffusion relaxation times td: (1) Diffusion through the solid particle (methane transport through the pores in the outer crust of ice) (td1); (2) diffusion through the porous space within the powder layer (td2); and (3) diffusion of methane in the mixing layer, developing over the powder surface (td3). Under the condition ΔC1T1 = const (where ΔC1 and ΔT1 are dimensionless values; the dimensionalization can be done based on initial differences), j ~ q ~ (Re)0.5 ~ (U0)0.5. In accordance with expression (1), a fourfold increase in the heat flux leads to approximately a double increase in the dissociation rate, i.e., to a two-fold increase in the average density of the methane flux. A noticeable lag in the growth of j is probably due to the fact that the growth of q leads to an increase in the temperature gradient in the boundary layer ΔT1. At that, the growth of ΔC1 for the same period of time is significantly slower. It can be reasonably assumed that td1 >> td2 >> td3. Thus, the main diffusion resistance is associated with the transfer of methane through the pores. As mentioned above, in the powder volume there are local areas of partial “self-preservation”, which lead to the formation of closed pores and the appearance of a high-strength ice shell. As a result, the total methane flow falls significantly and is determined by the flow of methane through a region without self-preservation (the area of the powder where the temperature T < −50 °C and T > −3 °C). Thus, the nature of dependence (1) is determined by the pore density in the granules. Then, the combustion kinetics and temperature (Tc) also depend on the methane concentration and on the pore density distribution (ρp) by the size of rp (rp—pore radius) for all granules, i.e., Tc = f(P(ρp)), where P is the pore size distribution function). Taking into account expression (1) and taking the dependence q ~ (U0)0.5, we obtain expression (2) (n2 = n1·0.5 = 0.7·0.5 = 0.35).
j = a2(U0)n2, where a2 = 6.8·10−6, n2 = 0.35

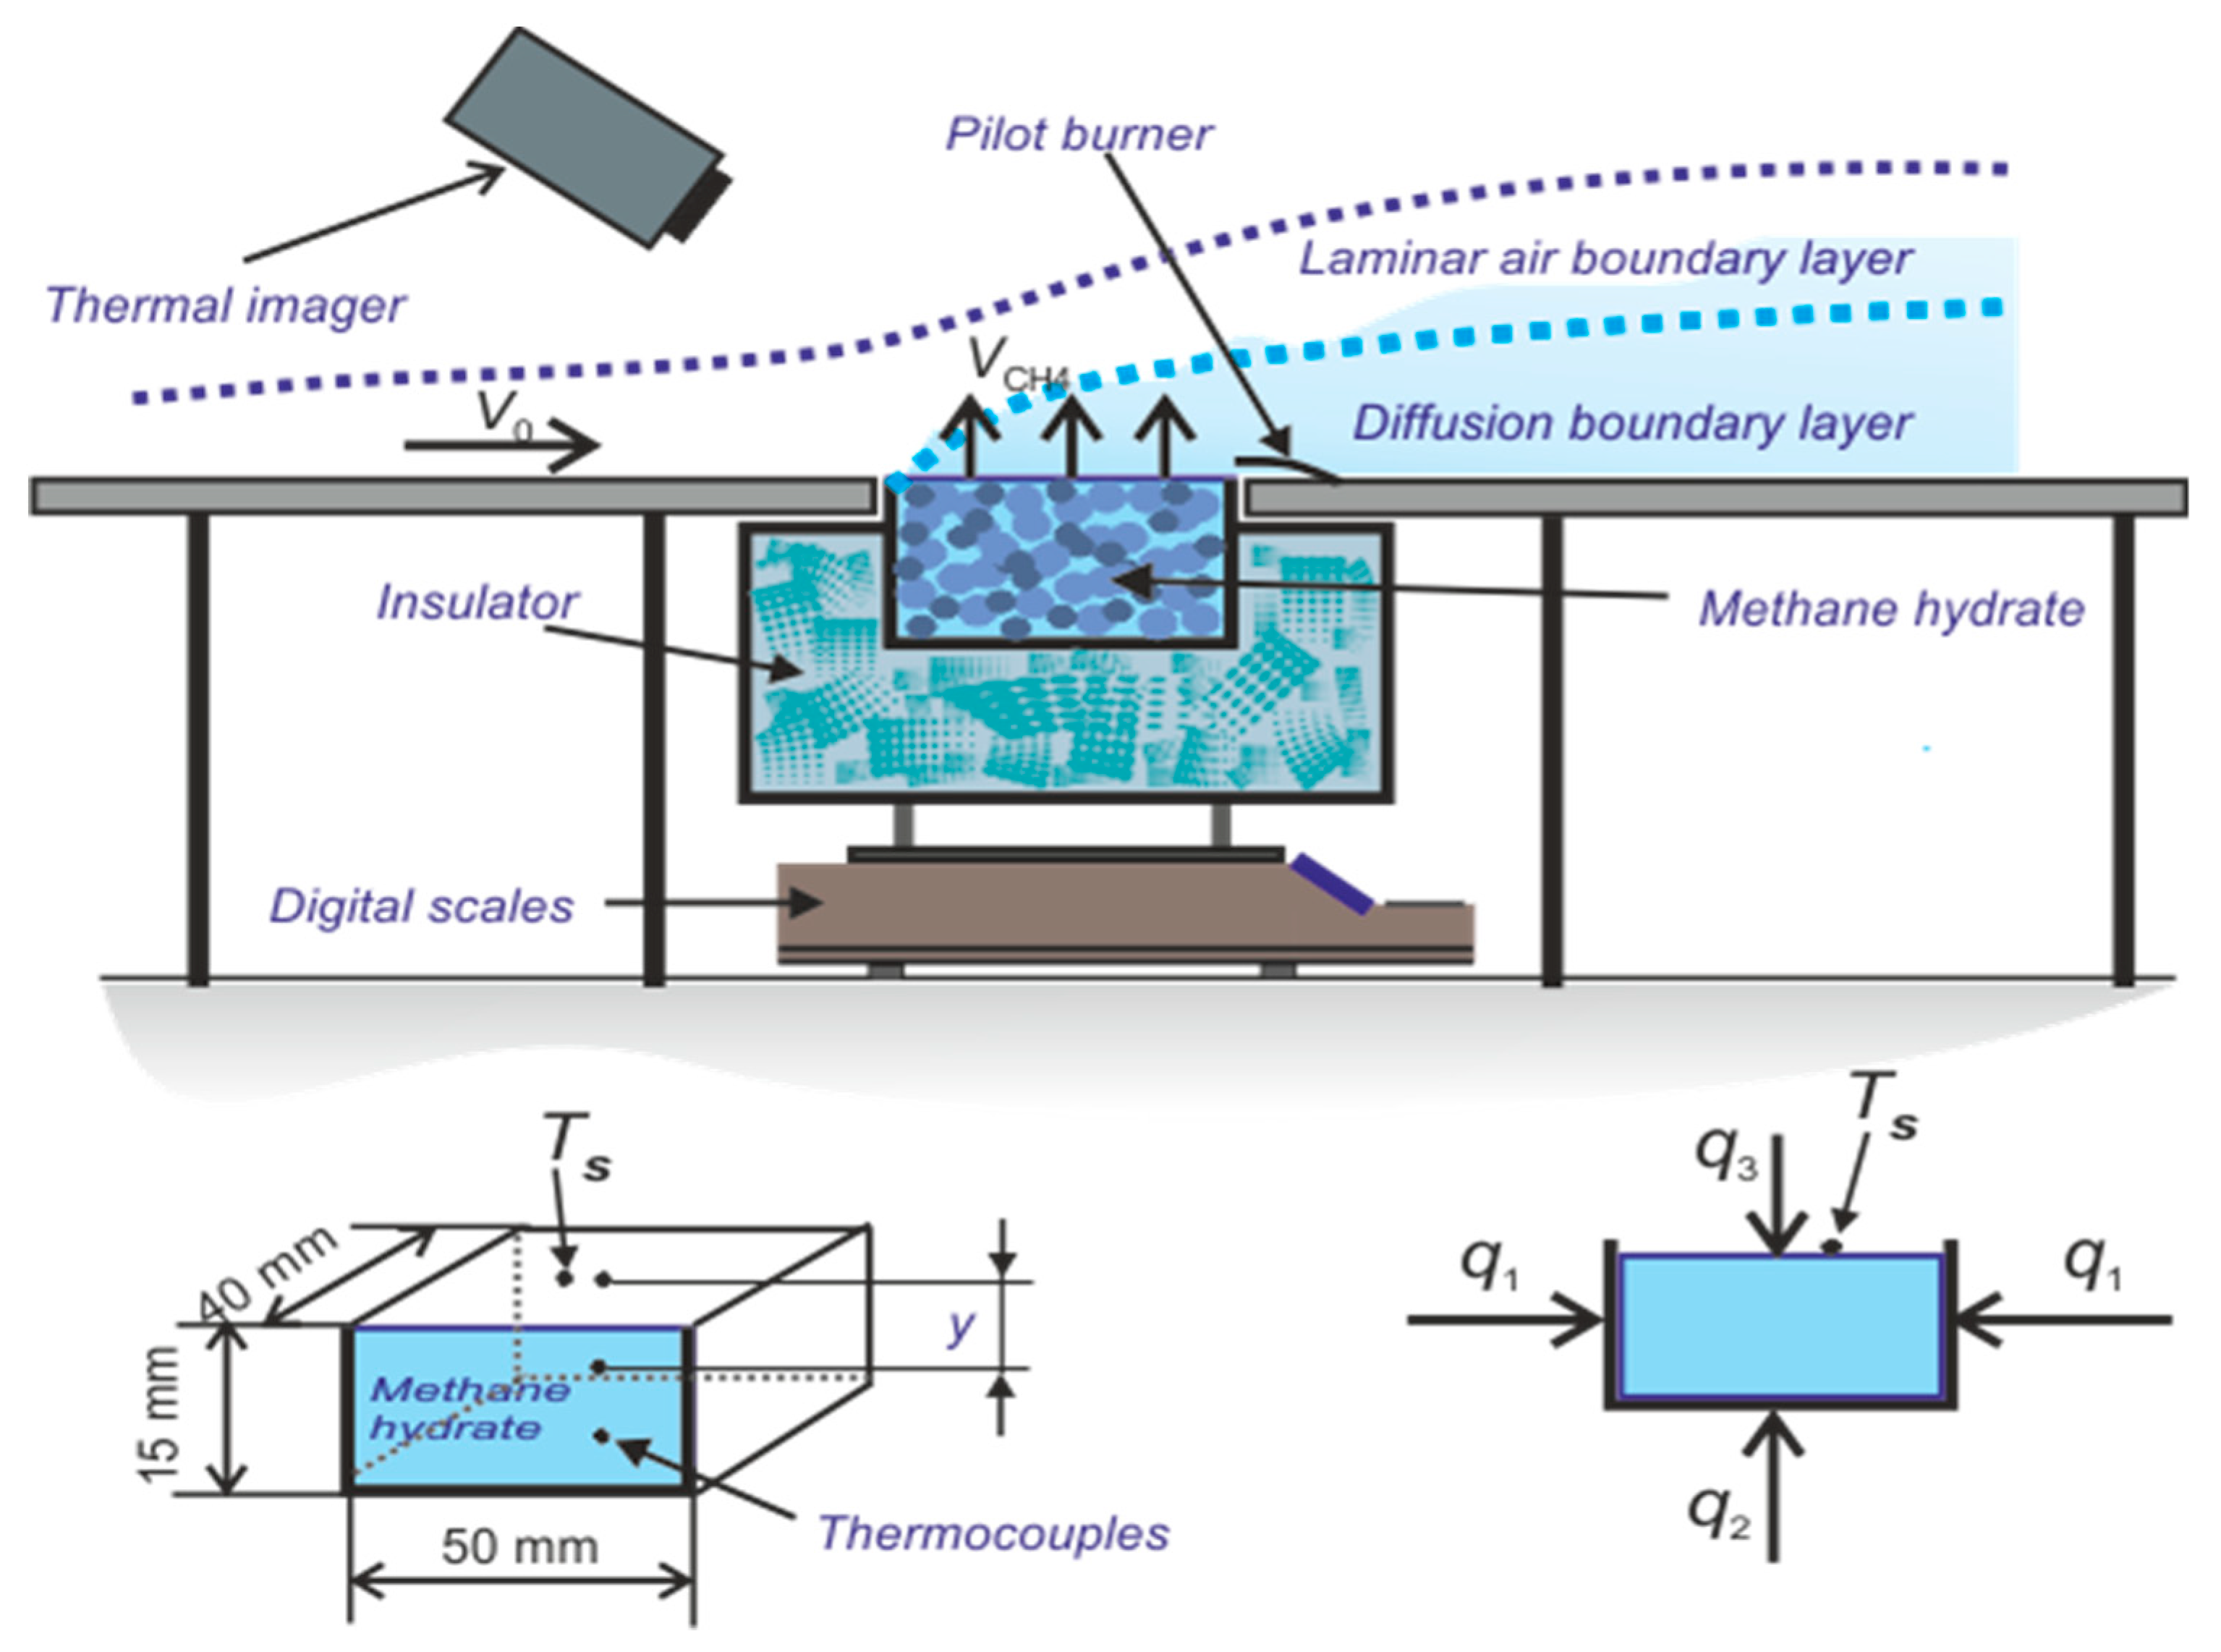
3. Experimental Apparatus and Procedure

3.1. Test Section for Organizing Methane Hydrate and Combustion

Most research works on methane hydrate combustion are related to temperature measurements in the powder layer and the flame spread speed determination. The absence of data on the methane flux density and heat flux both in the powder layer and in the gas phase does not allow correctly simulating the processes of dissociation and combustion. To calculate the combustion parameters, it is necessary to know the rate at which methane flows from the powder layer to the diffusion mixing layer. This flow is formed as a result of methane hydrate dissociation and methane formation. In these studies, methane velocity was determined using the weight method (the digital scales Vibra AJH 4200 CE). The dissociation rate j (g/s) was measured as j = ∆m/∆t (where m is the powder mass, and t is the time). The maximum measurement error j was less than 8–9%. Figure 1 shows the experimental setup. Three thermocouples (y = 1 mm, y = 5 mm, y = 14 mm) are located in the center of the working area at different distance y from the upper surface of the powder to measure the temperature profile 1 of methane hydrate in the transverse direction. The vessel walls were made of stainless steel with thickness of 0.7–0.8 mm. Around the tank thermal insulating material was located.
Temperature field on the surface of the powder was measured with the use of a thermal imaging camera (NEC San Instruments). The measurement error of the thermocouple was within 1%. The difference between the temperature values measured by the thermocouple and the thermal imager did not exceed 1.5–2 K.
Methane hydrate combustion was realized at different air flow velocity U0 from 0 to 0.6 m/s. The mean flow velocity profile coincides with the Blasius velocity profile of a flat laminar boundary layer. The intensity of the turbulent velocity fluctuation e (e = urms/U0, where urms is the mean square value of velocity pulsations and U0 is the average velocity) was less than 2%. The surface temperature range of the samples (Ts) varied from 90 K to 273 K. Before the experiment, the methane powder was taken from liquid nitrogen and placed in a tank. Heating of the powder was due to the heat coming from the ambient medium, i.e., from the air through the top surface of the powder and from the metal walls of the tank. Evaluation of thermal resistance (heat transfer coefficient) shows that heat fluxes both from the upper surface and the side-walls are of the same order of values (without combustion of methane). The influence of the side-walls leads to a significant longitudinal temperature gradient (10–20 K) and the maximum temperature always corresponds to the powder on the surface and near the side-walls. Thus, in addition to measuring the transverse temperature profile, in these experiments the temperature of the entire surface of the powder Ts is measured using the thermal imager. The average temperature of the powder is important to know for the correct simulation of the dissociation rate. In most experimental works, temperatures are measured only in the center of the powder tank. The motion of the leading flame edge starts from the edge of the tank, where the temperature can be 20 K higher and a higher local density of methane flow is realized.
A diffusion layer (methane–air–water vapor) is formed inside the laminar boundary layer of air. The thickness of the diffusion layer is lower than that of the dynamic layer for air (Figure 1).
Methane hydrate was synthesized using the following procedure. The cooled autoclave was loaded with the powder of ice, the autoclave was blown with methane and the methane pressure of 7–10 MPa was set. The autoclave was placed in a thermostat with a temperature of +1 °C. Hydrate was synthesized by slow melting of ice during the day. Further, the autoclave was cooled to the temperature of liquid nitrogen, and the resulting mixture of methane hydrate and ice was ground and reloaded into the autoclave (all at the temperature of liquid nitrogen). After warming up the autoclave to about −100 °C, the methane pressure was set, and the autoclave was again placed in a thermostat with a temperature of +1 °C. This procedure was repeated two times, resulting in an almost pure methane hydrate with an ice content of not more than a few mass %. Before use, the hydrate was stored immersed in liquid nitrogen. The purity of the sample was controlled by powder X-ray diffraction. The average size of methane hydrate particles in all experiments was 0.1–0.2 mm.

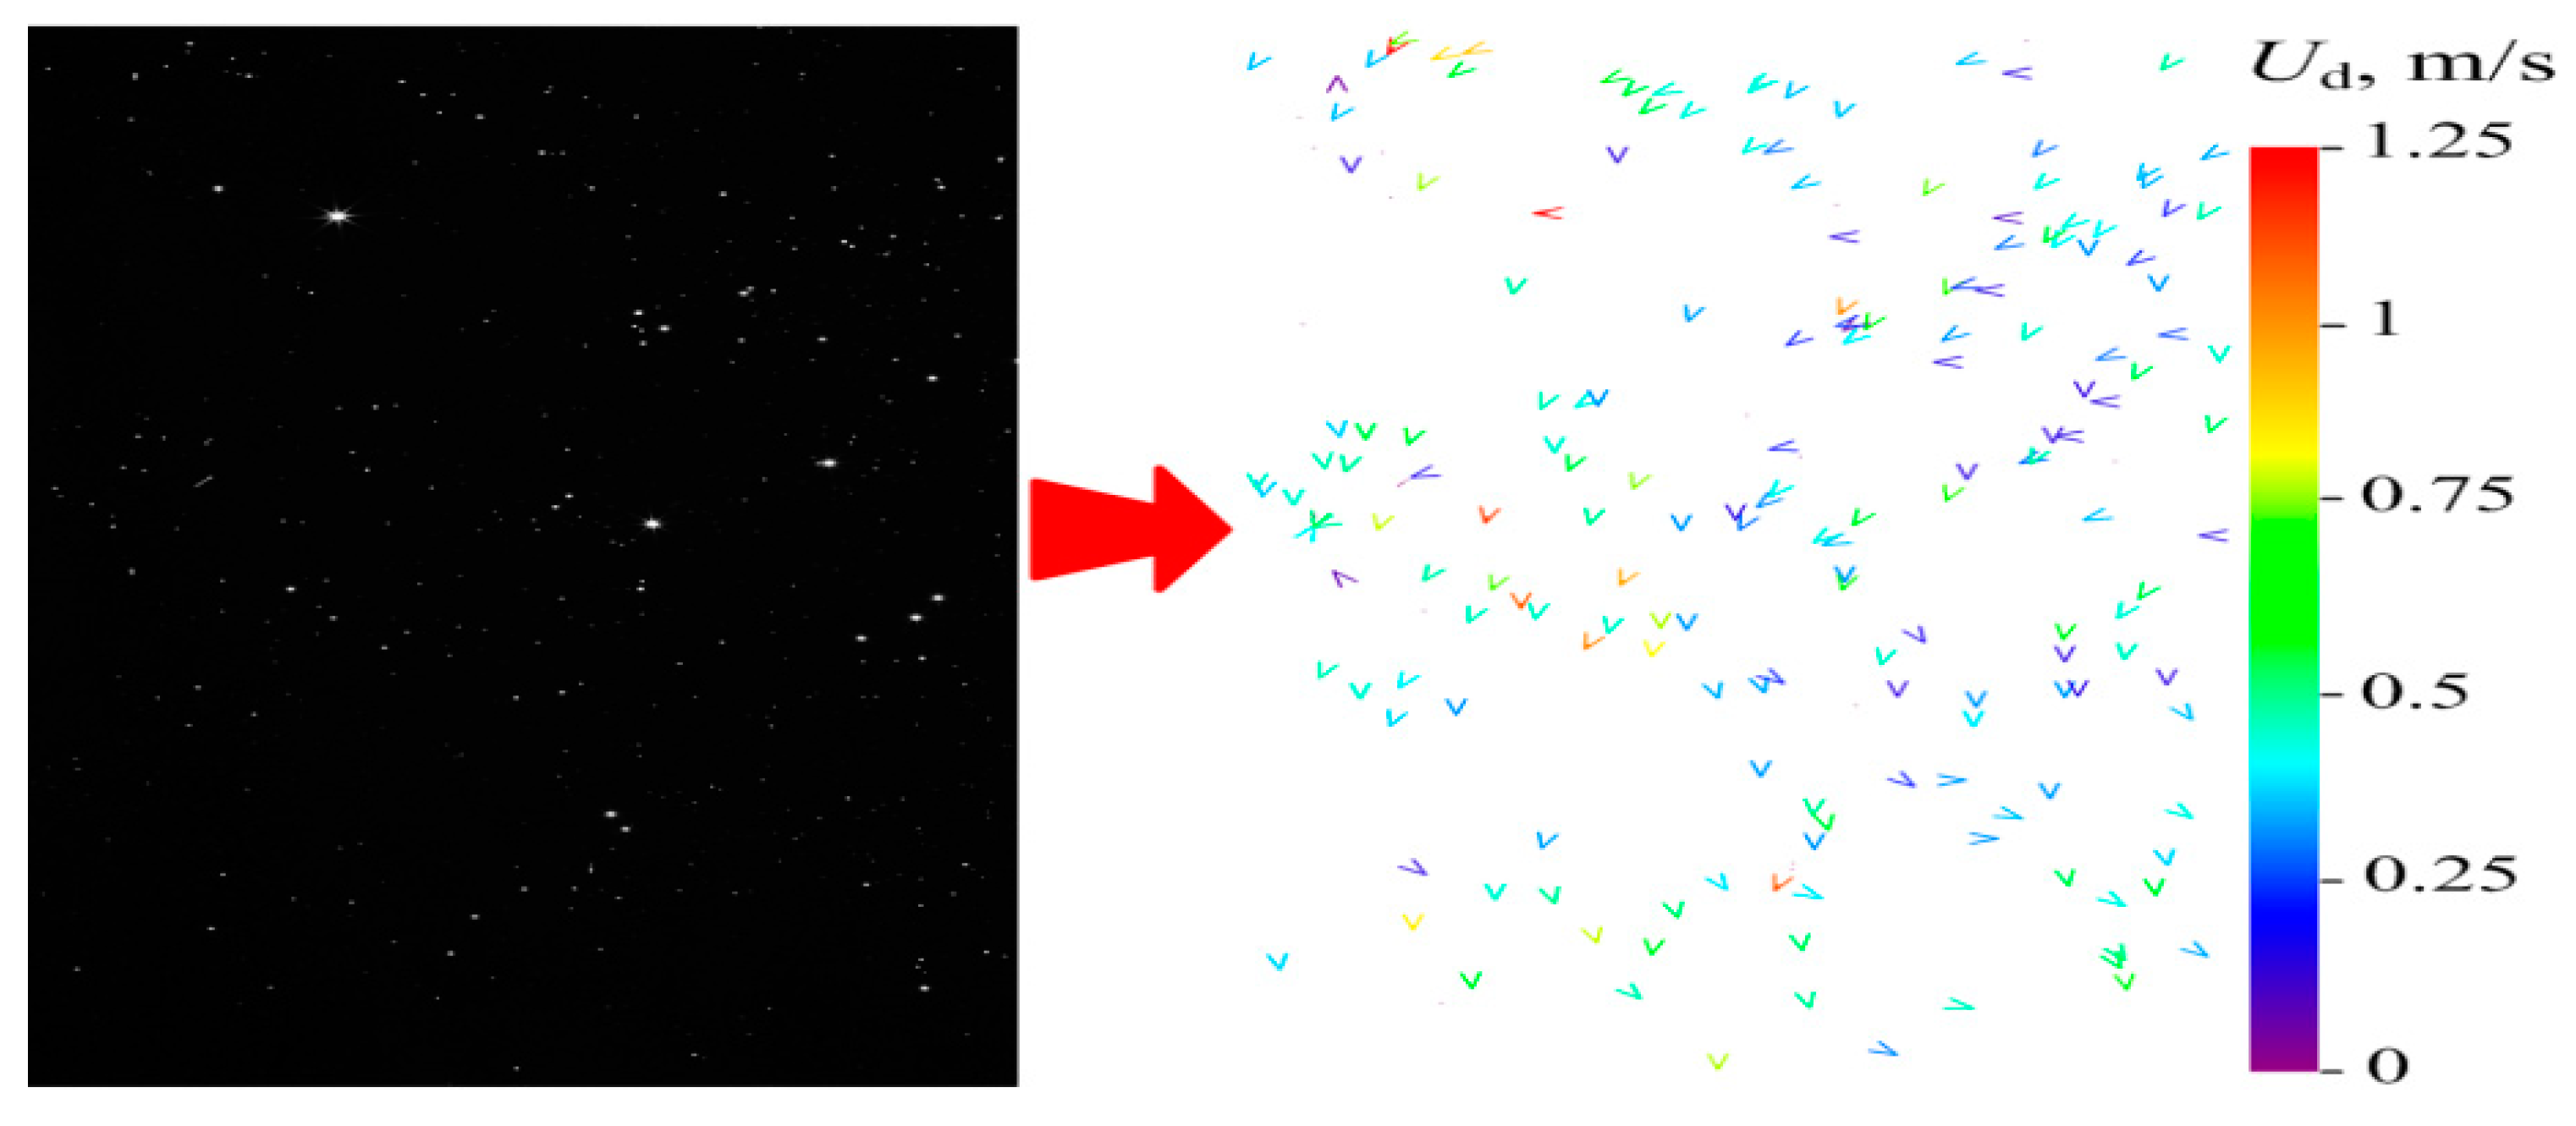
3.2. Measurement Using Particle Tracking Velocimetry (PTV) Method

The method of “Particle Tracking Velocimetry” (PTV) was used to determine the gas flow velocity (formed during combustion of methane hydrates). Similar to the Particle Image Velocity (PIV) method, the PTV algorithm is based on determining the most likely particle shift for a very short time delay. The use of the PTV method in these experiments is due to its peculiarities: Unlike the PIV method, the PTV method does not imply the use of a large number of tracing particles. For this reason, the influence of tracers on the process can be neglected. In addition, the PTV method has a higher spatial resolution, as well as a lower sensitivity to uneven seeding of the flow by particles (compared to PIV). TiO2 powder (particle sizes of 0.1–1 µm) was used as tracing particles for seeding the registration area. The tracers were blown into a container with hydrate in advance (3–5 s before the start of the experiment) and formed a slurry. The registration area was dissected with a sheet of a double pulsed Nd: YAG laser “Qantel EverGreen 70” (wave length—532 nm, pulse energy—74 mJ) with a frequency of 0.25 Hz. To create a flat sheet, an optical nozzle with an opening angle of 45° was used. The thickness of the laser sheet in the registration area was about 200 µm. Images of TiO2 microparticles in the plane cut by the laser knife were recorded by CCD video camera “ImperX IGV B2020M” (resolution of 2048 × 2048 pix, and bit width of 8 bit). The angle between the optical axis of the camera and the plane of the laser sheet was 90°. A couple of frames were recorded for each moment. The delay between frames in a pair (frame delay) was 50–100 µs. The data processing required the use of “Relaxation method of PTV”—a two-frame PTV with an estimation of the probability of outcomes. Image processing included several successive stages (steps). At the first step, the background was subtracted from the obtained images and extraneous noise was removed (using mathematical algorithms, as well as “Median” and “Average” filters). At the second step, the intensity threshold “Intensity Threshold” was set to binarize the obtained images. The threshold was set as a percentage of the maximum intensity value (255 for 8-bit images). The areas that underwent binarization marked the position of the particles. At the third step, for each region after binarization, the procedure for finding the center of the particle using the algorithm for calculating the center of mass was carried out. The fourth step was to find a pair for each particle from the first frame in the second frame. The radius for the pair search was set based on the maximum possible displacement of the particles in the image. At the fifth step, the displacement of each particle (l) was determined, after which the absolute value of the velocity of each particle was determined at the known values of the scale coefficient (S) and the frame delay value (dt): u = S∙l/dt. The last (sixth) step stipulated the elimination of erroneous vectors (using the algorithm “Moving average validation”).
The result of each experiment was a set of irregular two-component velocity fields. The systematic error in the determination of particle velocity values by the PTV method depended on the type of optics used and the size of the registration area and did not exceed 1.5% in experiments. An example of an image of tracing particles and an irregular velocity field is shown in Figure 2.

4. Measurement

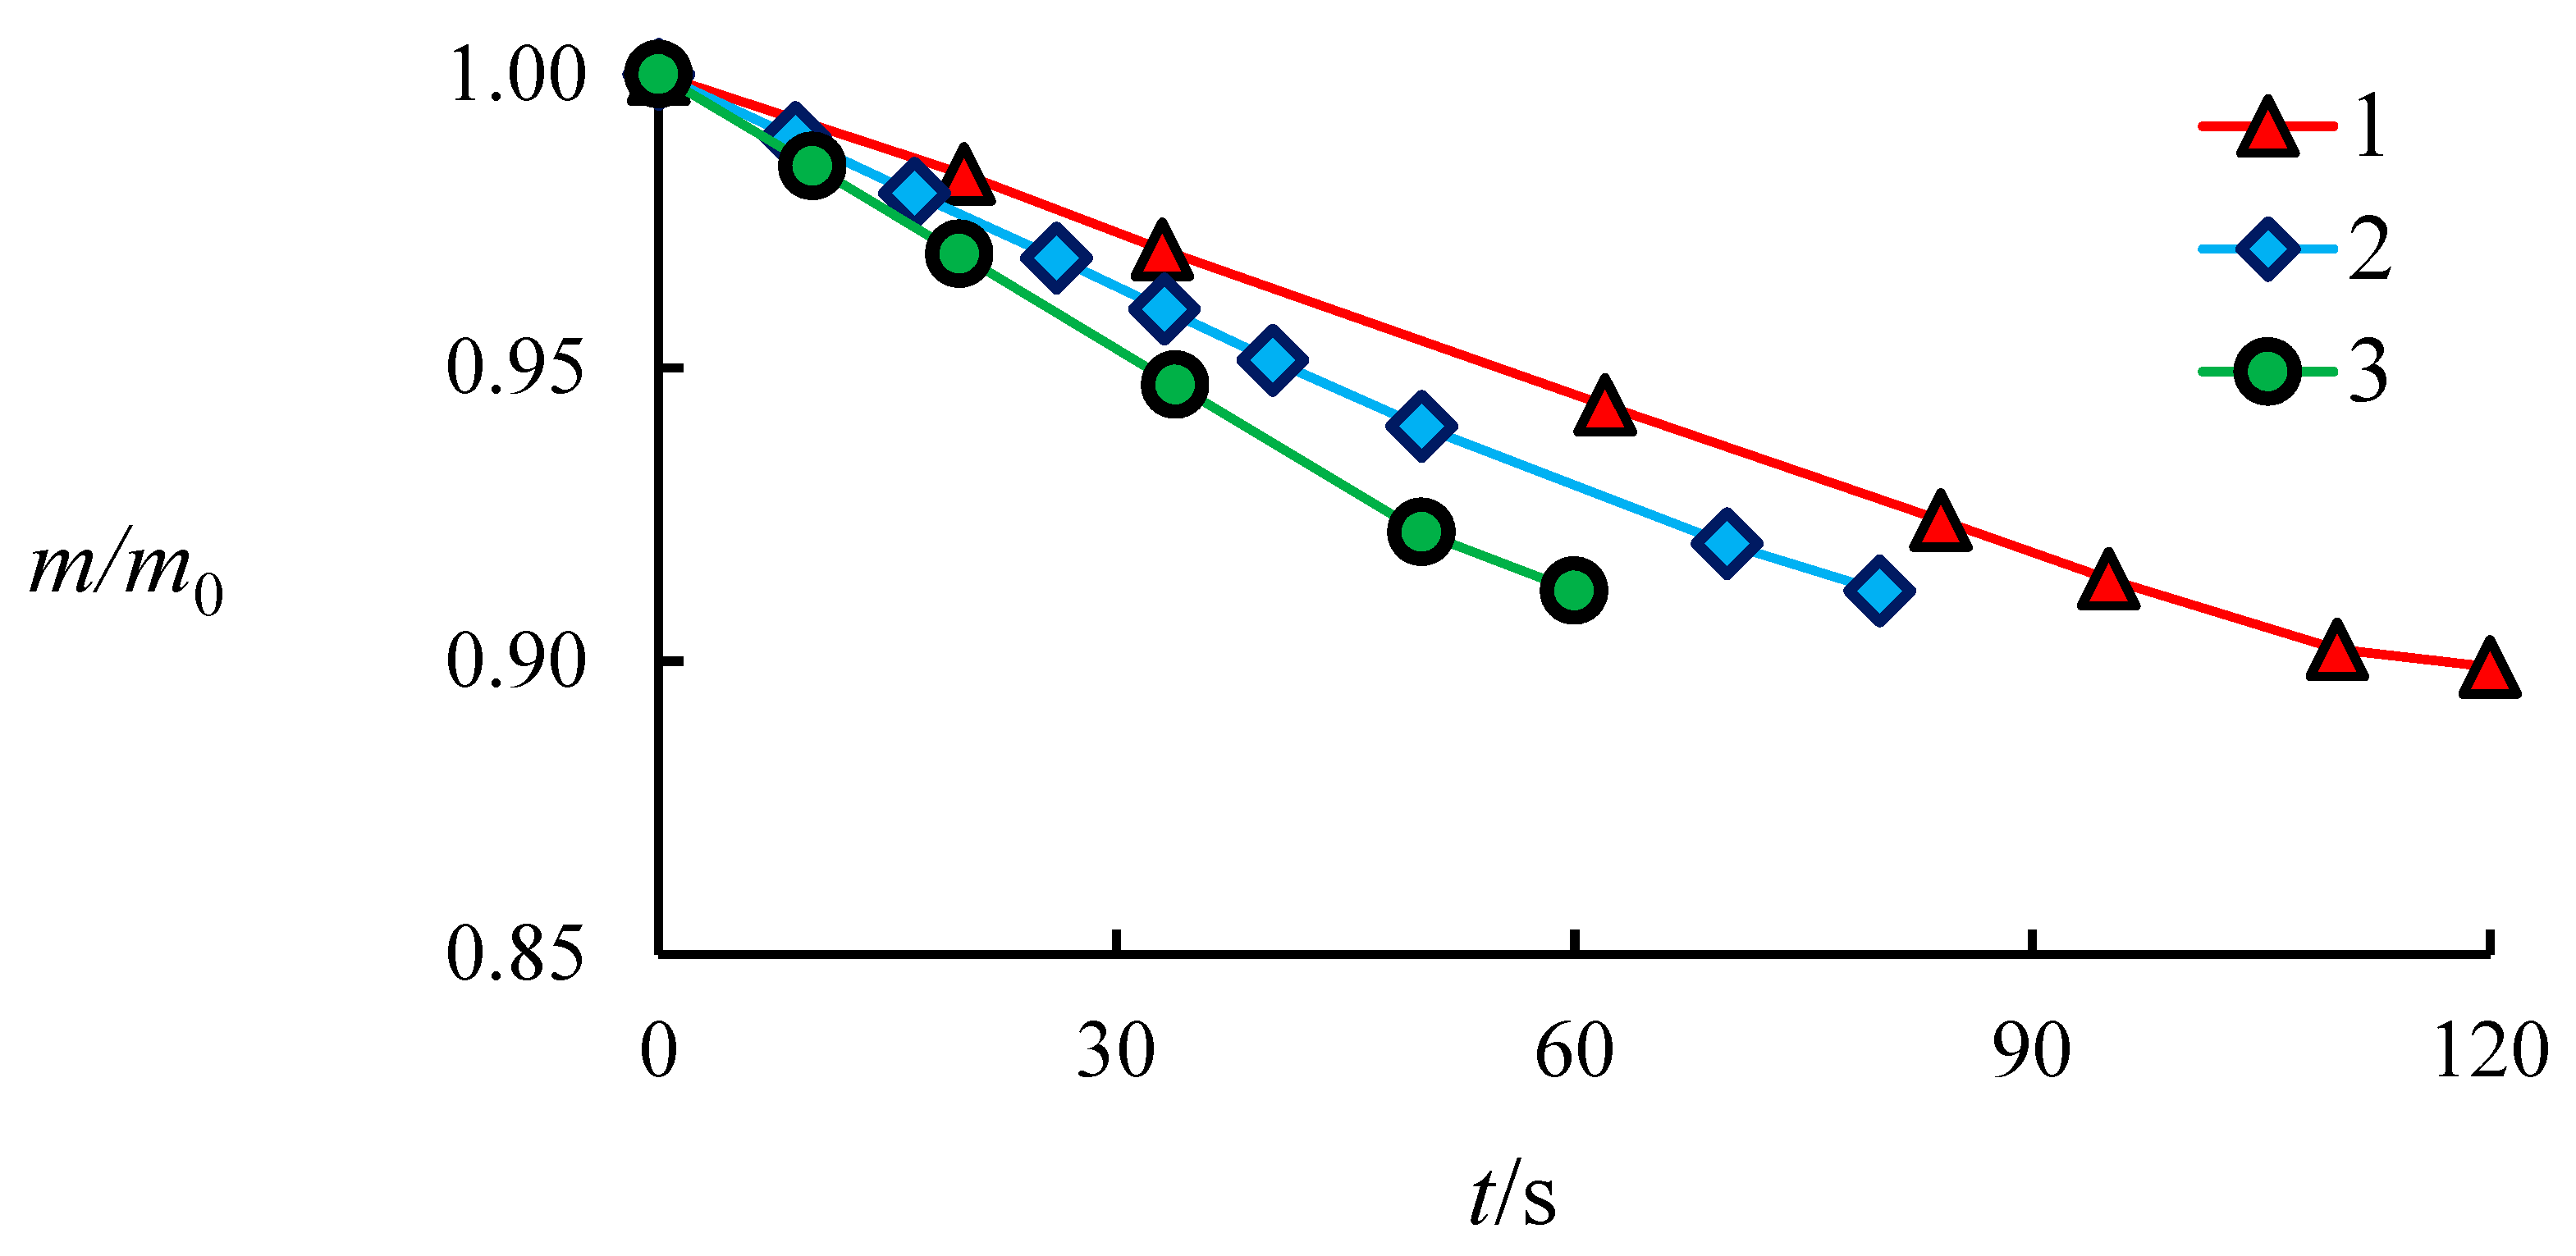
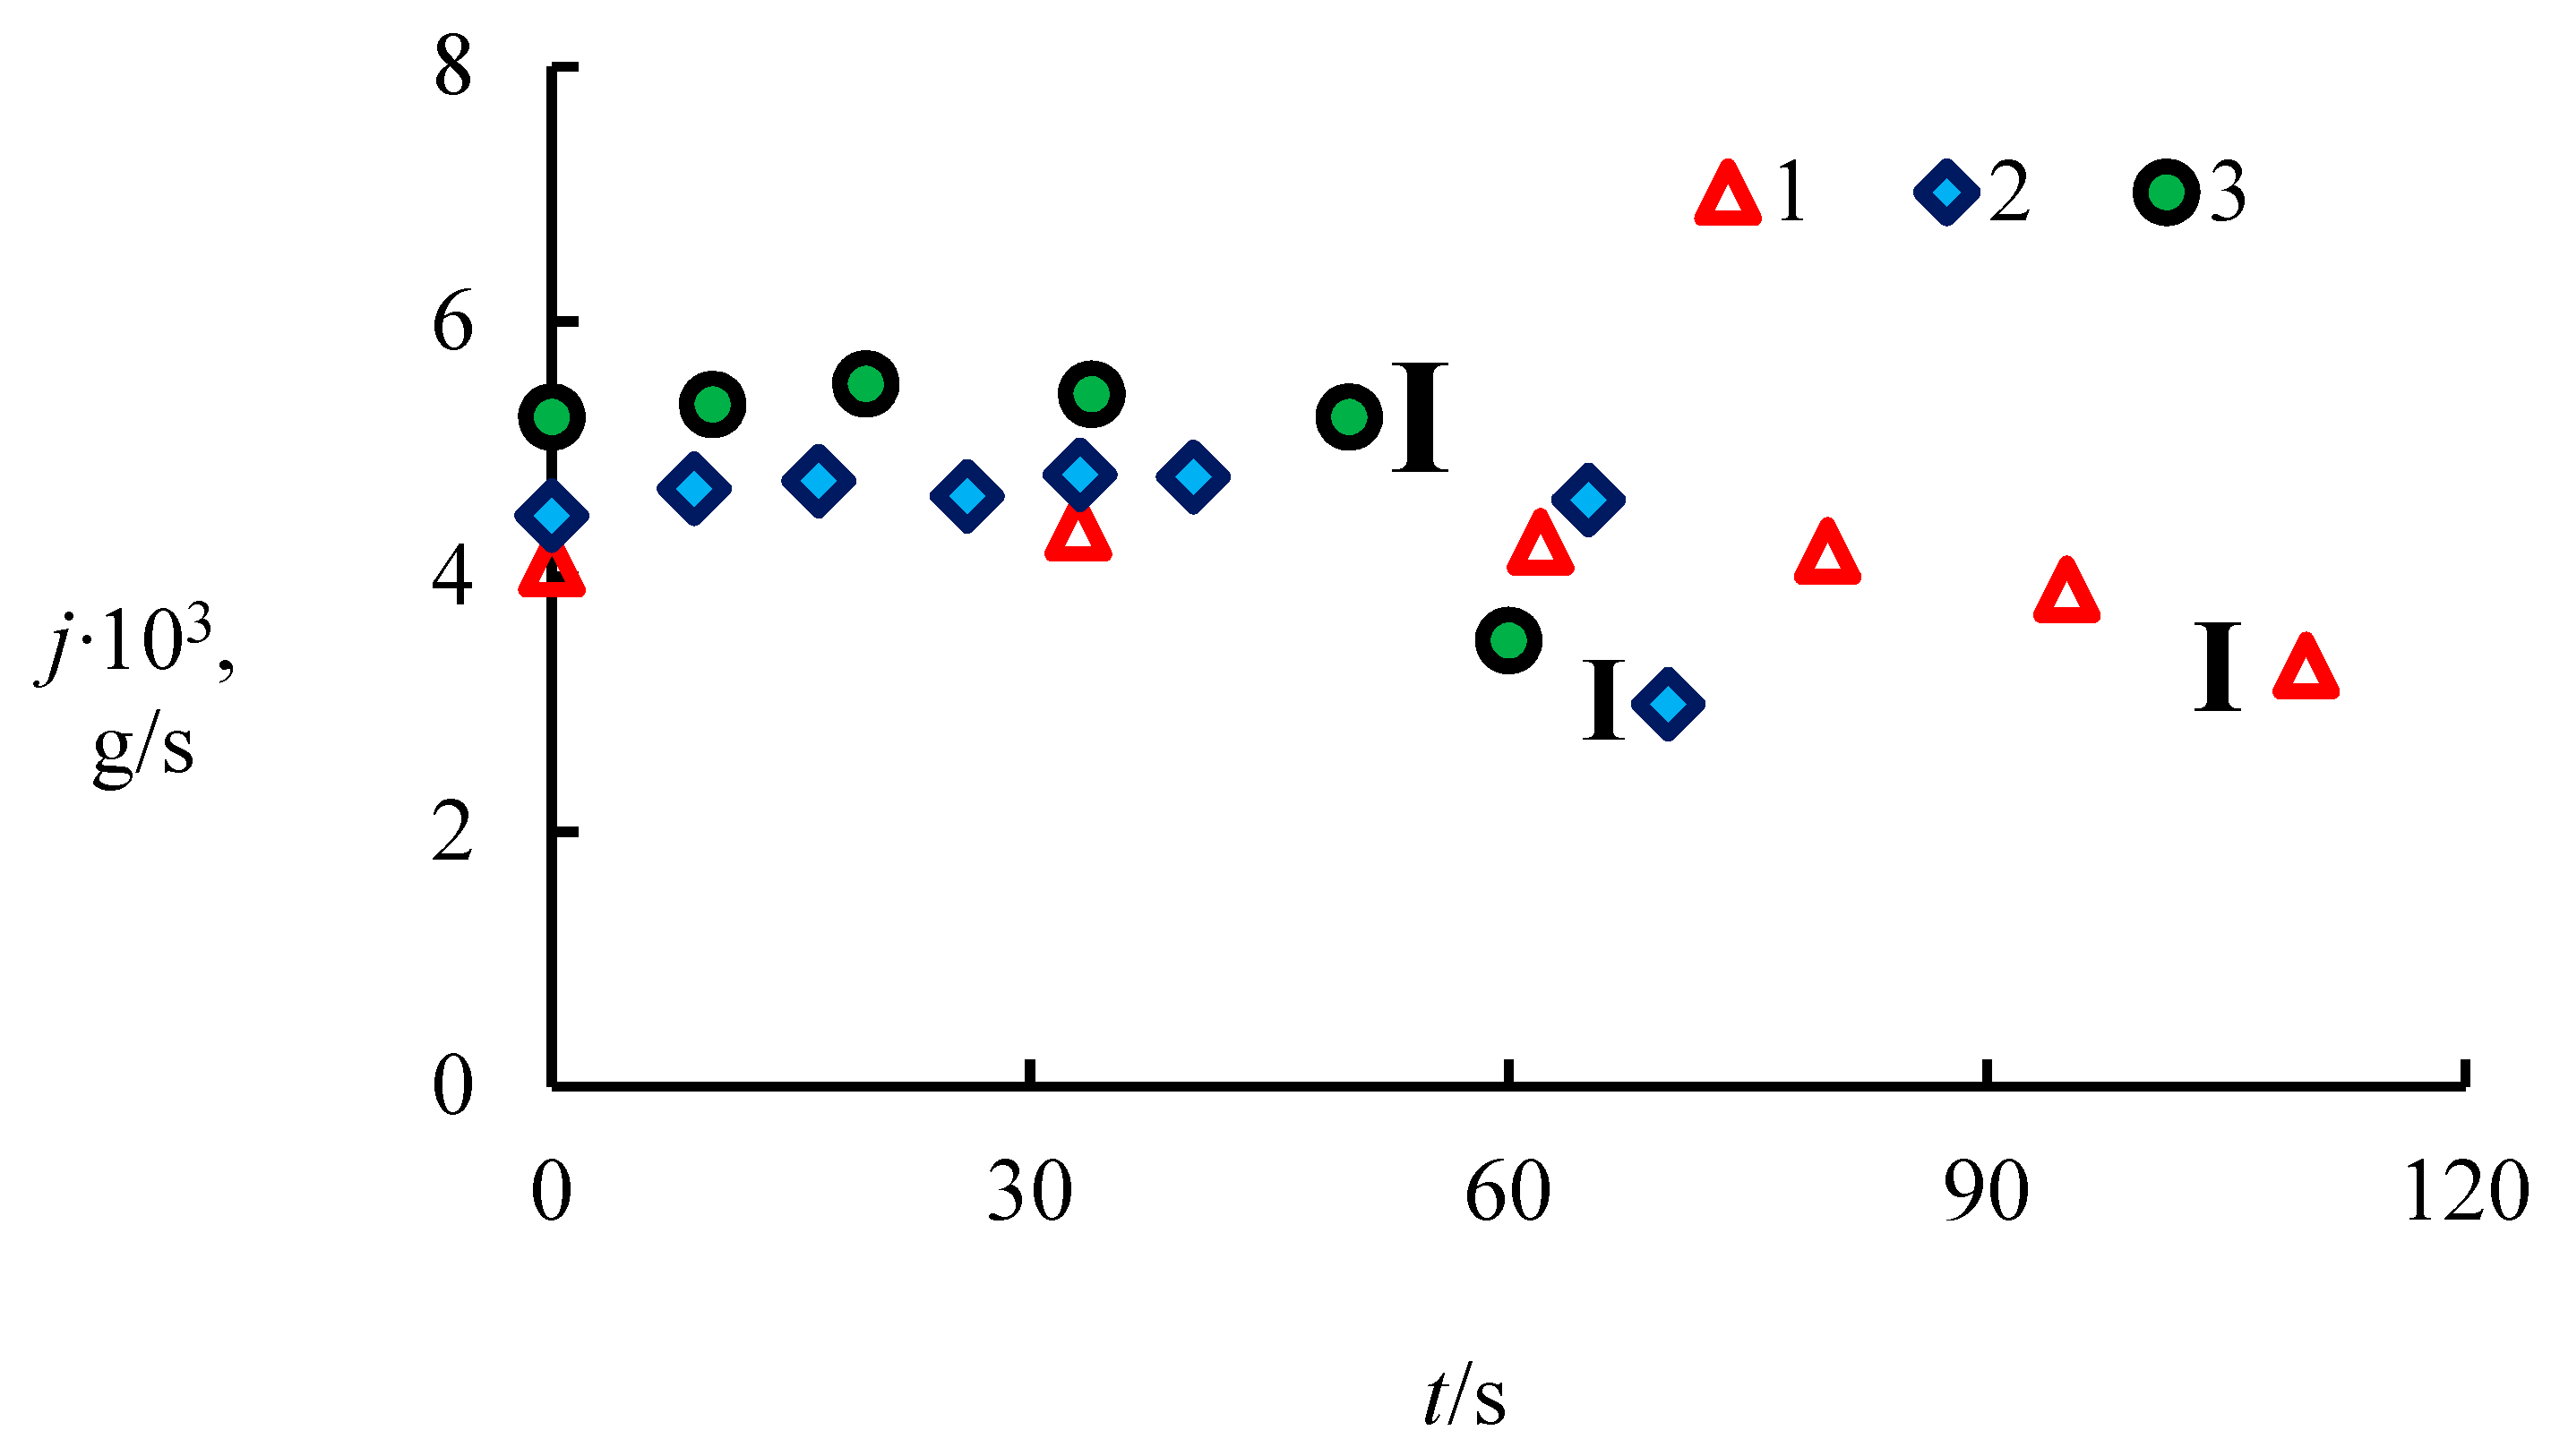
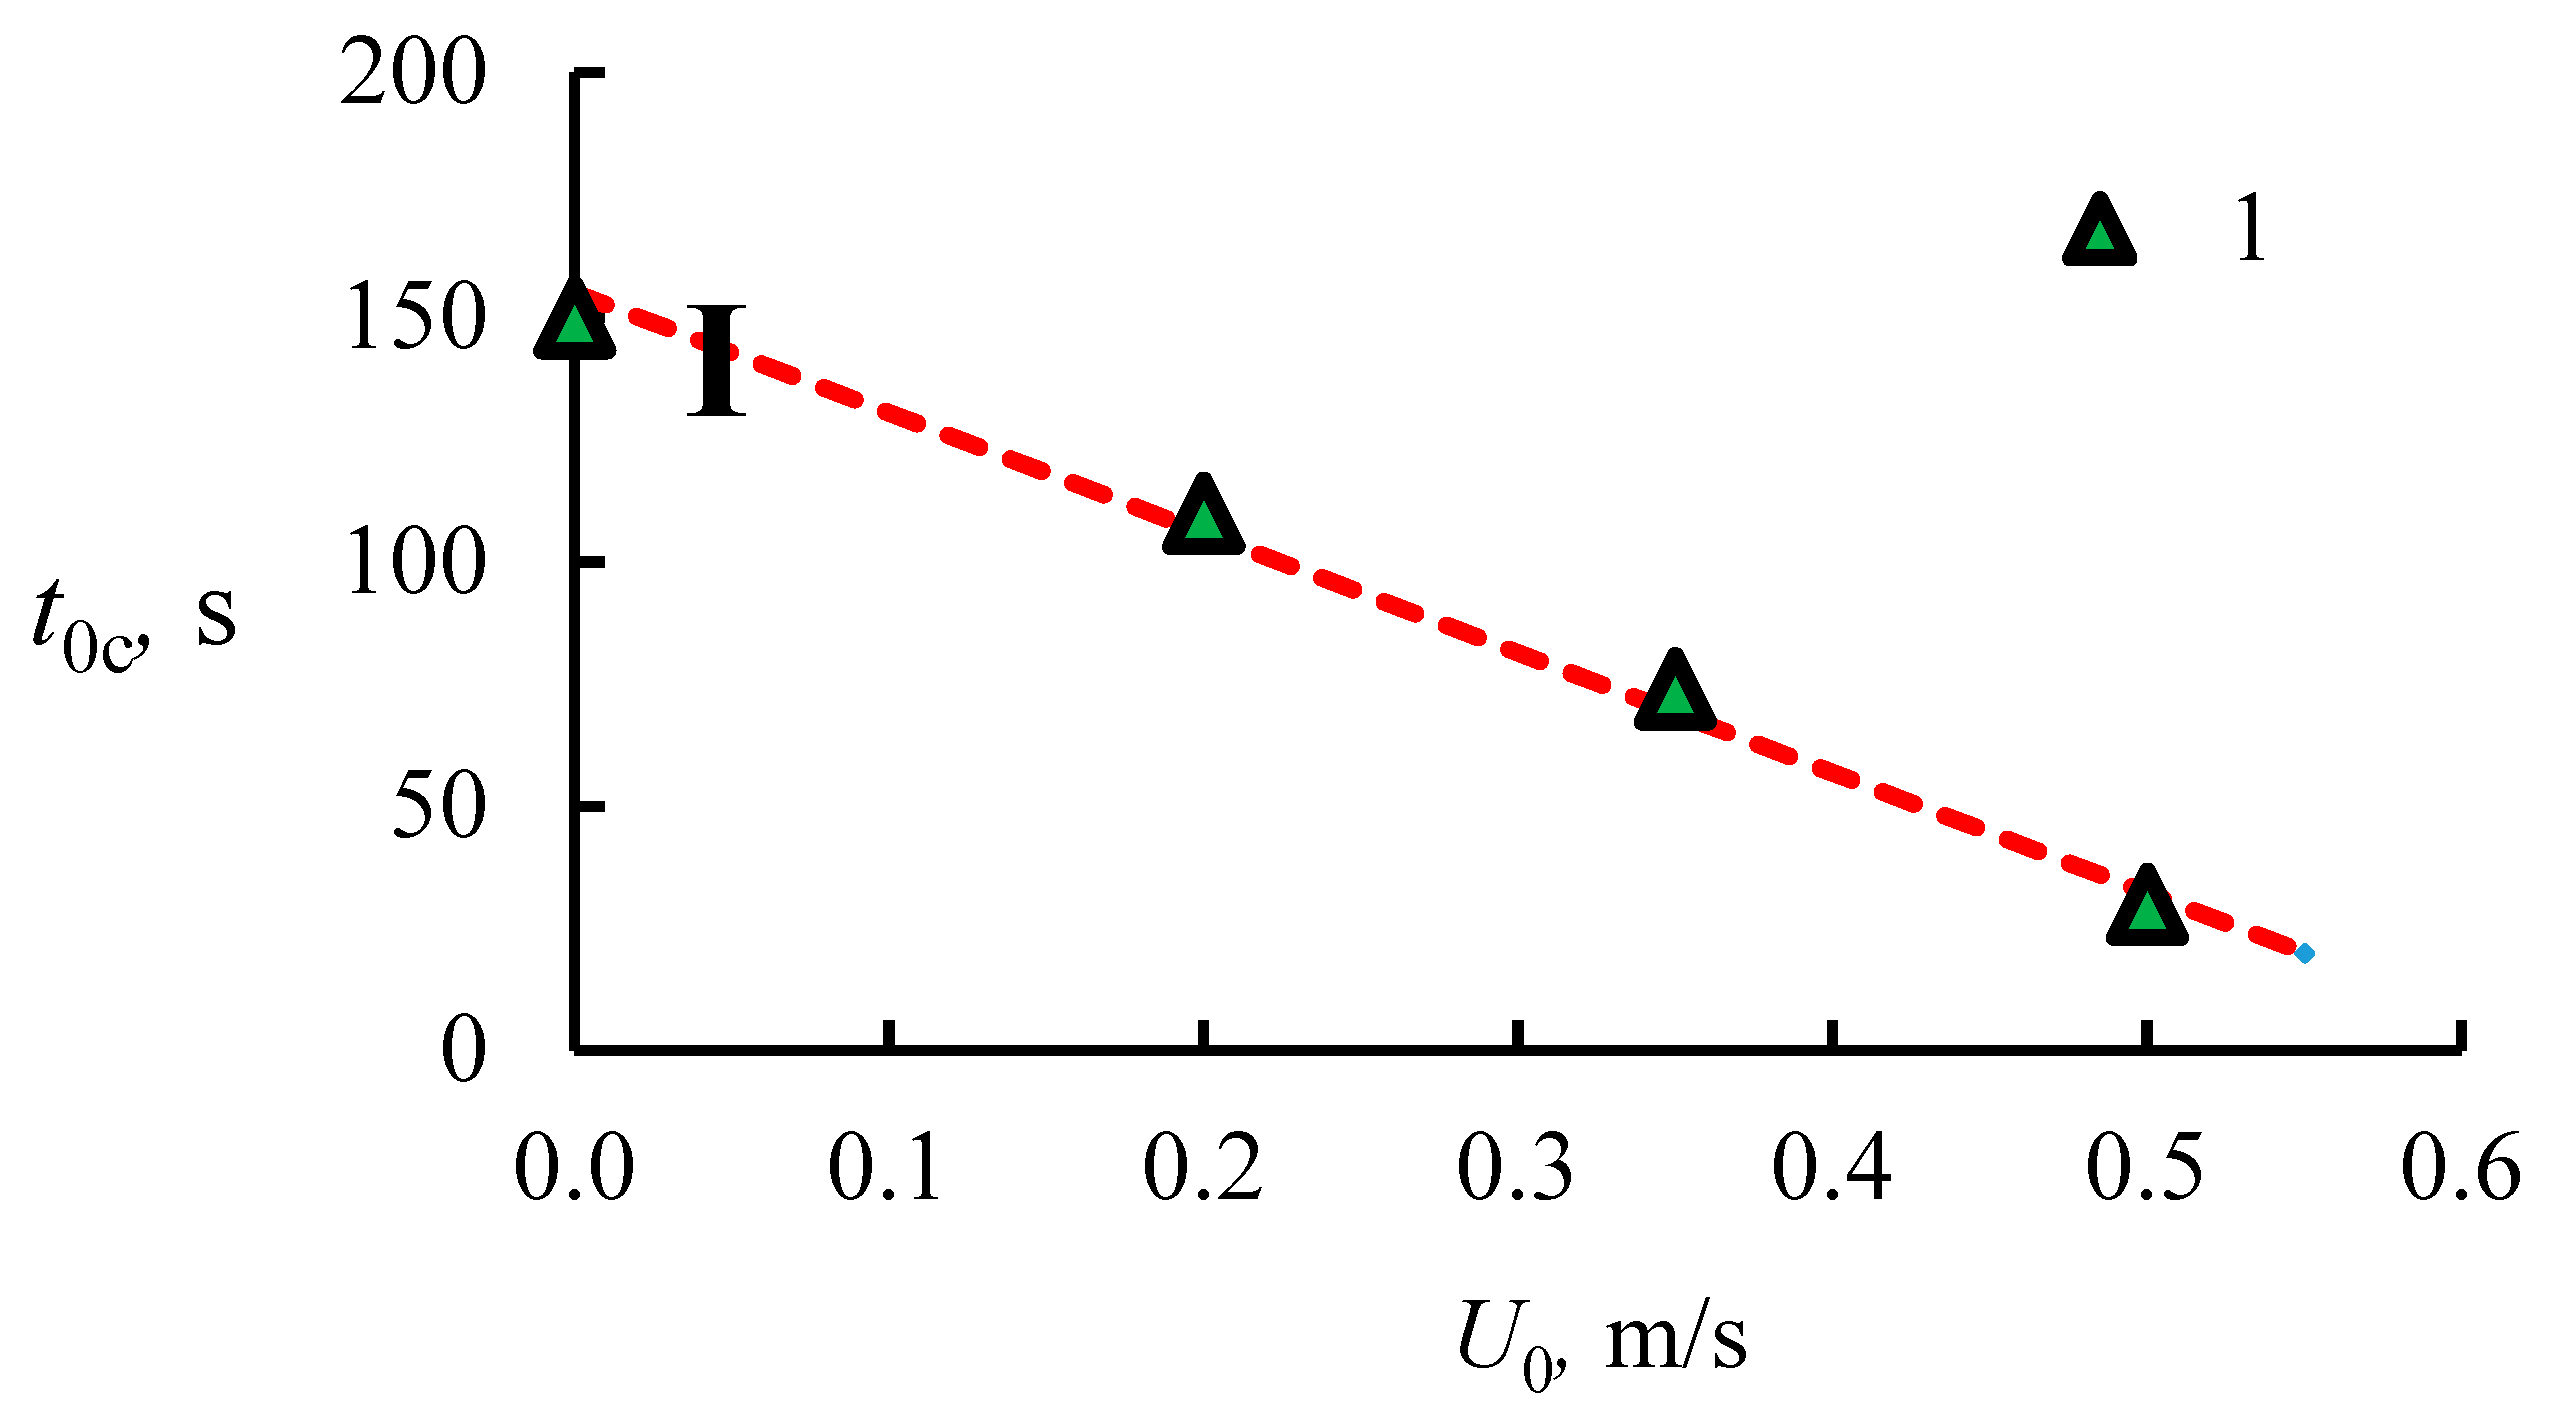
4.1. The Dissociation Rate in the Combustion of Methane Hydrate

To determine the dissociation rate of methane hydrate, it is necessary to construct curves of powder mass change over time. Figure 3 shows curves for different external air-flow rates U0. The powder mass values are divided by the initial mass m0 (m0 corresponds to the methane hydrate mass when all methane is in the sample). As the velocity U0 increases, the slope of the curves grows, i.e., the dissociation rate j = ∆m/∆t increases. The graphs of j change are shown in Figure 4. The rate of methane hydrate dissociation depends on the diffusion, heat transfer, and internal kinetics of the reaction.
Figure 5 presents experimental data (points 1) for the dissociation rate j of methane hydrate depending on the velocity of the incoming air flow U0. The calculated curve 2 is obtained in accordance with expression (2). The difference between the curve 2 and experimental data 1 can be associated with both the experimental error (measurement error j) and the deviation of the dependence q ~ (U0)0.5 from the quadratic form. This deviation is probably due to the presence of both a forced air-flow and a free-convective flow due to high temperature gradient and gas density in the diffusion layer of the mixture. The degree n = 0.5 corresponds only to the plane laminar boundary layer when the buoyancy is neglected, i.e., when St ~ 1/(Re)0.5 and q ~ (U0)0.5 [41,42,43,44], where St and Re are the Stanton number and the Reynolds number, St = q/(ρ0U0cpT), Re = ρ0U0x/µ, x is the longitudinal coordinate, µ is the dynamic viscosity, and cp is the heat capacity of the gas mixture. If the characteristic velocities caused by forced flow and buoyancy are comparable (of the same order), their ratio can be estimated using the Richardson number Ri = Gr/Re2 (Gr is the Grashof number).
The deviation of experimental data (1) from curve (2) begins at U0 < 0.25–0.3 m/s, since expression (2) does not describe free convection (U0 is the velocity of the forced convection). Thus, there are at least two dissociation modes of j, depending on U0, for which the degree n will vary significantly. For 0 m/s < U0 < 0.3 m/s the dissociation rate is quasi-constant (n = 0), and for 0.3 m/s < U0 < 0.6–0.7 m/s the degree n = 0.29 m/s. With further velocity increase the combustion suppression is observed. The existence of two modes with increasing velocity U0 was also observed in Reference [29] for the flame propagation speed. However, the parameters of j and flame propagation speed correlate, i.e., the reaction rate during combustion and the dissociation rate are interrelated. At the same time, in Reference [29] there is a certain shift for the boundary of two modes transition. The critical value of Ucr1 corresponds to velocity, when the experimental curve 1 deviates from the calculated curve 2. Ucr2 determines the deviation of curve 3 from the calculated curve 2. Curve 3 shows the shift of the experimental curve 1 in the direction of increasing Ucr2 (Ucr2 = 0.7 m/s). Vertical dotted lines distinguish regimes 1 and 2 (Figure 5). The mode transition boundary corresponded to velocity U0 = 0.7 m/s, and then there was an increase in the flame propagation speed. These differences are related to the difference in the boundary conditions for the two works. It is easy to link possible causes of this shift with two dimensionless criteria A1 = A1cr = δd/δm (dynamic and diffusion layer thickness ratio) (Figure 6) and A2 = A2cr = U0/Uconv (ratio of air velocity to convective flow velocity). In Reference [29], there is a longer background (prehistory) and a thicker δd2. As a result, U0m2 will be, on the contrary, less than U0m1 in the present work. Let us consider the second reason (A2cr). The convection velocity can be approximately expressed via the characteristic lengths of the working area L in form (3).
Uconv ~ (2gLρ/ρ)1/2
Then, the ratio of characteristic convection velocities for two works Uconv2/Uconv1 will be proportional to (L2/L1)1/2 = (120 mm/25 mm)1/2 = 2.2. Ignition in [29] begins at the end of the working area, the length of which is 120 mm. In the present work, combustion is realized approximately in the middle of the working section of 50 mm long. Thus, the number A2 for L2 will be higher than for L1. As a result, to realize some critical value of A2cr, it is required to increase the velocity almost 2.2 times in [29]. In this case, external convection U0 will exert a significant influence on heat and mass transfer and on dissociation rate of methane hydrate. Then, A2cr is implemented for velocity U0 = 0.3 × 2.2 = 0.66 m/s. The obtained estimated critical velocity (0.66 m/s) corresponds to the velocity in [29], which is 0.7 m/s. The third reason for the differences in the critical velocity (transition modes) is associated with different average temperature of the powder, which will lead to different dissociation rate, methane injection rate, the average combustion temperature, the difference between the combustion temperature, and the surface temperature of the powder ∆T, which will lead to a change in ∆ρ (∆ρ = βT) and velocity Uconv. Further theoretical and experimental studies are required to determine more precise dependences of the transition mode on these three factors.
As can be seen from the graph, with the growth of U0 the dissociation rate j increases. However, this growth is an extremely weak function of U0. In References [28,29] there was a weak increase in the velocity of the flame edge Vс with an increase in the velocity U0. Obviously, this velocity is a function of the combustion temperature Tc. The reason for this weak influence has been considered above in accordance with expression (2). Another reason for such a weak effect may be due to the geometry of the diffusion and dynamic layer. Figure 6 demonstrates the characteristic profiles for two different velocities of the external incoming air flow U01 and U02 (U01 < U02).
The figure shows the dynamic velocity profile 1 for air and the diffusion profile 2 for the gas mixture (methane–air–water vapor). The velocity U0m corresponds to the upper boundary of the mixing layer. Despite the increase in U02 compared to U01, the velocity at the boundary of the diffusion layer U0m decreases sharply (U0m2 < U0m1). In addition, the characteristic scale of vorticity Lw decreases sharply due to the flow instability at combustion. With the fall of U0m (factor 1) and Lw (factor 2), the flow of methane to the combustion region “C” decreases as well. The combustion region “C” for the case (a) covers most of the mixing region (2). At that, there is a high cross-flow of methane j (V1 > V2). For figure (b), the largest part of the “C” area is outside the diffusion layer (2). Thus, the area of the combustion region, which is inside the diffusion layer, is the third factor that affects combustion. As a result, we obtain the following. The increase in the velocity U0 for the laminar boundary layer leads to an increase in the heat flux (q ~ (U0)0.5) in the mixing layer.
According to the energy conservation, the heat flux to the powder is equal to the heat flux inside the powder. The increase in heat flux leads to an increase in dissociation rate according to (1) and to an increase in methane concentration within the combustion region. However, the other three factors mentioned above significantly reduce the positive role of U0 growth. Thus, we can draw two important conclusions from the above: (1) The increase in velocity U0 leads to a weak increase in the burning rate; and (2) the average temperature of the powder and the uneven temperature distribution in the layer strongly affect the methane concentration in the combustion region. In turn, the second factor (temperature) is extremely sensitive to the pores distribution density in the powder particles due to the phenomenon of self-preservation.
Let us consider the time of combustion start t0c depending on the velocity of the incoming air-flow U0 (where t0c is the time from the powder placement in the tank to the start of combustion). Methane was ignited periodically every 5 s. However, combustion began only when the methane concentration in the combustion zone reached a certain minimum limiting value. Figure 7 shows that with U0 increase, the value of t0c decreases. This decrease is due to the fact that with the growth of U0, q and j increase, which leads to a faster increase in the powder temperature. Thus, the required combustion temperature in the “C” zone and the concentration of methane in the combustion region are achieved faster. Curve 2, generalizing experimental data for t0c, has a quasi-linear form t0c = −kU0 (where parameter k is a function of both properties of boundary layers over the plate (Figure 1) and properties of methane hydrate powder.

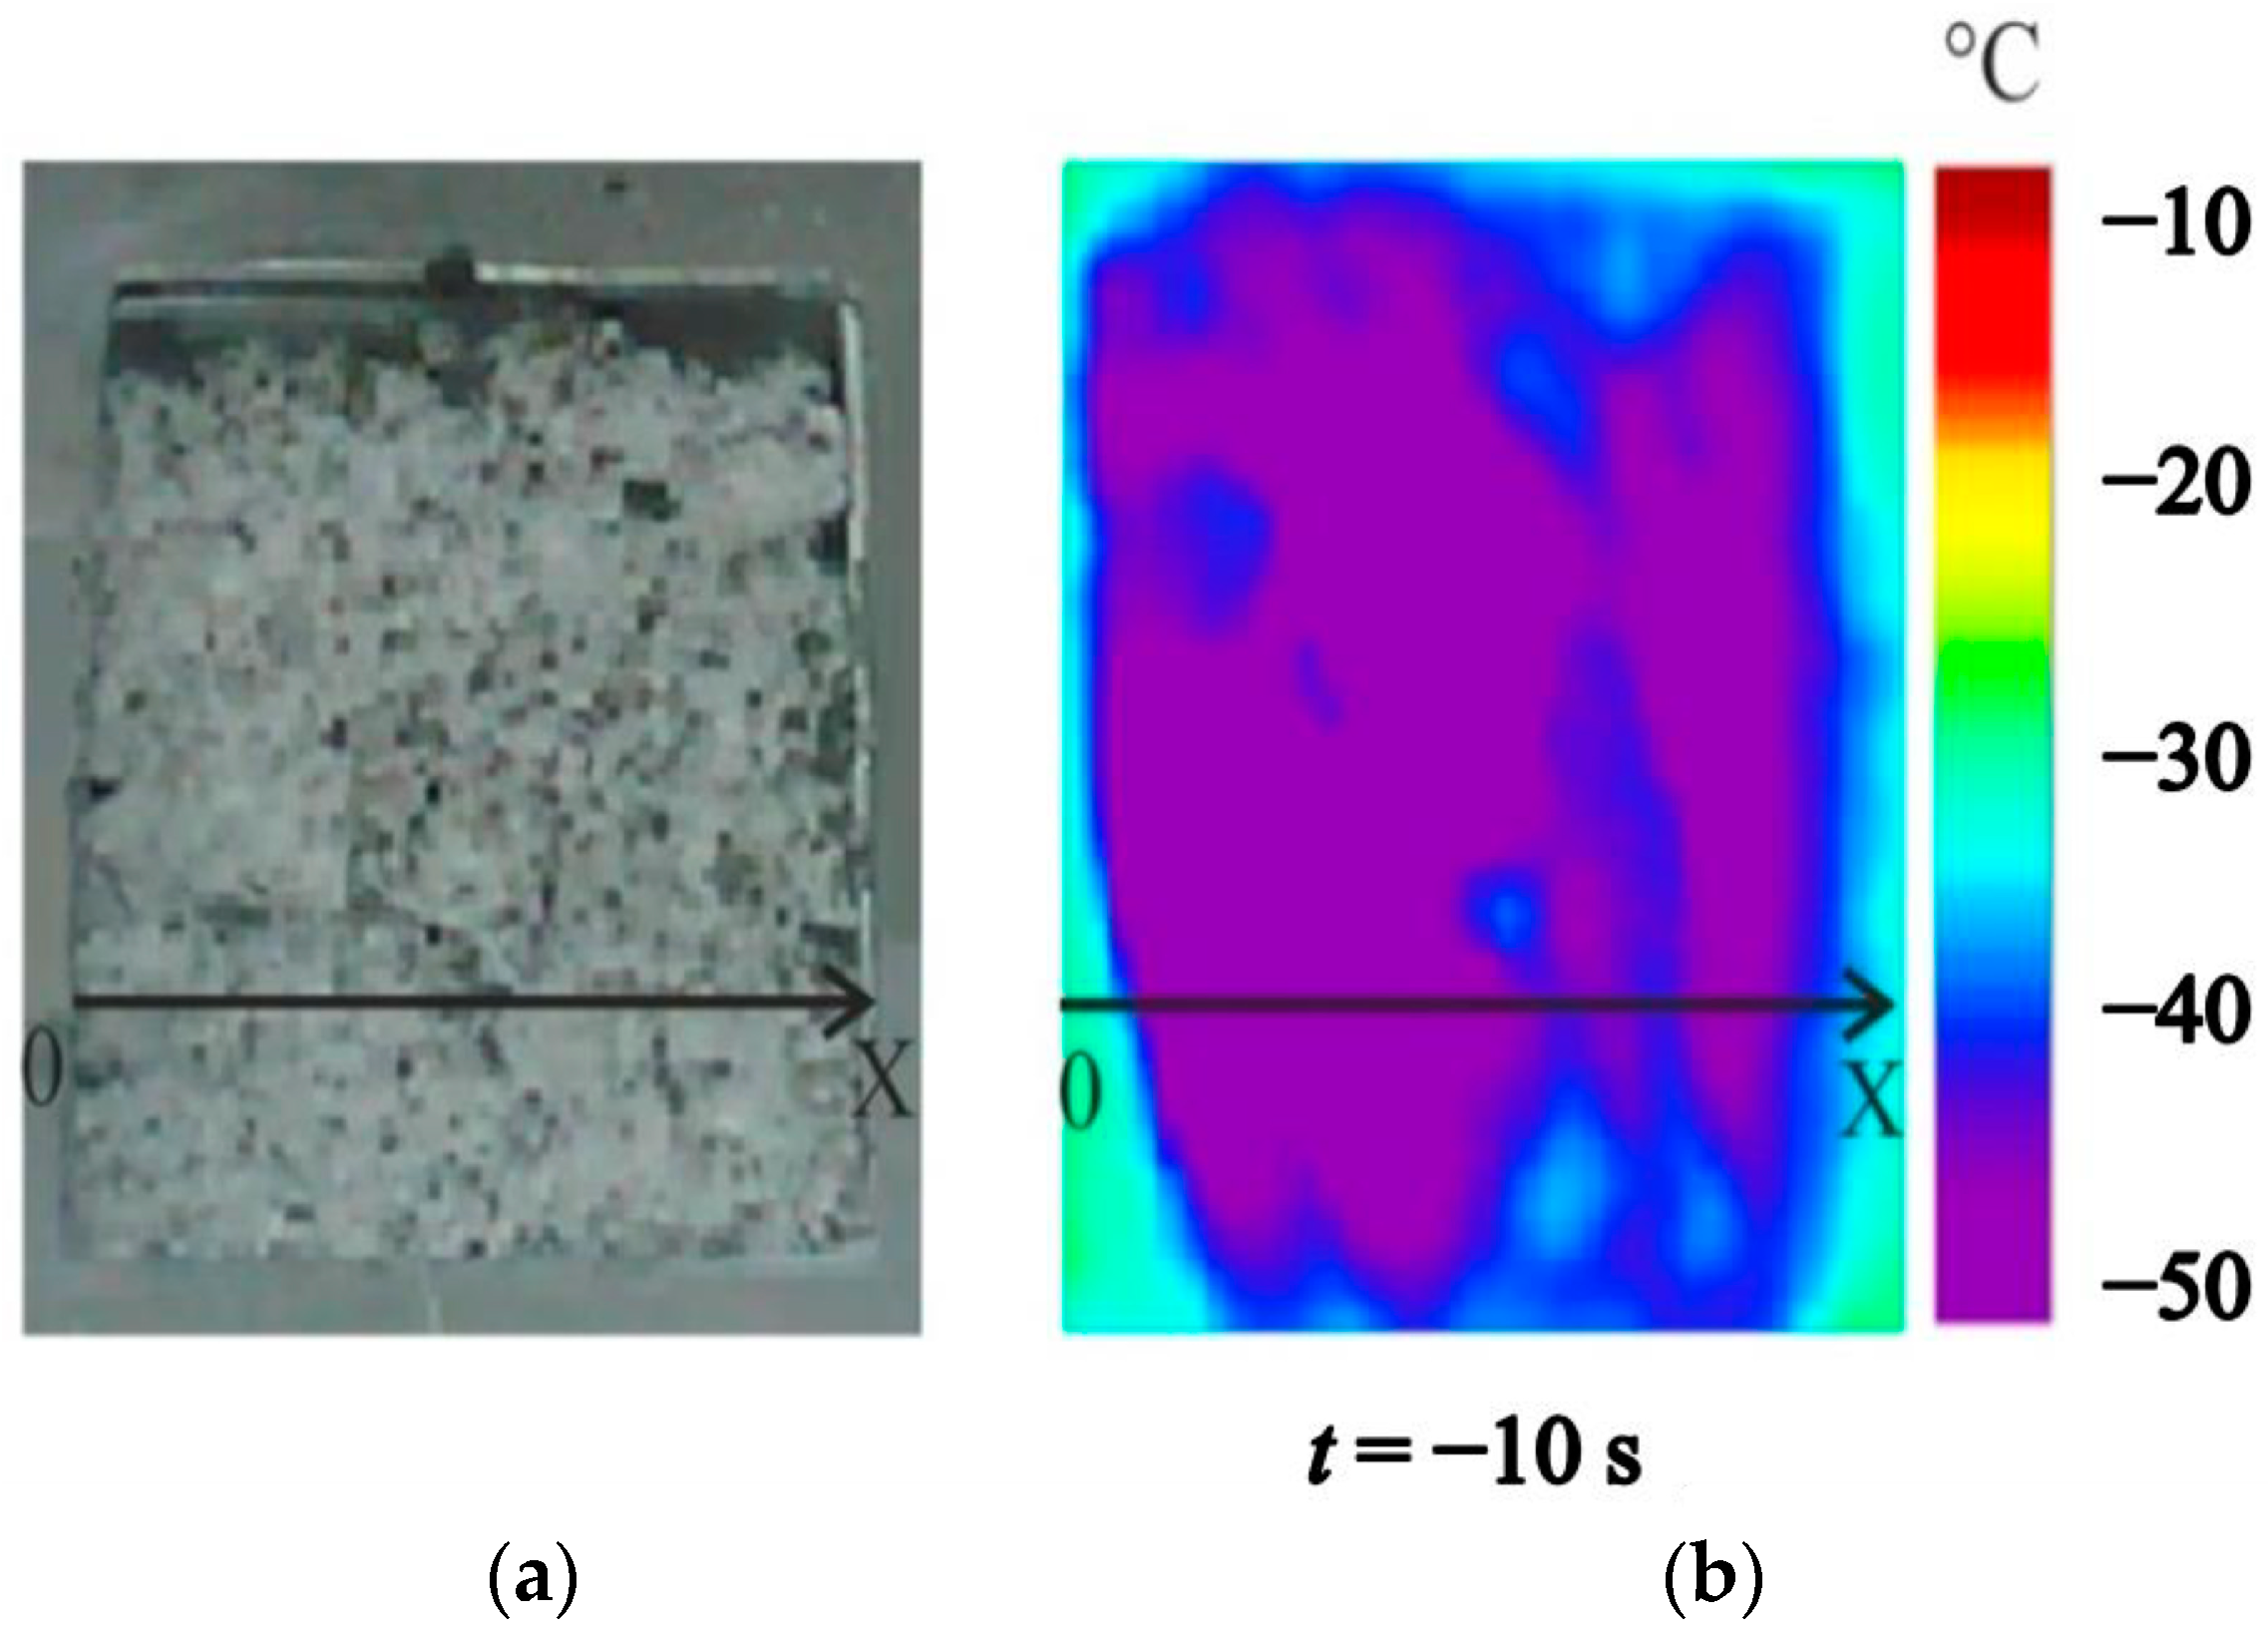
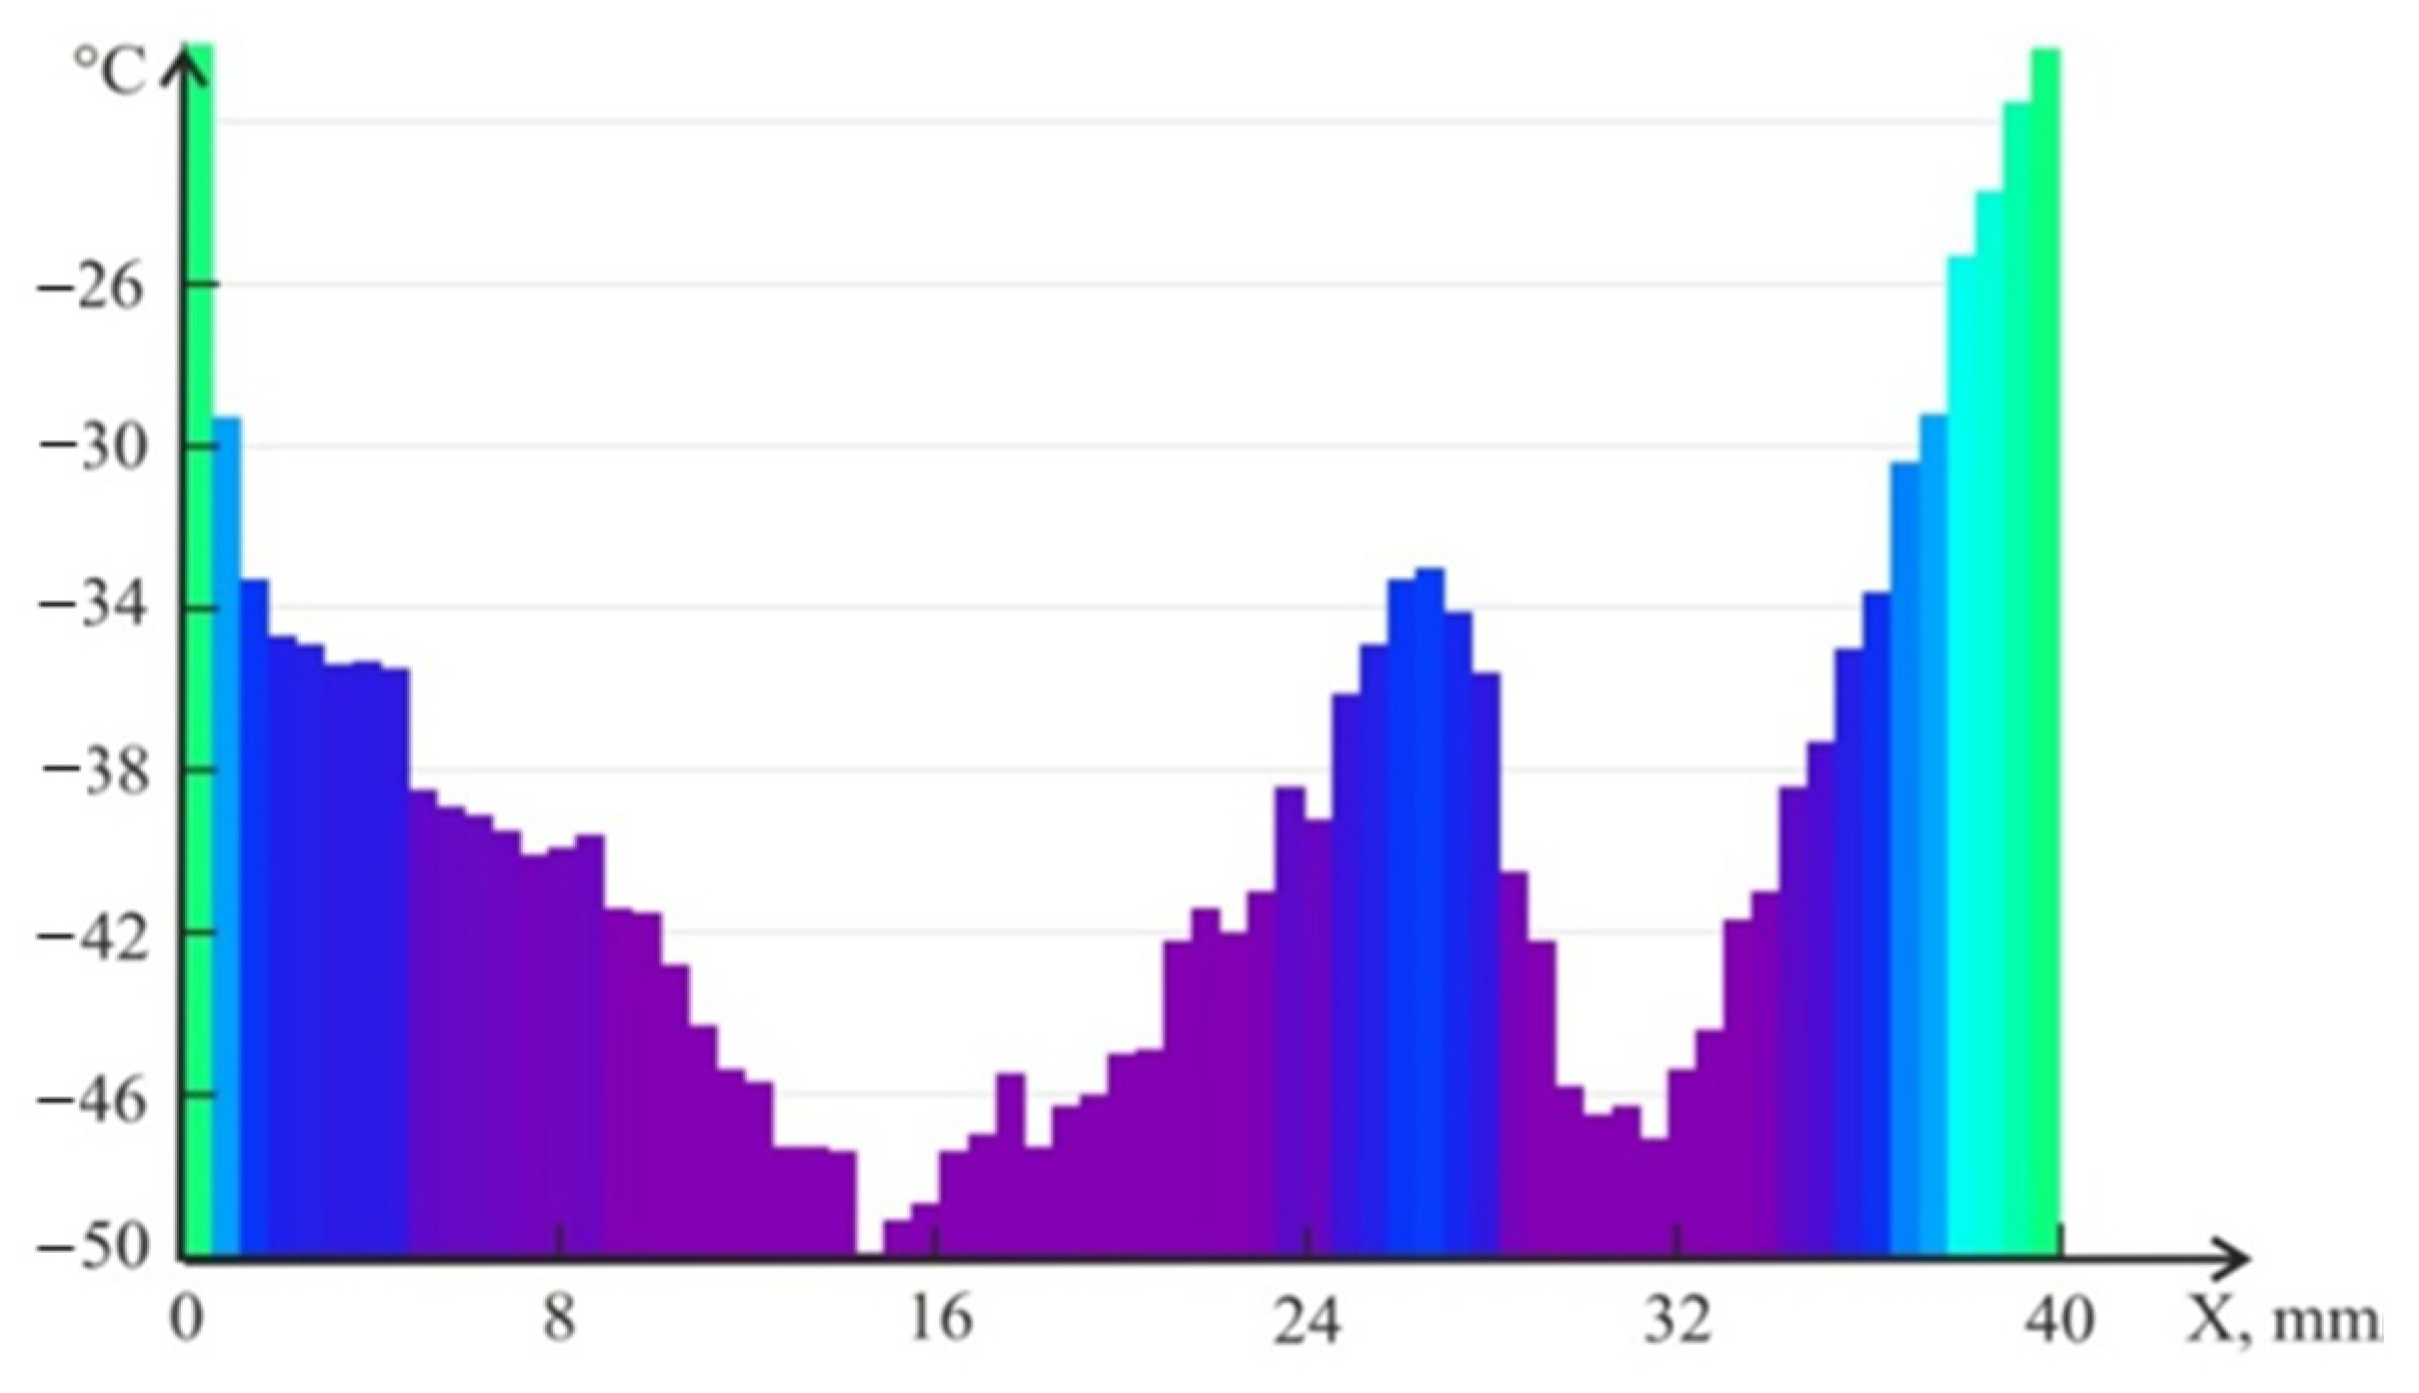
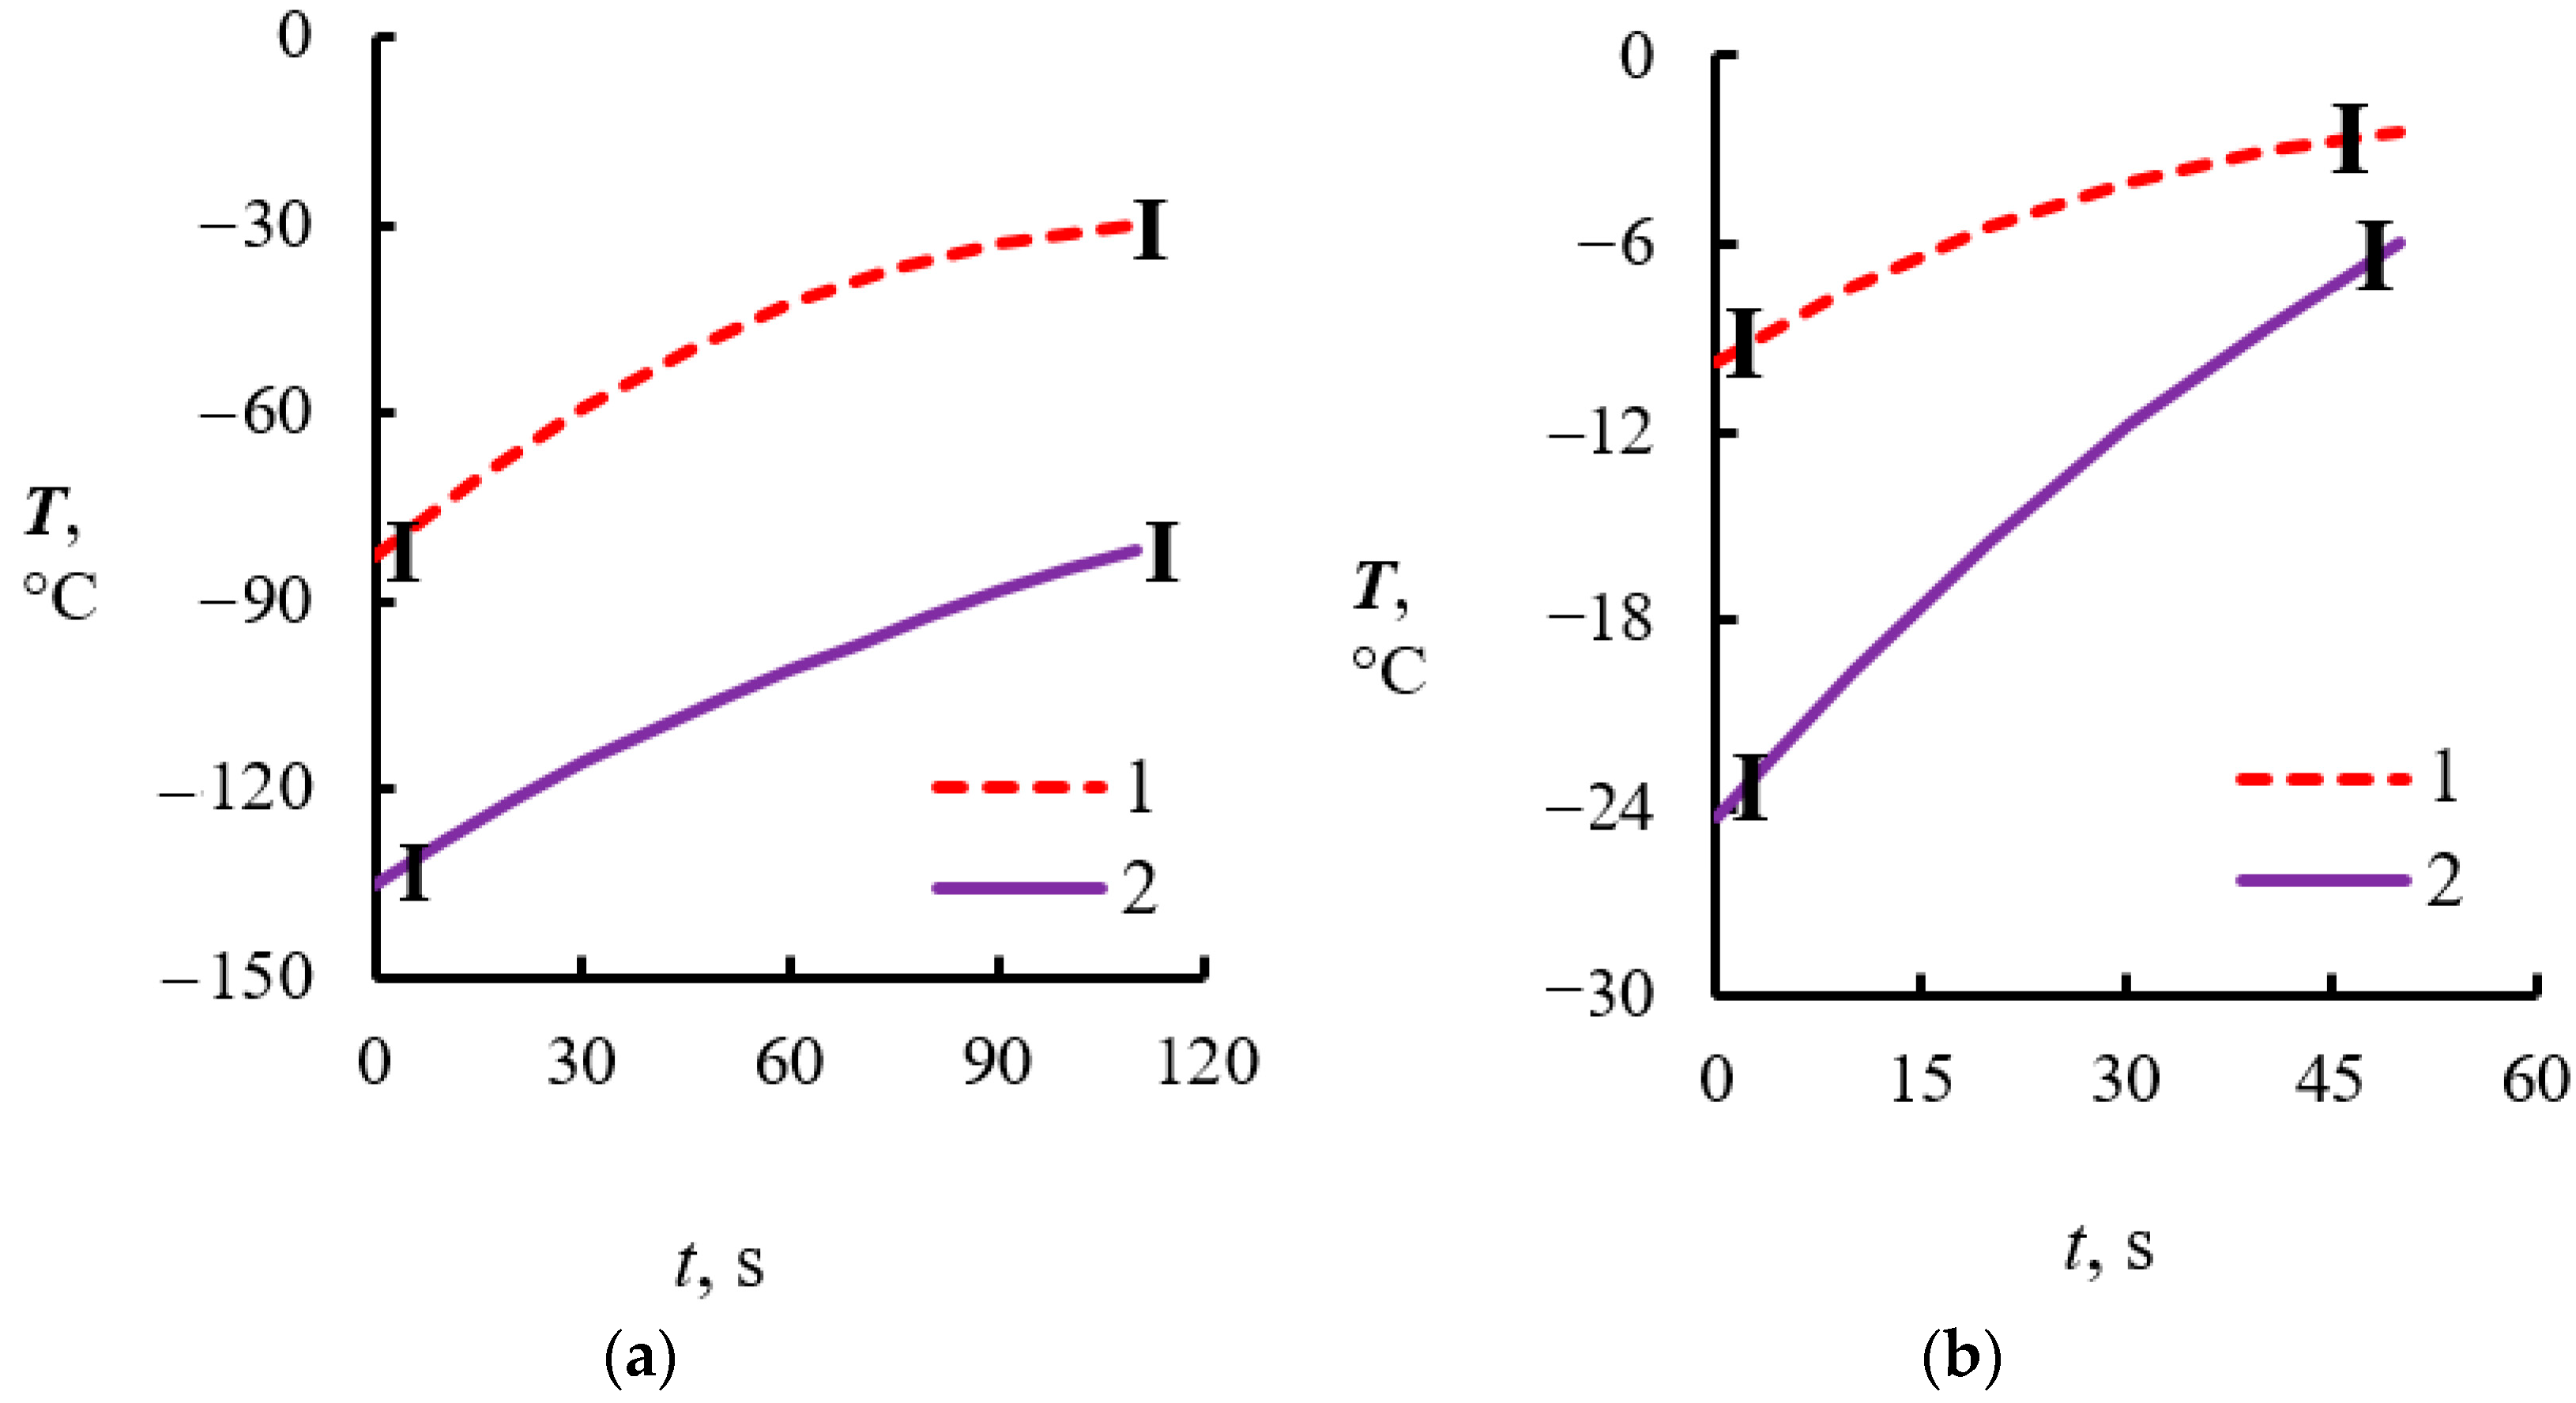
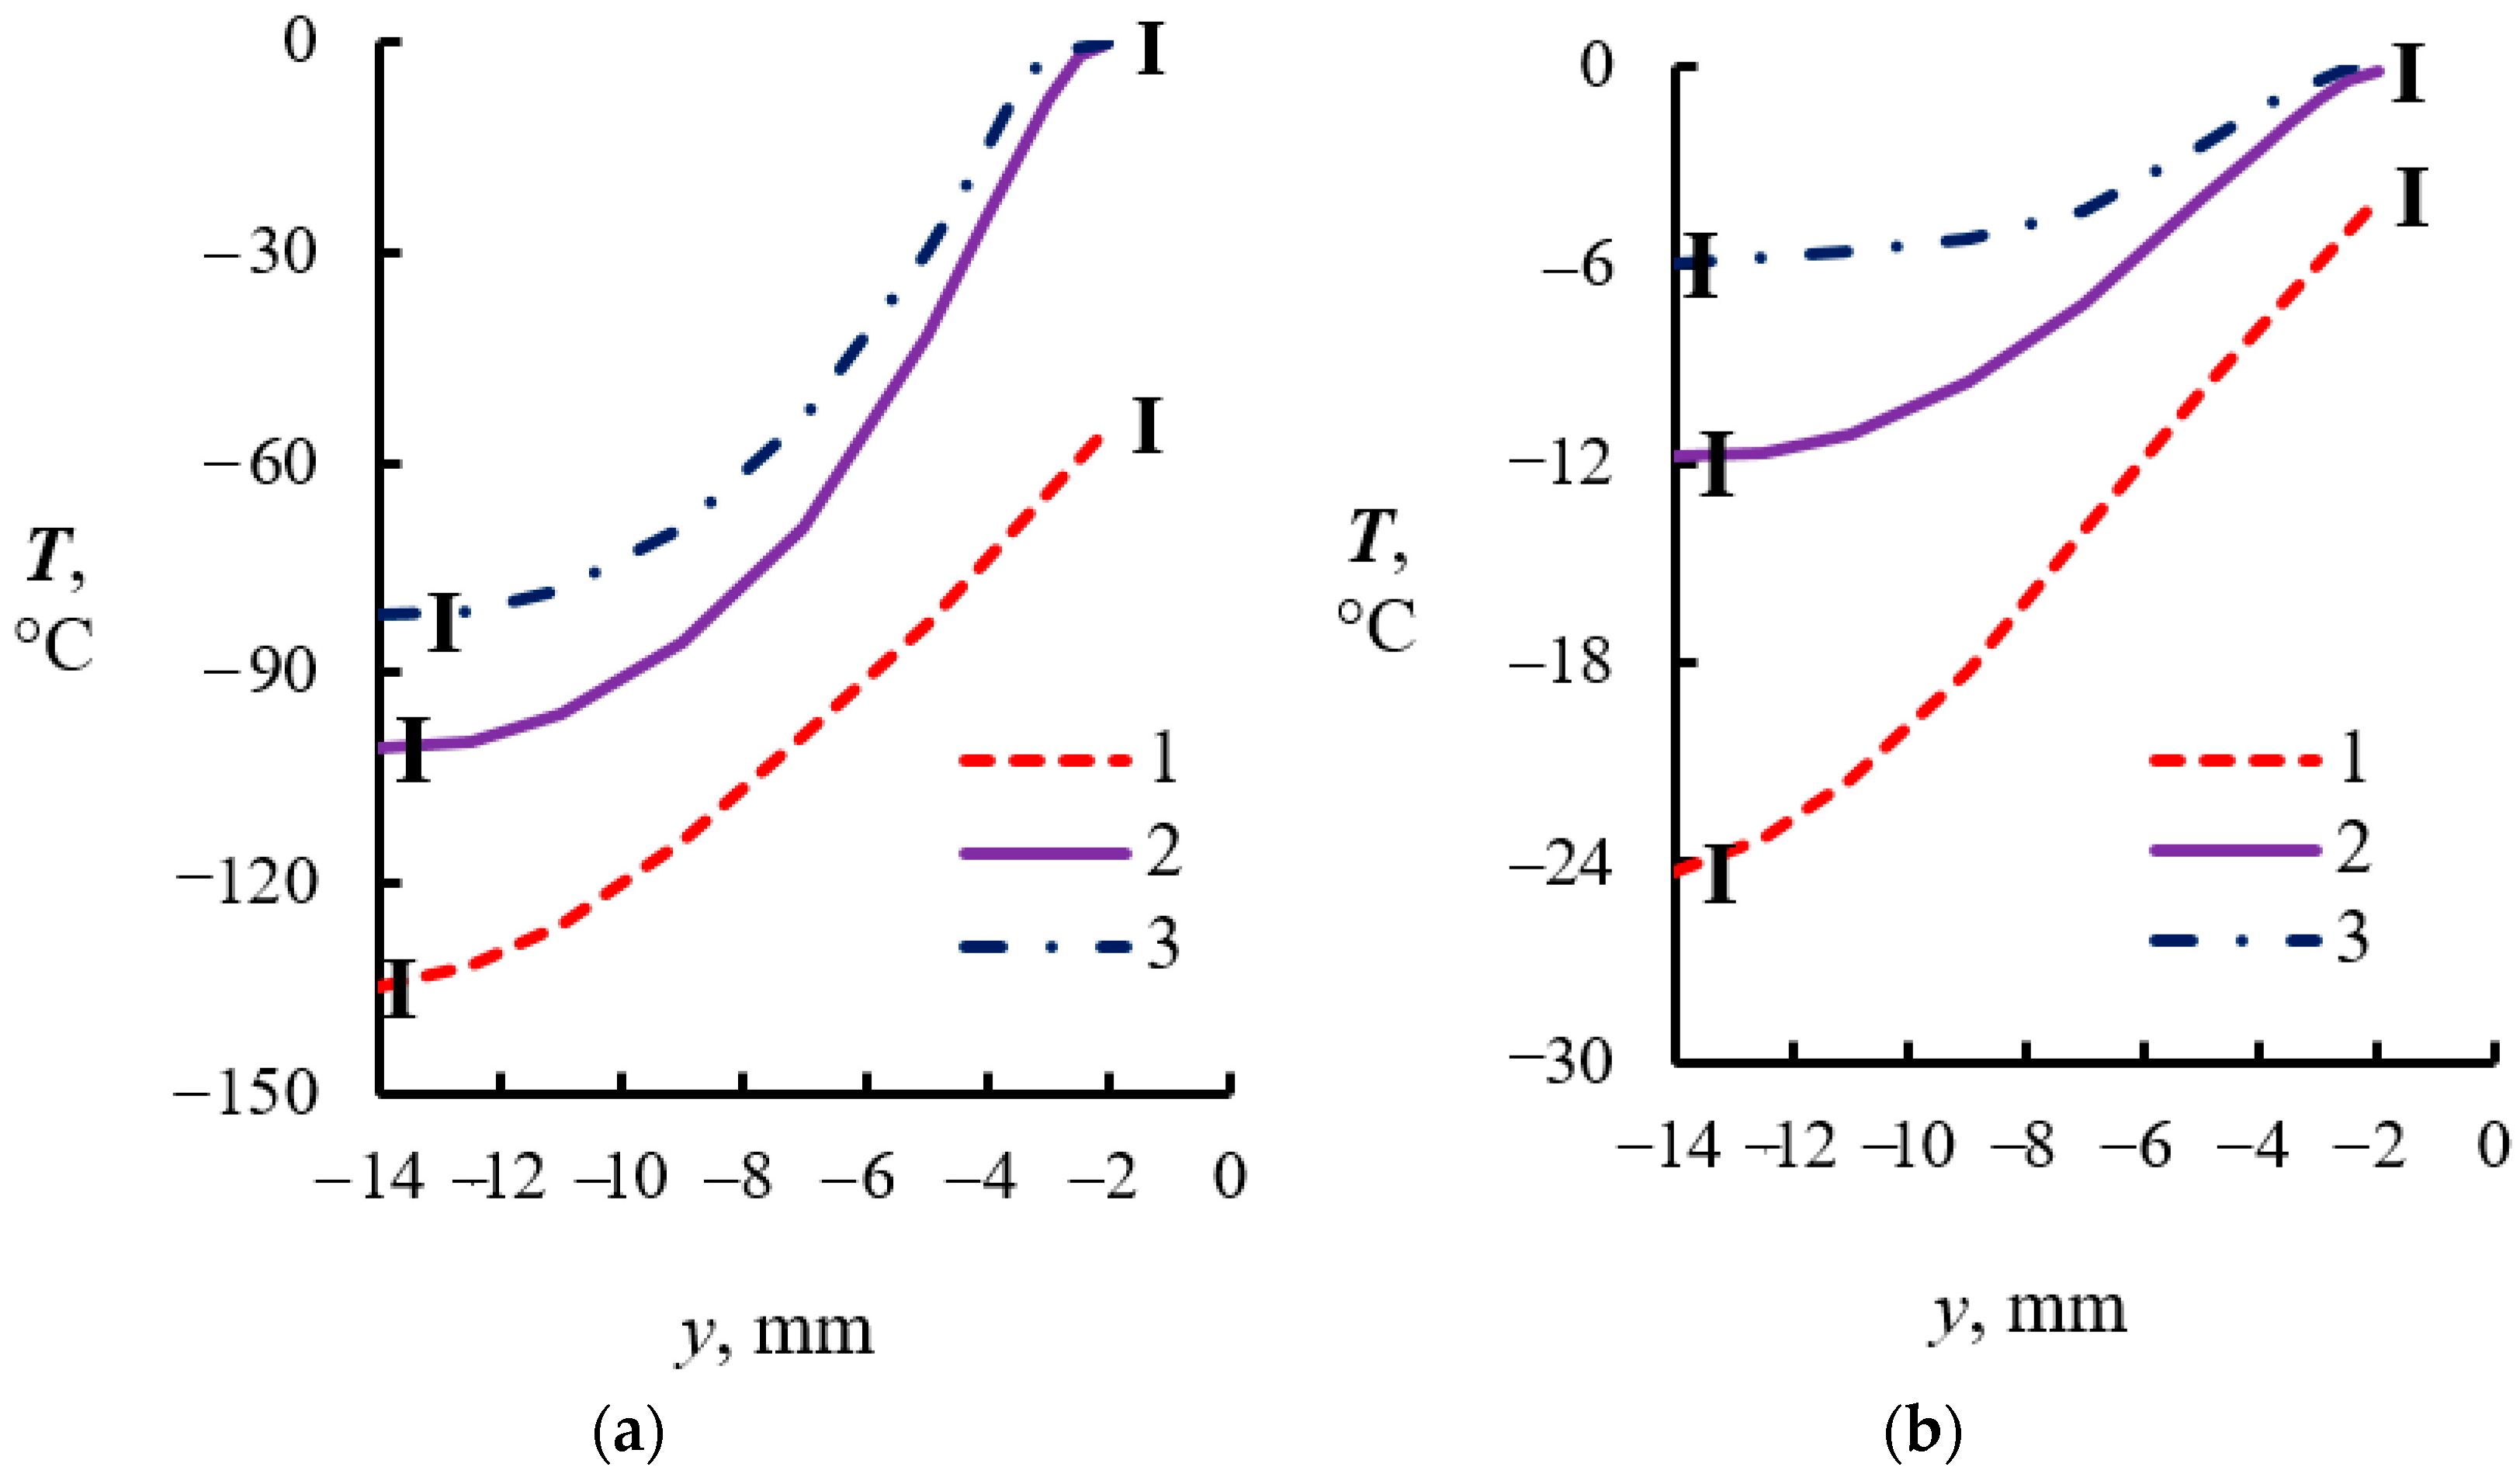
4.2. Temperature Measurements in the Powder Layer at Methane Hydrate Dissociation

Since the dissociation rate of methane hydrate and the reaction rate during combustion strongly depend on the temperature, it is important to know the temperature field for the entire volume of the powder for correct modeling.
The photo of the tank with the sample is shown in Figure 8a (top view). Figure 8b shows a thermal image of the powder surface 10 s before combustion. Time t = 0 s corresponds to the beginning of combustion of methane hydrate.
Figure 9 shows a graph of the sample surface temperature change along the longitudinal axis 0X, shown in Figure 8a,b. The maximum temperature of the sample corresponds to the side-walls of the tank (X = 0; 40 mm), which indicates that the heat flux from the walls cannot be neglected. Since burning begins near the wall (the location of the pilot burner can be seen in Figure 1), it is important to know not only the average volumetric temperature of the sample, but also the temperature near the pilot burner. In most experimental works only the temperatures on the tank axis are measured.
The temperature change of the powder is shown in Figure 10. Thermocouples were located on the tank axis (Figure 1). For thermocouple 1 y = 5 mm (the distance y is measured from the top powder surface, see Figure 1); curve 2 corresponds to y = 14 mm. Over time, the temperature increases continuously. It should be noted that the powder temperature should fall due to the methane hydrate dissociation and increase due to the heat flux from the walls of the tank (q1 and q2) (Figure 1) and from the ambient medium (q3 is heat flux to the top surface of the powder). Since temperature T increases for any moment t, it can be concluded that the heat of dissociation is much lower than the heat supplied to the sample from the ambient medium. Time t = 0 s corresponds to the beginning of combustion.
As can be seen from the graphs, for U0 = 0.5 m/s, the combustion starts when the temperature of the powder (for y = 5 mm) is approximately 70 °C higher than for the option with U0 = 0 m/s. This feature (the temperature of combustion onset) is obvious. With an increase in the external flow velocity, the concentration of methane in the combustion zone C (Figure 6) decreases and combustion occurs when the powder surface temperature and the temperature in the combustion region increases substantially. The occurrence of combustion depends on the concentration of the mixture components, and the temperature of the gas.
Figure 11 shows graphs of temperature distribution (on the tank axis) over the height of the powder layer during combustion of methane hydrate (y = 0 mm corresponds to the upper surface of the layer). Time t = 0 s corresponds to the beginning of combustion. As can be seen from the graphs, for the entire combustion period there are nonlinear curves for the temperature distribution that characterizes the non-stationary character of the heat equation inside the thick layer. This non-stationary character is already available for the distance y > 3–5 mm. For smaller values of y (1 mm < y < 2 mm), the temperature for a few seconds approaches 0 °C and then remains constant due to the ice crust melting on the surface of the granules, i.e., only for the uppermost layer (small height y) a stationary approximation may be considered. However, for dissociation, despite T = const, the flow of methane j in the near-surface region will decrease due to the curvature of the granules [21], i.e., the diffusion problem must be solved in a non-stationary form even under quasi-isothermal conditions.
The above diagrams show the uneven nature of temperature, and accordingly, of the methane hydrate dissociation throughout the powder volume. As a result, most of the burning time is characterized by changing flame height as well as by “effective area” of combustion on the layer surface, which is clearly seen from Figure 12. Features of inhomogeneous combustion are considered in the following paragraph.

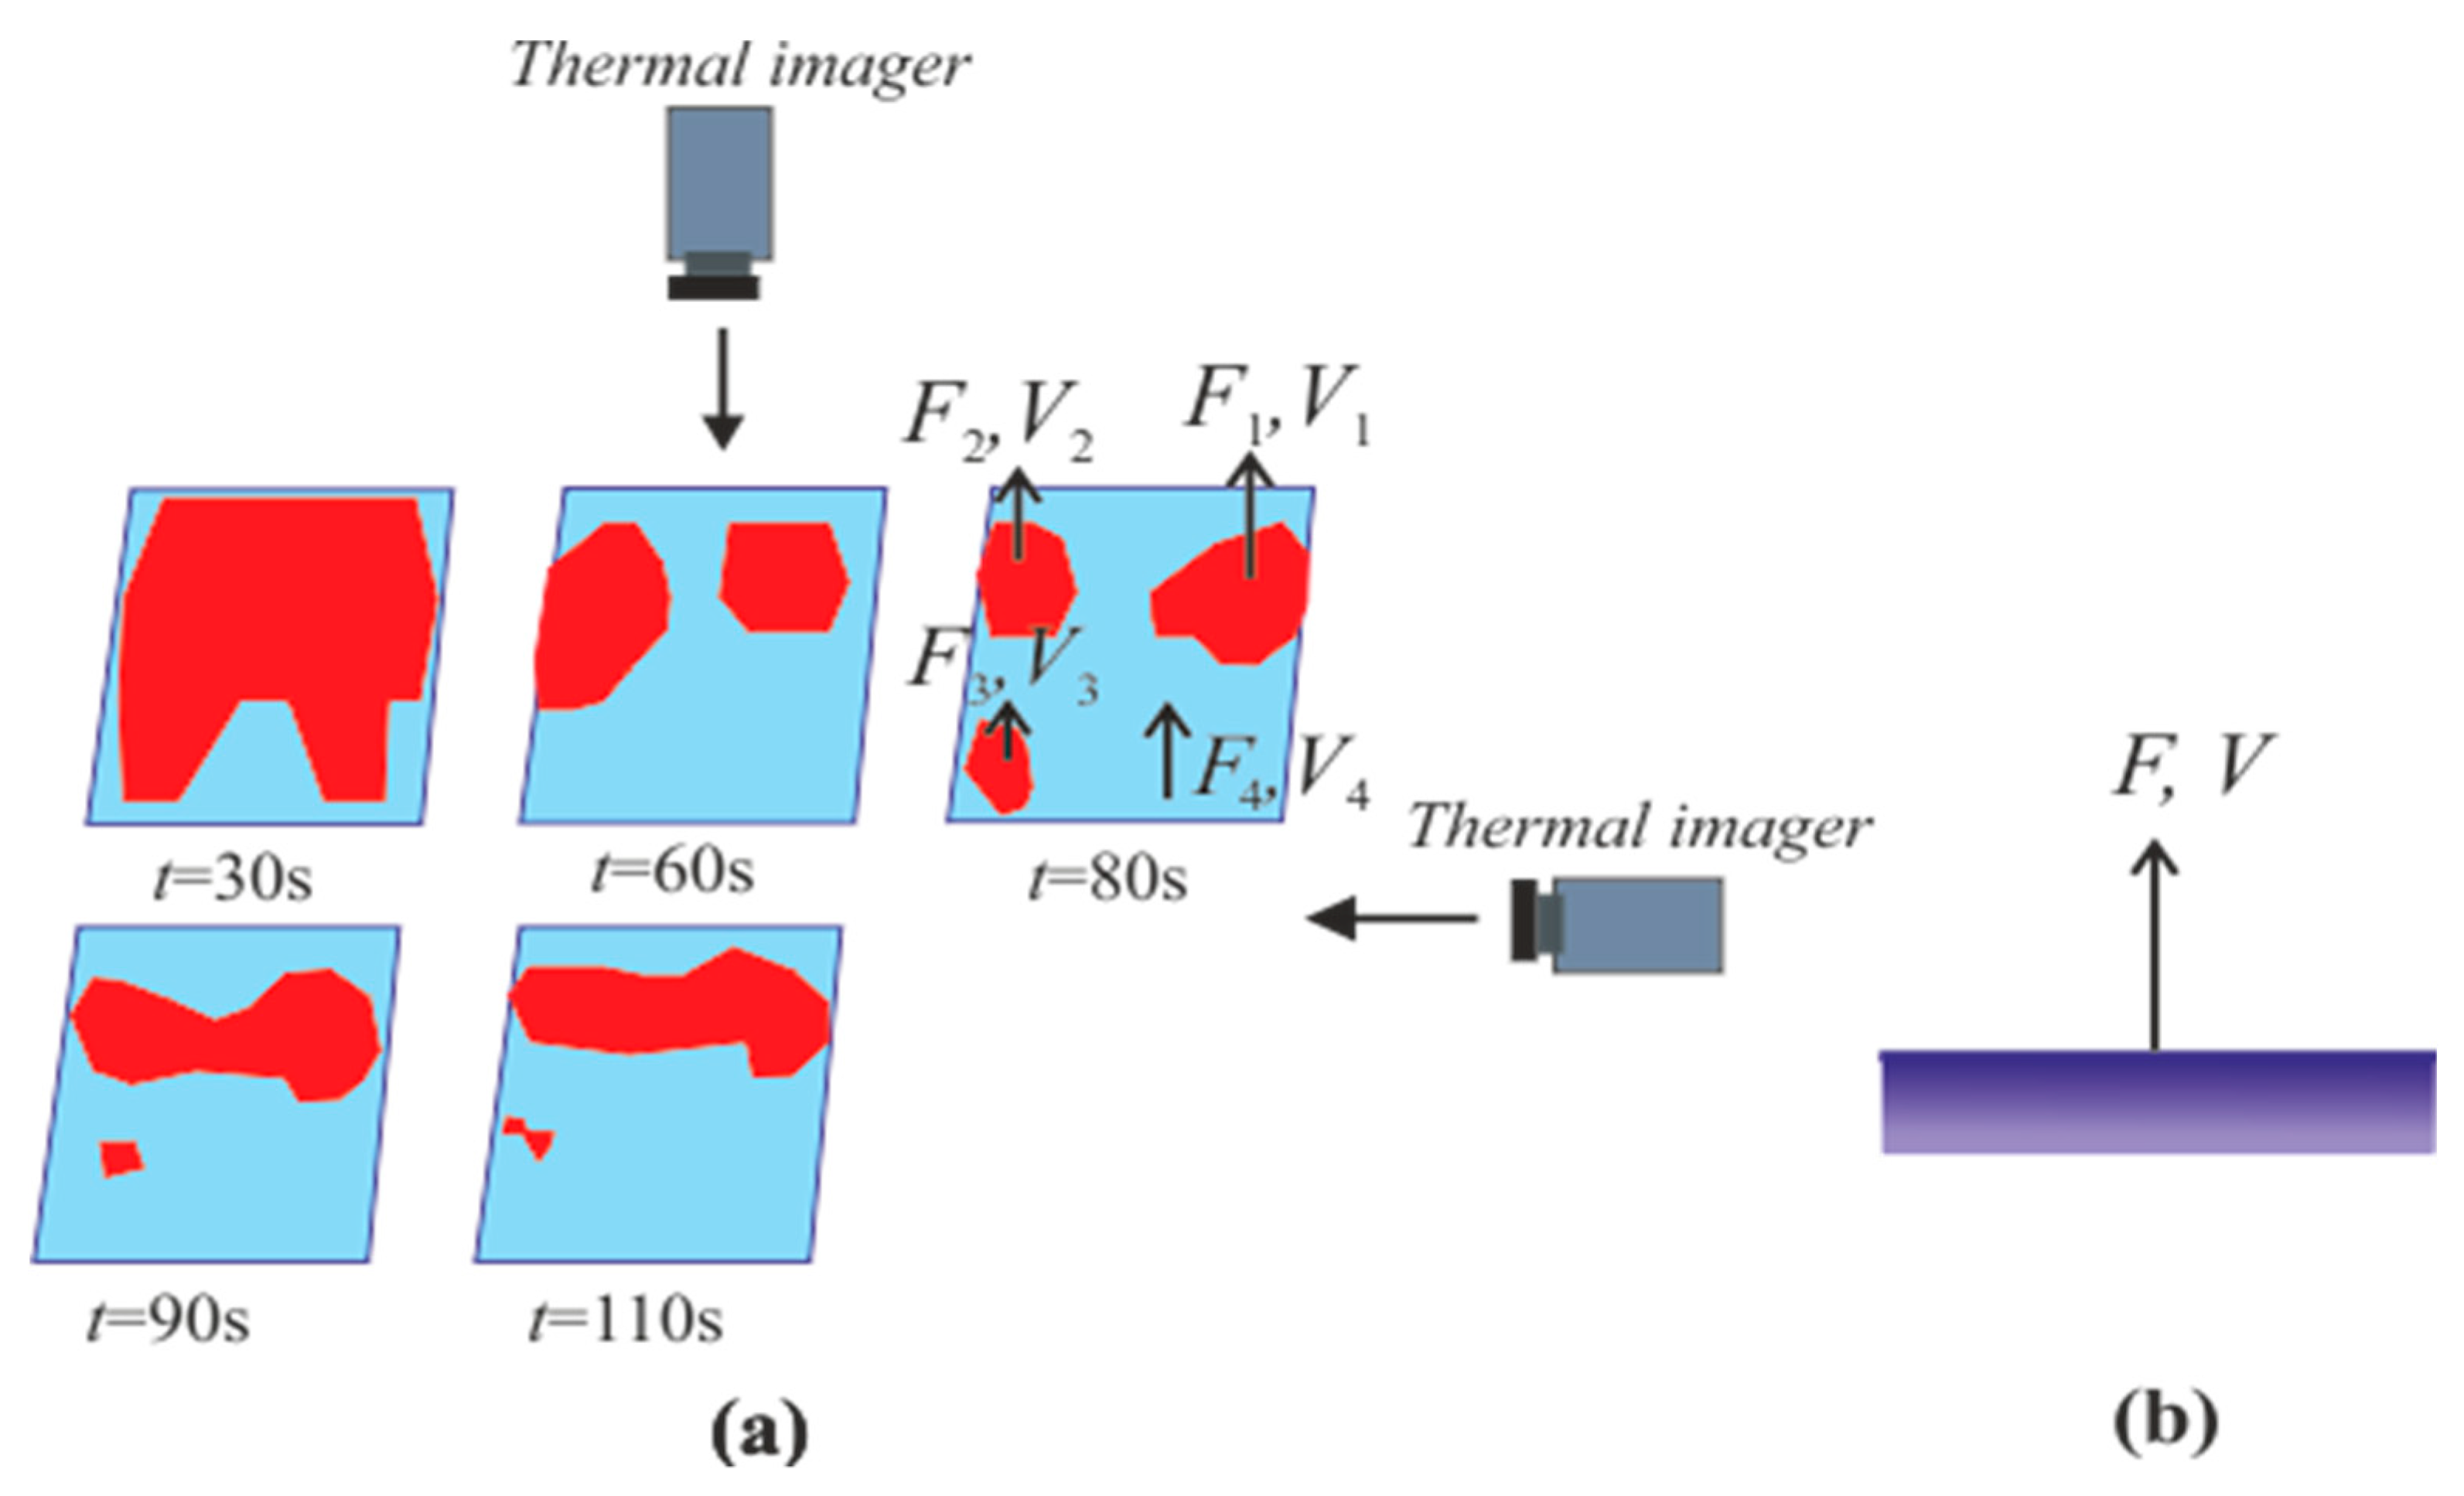
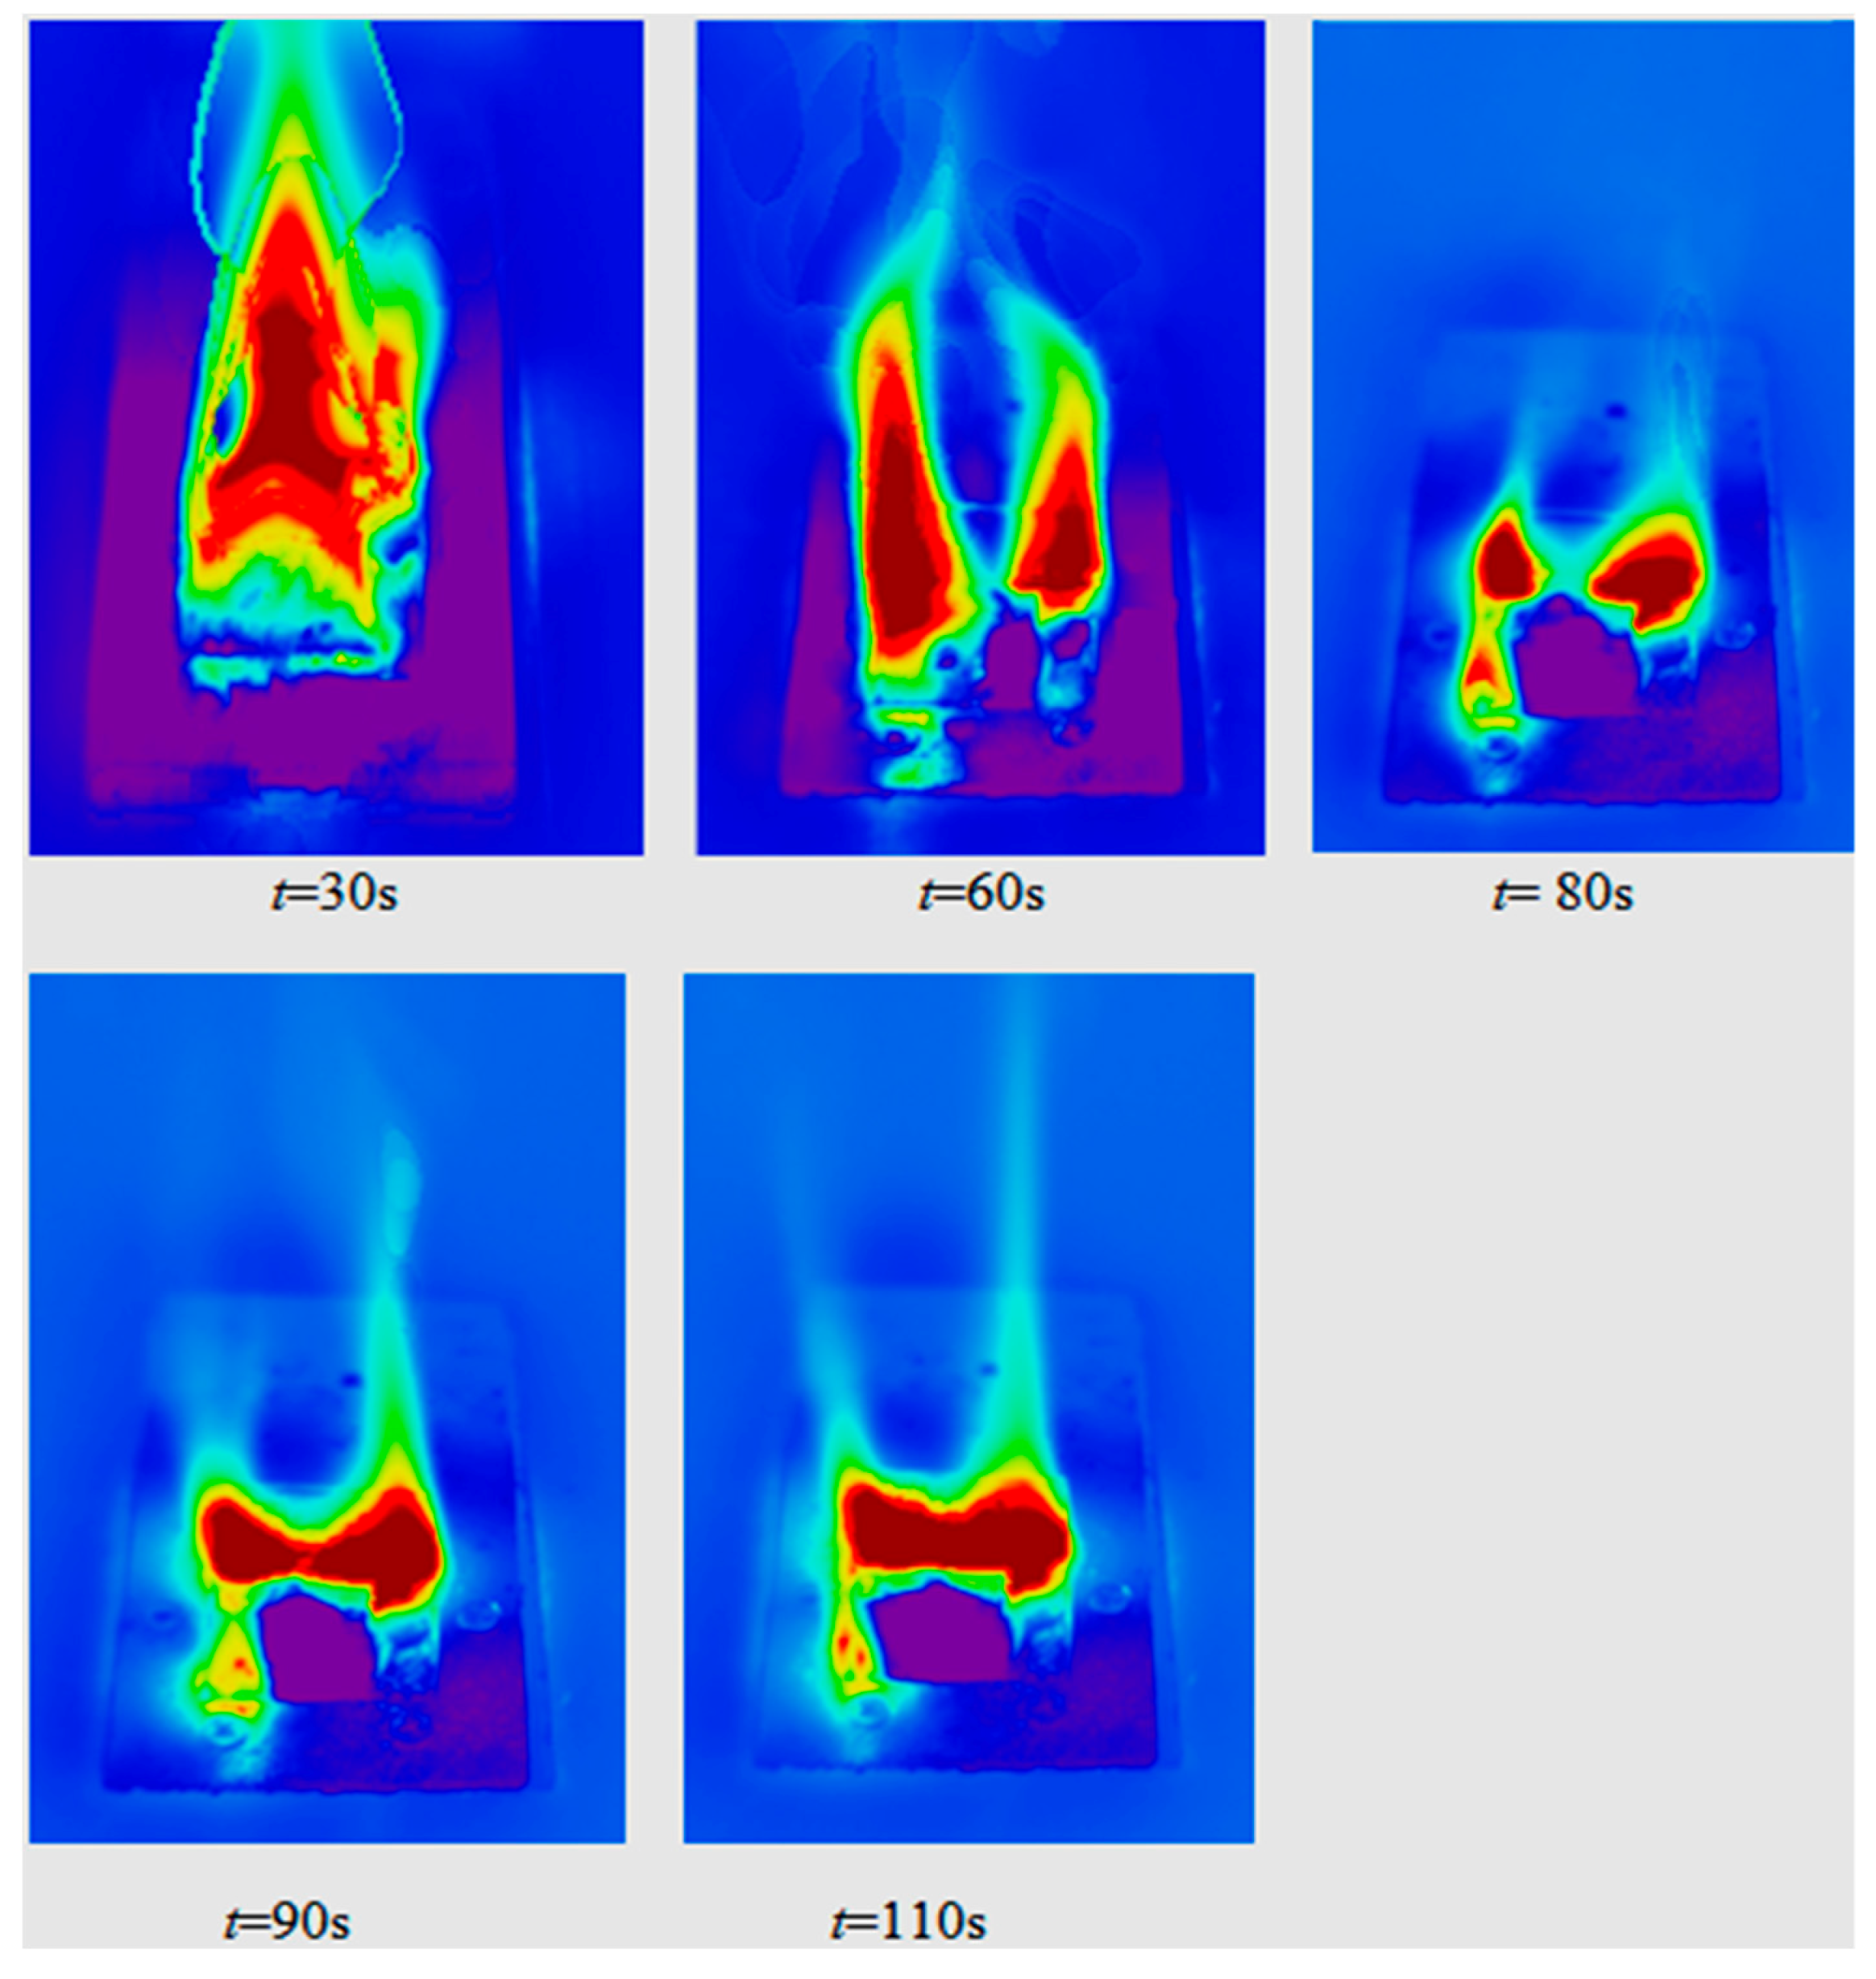
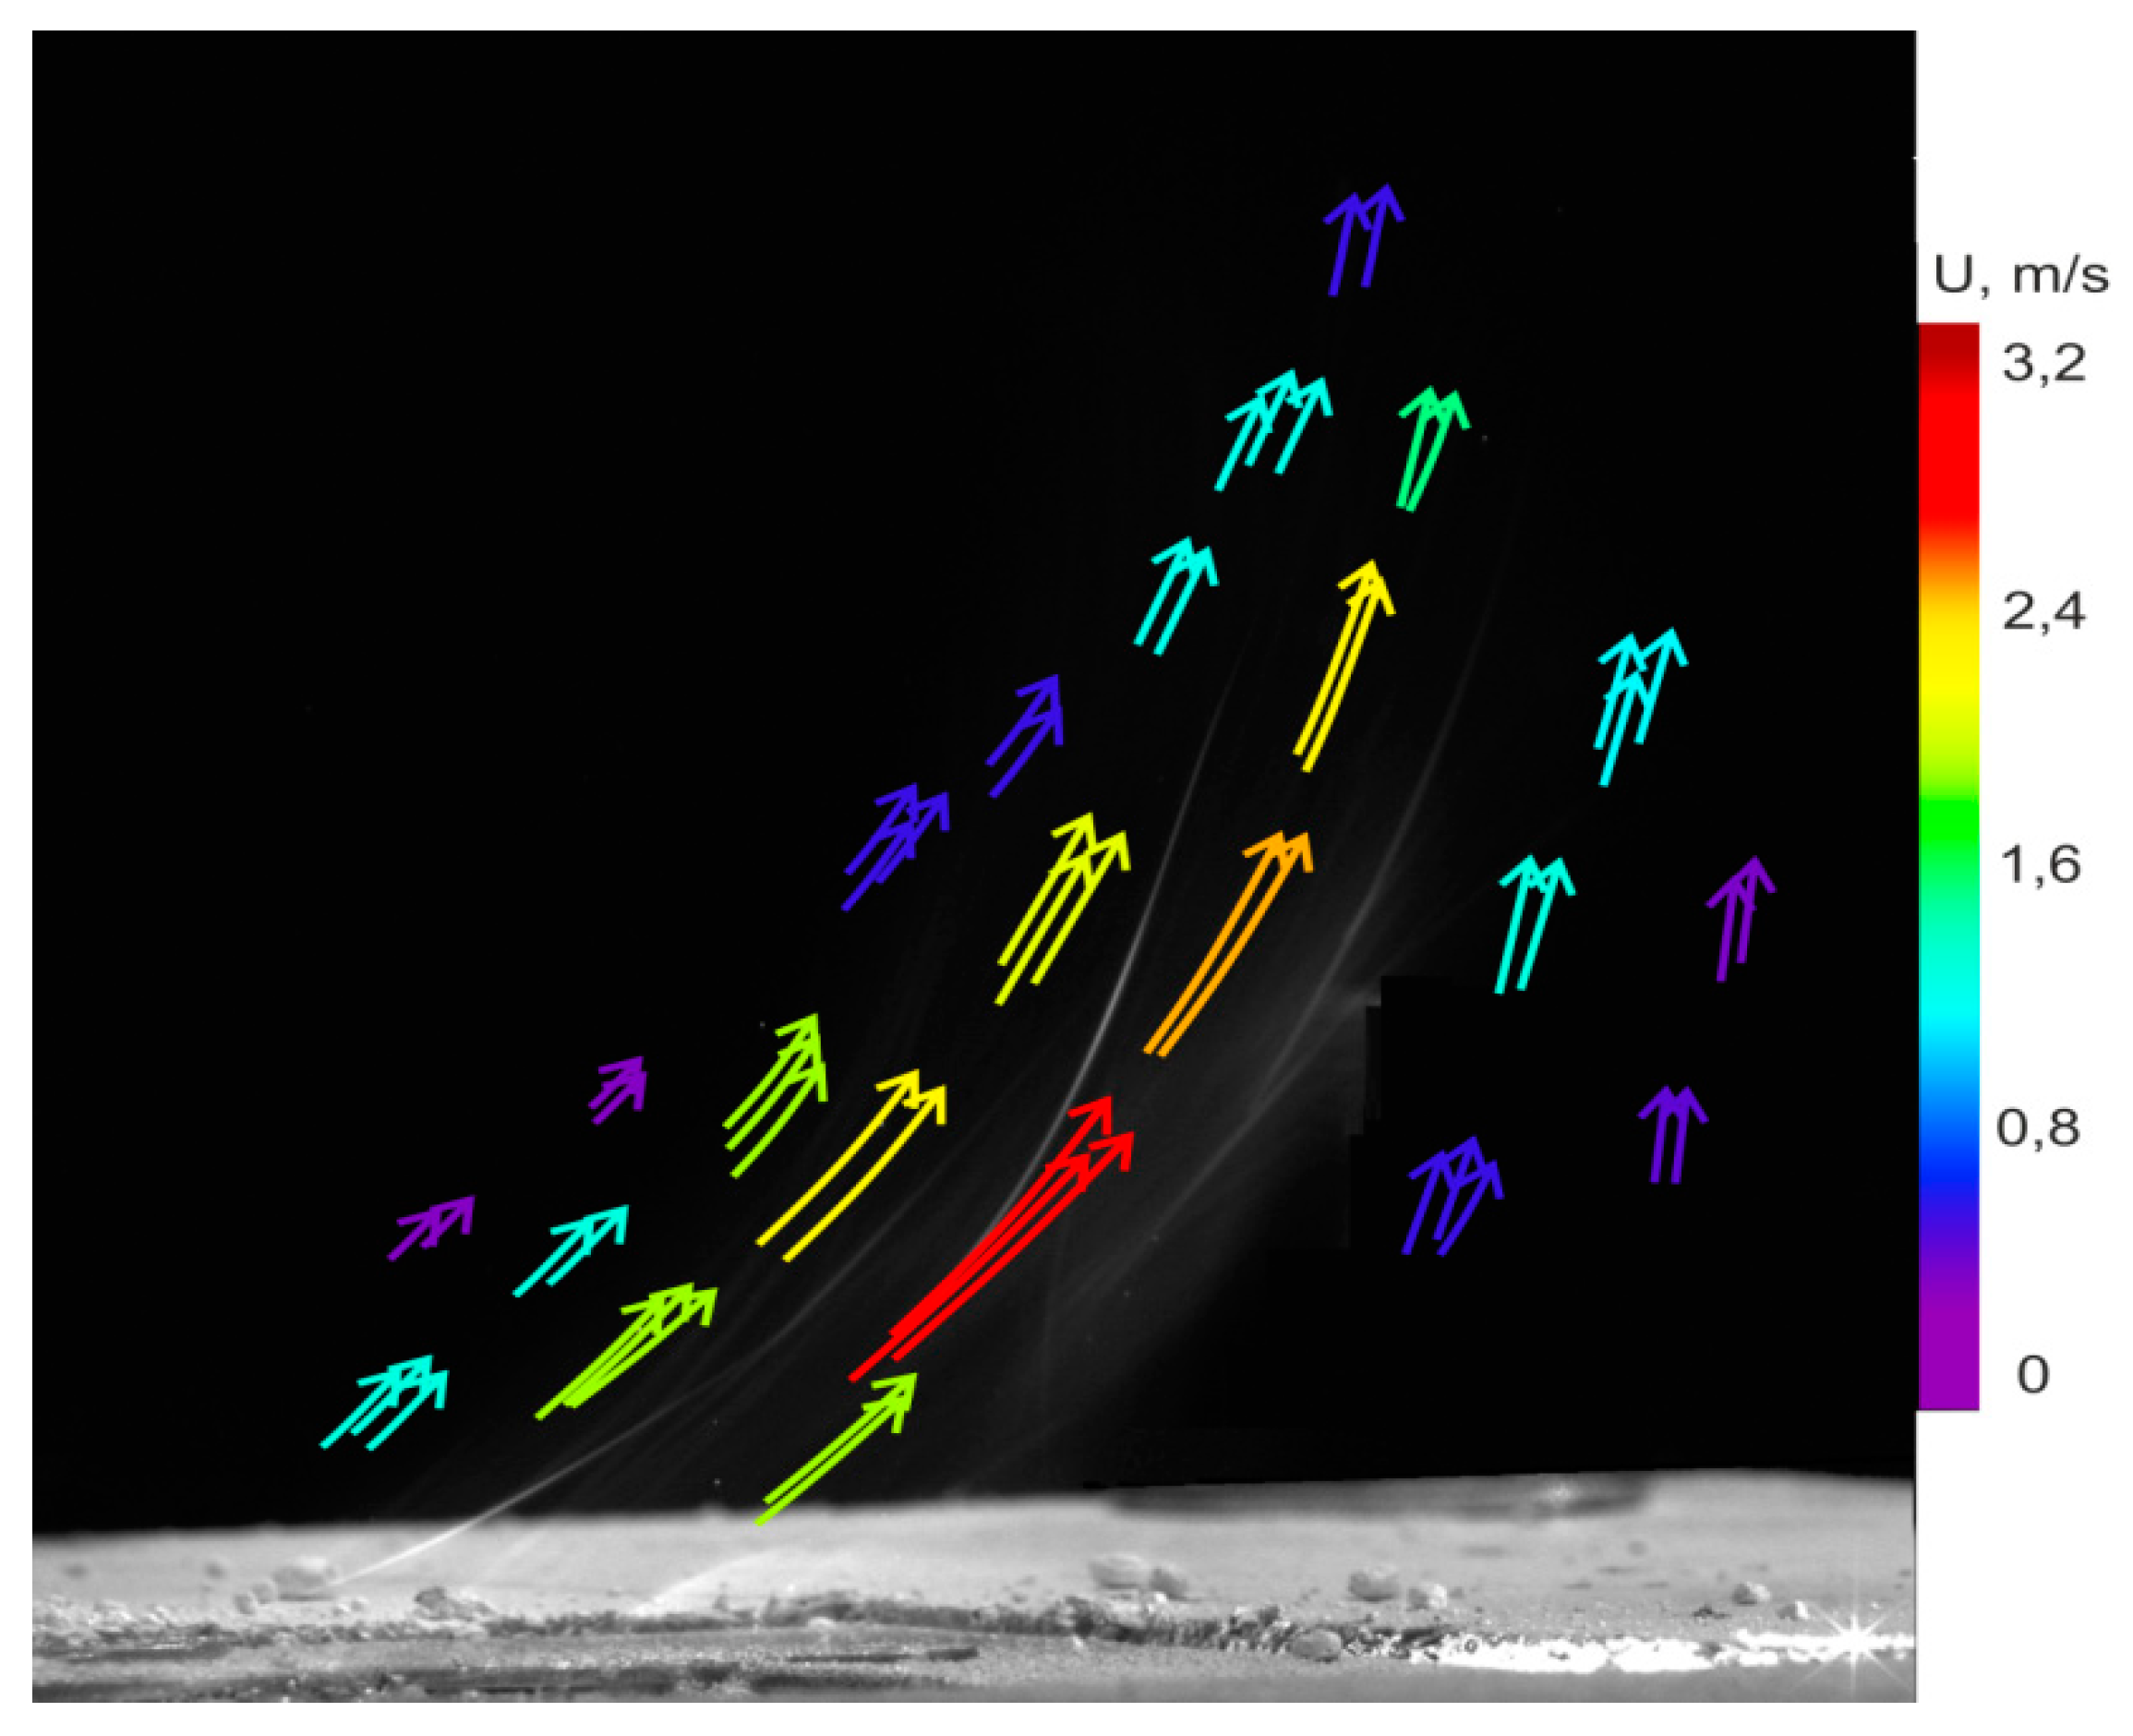
4.3. Heterogeneous Character of Methane Hydrate Combustion, Velocity Field at Combustion

When calculating the flow of methane only the full surface of the layer is always taken into account. The average velocity of methane V, directed perpendicular to the layer surface (Figure 13b) is defined as V = ∆m/(ρFt), where m is the mass of methane released, F is layer surface area. The mass can be measured both by weight and volume method and reflects only the average specific flow of methane. Figure 13 shows the “effective area” of combustion based on Figure 12. Only the surface areas of the layer above which methane is burning are highlighted in red. Thus, for t = 80 s there are three characteristic areas (F1, F2, and F3) and three characteristic velocities (V1, V2, and V3). “Effective areas (Fef)” are determined by imaging using two thermal imagers, located in the direction of two perpendicular axes (Figure 13a). It is extremely difficult to experimentally determine the local velocities of methane Vef over these Fef areas and it is the subject of further research. PIV and PTV methods can be used for these purposes.
It should be noted that F > Fef = F1 + F2 + F3, and V > Vef = V1 + V2 + V3 (V = V1 + V2 + V3 + V4), where V4 corresponds to the surface F4, over which there is no combustion. Not all methane (V4) from the surface (F4) enters the combustion region, but only part of it. Therefore, over the powder surface there is always a local uneven flow of methane and uneven local concentration of methane in the field of burning. The changes in local concentrations of methane and buoyancy effect will lead to unstable combustion. This unstable combustion is clearly seen in Figure 12.
Figure 1 and Figure 6 show schematic images of the dynamic (δd) and diffusion layer (δm) development. The laminar velocity profile is considered in the numerical calculation of combustion. However, this type of profile is valid only for very low rates of injection and with disregard for free convection. The blowing parameter can be estimated as b = 3ρCH4VCH4(Rex)0.5/(ρ0U0) = 0.2. This value is much lower than the critical bcr = 1.86 [41,42,43,44], which corresponds to the separation of the wall layer. Thus, the injected methane from the powder can only partially deform the dynamic layer of air. In the presence of combustion, a significant impact on the development of profiles is exerted by buoyancy (density gradient due to temperature difference.) The estimation by the approximate formula shows that the velocity value for free convection in the combustion region is approximately 2–4 m/s. Figure 14 presents the velocity field in the combustion region using the PTV method at an external flow rate U0 = 0.5 m/s.
The maximum gas velocity in the combustion zone is approximately equal to Uc = 3.5 m/s. Average velocity of methane injection, defined by the entire surface area F, equals 8.4 mm/s. Thus, the injected gas has little effect on the velocity profile of the dynamic boundary layer (3500 mm/s/8.4 mm/s = 417). The obtained velocity value before burning (0.8 mm/s) closely corresponds to the experimental value of maximum methane velocity of 0.6–0.7 mm/s (without combustion) in Reference [31]. The close agreement of the velocities suggests that combustion in the presented experiments began when the average volumetric temperature of the powder corresponded to the maximum dissociation rate, i.e., the volume of local regions of partial self-preservation was minimal. The specified velocity (0.7–0.8 mm/s) provided the high flame spread speed above the powder surface, which was close to the velocity in Reference [31] (about 1 m/s).
The ratio of the maximum convection velocity to the velocity of the external air flow (Uconv/U0) is equal to seven. Considering that the diffusion layer is inside the dynamic one (Uconv/U0m) (Figure 6), this ratio will be higher (about 10). In accordance with the directions of the velocity lines and the value of velocity in Figure 14 it can be concluded that buoyancy plays a predominant role in the formation of the velocity field and the type of flow will be fundamentally different from Figure 1 and Figure 6, which are usually taken for modeling. In addition, it is incorrect to take into account only buoyancy, since the lines of the velocity direction significantly deviate in the direction of the velocity U0. Even low external flow velocities U0 significantly effect the flow formation at combustion over the methane hydrate layer, and accordingly, the distribution of methane concentrations in the diffusion layer.

5. Conclusions

In this paper, the temperature characteristics inside the powder layer at methane hydrate dissociation and in the presence of the released methane combustion on the powder surface have been experimentally studied. The experiments were carried out at different velocities of the external air-flow from 0 to 0.6 m/s, when there was a laminar flow at the inlet to the working area with the sample. The temperature of the powder during the experiment increased from the temperature of liquid nitrogen to 0 °C due to heat supply from the ambient medium. Measurements were carried out using the weight method, thermal imaging and PTV methods, as well as a high-speed camera.
During combustion, the transverse temperature profile in the powder layer was nonlinear for the most part of the layer height and only in a narrow region (at a depth of about 1 mm from the top surface of the layer) where the powder temperature was quasi-static. Thus, a small granule and a thin layer modeling is possible in the form of a stationary heat equation, and for a thick layer, the non-stationary term cannot be neglected.
Measuring the temperature field of the powder using a thermal imager has shown that there is a highly uneven temperature field on the surface of the layer. The maximum temperature always corresponds to the powder near the side-walls, which is more than 10 °C higher than the average temperature in the layer. Thus, it is incorrect to carry out measurements only on the axial line of the layer, as it is done in most works. The heat flux from the side-walls is higher than for the upper surface of the powder without combustion.
Thermal imaging measurements have revealed the heterogeneous nature of combustion, when only a partial area of the layer is effective over the surface of the powder (combustion is realized above it). Over the rest of the layer surface, the powder temperature is much lower. Thus, simulating combustion on the average rate of methane release is incorrect, since the rate of methane release above the surface layer varies considerably along the surface. As a result, the combustion temperature will be different, i.e., have a non-uniform character, which will lead to non-stationary and non-uniform combustion.
Measurements of the velocity field using the PTV method have shown that the maximum gas velocity in the field of combustion exceeds 3 m/s. To perform stoichiometric ratios, given the methane velocity and oxygen concentration in the air, the velocity of about 0.1–0.2 mm/s is required. In accordance with the foregoing, the excess of oxidizer over the fuel leads to a more than ten-fold violation of the stoichiometric ratio. It is obvious that such a high velocity can be achieved only due to the increased inflow of external air. The methane velocity cannot increase tenfold due to the limited gas diffusion through the pores of methane hydrate granules (diffusion resistance of pores in the formed ice crust). Thus, free convection during combustion leads to a significant excess of the oxidant in the combustion zone, and it is surprising that this air excess results in high velocities of the flame spread speed above the powder surface, which was close to the velocity in Reference [31] (about 1 m/s). For correct modeling, it is necessary to take the real velocity profile rather than the laminar one, but taking into account free convection.
Despite that the velocity profile in the combustion region is formed mainly due to free convection, it is also necessary to take into account the external flow of the forced gas U0. Even at low velocities U0, the velocity direction lines are significantly deviated by the forced air-flow.

Author Contributions

M.S.Y., V.I.S., M.V.S., and Y.O.S. performed experiments related to the methane hydrate combustion, PTV and TV measurements. M.A.Y. and I.A.V. performed synthesis and characterization of methane hydrate.

Funding

Experiments related to the methane hydrate combustion, PTV and TV measurements were carried out within the framework of the National Research Tomsk Polytechnic University development program (project VIU-ISHFVP-184/2018) (contributions by M.S.Y., V.I.S., Y.O.S.).

Conflicts of Interest

The authors declare no conflict of interest.

References

  1. Rehder, G.; Eckl, R.; Elfgen, M.; Falenty, A.; Hamann, R.; Kahler, N.; Kuhs, W.F.; Osterkamp, H.; Windmeier, C. Methane hydrate pellet transport using the self-preservation effect: A Techno-Economic Analysis. Energies 2012, 5, 2499–2523. [Google Scholar] [CrossRef]
  2. Cui, Y.; Lu, C.; Wu, M.; Peng, Y.; Yao, Y.; Luo, W. Review of exploration and production technology of natural gas hydrate. Adv. Geo-Energy Res. 2018, 2, 53–62. [Google Scholar] [CrossRef] [Green Version]
  3. Takahashi, M.; Moriya, H.; Katoh, Y.; Iwasaki, T. Development of natural gas hydrate (NGH) pellet production system by bench scale unit for transportation and storage of NGH pellet. In Proceedings of the 6th International Conference on Gas Hydrates, Vancouver, BC, Canada, 6–10 July 2008. [Google Scholar]
  4. Istomin, V.A.; Yakushev, V.S. Gas Hydrates in Nature; Nedra Publisers: Moscow, Russia, 1992. [Google Scholar]
  5. Sum, A.K.; Koh, C.A.; Sloan, E.D. Clathrate hydrates: From laboratory science to engineering practice. Ind. Eng. Chem. Res. 2009, 48, 7457–7465. [Google Scholar] [CrossRef]
  6. Kuhs, W.F.; Genov, G.; Staykova, D.K.; Hansen, T. Ice perfection and onset of anomalous preservation of gas hydrates. Phys. Chem. Chem. Phys. 2004, 6, 4917–4920. [Google Scholar] [CrossRef]
  7. Takeya, S.; Yoneyama, A.; Ueda, K.; Mimachi, H.; Takahashi, M.; Sano, K.; Hyodo, K.; Takeda, T.; Gotoh, Y. Anomalously preserved clathrate hydrate of natural gas in pellet form at 253 K. J. Phys. Chem. 2012, 116, 13842–13848. [Google Scholar] [CrossRef]
  8. Yakushev, V.S.; Istomin, V.A. Gas-hydrates self-preservation effect. In Physics and Chemistry of Ice; Maeno, N., Hondoh, T., Eds.; Hokkaido Univ. Press: Sapporo, Japan, 1992; pp. 136–139. [Google Scholar]
  9. Sato, H.; Sakamoto, H.; Ogino, S.; Mimachi, H.; Kinoshita, T.; Iwasaki, T.; Sano, K.; Ohgaki, K. Self-preservation of methane hydrate revealed immediately below the eutectic temperature of the mother electrolyte solution. Chem. Eng. Sci. 2013, 91, 86–89. [Google Scholar] [CrossRef]
  10. Zhang, G.; Rogers, R.E. Ultra-stability of gas hydrates at 1 atm and 268.2 K. Chem. Eng. Sci. 2008, 63, 2066–2074. [Google Scholar] [CrossRef]
  11. Takeya, S.; Ripmeester, J.A. Anomalous preservation of CH4 hydrate and its dependence on the morphology of ice. ChemPhysChem 2010, 11, 70–73. [Google Scholar] [CrossRef]
  12. Takeya, S.; Yoneyama, A.; Ueda, K.; Hyodo, K.; Takeda, T.; Mimachi, H.; Takahashi, M.; Iwasaki, T.; Sano, K.; Yamawaki, H.; et al. Nondestructive imaging of anomalously preserved methane clathrate hydrate by phase contrast X-ray imaging. J. Phys. Chem. 2011, 115, 16193–16199. [Google Scholar] [CrossRef]
  13. Stern, L.A.; Circone, S.; Kirby, S.H.; Durham, W.B. Anomalous preservation of pure methane hydrate at 1 atm. J. Phys. Chem. 2011, 105, 1756–1762. [Google Scholar] [CrossRef]
  14. Stern, L.A.; Cirone, S.; Kirby, S.H.; Durham, W.B. Temperature, pressure and compositional effects on anomalous or “self” preservation of gas hydrates. Can. J. Phys. 2003, 81, 271–283. [Google Scholar] [CrossRef]
  15. Falenty, A.; Kuhs, W.F. Self-preservation of CO2 gas hydrates-surface microstructure and ice perfection. J. Phys. Chem. 2009, 113, 15975–15988. [Google Scholar] [CrossRef] [PubMed]
  16. Shimada, W.; Takeya, S.; Kamata, Y.; Uchida, T.; Nagao, J.; Ebinuma, T.; Narita, H. Texture change of ice on anomalously preserved methane clathrate hydrate. J. Phys. Chem. 2005, 109, 5802–5807. [Google Scholar] [CrossRef] [PubMed]
  17. Nguyen, A.H.; Koc, M.A.; Shepherd, T.D.; Molinero, V. Structure of the ice-clathrate interface. J. Phys. Chem. 2015, 119, 4104–4117. [Google Scholar] [CrossRef]
  18. Lv, Y.; Jia, M.; Chen, J.; Sun, C.; Gong, J.; Chen, G.; Liu, B.; Ren, N.; Guo, S.; Li, Q. Self-Preservation effect for hydrate dissociation in water + diesel oil dispersion systems. Energy Fuels 2015, 29, 5563–5572. [Google Scholar] [CrossRef]
  19. Prasad, P.S.R.; Chari, V.D. Preservation of methane gas in the form of hydrates: Use of mixed hydrates. J. Nat. Gas Sci. Eng. 2015, 25, 10–14. [Google Scholar] [CrossRef]
  20. Misyura, S.Y.; Donskoy, I.G. Dissociation of natural and artificial gas hydrate. Chem. Eng. Sci. 2016, 148, 65–77. [Google Scholar] [CrossRef]
  21. Misyura, S.Y. Effect of heat transfer on the kinetics of methane hydrate dissociation. Chem. Phys. Lett. 2013, 583, 34–37. [Google Scholar] [CrossRef]
  22. Semenov, M.E.; Manakov, A.Y.; Shitz, E.Y.; Stoporev, A.S.; Altunina, L.K.; Strelets, L.A.; Misyura, S.Y.; Nakoryakov, V.E. DSC and thermal imaging studies of methane hydrate formation and dissociation in water emulsions in crude oils. J. Therm. Anal. Calorim. 2015, 119, 757–767. [Google Scholar] [CrossRef]
  23. Aerov, M.E.; Todes, O.M.; Narinsky, D.A. Apparatuses with the Steady Grain Layer: Hydraulic and Thermal Fundamentals of Operation; Khimiya: Leningrad, Russia, 1992. [Google Scholar]
  24. Chen, X.R.; Li, X.S.; Chen, Z.Y.; Zhang, Y.; Yan, K.F.; Lv, Q.-N. Experimental investigation into the combustion characteristics of propane hydrates in porous media. Energies 2015, 8, 1242–1255. [Google Scholar] [CrossRef]
  25. Nakoryakov, V.E.; Misyura, S.Y. Nonstationary combustion of methane with gas hydrate dissociation. Energy Fuels 2013, 27, 7089–7097. [Google Scholar] [CrossRef]
  26. Nakoryakov, V.E.; Misyura, S.Y.; Elistratov, S.L.; Manakov, A.Y.; Shubnikov, A.E. Combustion of methane hydrates. J. Eng. Thermophys. 2013, 22, 87–92. [Google Scholar] [CrossRef]
  27. Nakoryakov, V.E.; Misyura, S.Y.; Elistratov, S.L.; Manakov, A.Y.; Sizikov, A.A. Methane combustion in hydrate systems: Water-methane and water-methane-isopropanol. J. Eng. Thermophys. 2013, 22, 169–173. [Google Scholar] [CrossRef]
  28. Maruyama, Y.; Yokomori, T.; Ohmura, R.; Ueda, T. Flame spreading over combustible hydrate in a laminar boundary layer. In Proceedings of the 7th International Conference on Gas Hydrate, Edinburgh, UK, 17–21 July 2011. [Google Scholar]
  29. Nakamura, Y.; Katsuki, R.; Yokomori, T.; Ohmura, R.; Takahashi, M.; Iwasaki, T.; Uchida, K.; Ueda, T. Combustion characteristics of methane hydrate in a laminar boundary layer. Energy Fuels 2009, 23, 1445–1449. [Google Scholar] [CrossRef]
  30. Kitamura, K.; Nakajo, K.; Ueda, T. Numerical calculation of a diffusion flame formed in the laminar boundary layer over methane-hydrate. In Proceedings of the Fourth International Conference on Gas Hydrates, Yokohama, Japan, 19–23 May 2002; pp. 1055–1058. [Google Scholar]
  31. Maruyama, Y.; Fuse, M.J.; Yokomori, T.; Ohmura, R.; Watanabe, S.; Iwasaki, T.; Iwabuchi, W.; Ueda, T. Experimental investigation of flame spreading over pure methane hydrate in a laminar boundary layer. Proc. Combust. Inst. 2013, 34, 2131–2138. [Google Scholar] [CrossRef]
  32. Wu, F.H.; Padilla, R.E.; Dunn-Rankin, D.; Chen, G.B.; Chao, Y.C. Thermal structure of methane hydrate fueled flames. Proc. Combust. Inst. 2017, 36, 4391–4398. [Google Scholar] [CrossRef]
  33. Yoshioka, T.; Yamamoto, Y.; Yokomori, T.; Ohmura, R.; Ueda, T. Experimental study on combustion of methane hydrate sphere. Exp. Fluids 2015, 56, 192. [Google Scholar] [CrossRef]
  34. Bar-Kohany, T.; Sirignano, W.A. Transient combustion of methane-hydrate sphere. Combust. Flame 2016, 163, 284–300. [Google Scholar] [CrossRef]
  35. Misyura, S.Y. Efficiency of methane hydrate combustion for different types of oxidizer flow. Energy 2016, 103, 430–439. [Google Scholar] [CrossRef]
  36. Cuenot, B.; Poinsot, T. Effect of curvature and unsteadiness in diffusion flames implications for turbulent diffusion combustion. Proc. Combust. Inst. 1994, 25, 1383–1390. [Google Scholar] [CrossRef]
  37. Dehaech, S.; Van Parys, H.; Hubin, A.; Van Beeck, J.P.A.J. Laser marked shadowgraphy: A novel optical planar technique for the study of microbubbles and droplets. Exp. Fluids 2009, 47, 333–341. [Google Scholar] [CrossRef]
  38. Kuznetsov, G.V.; Piskunov, M.V.; Volkov, R.S.; Strizhak, P.A. Unsteady temperature fields of evaporating water droplets exposed to conductive, convective and radiative heating. Appl. Therm. Eng. 2018, 131, 340–355. [Google Scholar] [CrossRef]
  39. Hagiwara, Y.; Sakamoto, S.; Tanaka, M.; Yoshimura, K. PTV measurement on interaction between two immiscible droplets and turbulent uniform shear flow of carrier fluid. Exp. Therm. Fluid Sci. 2002, 26, 245–252. [Google Scholar] [CrossRef]
  40. Westerweel, J. Fundamentals of digital particle image velocimetry. Meas. Sci. Technol. 1997, 8, 1379–1392. [Google Scholar] [CrossRef]
  41. Kutateladze, S.S. Fundamentals of Heat Transfer; Arnold, E., Ed.; Wiley: London, UK, 1963. [Google Scholar]
  42. Volchkov, E.P.; Makarov, M.S.; Makarova, S.N. Heat and mass diffusion fluxes on a permeable wall with foreign-gasblowing. Int. J. Heat Mass Transf. 2012, 55, 1881–1887. [Google Scholar] [CrossRef]
  43. Kutateladze, S.S.; Leont’ev, A.I. Heat Transfer, Mass Transfer, and Friction in Turbulent Boundary Layers; Hemisphere Publishing Corporation: New York, NY, USA, 1989. [Google Scholar]
  44. Volchkov, E.P. Concerning the heat and mass transfer features on permeable surfaces. Int. J. Heat Mass Transf. 2006, 49, 755–762. [Google Scholar] [CrossRef]
Figure 1. Scheme of experimental setup.
Energies 11 03518 g001
Figure 2. Video image of TiO2 particles (left) and the result of its processing by PTV (right).
Energies 11 03518 g002
Figure 3. Change of powder mass over time (m0—initial powder mass): 1 − U0 = 0 mm/s; 2 − U0 = 0.2 mm/s; and 3 − U0 = 0.6 mm/s.
Energies 11 03518 g003
Figure 4. The dissociation rate j = Δmt over time (m0—initial powder mass): 1 − U0 = 0 mm/s; 2 − U0 = 0.2 m/s; and 3 − U0 = 0.6 m/s (I—maximum error interval).
Energies 11 03518 g004
Figure 5. The dissociation rate j of methane hydrate depending on the velocity of the incoming air flow U0: 1—experiment; 2—calculation by (2); Ucr1 = 0.3 m/s; Ucr2 = 0.7 m/s [29]; 3—Shift curve2 to the top; and L—the characteristic lengths of the working area.
Energies 11 03518 g005
Figure 6. Characteristic boundary layers for velocity profile and diffusion profile (U01 < U02).
Energies 11 03518 g006
Figure 7. The ignition time t0c depending on velocity of incoming air flow U0: (1—experimental data; 2 − t0c = −kU0.
Energies 11 03518 g007
Figure 8. (a) Photo of a reservoir with a sample; and (b) thermal imaging photograph of the powder surface (photos were taken 10 s before the start of combustion).
Energies 11 03518 g008
Figure 9. Temperature profile of the powder surface along the 0X line shown in Figure 8a,b.
Energies 11 03518 g009
Figure 10. Temperature change in the powder layer over time during combustion of methane hydrate (1 − y = 5 mm; 2 − y = 14 mm, and y—distance from the top surface of the powder layer; thermocouples are located in the center of the tank (Figure 1)): (a) the velocity of the incoming flow U0 = 0 m/s (Figure 1); and (b) U0 = 0.5 m/s (I—intervals of temperature measurement for three repeated experiments).
Energies 11 03518 g010
Figure 11. Temperature distribution by the height of the powder layer during combustion of methane hydrate: (a) U0 = 0 m/s; 1 − t = 0 s; 2 − t = 60 s; 3 − t = 110 s; (b) U0 = 0.5 m/s; 1 − t = 0 s; 2 − t = 30 s; and 3 − t = 50 s (I—intervals of temperature measurement for three repeated experiments).
Energies 11 03518 g011
Figure 12. Thermal imaging photos of methane hydrate combustion (U0 = 0 m/s).
Energies 11 03518 g012
Figure 13. (a) “Effective area” of methane hydrate combustion (red); and (b) average methane velocity V from the entire surface area of layer F.
Energies 11 03518 g013
Figure 14. Velocity field in the combustion region obtained using the PTV method (U0 = 0.5 m/s, t = 20 s).
Energies 11 03518 g014

