A Self-Adaptive Artificial Intelligence Technique to Predict Oil Pressure Volume Temperature Properties


Abstract
:1. Introduction
2. Artificial Neural Network Modeling
3. Methodology
Data Analysis and Acquisition
4. Results and Discussion
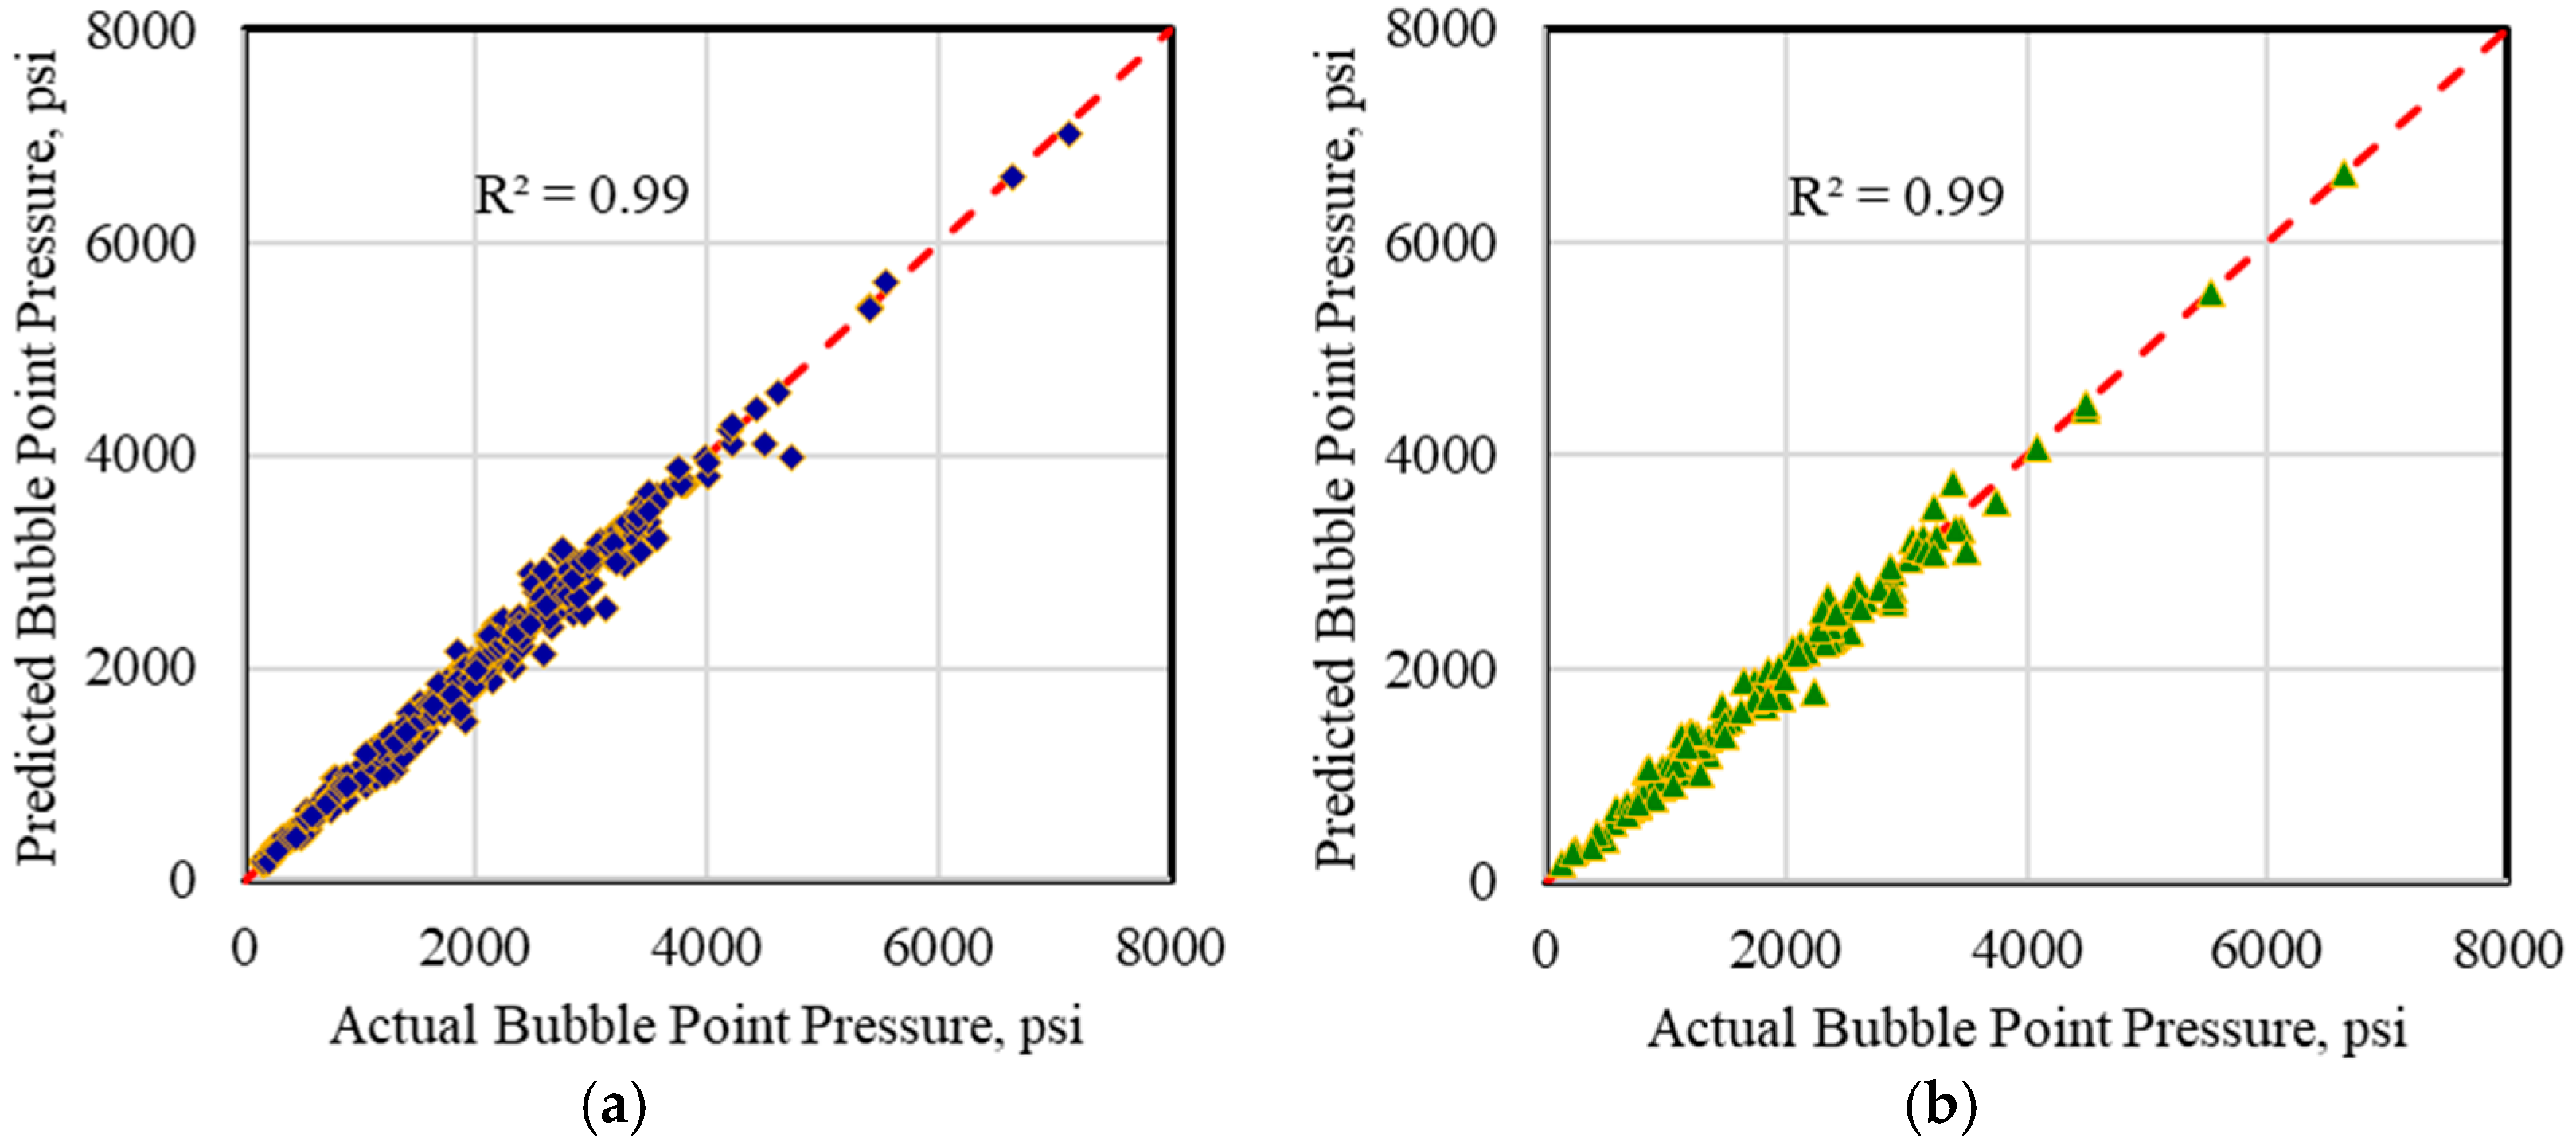
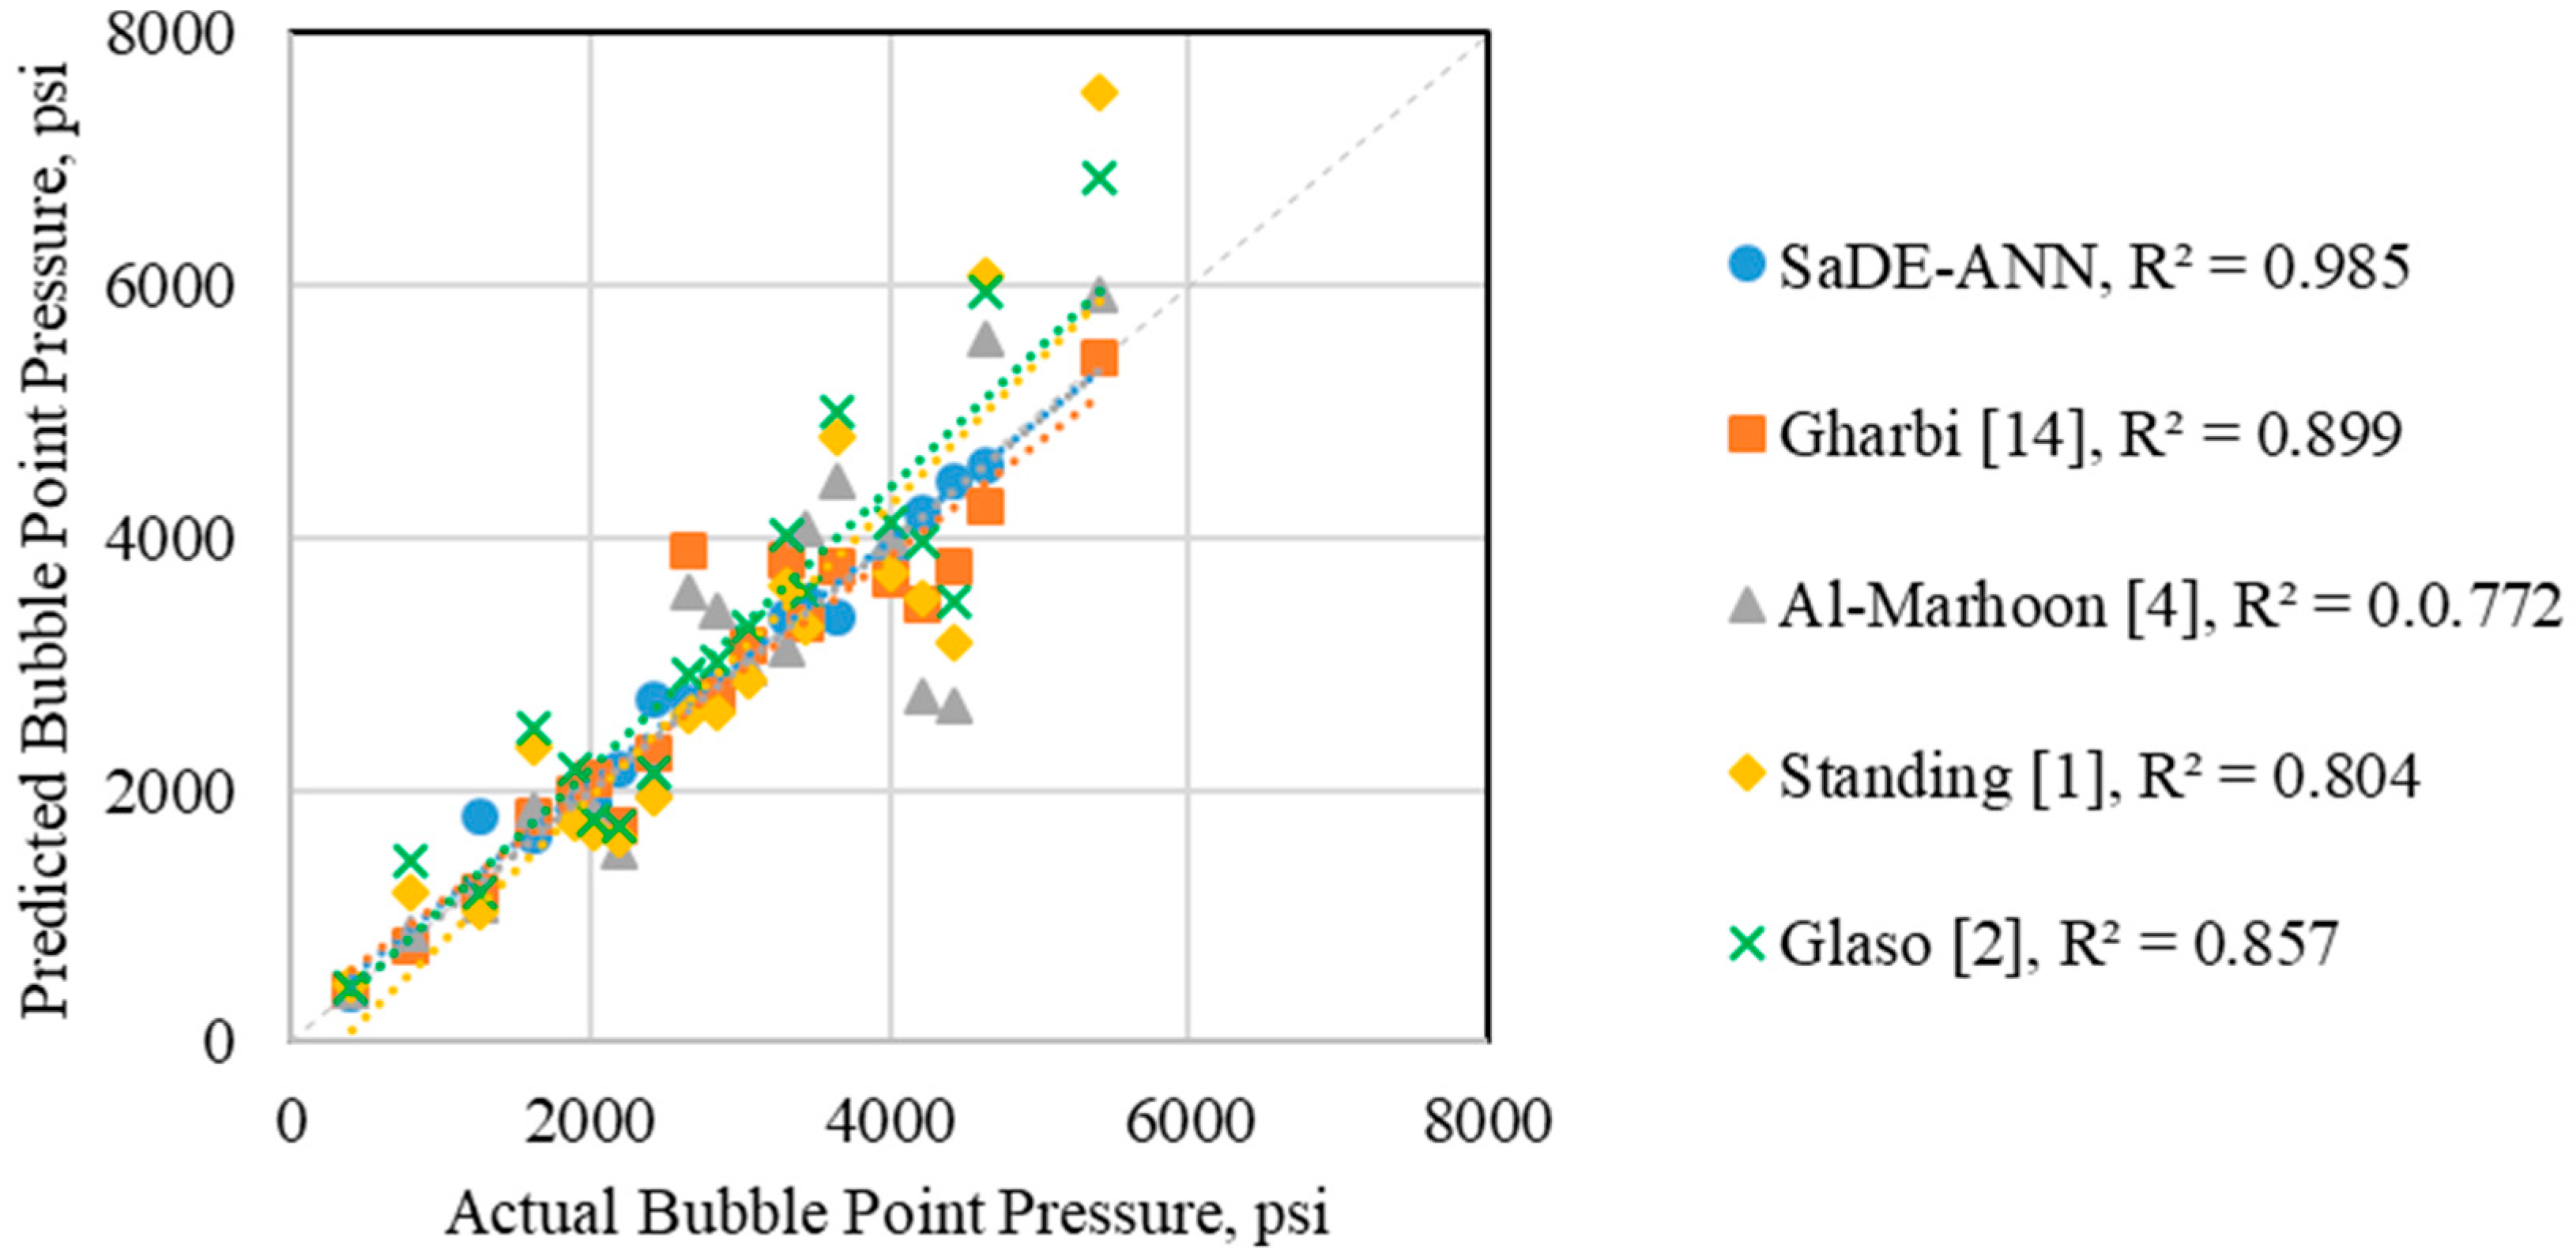
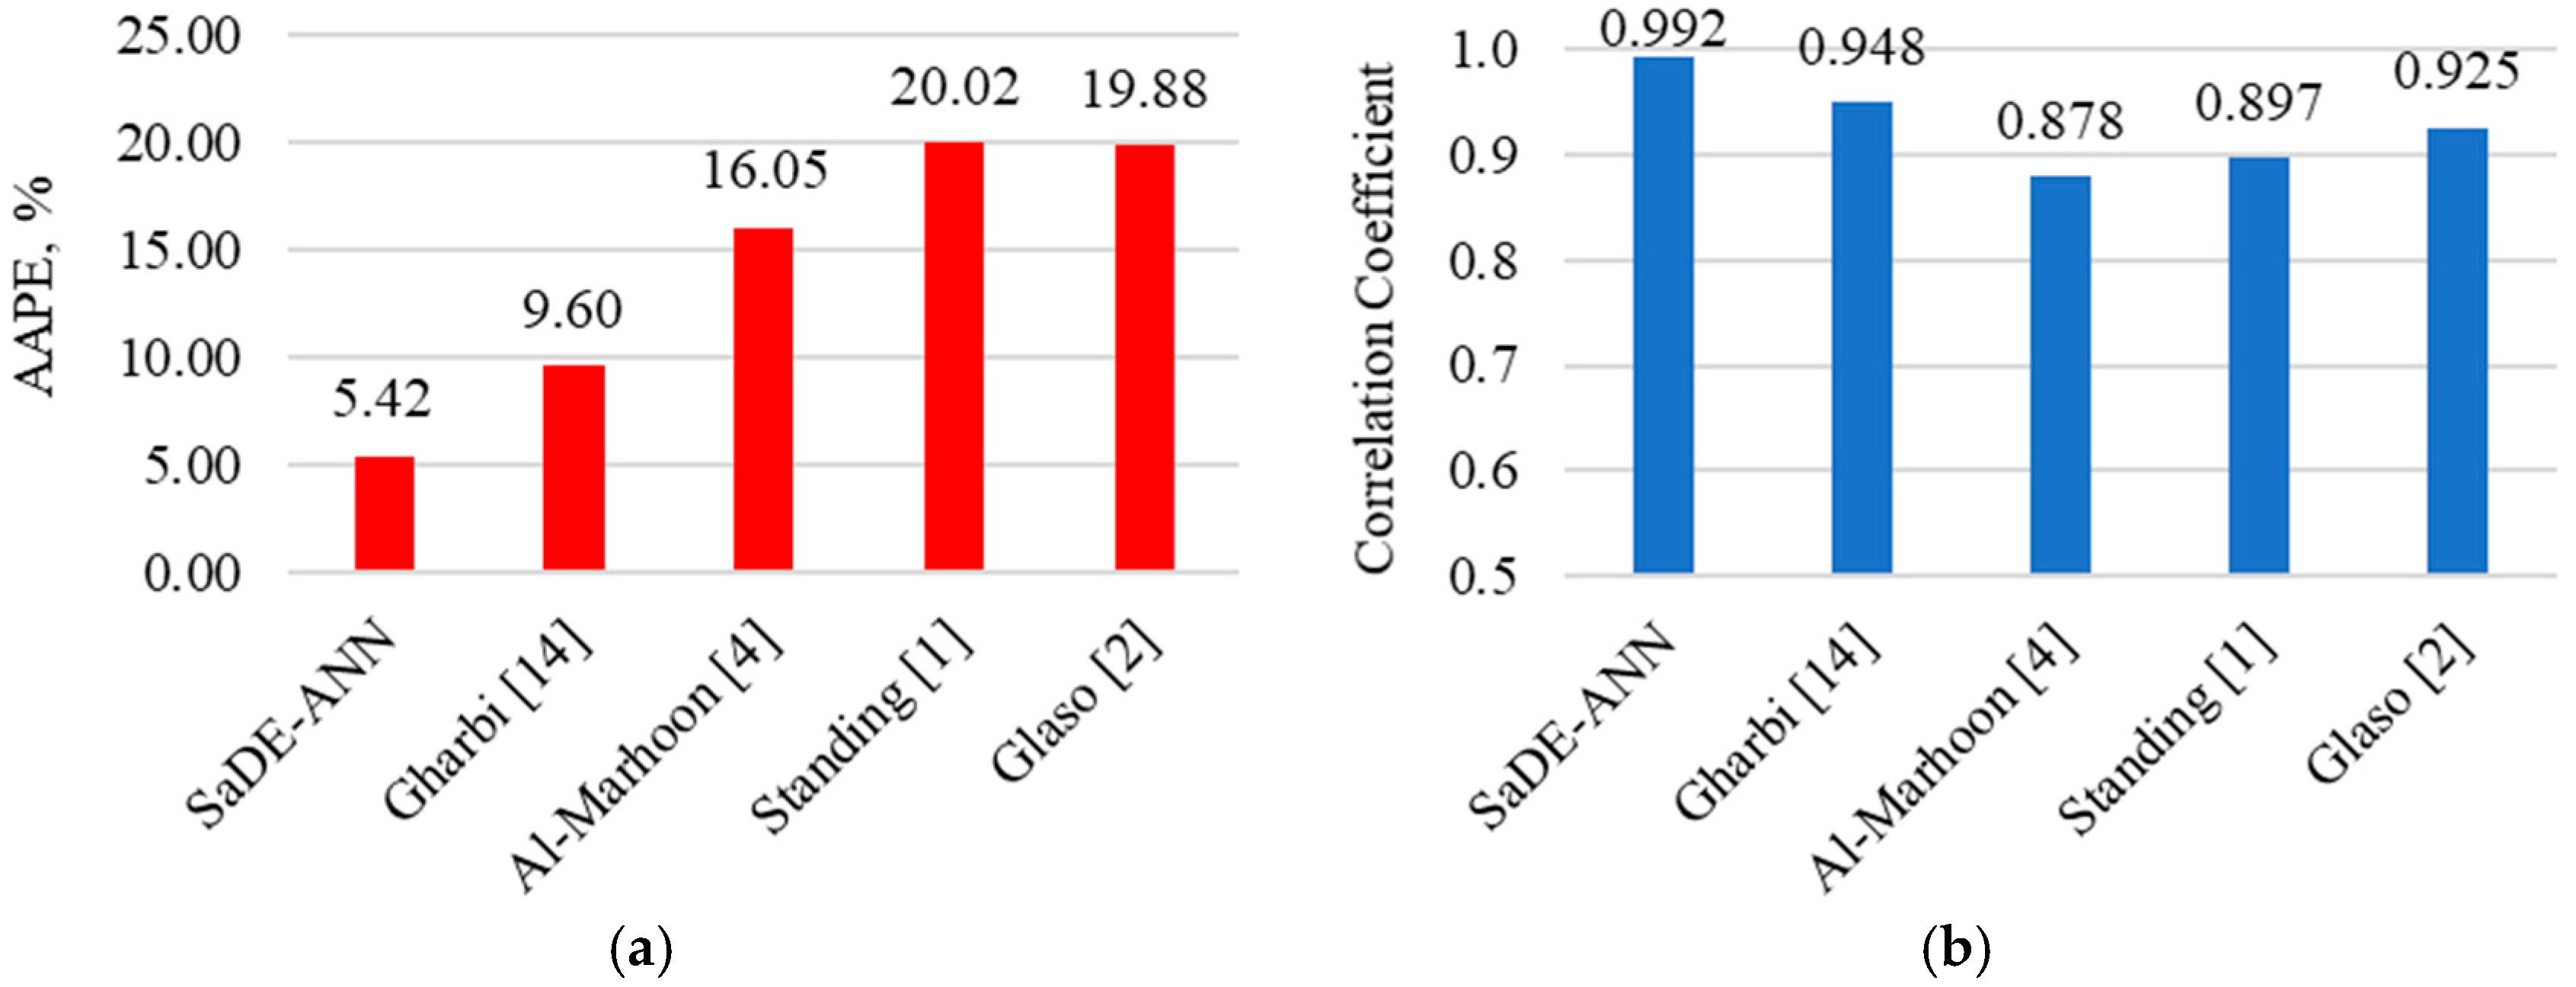
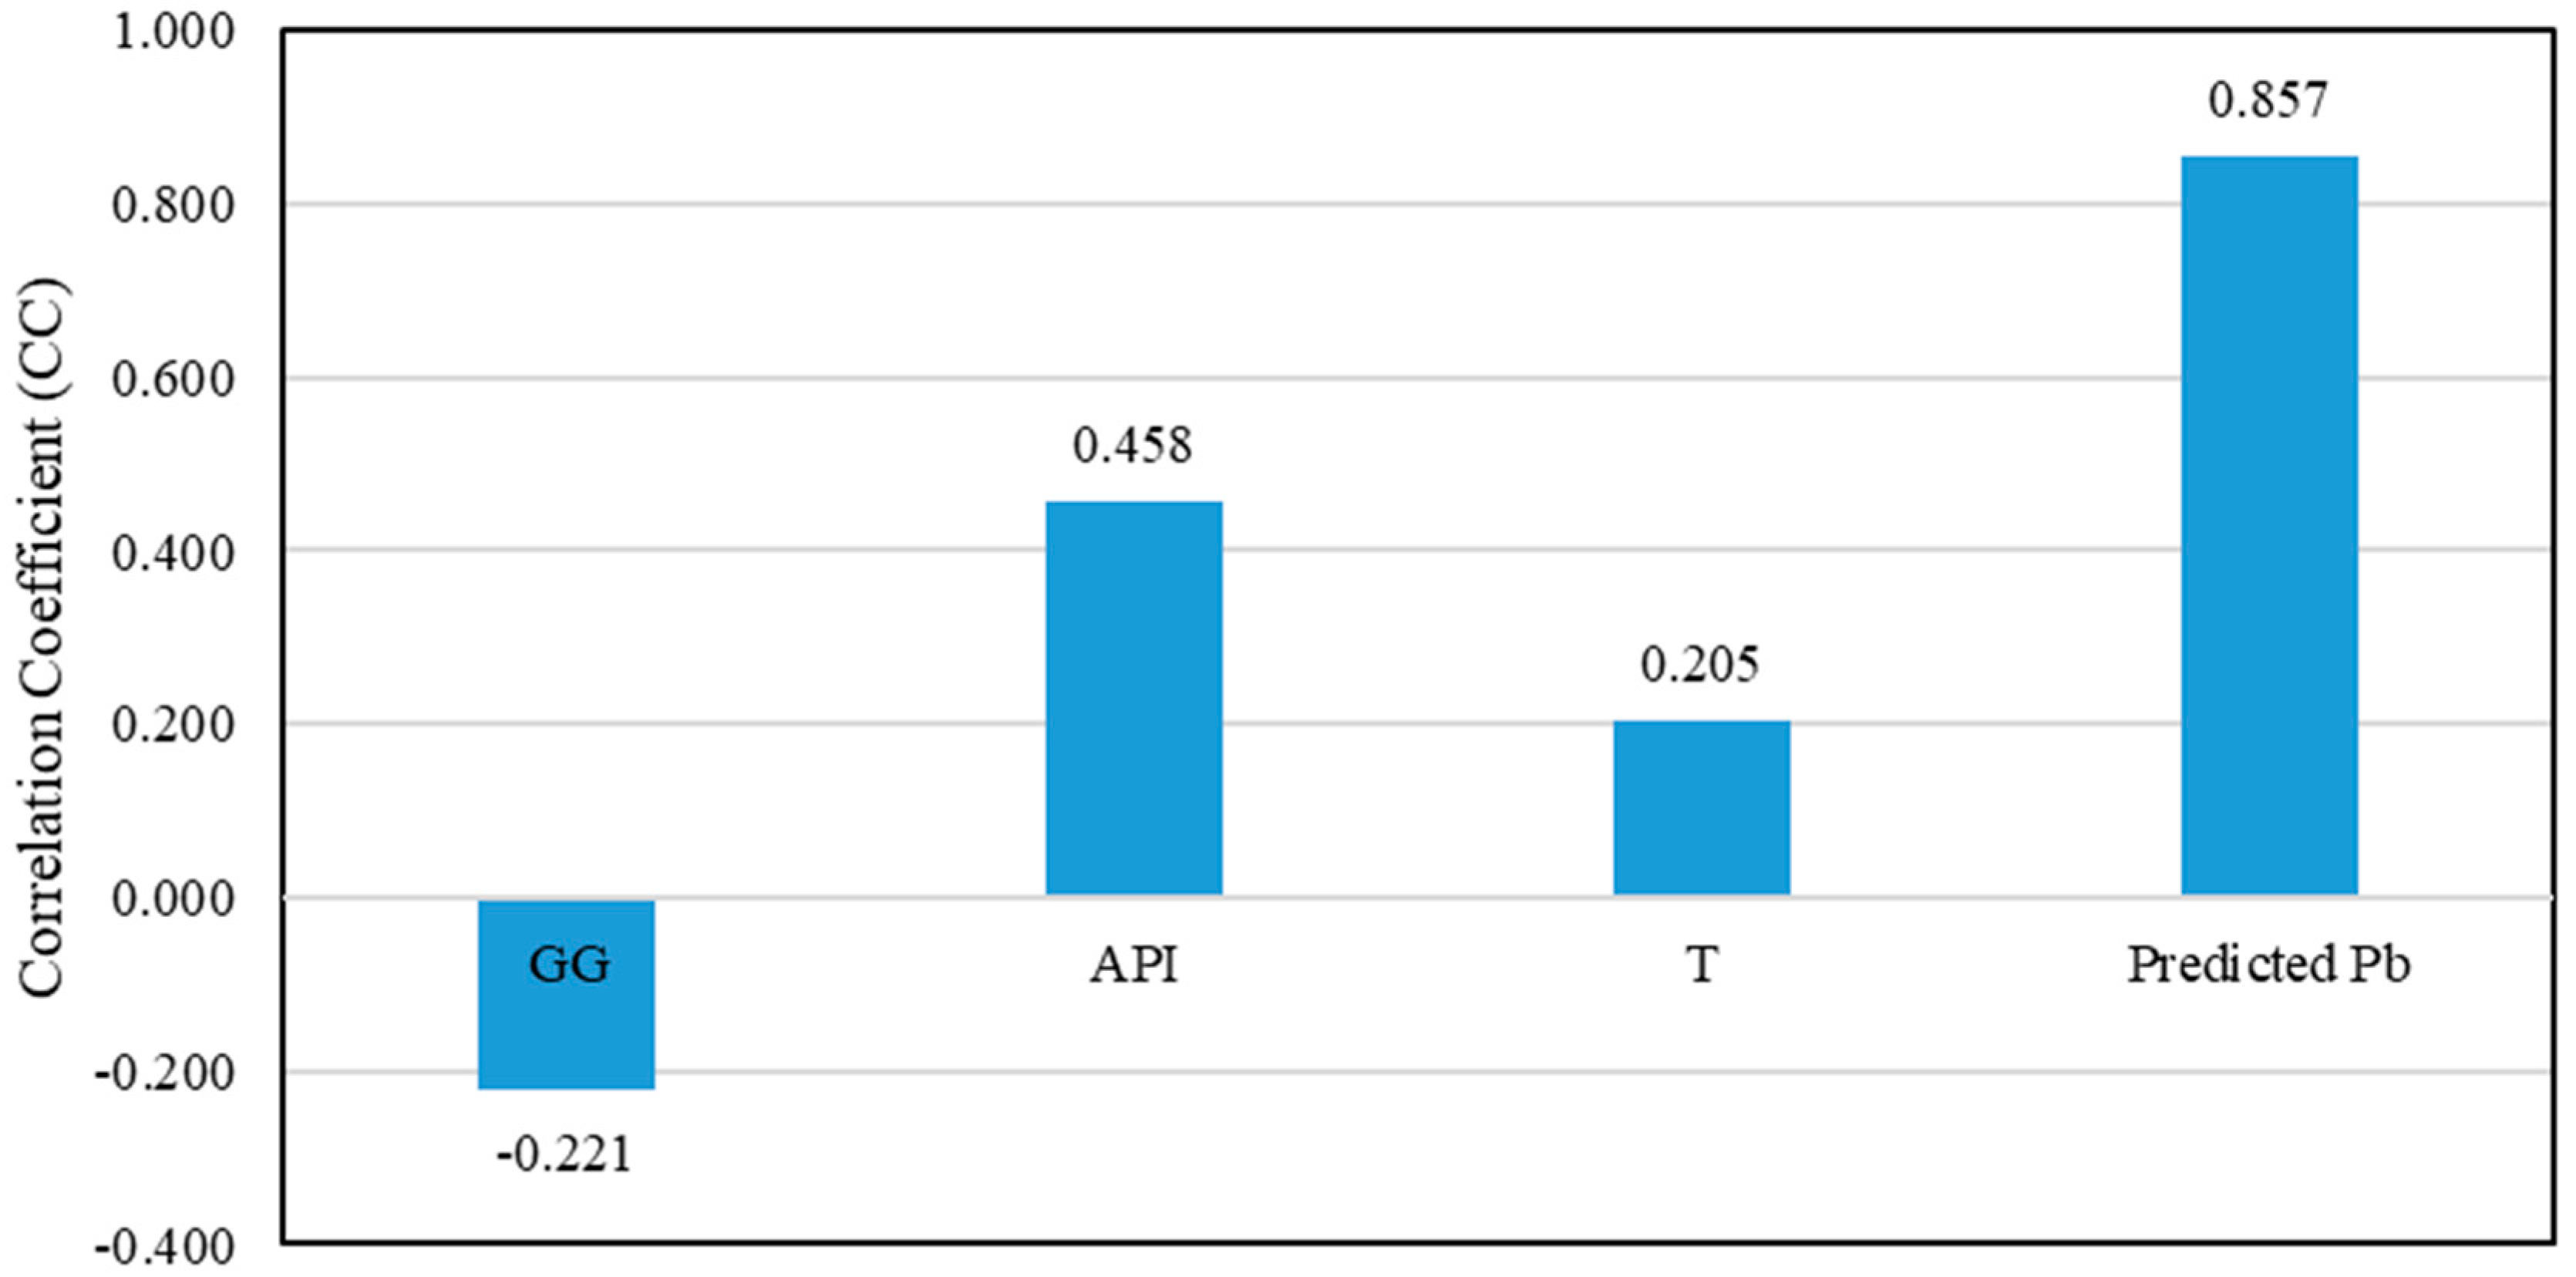
4.1. Bubble Point Pressure Estimation
Mathematical Model for Bubble Point Pressure
| , | number of neurons in the first and second hidden layers, respectively; |
| i, j | neuron index in the first and second hidden layers, respectively, as shown in Table 2 and Table 3; |
| , | weights and bias between the input and first hidden layers, respectively, as shown in Table 2; |
| , | weights and bias between the first hidden and output layers, respectively; the values of W2j,i are shown in Table 3; |
| , | weights and bias between the second hidden and output layers, respectively; b3 = −0.2626 and the values of W3j are shown in Table 3; |
| normalized GG, as calculated by Equation (6); | |
| APIn | normalized oil API gravity, as calculated by Equation (7); |
| Tn | normalized reservoir temperature (°F), as calculated by Equation (8). |
4.2. Gas Solubility Estimation
Mathematical Model for Gas Solubility
5. Conclusions
Author Contributions
Funding
Conflicts of Interest
Appendix A
References
- Jia, B.; Tsau, J.; Barati, R. A Review of the Current Progress of CO2 Injection EOR and Carbon Storage in Shale Oil Reservoirs. Fuel 2019, 236, 404–427. [Google Scholar] [CrossRef]
- Jia, B.; Tsau, J.; Barati, R. Role of Molecular Diffusion in Heterogeneous, Naturally Fractured Shale Reservoirs during CO2 Huff-n-Puff. J. Pet. Sci. Eng. 2018, 164, 31–42. [Google Scholar] [CrossRef]
- Baker, R.O.; Regier, C.; Sinclair, R. PVT Error Analysis for Material Balance Calculations. In Proceedings of the Canadian International Petroleum Conference, Calgary, AB, Canada, 10–12 June 2003. [Google Scholar]
- Dong, C.; O’Keefe, M.D.; Elshahawi, H.; Hashem, M.; Williams, S.M.; Stensland, D.; Hegeman, P.S.; Vasques, R.R.; Terabayashi, T.; Mullins, O.C.; et al. New Downhole-Fluid-Analysis Tool for Improved Reservoir Characterization. SPE Reserv. Eval. Eng. 2008, 11, 1107–1116. [Google Scholar] [CrossRef]
- Nnochiri, M.O.; Lawal, K.A. How Variable Fluid PVT Model Affects the Performance of an Integrated Production System. In Proceedings of the SPE EUROPEC/EAGE Annual Conference and Exhibition, Barcelona, Spain, 14–17 June 2010. [Google Scholar]
- Standing, M.B. A Pressure-Volume-Temperature Correlation for Mixtures of California Oils and Gases. In Drilling and Production Practice; American Petroleum Institute: New York, NY, USA, 1947. [Google Scholar]
- Glaso, O. Generalized Pressure-Volume-Temperature Correlations. J. Pet. Technol. 1980, 32, 785–795. [Google Scholar] [CrossRef]
- Al-Marhoun, M.A. PVT Correlations for Middle East Crude Oils. J. Pet. Technol. 1988, 40, 650–667. [Google Scholar] [CrossRef]
- Vazquez, M.; Beggs, H.D. Correlations for Fluid Physical Property Prediction. J. Pet. Technol. 1980, 32, 968–970. [Google Scholar] [CrossRef]
- Wang, L.-S.; Gmehling, J. Improvement of the SRK equation of state for representing volumetric properties of petroleum fluids using Dortmund Data Bank. Chem. Eng. Sci. 1999, 54, 3885–3892. [Google Scholar] [CrossRef]
- Peng, W.; Pope, G.A. Proper Use of Equations of State for Compositional Reservoir Simulation. J. Pet. Technol. 2001, 53, 74–81. [Google Scholar] [CrossRef]
- Guo, X.Q.; Sun, C.Y.; Rong, S.X.; Chen, G.J.; Guo, T.M. Equation of state analog correlations for the viscosity and thermal conductivity of hydrocarbons and reservoir fluids. J. Pet. Sci. Eng. 2001, 30, 15–27. [Google Scholar] [CrossRef]
- AlAjmi, M.D.; Alarifi, S.A.; Mahsoon, A.H. Improving Multiphase Choke Performance Prediction and Well Production Test Validation Using Artificial Intelligence: A New Milestone. In Proceedings of the SPE Digital Energy Conference and Exhibition, The Woodlands, TX, USA, 3–5 March 2015. [Google Scholar]
- Alarifi, S.; AlNuaim, S.; Abdulraheem, A. Productivity Index Prediction for Oil Horizontal Wells Using different Artificial Intelligence Techniques. In Proceedings of the SPE Middle East Oil & Gas Show and Conference, Manama, Bahrain, 8–11 March 2015. [Google Scholar]
- Feifei, C.; Yonggang, D.; Junbin, Z.; Weifeng, W. Application of neural network and fuzzy mathematic theory in evaluating the adaptability of inflow control device in horizontal well. J. Pet. Sci. Eng. 2015, 134, 131–142. [Google Scholar] [CrossRef]
- Moussa, T.; Elkatatny, S.; Mahmoud, M.; Abdulraheem, A. Development of New Permeability Formulation From Well Log Data Using Artificial Intelligence Approaches. J. Energy Resour. Technol. 2018, 140, 072903. [Google Scholar] [CrossRef]
- Van, S.L.; Chon, B.H. Effective Prediction and Management of a CO2 Flooding Process for Enhancing Oil Recovery Using Artificial Neural Networks. J. Energy Resour. Technol. 2017, 140, 032906. [Google Scholar] [CrossRef]
- Elkatatny, S.; Tariq, Z.; Mahmoud, M. Real time prediction of drilling fluid rheological properties using Artificial Neural Networks visible mathematical model (white box). J. Pet. Sci. Eng. 2016, 146, 1202–1210. [Google Scholar] [CrossRef]
- Abedini, R.; Esfandyari, M.; Nezhadmoghadam, A.; Rahmanian, B. The Prediction of Undersaturated Crude Oil Viscosity: An Artificial Neural Network and Fuzzy Model Approach. Pet. Sci. Technol. 2012, 30, 2008–2021. [Google Scholar] [CrossRef]
- Moghadasi, J.; Kazemi, K.; Moradi, S. The Application of Artificial Neural Networks in Determination of Bubble Point Pressure for Iranian Crude Oils. Pet. Sci. Technol. 2013, 31, 2475–2482. [Google Scholar] [CrossRef]
- Al-Marhoun, M.A.; Ali, S.S.; Abdulraheem, A.; Nizamuddin, S.; Muhammadain, A. Prediction of Bubble Point Pressure from Composition of Black Oils Using Artificial Neural Network. Pet. Sci. Technol. 2014, 32, 1720–1728. [Google Scholar] [CrossRef]
- Tatar, A.; Naseri, S.; Bahadori, M.; Rozyn, J.; Lee, M.; Kashiwao, T.; Bahadori, A. Evaluation of Different Artificial Intelligent Models to Predict Reservoir Formation Water Density. Pet. Sci. Technol. 2015, 33, 1749–1756. [Google Scholar] [CrossRef]
- Ahmadi, M.A.; Bahadori, A. A simple approach for screening enhanced oil recovery methods: Application of artificial intelligence. Pet. Sci. Technol. 2016, 34, 1887–1893. [Google Scholar] [CrossRef]
- Choubineh, A.; Khalafi, E.; Kharrat, R.; Bahreini, A.; Hosseini, A.H. Forecasting gas density using artificial intelligence. Pet. Sci. Technol. 2017, 35, 903–909. [Google Scholar] [CrossRef]
- Moussa, T.M.; Awotunde, A.A. Self-adaptive differential evolution with a novel adaptation technique and its application to optimize ES-SAGD recovery process. Comput. Chem. Eng. 2018, 118, 64–76. [Google Scholar] [CrossRef]
- Arabjamaloei, R.; Shadizadeh, S. Modeling and Optimizing Rate of Penetration Using Intelligent Systems in an Iranian Southern Oil Field (Ahwaz Oil Field). Pet. Sci. Technol. 2011, 29, 1637–1648. [Google Scholar] [CrossRef]
- Schalkoff, R.J. Artificial Neural Networks; McGraw-Hill: New York, NY, USA, 1997. [Google Scholar]
- Haykin, S. Neural Networks: A Comprehensive Foundation; Prentice Hall: Upper Saddle River, NJ, USA, 1998. [Google Scholar]
- Ali, J.K. Neural Networks: A New Tool for the Petroleum Industry? In Proceedings of the European Petroleum Computer Conference, Aberdeen, UK, 15–17 March 1994. [Google Scholar]
- Van der Aalst, W.M.P.; Rubin, V.; Verbeek HM, W.; van Dongen, B.F.; Kindler, E.; Günther, C.W. Process mining: A two-step approach to balance between underfitting and overfitting. Softw. Syst. Model. 2010, 9, 87. [Google Scholar] [CrossRef]
- Lippmann, R. An introduction to computing with neural nets. IEEE ASSP Mag. 1987, 4, 4–22. [Google Scholar] [CrossRef]
- Jain, A.K.; Jianchang, M.; Mohiuddin, K.M. Artificial neural networks: A tutorial. Computer 1996, 29, 31–44. [Google Scholar] [CrossRef]
- Katz, D.L. Prediction of The Shrinkage of Crude Oils. In Drilling and Production Practice; American Petroleum Institute: New York, NY, USA, 1942. [Google Scholar]
- Omar, M.I.; Todd, A.C. Development of New Modified Black Oil Correlations for Malaysian Crudes. In Proceedings of the SPE Asia Pacific Oil and Gas Conference, Singapore, 8–10 February 1993. [Google Scholar]
- De Ghetto, G.; Villa, M. Reliability Analysis on PVT Correlations. In Proceedings of the European Petroleum Conference, London, UK, 25–27 October 1994. [Google Scholar]


| Statistical Parameter | Gas Specific Gravity | Oil Gravity, °API | Reservoir Temperature, °F | Solution Gas Oil Ratio, SCF/STB | Bubble Point Pressure, psi |
|---|---|---|---|---|---|
| Maximum | 1.367 | 56.200 | 294.000 | 1718.000 | 4735.000 |
| Minimum | 0.589 | 15.300 | 74.000 | 9.000 | 126.000 |
| Arithmetic Mean | 0.904 | 36.048 | 170.926 | 518.981 | 1754.048 |
| Geometric Mean | 0.891 | 35.273 | 163.511 | 356.563 | 1357.907 |
| Harmonic Mean | 0.879 | 34.449 | 155.754 | 189.980 | 907.683 |
| Mode | 0.802 | 33.300 | 100.000 | 61.000 | 500.000 |
| Range | 0.778 | 40.900 | 220.000 | 1709.000 | 4609.000 |
| Mid-Range | 0.201 | 10.400 | 74.000 | 554.000 | 1633.000 |
| Variation | 0.389 | 20.450 | 110.000 | 854.500 | 2304.500 |
| Interquartile Range | 0.025 | 53.085 | 2,394 | 145,930 | 1101,077 |
| Standard Deviation | 0.160 | 7.286 | 48.933 | 382.008 | 1049.322 |
| Skewness | 0.820 | −0.043 | 0.082 | 0.823 | 0.357 |
| Kurtosis | 0.285 | −0.385 | −0.772 | 0.202 | −0.624 |
| Coefficient of Variation | 0.176 | 0.202 | 0.286 | 0.736 | 0.598 |
| 1 | 0.0847 | 3.8463 | 0.5493 | 0.7595 |
| 2 | 3.91 | −1.1935 | 4.9371 | 2.2716 |
| 3 | −1.2509 | 2.3835 | 2.1648 | −1.5377 |
| 4 | 0.3323 | 3.9022 | 0.3577 | −1.27 |
| 5 | −3.4482 | −0.7113 | −2.0318 | 0.3747 |
| 6 | −4.184 | 0.6819 | 3.4924 | −0.6621 |
| 7 | −1.7434 | 4.3069 | −2.8004 | −1.7342 |
| 8 | 0.4419 | −3.0066 | 4.0254 | −0.8286 |
| 9 | 0.4158 | 4.5222 | −2.392 | 1.6974 |
| 10 | −3.9243 | −1.6785 | −1.0686 | −1.4006 |
| 11 | 1.3103 | 0.1133 | −1.5418 | −1.4221 |
| 12 | −2.0139 | −0.2613 | 4.4812 | −0.53 |
| 13 | 1.3382 | −2.6467 | −2.8971 | −0.5727 |
| 14 | 3.0649 | −3.291 | −0.4142 | 0.0906 |
| 15 | −2.6736 | −3.06 | 1.1079 | 0.0082 |
| 16 | −2.5812 | 5.0496 | −0.5947 | −1.4075 |
| 17 | 2.0543 | 1.3933 | −1.2484 | 1.0663 |
| 18 | −1.3636 | −1.2778 | −3.4035 | 1.2546 |
| i = 1 | i = 2 | i = 3 | i = 4 | i = 5 | i = 6 | i = 7 | i = 8 | i = 9 | i = 10 | i = 11 | i = 12 | i = 13 | i = 14 | i = 15 | i = 16 | i = 17 | i = 18 | |||
|---|---|---|---|---|---|---|---|---|---|---|---|---|---|---|---|---|---|---|---|---|
| 1 | −0.410 | 0.184 | 0.134 | −0.573 | −0.403 | −0.683 | −0.406 | −1.883 | −2.377 | 0.335 | 0.963 | 0.693 | −0.502 | 0.426 | 0.631 | −0.165 | 1.085 | −0.564 | −0.140 | 2.45 |
| 2 | 1.839 | 0.385 | −0.889 | 0.058 | 0.149 | −1.337 | 0.649 | 0.125 | 1.038 | −0.344 | 0.513 | −1.343 | −0.352 | −2.096 | 0.143 | −1.614 | −0.257 | −1.045 | −0.043 | 2.33 |
| 3 | −0.691 | −0.169 | −0.392 | −0.738 | 0.966 | −0.037 | 2.469 | 1.518 | −0.477 | 0.860 | 0.060 | −1.226 | −0.331 | 0.086 | 0.986 | 0.814 | −1.231 | −1.200 | 0.658 | −2.55 |
| 4 | −0.066 | −1.132 | 0.415 | 0.910 | 0.027 | −0.677 | −0.639 | −0.017 | −1.124 | 0.380 | −0.161 | 0.106 | 1.061 | −1.934 | 0.167 | 1.766 | −1.055 | 0.291 | 0.475 | 3.03 |
| 5 | −0.871 | 0.580 | −0.018 | 1.068 | 0.210 | −0.130 | 0.122 | −0.208 | 0.603 | 1.078 | −0.179 | 0.406 | 1.156 | −0.458 | 0.470 | −1.116 | 2.286 | 1.042 | −0.308 | −2.45 |
| 6 | −0.398 | 0.099 | 0.129 | −0.735 | 0.309 | −0.698 | 1.262 | 0.292 | 0.307 | −0.349 | −0.255 | −0.003 | −0.508 | −1.289 | 0.797 | 0.309 | 0.956 | −2.374 | 0.030 | −1.69 |
| 7 | 2.022 | 0.363 | −0.565 | 0.045 | 1.093 | 0.642 | 1.615 | −0.573 | −0.532 | −0.361 | 0.372 | 0.643 | 0.274 | −0.125 | 0.750 | −2.309 | −1.358 | 1.216 | −1.258 | 1.59 |
| 8 | 0.745 | −0.001 | −0.369 | −0.999 | 0.947 | 0.635 | −0.097 | 1.481 | −1.005 | 0.766 | 0.153 | 0.541 | 1.084 | −1.943 | −0.291 | 0.116 | 0.892 | −0.271 | −0.179 | 2.88 |
| 9 | −1.396 | 2.816 | −1.460 | −0.517 | 0.891 | −1.169 | −1.263 | −1.146 | 0.977 | −0.275 | 0.575 | 0.896 | −0.382 | 1.573 | −1.410 | −0.920 | 0.249 | −0.653 | −0.376 | 2.16 |
| 10 | 0.178 | 0.040 | 0.676 | −0.682 | −0.926 | 0.075 | 1.437 | −1.222 | 1.177 | 0.304 | −0.626 | 1.318 | 0.117 | 0.112 | 0.620 | 1.398 | 0.775 | −0.206 | 0.032 | 2.22 |
| 11 | 0.599 | 1.986 | −0.004 | 1.060 | −0.798 | −2.162 | −1.054 | −2.858 | −1.155 | −0.851 | −0.474 | 0.723 | 1.148 | 0.355 | 1.151 | −0.598 | 0.802 | −0.841 | 0.428 | −2.01 |
| 12 | 1.621 | 1.076 | −0.721 | 0.871 | −0.406 | −0.070 | −0.468 | 0.738 | −1.347 | 2.547 | 0.202 | 0.095 | −0.247 | −0.356 | 0.930 | −0.132 | −1.160 | −1.164 | −0.336 | −2.26 |
| 13 | 0.754 | 0.041 | 0.499 | −1.609 | −0.795 | −0.997 | 0.627 | −0.995 | 0.422 | 0.316 | 0.195 | −0.564 | −0.831 | −0.339 | 1.346 | 1.092 | 0.062 | 0.030 | −0.425 | −2.49 |
| 14 | −0.106 | 2.295 | −1.196 | 1.851 | 0.387 | −1.079 | 0.522 | −0.724 | 1.553 | 0.901 | 0.517 | 0.671 | 0.445 | 1.174 | −0.451 | −0.530 | −0.803 | 0.275 | −0.358 | 3.01 |
| 15 | 0.413 | −0.554 | 0.719 | −0.232 | −0.347 | −0.208 | −0.588 | −0.839 | −1.993 | −0.045 | −1.883 | 0.534 | 0.749 | 0.201 | −0.239 | −0.480 | 0.826 | −1.309 | −0.795 | −2.04 |
| 16 | 0.619 | −0.603 | 1.597 | −0.640 | −0.289 | −0.909 | −0.746 | −0.293 | −1.093 | 0.489 | −0.850 | −1.021 | −0.823 | 0.522 | 0.175 | 0.414 | 1.333 | −1.094 | 0.347 | 3.26 |
| 17 | −0.073 | −0.903 | 1.402 | −0.143 | −1.191 | 0.156 | 0.652 | −0.068 | −1.299 | 0.760 | −0.864 | 0.733 | 0.539 | 0.285 | 0.904 | −1.034 | −0.233 | 0.345 | 0.205 | 2.84 |
| 1 | 7.8528 | −3.4231 | 2.4038 | −2.2436 | 1.7801 |
| 2 | −2.2089 | −3.6357 | −1.3463 | 4.094 | 0.1083 |
| 3 | 1.5981 | −3.9961 | 4.4487 | −0.4893 | −1.9289 |
| 4 | −0.3229 | 2.2407 | 5.5417 | 3.2776 | 0.0307 |
| 5 | −5.2848 | 2.7897 | 3.7404 | 3.9076 | 1.3228 |
| 6 | 3.1948 | 6.484 | 3.2778 | 4.2005 | 2.2259 |
| 7 | −1.6744 | 1.3062 | 2.0996 | −4.7358 | −1.6276 |
| 8 | −1.0052 | −0.6798 | −1.2986 | 6.0228 | 3.8066 |
| 9 | −7.2086 | 0.9991 | 3.2067 | 4.6079 | −0.7049 |
| 10 | −1.9889 | 3.5852 | −1.5909 | −4.3559 | −1.9949 |
| 11 | −1.7207 | 3.2091 | −3.3657 | 6.883 | −0.5073 |
| 12 | −5.5474 | 0.9029 | 0.6965 | 0.6955 | 1.1485 |
| 13 | −2.7482 | −1.8183 | −4.8786 | −0.4023 | 1.0552 |
| 14 | −6.9512 | −4.748 | 3.7096 | −2.0801 | −0.5928 |
| 15 | 0.5709 | −4.1858 | −3.5728 | 3.9487 | 1.5681 |
| i =1 | i = 2 | i = 3 | i = 4 | i = 5 | i = 6 | i = 7 | i = 8 | i = 9 | i = 10 | i = 11 | i = 12 | i = 13 | i = 14 | i = 15 | |||
|---|---|---|---|---|---|---|---|---|---|---|---|---|---|---|---|---|---|
| 1 | 1.554 | 2.800 | 1.085 | −0.860 | −1.485 | −2.396 | −0.242 | 0.840 | 1.776 | 1.773 | −2.829 | 0.694 | −0.441 | −0.082 | 1.385 | −0.922 | −5.681 |
| 2 | −2.932 | −0.424 | 0.263 | −0.633 | −0.212 | −0.844 | 0.465 | 4.355 | −2.354 | 1.788 | −1.613 | 1.671 | 0.636 | −0.997 | −2.740 | −0.434 | 4.585 |
| 3 | −0.938 | −0.749 | −1.130 | −1.269 | 4.179 | 1.264 | 1.402 | 0.393 | −2.974 | −2.532 | 1.927 | −1.845 | 0.234 | 2.833 | −1.008 | 0.310 | −3.292 |
| 4 | −2.711 | −1.708 | 2.747 | 1.537 | −0.662 | −1.630 | 2.046 | −1.875 | −1.191 | 1.346 | −2.360 | 0.289 | 2.147 | −0.430 | −0.108 | 2.778 | −4.724 |
| 5 | 3.450 | 2.797 | −1.875 | 0.605 | −2.980 | −4.805 | 3.414 | −1.952 | 2.863 | −0.029 | 2.960 | 1.690 | −2.389 | −0.267 | 0.929 | 0.854 | 4.937 |
| 6 | 3.137 | −2.165 | 1.345 | 1.902 | −0.208 | −1.544 | −1.150 | −0.256 | −1.293 | 1.383 | −4.041 | 1.017 | −0.175 | 0.102 | −1.149 | 0.683 | −2.076 |
| 7 | 1.598 | 0.386 | 0.274 | 1.047 | 1.528 | 0.021 | 0.477 | −1.698 | −0.732 | 0.598 | −1.437 | 0.031 | 0.247 | 0.940 | −2.502 | −0.063 | 4.667 |
| 8 | 3.038 | 1.812 | 0.852 | −4.579 | 2.510 | 1.750 | −0.412 | −1.840 | −0.295 | −0.441 | −2.573 | 1.692 | −0.174 | 1.624 | 1.293 | −1.129 | 3.736 |
| 9 | 1.148 | 1.240 | 0.769 | 2.059 | 1.937 | −1.253 | 0.274 | −2.670 | 1.178 | −0.013 | −2.148 | −3.262 | 1.213 | 1.012 | 1.594 | −0.535 | 4.452 |
| 10 | 0.166 | 2.730 | −3.771 | 1.449 | −0.412 | −0.376 | −2.410 | 0.841 | 2.582 | 0.553 | 2.596 | 0.003 | 0.336 | −1.986 | −2.667 | 1.420 | −4.039 |
| 11 | −2.558 | −2.640 | 0.543 | −2.271 | 0.328 | 2.071 | −0.171 | 1.974 | −3.259 | −1.002 | 2.292 | −0.392 | −0.611 | 1.001 | 1.955 | −0.067 | 3.891 |
| 12 | 1.815 | 0.977 | 0.500 | −0.962 | −1.080 | −1.207 | 0.502 | −3.151 | −0.801 | −0.441 | −0.533 | 1.825 | −0.441 | 2.414 | −1.809 | 1.262 | −4.627 |
| 13 | −2.361 | −3.992 | −3.165 | −2.139 | 0.709 | 1.626 | 1.510 | 1.054 | 0.260 | 1.670 | −0.604 | −0.122 | 1.297 | −1.834 | −1.540 | −1.014 | 2.243 |
| 14 | −2.109 | 0.314 | −0.084 | −0.826 | 0.154 | 0.630 | 1.856 | −0.959 | −0.841 | 0.530 | −2.510 | 0.546 | 2.185 | −1.291 | −0.992 | −0.712 | −3.847 |
| 15 | 0.563 | −0.695 | 0.811 | −0.402 | 1.825 | 1.529 | −2.245 | −1.279 | −0.432 | −0.295 | 4.792 | −1.066 | −1.730 | −0.036 | −0.070 | 0.922 | −2.925 |
© 2018 by the authors. Licensee MDPI, Basel, Switzerland. This article is an open access article distributed under the terms and conditions of the Creative Commons Attribution (CC BY) license (http://creativecommons.org/licenses/by/4.0/).
Share and Cite
Elkatatny, S.; Moussa, T.; Abdulraheem, A.; Mahmoud, M. A Self-Adaptive Artificial Intelligence Technique to Predict Oil Pressure Volume Temperature Properties. Energies 2018, 11, 3490. https://doi.org/10.3390/en11123490
Elkatatny S, Moussa T, Abdulraheem A, Mahmoud M. A Self-Adaptive Artificial Intelligence Technique to Predict Oil Pressure Volume Temperature Properties. Energies. 2018; 11(12):3490. https://doi.org/10.3390/en11123490
Chicago/Turabian StyleElkatatny, Salaheldin, Tamer Moussa, Abdulazeez Abdulraheem, and Mohamed Mahmoud. 2018. "A Self-Adaptive Artificial Intelligence Technique to Predict Oil Pressure Volume Temperature Properties" Energies 11, no. 12: 3490. https://doi.org/10.3390/en11123490
APA StyleElkatatny, S., Moussa, T., Abdulraheem, A., & Mahmoud, M. (2018). A Self-Adaptive Artificial Intelligence Technique to Predict Oil Pressure Volume Temperature Properties. Energies, 11(12), 3490. https://doi.org/10.3390/en11123490