1. Introduction
The importance of wind as a renewable energy has further increased. The interest in offshore wind power is increasing significantly worldwide. The reason is that the potential wind speed is higher than onshore. Furthermore, the installation and noise problems have been solved using the offshore wind farms in Central European countries [
1,
2]. Meanwhile, the offshore wind farms and the grid that requires long distance transmission are connected using DC transmission [
3].
The significant increase in the capacity of the wind generators has led to concerns about the grid stability. In particular, tripping in large capacity wind farms increases the risk of grid collapses. The tripping of the wind generators caused a power outage in Western Europe due to a 4892-MW loss [
4]. In the event of a grid fault, the LVRT solves the grid collapse problem caused by the tripping of the wind generator. The LVRT specifies the connection between the wind generator and the grid according to the fault condition. Furthermore, the LVRT specifies the amount of reactive power for recovery of the grid fault [
5,
6,
7,
8]. When the offshore wind farm and the grid are connected with the MVDC, the reactive power output of the MVDC increases to the recovery of the grid fault. In this situation, depending on the converter characteristics, the active power output decreases and the DC voltage of the MVDC rises due to the unbalanced power of the DC link [
9,
10,
11,
12].
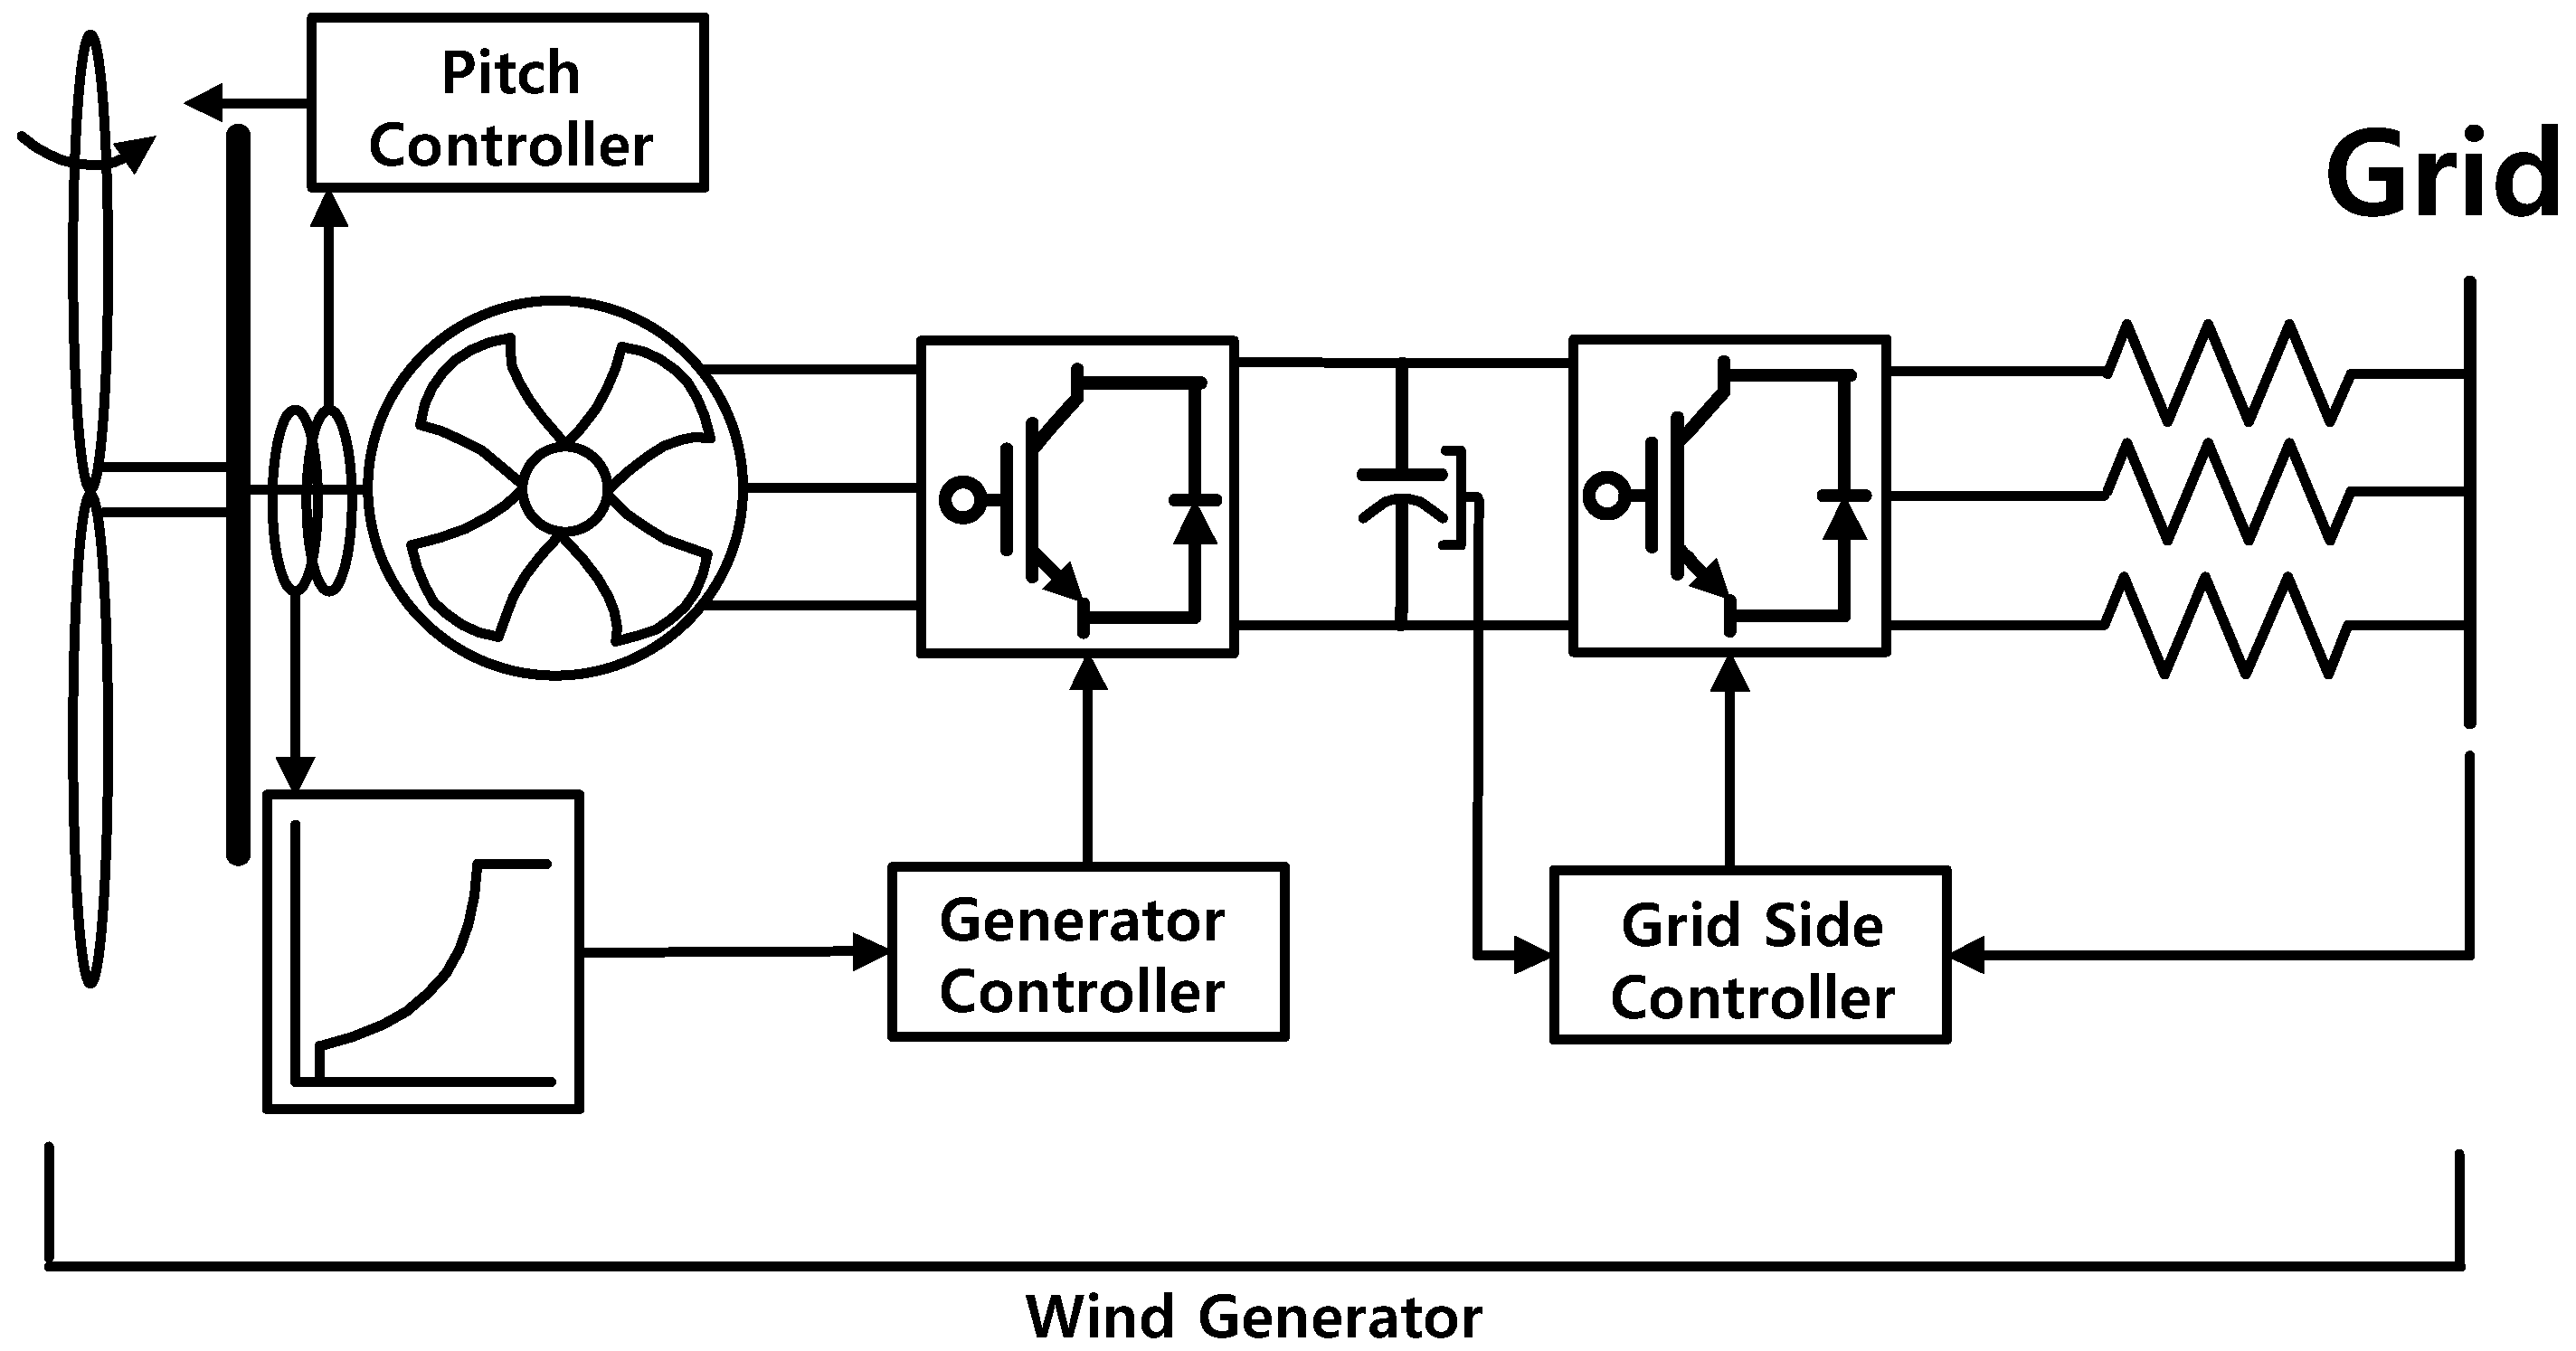
The method to suppress the DC voltage rise of the MVDC is wind generator control and the CR. The wind generator controller in
Figure 1 consists of three control loops such as the pitch controller, generator controller, and grid side controller. The pitch controller is activated to limit the rotor speed in high wind speeds. The generator controller moves the operating point for MPPT. The grid side controller adjusts the active power to maintain the DC voltage of the wind generator. Thus, when the DC voltage of the MVDC rises due to the grid fault, the output power of the wind generators is reduced to suppress the DC voltage of the MVDC. However, while wind generators are operating, the reduction performance of the output power is limited. The accumulated energy is converted into kinetic energy, which increases the rotor speed and the DC voltage of the wind generators. Furthermore, the communication delay (typical 10 ms) causes a higher DC voltage rise than the ideal situation and a larger problem if not properly communicated [
13,
14,
15].
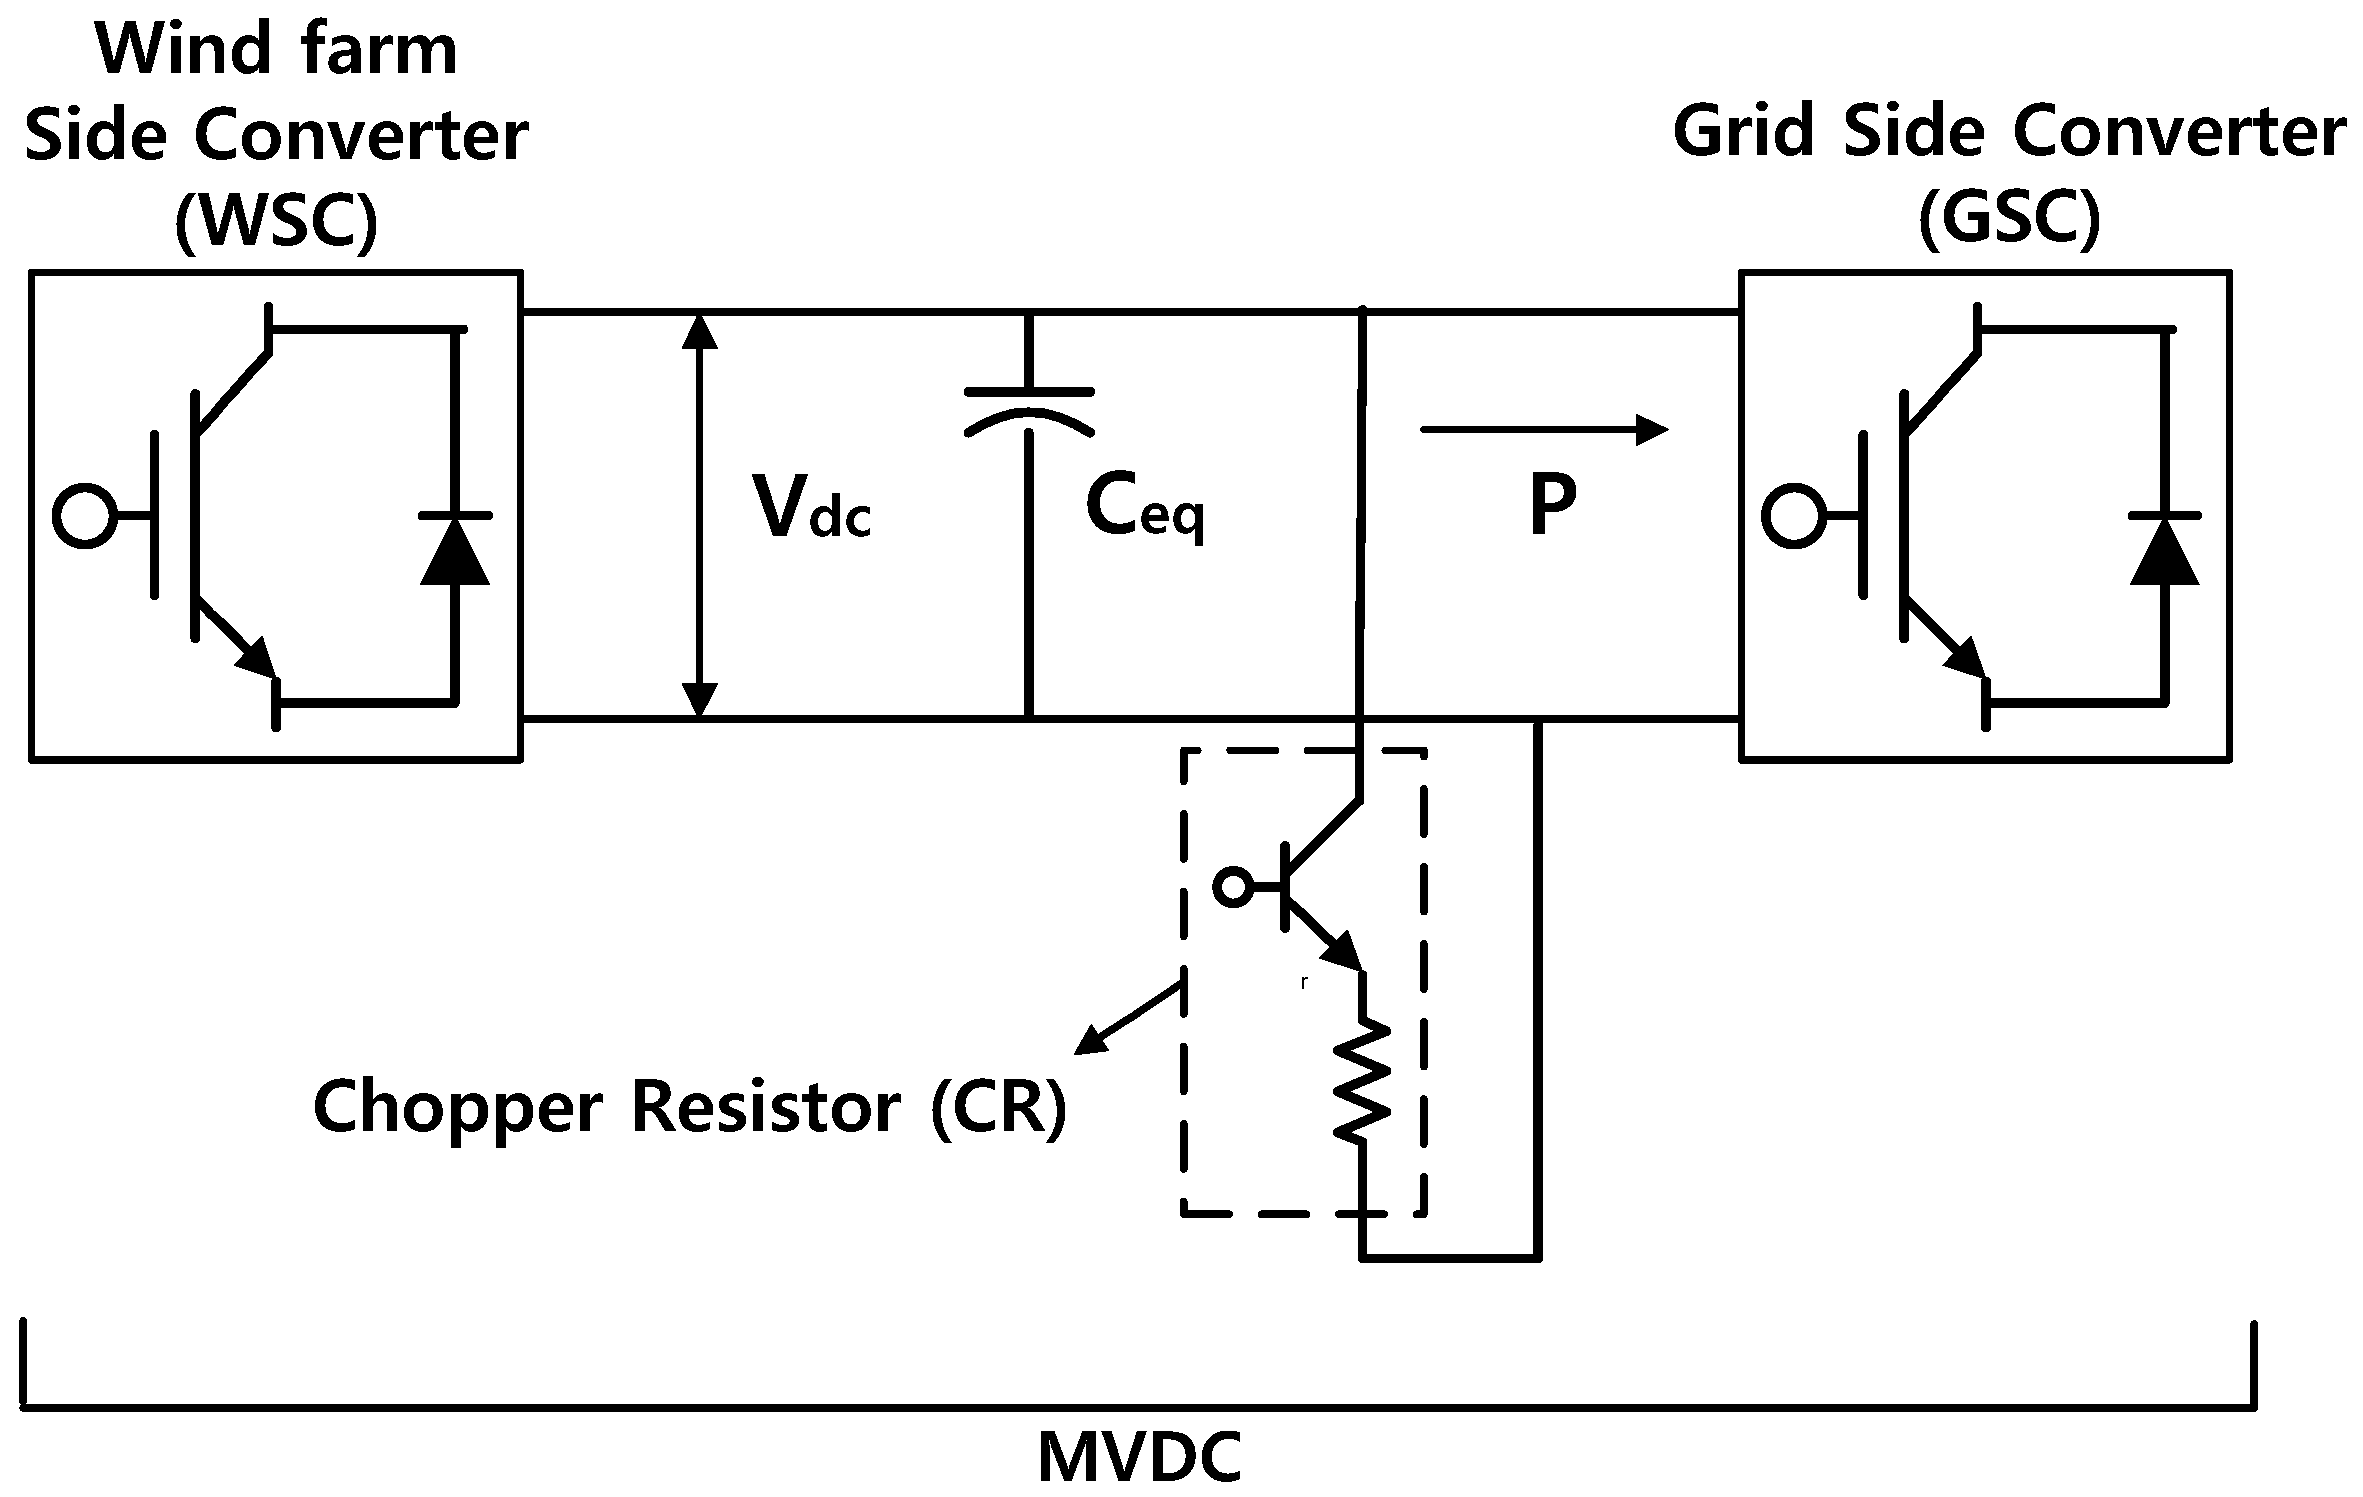
An alternative method to maintaining the DC voltage of the MVDC below the threshold during the grid fault is to dissipate the accumulated power as heat. The CR in
Figure 2 is linked to the DC link of the MVDC to dissipate the accumulated power during the grid fault [
16,
17,
18,
19].
The CR is more effective at the suppression of the MVDC link voltage compared to other methods. Furthermore, the CR is safe from problems of the communication delay because it is independent of the communication. However, the conventional CR only considers the system capacity and rated voltage. The DC voltage peak, current flowing in the CR, and settling time are not considered. If the current flowing in the CR is high, the cost is increased due to the necessity of the additional cooling device. In particular, the cost issue with regard to using external devices such as the CR is one of the important factors. The DC voltage peaks and settling time are important issues with regard to the system stability during the fault.
This paper proposes the parameter estimation of the CR considering the important factors.
Section 2 describes the MVDC, the LVRT, and the CR.
Section 3 describes the penalty method for estimating the parameter on the CR.
Section 4 verifies the proposed method through simulation.
Section 5 is the conclusion of this paper.
2. Simulation Modeling
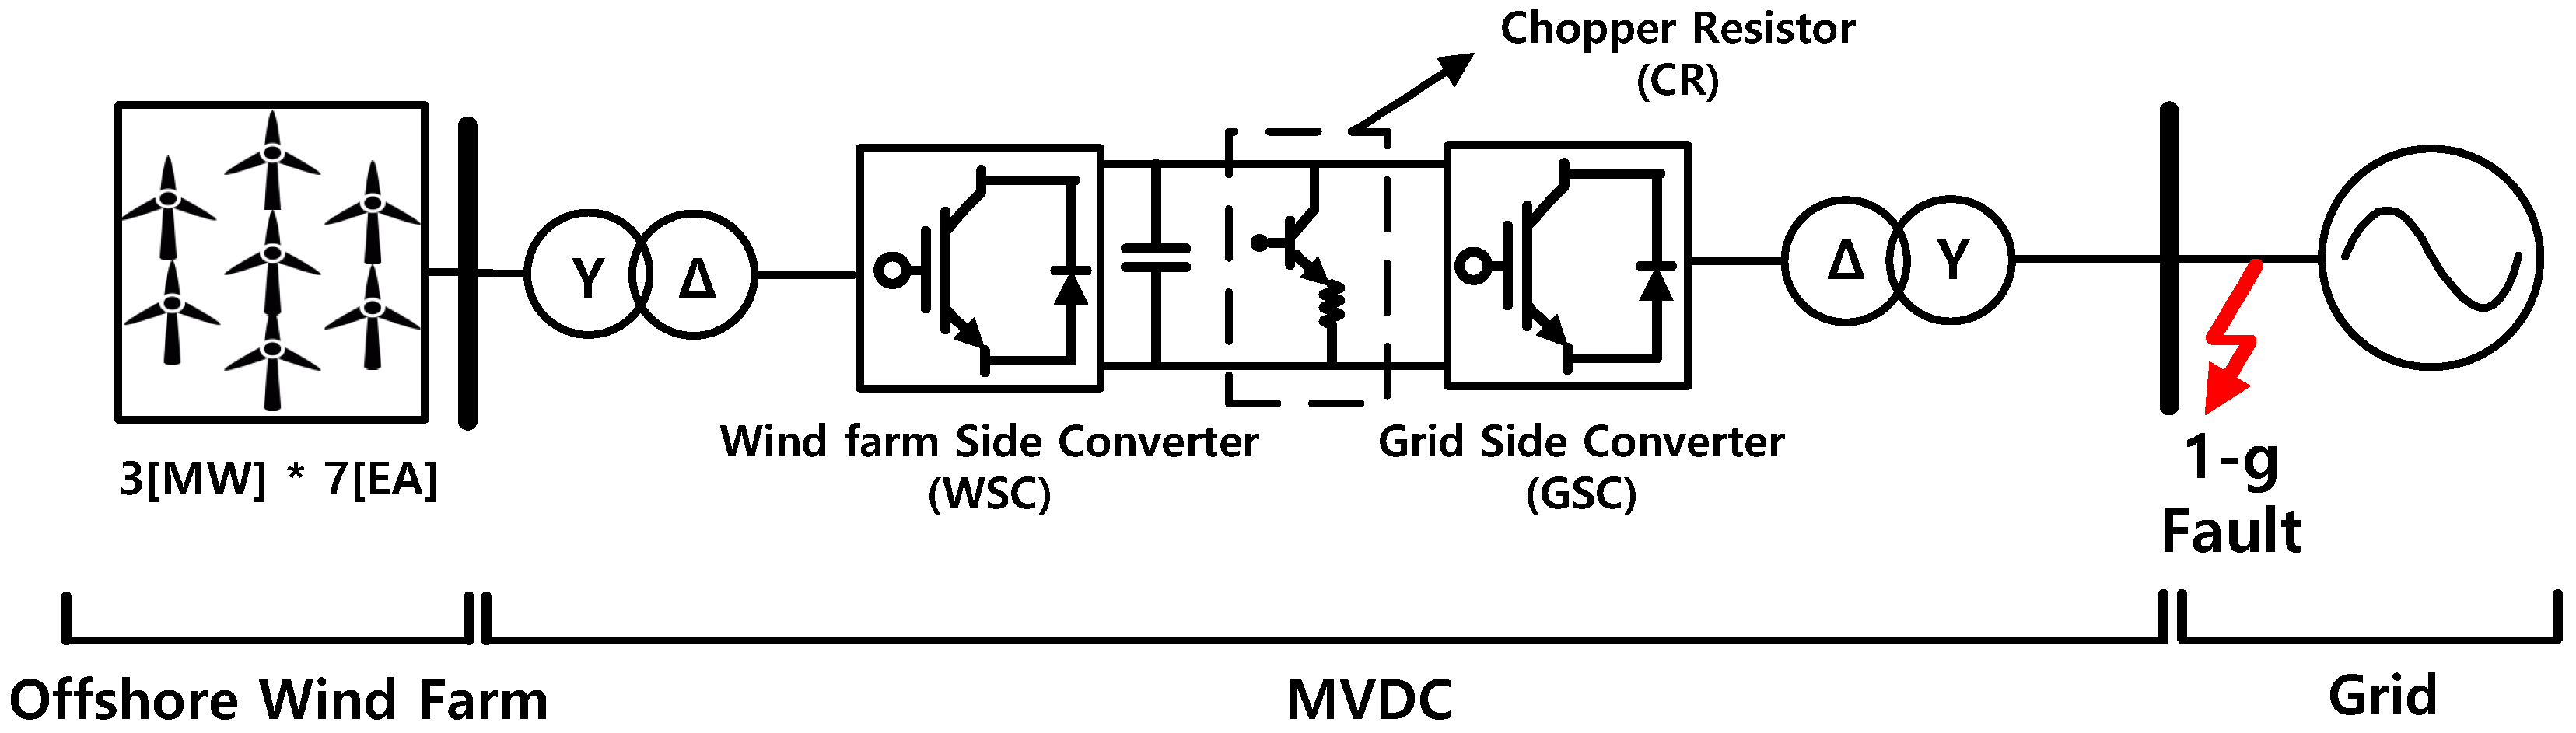
2.1. The MVDC for Offshore Wind Farms
DC transmission has the advantage of asynchronous coupling and loss reduction, as well as a lower insulation level. The DC transmission systems have been classified into VSC and LCC according to the power device type. The VSC-MVDC is suitable for offshore wind farms because it does not require an additional reactive power compensation device and requires only a small installation area [
20,
21].
Figure 3 shows the configuration of the MVDC for the offshore wind farm. The MVDC is connected to the offshore wind farms through the WSC and to the grid through the GSC.
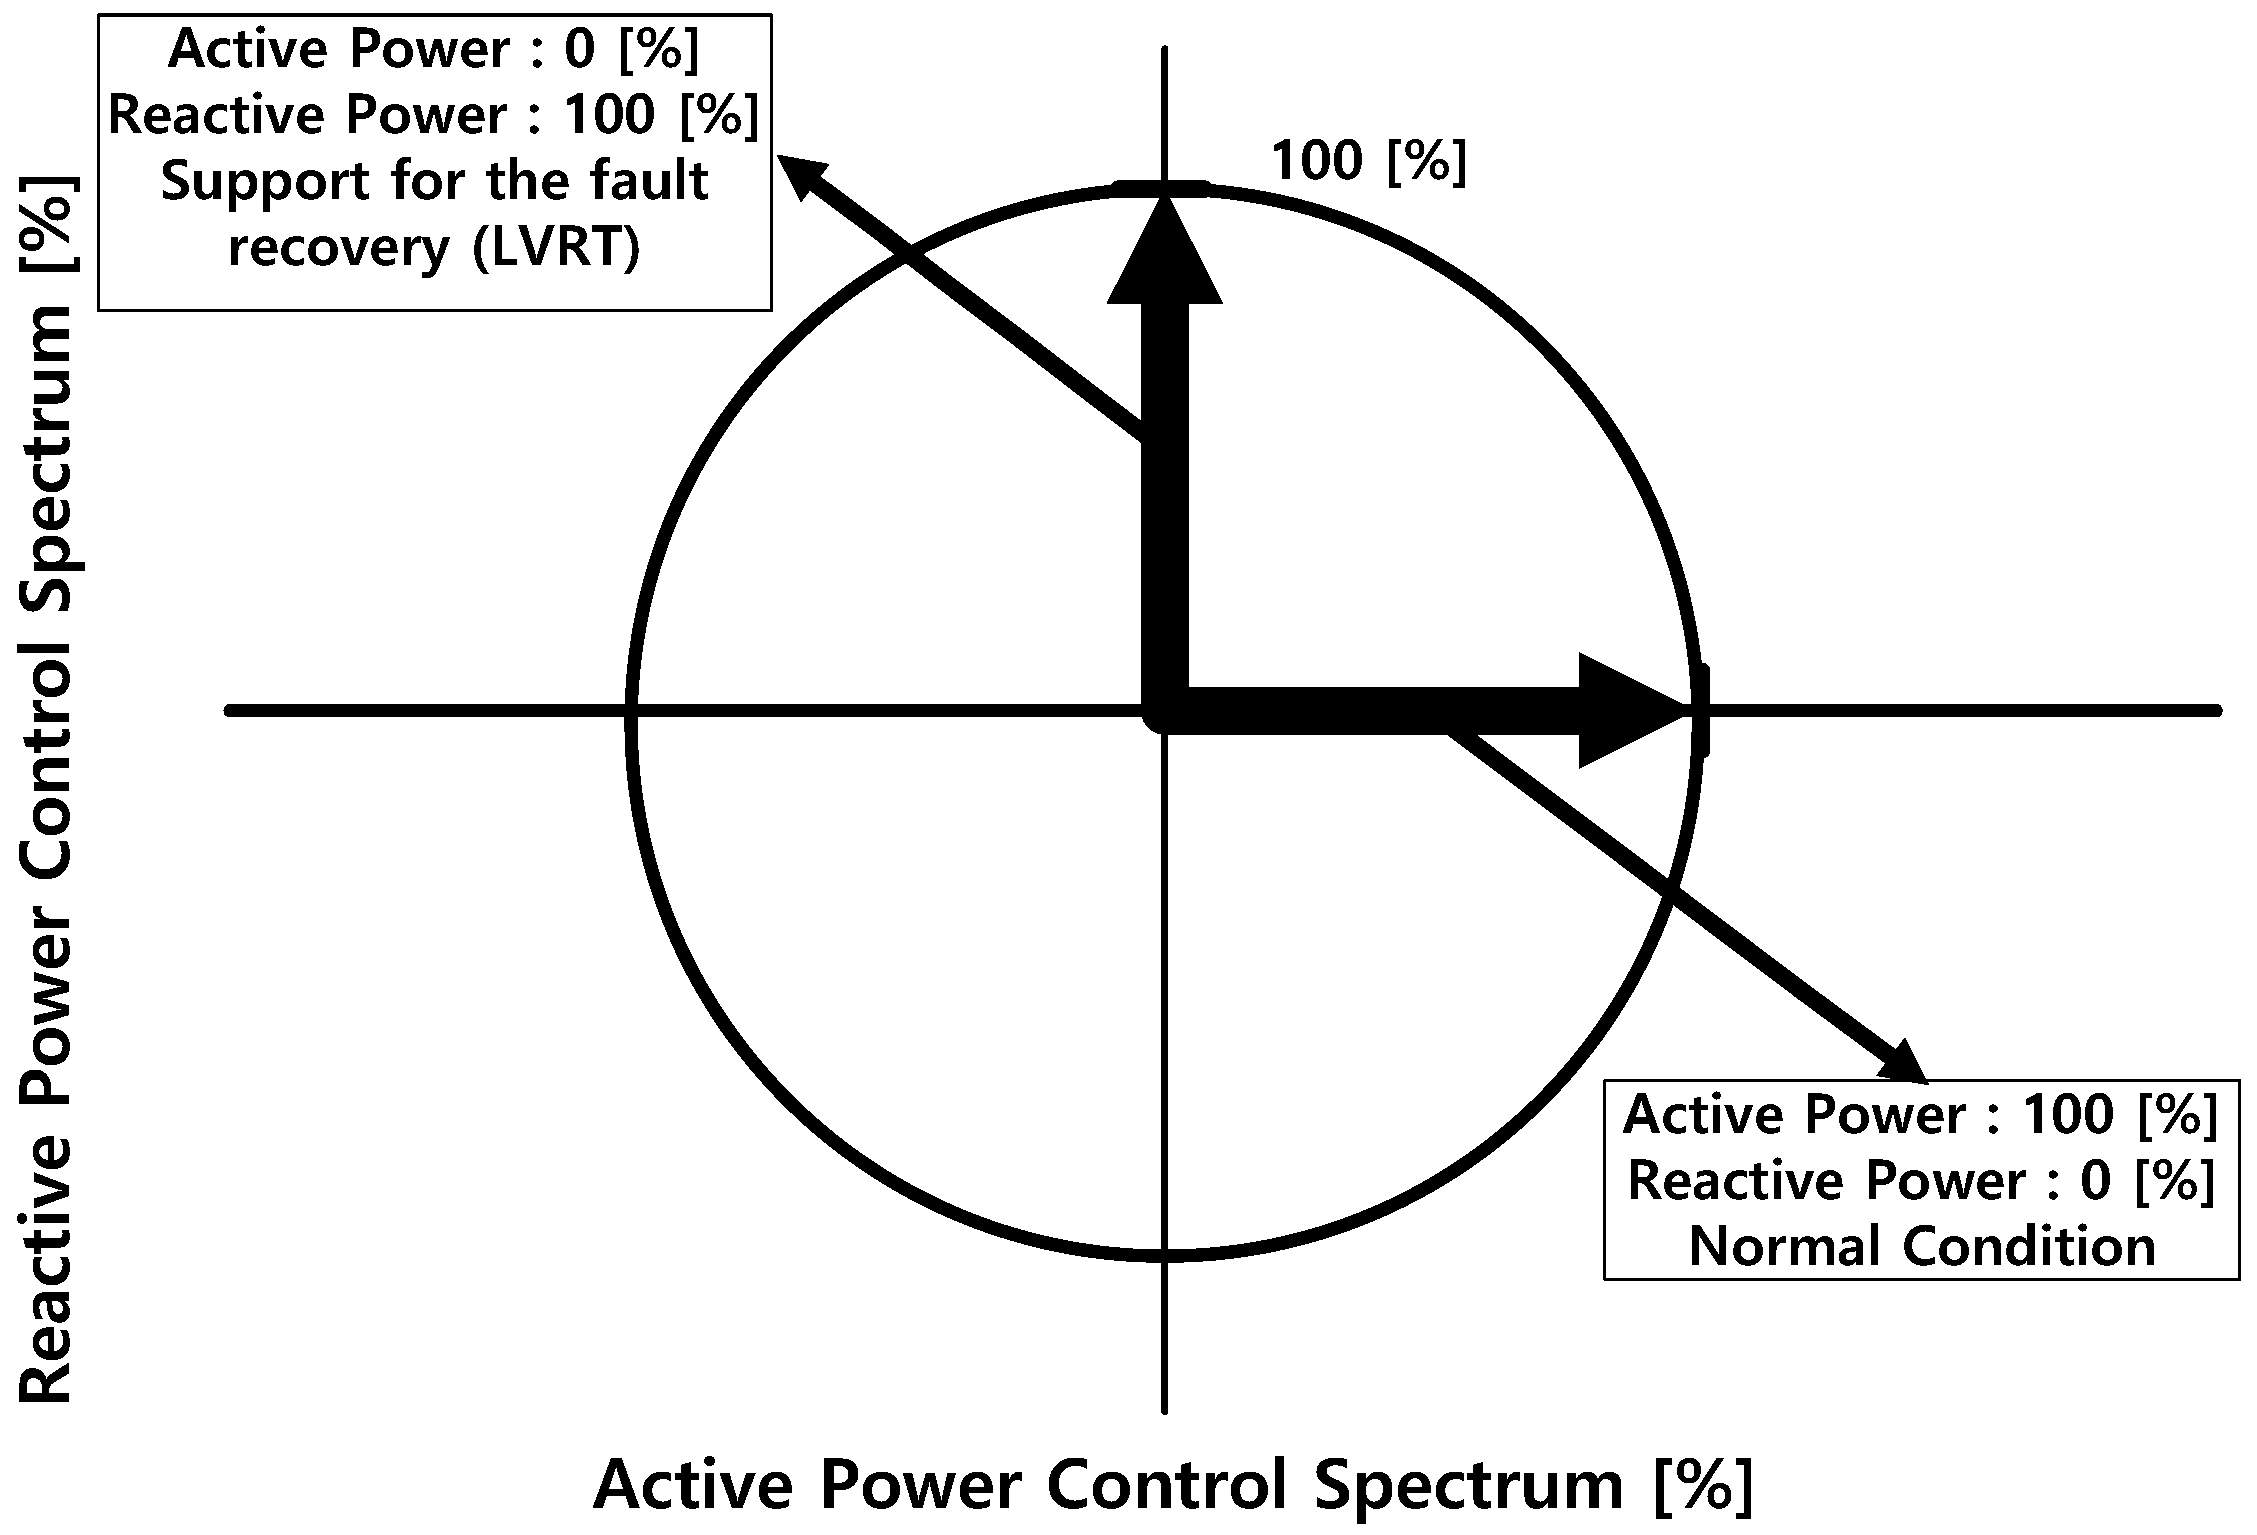
In the event of a grid fault, the reactive power output of the MVDC increases to support recovery of the grid fault. The reduction of the active power output due to the characteristics of the converter as shown in
Figure 4 results in the unbalanced power of the MVDC. Therefore, the DC voltage of the MVDC rises due to the unbalanced power of the input and output [
9,
10,
11,
12].
2.2. Low Voltage Ride-Through
All over the world, grid codes have been established to ensure system stability of the connection between renewable energy and the grid. If a grid fault occurs, the tripping of the wind generators from the fault causes a system collapse. The LVRT defines the actions according to the fault conditions to solve these problems.
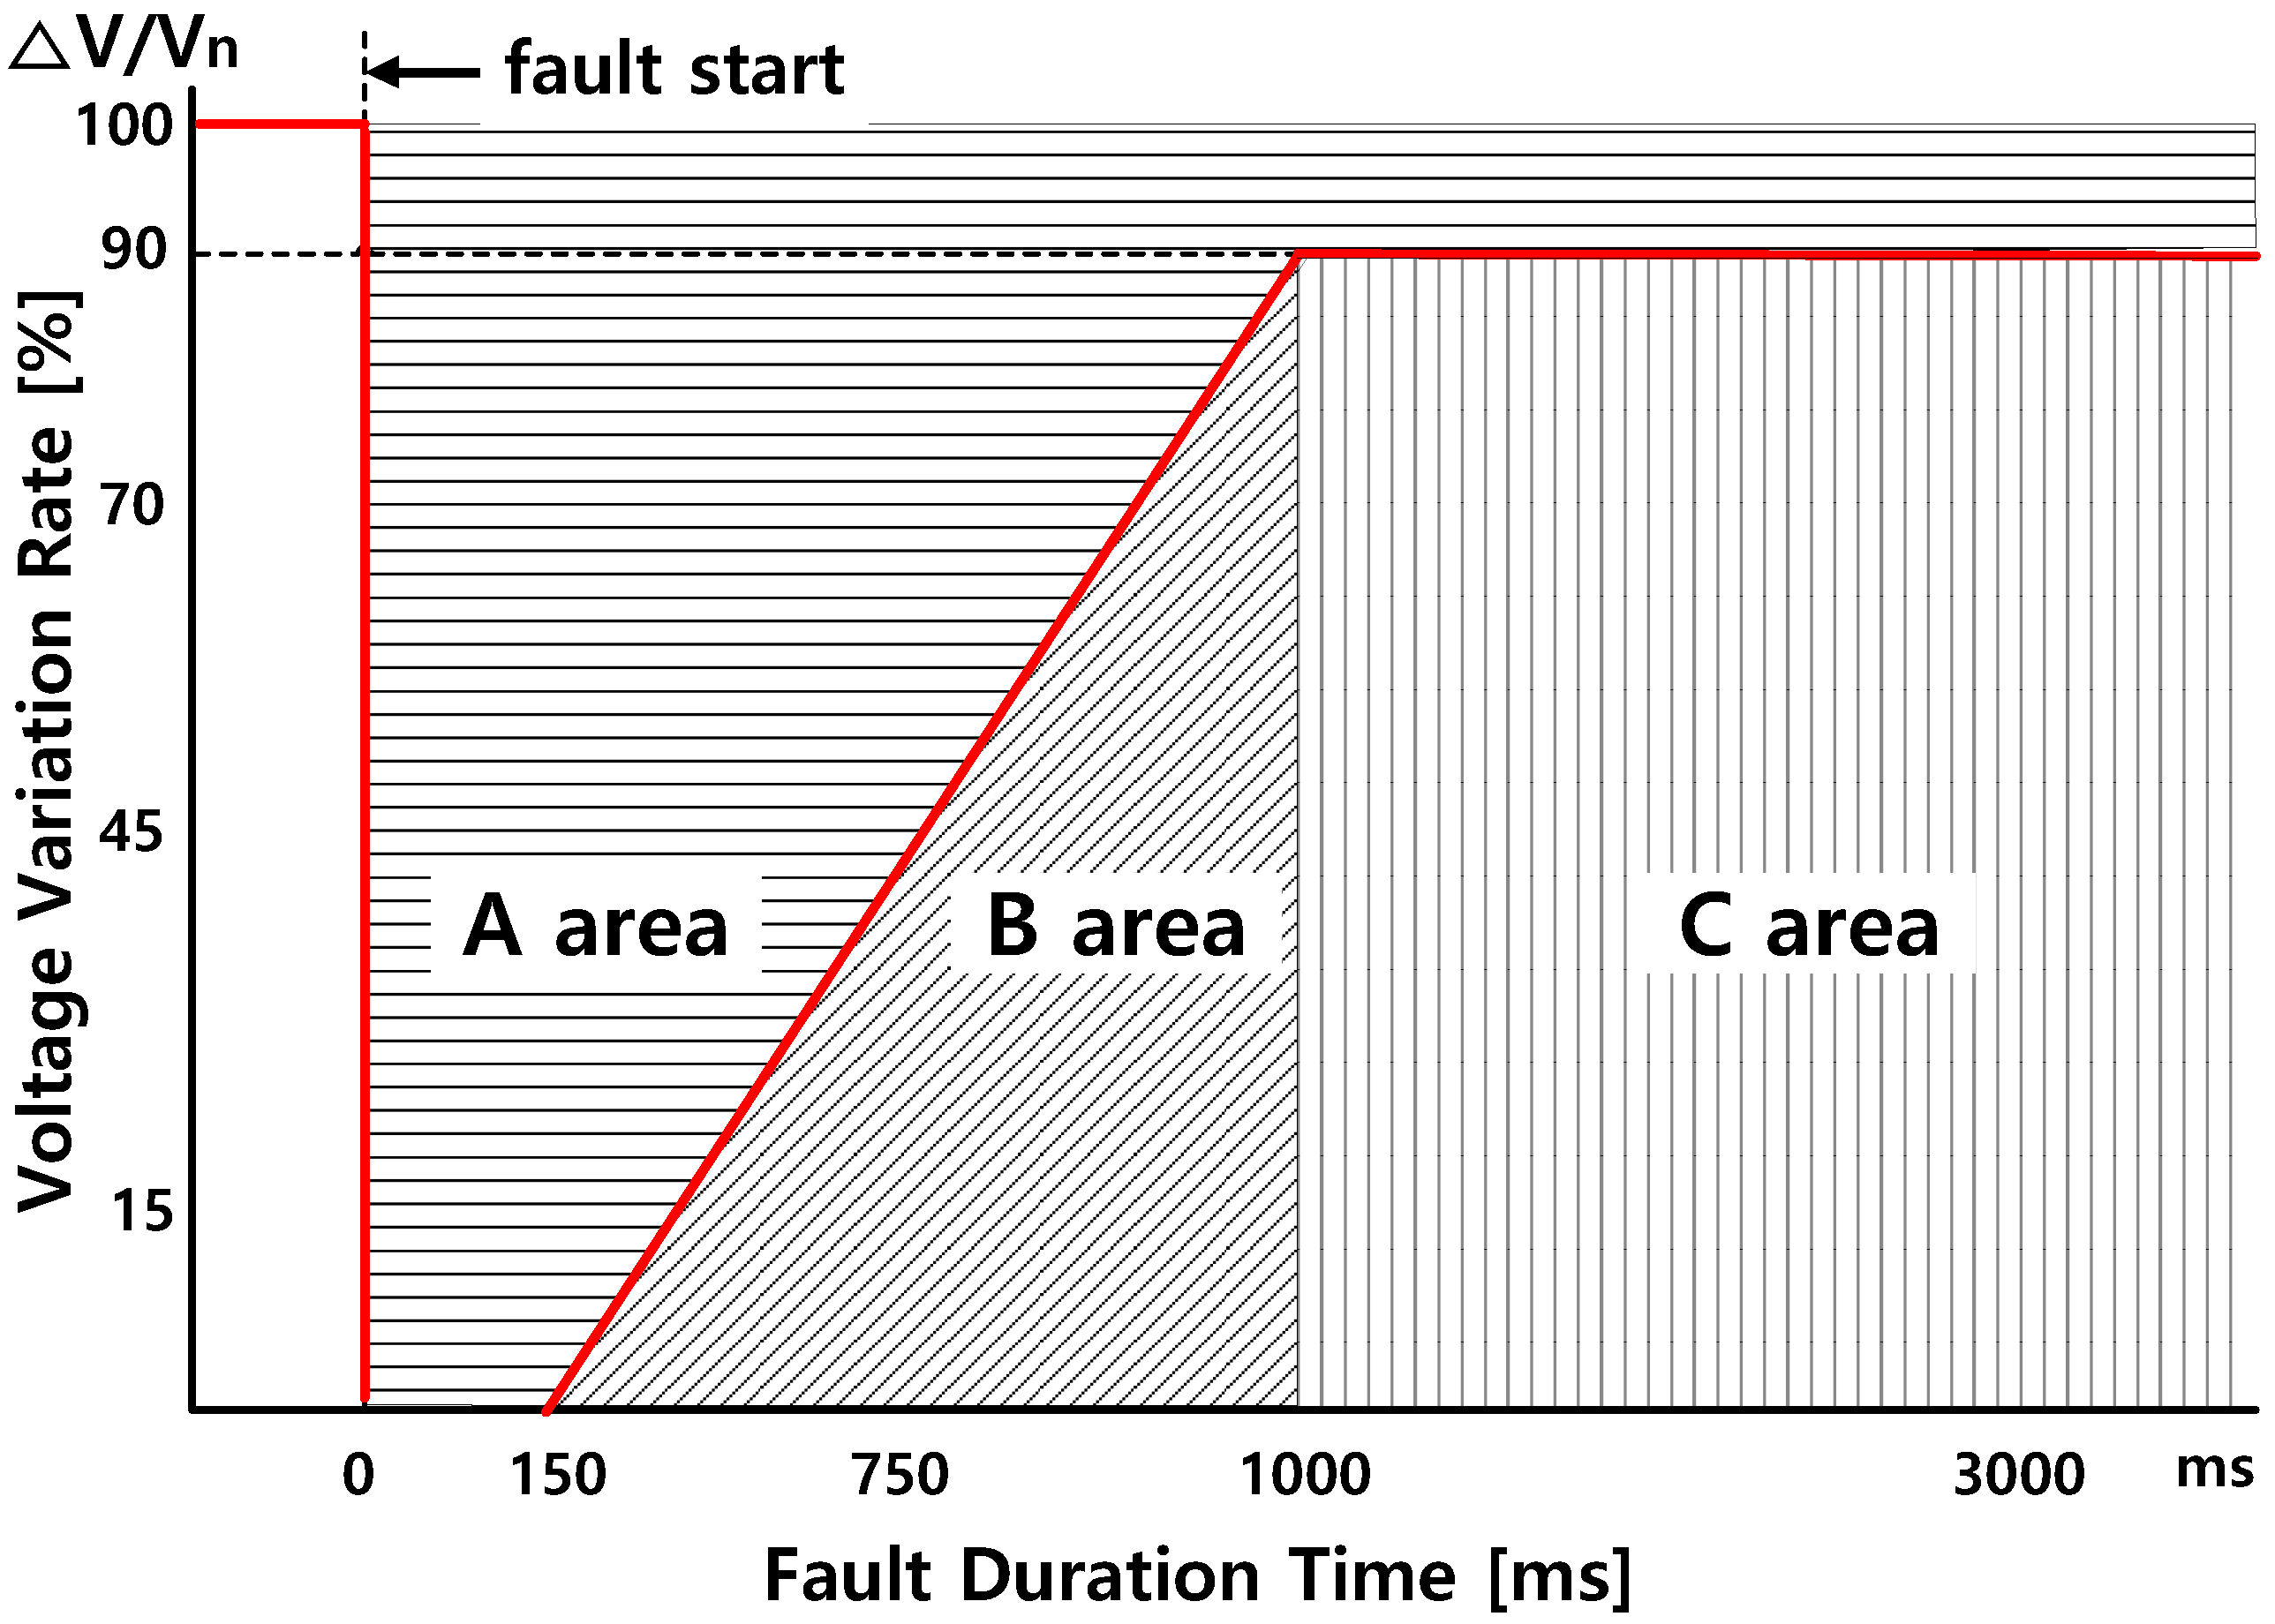
Figure 5 shows Germany’s LVRT based on many countries. Germany’s LVRT, which is the basis for other countries, is one of the strictest regulations in the world. The
x-axis represents the fault duration time. The
y-axis represents the highest value of the three-phase line-to-line grid voltage at the PCC. In the case of a fault corresponding to the area A, the wind generators must maintain the connection with the grid. In the case of a fault corresponding to the area B, the wind generators and the grid can be disconnected. However, the wind generators and the grid must resynchronize within two seconds after the fault removal. Furthermore, the active power must be provided to the grid at a 10% rate of the rated capacity per second. In the event of the fault corresponding to the area C, the wind generators and the grid are disconnected [
5,
6,
7,
8].
Figure 6 shows the reactive current supply condition. The MVDC does not need to supply the reactive power to the grid when the grid voltage is within the normal range. However, if the grid voltage is outside the normal range, the MVDC must supply the reactive power to the grid according to the voltage variation rate [
5,
6,
7,
8]. Thus, in the case of the fault corresponding to the area A or B, the MVDC should contribute to the recovery of the grid fault. In this situation, the DC voltage of the MVDC rises due to unbalanced power, as shown in
Figure 4 [
9,
10,
11,
12].
2.3. Chopper Resistor
Section 2.3 describes the CR for the suppression of the DC voltage rise. Equation (
1) shows the conventional parameter estimation of the CR. If the rise of the DC voltage is limited to 5% of the rating, the current flowing in the CR is Equation (
2). Equation (
3) shows the operating signal of the CR. When the DC voltage rises above the threshold (
), the accumulated power is dissipated as thermal energy. Thereafter, when the grid fault is removed or the DC voltage is reduced below the threshold (
), the CR is separated from the DC link. Therefore, the unbalanced power of the DC link can be solved, and the DC voltage rise of the MVDC is suppressed [
16,
17,
18,
19]. However, the conventional CR parameters have been estimated considering system capacity and rated voltage and focusing on the application to the DC link of the wind generators.
Section 3 explains how to estimate the optimal parameters considering important factors.
3. Parameter Estimation Method
3.1. Penalty Method
Section 3.1 describes the penalty method for the parameter estimation. Equation (
4) represents the evaluation index. The evaluation value represents the performance according to the parameter change. The evaluation criterion represents the performance for the criterion parameter. The evaluation index represents the ratio of changed parameter performance to criterion parameter performance. Equation (
5) represents the total fitness value, which is the sum of the evaluation index considering each evaluation factor.
Figure 7 shows the flowchart for finding the optimal parameters. First, the evaluation factor and the evaluation criterion are selected for the objective function design. The evaluation factors are the important factors affecting the optimal parameters. The evaluation criterion is generally selected with the conventional method because the improved method can be found through comparison with the conventional method. After designing the objective function, the optimal parameter can be found by calculating the total fitness value.
Figure 8 shows the concept of the penalty method. The optimal parameters are determined by the total fitness value. If the low value of the performance indicates a good control effect, the optimal parameter is when the total fitness value is at a minimum point. The region where the total fitness value is smaller than one, as shown in
Figure 8a, means better performance than the conventional parameter estimation. Thus, the minimum point of the total fitness value represents the optimal parameter. Conversely, If the high value of the performance indicates a good control effect, the optimal parameter is when the total fitness value is at a maximum point. The region where the total fitness value is higher than one, as shown in
Figure 8b, means better performance than the conventional parameter estimation. In this case, the maximum point of the total fitness value represents the optimal parameter [
22,
23,
24,
25].
3.2. Parameter Estimation
Section 3.2 describes the parameter estimation of the CR using the penalty method. Equation (
6) is the total fitness value considering evaluation factors such as the DC voltage peak, the current flowing in the CR, and the settling time. The evaluation criterion is the value of the performance when using Equation (
1) for conventional parameter estimation. The evaluation factors such as DC voltage peak, current flowing in CR, and settling time have a better effect on the system, with a lower value of the performance. Therefore, the performance value of the changed parameters implies a better effect than the performance value of conventional parameters when the total fitness value is less than one. Furthermore, the optimal parameter is when the total fitness value is minimum.
Figure 9 shows the total fitness value for finding the optimal parameter. The
x-axis represents the parameter, and the
y-axis represents the total fitness value. The parameter corresponding to the region in which the total fitness value is smaller than one represents a more effective method than the conventional parameter estimation. Since the current flowing in the CR and the settling time increases, the total fitness value increases when the parameter is lower than 20. Furthermore, as the parameter increases to morethan 25, the total fitness value increases because the suppression of the DC voltage peak is difficult.
4. Simulation
4.1. Simulation Result
Section 4.1 verifies the proposed parameter estimation using PSCAD/EMTDC.
Figure 10a shows the active power and reactive power of the WSC without control. When the grid fault occurred, the active power was continuously being input from the wind generators to the MVDC.
Figure 10b shows the active power and reactive power of the GSC without control. The reactive power output of the MVDC increased to contribute to the fault recovery in the grid. The output of the active power decreased due to the converter characteristics. As a result, the DC voltage rose due to the unbalanced power of the MVDC input and output, as shown in
Figure 11. The DC voltage of the MVDC rose to 26.11 kV without control. In the case of the wind generators control, the DC voltage was suppressed to 25.44 kV, and the settling time was reduced to 2.85 s. In the case of the CR, the DC voltage peak was suppressed to 20.95 kV, and the settling time was improved to 2.52 s.
Figure 12 shows the DC voltage of the MVDC when applying the CR. In the case of the conventional parameter estimation, the DC voltage peak was 1.046 p.u, and the settling time was 2.52 s. In the case of the proposed parameter estimation, the voltage peak was suppressed to 1.03 p.u, and the settling time was improved to 2.44 s.
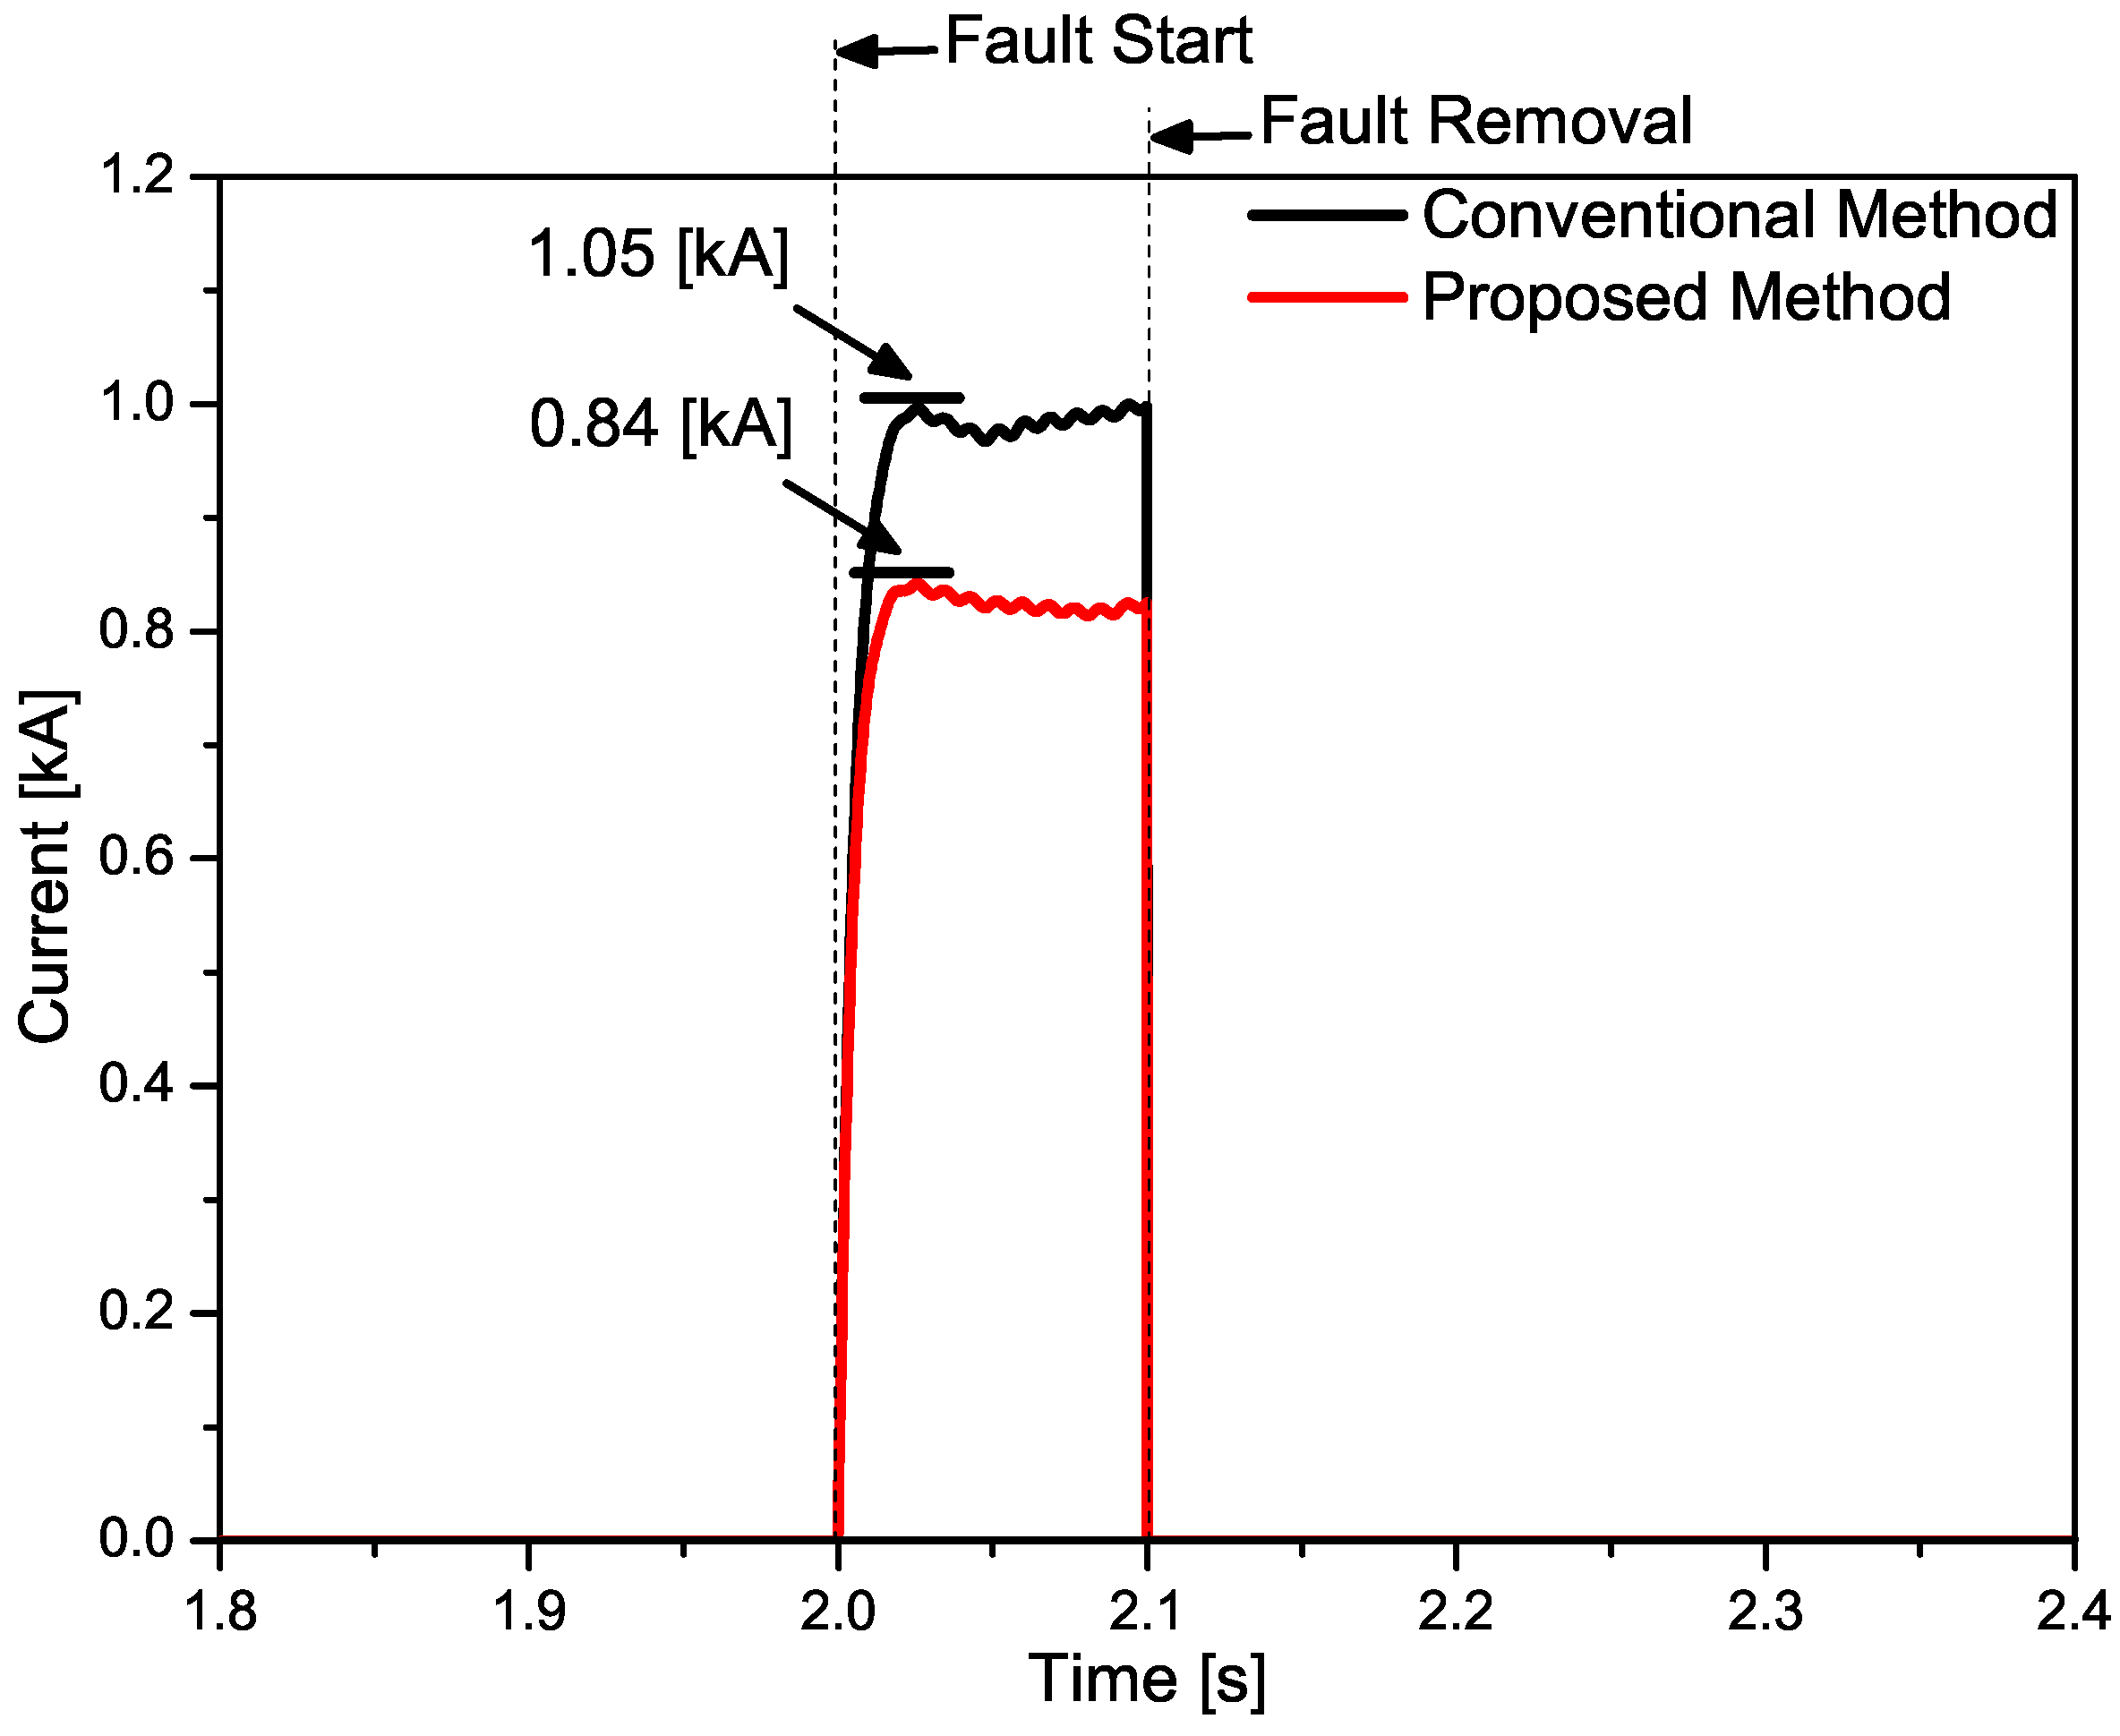
Figure 13 shows the current flowing in the CR for each case. In the case of the conventional parameter estimation, the current peak flowing in the CR was 1.05 kA. In the case of the proposed parameter estimation, the current peak flowing in the CR was improved 0.84 kA. The current peak of the proposed method was reduced by about 20% compared to the conventional method.
4.2. Discussions
In the event of the grid fault, the wind generators and the MVDC contribute to recovery of the grid fault for LVRT satisfaction. This situation causes the DC voltage rise of the MVDC due to unbalanced power. Generally, the DC voltage rise is suppressed by using the wind generators to control the CR. In
Figure 11, the DC voltage rise is more effectively suppressed using the CR than the other method. However, the conventional CR design only considers the system capacity and the rated voltage. The factors such as the voltage peak, the current flowing in the CR, and the settling time are not considered in the CR design. Therefore, this paper proposes the CR design by estimating optimal parameters considering important factors. In
Figure 12, the proposed method suppresses the DC voltage peak and improves the settling time better than the conventional method. In
Figure 13, the current peak flowing in the CR is reduced by 20% compared to the conventional method. This paper confirmed that the evaluation factors such as the DC voltage peak, current flowing in the CR, and settling time were improved through the optimal parameter estimation using the penalty method.
The
Appendix presents the parameters of this paper’s simulation.
Table A1 represents the parameters of the wind generator.
Table A2 represents the MVDC parameters for the offshore wind farm. This paper applied these parameters to PSCAD/EMTDC.
5. Conclusions
When a grid fault occurs, the wind generators and the MVDC are tripped to protect the devices. In this situation, as the capacity of the wind generators increases, the tripping of the wind generators and the grid results in the collapse of the system. To solve these problems, the wind generators and the MVDC should contribute to the grid fault recovery by LVRT. As a result, the MVDC has the problem that the DC voltage rises due to the unbalanced power of the input and output. The CR effectively suppresses the DC voltage rise better than other methods. However, the conventional CR has only been designed considering the system capacity and rated voltage. Therefore, this paper proposed a CR design by parameter estimation of the CR considering important factors.
This paper confirms the following advantages.
The CR is the most effective at suppressing DC voltage rises compared to other methods.
When designing the CR, the current flowing in the CR was considered. Therefore, the current peak flowing in the CR has been reduced. Accordingly, the cost of the additional cooling device can be saved.
When designing the CR, the settling time was considered. Therefore, The settling time has been improved. Accordingly, the stability of the system has been improved.
The proposed CR parameter estimation was enough to suppress the voltage below the threshold.
The parameters of CR can be estimated appropriately by weighting factors according to the importance of the factors.
The CR control has been commonly used to suppress the DC voltage rise of the wind generators and to enhance the LVRT capability. The important factors should be considered when applying the CR to the DC transmission system. The reason is that the capacity of the DC transmission system is greater than the wind generators and affects the system stability. The proposed CR design method can be slightly more expensive than conventional methods depending on the situation. However, the proposed method will be applied to many systems because the systems obtain many benefits.
Author Contributions
Methodology, J.-S.K.; Writing—Original Draft, H.-J.L.; Writing—Review and Editing, J.-C.K.
Funding
This research was supported in part by Korea Electric Power Corporation (Grant number: R18XA04), in part by the Korea Institute of Energy Technology Evaluation and Planning(KETEP) and the Ministry of Trade, Industry & Energy(MOTIE) of the Republic of Korea (No. 20179310100050).
Acknowledgments
This research was supported in part by Korea Electric Power Corporation (Grant Number R18XA04), in part by the Korea Institute of Energy Technology Evaluation and Planning (KETEP), and the Ministry of Trade, Industry & Energy (MOTIE) of the Republic of Korea (No. 20179310100050).
Conflicts of Interest
The authors declare no conflict of interest.
Abbreviations
The following abbreviations are used in this manuscript:
| Chopper Resistor or DC Chopper Resistor |
| Fault Ride Through |
| Grid Side Converter |
| i | Evaluation factors |
| Line Commutated Converters |
| Low Voltage Ride Through |
| Modular Multi-level Converter |
| Maximum Power Point Tracking |
| Medium Voltage Direct Current |
| System’s rated capacity |
| Point of the Common Coupling |
| Power System Computer Aided Design/ElectroMagnetic Transients including DC |
| Parameter of chopper resistor |
| Rated voltage |
| Voltage Source Converters |
| w | Evaluation factor weights |
| Wind farm Side Converter |
Appendix A
Table A1.
The parameters for the PMSG wind turbine generator.
Table A1.
The parameters for the PMSG wind turbine generator.
| Classification | Parameter |
|---|
| Rated Capacity | 3.0 MW |
| Generator Type | PMSG |
| Stator Resistor | 0.005 p.u |
| Stator Leakage Reactance | 0.154 p.u |
| Rated Voltage (L-G) | 0.398 kV |
| Rated Current | 2.51 kA |
Table A2.
The MVDC parameters for the offshore wind farm.
Table A2.
The MVDC parameters for the offshore wind farm.
| Item | Classification | Parameter |
|---|
| | Rated Capacity | 21 MW (3 MW × 7) |
| Wind Power System | Normal Operation Capacity | 20 MW |
| | PCC-1 Transformer | 0.69/22.9 kV |
| | Bus Voltage | 3-Phase 22.9 kV |
| AC Grid | Bus Frequency | 60 Hz |
| Circuit Constant | Line Inductance | Sending: 0.15 p.u/Receiving: 0.15 p.u |
| | Converter Transformer Ratio | 22.9/11.75 kV |
| | Control | MMC Type (11-Level) |
| | DC Voltage | 20 kV |
| MVDC | System Capacity | 20 MVA |
| Constant | Switching Frequency | 1980 Hz |
| | Converter Control | / |
| | Inverter Control | / |
| | Location | Transformer Primary AC Grid Side |
| Fault Scenario | Type | a-Phase Grounding Fault |
| | Fault Time | Start: 2.0 s; Removal: 2.1 s |
References
- Ackermann, T. Wind Power in Power Systems; John Wiley & Sons: Hoboken, NJ, USA, 2005. [Google Scholar]
- GWEC. Global Wind Report: Annual Market Update 2015; Global Wind Energy Council: Brussels, Belgium, 2017. [Google Scholar]
- Flourentzou, N.; Agelidis, V.G.; Demetriades, G.D. VSC-based HVDC power transmission systems: An overview. IEEE Trans. Power Electron. 2009, 24, 592–602. [Google Scholar] [CrossRef]
- Maas, G.A.; Bial, M.; Fijalkowski, J. Final Report-System Disturbance on 4 November 2006; Tech. Rep.; Union for the Coordination of Transmission of Electricity in Europe: Brussels, Belgium, 2007. [Google Scholar]
- Tsili, M.; Papathanassiou, S. A review of grid code technical requirements for wind farms. IET Renew. Power Gener. 2009, 3, 308–332. [Google Scholar] [CrossRef]
- E-One Netz GmbH. Grid Code; High and Extra High Voltage; E-One Netz GmbH: Bayreuth, Germany, 2006; Volume 4. [Google Scholar]
- Tsili, M.; Patsiouras, C.; Papathanassiou, S. Grid code requirements for large wind farms: A review of technical regulations and available wind turbine technologies. In Proceedings of the EWEC, Brussels, Belgium, 31 March–3 April 2008; pp. 1–11. [Google Scholar]
- Erlich, I.; Bachmann, U. Grid code requirements concerning connection and operation of wind turbines in Germany. In Proceedings of the IEEE Power Engineering Society General Meeting, San Francisco, CA, USA, 16 June 2005; pp. 1253–1257. [Google Scholar]
- Le, V.; Li, X.; Li, Y.; Dong, T.L.; Le, C. An innovative control strategy to improve the fault ride-through capability of DFIGs based on wind energy conversion systems. Energies 2016, 9, 69. [Google Scholar] [CrossRef]
- Zhang, X.; Wu, Z.; Hu, M.; Li, X.; Lv, G. Coordinated control strategies of VSC-HVDC-based wind power systems for low voltage ride through. Energies 2015, 8, 7224–7242. [Google Scholar] [CrossRef]
- Ramtharan, G.; Arulampalam, A.; Ekanayake, J.B.; Hughes, F.M.; Jenkins, N. Fault ride through of fully rated converter wind turbines with AC and DC transmission systems. IET Renew. Power Gener. 2009, 3, 426–438. [Google Scholar] [CrossRef]
- Huh, J.S.; Moon, W.S.; Park, S.I.; Kim, D.H.; Kim, J.C. DC-link Voltage Control of HVDC for Offshore Wind Farm using Improved De-loading Method. Trans. Korean Inst. Electr. Eng. 2015, 64, 399–404. [Google Scholar] [CrossRef]
- Bossanyi, E.A. The design of closed loop controllers for wind turbines. Wind Energy Int. J. Prog. Appl. Wind Power Convers. Technol. 2000, 3, 149–163. [Google Scholar]
- Chinchilla, M.; Arnaltes, S.; Burgos, J.C. Control of permanent-magnet generators applied to variable-speed wind-energy systems connected to the grid. IEEE Trans. Energy Convers. 2006, 2, 130–135. [Google Scholar] [CrossRef]
- Hartge, S.; Fischer, F. FACTS capabilities of wind energy converters. In Proceedings of the EWEC, Athens, Greece, 27 February–2 March 2006. [Google Scholar]
- Chaudhary, S.K.; Teodorescu, R.; Rodriguez, P.; Kjaer, P.C. Chopper controlled resistors in VSC-HVDC transmission for WPP with full-scale converters. In Proceedings of the 2009 IEEE PES/IAS Conference on Sustainable Alternative Energy (SAE), Valencia, Spain, 28–30 September 2009; pp. 1–8. [Google Scholar]
- Wu, J.; Zhang, S.; Xu, D. Modeling and control of multi-terminal HVDC with offshore wind farm integration and DC chopper based protection strategies. In Proceedings of the IECON 2013—39th Annual Conference of the IEEE Industrial Electronics Society, Vienna, Austria, 10–13 November 2013; pp. 1013–1018. [Google Scholar]
- Adeuyi, O.D.; Cheah-Mane, M.; Liang, J.; Livermore, L.; Mu, Q. Preventing DC over-voltage in multi-terminal HVDC transmission. CSEE J. Power Energy Syst. 2015, 1, 86–94. [Google Scholar] [CrossRef]
- Nentwig, C.; Haubrock, J.; Renner, R.H.; Van Hertem, D. Application of DC choppers in HVDC grids. In Proceedings of the 2016 IEEE International Energy Conference (ENERGYCON), Leuven, Belgium, 4–8 April 2016; pp. 1–5. [Google Scholar]
- Engel, S.P.; Stieneker, M.; Soltau, N.; Rabiee, S.; Stagge, H.; De Doncker, R.W. Comparison of the modular multilevel DC converter and the dual-active bridge converter for power conversion in HVDC and MVDC grids. IEEE Trans. Power Electron. 2015, 30, 124–137. [Google Scholar] [CrossRef]
- Marquardt, R. Modular Multilevel Converter: An universal concept for HVDC-Networks and extended DC-Bus-applications. In Proceedings of the 2010 International Power Electronics Conference (IPEC), Sapporo, Japan, 21–24 June 2010. [Google Scholar]
- Luenberger, D.G.; Ye, Y. Linear and Nonlinear Programming; Springer: Berlin, Germany, 1984; Volume 2. [Google Scholar]
- Forsythe, G.E.; Moler, C.B. Computer Solution of Linear Algebraic Systems; Prentice-Hall: Upper Saddle River, NJ, USA, 1967. [Google Scholar]
- Wismer, D.A.; Chattergy, R. Introduction to Nonlinear Optimization: A Problem Solving Approach; North Holland: Amsterdam, The Netherlands, 1978; Volume 1. [Google Scholar]
- Bertsekas, D.P. Nonlinear Programming; Athena Scientific: Belmont, MA, USA, 1999. [Google Scholar]
© 2018 by the authors. Licensee MDPI, Basel, Switzerland. This article is an open access article distributed under the terms and conditions of the Creative Commons Attribution (CC BY) license (http://creativecommons.org/licenses/by/4.0/).


