Finite Element Method Investigation and Loss Estimation of a Permanent Magnet Synchronous Generator Feeding a Non-Linear Load


Abstract
1. Introduction
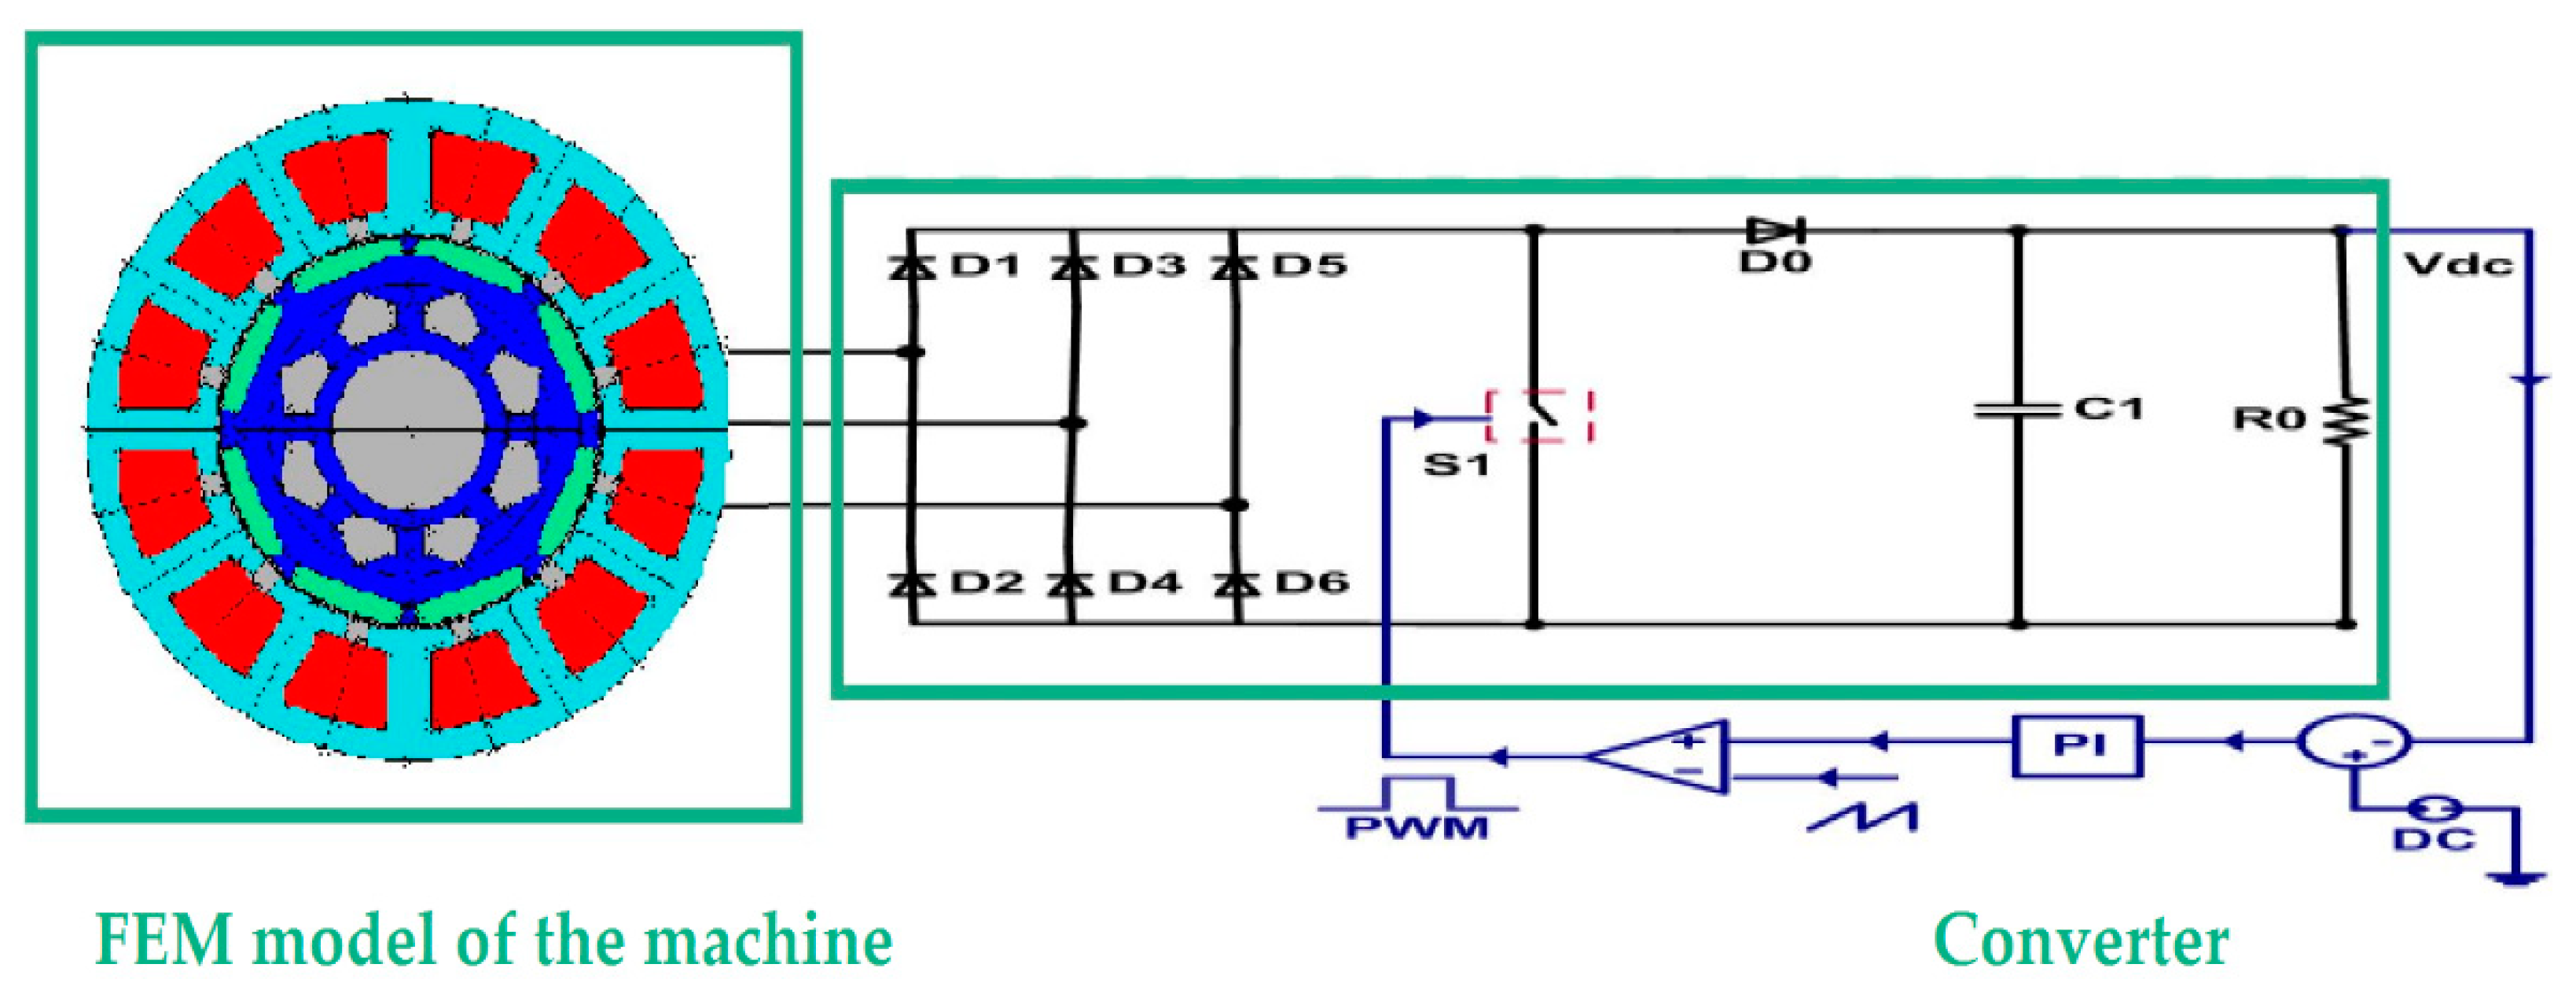
2. The Wind Power System
3. Loss Terms
3.1. Copper Losses
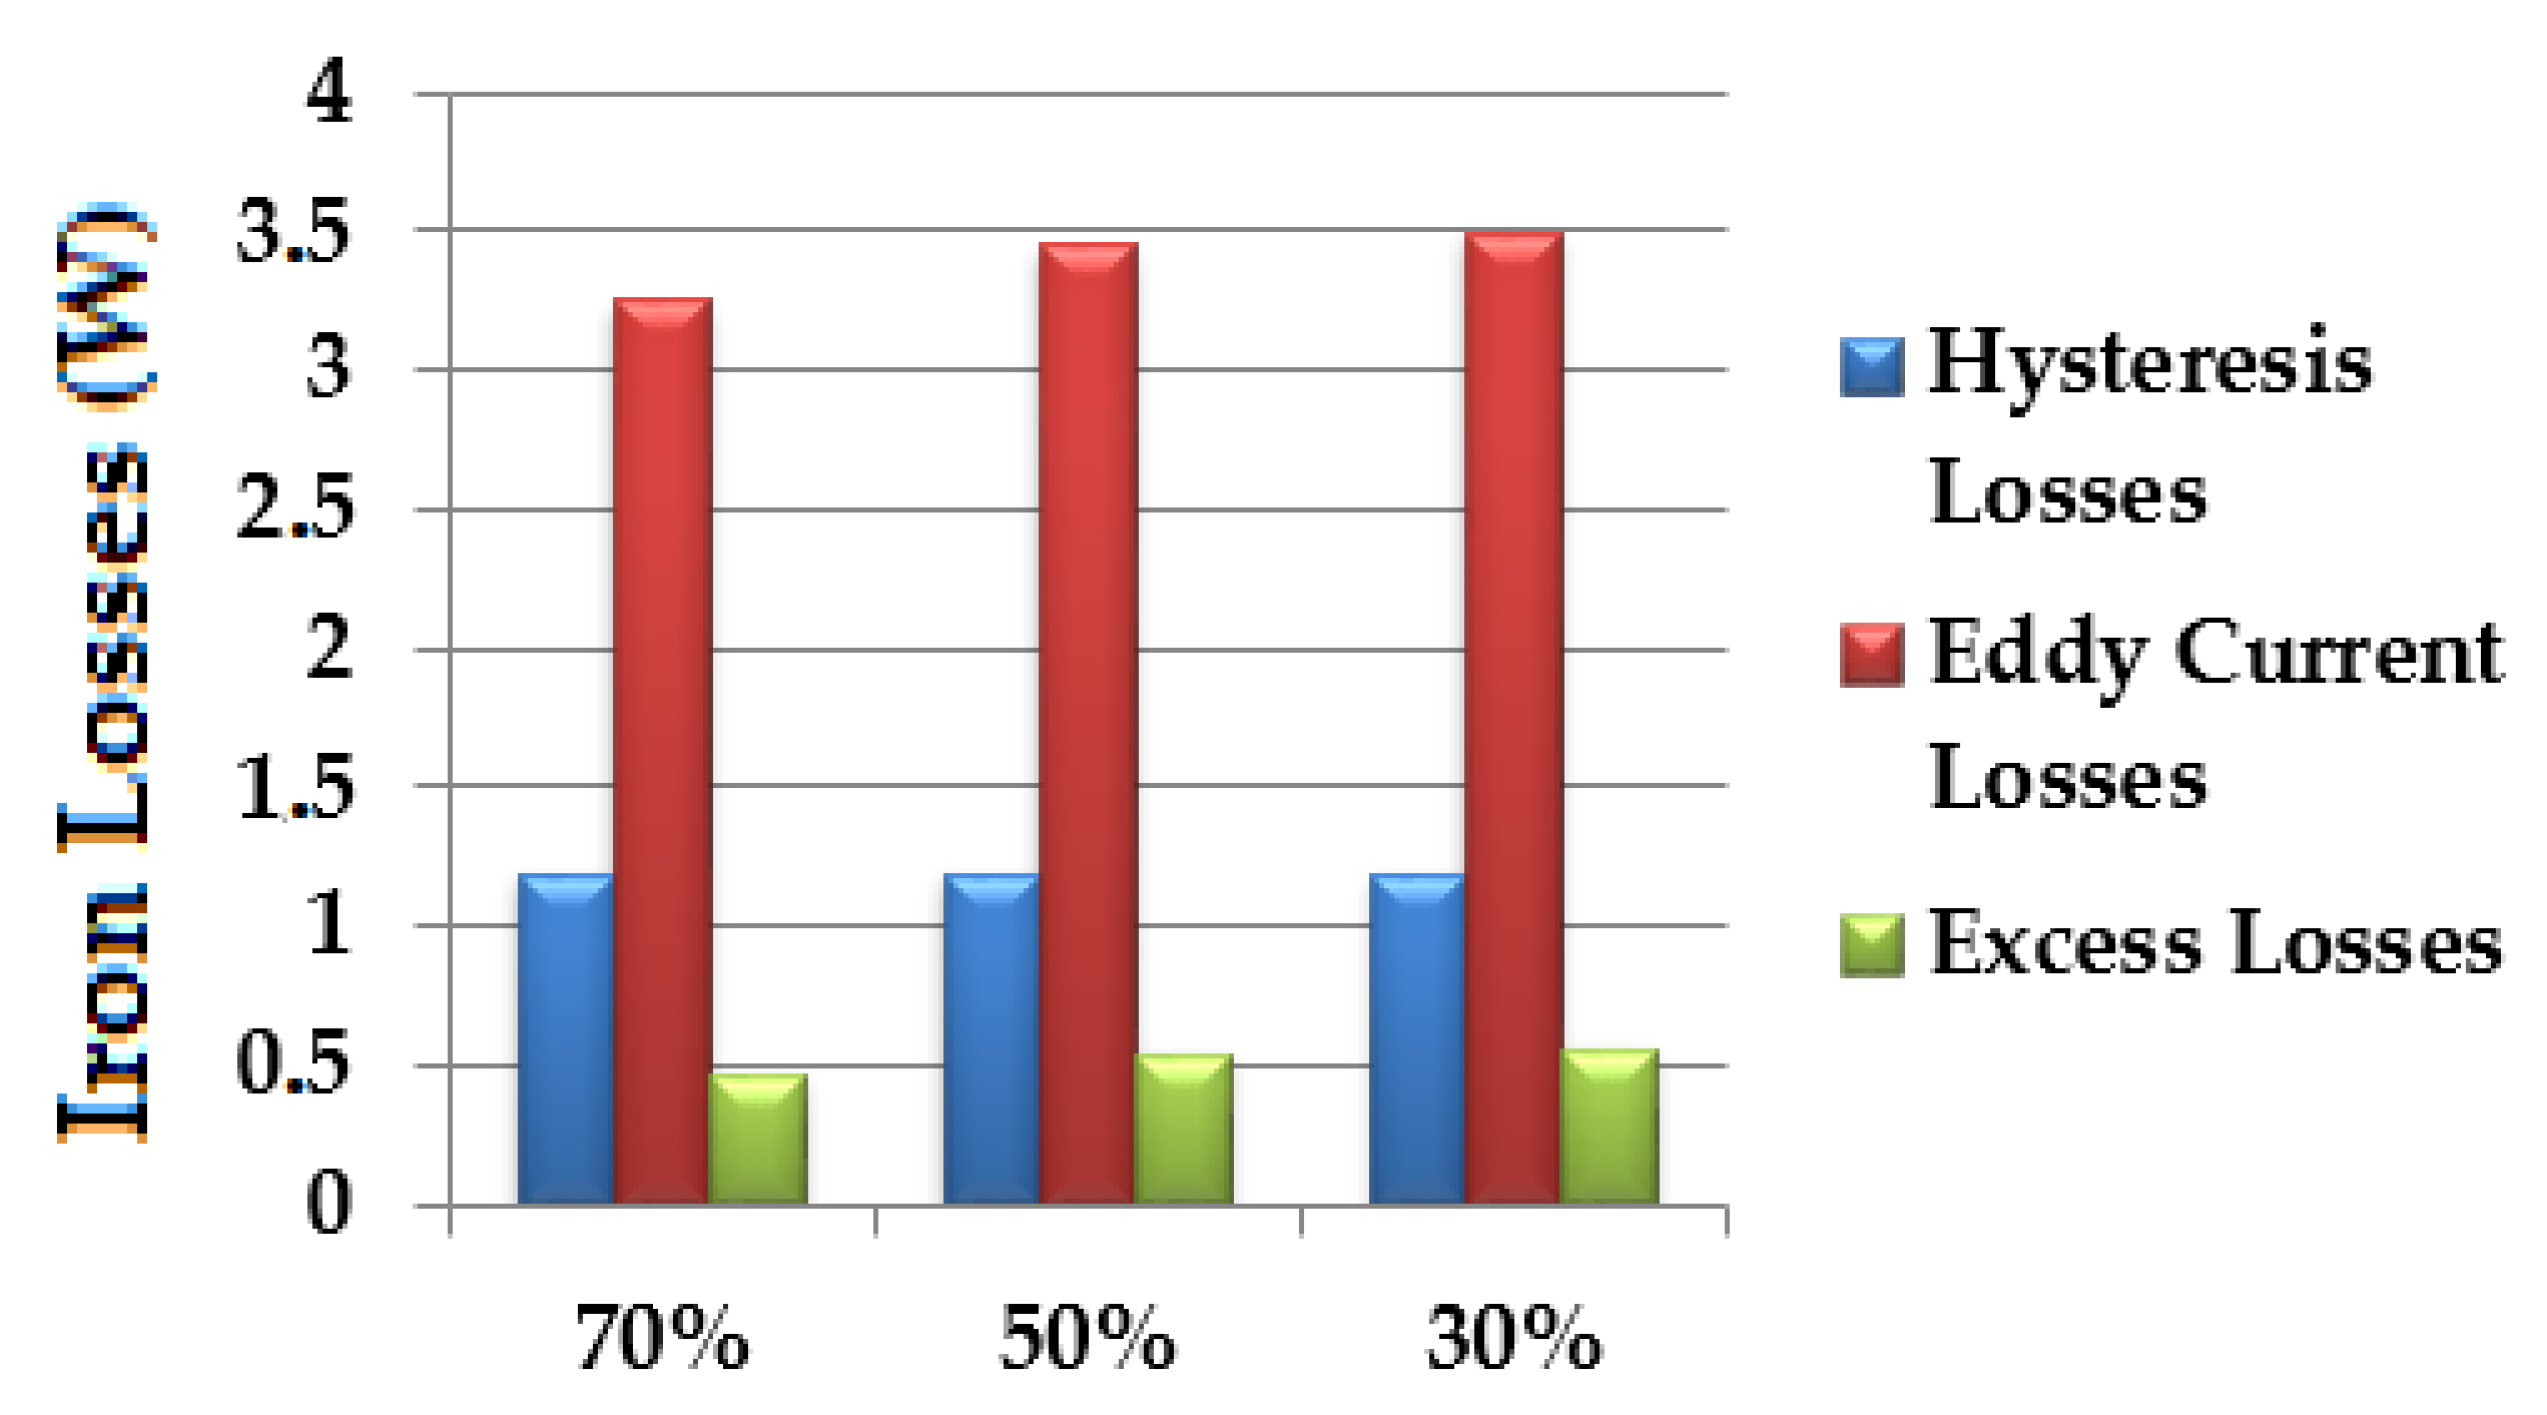
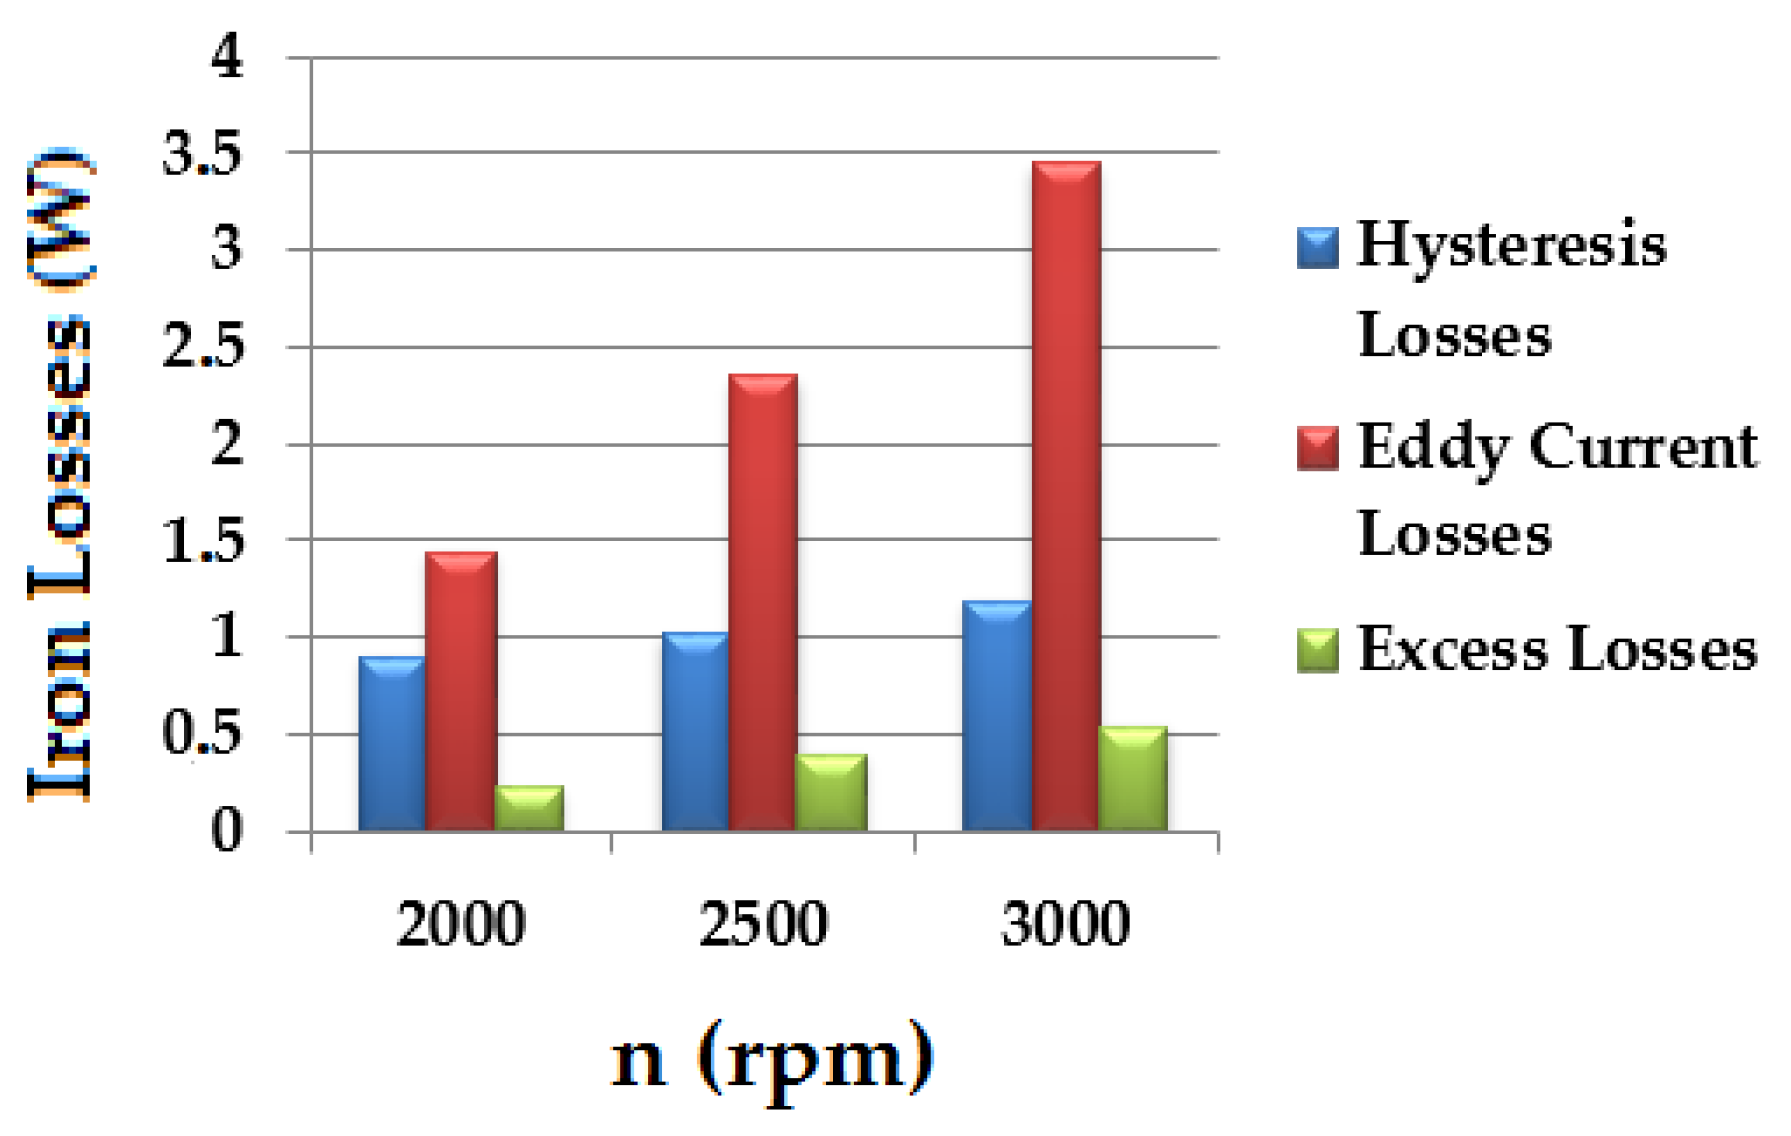
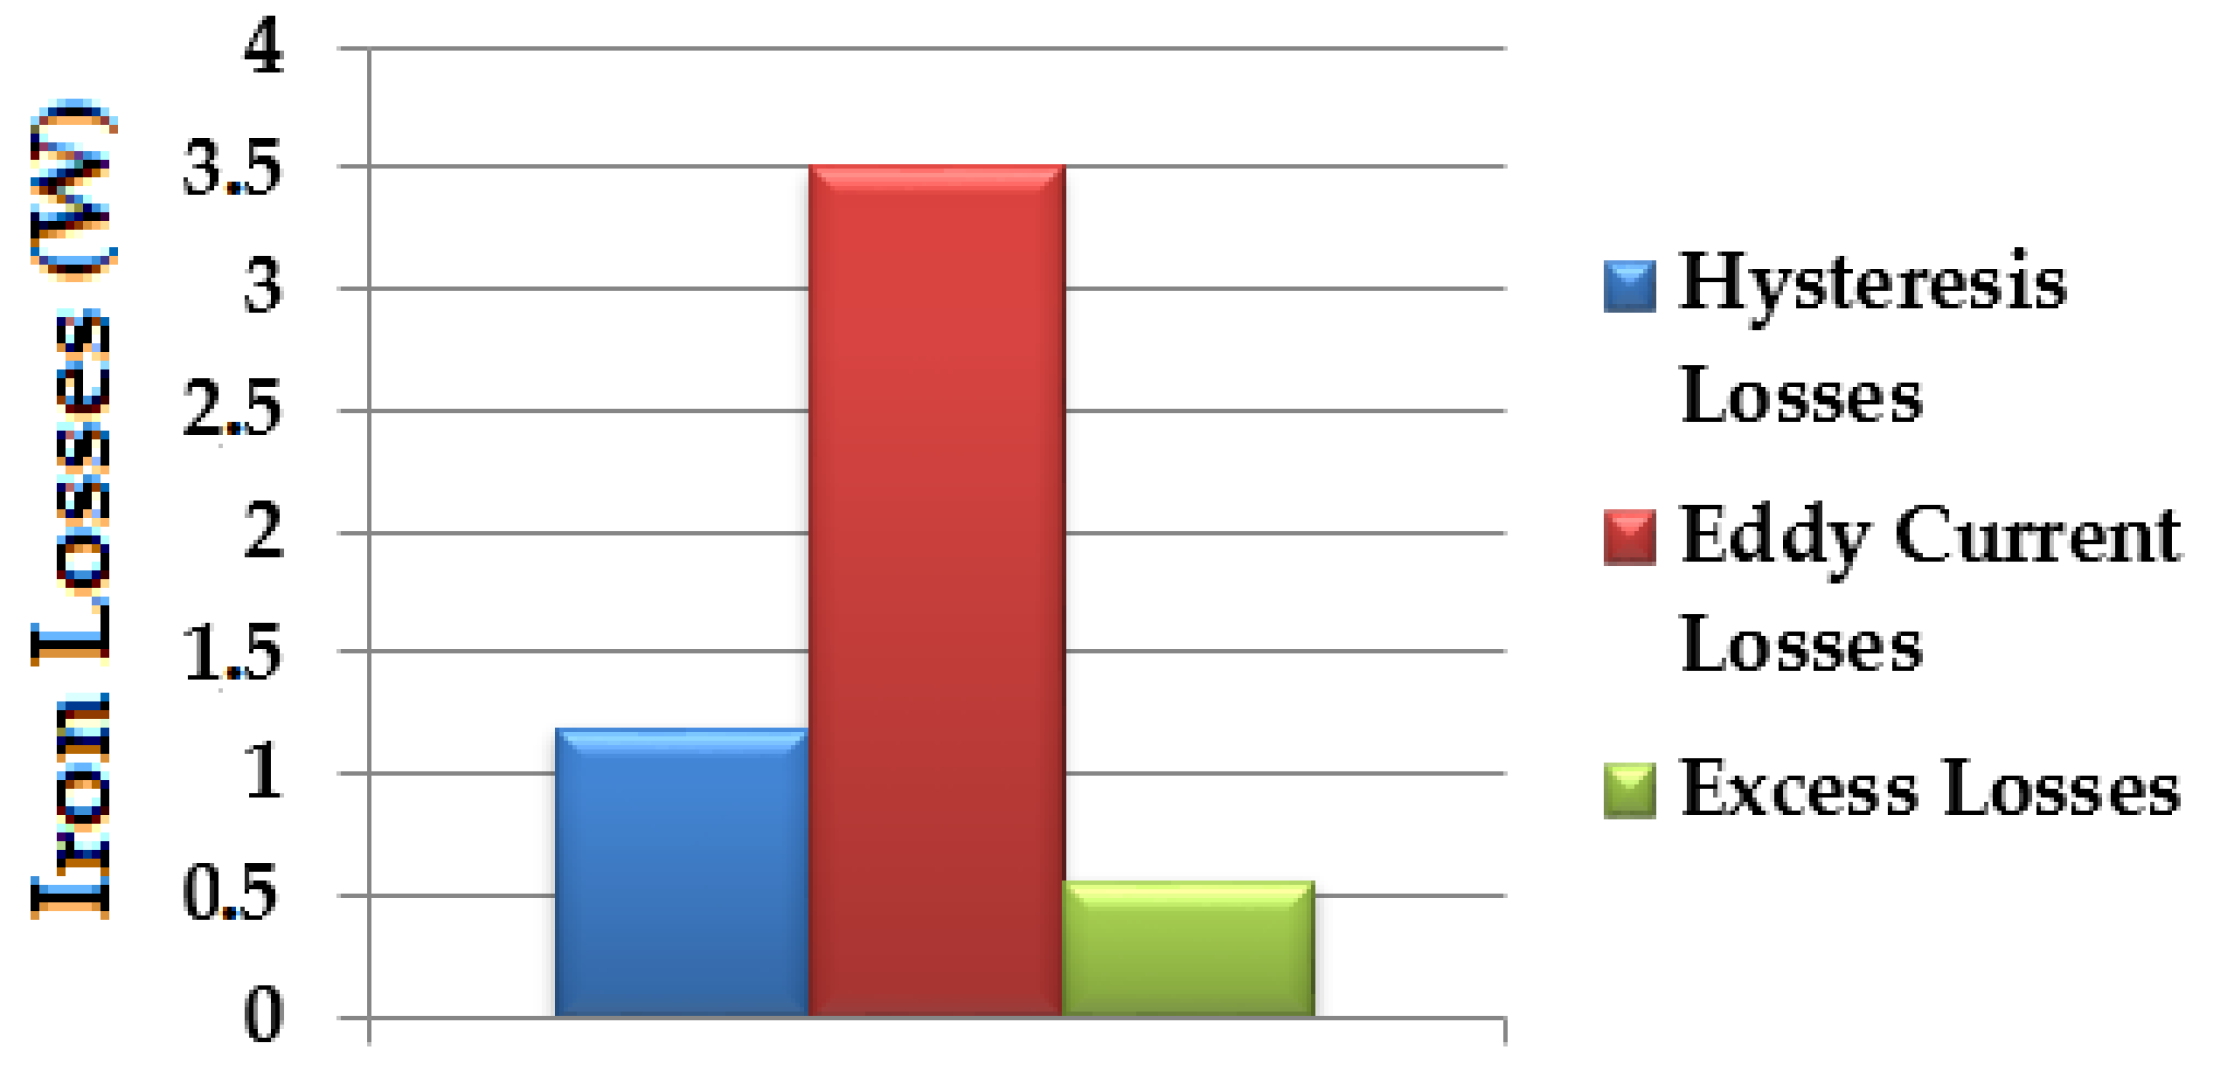
3.2. Iron Losses
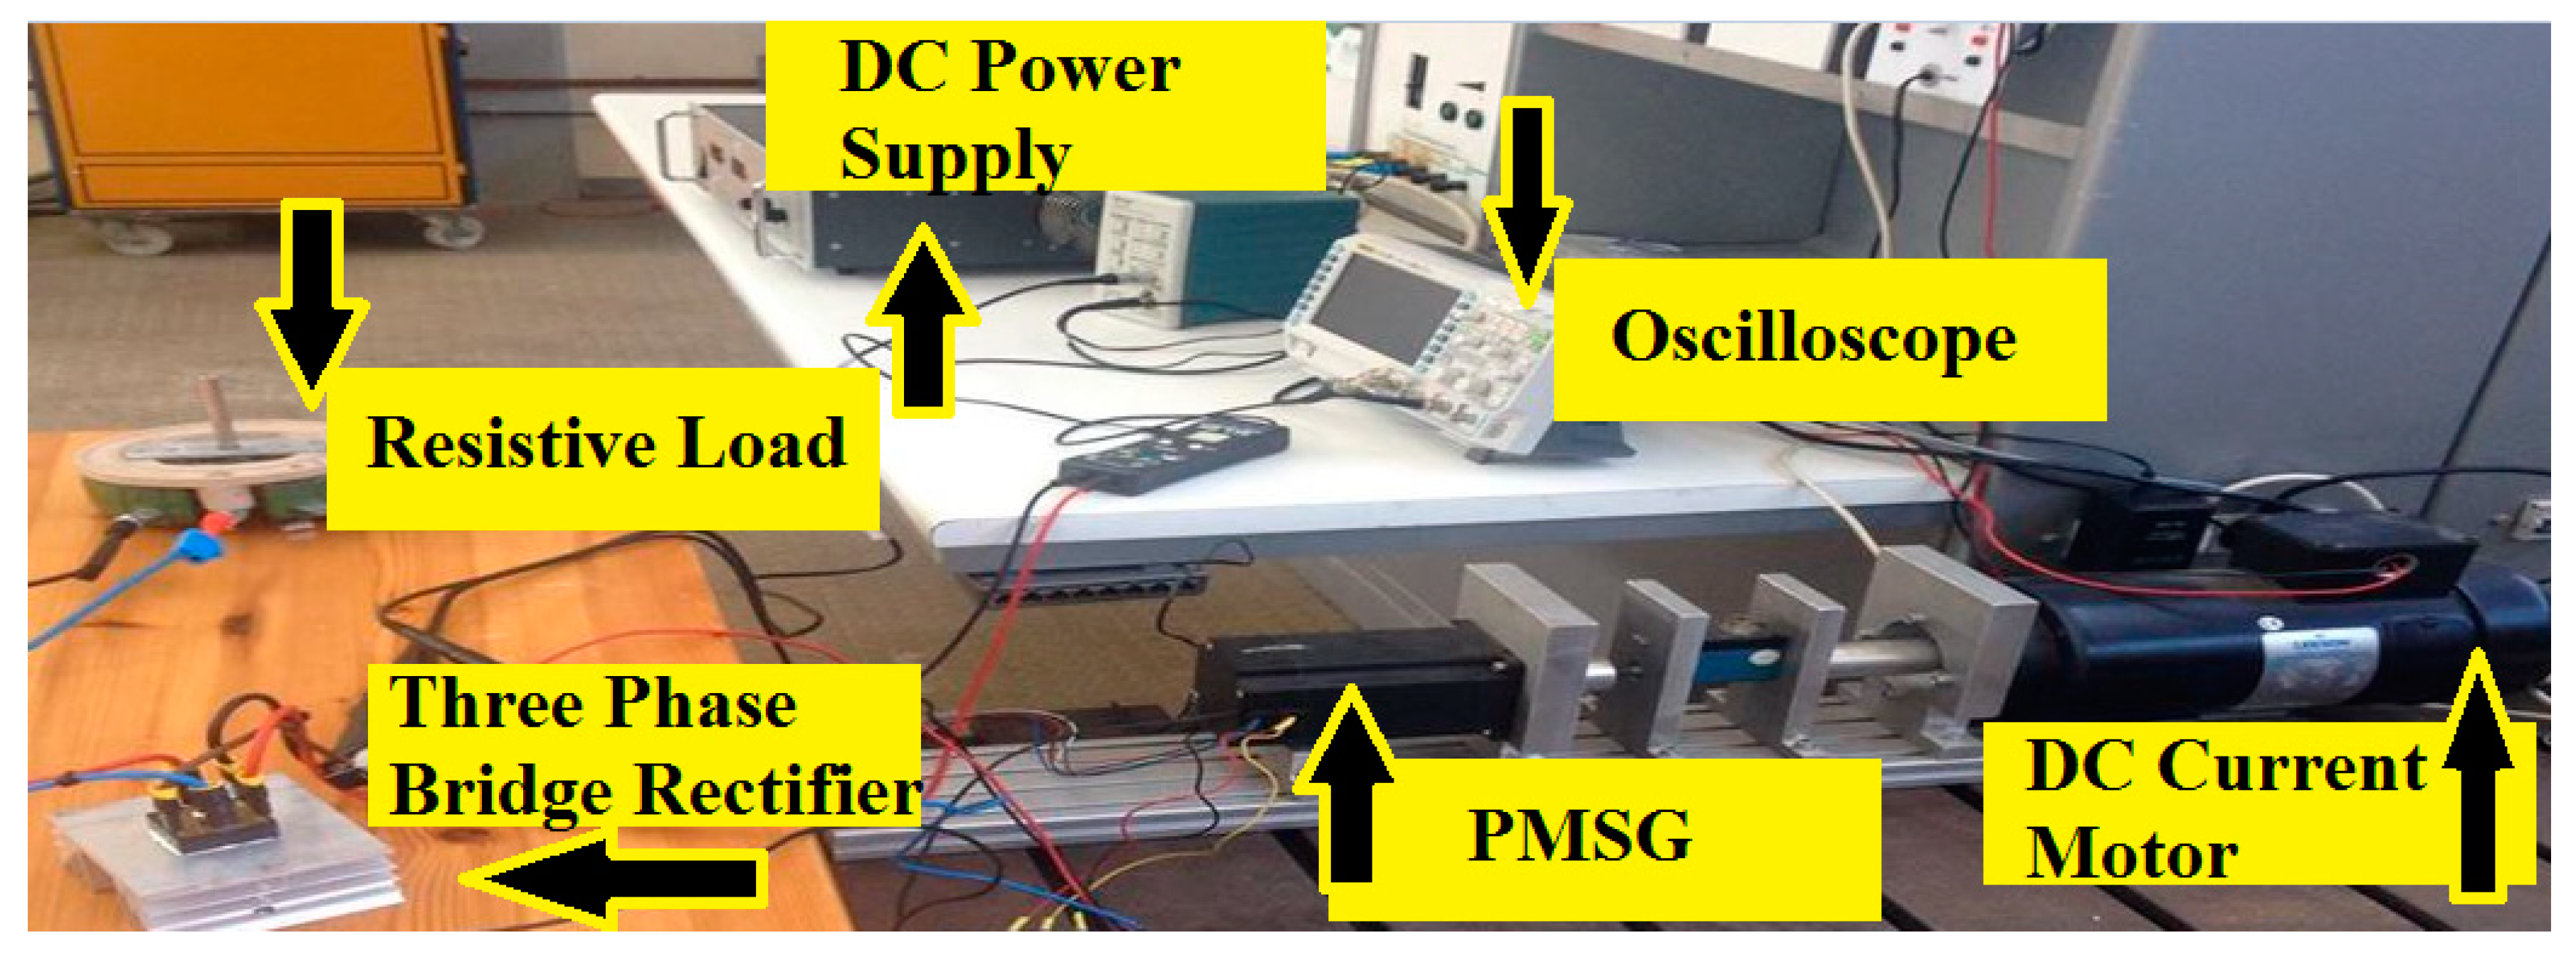
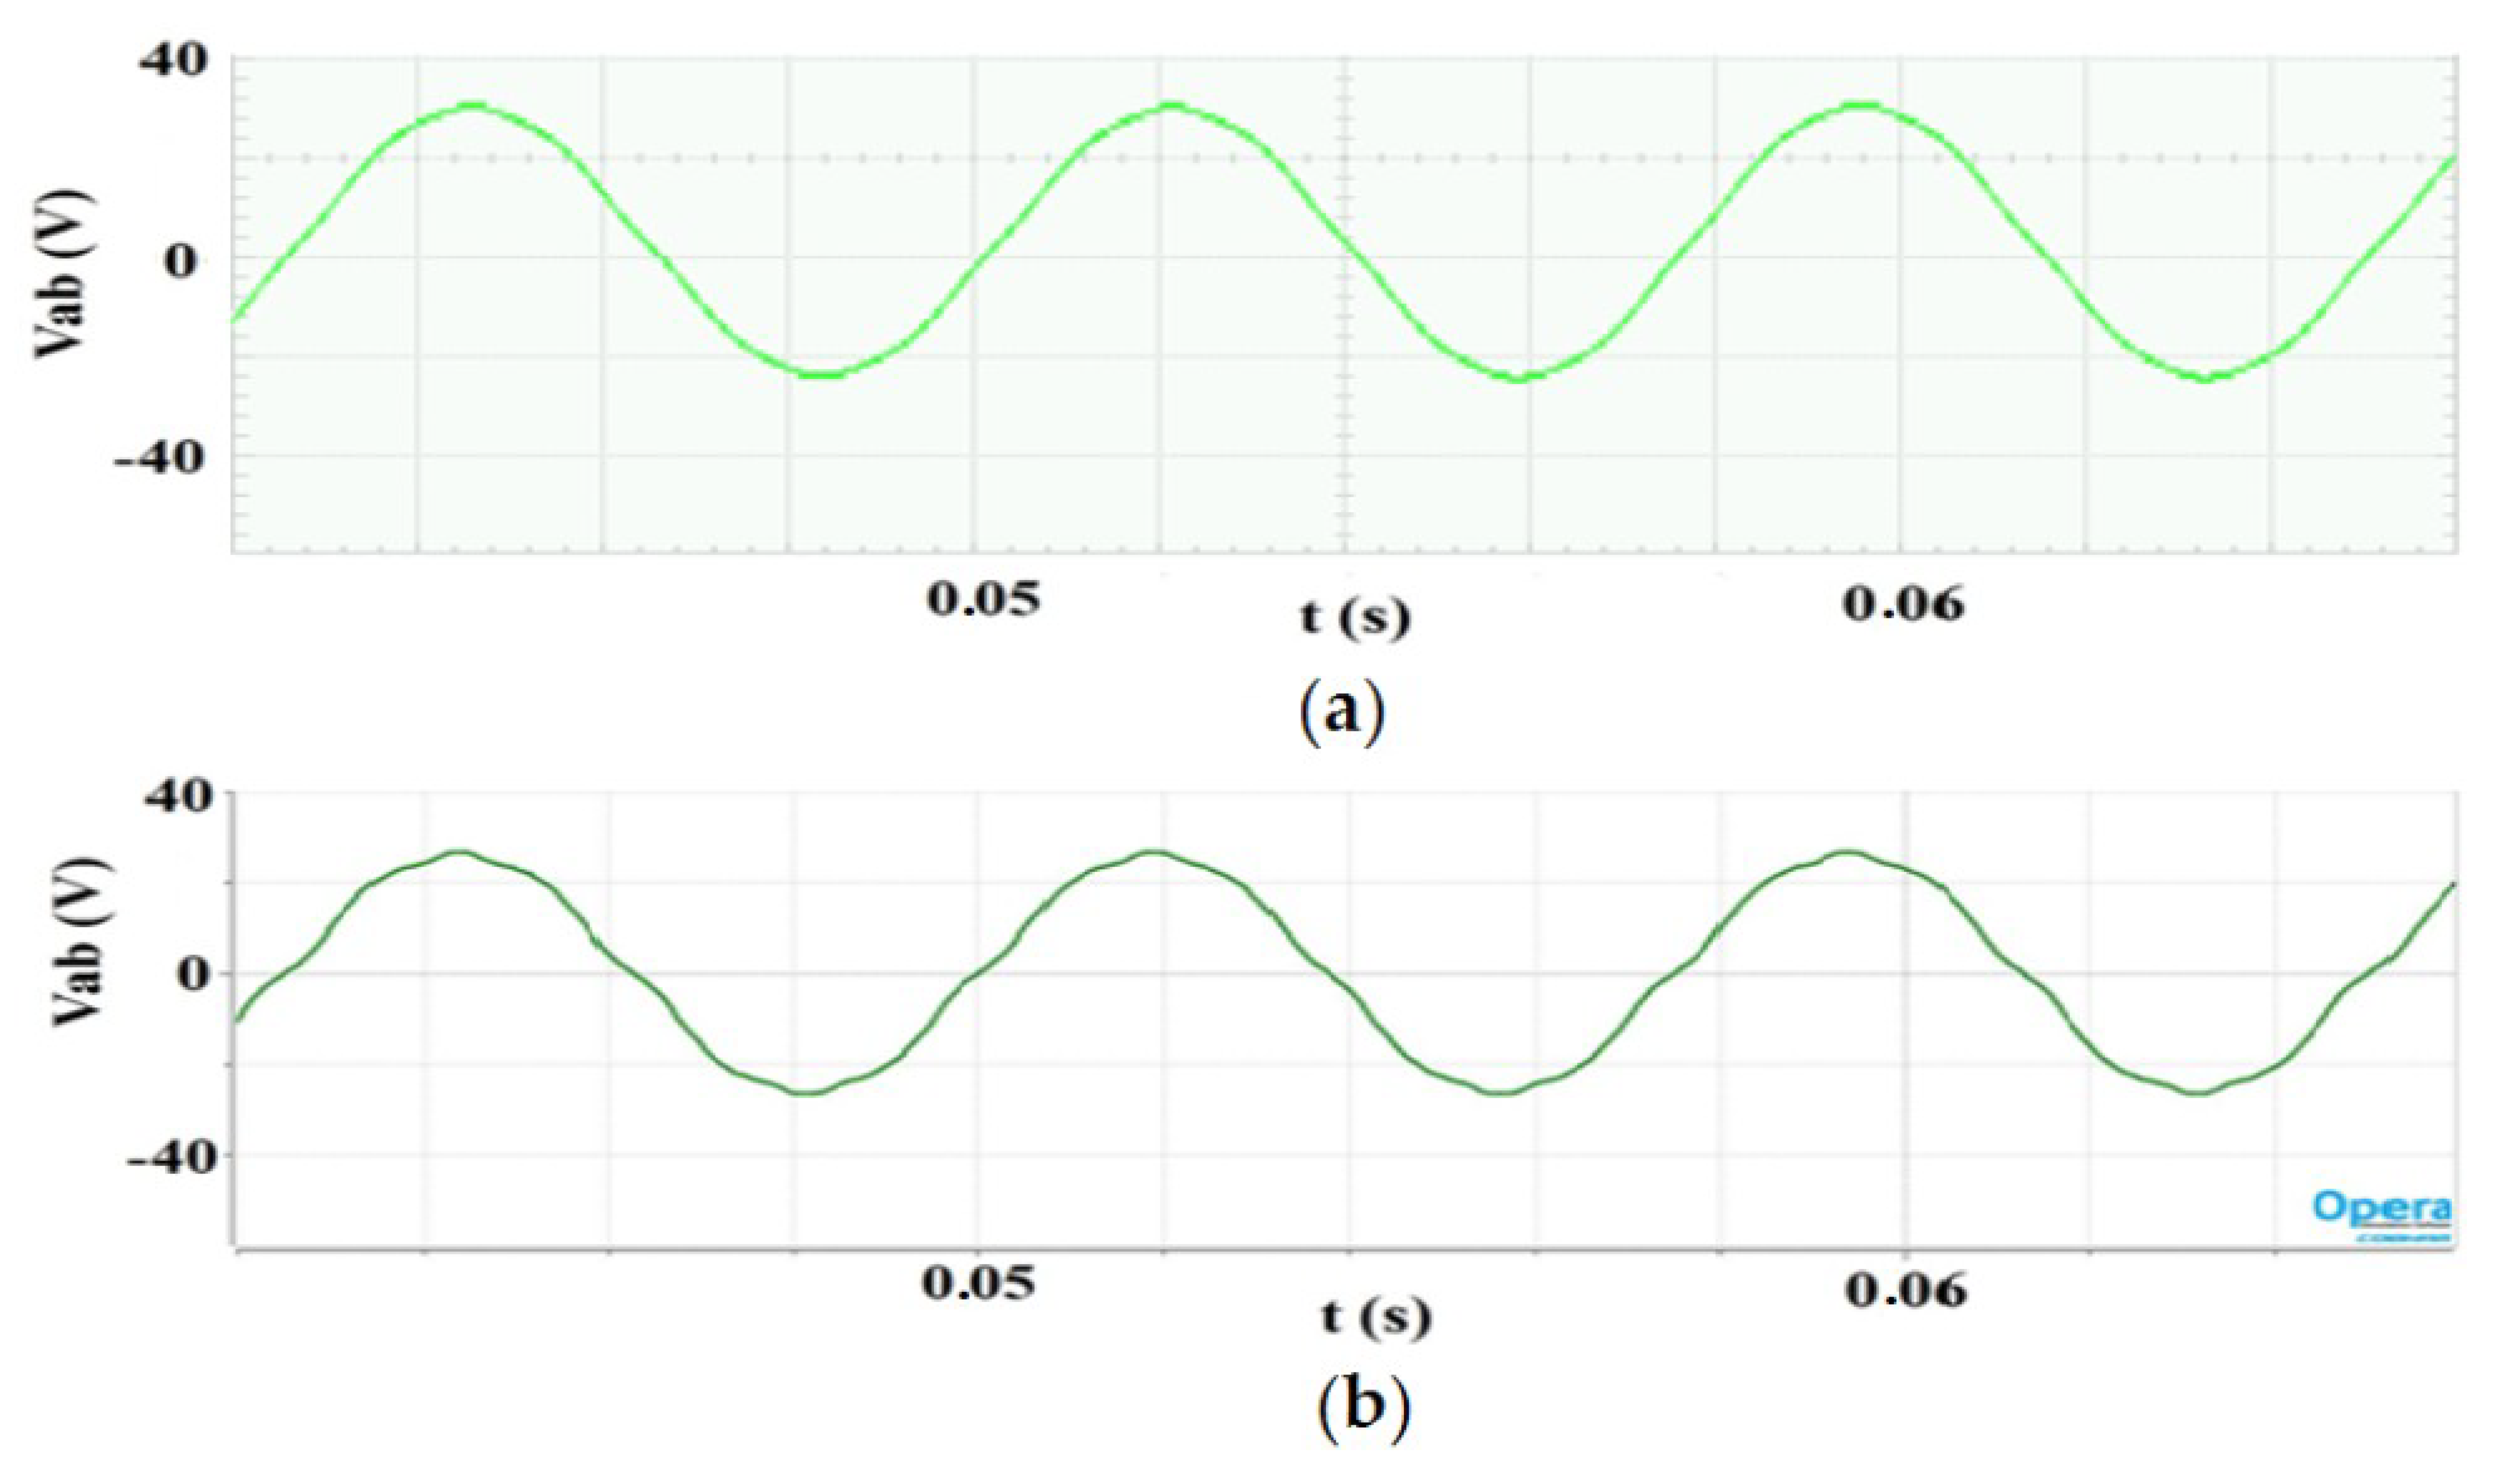
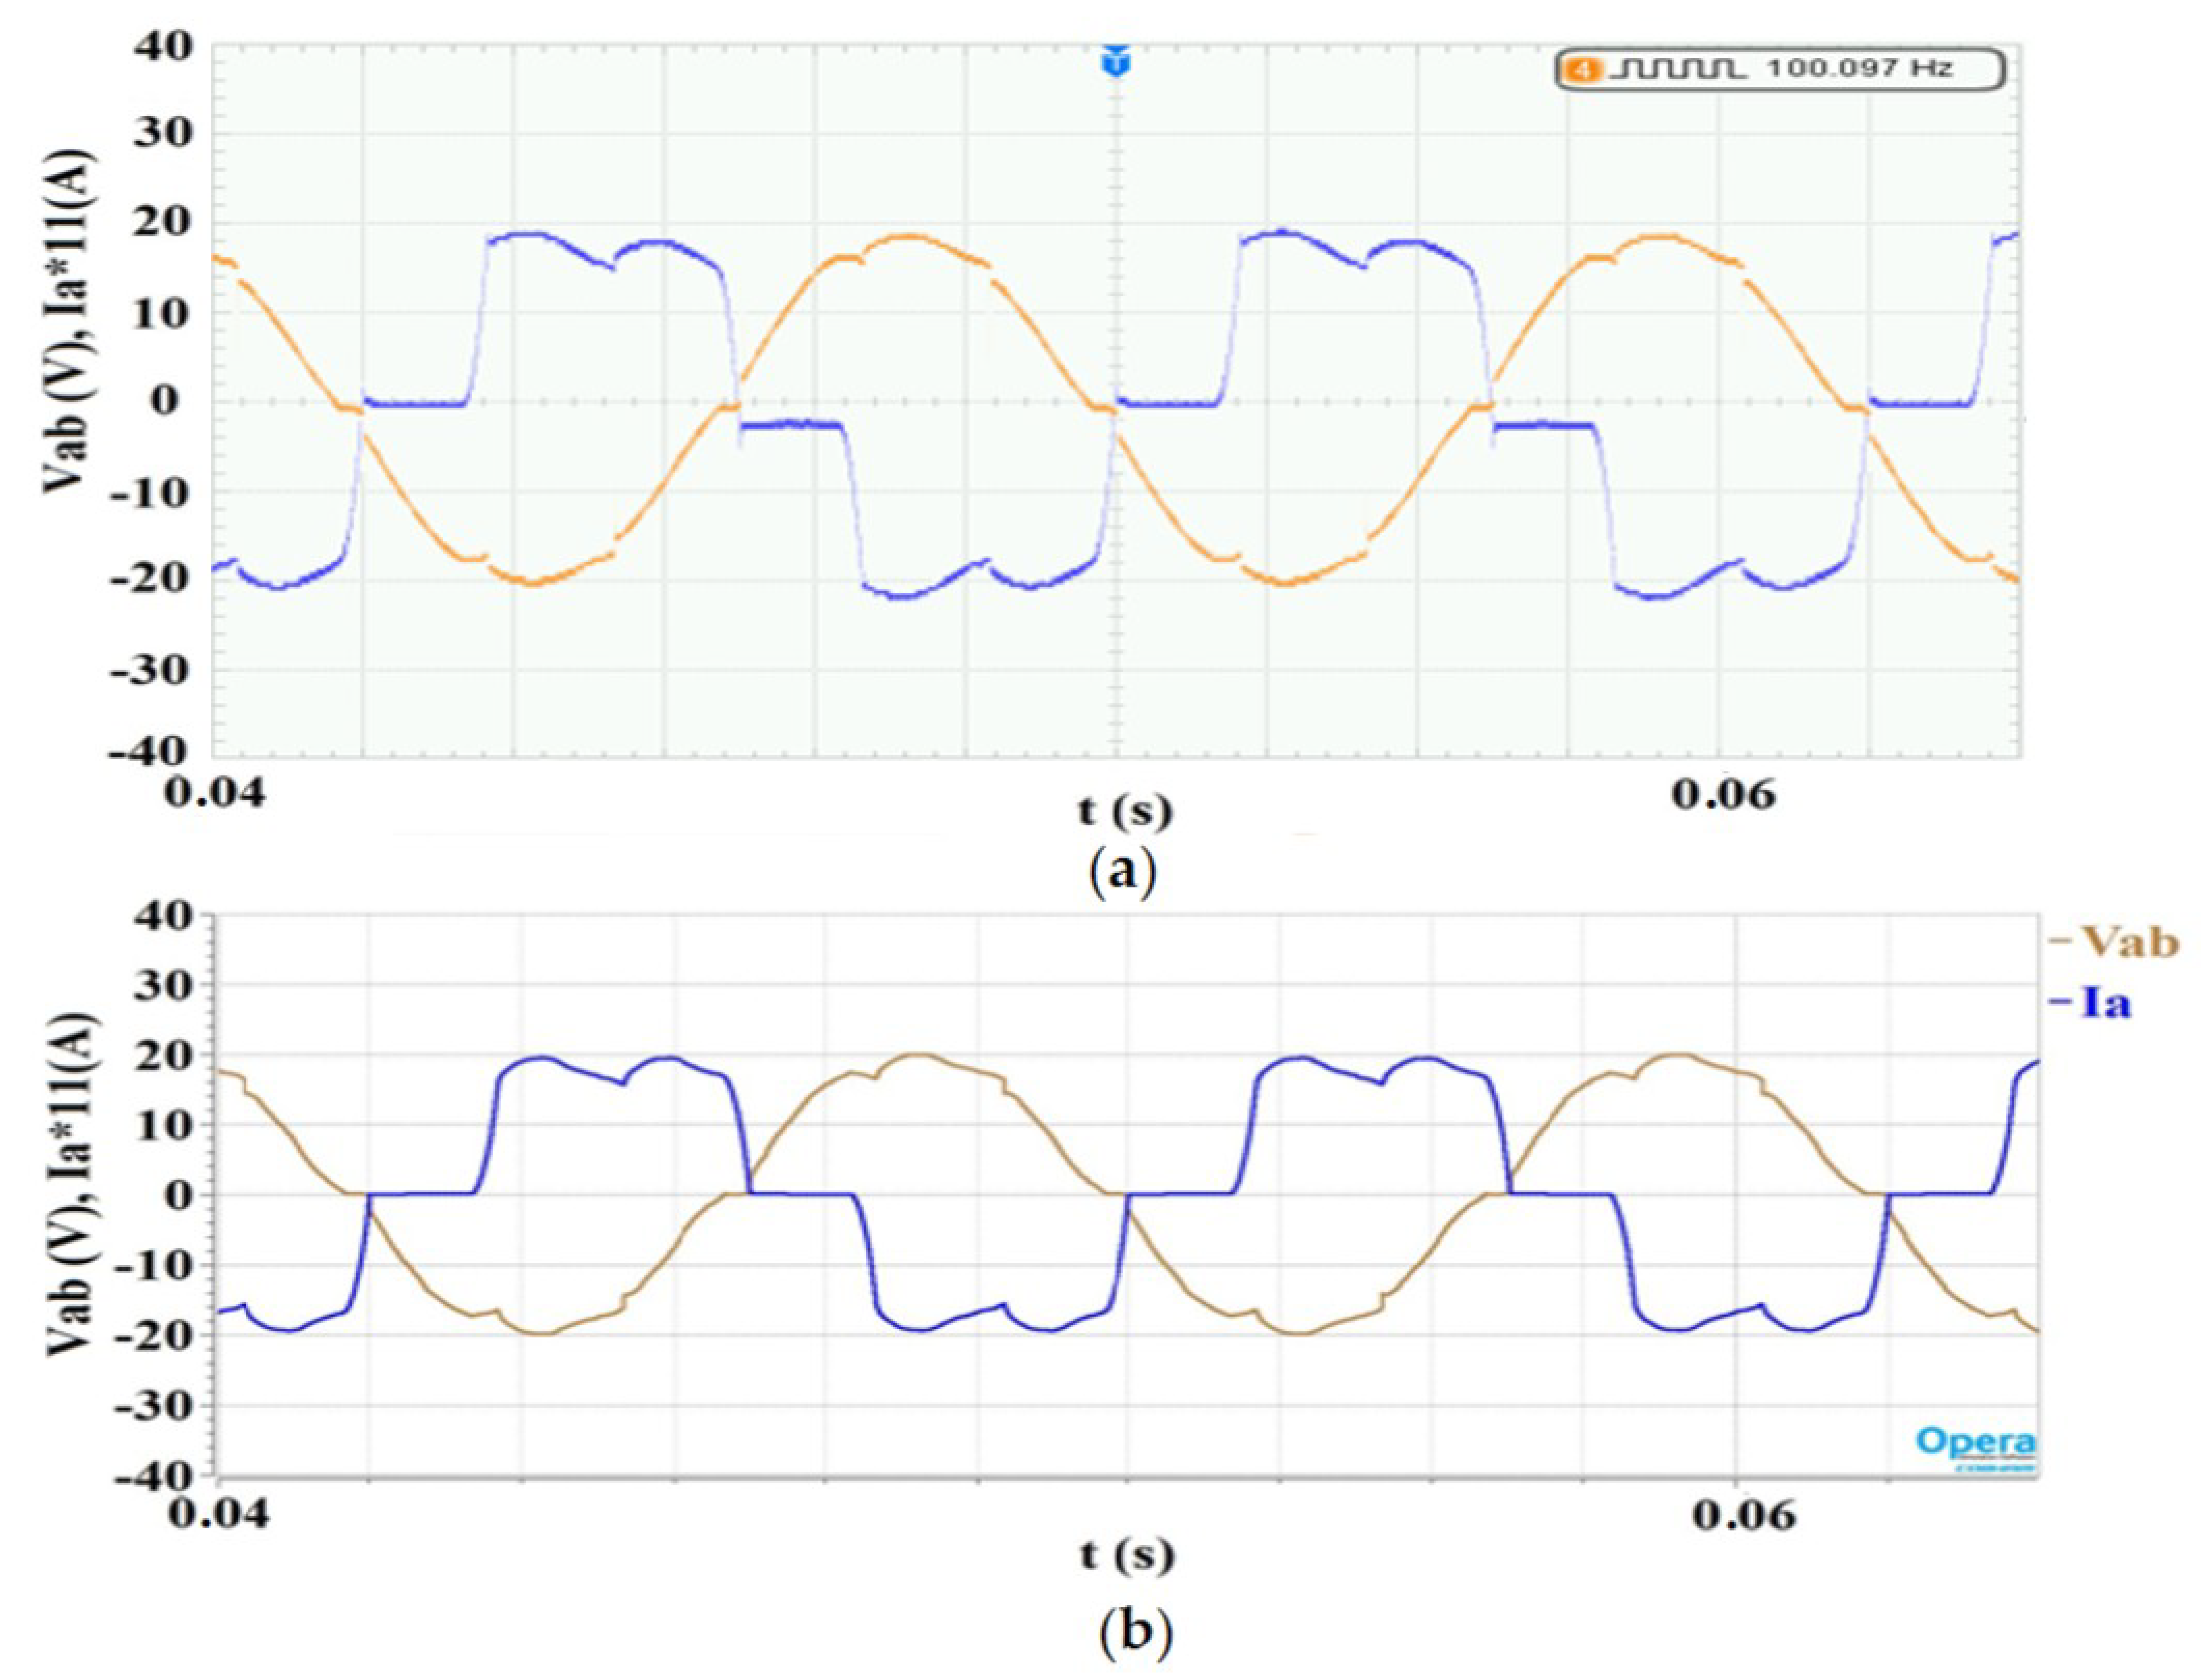
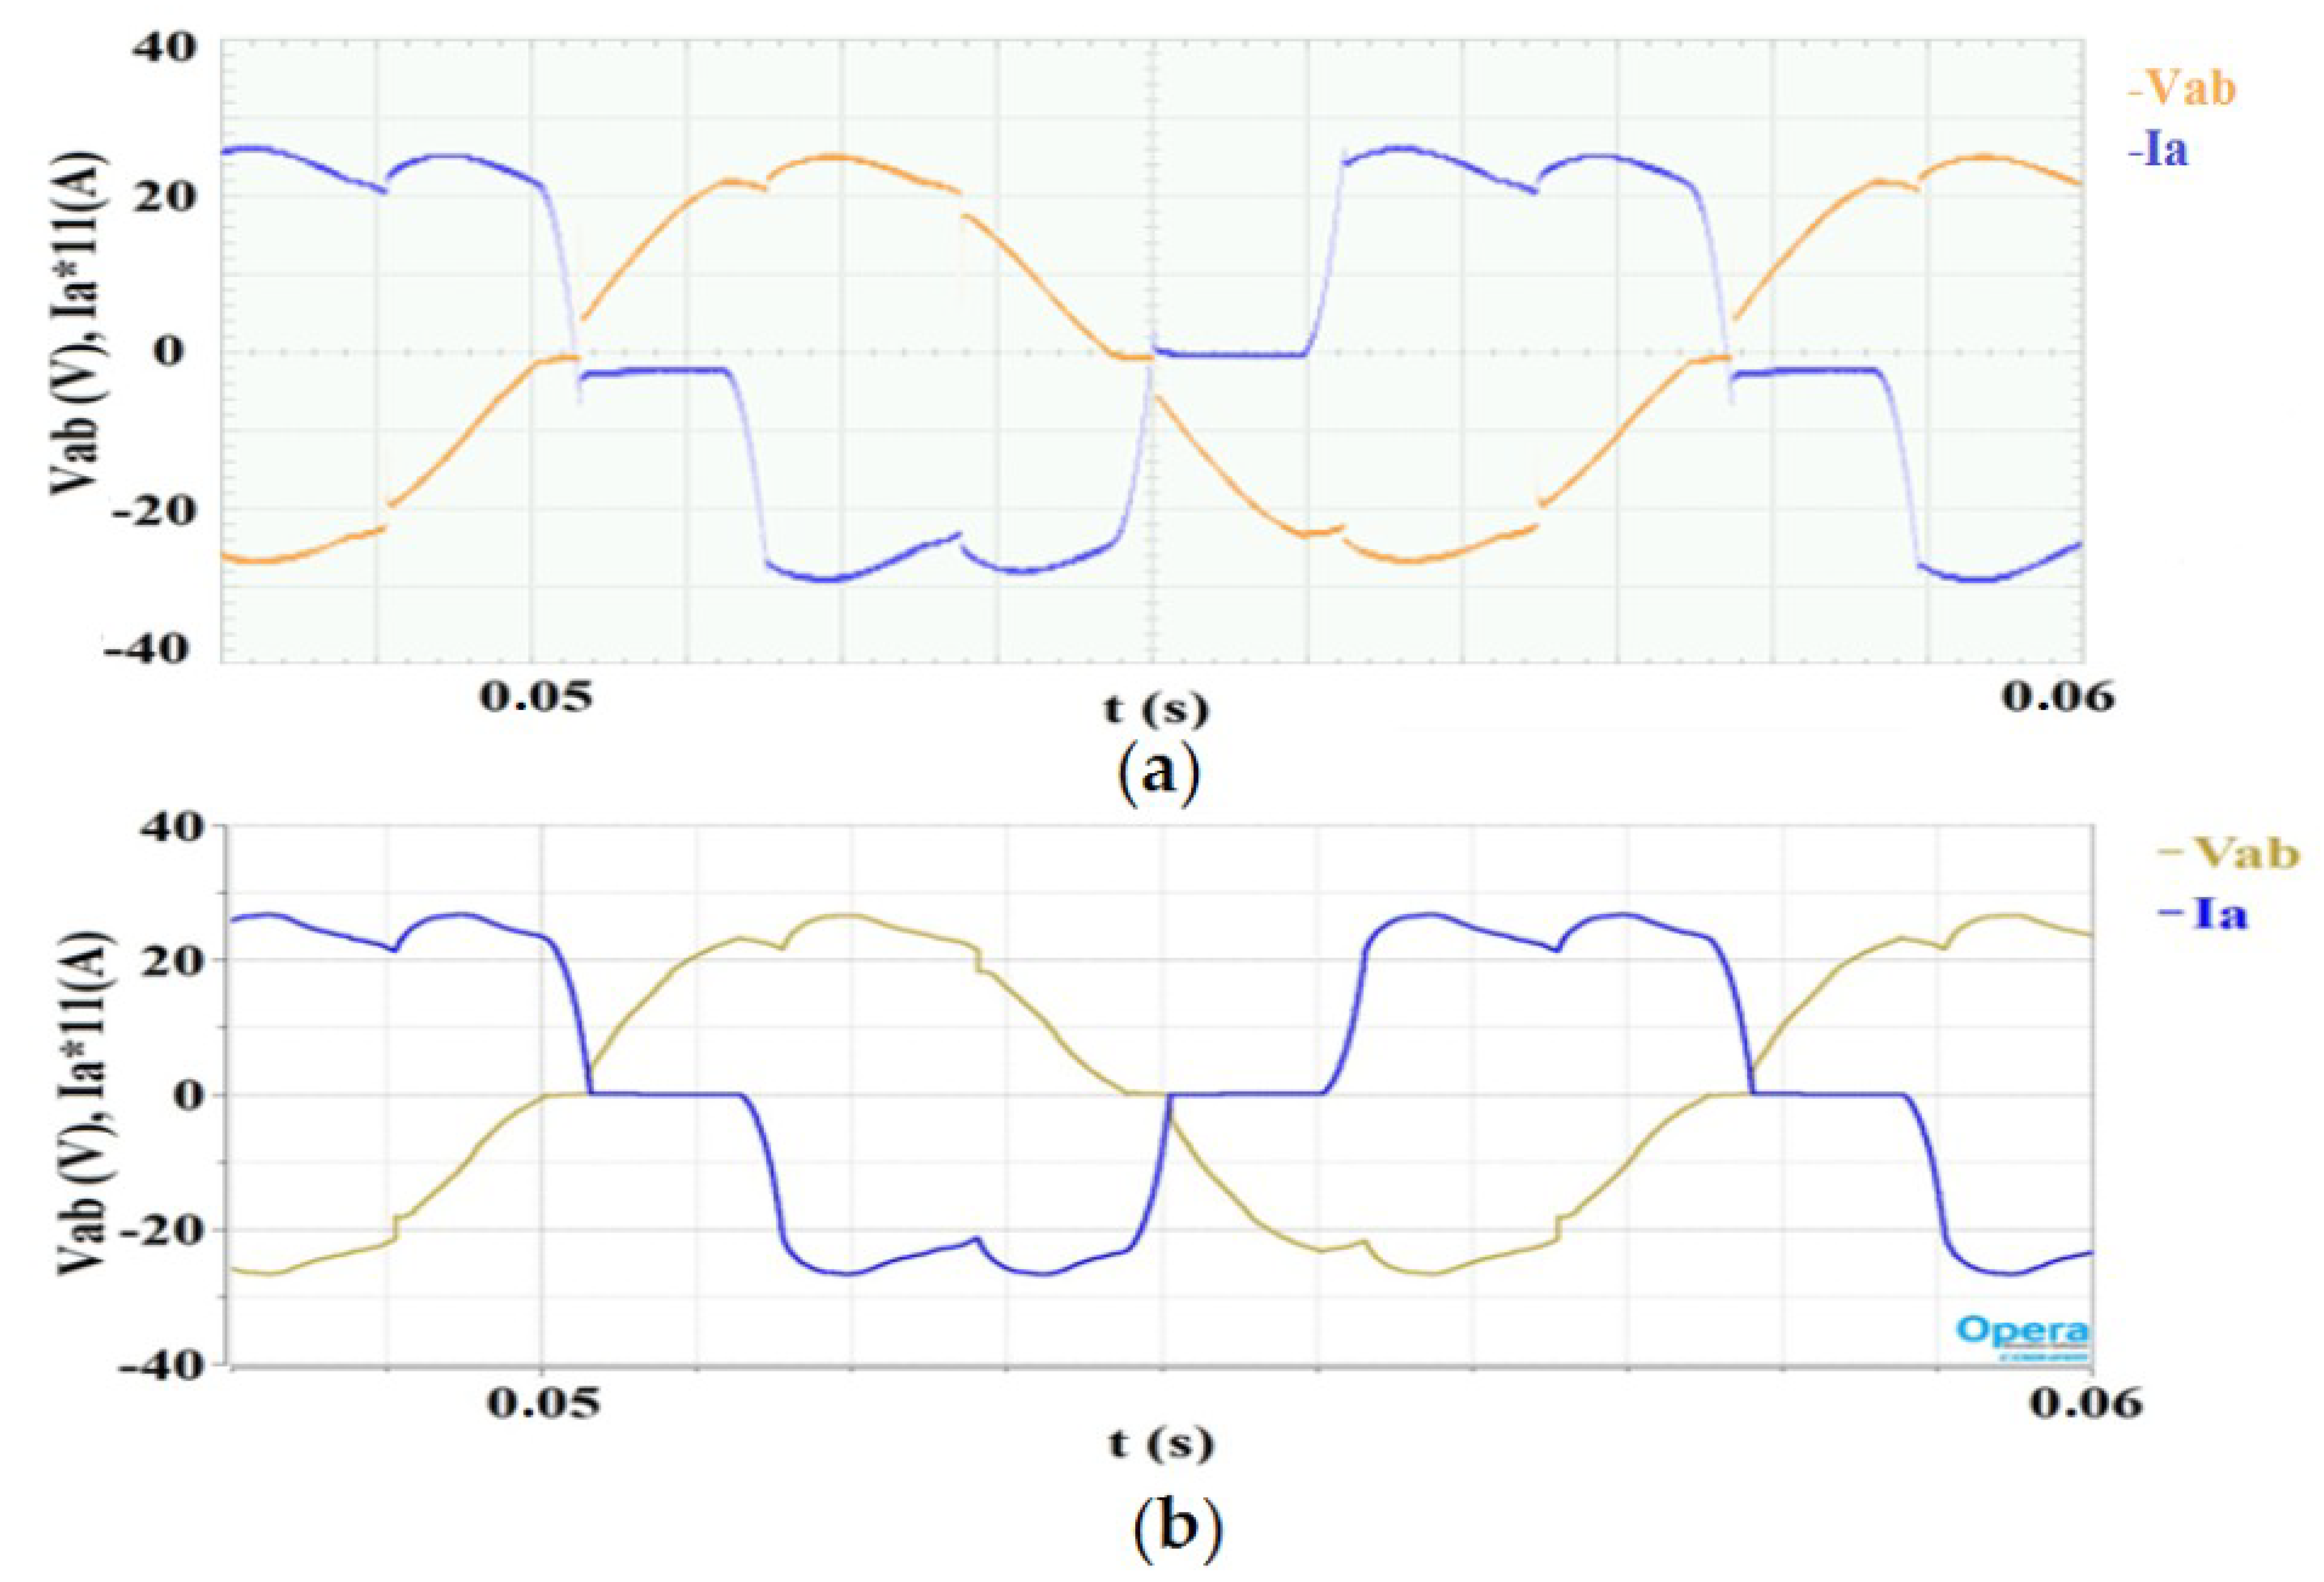
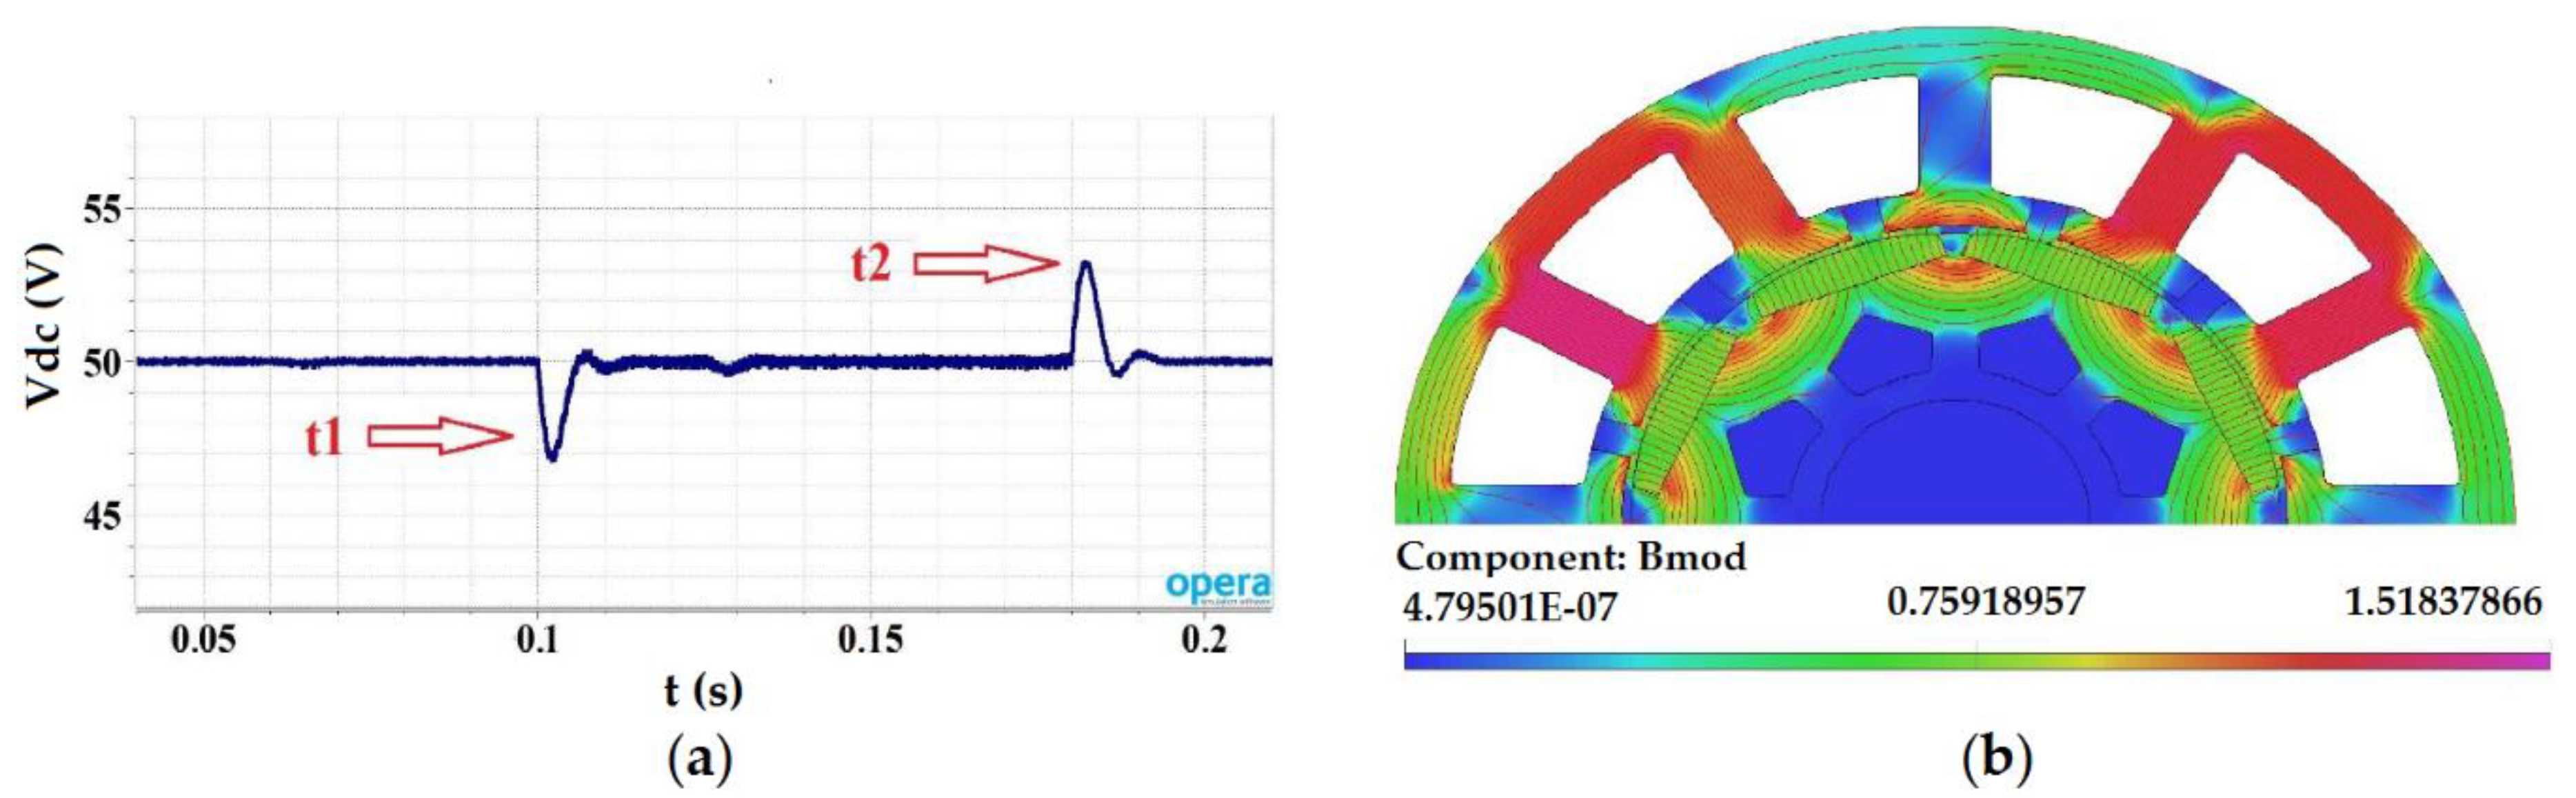
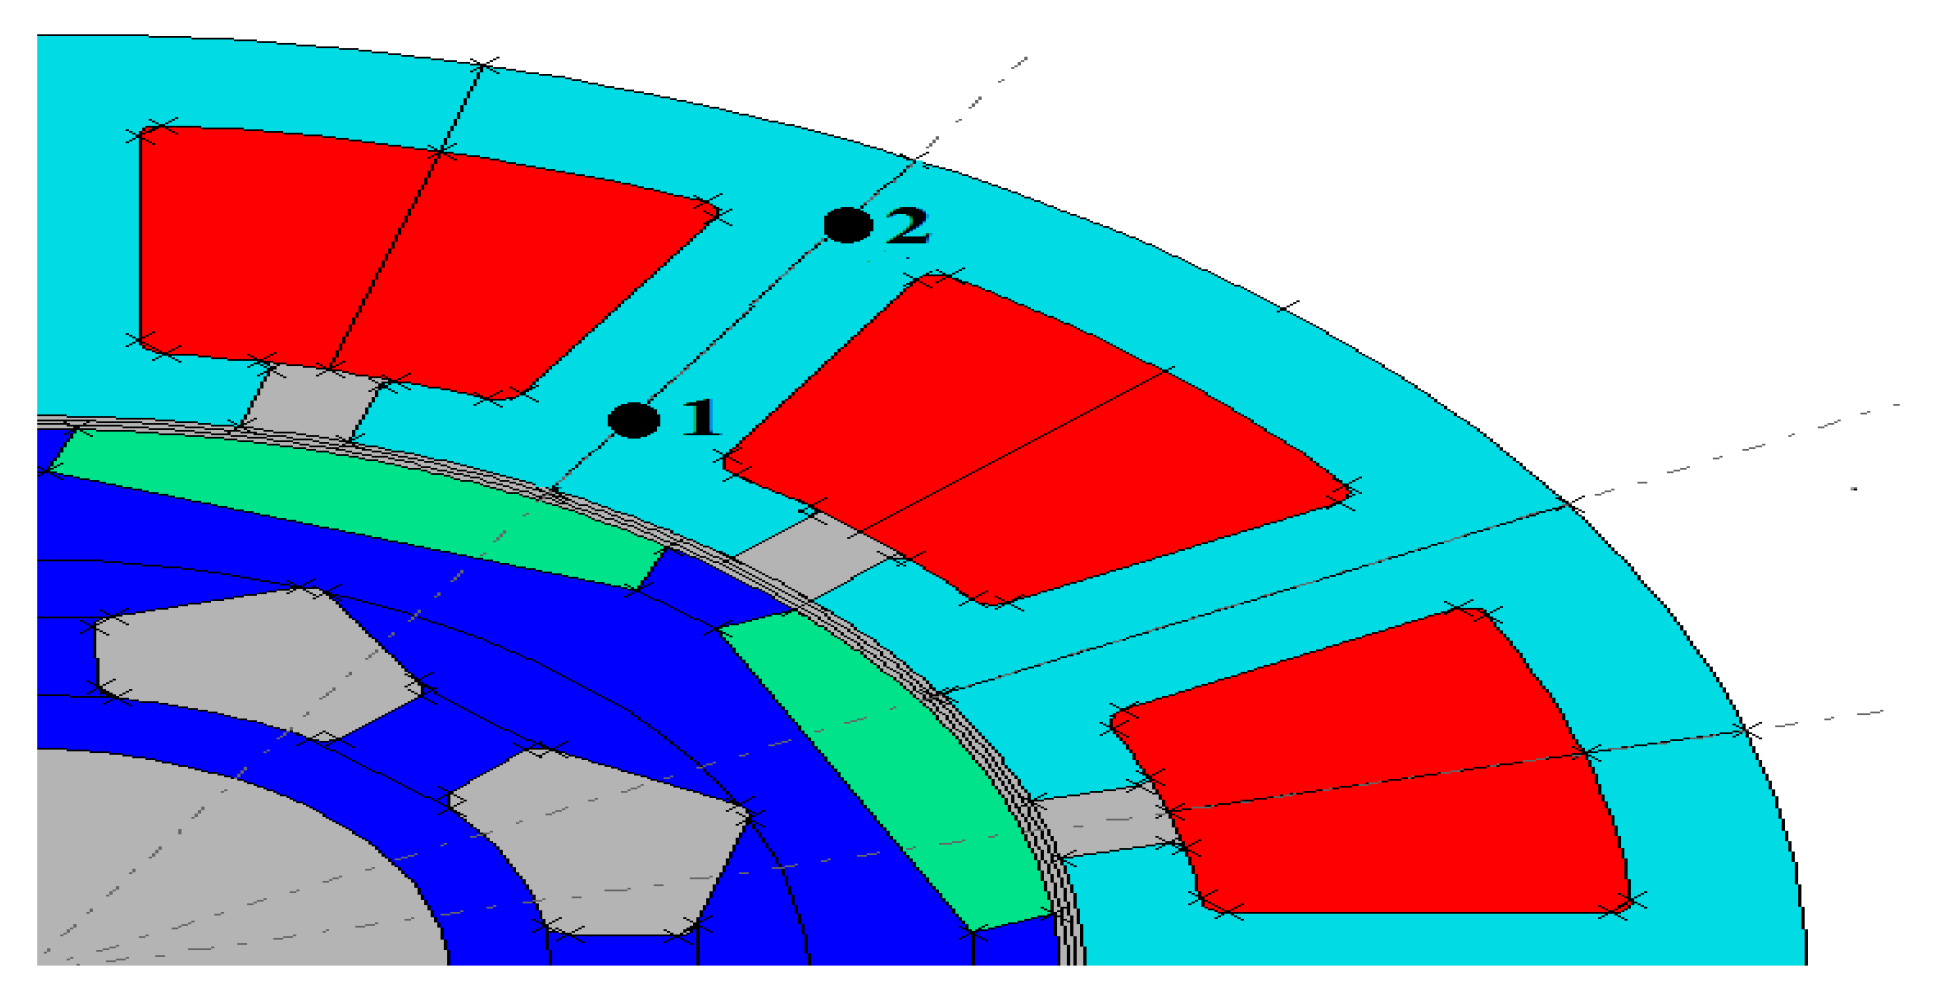
4. FEM Model Validation
5. Simulation Results
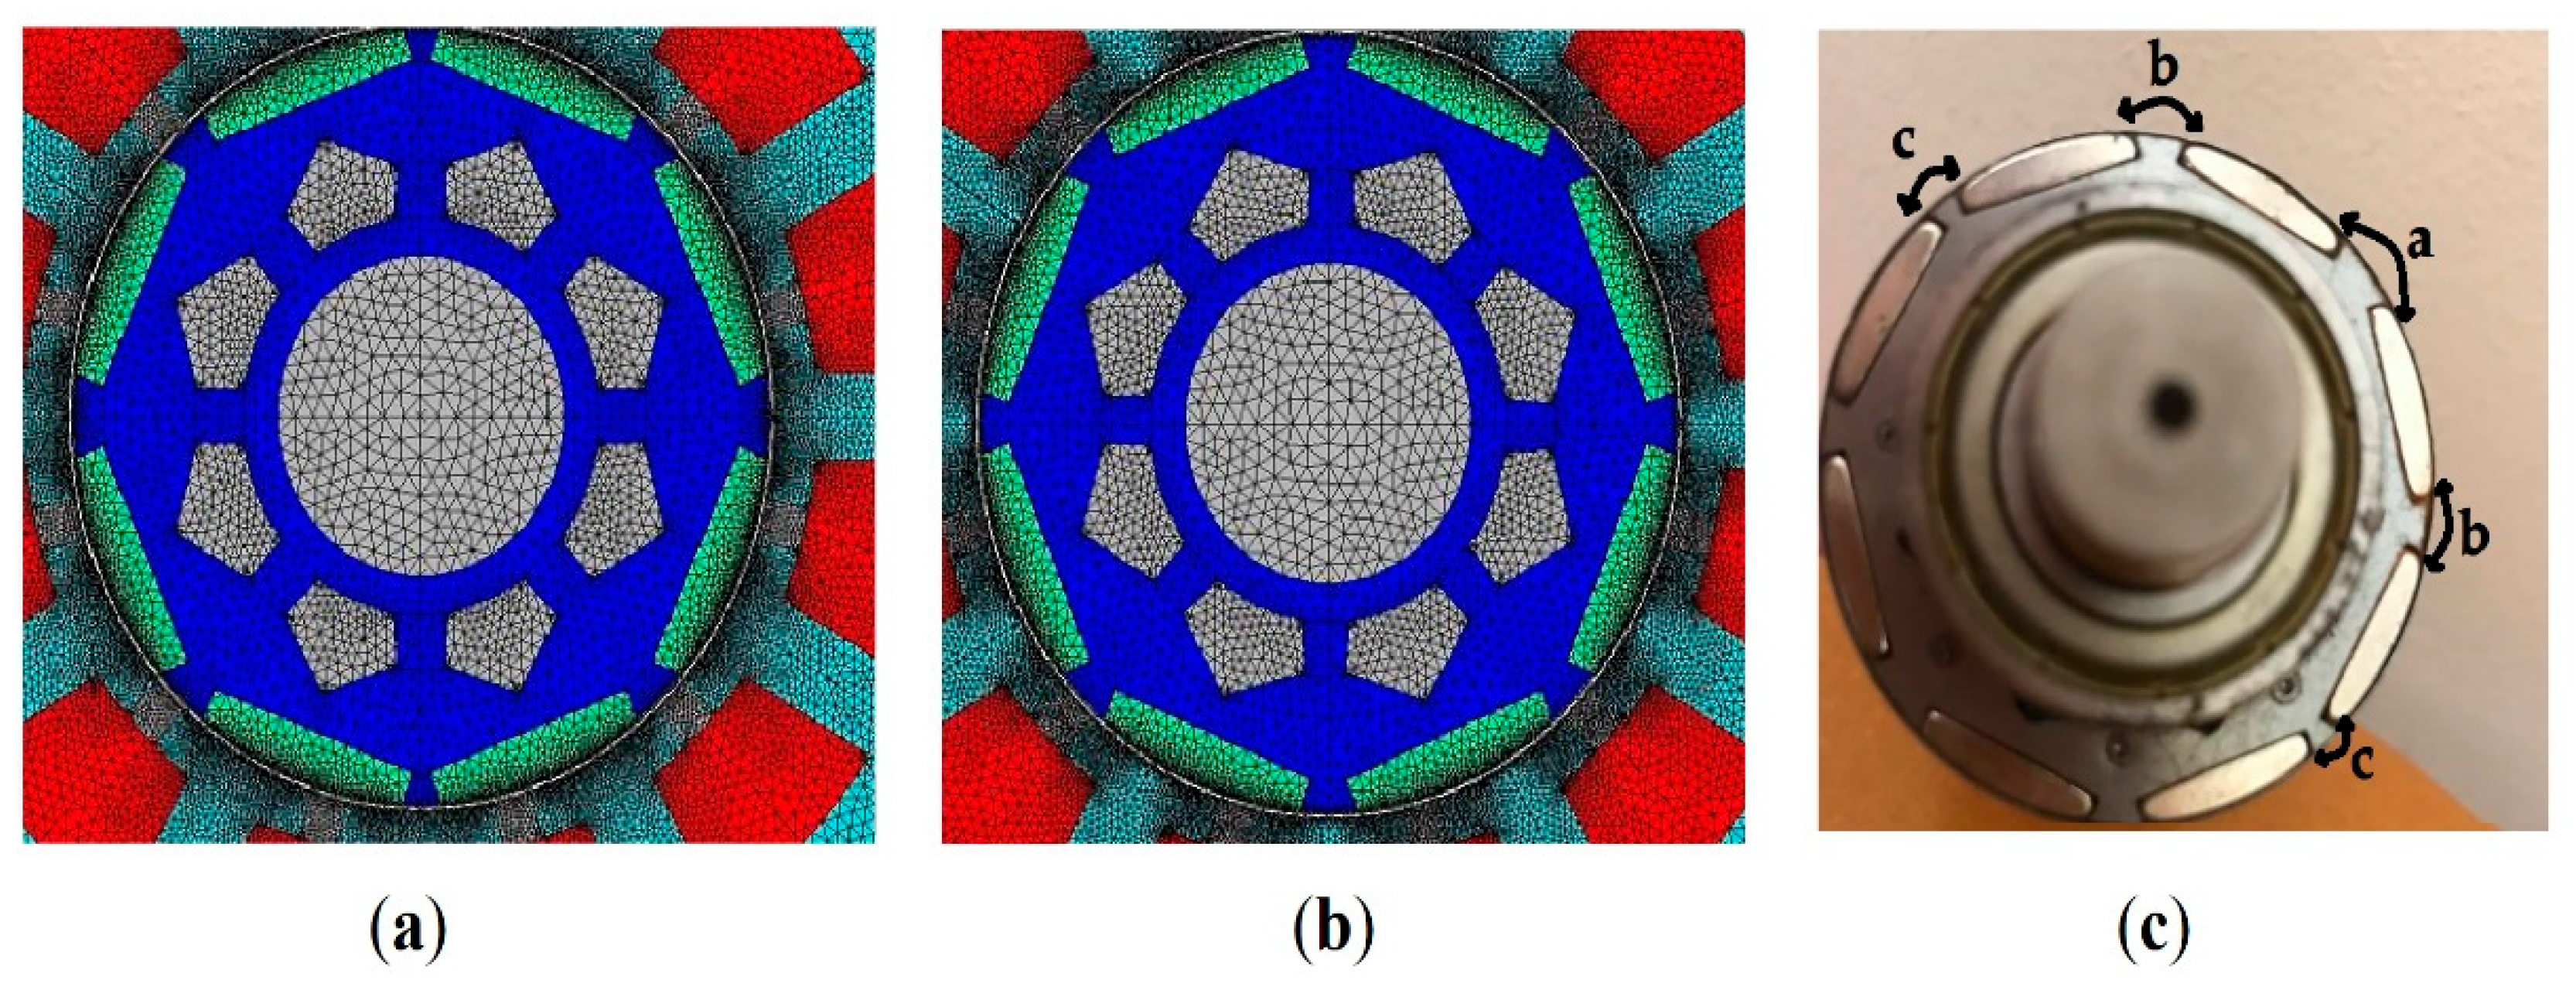
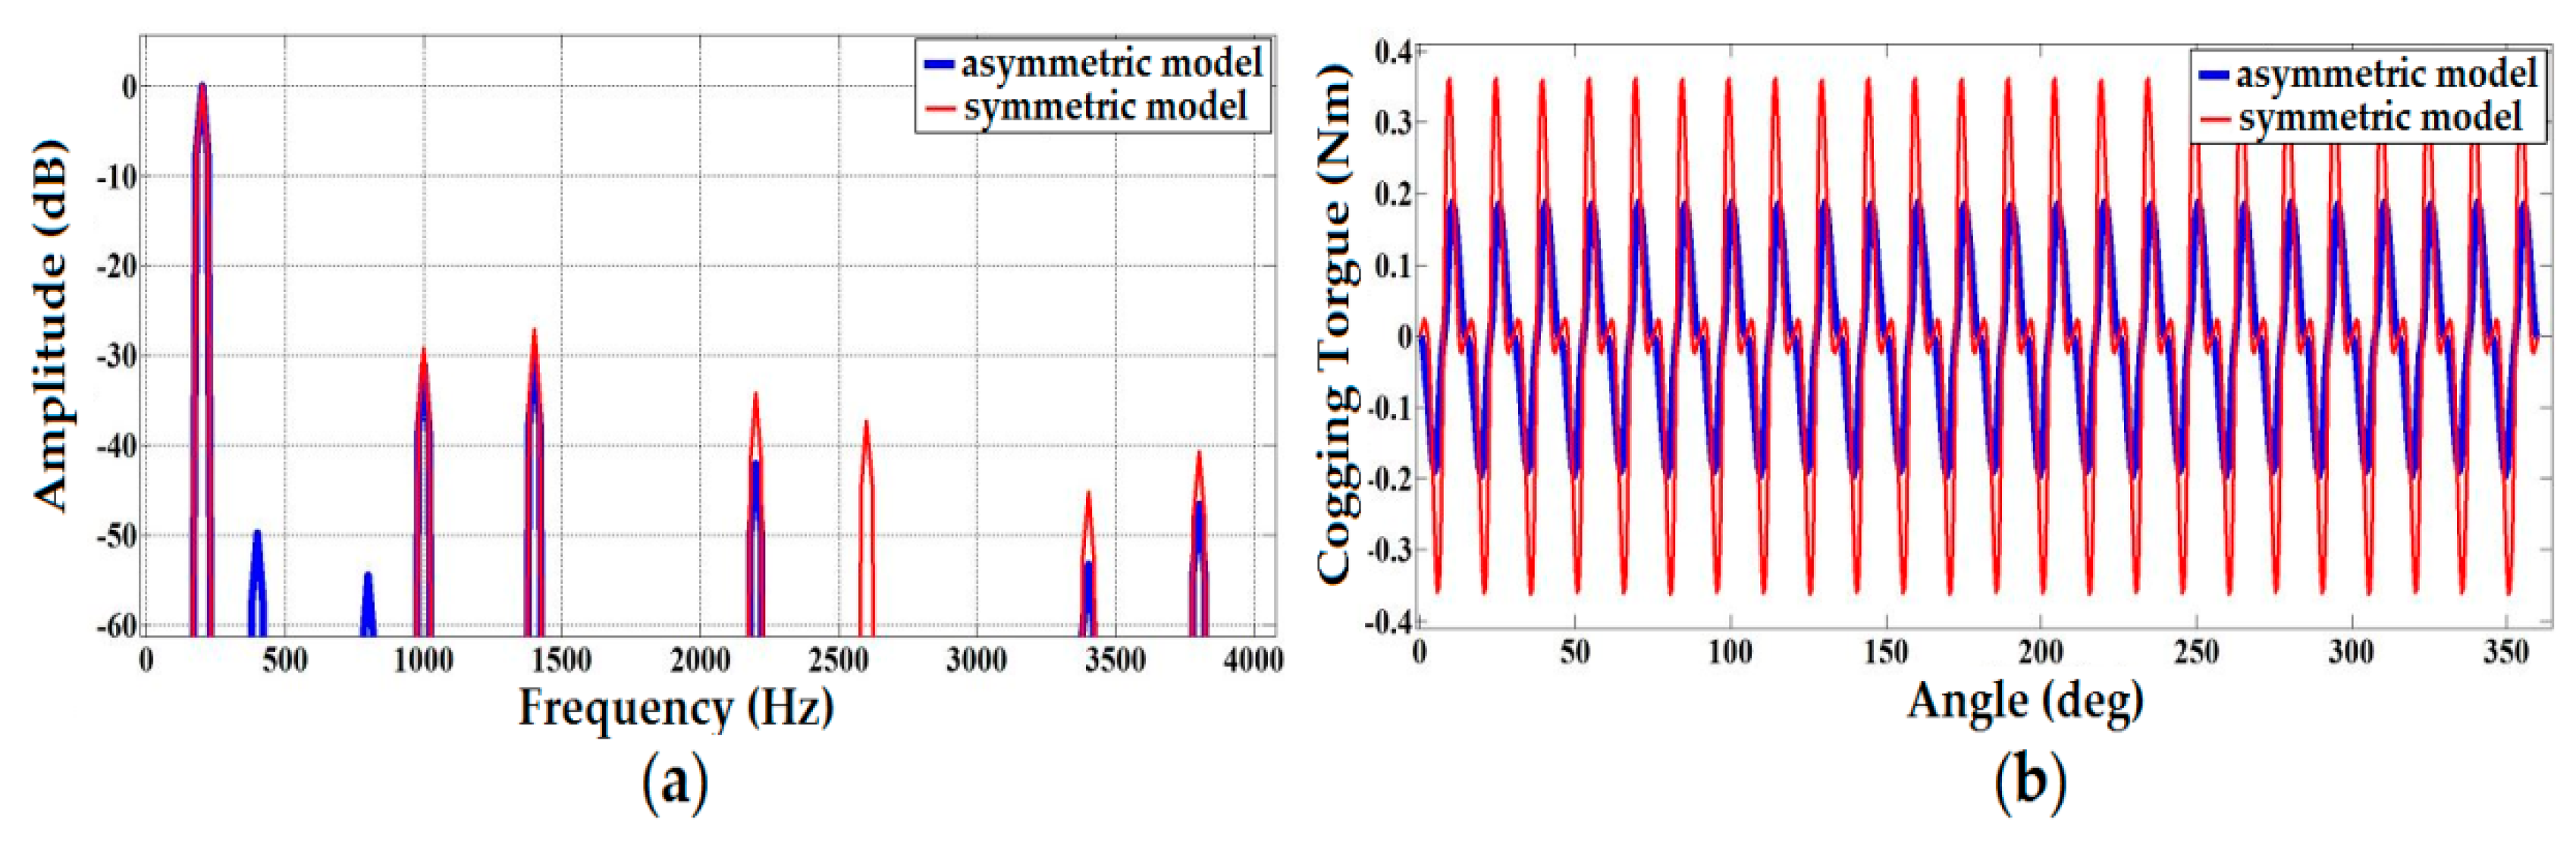
5.1. Symmetric and Asymmetric Model of the Generator with a Resistive Load
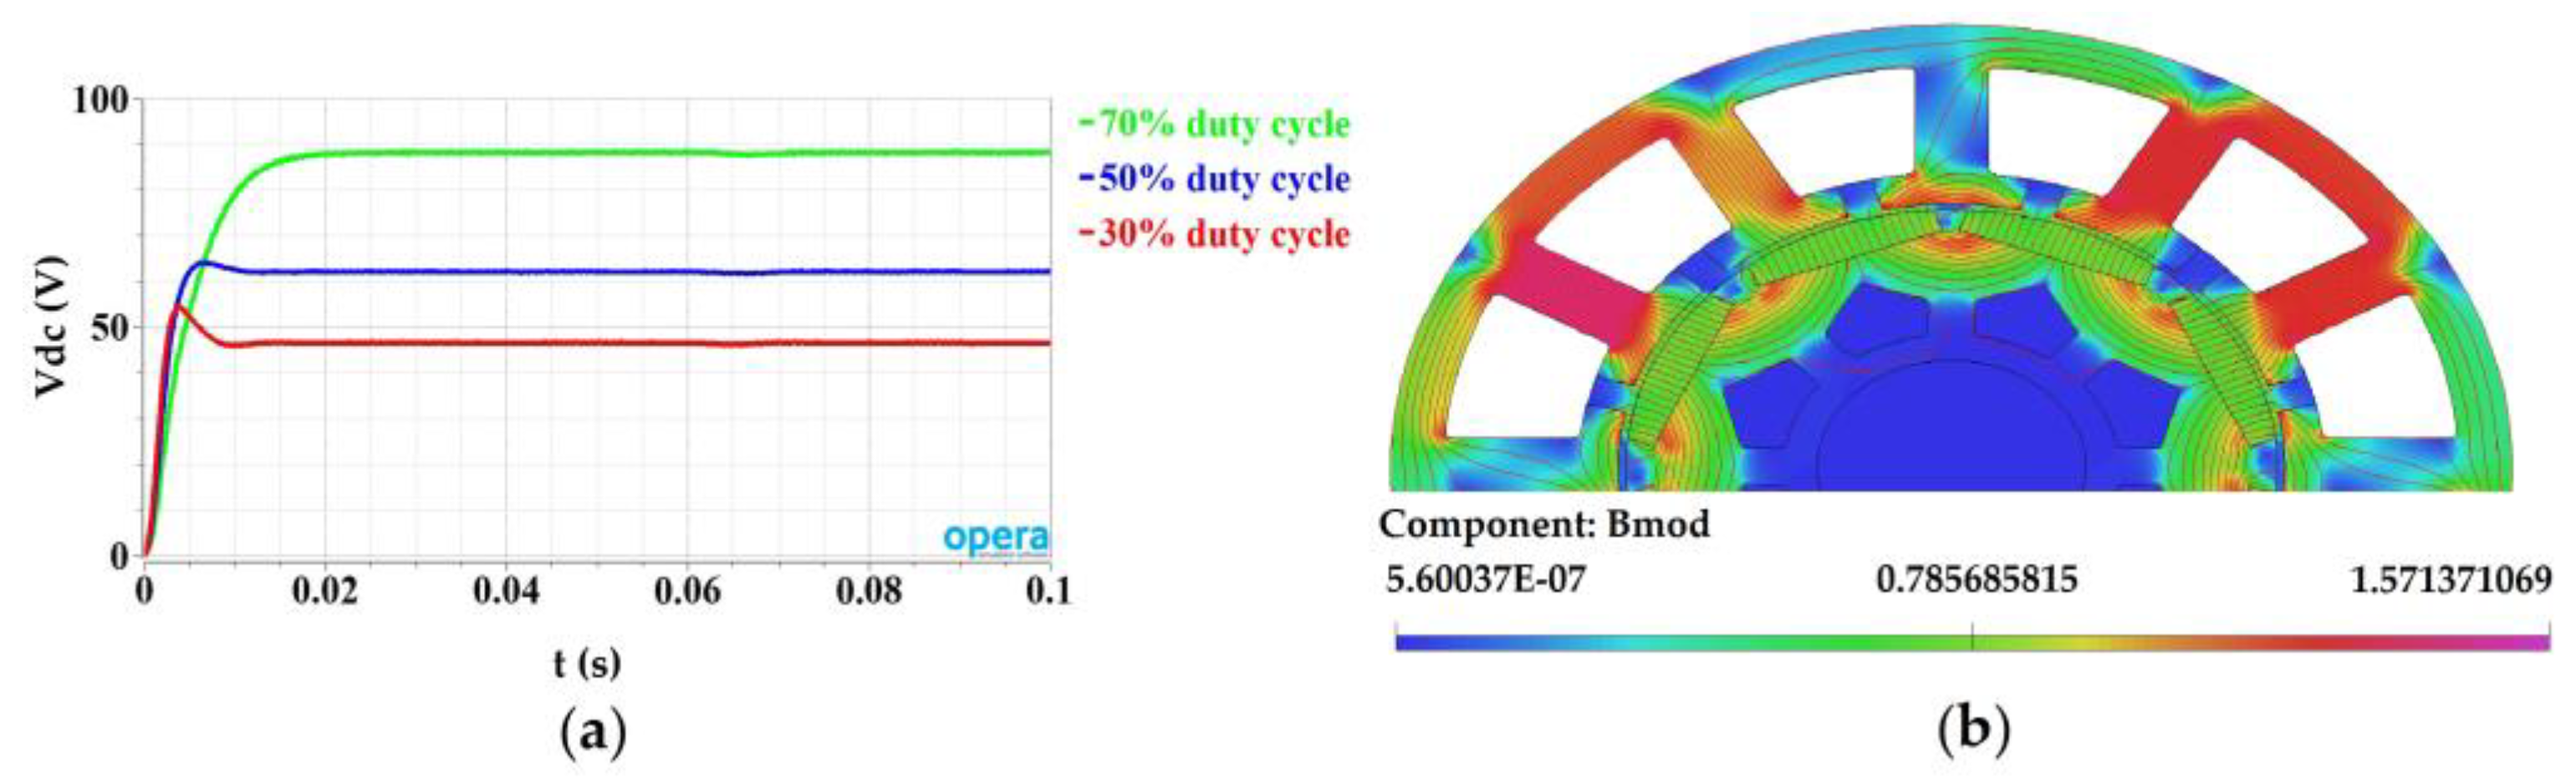
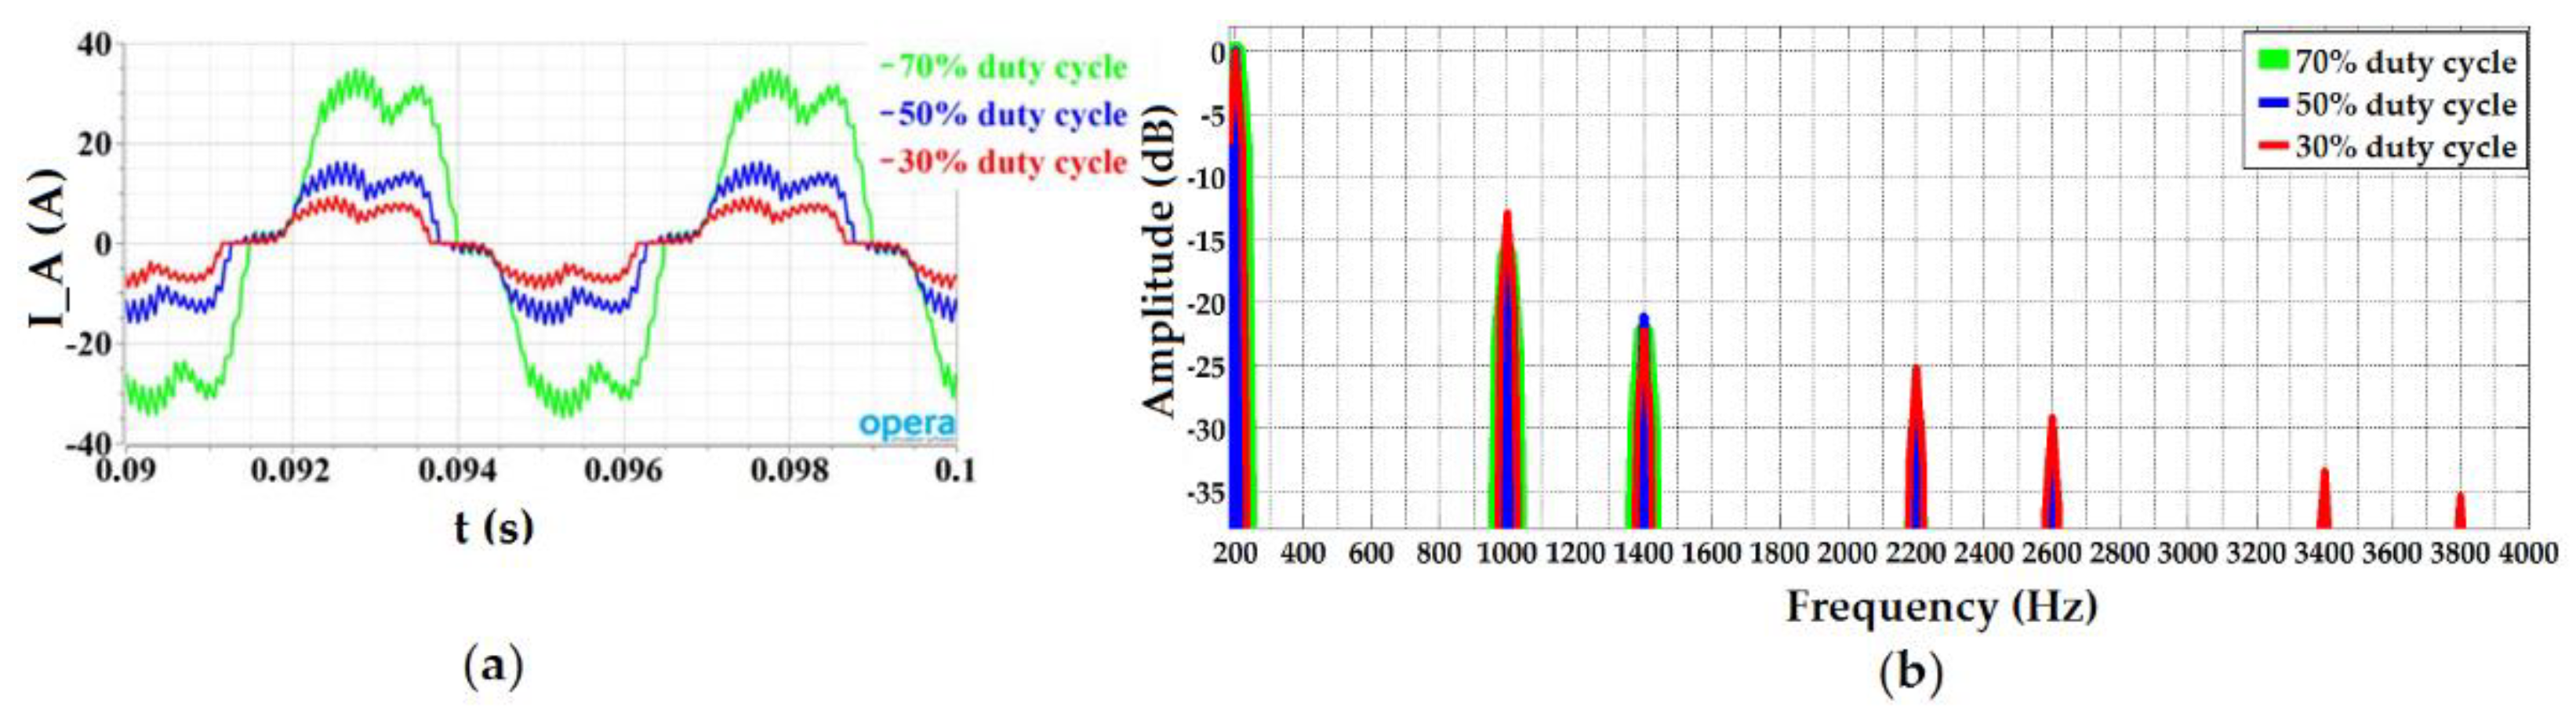
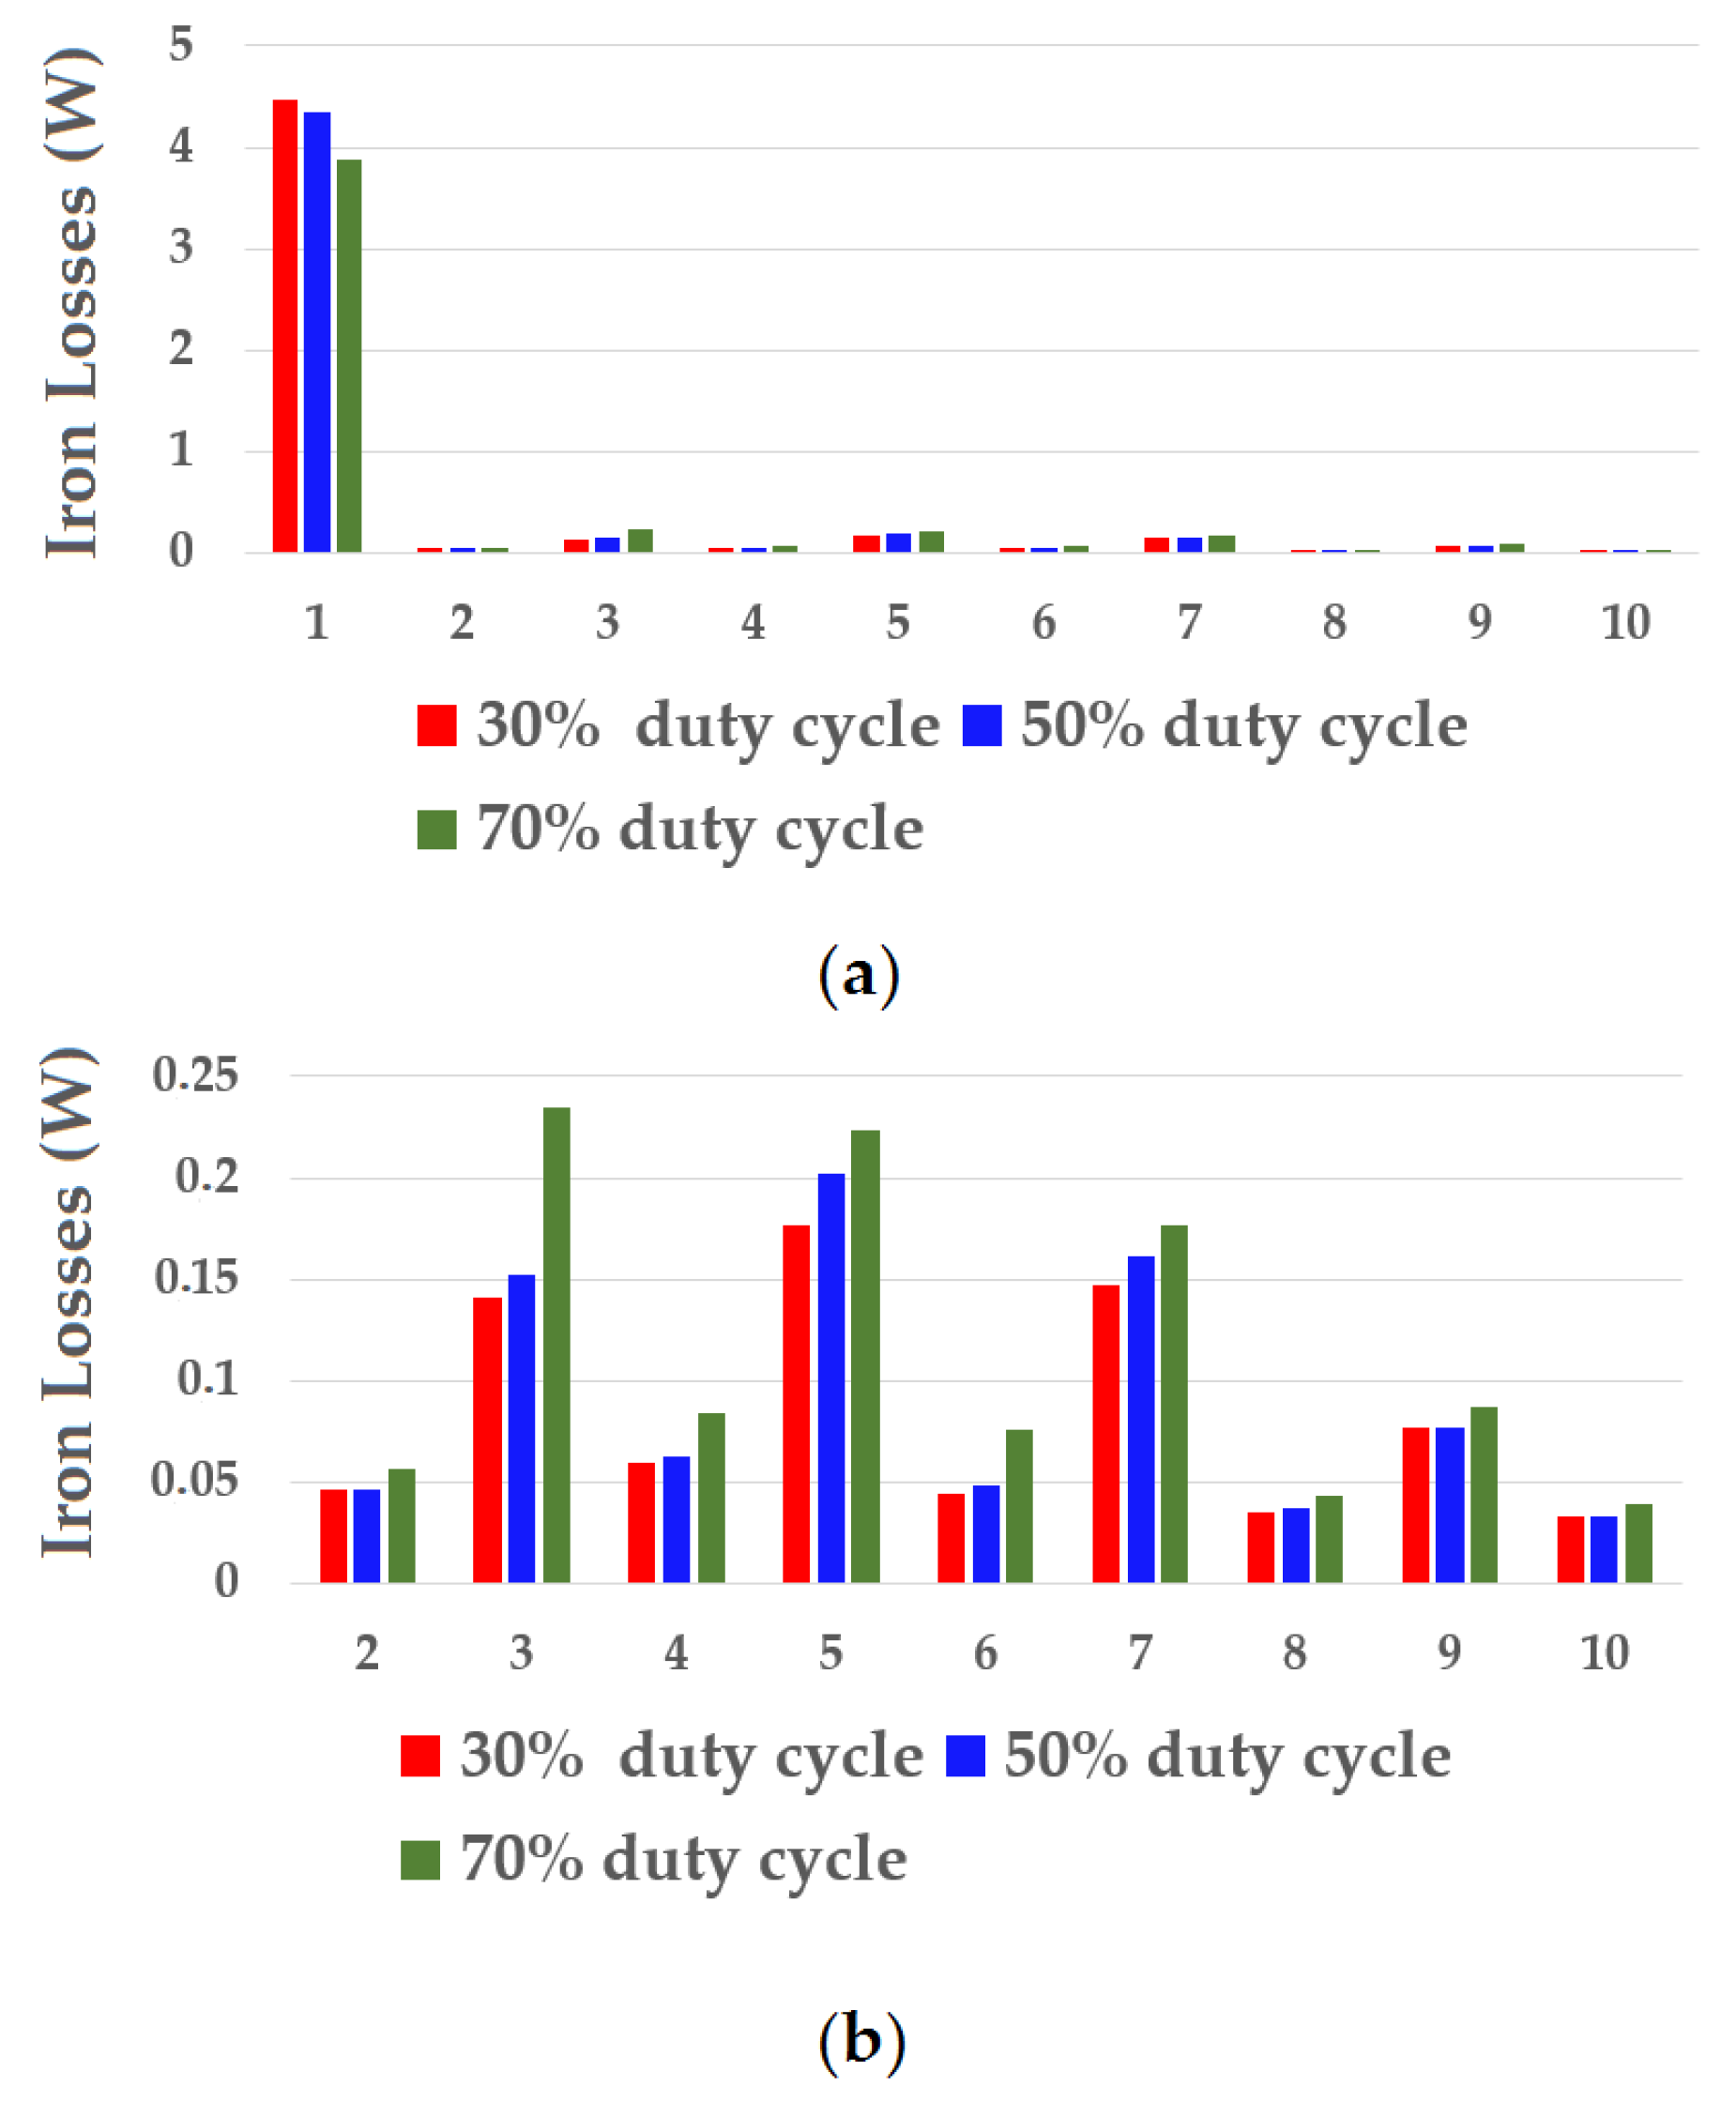
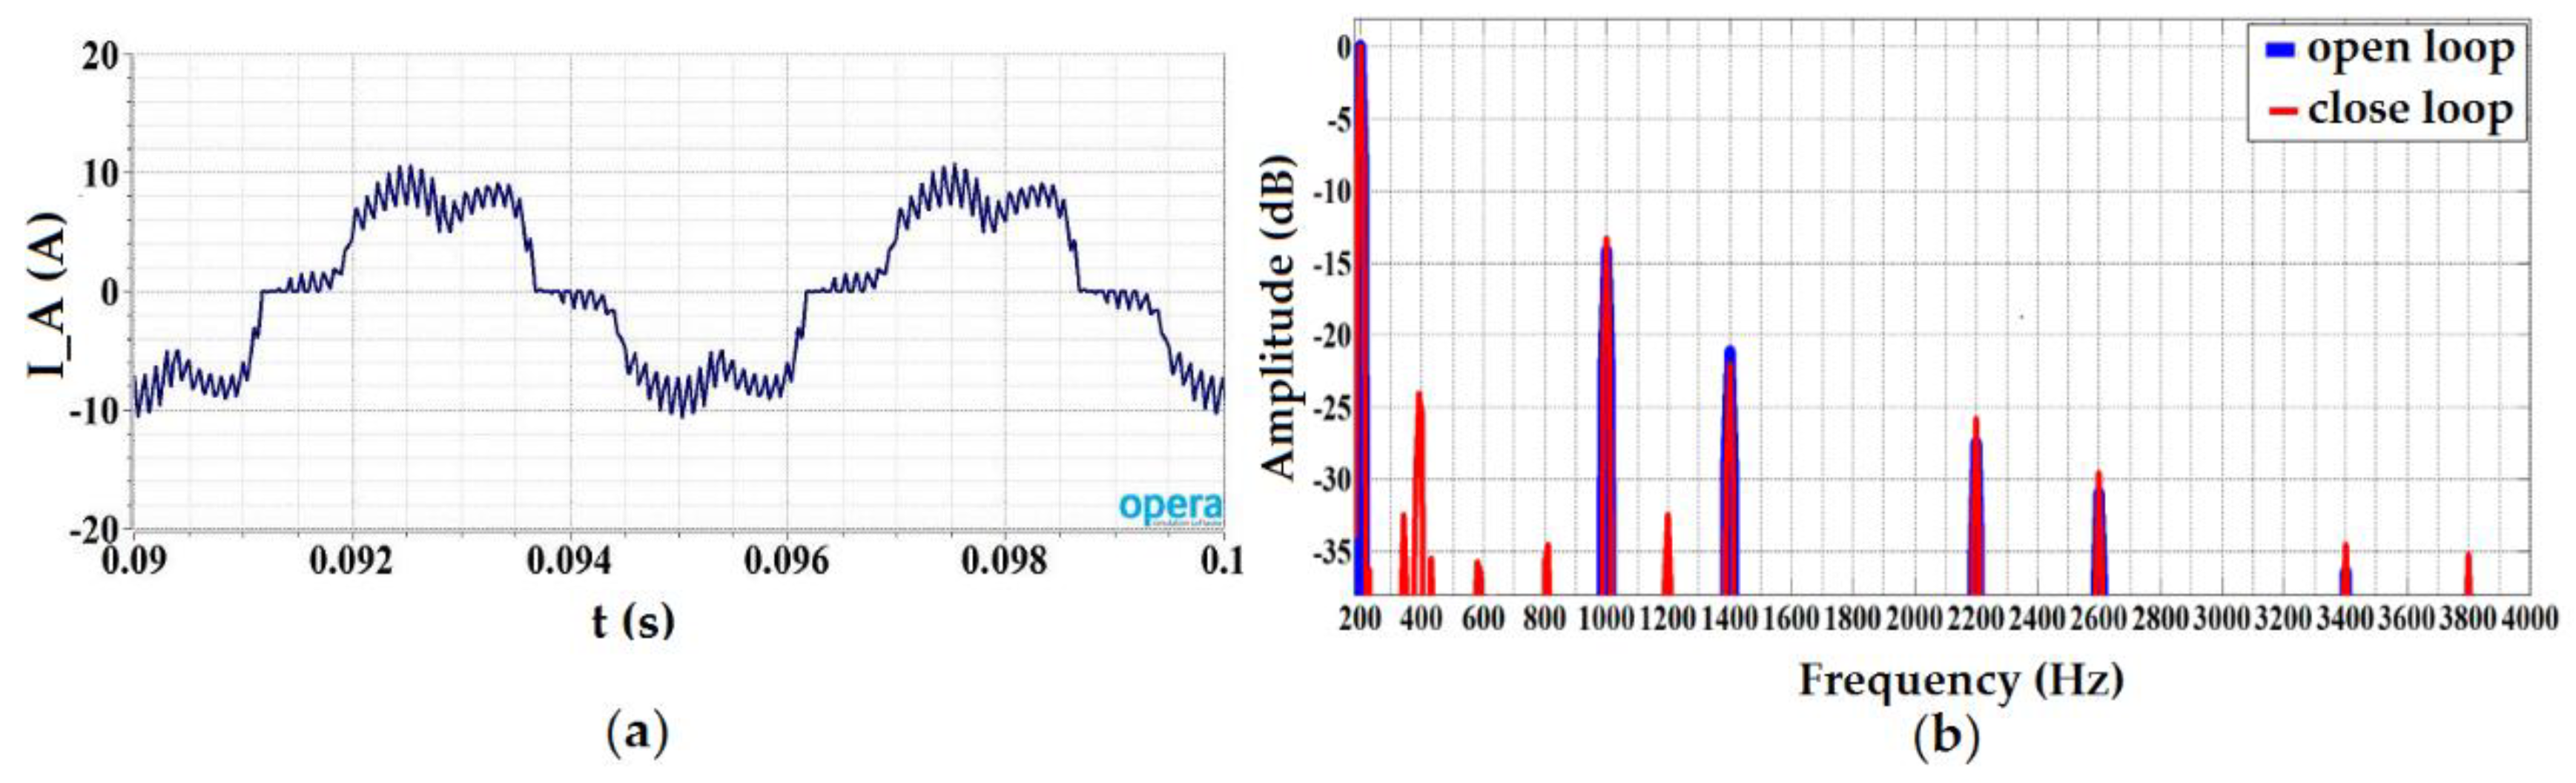
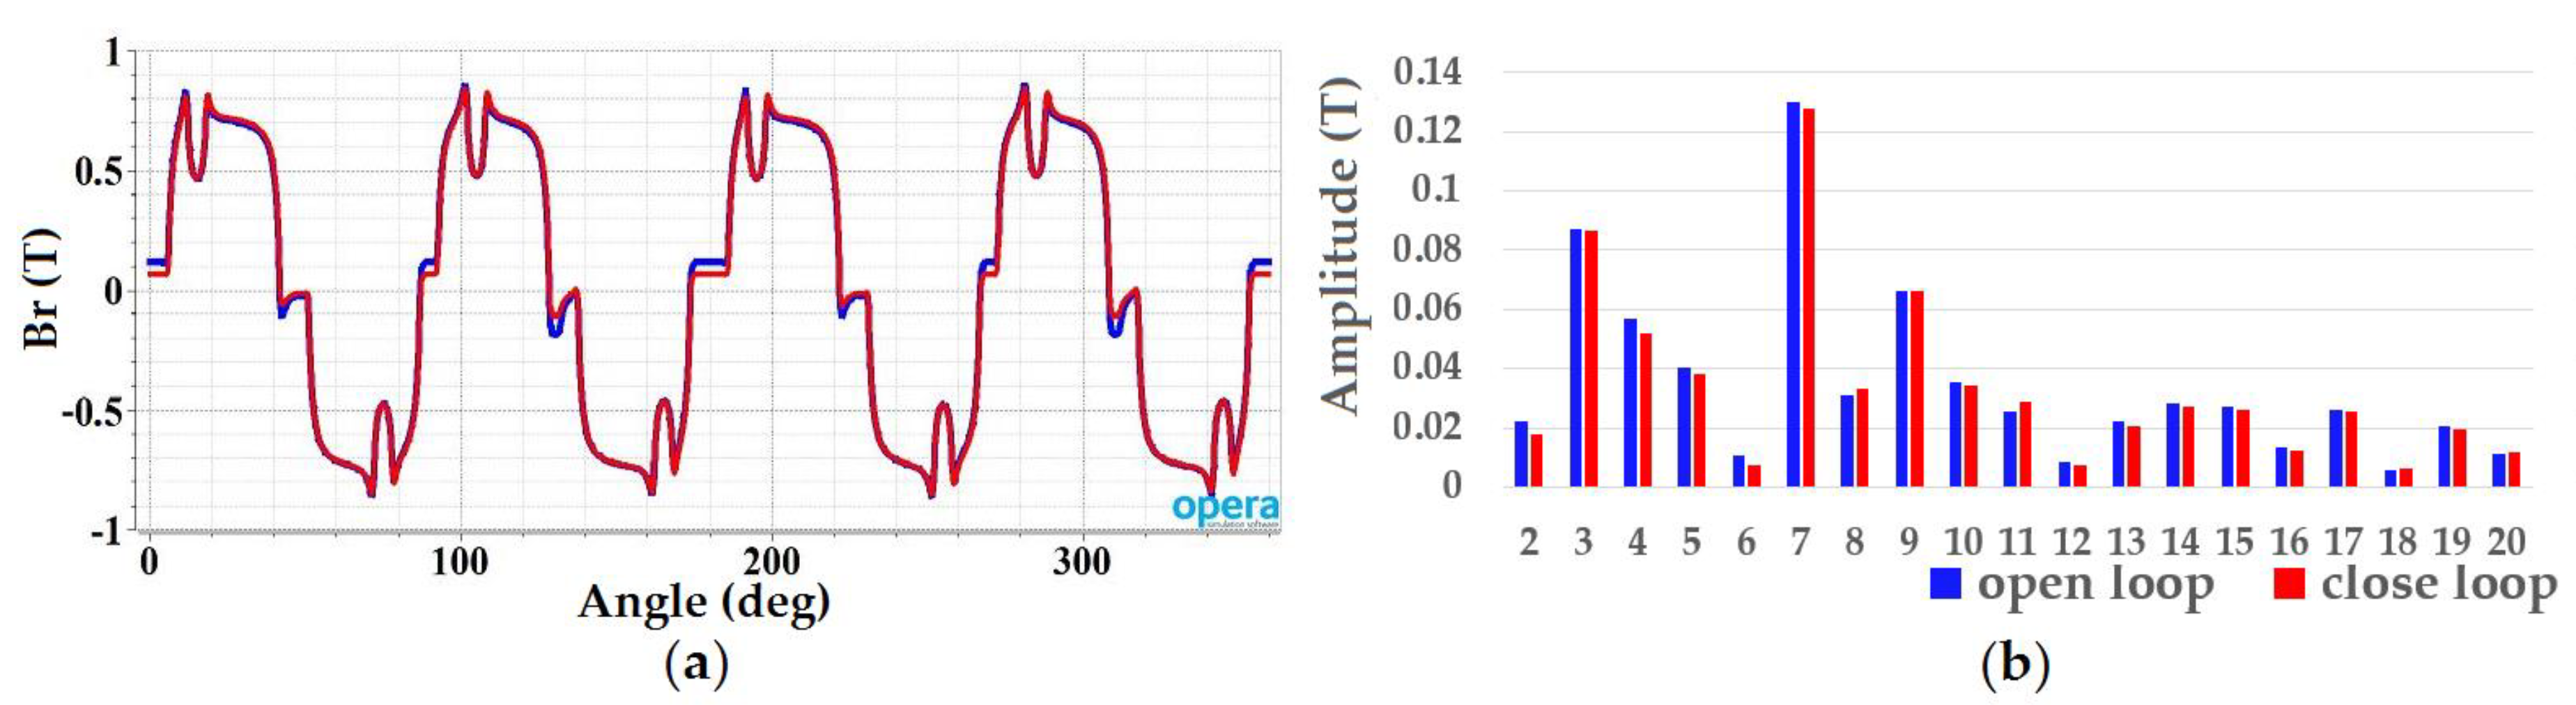
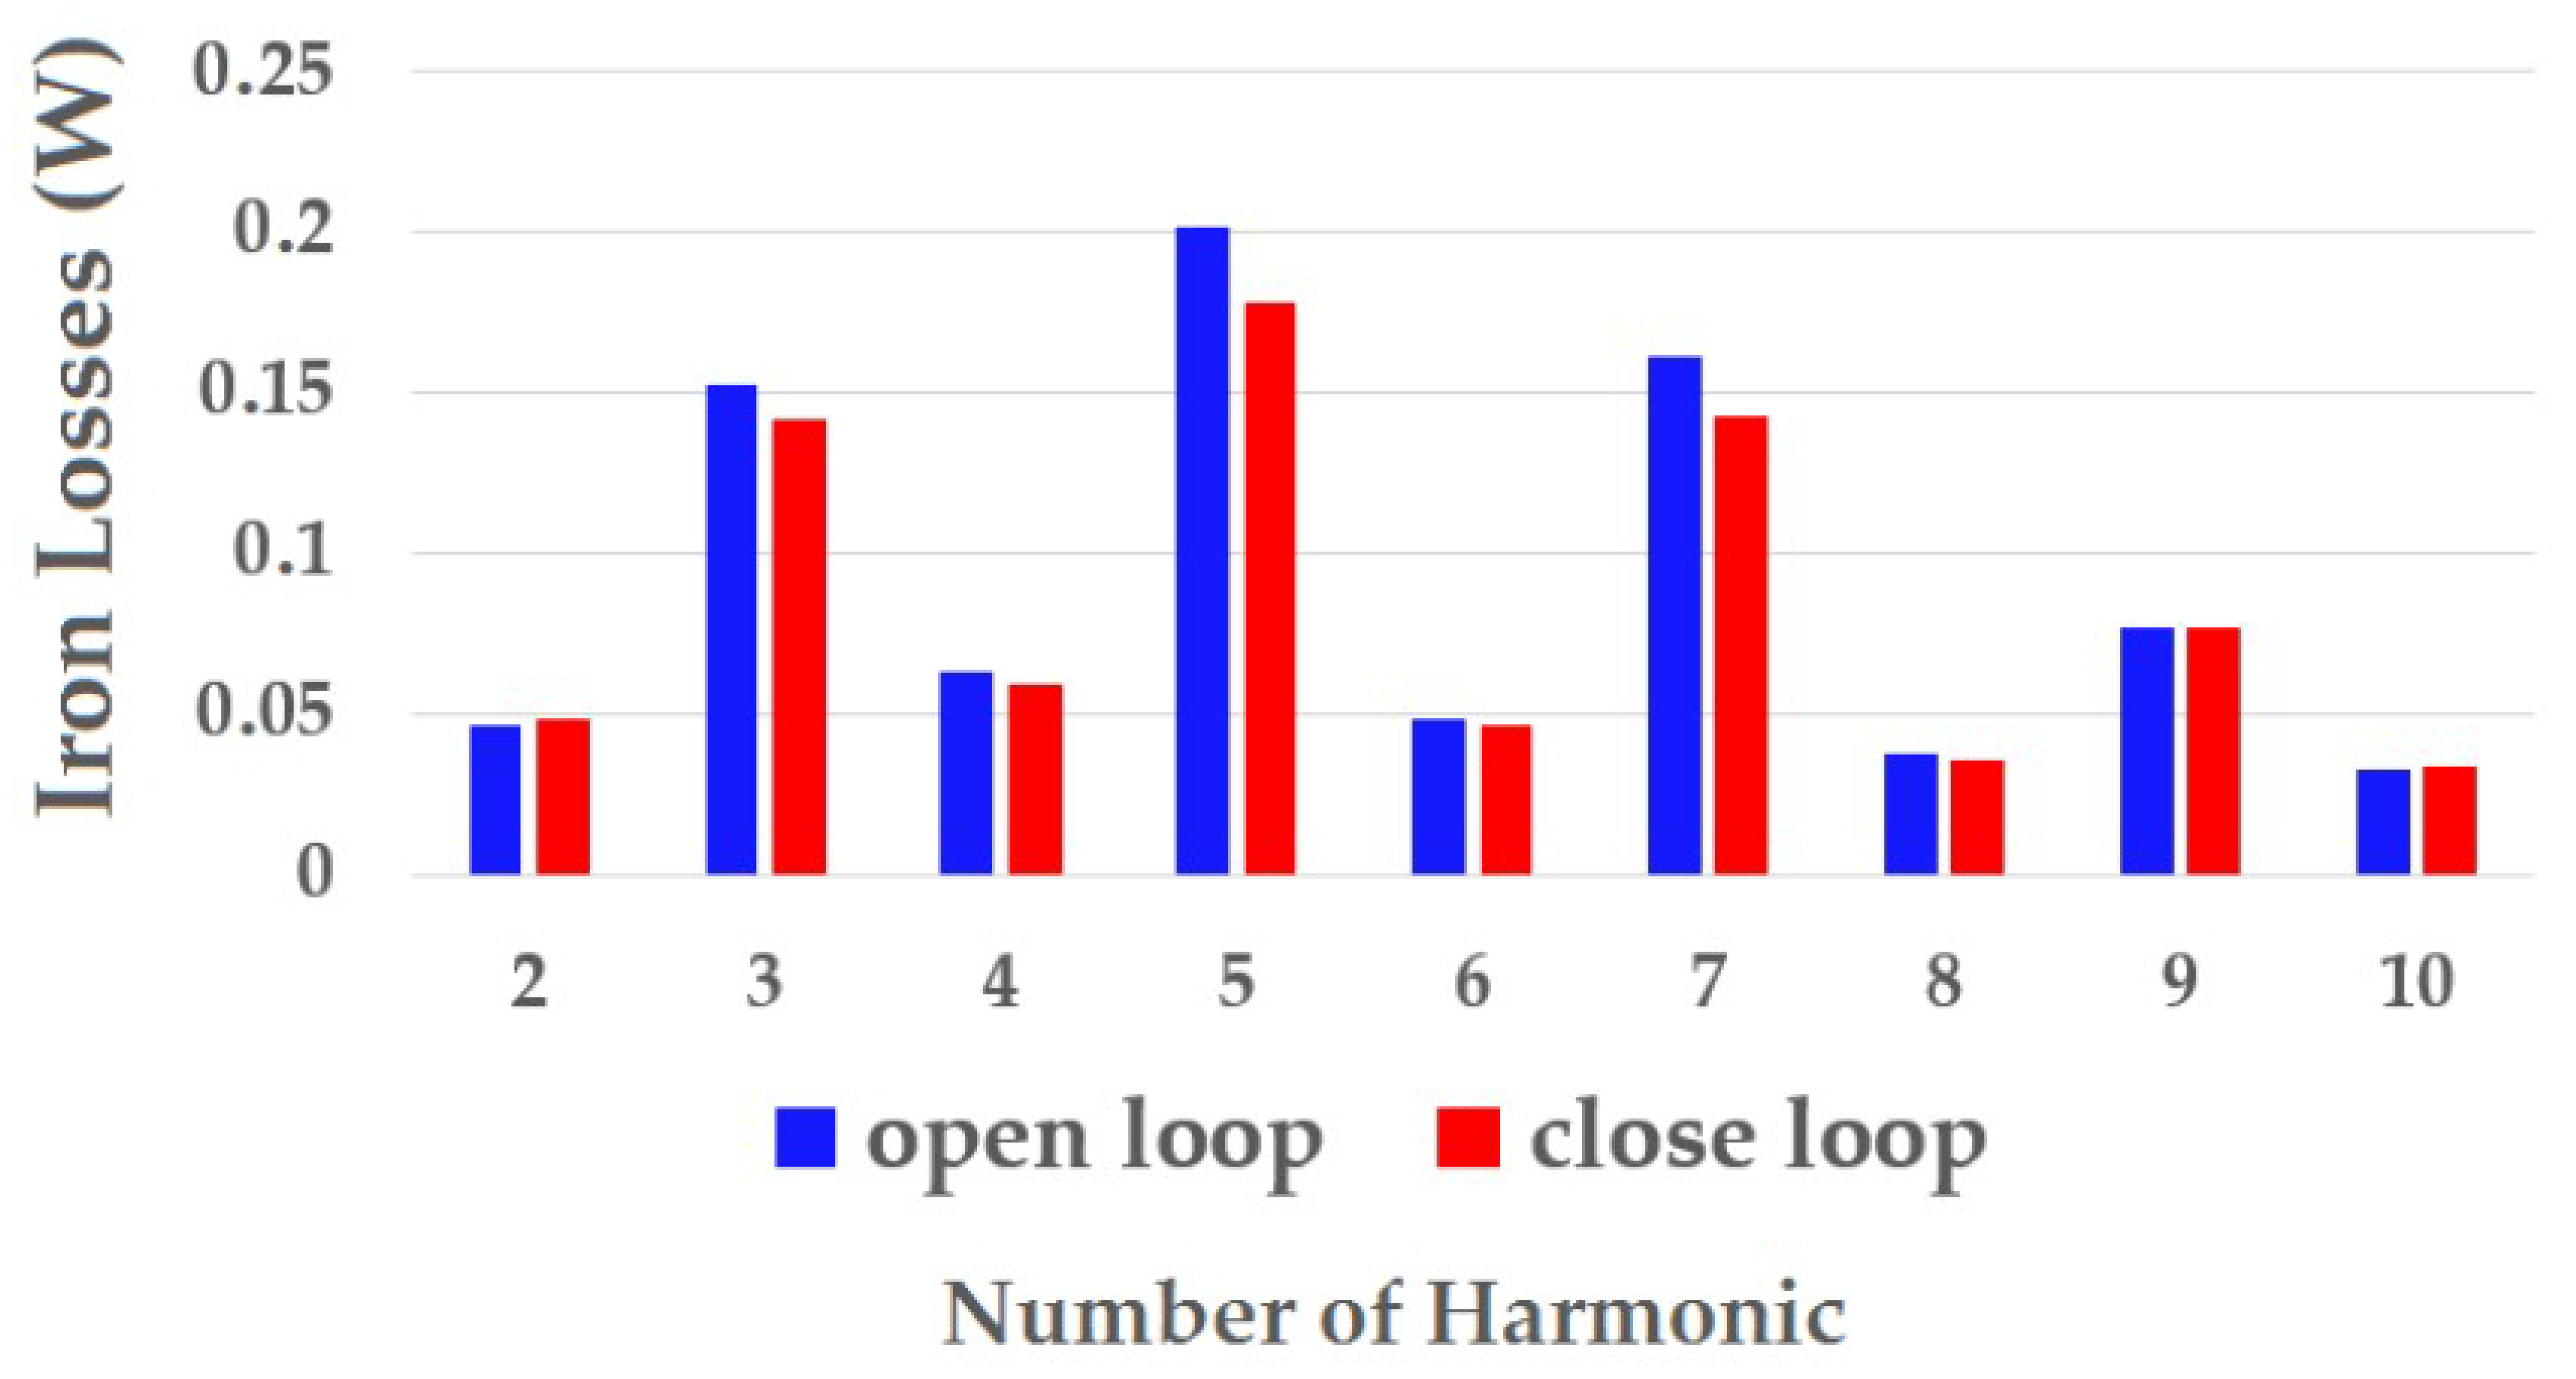
5.2. Open Loop Control of the System
5.3. Close Loop Control of the System
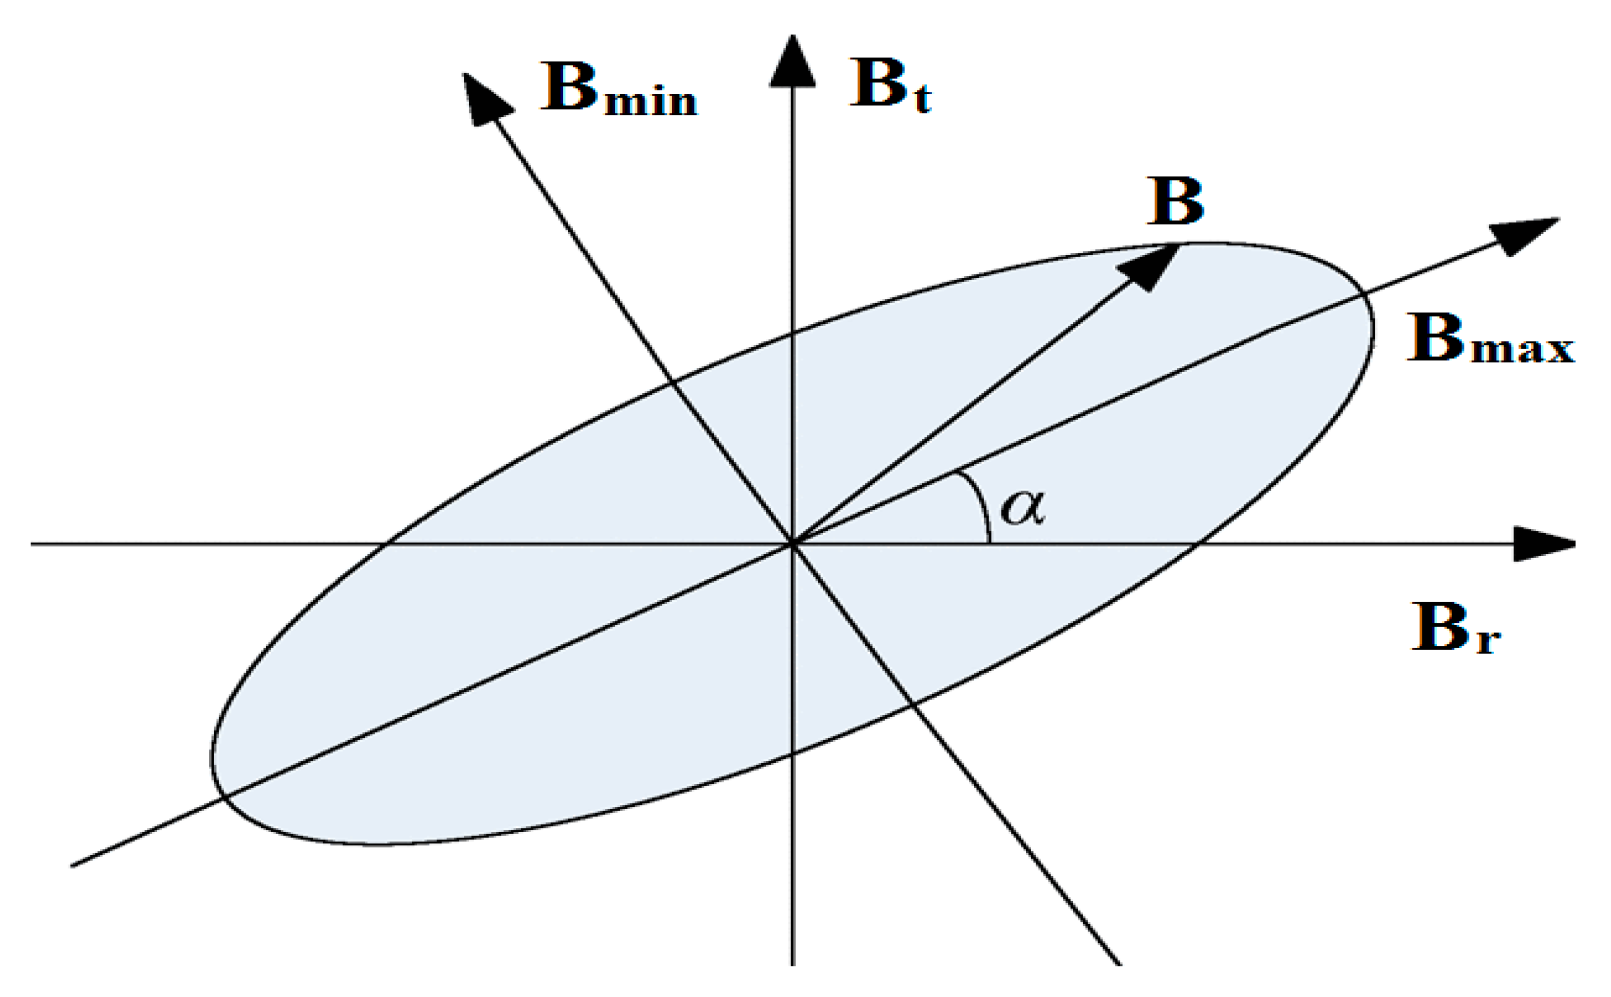
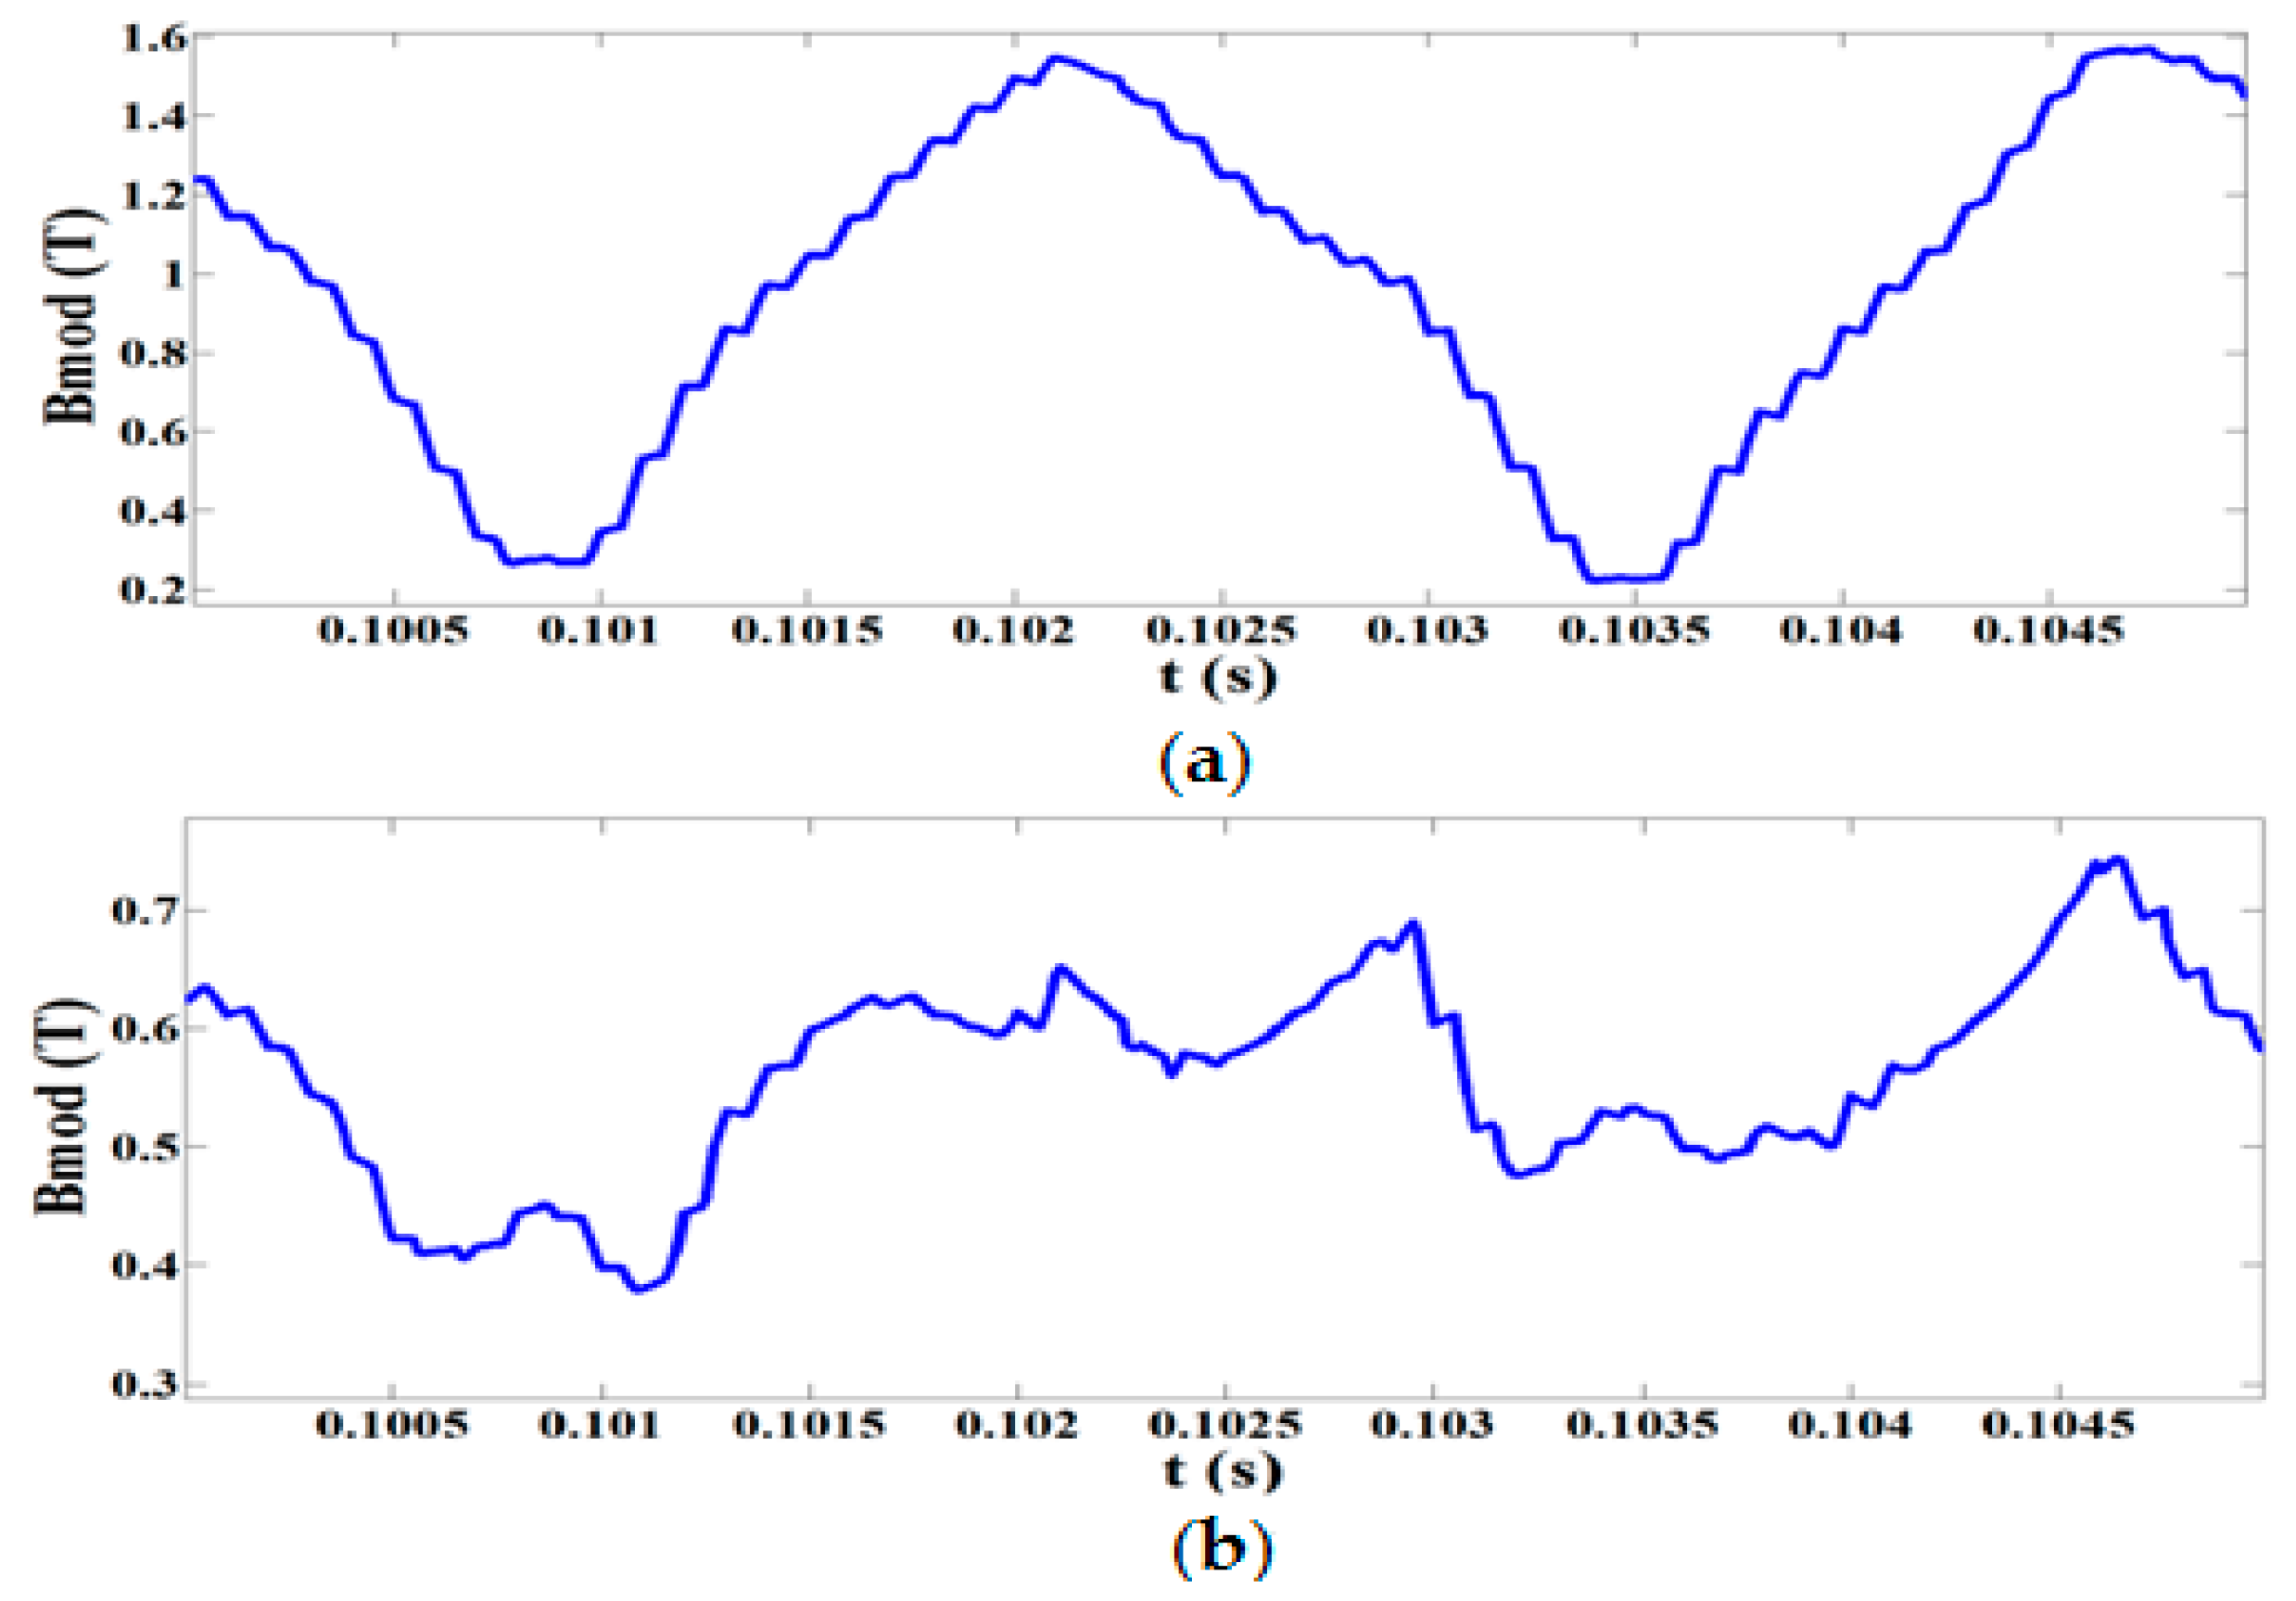
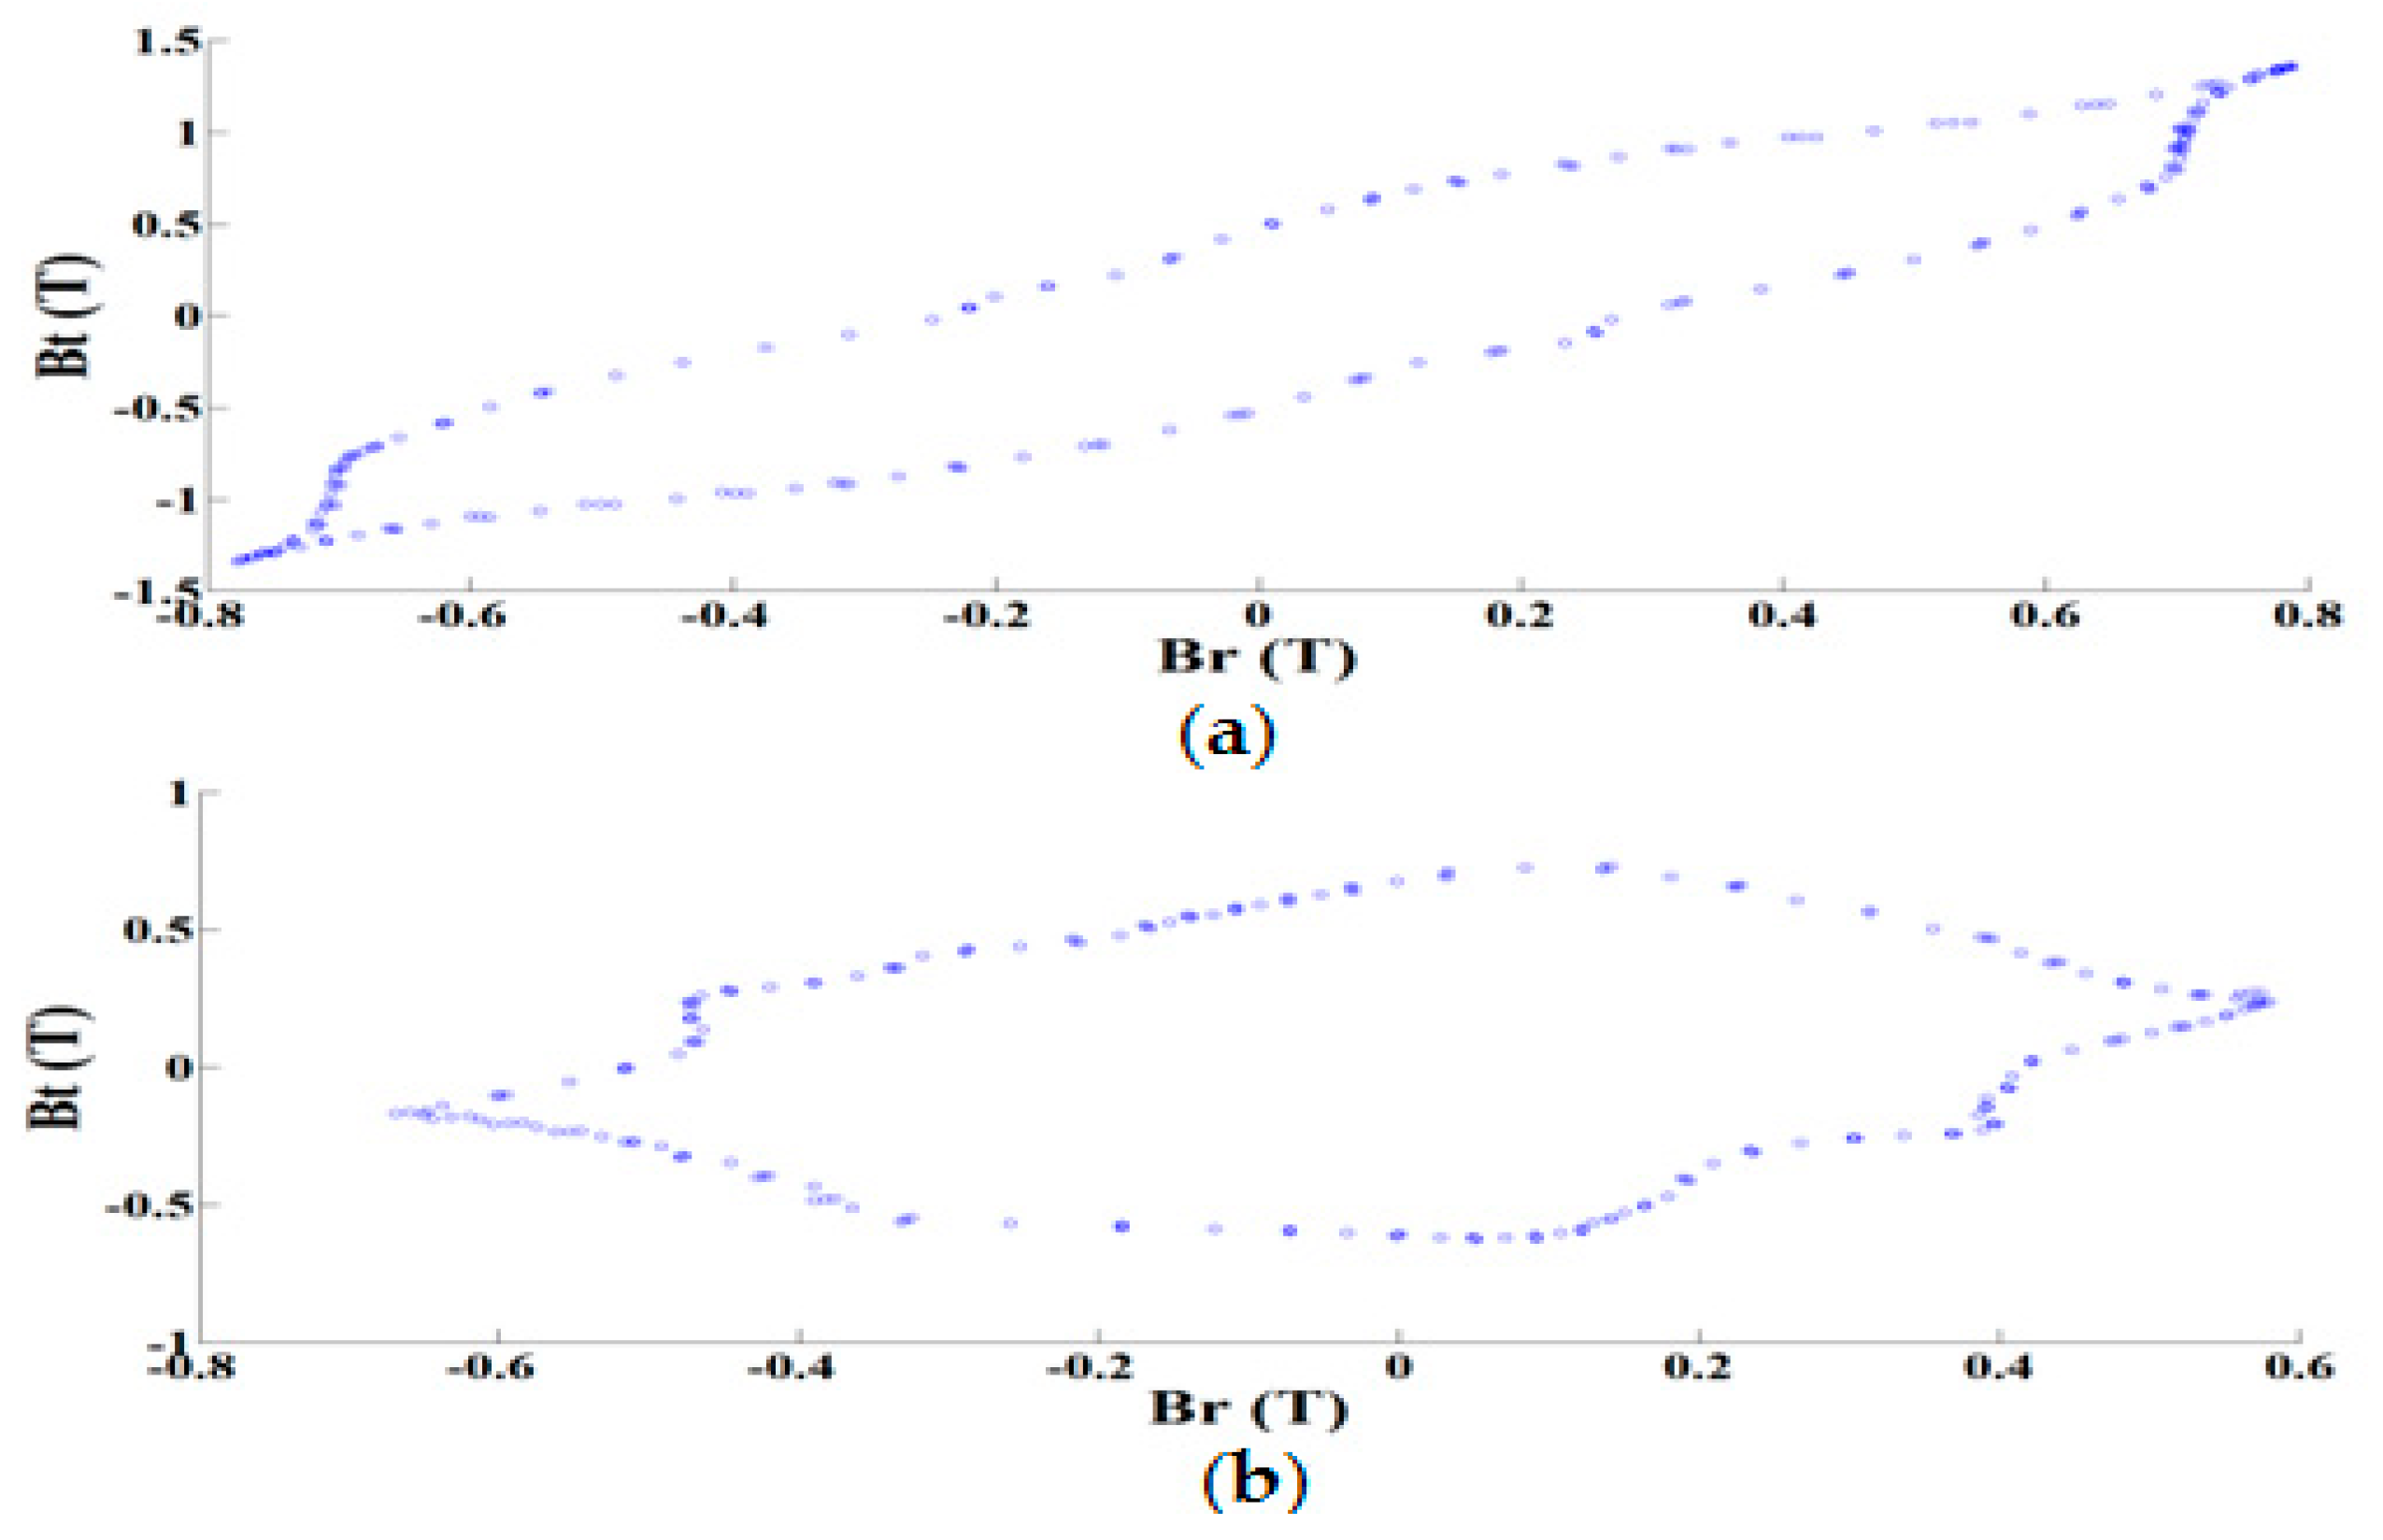
6. Losses Due to the Rotating Magnetic Field
7. Conclusions
Author Contributions
Funding
Conflicts of Interest
References
- Boldea, I.; Tutelea, L.; Blaabjerg, F. High power wind generator designs with less or no PMs: An overview. In Proceedings of the 2014 17th International Conference on Electrical Machines and Systems (ICEMS), Hangzhou, China, 22–25 October 2014. [Google Scholar]
- Polinder, H.; Ferreira, J.A.; Jensen, B.B.; Abrahamsen, A.B.; Atallah, K.; McMahon, R.A. Trends in wind turbine generator systems. IEEE J. Emerg. Sel. Top. Power Electron. 2013, 1, 174–185. [Google Scholar] [CrossRef]
- Goto, H.; Guo, H.J.; Inchinokura, O. A micro wind power generation system using permanent magnet reluctance generator. In Proceedings of the 2009 13th European Conference on Power Electronics and Applications (ECPEA), Barcelona, Spain, 8–10 September 2009. [Google Scholar]
- Novakovic, B.; Duan, Y.; Solveson, M.; Nasiri, A.; Ionel, D.M. Multi-physics system simulation for wind turbines with permanent magnet generator and full conversion power electronics. In Proceedings of the 2013 13th IEEE International Conference on Electrical Machines and Drives (IEMDC), Chicago, IL, USA, 12–15 May 2013. [Google Scholar]
- Novakovic, B.; Duan, Y.; Solveson, M.; Nasiri, A.; Ionel, D.M. Comprehensive modeling of turbine systems from wind to electric grid. In Proceedings of the 2013 5th Annual IEEE Energy Conversion Congress and Exposition (ECCE), Denver, CO, USA, 15–19 September 2013. [Google Scholar]
- Uma, S.P.; Manikandan, S. Control technique for variable speed wind turbine using PI controller. In Proceedings of the 2013 1th IEEE International Conference on Emerging Trends in Computing, Communications and Nanotechnology (ICETCCN), Tirunelveli, India, 25–26 March 2013. [Google Scholar]
- Raza, K.S.M.; Goto, H.; Guo, H.J.; Inchinokura, O. Maximum power point tracking control and voltage regulation of a DC grid-tied wind energy conversion system based on a novel permanent magnet reluctance generator. In Proceedings of the 2007 10th International Conference on Electrical Machines and Systems (ICEMS), Seoul, Korea, 8–10 October 2007. [Google Scholar]
- Koreboina, V.B.; Venkatesha, L. Modelling and simulation of switched reluctance generator control for variable speed wind energy conversion systems. In Proceedings of the 2012 4th IEEE International Conference on Power Electronics, Drives and Energy Systems (ICPEDES), Bengaluru, India, 16–19 December 2012. [Google Scholar]
- Ahmed, N.A.; Al-Othman, A.K.; AlRashidi, M.R. Development of an efficient utility interactive combined wind/photovoltaic/fuel cell power system with MPPT and DC bus voltage regulation. Electr. Power Syst. Res. 2011, 81, 1096–1106. [Google Scholar] [CrossRef]
- Asefa, P.; Bargallo Perpina, R.; Barzegaran, M.R.; Lapthorn, A.; Mewes, D. Load identification of different Halbach-array topologies on permanent magnet synchronous generators using the coupled field-circuit FE methodology. Electr. Power Syst. Res. 2018, 154, 484–492. [Google Scholar] [CrossRef]
- Barmpatza, A.; Pallis, I.K.; Kappatou, J. FEM modeling and study of a permanent magnet synchronous generator with DC-link voltage control for wind power systems. In Proceedings of the 2015 17th International Symposium on Electromagnetic Fields in Mechatronics, Electrical and Electronic Engineering (ISEF), Valencia, Spain, 10–12 September 2015. [Google Scholar]
- Barmpatza, A.C.; Kappatou, J.C. PWM influence on the losses of a PMSG supplying a boost rectifier. In Proceedings of the 2016 22th International Conference on Electrical Machines (ICEM), Lausanne, Switzerland, 4–7 September 2016. [Google Scholar]
- Tudorache, T.; Melcescu, L.; Popescu, M. Methods for cogging torque reduction of directly driven PM Wind generators. In Proceedings of the 2010 12th International Conference on Optimization of Electrical and Electronic Equipment (ICOEEE), Basov, Romania, 20–22 May 2010. [Google Scholar]
- Kolar, J.W.; Ertl, H.; Zach, F.C. Space vector-based analytical analysis of the input current distortion of a three-phase discontinuous-mode boost rectifier system. IEEE Trans. Power Electron. 1995, 10, 733–745. [Google Scholar] [CrossRef]
- Jangand, Y.; Jovanonic, M. A novel robust harmonic injection method for single-switch three phase discontinuous-conduction-mode boost rectifiers. IEEE Trans. Power Electron. 1998, 5, 824–834. [Google Scholar] [CrossRef]
- Xu, Z.; Zhang, D.; Wang, F.; Boroyevich, D. Unified control for the permanent magnet generator and rectifier system. In Proceedings of the 2011 26th Annual IEEE Applied Power Electronic Conference and Exposition (APEC), Fort Worth, TX, USA, 6–11 March 2011. [Google Scholar]
- Li, J.; Choi, D.W.; Son, D.-H.; Cho, Y.-H. Effects of MMF harmonics on rotor eddy-current losses for inner-rotor fractional slot axial flux permanent magnet synchronous machines. IEEE Trans. Magn. 2012, 48, 839–842. [Google Scholar] [CrossRef]
- Pfingsten, G.; Steentjes, S.; Hombitzer, M.; Franck, D.; Hameyer, K. Influence of winding scheme on the iron-loss distribution in permanent magnet synchronous machines. IEEE Trans. Magn. 2014, 50. [Google Scholar] [CrossRef]
- Stiebler, M. Sub-transients in PM synchronous generator with diode rectifier load. In Proceedings of the 2014 21th International Conference on Electrical Machines (ICEM), Berlin, Germany, 2–5 September 2014. [Google Scholar]
- Jang, Y.; Jovanonic, M. A Comparative study of single-switch, three-phase, high-power-factor rectifiers. IEEE Trans. Ind. Appl. 1998, 34, 1327–1334. [Google Scholar] [CrossRef]
- Yao, K.; Ruan, X.; Mao, X.; Ye, Z. Variable-duty-cycle control to achieve high input power factor for DCM boost PFC converter. IEEE Trans. Ind. Appl. 2010, 58, 1856–1865. [Google Scholar] [CrossRef]
- Krings, A.; Soulard, J.; Wallmark, O. pwm influence on the iron losses and characteristics of a slotless permanent-magnet motor with SiFe and NiFe stator cores. IEEE Trans. Ind. Appl. 2015, 51, 1457–1484. [Google Scholar] [CrossRef]
- Juergens, J.; Ponick, B.; Winter, O.; Fricassè, A. Influences of iron loss coefficients estimation on the prediction of iron losses for variable speed motors. In Proceedings of the 2015 14th IEEE International Conference on Electrical Machines and Drives (IEMDC), Coeur d’ Alene, ID, USA, 10–13 May 2015. [Google Scholar]
- Ibrahim, M.; Pillay, P. Core loss prediction in electrical machine laminations considering skin effect and minor hysteresis loops. IEEE Trans. Ind. Appl. 2014, 49, 2061–2068. [Google Scholar] [CrossRef]
- Huang, Y.; Dong, J.; Zhu, J.; Guo, Y. Core loss modeling for permanent-magnet motor based on flux variation locus and finite-element method. IEEE Trans. Magn. 2012, 48, 1023–1026. [Google Scholar] [CrossRef]
- Kim, W.; Kim, J.M.; Seo, S.W.; Ahn, J.H.; Hong, K.; Choi, J.Y. core loss analysis of permanent magnet linear synchronous generator considering the 3-D flux path. IEEE Trans. Magn. 2018, 54. [Google Scholar] [CrossRef]
- Hwang, S.W.; Lim, M.S.; Hong, J.P. Hysteresis torque estimation method based on iron-loss analysis for permanent magnet synchronous motor. IEEE Trans. Magn. 2016, 52. [Google Scholar] [CrossRef]
- Tudorache, T.; Trifu, I. Permanent-magnet synchronous machine cogging torque reduction using a hybrid model. IEEE Trans. Magn. 2012, 48, 2627–2632. [Google Scholar] [CrossRef]
- Bianchini, C.; Immovilli, F.; Lorenzani, E.; Bellini, A.; Davoli, M. Review of design solutions for internal permanent-magnet machines cogging torque reduction. IEEE Trans. Magn. 2012, 48, 2685–2693. [Google Scholar] [CrossRef]
- Tsotoulidis, S.; Safacas, A. A sensorless commutation technique of a brushless DC motor drive system using two terminal voltages in respect to a virtual neutral potential. In Proceedings of the 2012 20th International Conference on Electrical Machines (ICEM), Marseille, France, 2–5 September 2012. [Google Scholar]
- Tsotoulidis, S.; Safacas, A.; Mitronikas, E. A Sensorless Commutation strategy for a brushless DC motor drive system based on detection of back electromagnetic force. In Proceedings of the 2011 International Aegean Conference on Electrical Machines and Power Electronics and Electromotion, Joint Conference (ACEMP), Istanbul, Turkey, 8–10 September 2011. [Google Scholar]
- Zhao, N.; Zhu, Z.Q.; Liu, W. Rotor eddy current loss calculation and thermal analysis of permanent magnet motor and generator. IEEE Trans. Magn. 2011, 47, 4199–4202. [Google Scholar] [CrossRef]
- Ruderman, A.; Reznikov, B.; Busquets-Monge, S. Asymptotic time domain evaluation of a multilevel multiphase PWM converter voltage quality. IEEE Trans. Ind. Electron. 2013, 60, 1999–2009. [Google Scholar] [CrossRef]
- Ruderman, A. Discussion on effect of multilevel inverter supply on core losses in magnetic materials and electrical machines. IEEE Trans. Energy Convers. 2015, 30, 1604. [Google Scholar] [CrossRef]
- Boubakera, N.; Matta, D.; Enricia, P.; Nierlichb, F.; Durandb, G.; Orlandinic, F.; Longèrec, X.; Aïgba, J.S. Study of eddy-current loss in the sleeves and Sm–Co magnets of a high-performance SMPM synchronous machine (10 kRPM, 60 kW). Electr. Power Syst. Res. 2017, 142, 20–28. [Google Scholar] [CrossRef]
- Chen, P.; Tang, R.; Tong, W.; Han, X.; Jia, J.; Zhu, X. Analysis of losses of permanent magnet synchronous motor with PWM supply. In Proceedings of the 2014 17th International Conference on Electrical Machines and Systems (ICEMS), Hangzhou, China, 22–25 October 2014. [Google Scholar]


| Duty Cycle (%) | Copper Losses (W) | Iron Losses (W) | η (%) |
|---|---|---|---|
| 70 | 143.77 | 4.90 | 70.14 |
| 50 | 23.73 | 5.17 | 86.23 |
| 30 | 8.89 | 5.23 | 77.42 |
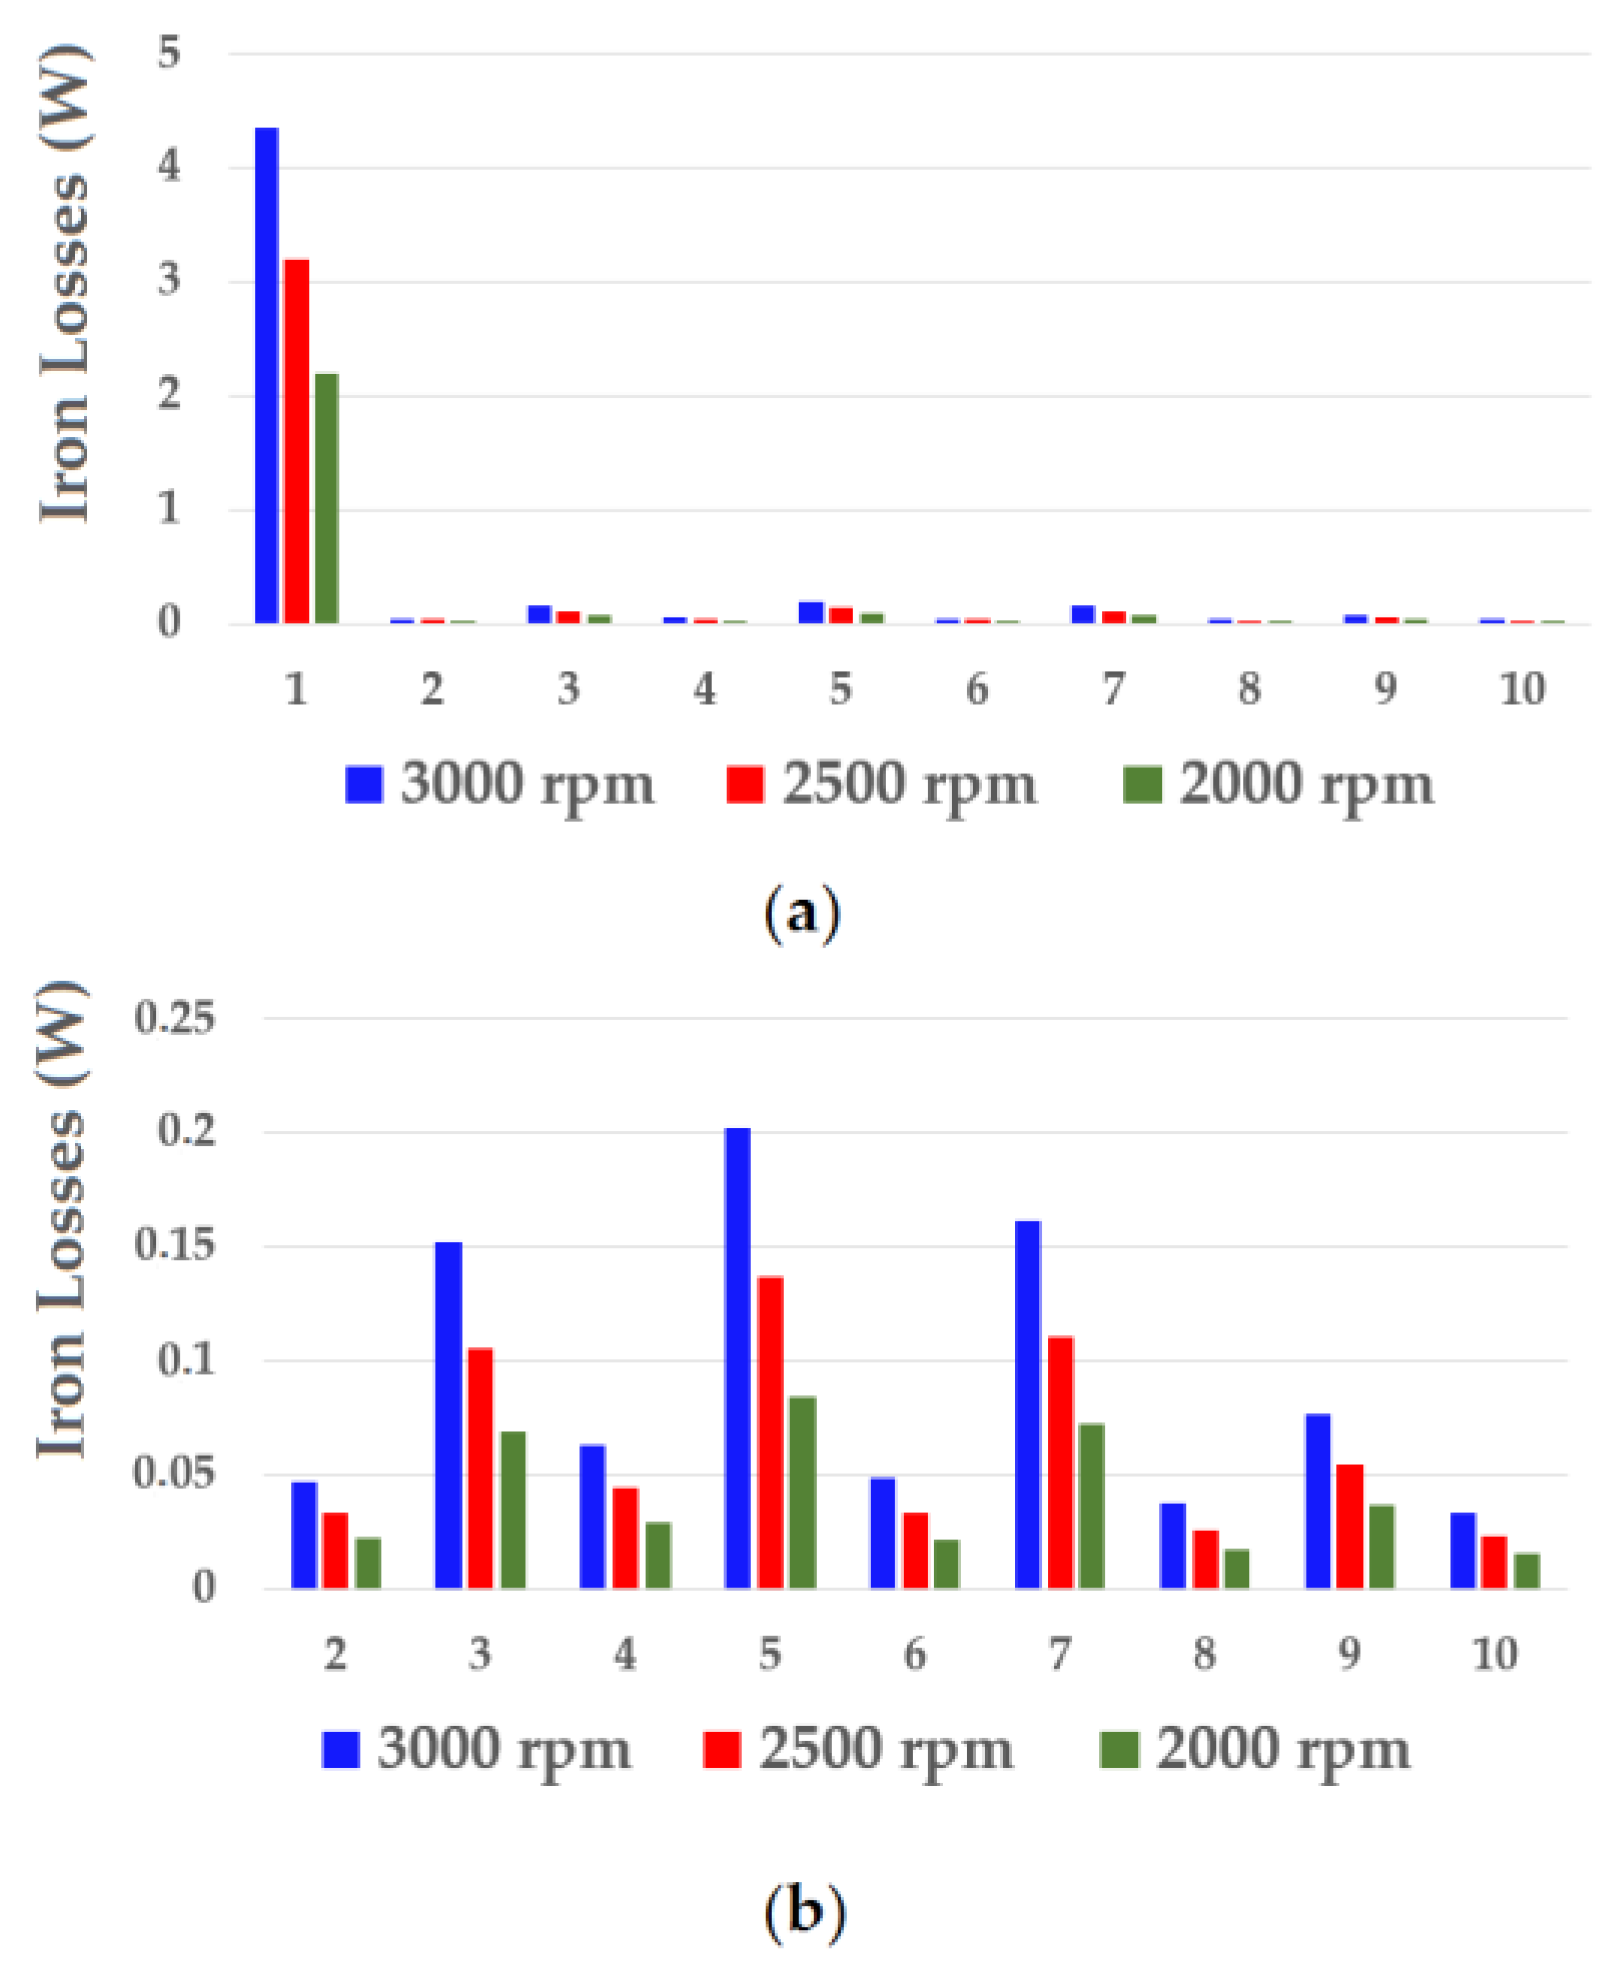
| n (rpm) | Copper Losses (W) | Iron Losses (W) | η (%) |
|---|---|---|---|
| 2000 | 10.27 | 2.57 | 83.25 |
| 2500 | 15.58 | 3.77 | 85.70 |
| 3000 | 23.73 | 5.17 | 86.23 |
| R0 (Ω) | ηOL (%) | ηCL (%) |
|---|---|---|
| 4 | 80.33 | 83.24 |
| 6 | 83.61 | 86.45 |
| 8 | 85.61 | 87.98 |
| 10 | 86.23 | 90.94 |
| Copper Losses (W) | Iron Losses (W) | η (%) |
|---|---|---|
| 8.75 | 5.24 | 90.94 |
| Hysteresis Losses (W) | Eddy Current Losses (W) | Excess Losses (W) | |
|---|---|---|---|
| Without Rotating Magnetic Field | 1.18 | 3.45 | 0.54 |
| Rotating Magnetic Field | 0.09 | 0.40 | 0.06 |
| Total Losses | 1.27 | 3.85 | 0.60 |
© 2018 by the authors. Licensee MDPI, Basel, Switzerland. This article is an open access article distributed under the terms and conditions of the Creative Commons Attribution (CC BY) license (http://creativecommons.org/licenses/by/4.0/).
Share and Cite
Barmpatza, A.C.; Kappatou, J.C. Finite Element Method Investigation and Loss Estimation of a Permanent Magnet Synchronous Generator Feeding a Non-Linear Load. Energies 2018, 11, 3404. https://doi.org/10.3390/en11123404
Barmpatza AC, Kappatou JC. Finite Element Method Investigation and Loss Estimation of a Permanent Magnet Synchronous Generator Feeding a Non-Linear Load. Energies. 2018; 11(12):3404. https://doi.org/10.3390/en11123404
Chicago/Turabian StyleBarmpatza, Alexandra C., and Joya C. Kappatou. 2018. "Finite Element Method Investigation and Loss Estimation of a Permanent Magnet Synchronous Generator Feeding a Non-Linear Load" Energies 11, no. 12: 3404. https://doi.org/10.3390/en11123404
APA StyleBarmpatza, A. C., & Kappatou, J. C. (2018). Finite Element Method Investigation and Loss Estimation of a Permanent Magnet Synchronous Generator Feeding a Non-Linear Load. Energies, 11(12), 3404. https://doi.org/10.3390/en11123404