Article

Derating Guidelines for Lithium-Ion Batteries

1
Institute of Sensor and Reliability Engineering (ISRE), Harbin University of Science and Technology, Harbin 150080, China
2
Center for Advanced Life Cycle Engineering (CALCE), University of Maryland, College Park, MD 20742, USA
*
Author to whom correspondence should be addressed.
Energies 2018, 11(12), 3295; https://doi.org/10.3390/en11123295
Submission received: 29 October 2018 / Revised: 13 November 2018 / Accepted: 19 November 2018 / Published: 26 November 2018

Abstract

:
Derating is widely applied to electronic components and products to ensure or extend their operational life for the targeted application. However, there are currently no derating guidelines for Li-ion batteries. This paper presents derating methodology and guidelines for Li-ion batteries using temperature, discharge C-rate, charge C-rate, charge cut-off current, charge cut-off voltage, and state of charge (SOC) stress factors to reduce the rate of capacity loss and extend battery calendar life and cycle life. Experimental battery degradation data from our testing and the literature have been reviewed to demonstrate the role of stress factors in battery degradation and derating for two widely used Li-ion batteries: graphite/LiCoO2 (LCO) and graphite/LiFePO4 (LFP). Derating factors have been computed based on the battery capacity loss to quantitatively evaluate the derating effects of the stress factors and identify the significant factors for battery derating.

1. Introduction

Li-ion batteries have the potential to shape global demand for fossil fuels, increase the use of renewables in the electric grid by buffering the intermittent and fluctuating green energy supply, bring convenient electric power to portable consumer electronics devices, and enable the broad commercial launch of electric vehicles. However, these batteries, similar to any other engineering product, degrade and lose capacity with aging. If the battery degradation rate can be slowed down, industry applications will benefit significantly [1].
Derating refers to the reduction of electrical, thermal, and mechanical stresses applied to a part in order to decrease the degradation rate and prolong the expected life of the part [2]. It is an efficient approach to reduce the degradation rate, minimize failures, and reduce business risks, and has been applied to almost all electronic components, including resistors, diodes, transistors, light-emitting diodes, CPUs, and capacitors. Many derating standards or specifications have been developed for electronic components [3]. For example, Freescale provides voltage and frequency derating guidelines for the MPC7447A microprocessor [4], and Hitachi provides guidelines for derating of temperature, humidity, voltage, and current for high-voltage integrated circuits [5]. These guidelines are valuable for engineers designing products, but no guidelines are available for derating of Li-ion batteries.
Extensive research has focused on Li-ion battery degradation [6]. For example, Guan et al. [7] investigated the capacity fade mechanisms of 4.2-V mesocarbon microbeads/LiCoO2 (LCO) commercial cells at various rates (0.6C, 1.2C, 1.5C, 1.8C, 2.4C, and 3.0C). They concluded that the decay in cathode and cell imbalance caused by the loss of active lithium and the polarization in the full cell dominated the degradation during cycling. Choi and Lim [8] pointed out that high charge cut-off voltages and a long float-charge period had the most severe effects on cycle life, but the depth of discharge (DoD) did not affect the cycle degradation. Ning et al. [9] studied the effects of discharge rates at three different C-rates (1C, 2C, and 3C) on 4.2-V carbon/LCO battery capacity fade and concluded that at higher C-rates growth of the solid electrolyte interphase (SEI) layer accelerated. Wang et al. [10] found a power law relation between capacity fade and charge throughput for 3.6-V graphite/LiFePO4 (LFP) cells under five DoDs (10–90%), five temperatures (from −30 °C to 60 °C) and four discharge rates (from C/2 to 10C). Ecker et al. [11] conducted an accelerated study on carbon/Li(NiMnCo)O2 cells to analyze the influence of cycle depth and mean state of charge (SOC) on cycle aging. They observed that rate of aging increased with increasing cycle depth (ΔSOC) almost linearly. Also, they found that for a given cycle depth, minimum aging occurred in cells cycled around 50% mean SOC. Saxena et al. [12] studied the effects of mean SOC and ∆SOC on graphite/LiCoO2 cells and concluded that both these factors affect the cycle life performance of batteries.
These studies highlight the major degradation mechanisms and effects of various stress factors on battery degradation. However, the authors did not extend their findings to develop a derating framework for Li-ion batteries. For example, Wikner et al. [13] concluded that a reduced charge level of 50% SOC increased the lifetime expectancy of the vehicle battery by 44–130%, and keeping the battery at 15% SOC during parking and limiting the time at high SOC reduced the contribution to the calendar aging. This paper aims to fill this research gap by reviewing the findings of some of the comprehensive testing studies from the past and also using the data from the authors’ own experiments to provide guidelines for battery derating.
Storage and cycling are the most common operating modes for Li-ion batteries, therefore, derating of Li-ion batteries refers to reducing the battery degradation rate and prolonging battery life under the two operating modes by reducing the environmental stresses and electrical stresses. Since capacity is the most important performance metric, it is selected as the battery health indicator, based on which the Li-ion battery derating is investigated. The remainder of the paper is organized as follows: Section 2 defines the derating factor and discusses Li-ion battery derating for calendar life improvement; Section 3 discusses Li-ion battery derating for cycle life improvement; Section 4 presents conclusions.

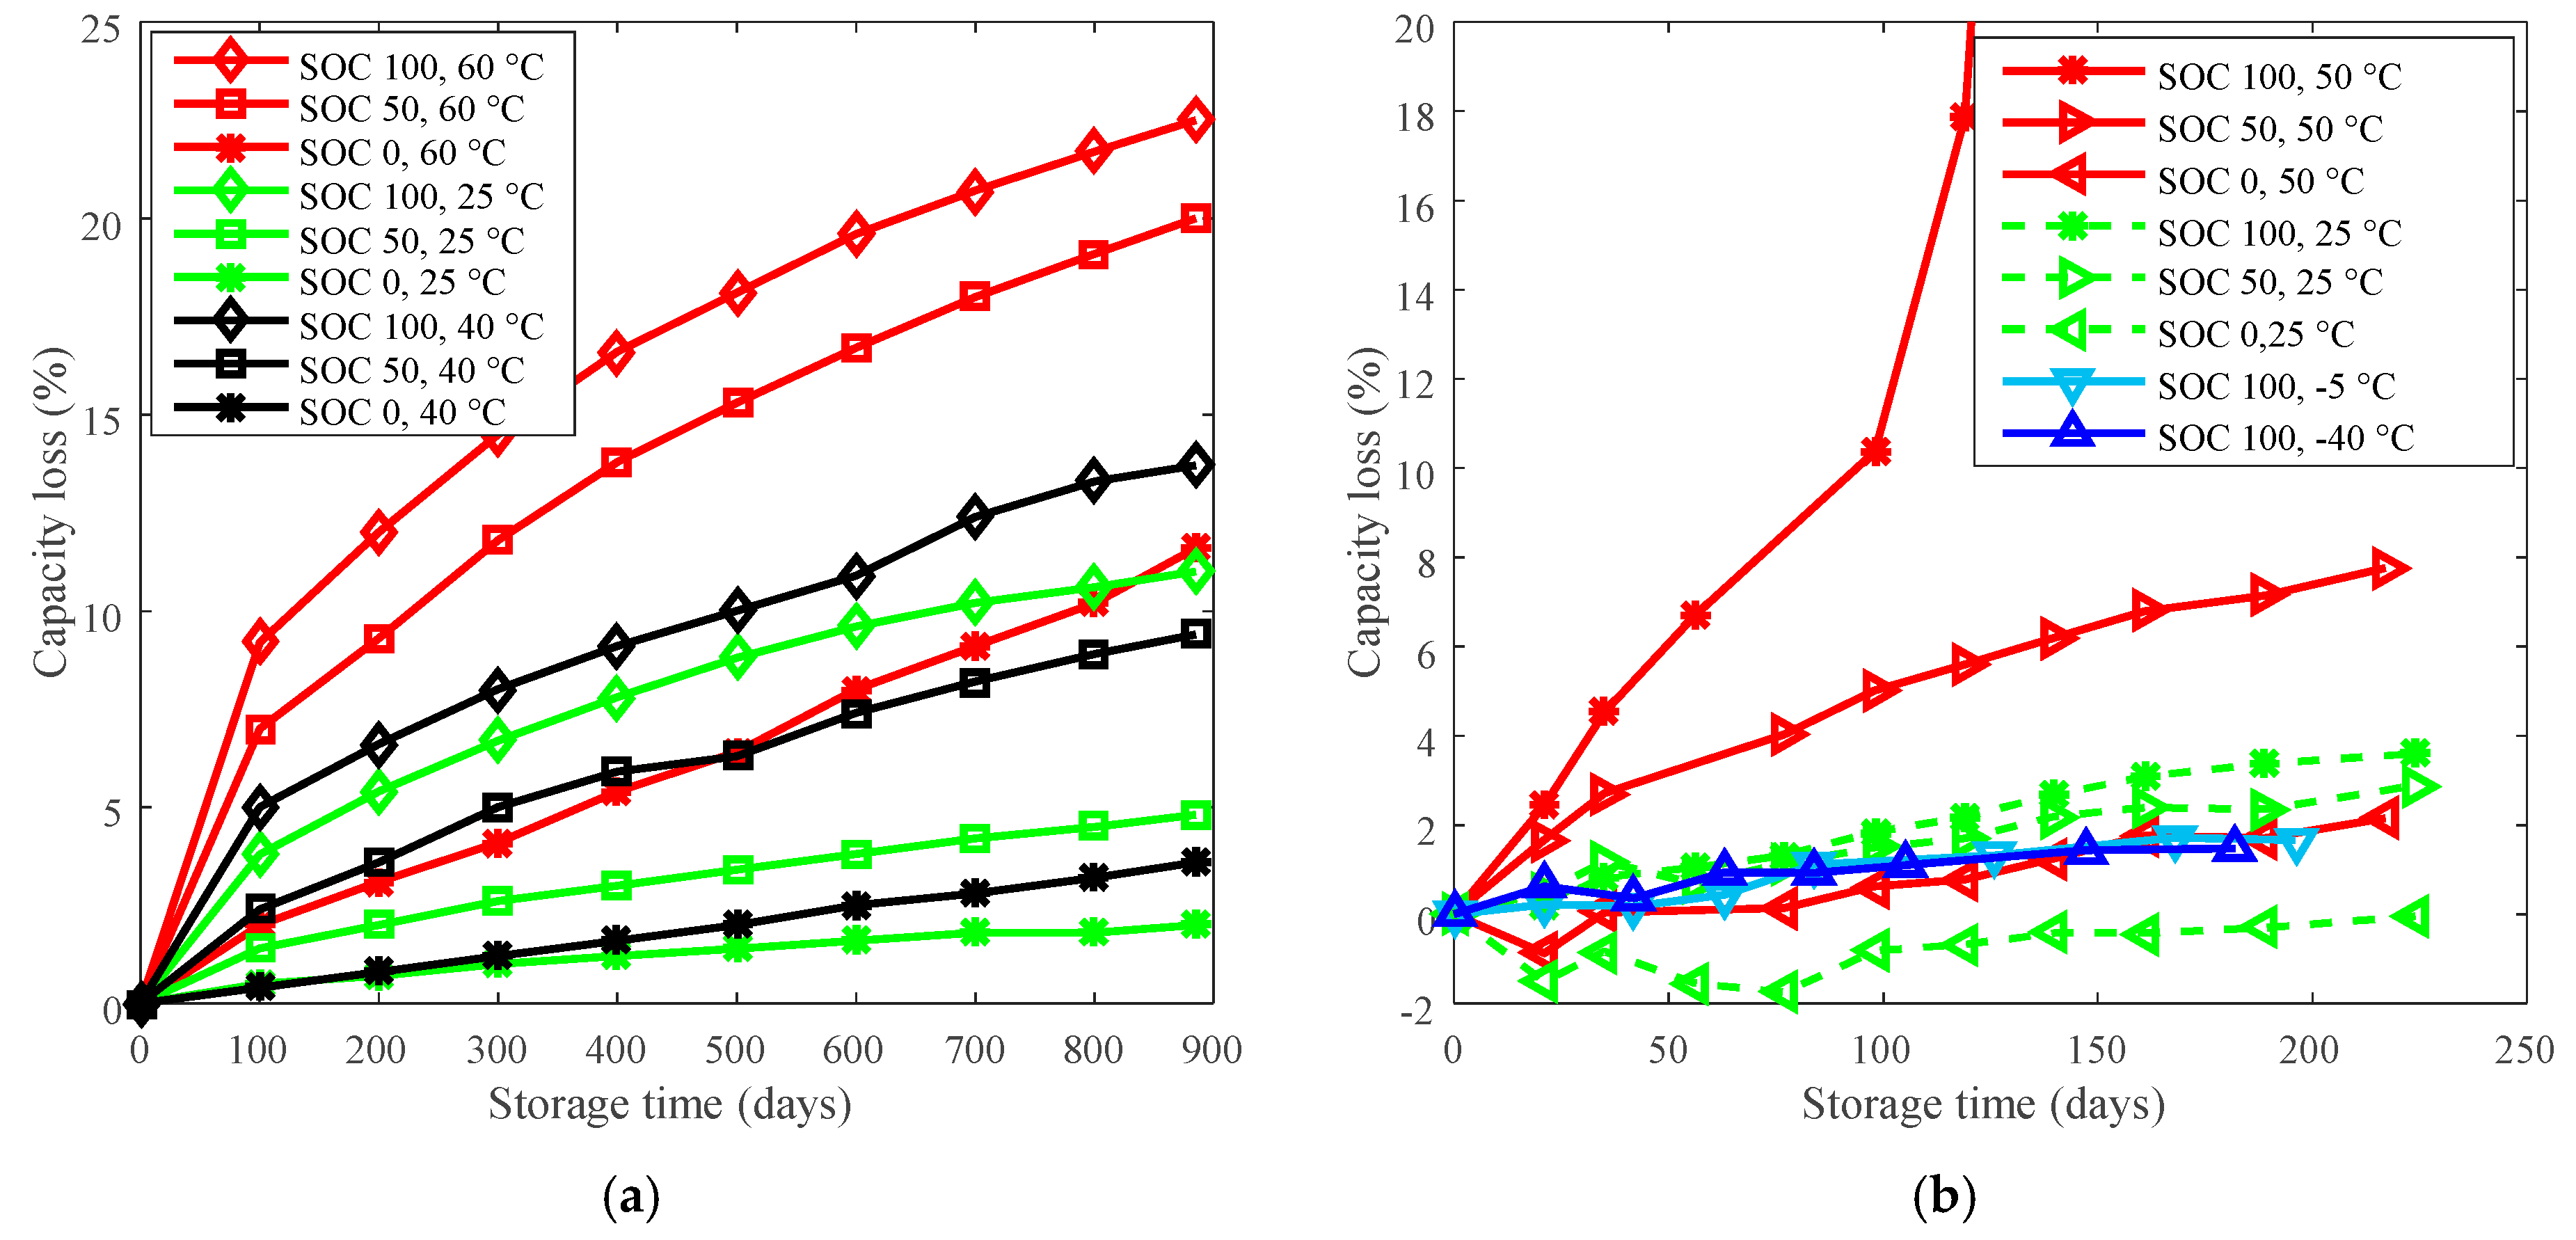
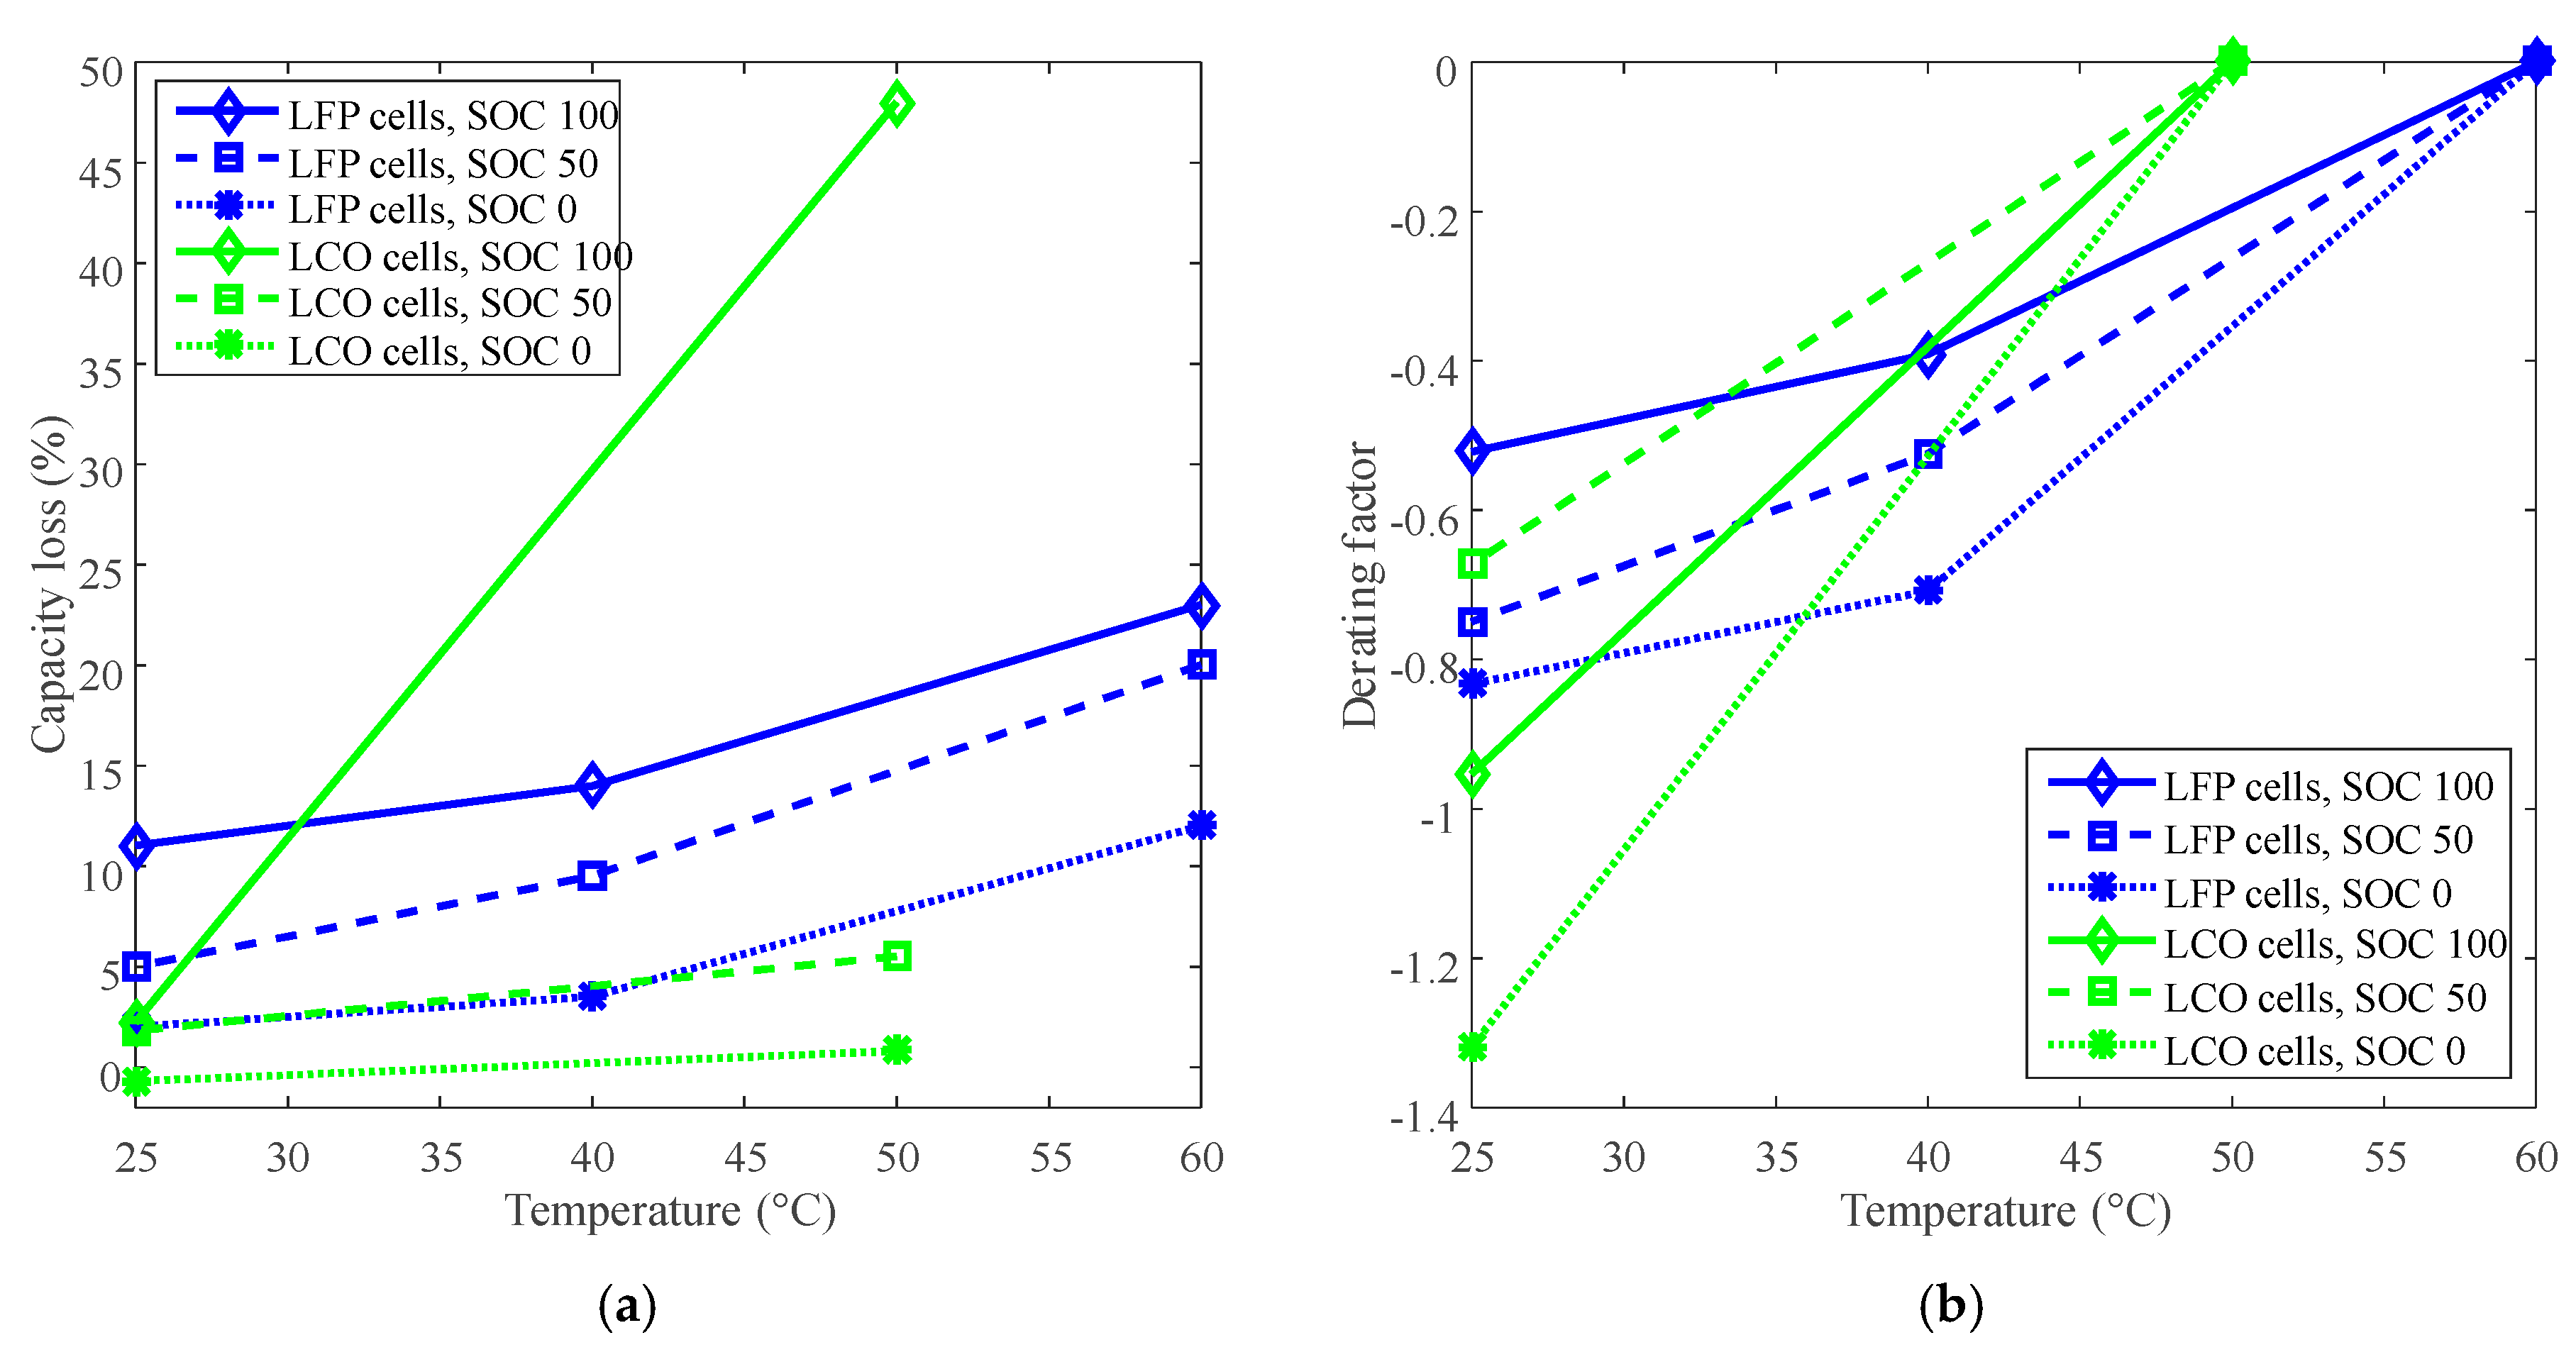
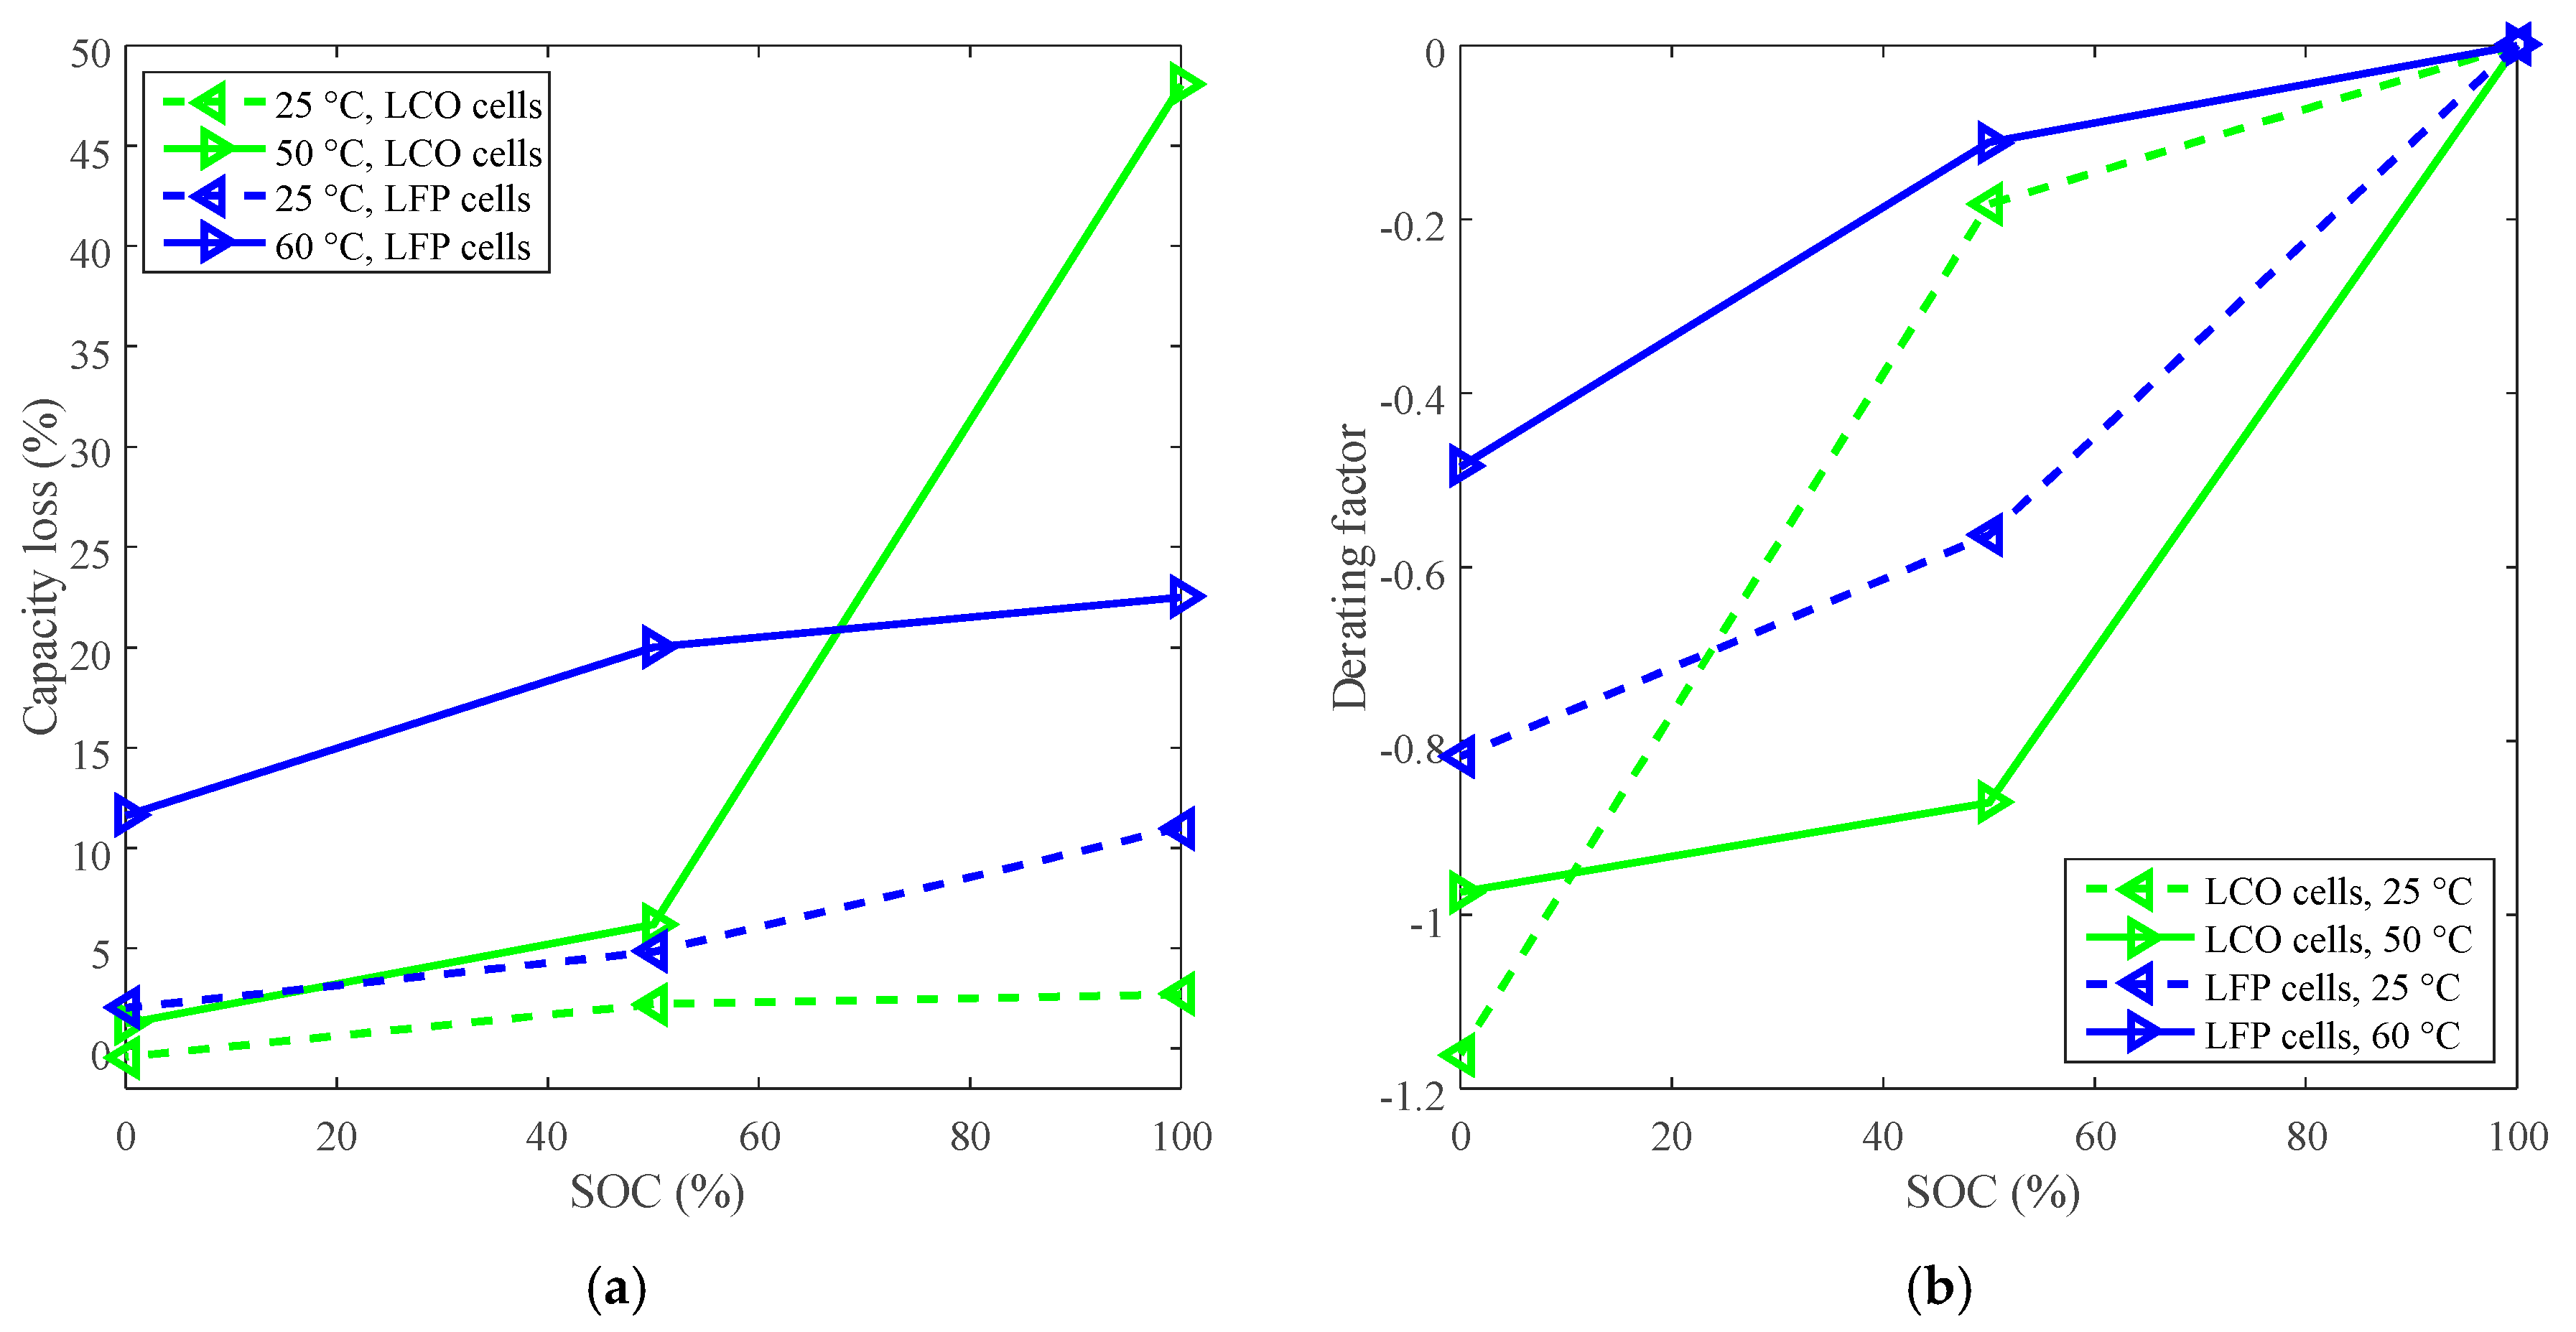
2. Derating for Calendar Life Improvement

In order to investigate the effectiveness of derating for life improvement, a metric such as derating factor needs to be defined. A derating factor has been defined as the ratio of the difference between the degradation rate under the derated stress and the degradation rate under the reference or maximum design stress to the degradation rate under the reference or maximum design stress at a specific time t [14].
DF(t) = [DRDer(t) − DRRef(t)]/DRRef(t)
where DF is the derating factor, DR(t) is the degradation rate at time t, DRDer(t) and DRRef(t) are the degradation rates under the derated stress and reference stress, respectively. DR(t) is defined as [15]
DR(t) = [QLoss(t) − QLoss(t0)]/(tt0)
where QLoss(t) is the battery capacity loss at time t and t0 < t. If t0 = 0, then the capacity loss at the beginning is 0, QLoss(t0) = 0. Then the derating factor can be updated as
DF(t) = [QLoss,Der(t) − QLoss,Ref(t)]/QLoss,Ref(t0)
Therefore, where the derating factor can be used to reflect the rate of battery capacity loss according to Equation (3), the degradation rate specifically refers to the rate of capacity loss. A low rate of capacity loss implies a long battery life.
To show how derating can be applied for battery calendar life improvement, data from storage tests on LFP batteries [16] and LCO batteries are presented here. Datasheet parameters of the investigated batteries are listed in Table 1. The storage testing data are presented in Figure 1.
The capacity losses under various temperatures at 885 days for LFP cells and at 140 days for LCO cells are plotted in Figure 2a. The reference temperatures for LFP cells and LCO cells are 60 °C and 50 °C, respectively, then the curves of derating of temperature are plotted in Figure 2b.
The derating factor declines against the decreasing temperature. For example, the derating factors reached at least −0.6 for LCO batteries and −0.5 for LFP batteries by derating the temperature to 25 °C, as shown in Figure 2b. The negative derating factors indicate the decreasing of the rate of capacity loss according to Equation (3). Therefore, the temperature can be derated to reduce the rate of capacity loss and prolong battery calendar life.
Calendar life can also be improved by derating the SOC. The capacity losses at 140 days under 50 °C and 25 °C for LCO cells, and the capacity losses at 885 days under 60 °C and 25 °C for LFP cells are plotted in Figure 3a. One hundred percent SOC was selected as the reference SOC, then the curves of derating of SOC are plotted in Figure 3b.
The derating factor declines against the decreasing SOC, so the SOC can be derated to reduce the rate of capacity loss and prolong the battery calendar life. As shown in Figure 3b, LCO batteries exhibited two distinct derating modes depending on temperature. One was that the derating factor was largely reduced to around −0.90 by derating the SOC from 100% to 50%, and then slightly went to about −0.97 by derating the SOC to 0% under high temperature (such as 50 °C). The other was that the derating factor was slightly reduced to around −0.20 by derating the SOC from 100% to 50%, and then sharply went to around −1.20 by derating the SOC to 0% under room temperature. The study implies that the rate of capacity loss can be decreased by derating the SOC to 50% under high temperature for LCO batteries. However, the rate of capacity loss for LFP batteries is only slightly declined by derating the SOC to 50% under high temperature.
In summary, temperature is the most significant parameter to derate to prolong battery calendar life. The rate of capacity loss can be significantly reduced by derating the temperature under various SOCs, but the rate of capacity loss only can be reduced slightly by derating the SOC under certain conditions. It can be observed from the derating analysis that room temperature suffices to be a good condition for storage as it does not require any additional cooling requirement than the already installed infrastructure. Li-ion batteries are electrochemical systems and hence reducing the temperature to room temperature positively affect their operation and degradation. SEI layer formation and growth, which consumes active lithium and reduces capacity, is considered a major mechanism affected by temperature [17,18]. When the temperature is derated to room temperature, the SEI layer formation and growth is inhibited, hence the rate of capacity loss can be reduced significantly. From the point of view of cost, room temperature storage is an easy condition for industries to maintain.
However, if temperature control is not possible in certain application or operation condition, then SOC is an important factor that can help in reducing degradation. At high temperature such as 50 °C and beyond, reducing SOC can significantly reduce the degradation for both LCO and LFP and can result in extended calendar life. Hence, SOC is also an important derating factor and should be considered if there is a possibility of high temperature.

3. Derating for Cycle Life Improvement

Batteries are charged and discharged multiple times in an application. As battery voltage, current, and temperature can vary by a large extent during the cycling, the number of stress factors involved in battery cycling are expectedly more than that for battery storage. Therefore, this study uses seven LFP and LCO battery data sets to investigate derating of five kinds of relevant stresses including temperature, discharge C-rate, charge C-rate, charge cut-off current, and charge cut-off voltage [19,20,21,22]. Two battery models were selected for LCO batteries and LFP batteries, respectively. The relationship between the battery samples and derated stresses is presented in Table 2. The detailed battery specifications, testing procedures, and testing conditions can be found in corresponding references, and a summary is provided in Table 3.

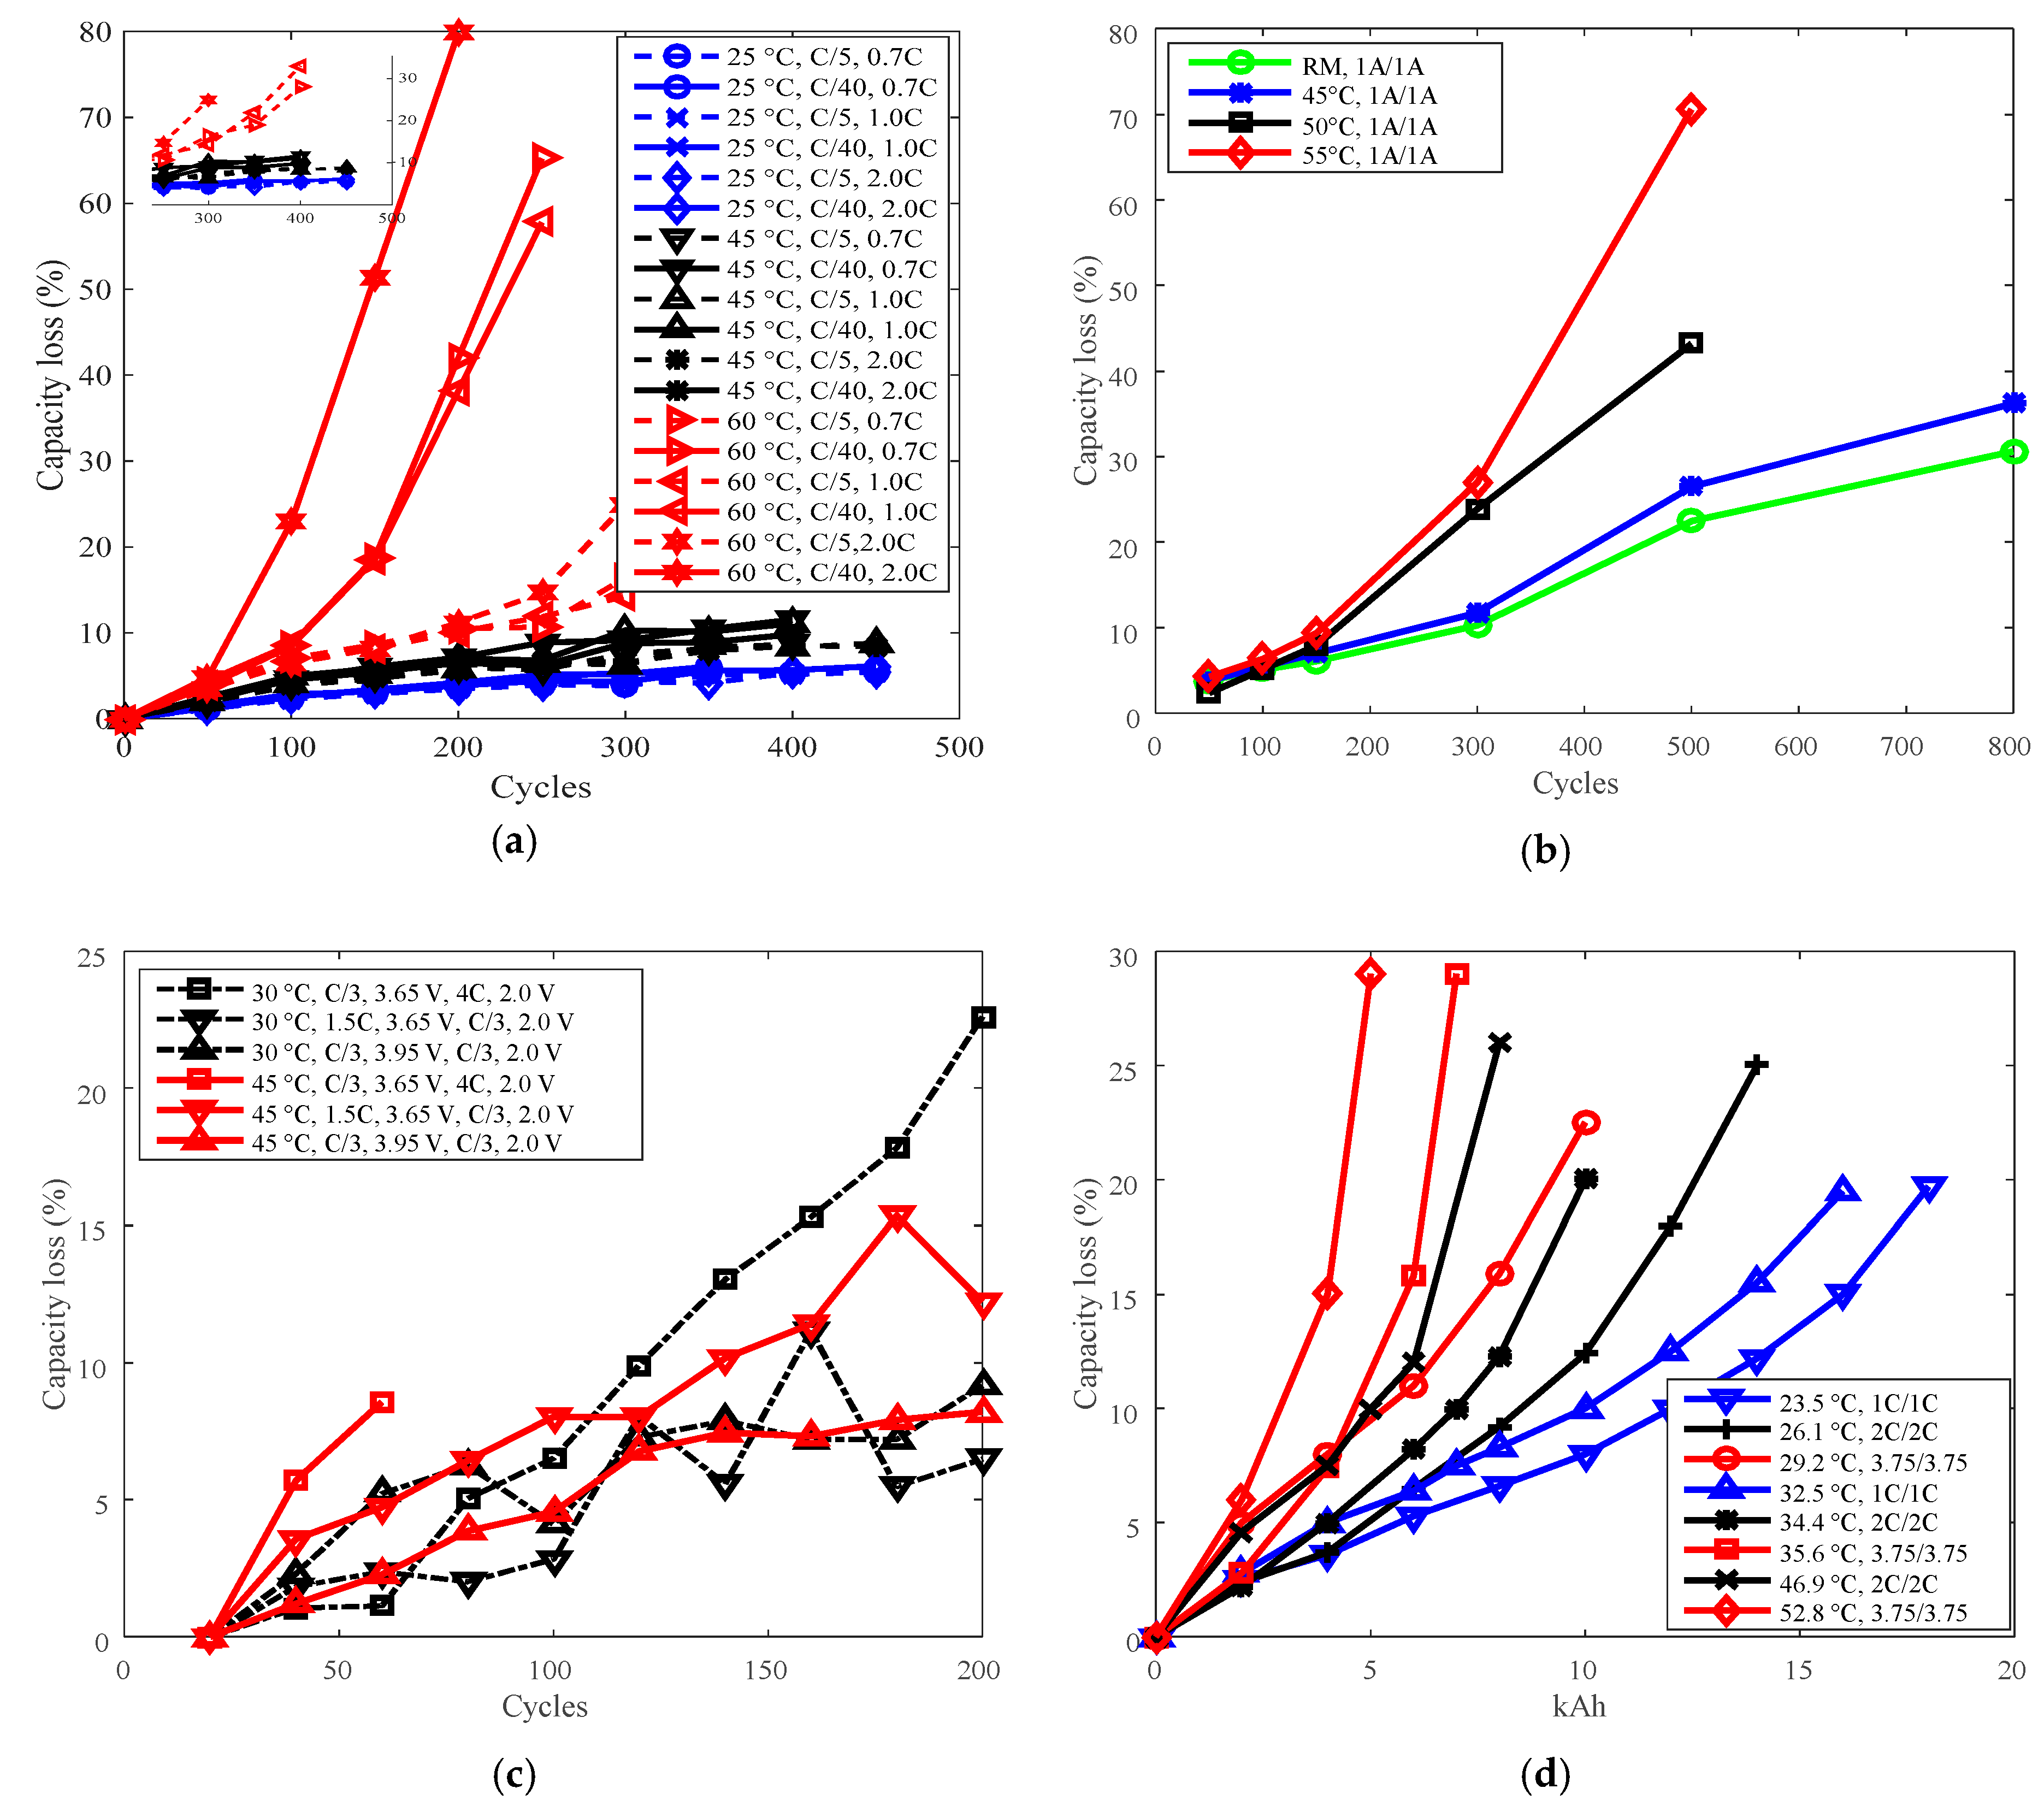
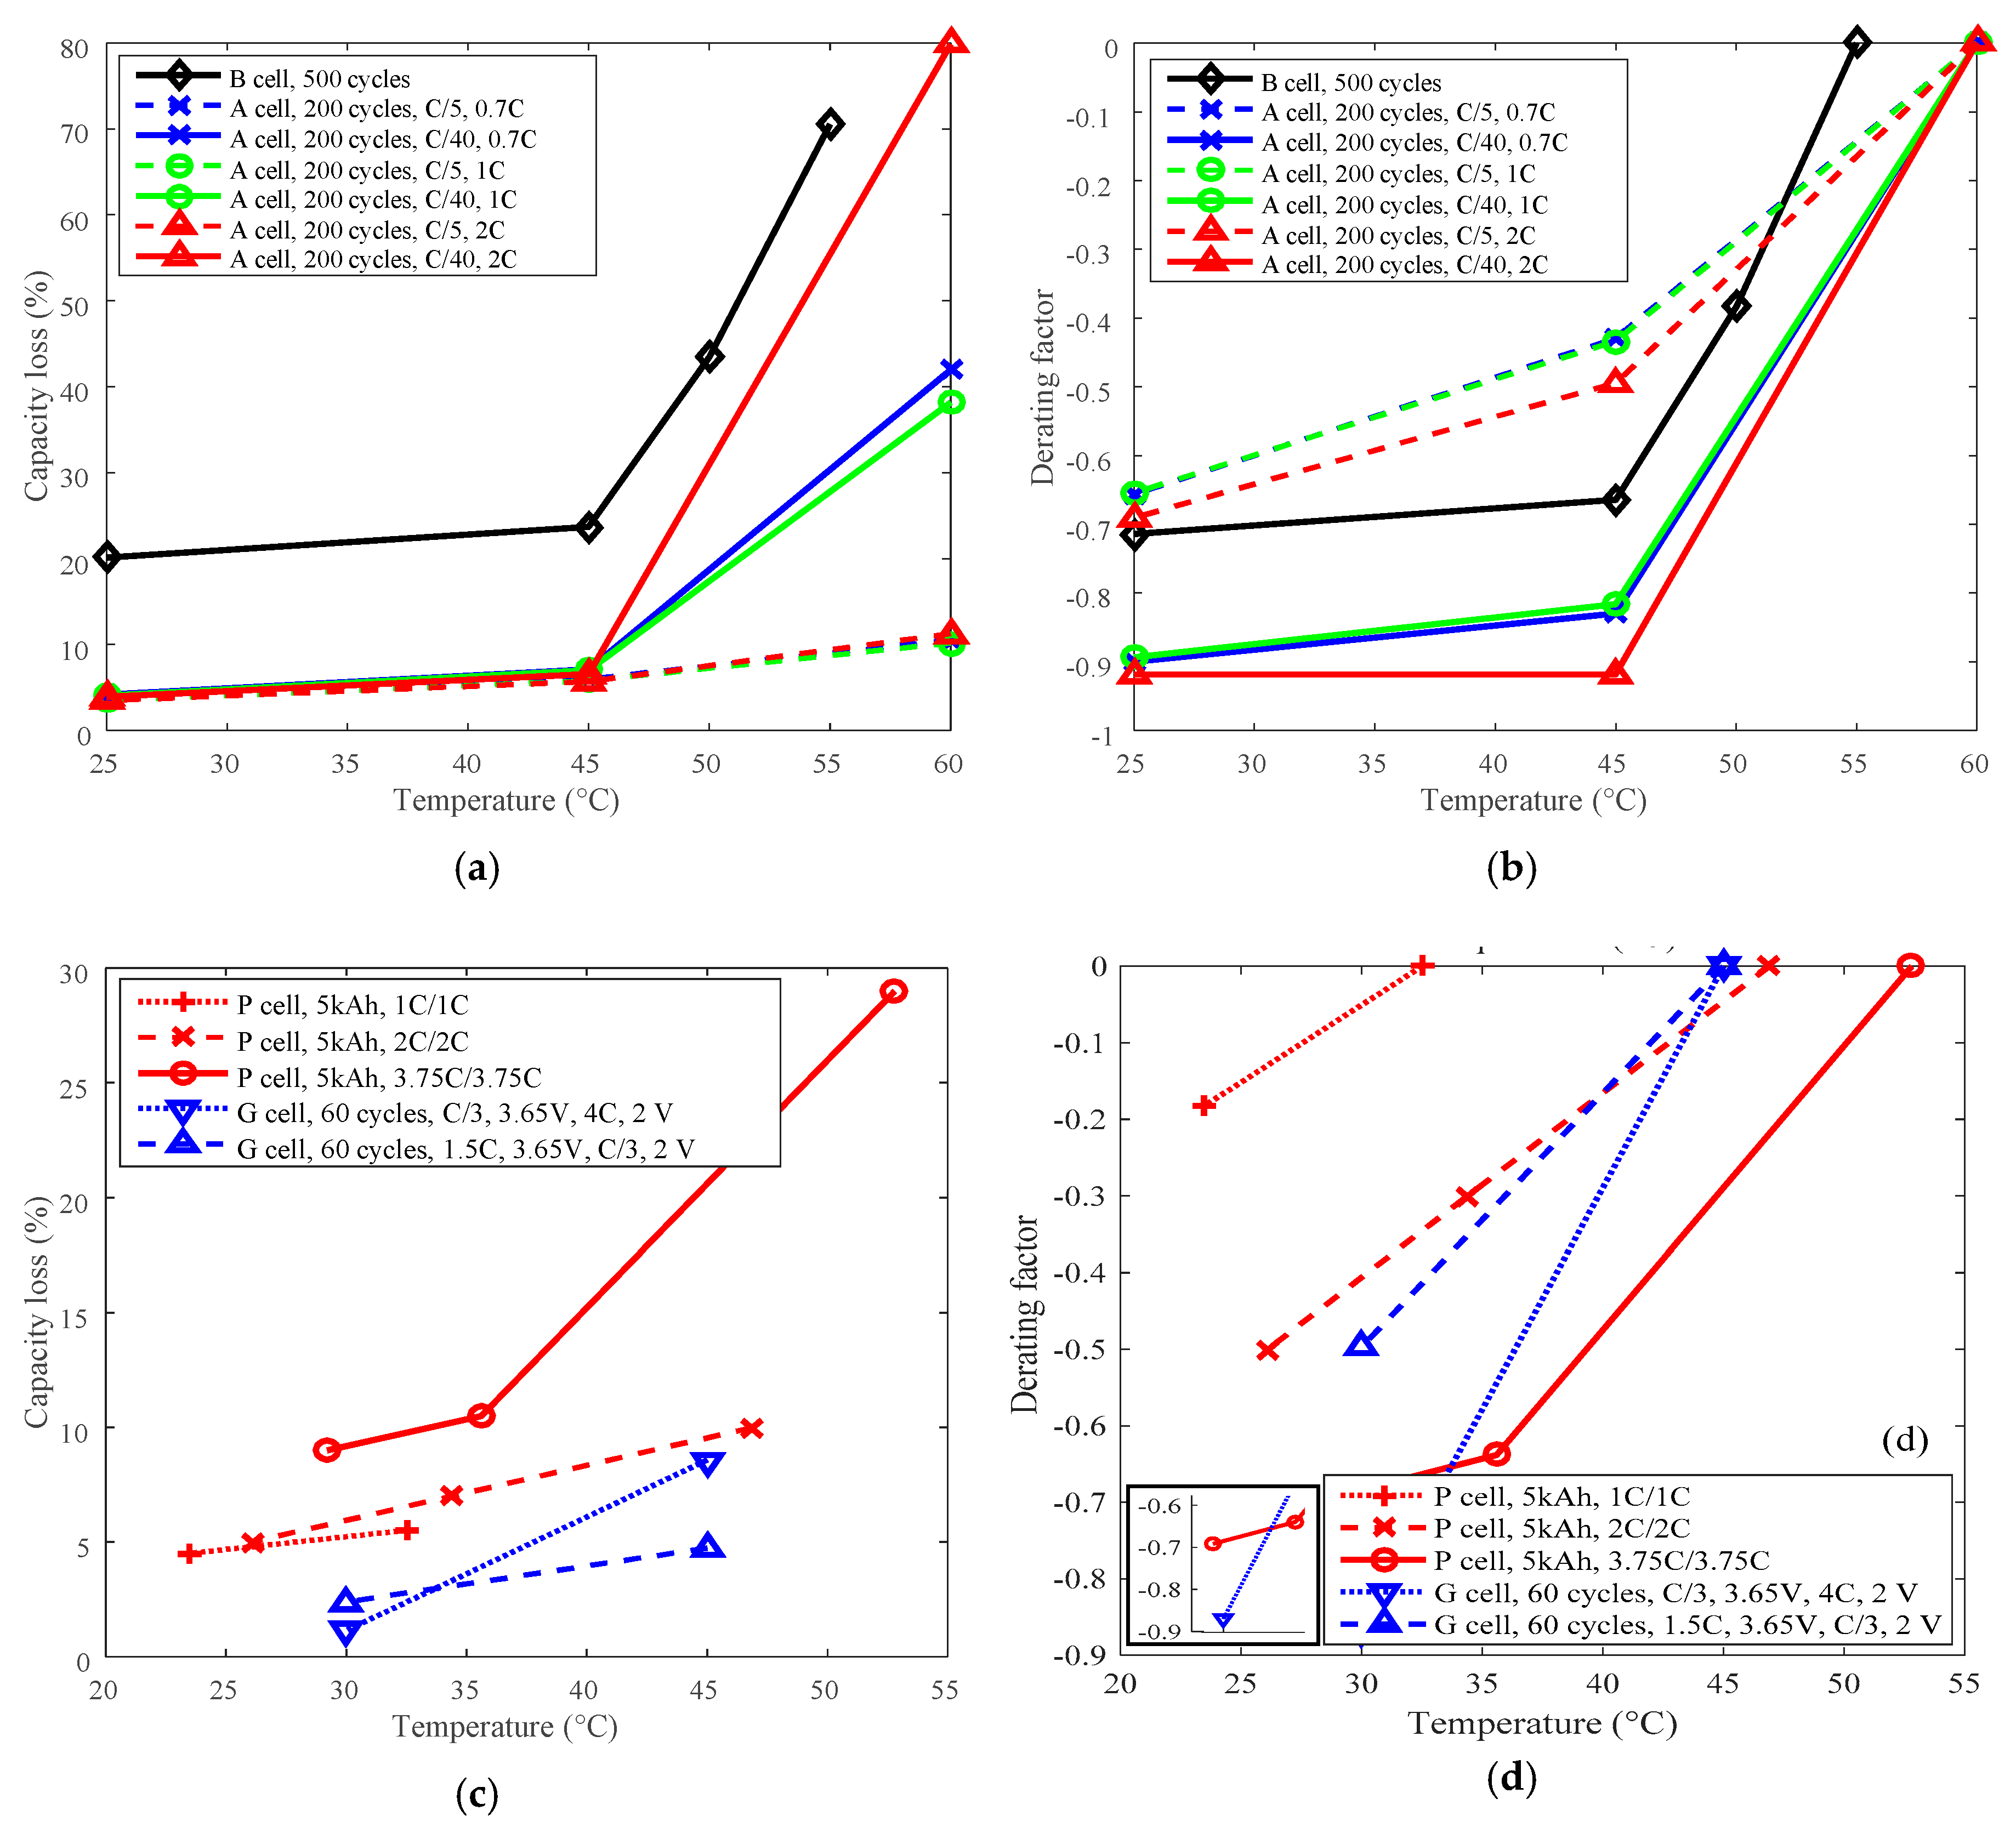
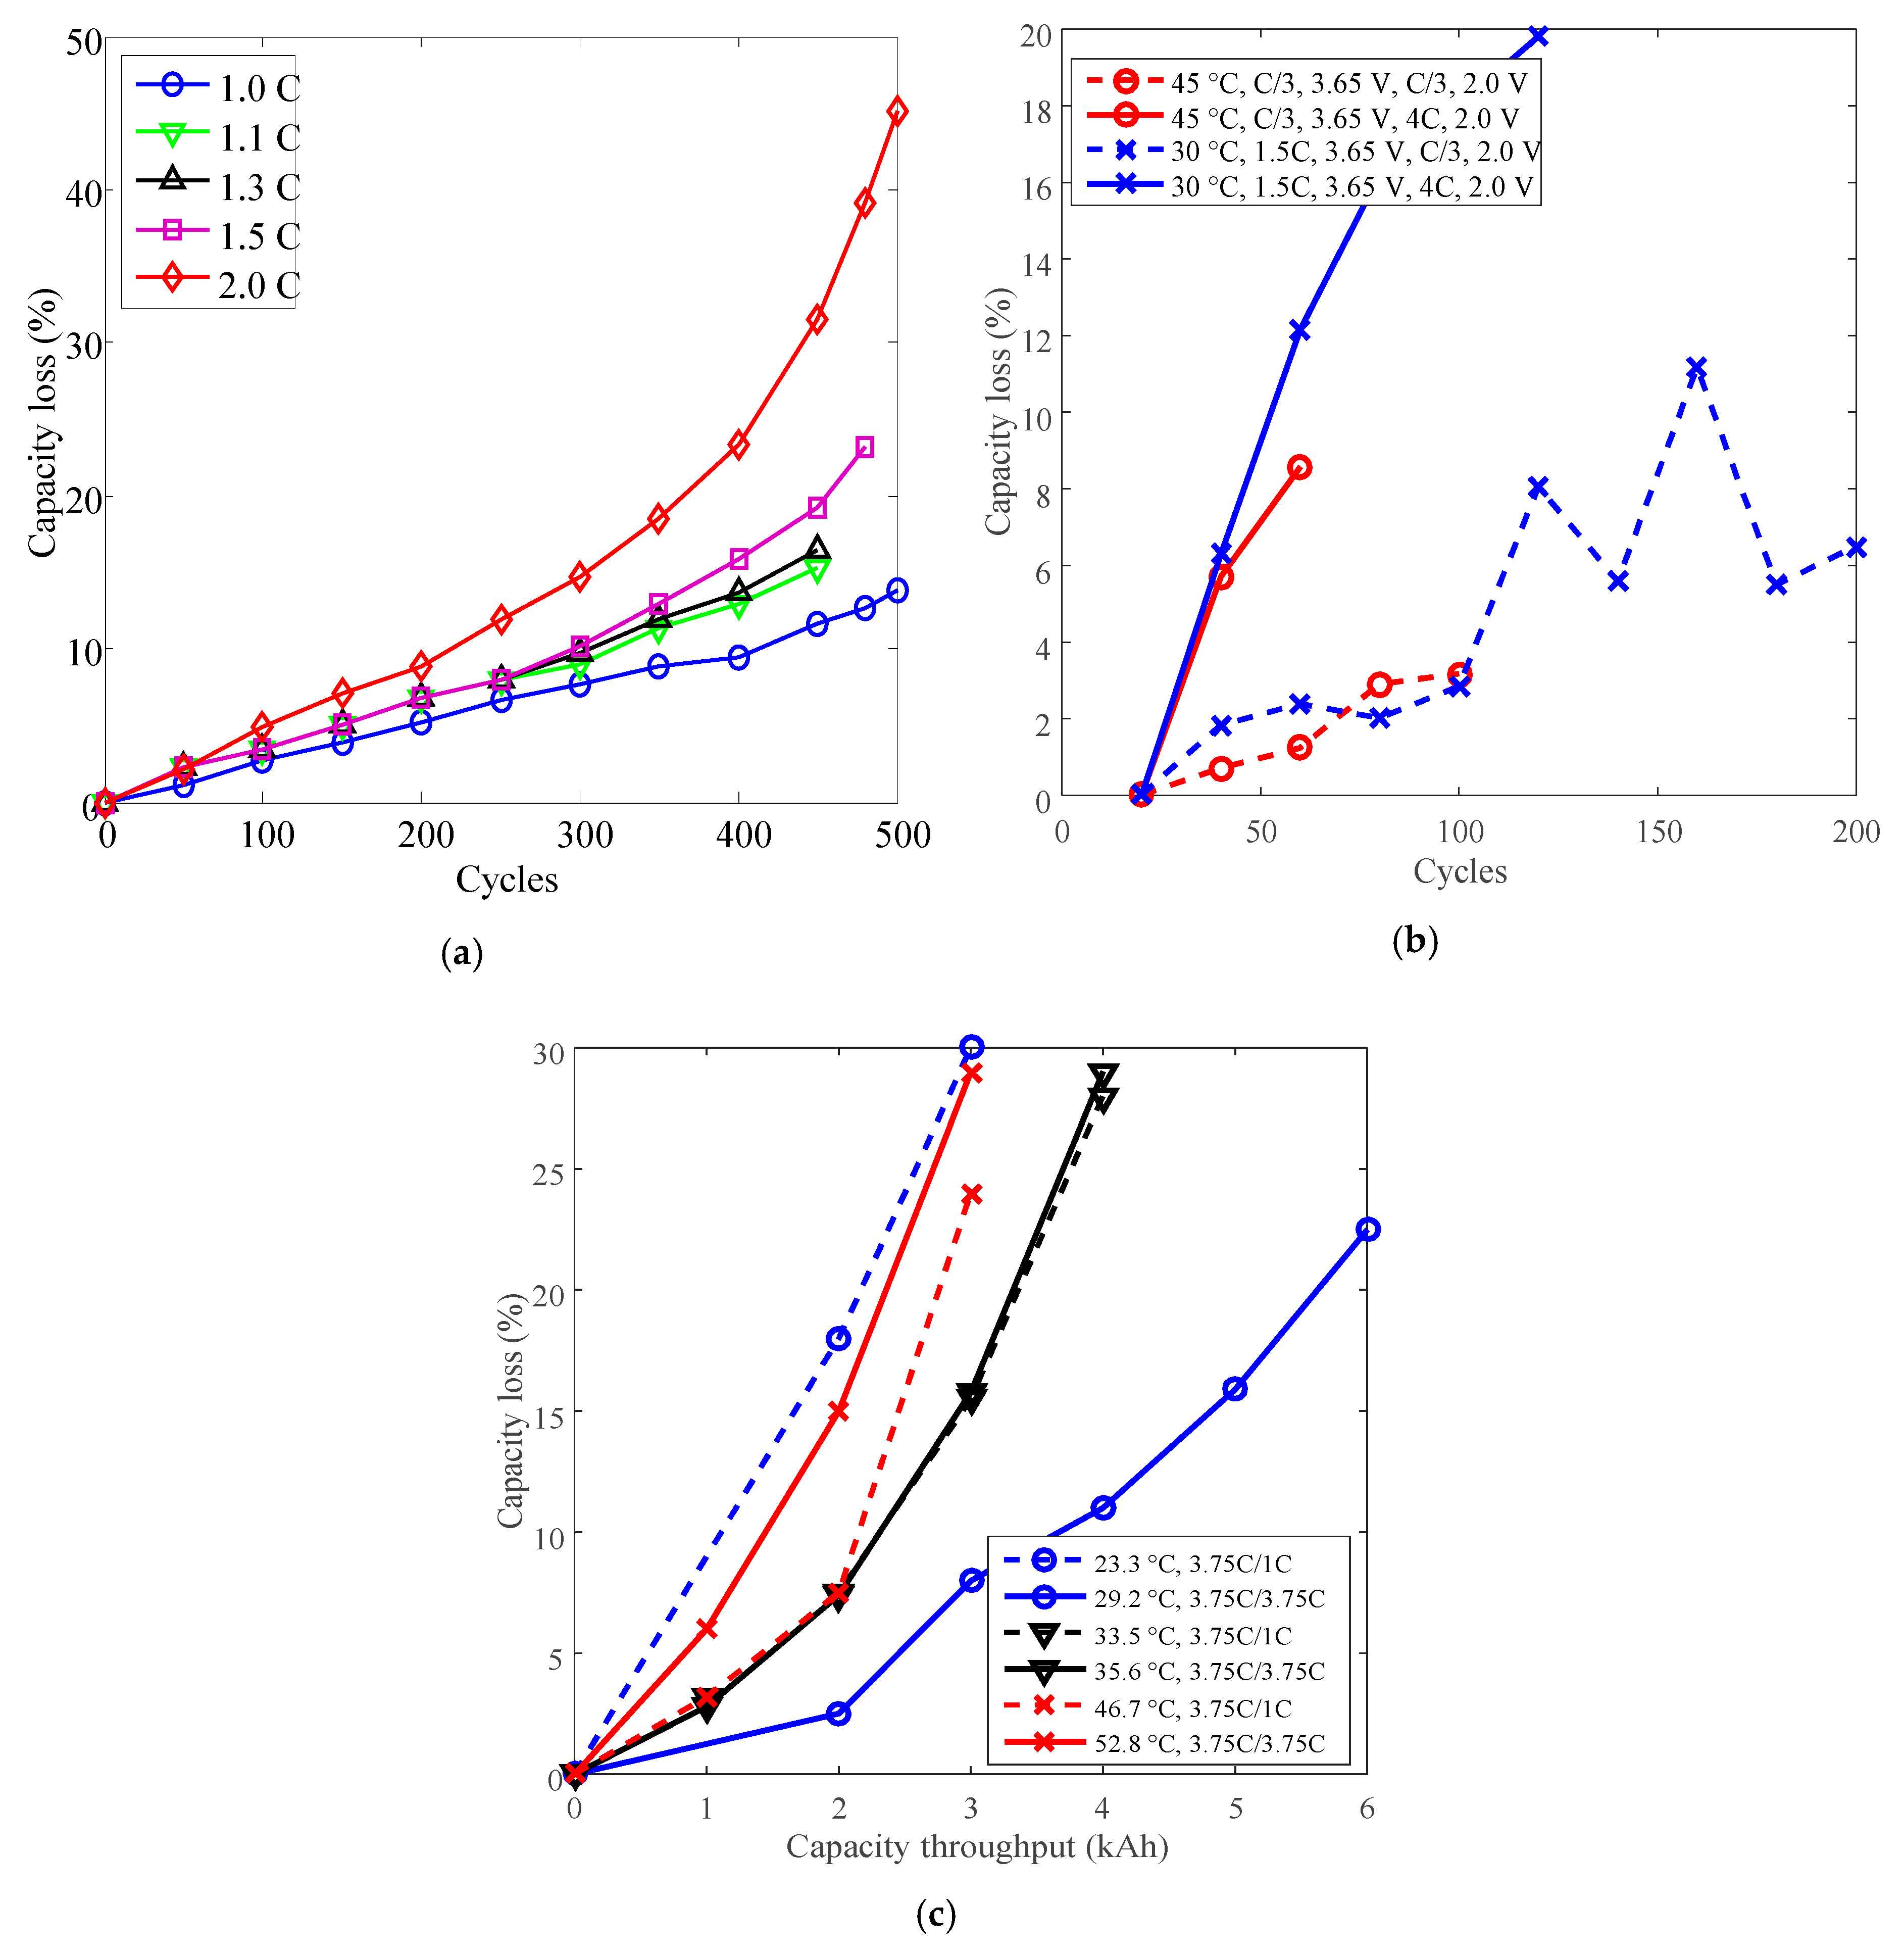
3.1. Cycle Life Improvement by Temperature Derating

Cycle life can be improved by derating the temperature. For example, batteries A and B with LCO positive electrode and batteries G and P with LFP positive electrode were employed to present the derating of temperature for cycle life. The testing data are presented in Figure 4.
The highest temperatures were selected as the reference temperature for each group, which were 60 °C for A, 55 °C for B, 45 °C for G, and 52.8 °C and 46.9 °C for P. The curves of capacity loss vs. temperature are shown in Figure 5a,c, and the curves of derating factor vs. temperature are presented in Figure 5b,d. Derating factors were computed using the capacity loss data presented in Figure 5a,c according to Equation (3).
The capacity loss decreases with reducing temperature as shown in Figure 5a,c. The derating factor declines with the decreasing temperature. As shown in Figure 5b,d, the derating factor got down to a value between −0.60 and −0.95 when derating the temperature from above 45 °C to around 25 °C. So, temperature can be employed as an effective parameter to reduce the rate of capacity loss and prolong battery cycle life. From the point of view of degradation mechanisms, high temperature can accelerate SEI layer growth and cause electrolyte decomposition and degradation of other battery components [23]. Additionally, cycling-induced cracks in the SEI layer provide new sites for the generation and growth of the SEI layer [24]. The degradation mechanisms also demonstrate that battery life can be prolonged by cycling under a lower temperature condition. The data also shows that both LCO and LFP batteries exhibited similar derating behaviors, so there is little difference between LCO and LFP batteries from the point of view of derating temperature.
Furthermore, the derating effect of temperature was influenced by discharge C-rate and charge cut-off current. The derating of temperature is influenced by charge cut-off current, as presented in Figure 6a, and the derating factor reached about −0.65 under C/5 charge cut-off current, and went down to around −0.90 under C/40 charge cut-off current by derating the temperature. So the temperature can be derated under various charge cut-off current levels. In addition, derating of temperature was slightly influenced by the discharge C-rate according to a small variation around 0.05 on derating factor when discharge C-rate changes from 0.7 C to 2 C, as presented in Figure 6b. Therefore, irrespective of other parameters, reduction of temperature enables derating of Li-ion batteries to reduce the rate of capacity loss under various conditions.
The temperature can be derated to prolong battery life, and it is more sensitive than charge cut-off current and discharge C-rate parameters in terms of derating. However, cooling techniques are necessary to reduce temperature during cycling operation and can lead to additional cost. Besides, the feasibility of deploying this equipment for temperature derating is variable due to specific application conditions.

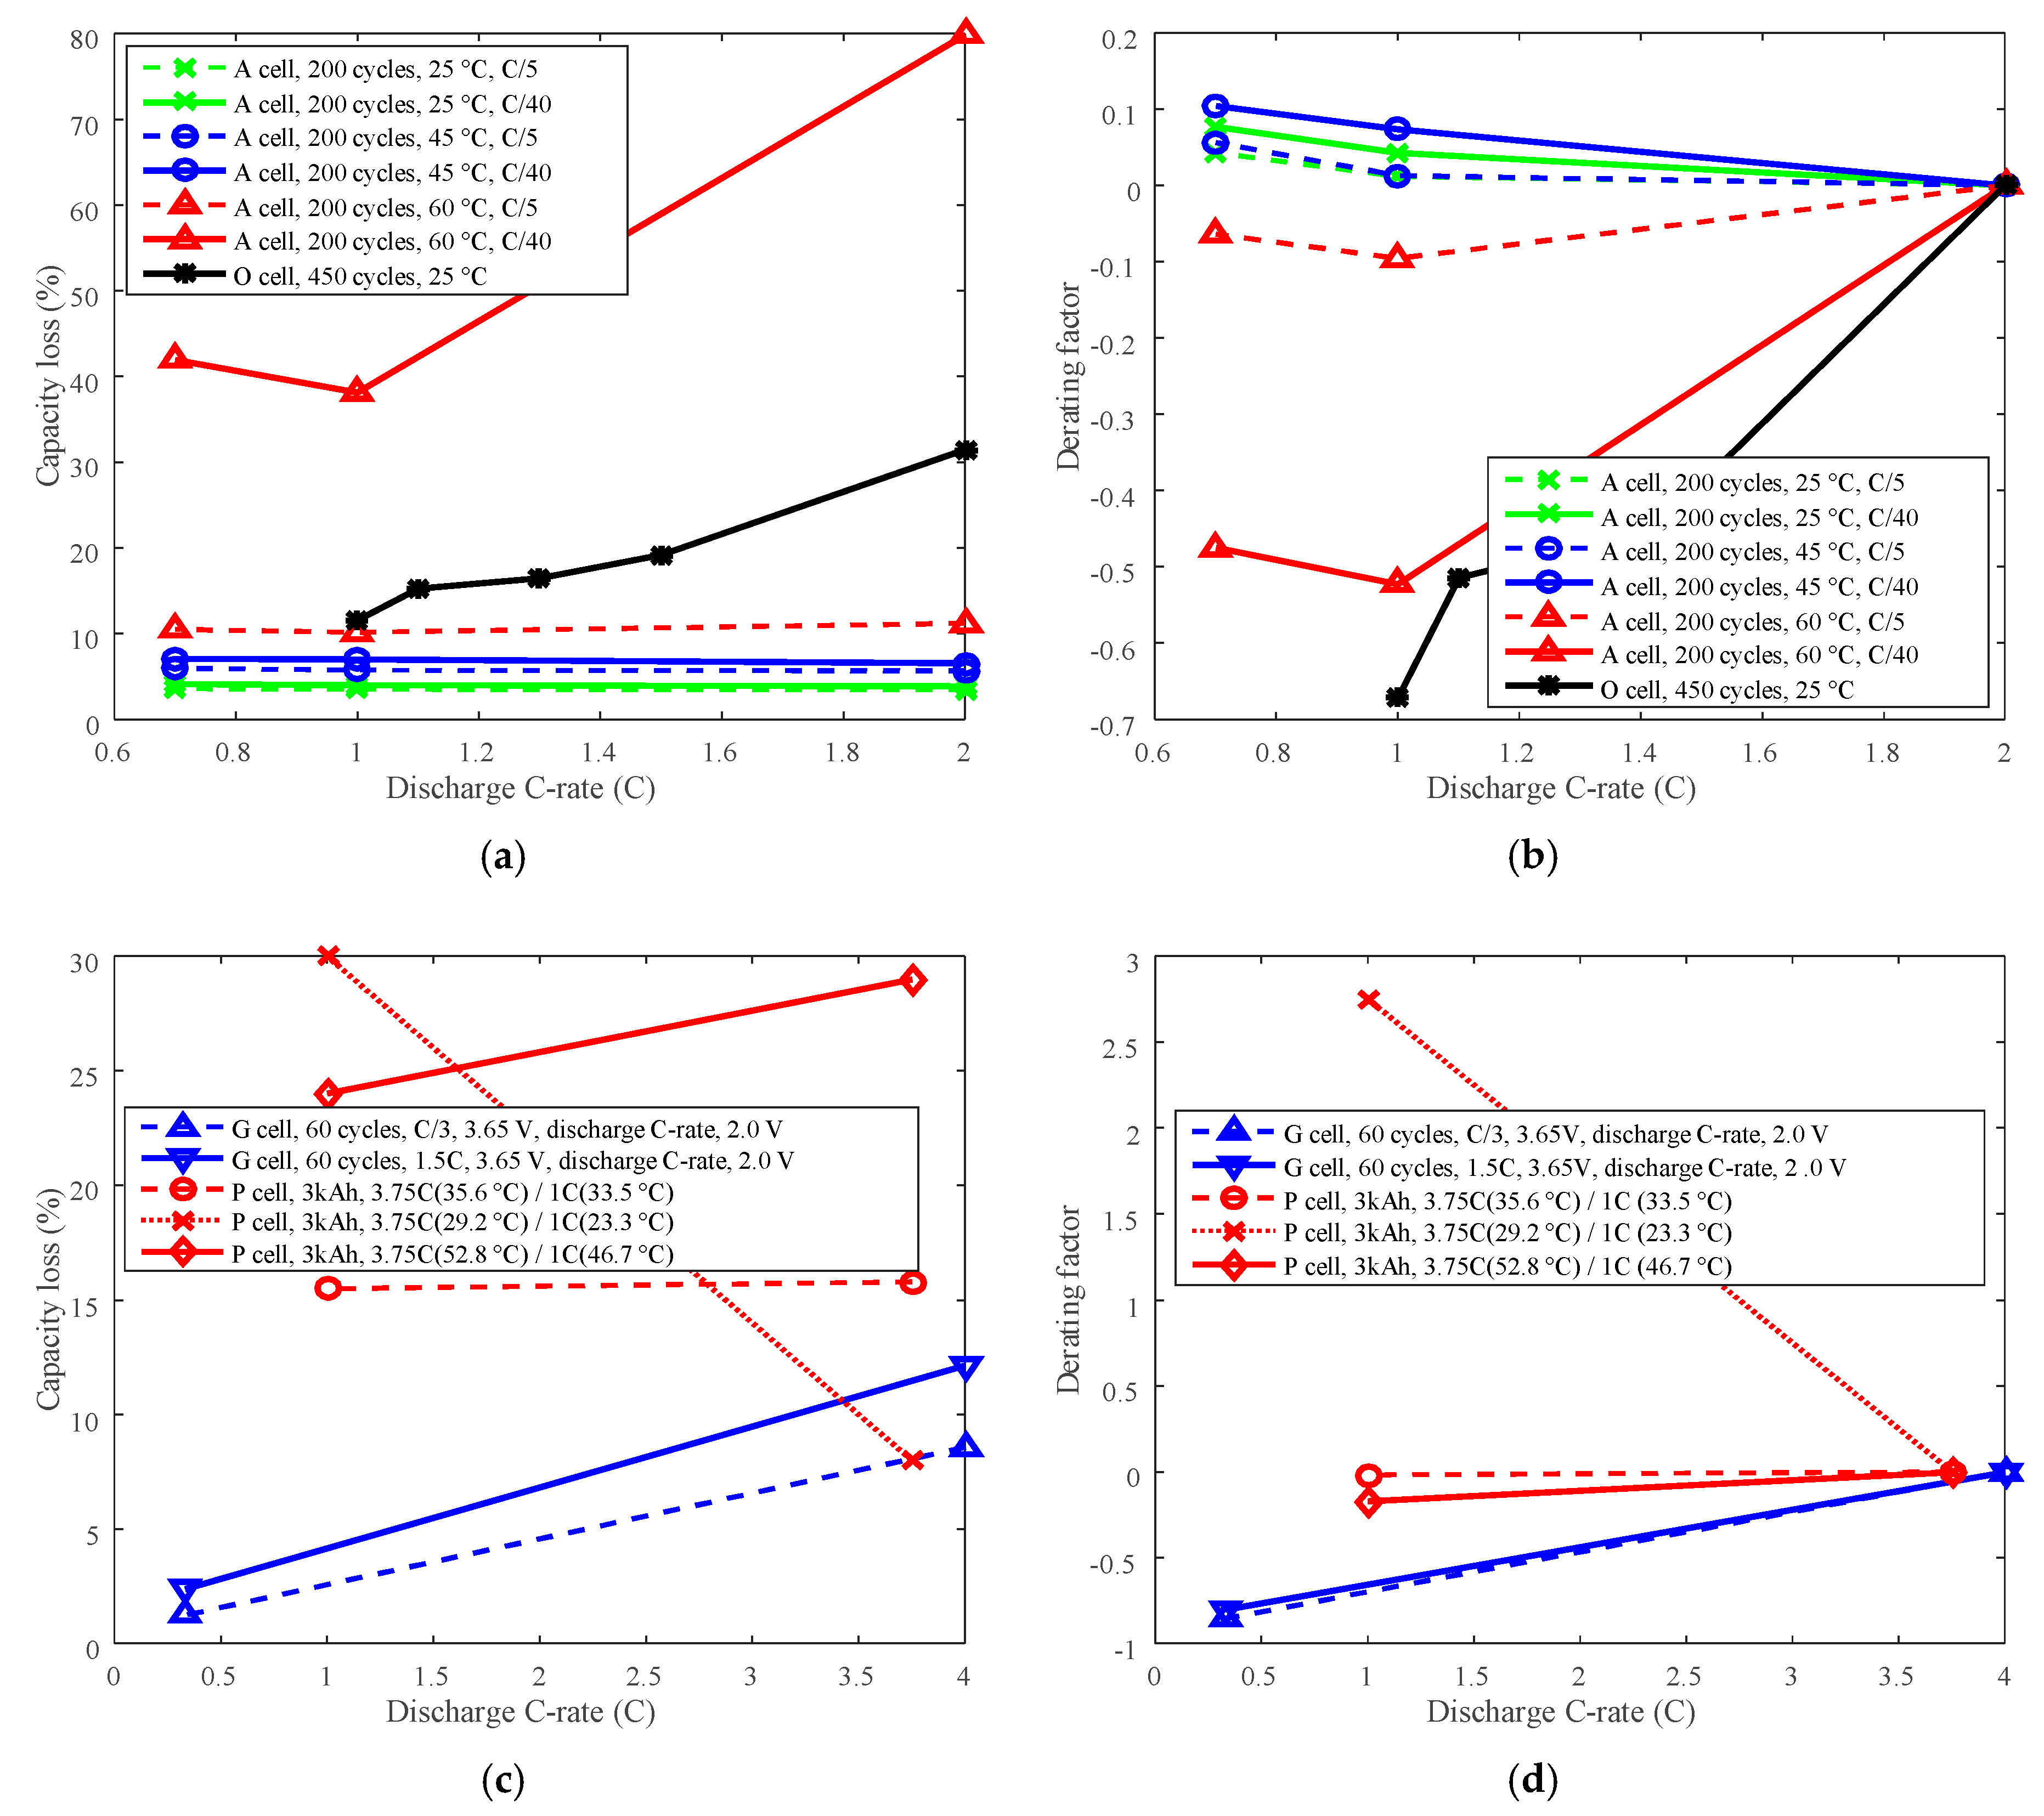
3.2. Cycle Life Improvement by Discharge C-Rate Derating

Cycle life can also be improved by derating the discharge C-rate. Batteries A and O with LCO positive electrode and batteries G and P with LFP positive electrode have been employed to present the derating of the discharge C-rate for cycle life. The testing data of batteries O, G, and P are presented in Figure 7a–c. The testing data of battery A are presented in Figure 4a.
As shown in Figure 7a,b, the capacity losses of batteries O and G increased against cycles overall. The minimum cycles were 450 for battery O and 60 for battery G. As shown in Figure 7c, the capacity losses of battery P also increased against total capacity throughout, the minimum testing time is 3 kAh.
The capacity losses at 200 cycles for battery A, at 450 cycles for battery O, at 60 cycles for battery G, and at 3 kAh capacity throughput for battery P are plotted in Figure 8a,c. The reference discharge C-rates were 2 C, 2 C, 4 C, and 3.75 C for batteries A, O, G, and P, respectively. Then the derating factors were computed according to Equation (3) and are shown in Figure 8b,d.
The study shows that the li-ion battery life cannot always be extended by derating discharge C-rate. The derating factor of battery A that cycling below 45 °C and at C/40 charge cut-off current, and the derating factor of battery P that cycling below 30 °C were bigger than 0 when derating discharge C-rate, as shown in Figure 8b,d, which implied that the derating of discharge C-rate increased the rate of capacity loss, and shortened the battery cycle life. This is contrary to the traditional knowledge that Li-ion battery life can be prolonged by reducing the discharge C-rate [25]. Therefore, degradation tests should be conducted first to make sure the discharge C-rate can be derated to prolong battery life before derating the discharge C-rate.
If derating the discharge C-rate has a positive role in prolonging battery life, when the temperature is uncontrollable, then the discharge C-rate can be derated to prolong battery life. However, there are many limitations when derating the discharge C-rate. For example, the discharge C-rate is mostly determined by practical application requirements, therefore, by reducing the discharge C-rate, some performance capability is limited.
The derating factor results did not exhibit much differences on LCO battery and LFP battery derating behaviors. Both LCO batteries’ and LFP batteries’ life not only can be extended by derating discharge C-rate, but also can be reduced. It indicates that it’s unreasonable to derate discharge C-rate just according to the electrode chemistries. Actually, not only the chemistries but also other components, such as electrolytes and separators, determine the Li-ion battery derating behaviors.

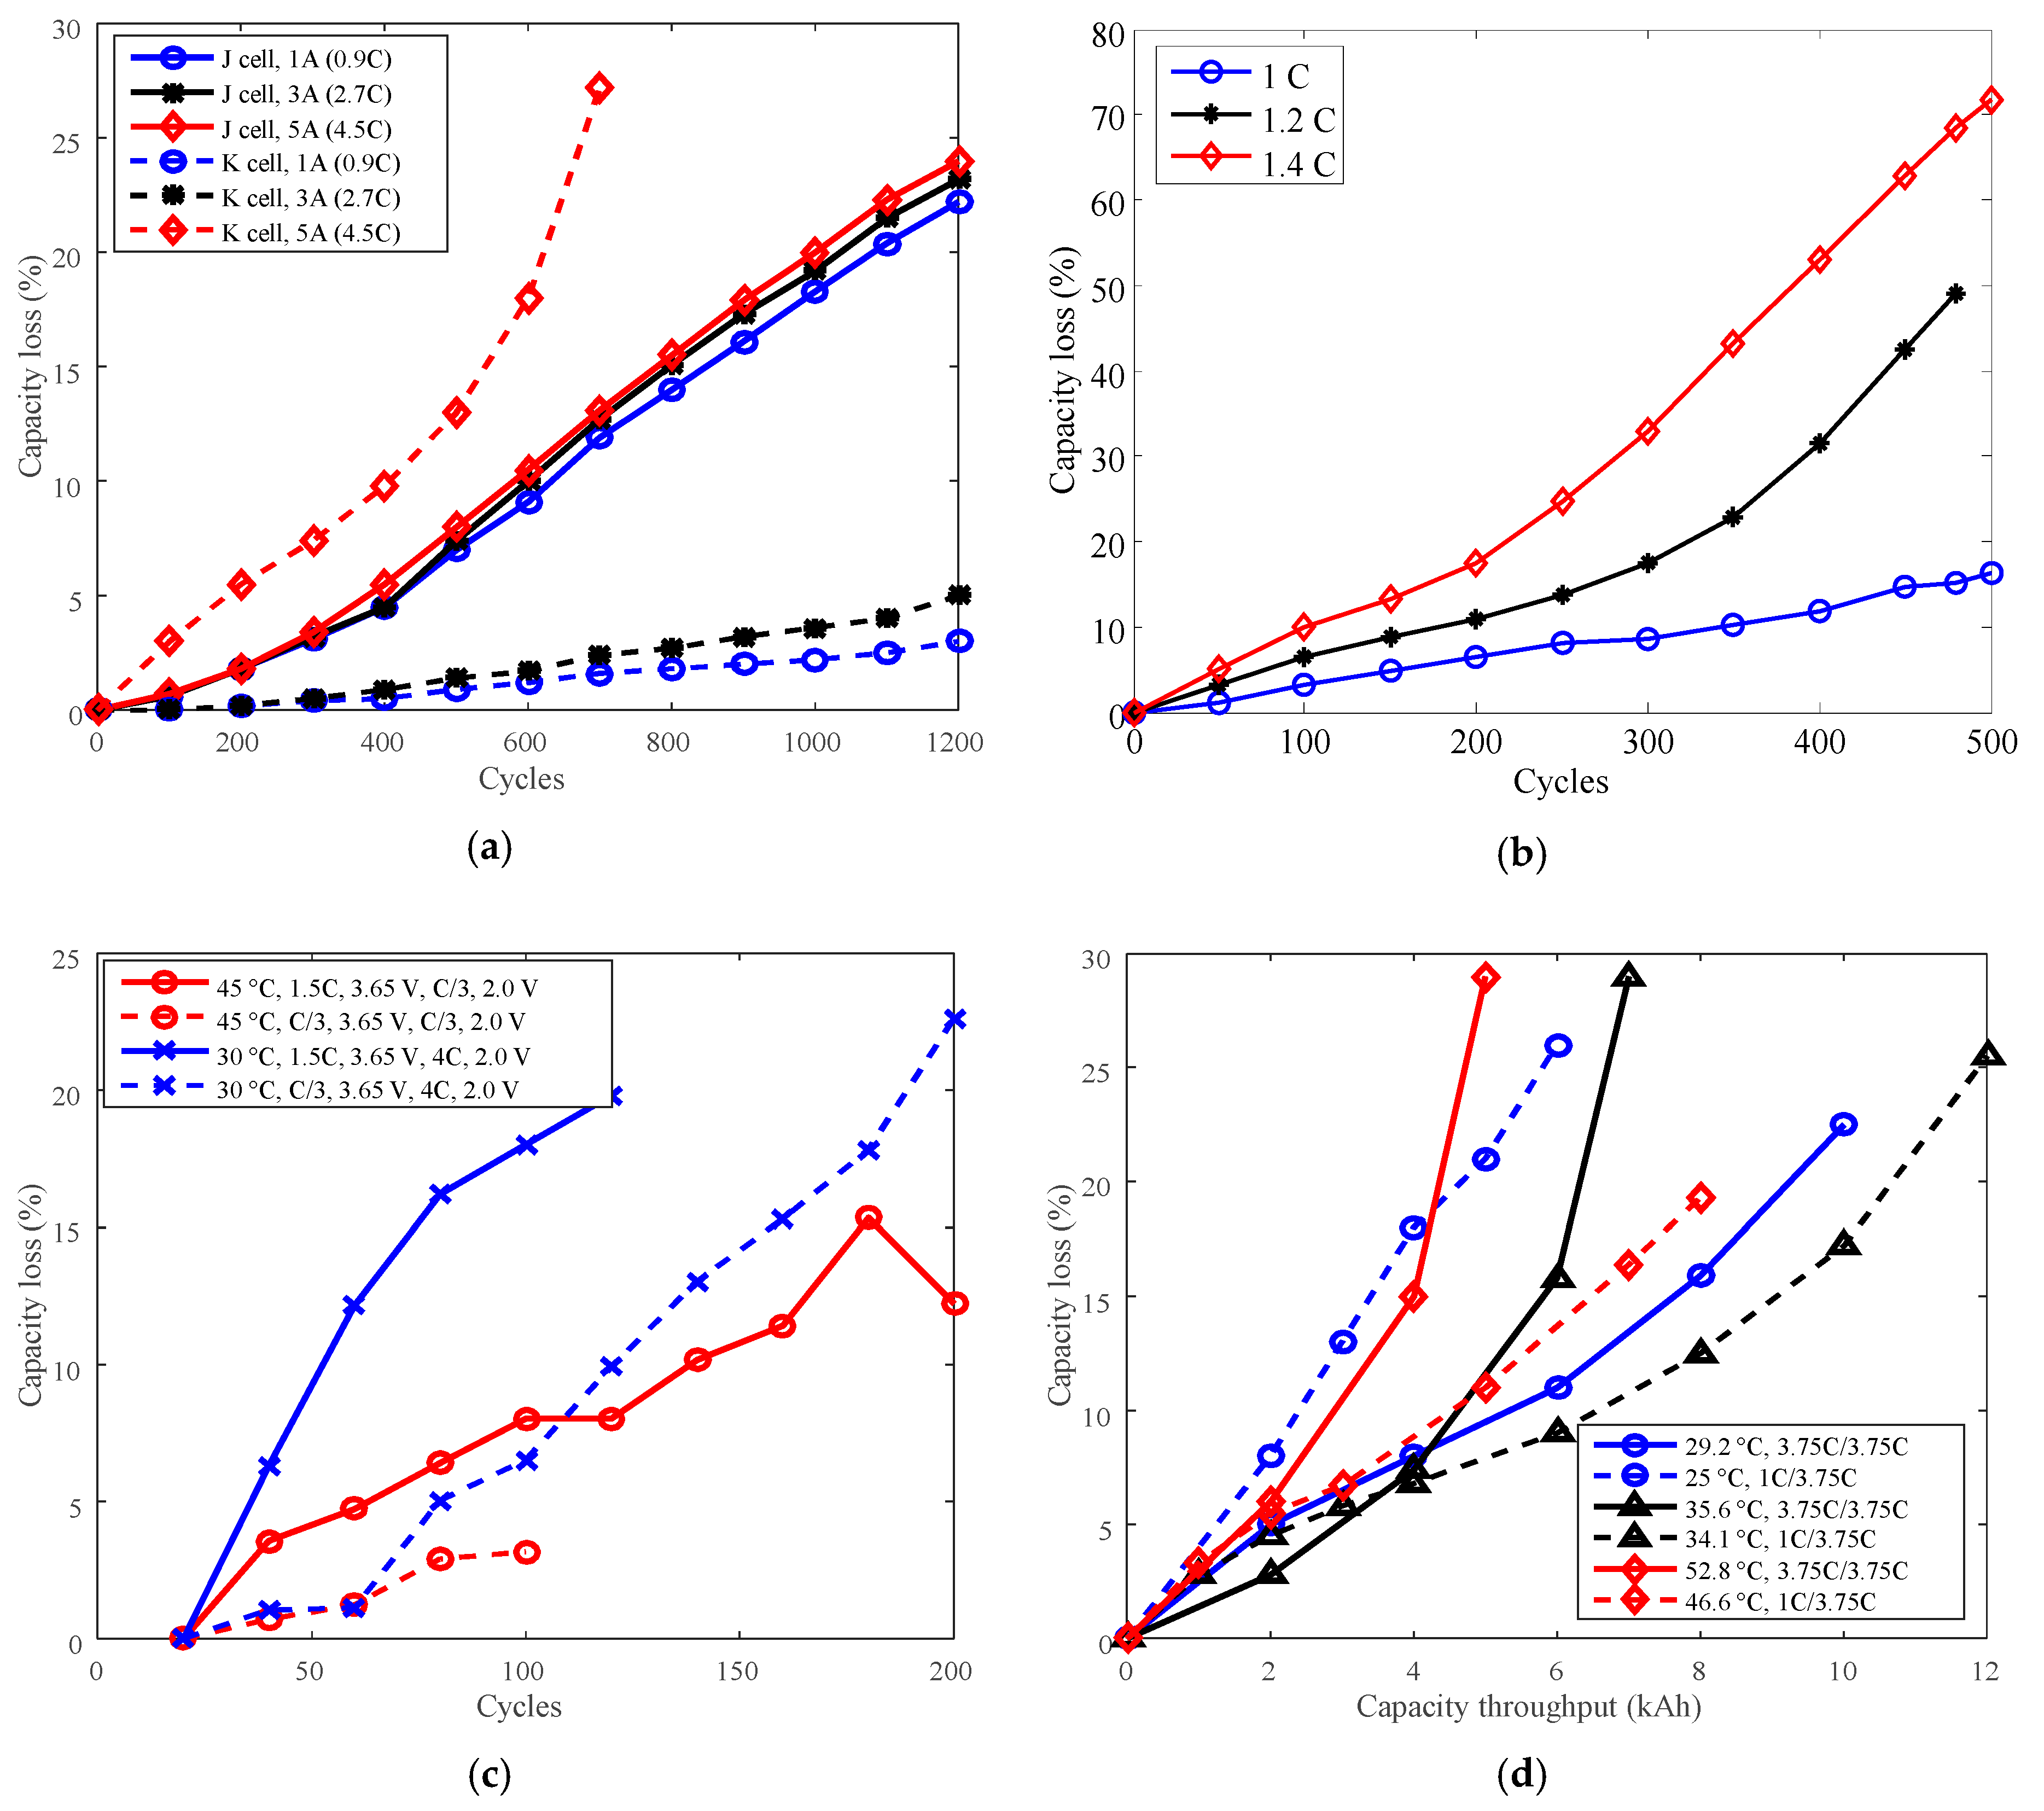
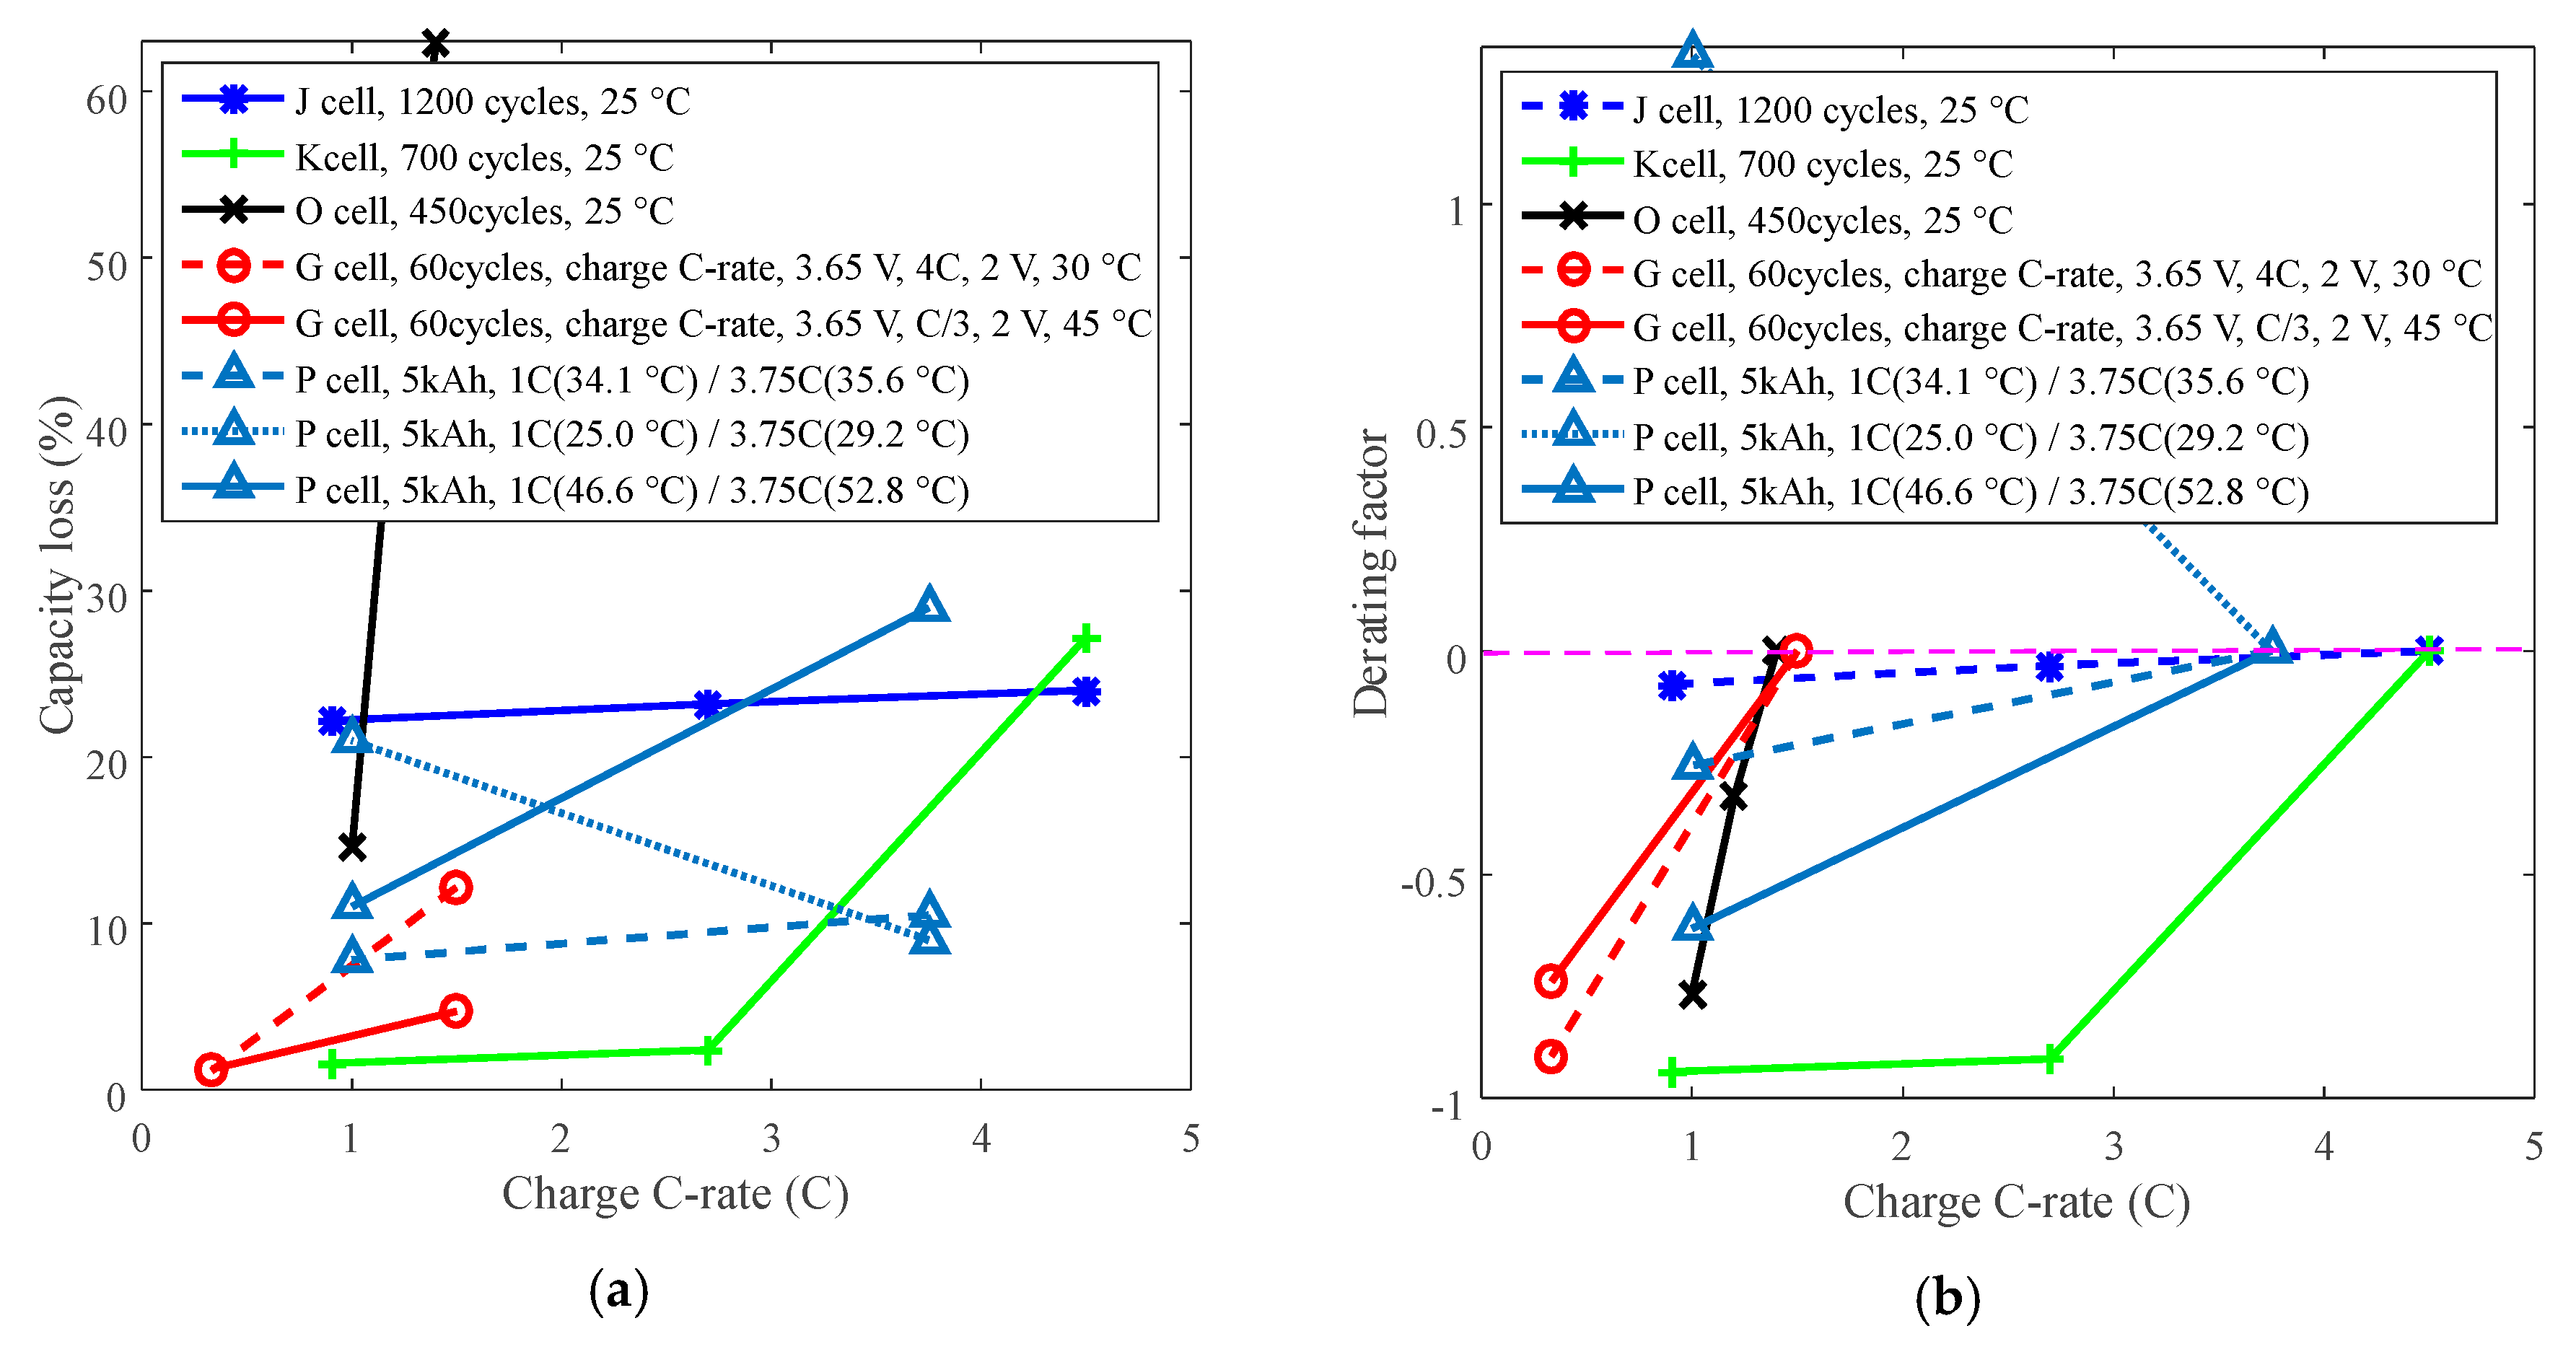
3.3. Cycle Life Improvement by Charge C-Rate Derating

Cycle life can also be improved by derating the charge C-rate. For example, batteries J and O with LCO positive electrode and battery K with LFP positive electrode were employed to present the derating of charge C-rate for cycle life. The testing data are represented in Figure 9. The derating behaviors vary when derating the charge C-rate, as presented in Figure 10.
The study indicates that batteries exhibit two opposite derating modes: one is that the derating factor declines with the decreasing charge C-rate, such as for batteries K, O and G, and the other is that the derating factor increases with the decreasing charge C-rate. For example, the derating factor of battery P that cycling below 30 °C reached 1.30 by derating the charge C-rate from 3.75C to 1C, which implies that the rate of capacity loss increased. This feature implies that degradation tests should be conducted to make sure charge C-rate can be derated to prolong battery life before derating the charge C-rate.
If the temperature is uncontrollable, then the charge C-rate can be considered to derate to prolong battery life. As we know, a high charge C-rate sharply shortens the charging time, therefore, derating of the charge C-rate leads to increasing charging time, results in users’ complaints.

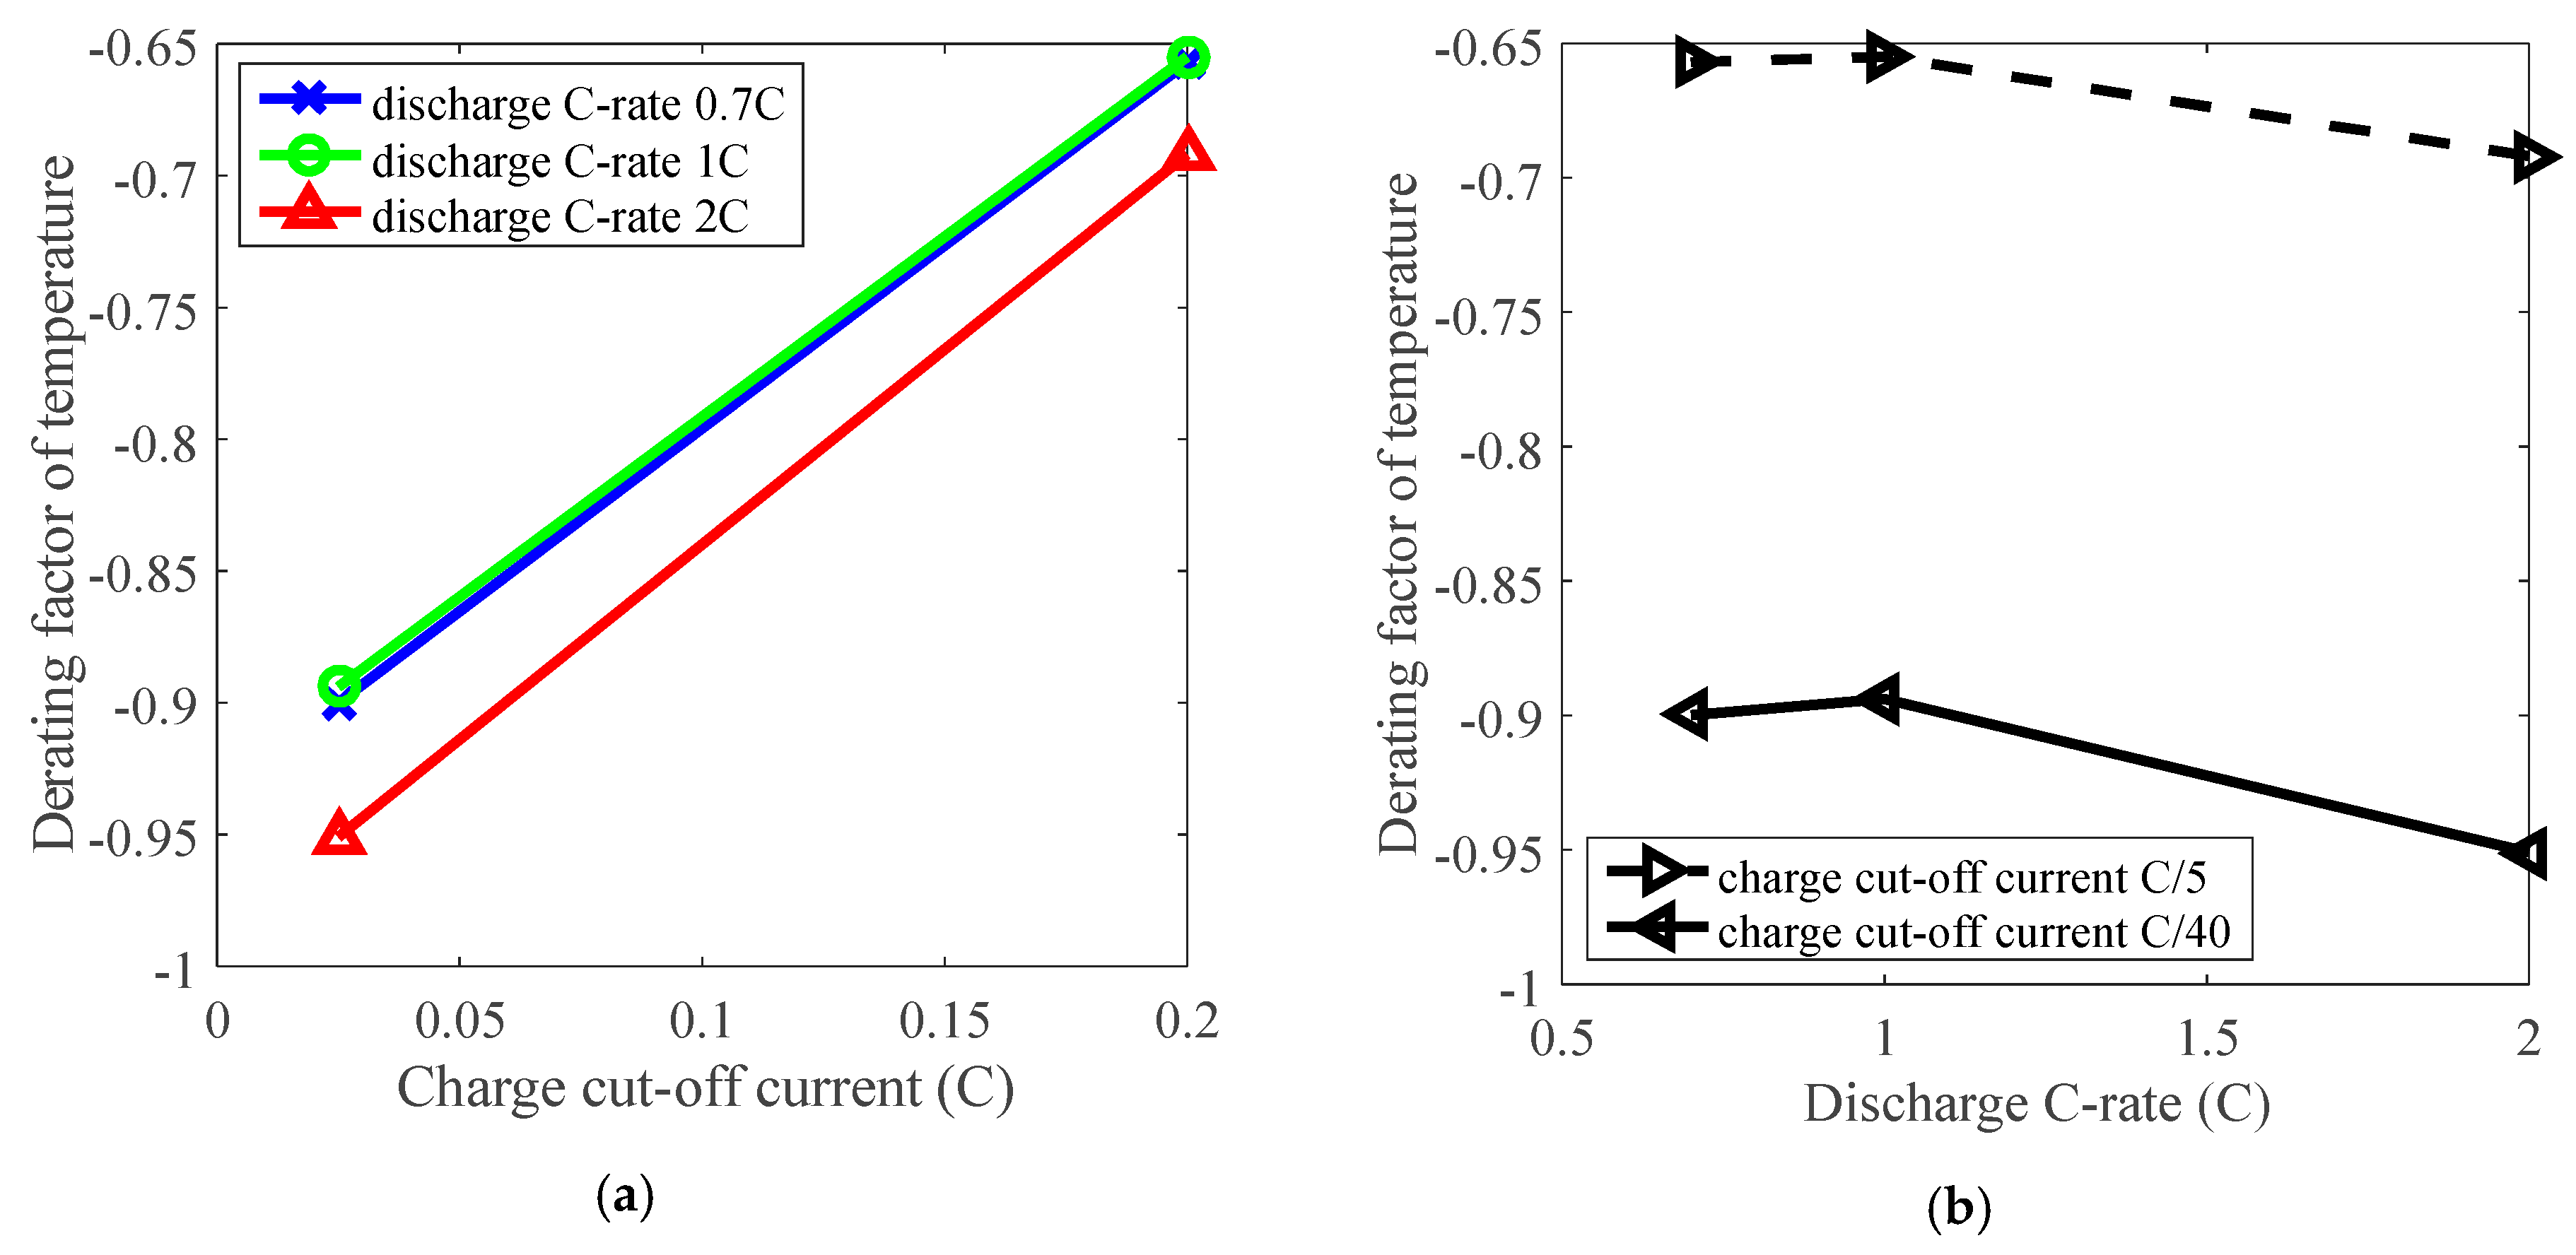
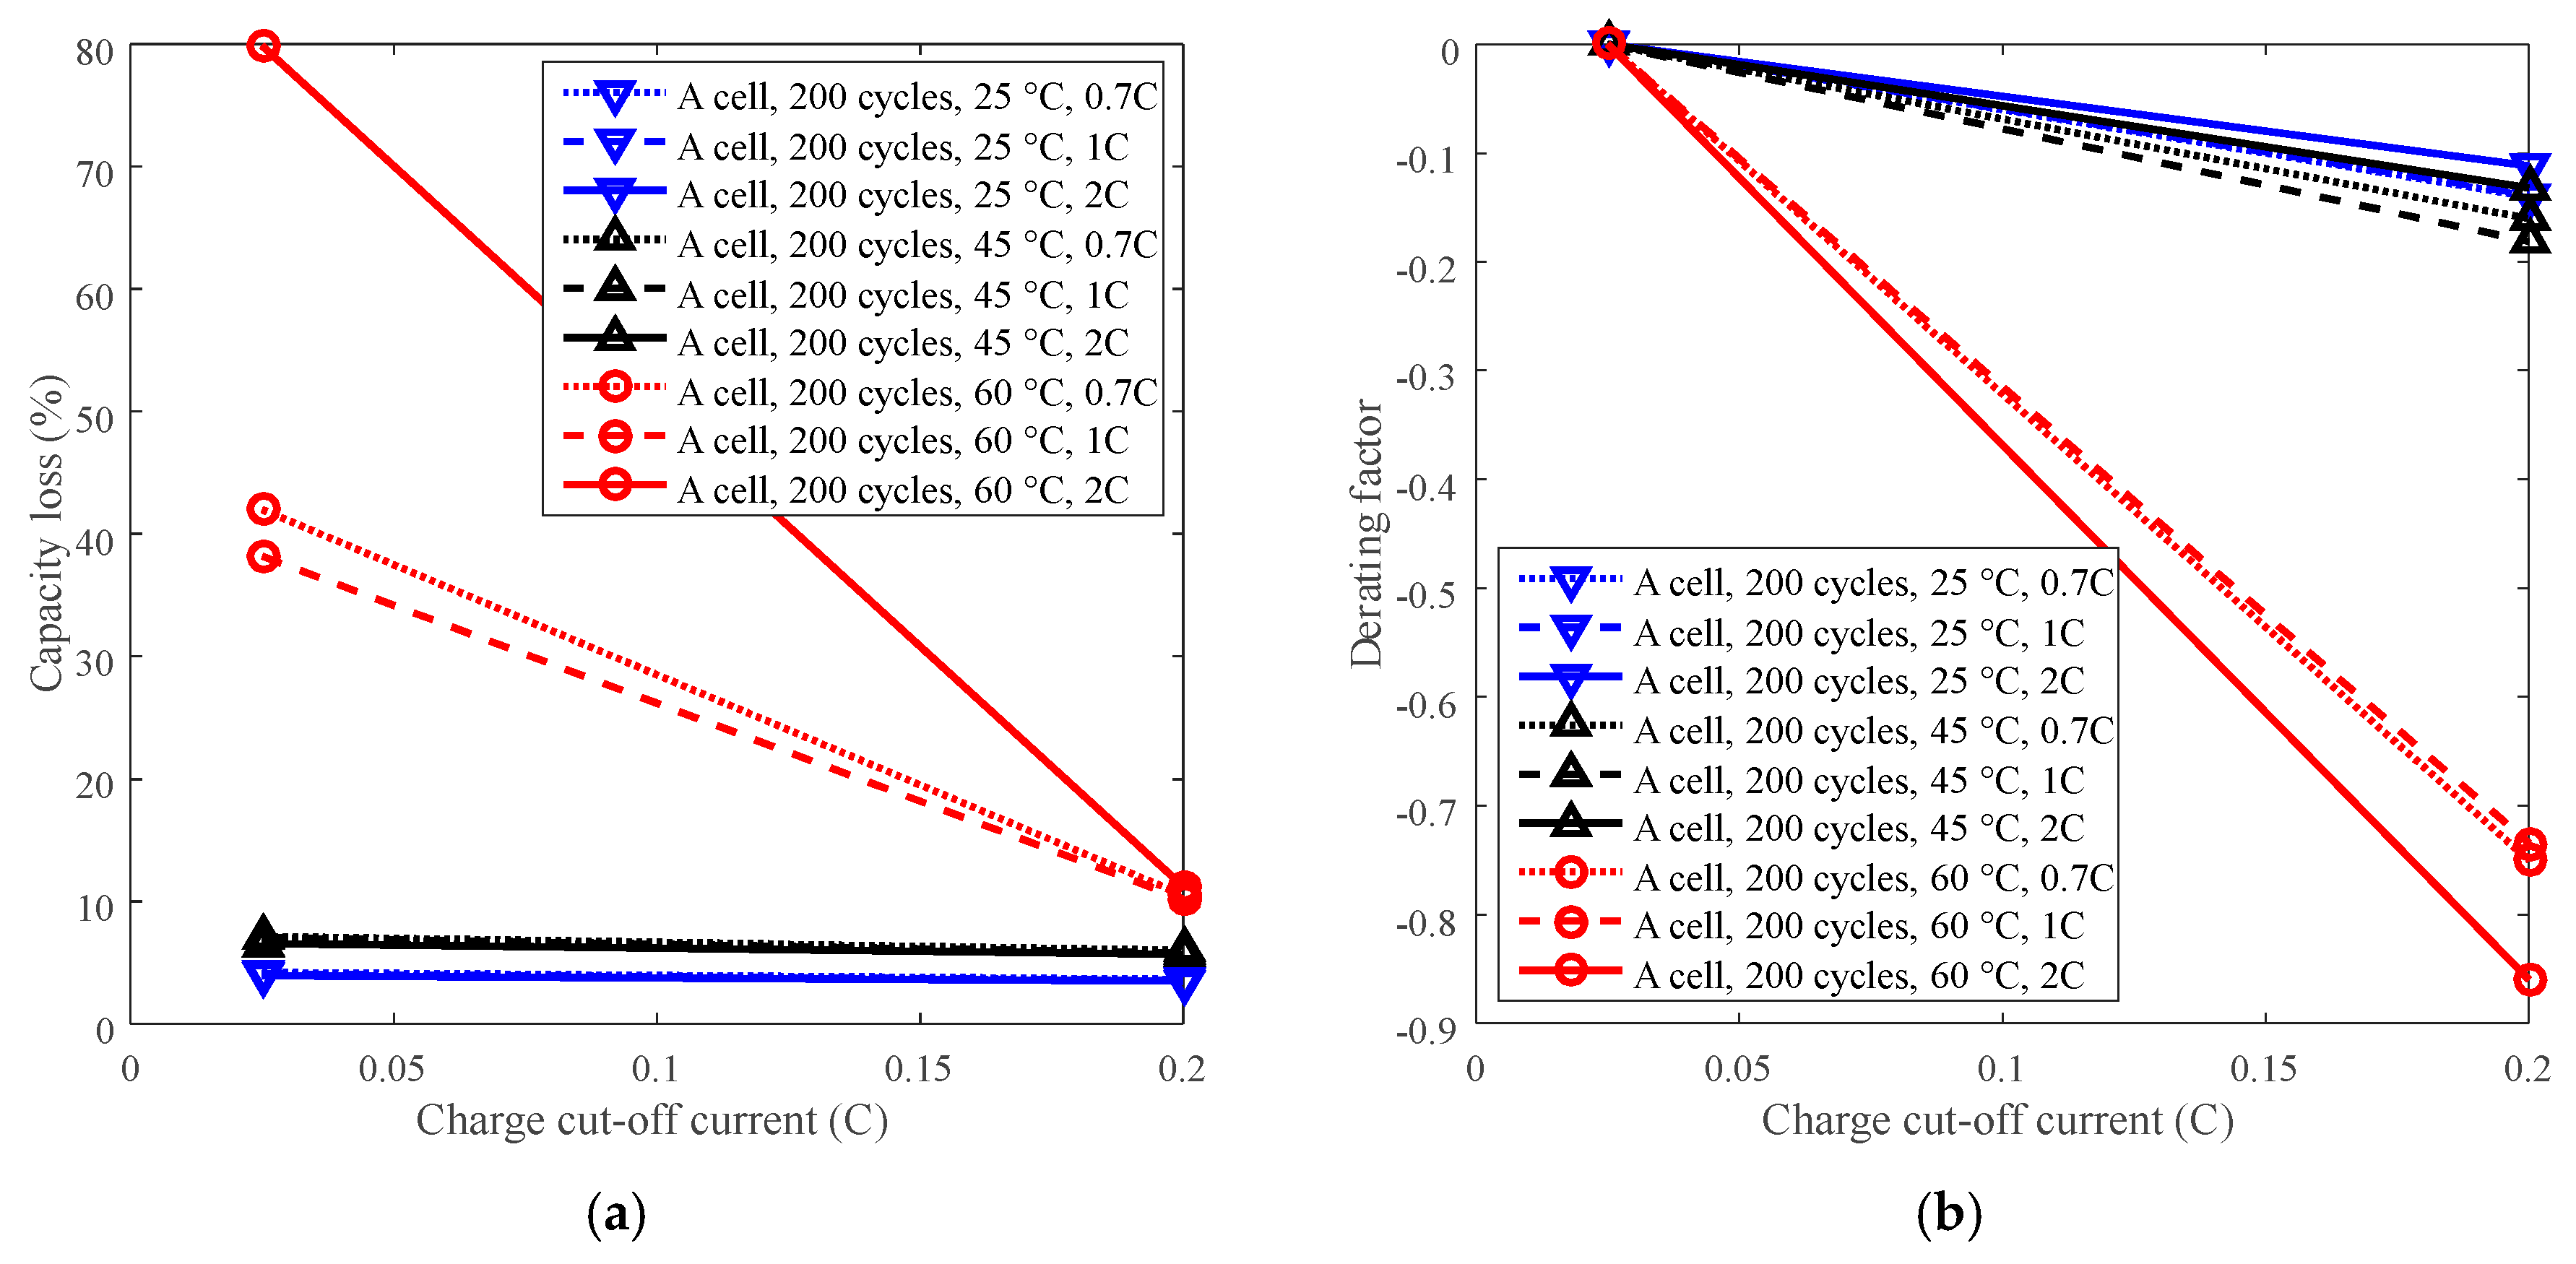
3.4. Cycle Life Improvement by Charge Cut-Off Current Derating

Cycle life can be improved by derating the charge cut-off current. For example, battery A with LCO positive electrode was employed to present the derating of the charge C-rate for cycle life under four temperature levels with charge cut-off current C/5 and C/40. The testing data can be seen in Figure 4a. The capacity losses under various charge cut-off current are computed using testing data and plotted in Figure 11a. C/40 was selected as the reference condition. The derating of the charge cut-off current is presented in Figure 11b.
The capacity loss decreased with the increasing charge cut-off current under 60 °C, whereas the capacity loss almost kept constant under 25 °C and 45 °C, as shown in Figure 11a. The derating factor declines with the increasing charge cut-off current, but its decreasing trend varies depending on temperature. Under temperatures below 45 °C, the derating factor slightly reached around −0.15 when derating the charge cut-off current to C/5, whereas when the temperature was 60 °C, the derating factor wend down to −0.75. Therefore, the charge cut-off current can be derated under high temperature (60 °C), rather than under temperatures below 45 °C, to reduce the rate of capacity loss and prolong battery life, as presented in Figure 11b. In addition, the discharge C-rate has little influence on derating of the charge cut-off current, so derating of the charge cut-off current can be applied under various discharge C-rates.
Charge cut-off current should be derated under high temperature (such as 60 °C). At high temperature, the rate of capacity loss can be reduced significantly by derating the charge cut-off current. However, when the temperature was below 45 °C, the rate of capacity loss was slightly reduced.

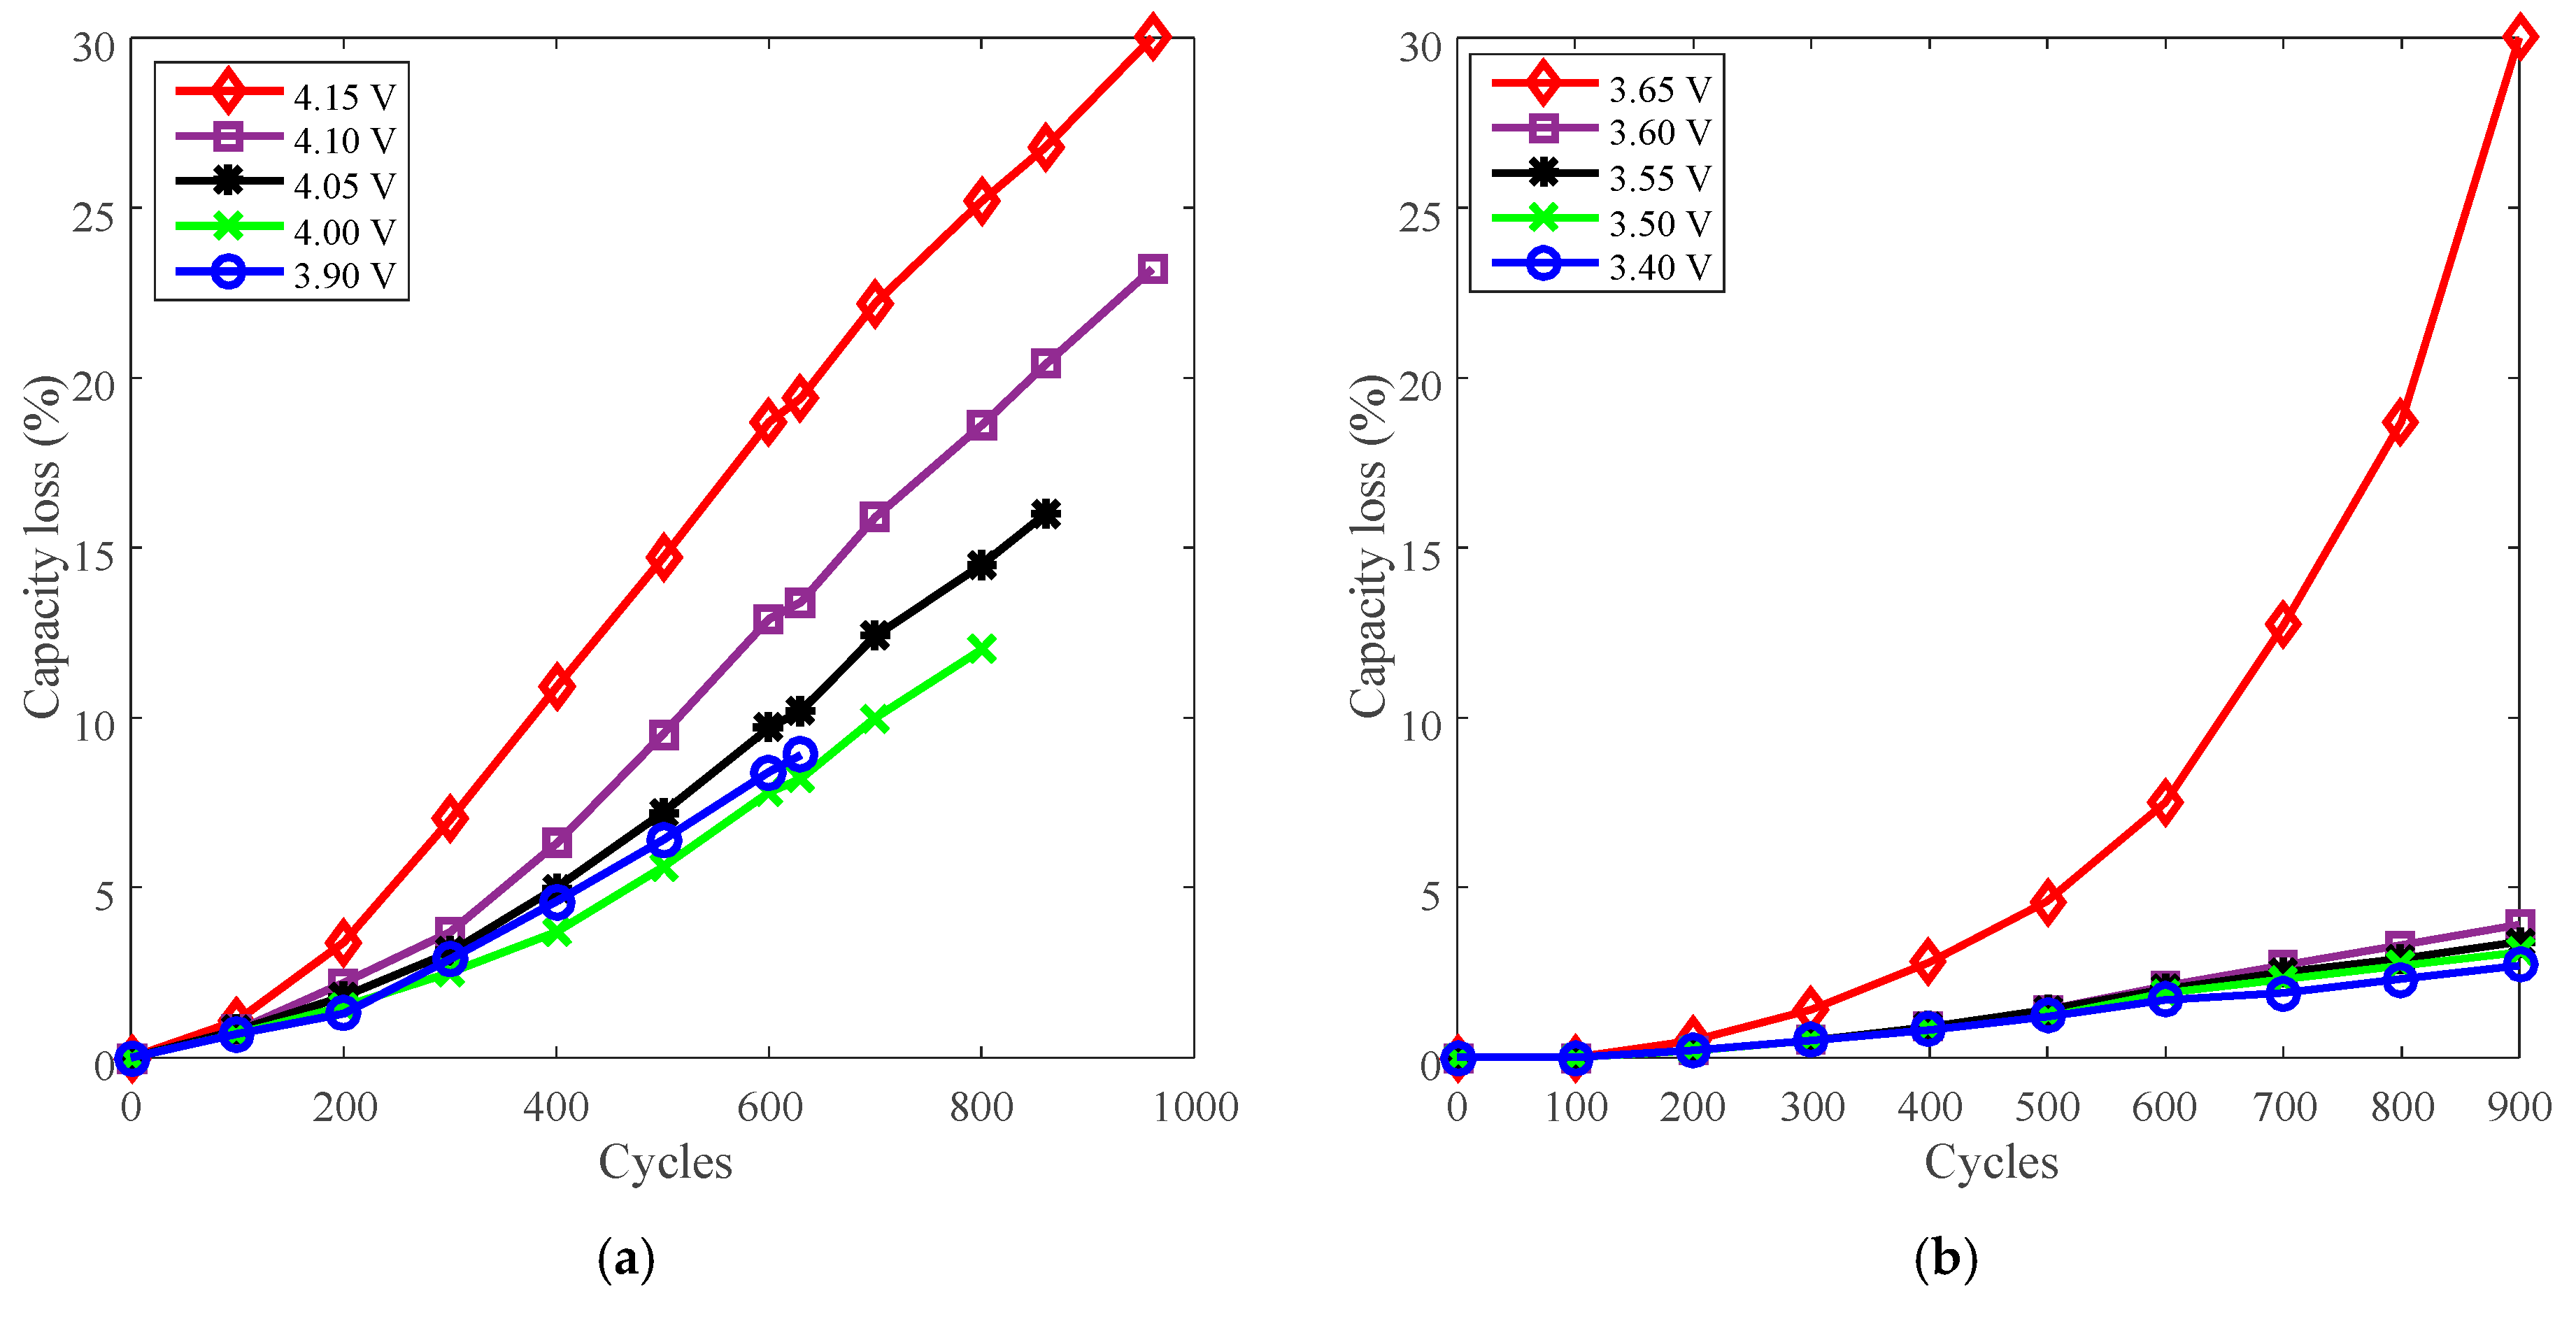
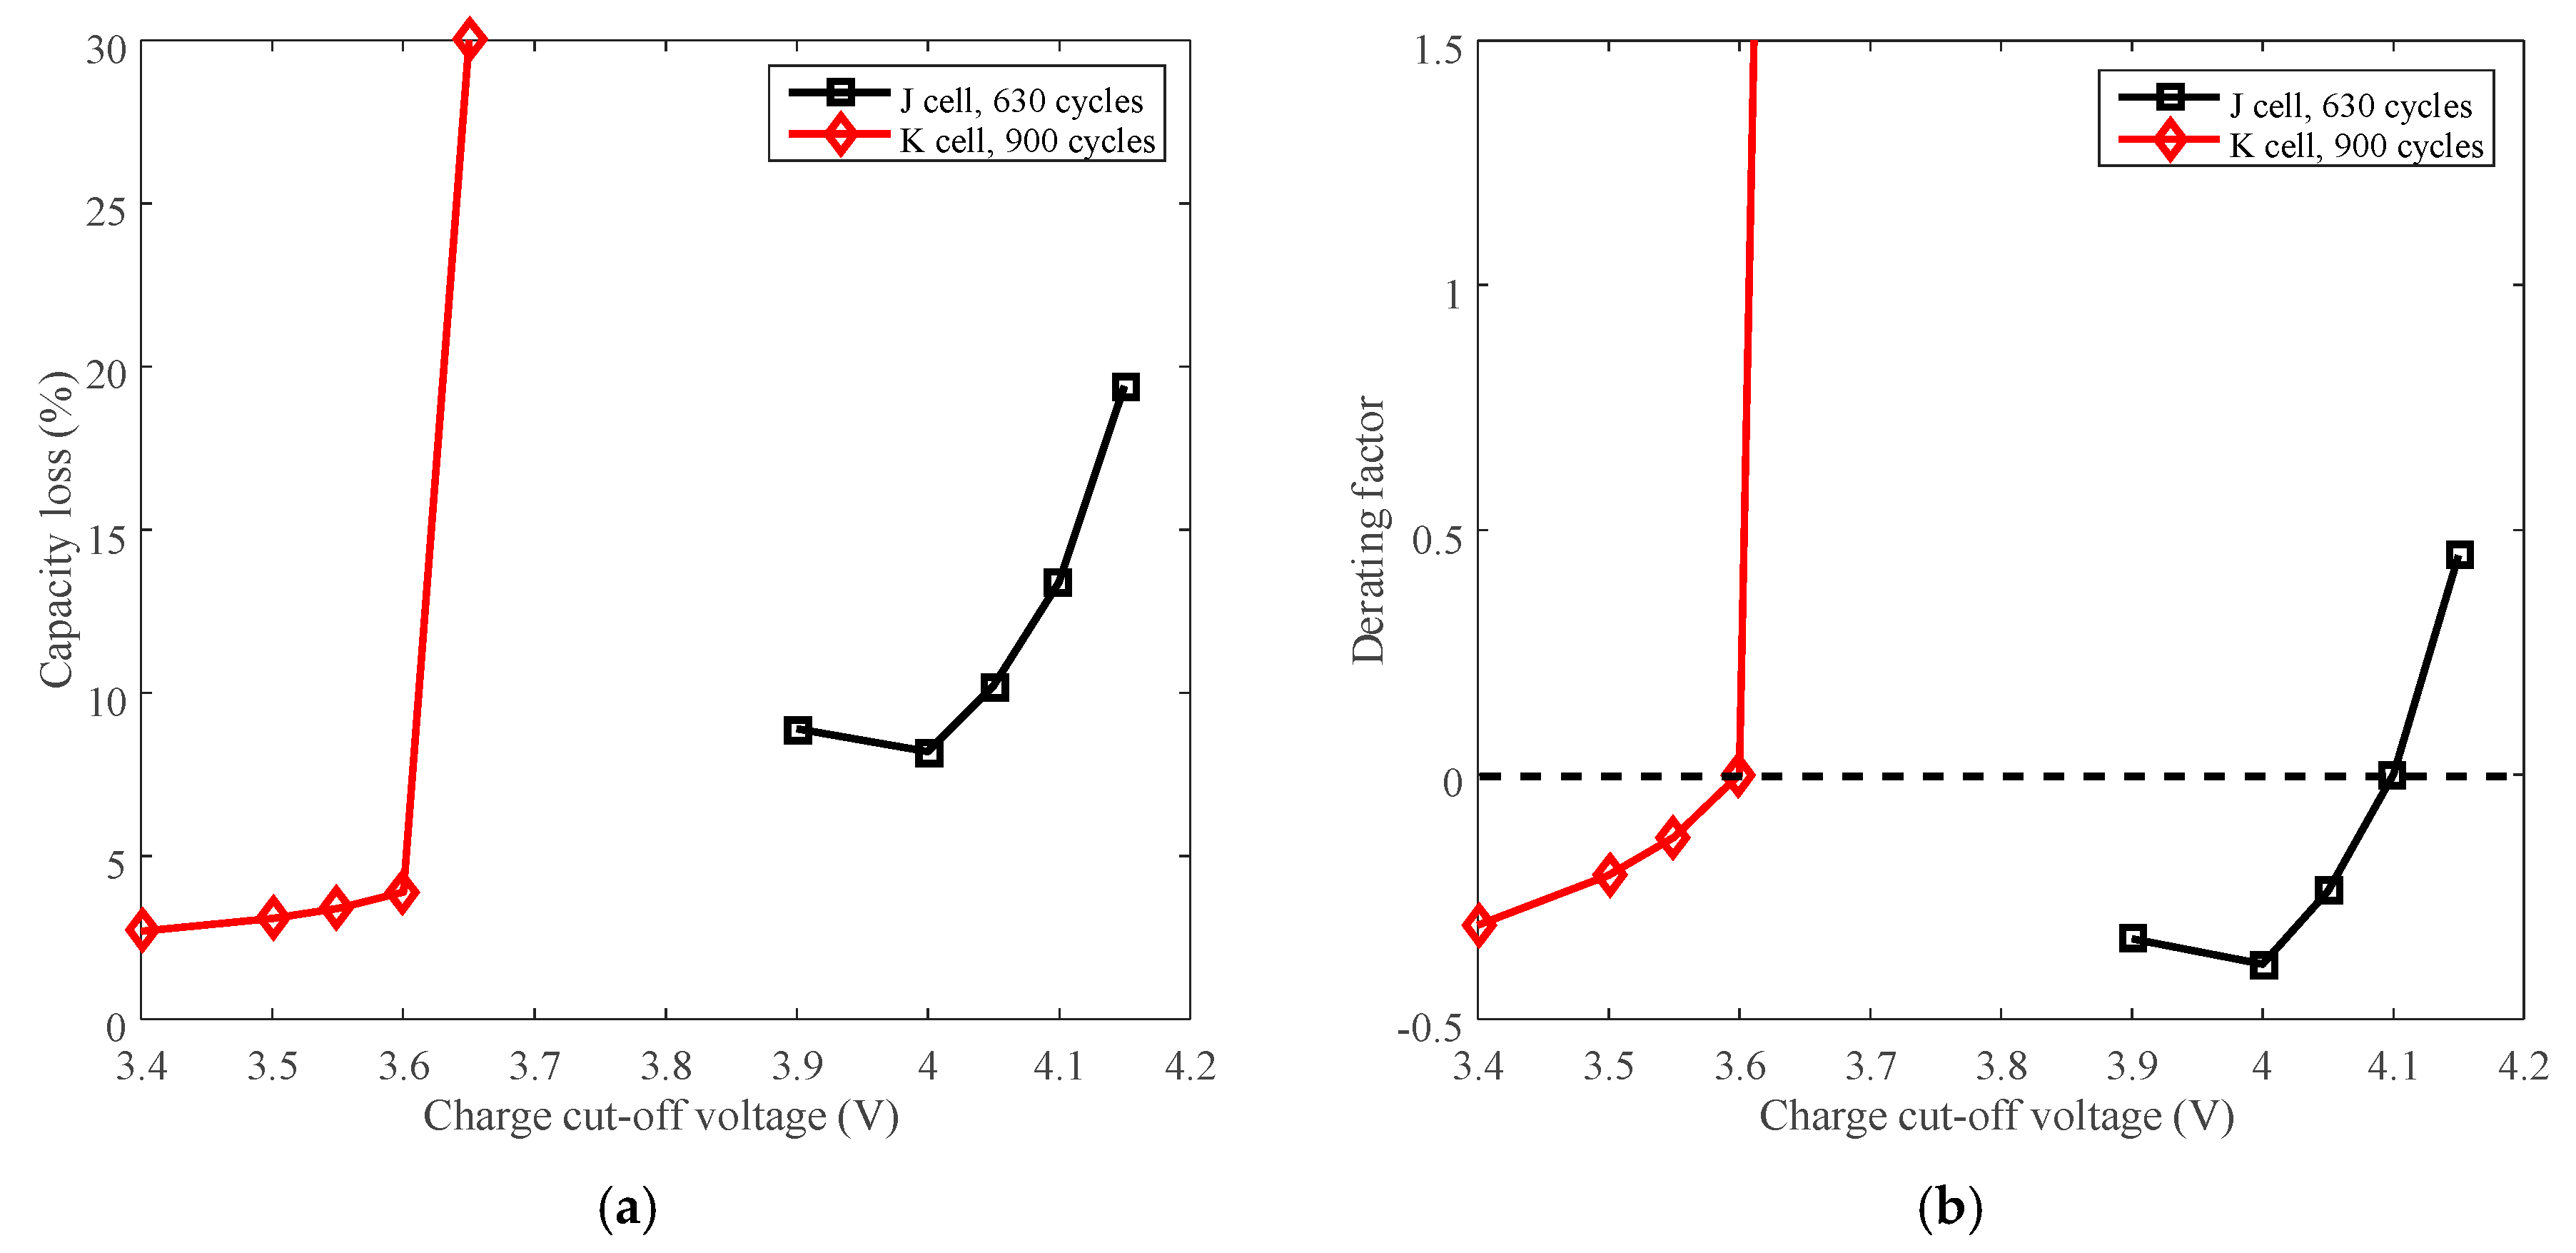
3.5. Cycle Life Improvement by Charge Cut-Off Voltage Derating

Battery J with LCO positive electrode and battery K with LFP positive electrode were employed to present the derating of charge cut-off voltage for cycle life. The capacity loss vs. cycles of battery J and K are plotted in Figure 12a,b, respectively.
The capacity loss vs. charge cut-off voltage of battery J and K are plotted in Figure 13a. The rated voltages, 4.1 V for battery J and 3.6 V for battery K, are selected as the reference conditions. The derating of charge cut-off voltage is presented in Figure 13b.
The capacity loss increases with the growing charge cut-off voltage, as shown in Figure 13a. The derating factor declines with the decreasing charge cut-off voltage overall, so the rate of capacity loss can be reduced by lowering the charge cut-off voltage. Batteries J and K exhibit similar derating behavior as shown in Figure 13b. However, the rate of capacity loss is accelerated when batteries are cycled beyond the rated voltage. So the batteries should not be used above the rated charge cut-off voltage.
Charge cut-off voltage can be employed to reduce the rate of capacity loss, whereas the rate of capacity loss is accelerated when increasing the charge cut-off voltage. In terms of derating the charge cut-off voltage, from the point of view of open-circuit voltage (OCV)–SOC curves, a small variation of the OCV leads to a large change of SOC [26]. The charge cut-off voltage determines battery OCV by a subtraction of voltage drop of internal resistance, and finally determines the SOC. Derating the charge cut-off voltage by a small variation will cause the charge capacity to decline a lot, resulting in a shortage of available energy and discharging time for one cycle.
In summary, temperature, charge cut-off voltage, and charge cut-off current can be derated to reduce the rate of capacity loss under various cycling conditions. However, the effects of derating the temperature are stronger than the effects of derating the charge cut-off voltage. The effects of derating the charge cut-off current varied depending on temperature. Under 60 °C, the rate of capacity loss can be severely reduced (with derating factor −0.82) by derating the charge cut-off current, whereas under temperatures below 45 °C, the rate of capacity loss slightly reduced (with derating factor −0.10). The cycle life is not always prolonged by derating the charge/discharge C-rate under certain specific situations. For example, the rate of capacity loss increased (with derating factor 2.75) by derating the discharge C-rate for battery P under low temperature, and by derating the charge C-rate, the rate of capacity loss increased (with derating factor 1.33) under temperature 25 °C. Therefore, to prolong battery cycle life, temperature could be considered as the most sensitive parameter to derate.

4. Conclusions

The degradation behavior of two widely used Li-ion batteries, graphite/LCO and graphite/LFP, was reviewed under calendar life and cycle life conditions to propose derating methodology and guidelines. Even for the same chemistry of Li-ion battery, different manufacturers use different designs and additives to reduce cost and enhance the performance of their batteries. Hence a strict derating regime cannot be applied across all manufacturers. This article is the first to present the methodology for selecting stress factors and guidelines for Li-ion battery derating.
Both temperature and SOC can be derated to reduce the rate of capacity loss for LCO and LFP batteries and extend their calendar life. While temperature in general is a more significant factor compared to SOC for calendar life derating, the criticality and effectiveness of SOC as a derating factor cannot be ignored at high temperature (50 °C or above). Hence, temperature control should be primarily used for derating to extend battery calendar life. Additionally, temperature control may be a more costly exercise compared to controlling the SOC, so if high temperature cannot be avoided during battery storage, then SOC derating must be implemented to extend battery calendar life.
In terms of battery cycle life, temperature is also the most significant parameter that can be derated to reduce the rate of capacity loss under various cycling conditions. The order of stress factors in terms of their significance for cycle life derating is as follows, taking the derating effects and practical limitations into account: temperature > charge/discharge C-rate > charge cut-off current > charge cut-off voltage. Charge C-rate and discharge C-rate should be carefully derated because the rate of battery capacity loss may be increased. Charge cut-off current is an effective derating parameter only at high temperature. Charge cut-off voltage can be derated to reduce the rate of capacity loss, but not beyond the rated voltage.
For any battery in industry application, stress factors for calendar life improvement and cycling life improvement should be identified first, then the batteries should be tested under different levels of stress factors using a statistical design of experiment (DOE) to accurately calculate the derating factors corresponding to each stress factor, and then the stress factors to be used for derating should be chosen based on the tradeoffs between ease of controllability and the magnitude of the derating factor.

Author Contributions

Y.S. and M.P. conceived and designed the research; Y.S. and S.S. analyzed the testing data; Y.S., S.S. and M.P. wrote the paper.

Funding

This research was also funded by University Nursing Program for Young Scholars with Creative Talents in Heilongjiang Province (UNPYSCT-2017087), and Natural Science Foundation of Heilongjiang Province (QC2016068).

Acknowledgments

The authors are supported by the Center for Advanced Life Cycle Engineering (CALCE) at the University of Maryland, which is funded by more than 150 companies and organizations concerned with electronics reliability and safety. The authors thank Cheryl Wurzbacher for editing and comments to improve the paper’s quality.

Conflicts of Interest

The authors declare no conflict of interest.

References

  1. Du, J.; Zhang, X.; Wang, T.; Song, Z.; Yang, X.; Wang, H.; Wu, X. Battery degradation minimization oriented energy management strategy for plug-in hybrid electric bus with multi-energy storage system. Energy 2018, 165, 153–163. [Google Scholar] [CrossRef]
  2. Instructions for EEE Parts Selection, Screening, Qualification and Derating (EEE-INST-002). Available online: https://nepp.nasa.gov/docuploads/FFB52B88-36AE-4378-A05B2C084B5EE2CC/EEE-INST-002_add1.pdf (accessed on 22 November 2018).
  3. Recommended Practice for Maintenance, Testing, and Replacement of Valve-Regulated Lead-Acid Batteries for Stationary Applications (IEEE 1188). Available online: https://standards.ieee.org/project/1188.html (accessed on 20 November 2018).
  4. Freescale Semiconductor. MPC7447AECS01AD Specification. 7 November 2018. Available online: https://www.nxp.com/docs/en/data-sheet/MPC7447AECS01AD.pdf (accessed on 7 November 2018).
  5. Hitachi. Instructions for Use of Hitachi High-Voltage Monolithic ICs. 7 November 2018. Available online: http://www.hitachi-power-semiconductor-device.co.jp/en/products/ic/pdf/Instructions_for_Use_EN.pdf (accessed on 7 November 2018).
  6. Yang, F.; Wang, D.; Zhao, Y.; Tsui, K.L.; Bae, S.J. A study of the relationship between coulombic efficiency and capacity degradation of commercial lithium-ion batteries. Energy 2018, 145, 486–495. [Google Scholar] [CrossRef]
  7. Guan, T.; Zuo, P.; Sun, S.; Du, C.; Zhang, L.; Cui, Y.; Wang, F. Degradation mechanism of LCO/mesocarbon microbeads battery based on accelerated aging tests. J. Power Sources 2014, 268, 816–823. [Google Scholar] [CrossRef]
  8. Choi, S.S.; Lim, H.S. Factors that affect cycle-life and possible degradation mechanisms of a Li-ion cell based on LiCoO2. J. Power Sources 2002, 111, 130–136. [Google Scholar] [CrossRef]
  9. Ning, G.; Haran, B.; Popov, B.N. Capacity fade study of lithium-ion batteries cycled at high discharge rates. J. Power Sources 2003, 117, 160–169. [Google Scholar] [CrossRef]
  10. Wang, J.; Liu, P.; Hicks-Garner, J.; Sherman, E.; Soukiazian, S.; Verbrugge, M.; Finamore, P. Cycle-life model for graphite-LFP cells. J. Power Sources 2011, 196, 3942–3948. [Google Scholar] [CrossRef]
  11. Ecker, M.; Nieto, N.; Käbitz, S.; Schmalstieg, J.; Blanke, H.; Warnecke, A.; Sauer, D.U. Calendar and cycle life study of Li (NiMnCo) O2-based 18650 lithium-ion batteries. J. Power Sources 2014, 248, 839–851. [Google Scholar] [CrossRef]
  12. Saxena, S.; Hendricks, C.; Pecht, M. Cycle life testing and modeling of graphite/LiCoO2 cells under different state of charge ranges. J. Power Sources 2016, 327, 394–400. [Google Scholar] [CrossRef]
  13. Wikner, E.; Thiringer, T. Extending Battery Lifetime by Avoiding High SOC. Appl. Sci. 2018, 8, 1825. [Google Scholar] [CrossRef]
  14. IEEE Standard Procedure for the Determination of the Ampacity Derating Factor for Fire-Protected Cable Systems. (IEEE Std 848-2015). Available online: https://ieeexplore.ieee.org/stamp/stamp.jsp?tp=&arnumber=7111195 (accessed on 20 November 2018).
  15. Peng, W.; Li, Y.F.; Yang, Y.J.; Mi, J.; Huang, H.Z. Bayesian degradation analysis with inverse Gaussian process models under time-varying degradation rates. IEEE Trans. Reliab. 2017, 66, 84–96. [Google Scholar] [CrossRef]
  16. Naumann, M.; Schimpe, M.; Keil, P.; Hesse, H.C.; Jossen, A. Analysis and modeling of calendar aging of a commercial LiFePO 4/graphite cell. J. Energy Storage 2018, 17, 153–169. [Google Scholar] [CrossRef]
  17. Rodrigues, M.T.F.; Sayed, F.N.; Gullapalli, H.; Ajayan, P.M. High-temperature solid electrolyte interphases (SEI) in graphite electrodes. J. Power Sources 2018, 381, 107–115. [Google Scholar] [CrossRef]
  18. Ploehn, H.J.; Ramadass, P.; White, R.E. Solvent diffusion model for aging of lithium-ion battery cells. J. Electrochem. Soc. 2004, 151, A456–A462. [Google Scholar] [CrossRef]
  19. Ramadass, P.; Haran, B.; White, R.; Popov, B.N. Capacity fade of Sony 18650 cells cycled at elevated temperatures: Part I. Cycling performance. J. Power Sources 2002, 112, 606–613. [Google Scholar] [CrossRef]
  20. Li, Z.; Lu, L.; Ouyang, M.; Xiao, Y. Modeling the capacity degradation of LiFePO4/graphite batteries based on stress coupling analysis. J. Power Sources 2011, 196, 9757–9766. [Google Scholar] [CrossRef]
  21. Keil, P.; Jossen, A. Charging protocols for lithium-ion batteries and their impact on cycle life—An experimental study with different 18650 high-power cells. J. Energy Storage 2016, 6, 125–141. [Google Scholar] [CrossRef]
  22. Groot, J.; Swierczynski, M.; Stan, A.I.; Kær, S.K. On the complex ageing characteristics of high-power LiFePO4/graphite battery cells cycled with high charge and discharge currents. J. Power Sources 2015, 286, 475–487. [Google Scholar] [CrossRef]
  23. Liu, G.; Lu, W. A Model of Concurrent Lithium Dendrite Growth, SEI Growth, SEI Penetration and Regrowth. J. Electrochem. Soc. 2017, 164, A1826–A1833. [Google Scholar] [CrossRef] [Green Version]
  24. Deshpande, R.; Verbrugge, M.; Cheng, Y.T.; Wang, J.; Liu, P. Battery cycle life prediction with coupled chemical degradation and fatigue mechanics. J. Electrochem. Soc. 2012, 159, A1730–A1738. [Google Scholar] [CrossRef]
  25. Guan, T.; Sun, S.; Yu, F.; Gao, Y.; Fan, P.; Zuo, P.; Yin, G. The degradation of LiCoO2/graphite batteries at different rates. Electrochim. Acta 2018, 279, 204–212. [Google Scholar] [CrossRef]
  26. Birkl, C.R.; McTurk, E.; Roberts, M.R.; Bruce, P.G.; Howey, D.A. A parametric open circuit voltage model for lithium ion batteries. J. Electrochem. Soc. 2015, 162, A2271–A2280. [Google Scholar] [CrossRef]
Figure 1. Calendar life testing data. (a) LiFePO4 (LFP) batteries were tested under three temperatures (60 °C, 40 °C, and 25 °C) and three state of charges (SOCs) (100%, 50%, and 0%) with an experiment duration of over 885 days. “SOC 100, 60 °C” refers to LFP batteries were stored at SOC 100% and 60 °C. The detailed testing information can be referred to [16]. (b) “SOC 100, 50 °C” refers to LCO batteries were stored at SOC 100% and 50 °C in a temperature chamber. All batteries underwent capacity testing and impedance measurement every 3 weeks. Capacity and impedance characterization: Batteries were constant charged at a rate of C/2 to 4.2 V, then constant voltage charged until the current fell below C/100 rate. The batteries were discharged at a rate of C/2 to 2.75 V to measure the deliverable maximum capacity. Then, the batteries were fully charged using the same constant current constant voltage (CCCV) profile followed an impedance measurement.
Energies 11 03295 g001
Figure 2. Derating of temperature for calendar life. (a) Capacity loss vs. temperature. (b) Derating factor vs. temperature. The derating factors were calculated according to Equation (3).
Energies 11 03295 g002
Figure 3. Derating of SOC for calendar life. (a) Capacity loss vs. SOC. (b) Derating factor vs. SOC, and the derating factors are calculated according to Equation (3).
Energies 11 03295 g003
Figure 4. Battery cycle degradation data under various temperatures. (a) Capacity loss vs. cycles for battery A, “25 °C, C/5, 0.7C” refers to charge cut-off current C/5, charge C-rate 0.7C under 25 °C. (b) Capacity loss vs. cycles for battery B, “RM, 1 A/1 A” refers to charge/discharge current 1 A under room temperature. (c) Capacity loss vs. cycles for battery G, “30 °C, C/3, 3.65 V, 4C, 2.0 V” refers to cells charged constant current (CC) C/3 to 3.65 V, discharged CC 4C to 2.0 V under 30 °C. (d) Capacity loss vs. total capacity throughput for battery P, “23.5 °C, 1C/1C” refers to charge/discharge C-rate 1C under 23.5 °C. The degradation is presented as a function of total capacity throughput over the entire cycle life, the unit is kiloampere hour (kAh).
Energies 11 03295 g004
Figure 5. Derating of temperature. (a) and (c) are for capacity loss vs. temperature, (b) and (d) are for derating factor vs. temperature.
Energies 11 03295 g005
Figure 6. The effects of charge cut-off current and discharge C-rate on derating of temperature. (a) Derating factor of temperature vs. charge cut-off current; (b) Derating factor of temperature vs. discharge C-rate.
Energies 11 03295 g006
Figure 7. Battery cycle degradation data under various discharge C-rates. (a) Battery O charged CC 1C to 4.2 V, constant voltage (CV) to 90 mA, discharged CC to 2.75 V under 25 °C. (b) Battery G. (c) Battery P.
Energies 11 03295 g007
Figure 8. Derating of discharge C-rate. (a,c) are for capacity loss vs. discharge C-rate, (b,d) are for derating factor vs. discharge C-rate. (a) “A cell, 200 cycles, 25 °C, C/5” refers to the capacity loss of battery A at 200 cycles under 25 °C and charge cut-off current C/5. (c) “G cell, 60 cycles, C/3, 3.65 V, discharge C-rate, 2.0 V” means the capacity loss of battery G at 60 cycles, the battery charged at constant current C/3 to 3.65 V, and discharged to 2.0 V. “P cell, 3 kAh, 3.75C (35.6 °C)/1C (33.5 °C)” refers to the capacity loss of battery P at capacity throughput 3 kAh, the battery discharged at 3.75C under 35.6 °C, and discharged at 1C under 33.5 °C.
Energies 11 03295 g008
Figure 9. Battery cycle degradation data under various charge C-rates. (a) “J cell, 1 A (0.9C)” refers to battery J charged CC 1 A (0.9C) to 4.1 V, CV to 100 mA (C/11), and finally discharged CC 3 A (2.7C) to 2.5 V under temperature 25 °C. “K cell, 1 A (0.9C)” refers to battery K charged CC 1 A (0.9C) to 3.6 V, then CV to 100 mA; discharge: CC 3 A (2.7C) to 2.0 V under 25 °C. (b) Battery O charged CC to 4.2 V, CV hold 2.5 h, discharged CC 1C to 2.75 V under temperature 25 °C. (c) Battery G. (d) Battery P.
Energies 11 03295 g009
Figure 10. Derating of charge C-rate. (a) Capacity loss. (b) Derating factor.
Energies 11 03295 g010
Figure 11. Derating of charge cut-off current. (a) Capacity loss vs. charge cut-off current. (b) Derating factor vs. charge cut-off current.
Energies 11 03295 g011
Figure 12. Battery cycle degradation data under various charge cut-off voltages. (a) “4.15 V” refers to battery J charged at CC 3 A (2.7C) to 4.15 V, then CV to 100 mA (C/11), and finally discharged at CC 3 A to 2.5 V under 25 °C. (b) “3.65 V” refers to battery K charged at CC 3 A (2.7C) to 3.65 V, then CV to 100 mA (C/10), and finally discharged at CC 3 A (2.7C) to 2.0 V under 25 °C.
Energies 11 03295 g012
Figure 13. Derating of charge cut-off voltage. (a) Capacity loss vs. cut-off voltage. (b) Derating factor vs. cut-off voltage.
Energies 11 03295 g013
Table 1. Battery specifications.
ChemistryNominal Capacity (Ah)Charge Cut-Off Voltage (V)Discharge Cut-Off Voltage (V)
Graphite/LFP [16]3.03.62.0
Graphite/LCO1.54.22.75
Table 2. Battery samples and derated stresses [19,20,21,22].
Derated StressesChemistryBatteryLevels of Derated Stresses
TemperatureLCOA10 °C, 25 °C, 45 °C, 60 °C
B25 °C, 45 °C, 50 °C, 55 °C
LFPG45 °C, 30 °C
P29.2 °C, 35.6 °C, 52.8 °C
Discharge C-rateLCOA0.7C, 1.0C, 2.0C
O1C, 1.1C, 1.3C, 1.5C, 2.0C
LFPGC/3, 4C
P1C, 3.75C
Charge C-rateLCOJ1A (0.91C), 3A, 5A (4.5C)
O1C, 1.2C, 1.4C
LFPK1A (0.91C), 3A, 5A (4.5C)
GC/3, 1.5C
P1C, 3.75C
Charge cut-off currentLCOAC/5, C/40
O0 min, 28 min, 53 min, 100 min
Charge cut-off voltageLCOJ4.15 V, 4.1 V, 4.05 V, 4.0 V, 3.9 V
LFPK3.65 V, 3.6 V, 3.55 V, 3.5 V, 3.4 V
Table 3. Battery specification and testing information.
BatteryBattery SpecificationsStressTesting Procedures and Conditions
ANormal capacity: 3.36 Ah
Cut-off voltage: 4.4 V/3.0 V
Positive electrode: LCO
Negative electrode: graphite
Temperature:
25 °C, 45 °C, 60 °C
Charge: CC 1.5C to 4.2 V, CV to 1C, then CC 1C to 4.4 V, CV to Ccut-off
Discharge: CC C
discharge to 3.0 V
Charge cut-off current (Ccut-off): C/5, C/40
Discharge constant current (Cdischarge): 0.7C, 1.0C, 2.0C
Charge cut-off current:
C/5, C/40
Discharge constant current:
0.7C, 1.0C, 2.0C
B
[19]
Normal capacity:1.8 Ah
Cut-off voltage: 4.2 V/2.0 V
Positive electrode: LCO
Negative electrode: carbon
Temperature:
25 °C, 45 °C, 50 °C, 55 °C
Charge: CC 1 A to 4.2 V, CV to 50 mA; discharge: CC 1 A to 2.0 V under 25 °C, 45 °C, 50 °C, and 55 °C.
G
[20]
Nominal capacity: 11 Ah
Cut-off voltage: 3.65 V/2.0 V
Positive electrode: LFP
Negative electrode: graphite
Temperature: 45 °C, 30 °C(1) Charge CC C/3 to 3.65 V, then CV to C/10; discharge CC C/3 to 2.0 V under 45 °C.
(2) Charge CC C/3 to 3.65 V, then CV to C/10; discharge CC 4C to 2.0 V under 30 °C.
(3) Charge CC 1.5C to 3.65 V, then CV to C/10; discharge CC C/3 to 2.0 V under 30 °C.
(4) Charge CC C/3 to 3.65 V, then CV to C/10; discharge CC 4C to 2.0 V under 45 °C.
(5) Charge CC 1.5C to 3.65 V, then CV to C/10; discharge CC C/3 to 2.0 V under 45 °C.
(6) Charge, CC 1.5C to 3.65 V, then CV to C/10; discharge CC 4C to 2.0 V under 30 °C.
Charge C-rate: 1.5C, C/3
Discharge C-rate: 4C, C/3
J
[20]
Nominal capacity: 1.1 Ah
Cut-off voltage: 4.1 V/2.5 V
Positive electrode: LiNiCoMnO2 + LCO
Negative electrode: graphite
Charge C-rate: 1 A, 3 A, 5 ACharge CC 1/3/5 A to 4.1 V, then CV to 100 mA; discharge CC 3 A to 2.5 V under 25 °C.
Charge cut-off voltage:
4.15 V, 4.1 V, 4.05 V, 4.0 V, 3.9 V
Charge CC 3 A to CV, then CV to 100 mA; discharge CC 3 A to 2.5 V under 25 °C.
K
[21]
Nominal capacity: 1.1 Ah
Cut-off voltage: 3.6 V/2.0 V
Positive electrode: LFP
Negative electrode: graphite
Charge C-rate: 1 A, 3 A, 5 ACharge CC 1/3/5 A to 3.6 V, then CV to 100 mA; discharge: CC 3 A to 2.0 V under 25 °C.
Charge cut-off voltage:
3.65 V, 3.6 V, 3.55 V, 3.5 V, 3.4 V
Charge CC 3 A to CV, then CV to 100 mA; discharge CC 3 A to 2.0 V under 25 °C.
O
[8]
Rated capacity: 900 mAh
Cut-off voltage: 4.2 V/2.75 V
Positive electrode: LCO
Negative electrode: graphite
CV charge period: 0 min, 28 min, 53 min, 100 minCharge CC 1C to 4.2V, CV hold thp; discharge CC 1C to 2.75 V under 25 °C.
Charge C-rate: 1C, 1.2C, 1.4CCharge CC to 4.2 V, CV hold 2.5 h; discharge CC 1C to 2.75 V under 25 °C.
Discharge C-rate:
1C, 1.1C, 1.3C, 1.5C, 2.0C
Charge CC 1C to 4.2 V, CV to 90 mA; discharge CC to 2.75 V under 25 °C.
P
[22]
Rated capacity: 2.3 Ah
Manufacturer: A123 Systems
Positive electrode: LFP
Negative electrode: graphite
Temperature:(1) Charge CC 1C to SOC 100%; discharge CC 1C to SOC 0% under 23.5 °C.
(2) Charge CC 1C to SOC 100%; discharge CC 1C to SOC 0% under 32.5 °C.
(3) Charge CC 2C to SOC 100%; discharge: CC 2C to SOC 0% under 26.1 °C.
(4) Charge CC 2C to SOC 100%; discharge: CC 2C to SOC 0% under 34.4 °C.
(5) Charge CC 2C to SOC 100%; discharge: CC 2C to SOC 0% under 46.9 °C.
(6) Charge CC 3.75C to SOC 100%; discharge: CC 3.75C to SOC 0%, under 29.2 °C.
(7) Charge CC 3.75C to SOC 100%; discharge: CC 3.75C to SOC 0%, under 35.6 °C.
(8) Charge CC 3.75C to SOC 100%; discharge: CC 3.75C to SOC 0%, under 52.8 °C.
(9) Charge CC 1C to SOC 100%; discharge CC 3.75C to SOC 0% under 34.1 °C.
(10) Charge CC 1C to SOC 100%; discharge CC 3.75C to SOC 0% under 25.0 °C.
(11) Charge CC 1C to SOC 100%; discharge: CC 3.75C to SOC 0% under 46.6 °C.
(12) Charge CC 3.75C to SOC 100%; discharge: CC 1C to SOC 0% under 33.5 °C.
(13) Charge CC 3.75C to SOC 100%; discharge: CC to SOC 0% under 23.3 °C.
(14) Charge CC 3.75C to SOC 100%; discharge: CC to SOC 0% under 46.7 °C.
Charge C-rate:
1C, 3.75C
Discharge C-rate:
1C. 3.75C

