Article

Cross-Border Energy Exchange and Renewable Premiums: The Case of the Iberian System

by
Juan Manuel Roldan-Fernandez
1,*,
Catalina Gómez-Quiles
1,
Adrien Merre
2,
Manuel Burgos-Payán
1 and
Jesús Manuel Riquelme-Santos
1
1
Department of Electrical Engineering, Universidad de Sevilla, Camino de los Descubrimientos, s/n, 41092 Sevilla, Spain
2
Département Génie Electrique, Polytech Nantes, 7 Boulevard de l’Université, 44600 Saint-Nazaire, France
*
Author to whom correspondence should be addressed.
Energies 2018, 11(12), 3277; https://doi.org/10.3390/en11123277
Submission received: 15 October 2018 / Revised: 19 November 2018 / Accepted: 22 November 2018 / Published: 24 November 2018
(This article belongs to the Special Issue 10 Years Energies - Horizon 2028)

Abstract

:
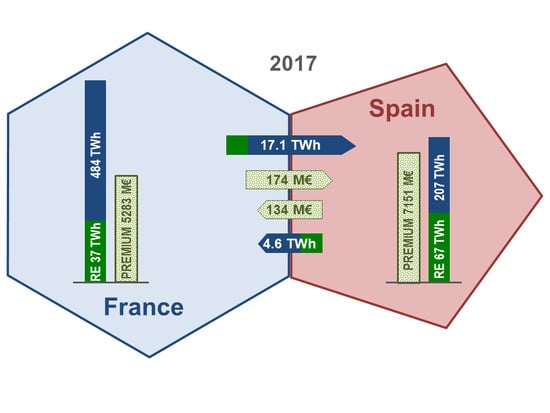
In 2002, the European Union set a target of 10% electricity interconnection capacity for 2020: a target that has been further extended to 15% by 2030. Cross-border interconnection of regional/national electricity systems will allow the EU to enhance its security of supply and to integrate more renewables into energy markets. Although the EU has a common renewable directive, every Member State has its own renewable support policy. For the case of Spain, consumers pay the renewable premium in their electricity bills; however, consumers would not be overburdened if premiums were counter-balanced with the energy-cost reduction due to the merit-order effect of renewables. When two markets are interconnected, the energy exchange through the interconnection yields certain expected rent transfers due to the market rules. However, this exchange is also accompanied by other unforeseen rent transfers related to the regional/national policies on renewables. To the authors’ knowledge, the identification and quantification of these indirect rent transfers has not been previously addressed. This paper analyses and quantifies how the premiums on regional/national renewables are distributed between neighbouring countries through cross-border exchanges. The analysis focuses on the Iberian/Spanish system and its neighbours, although the methodology could be extended to other systems. To this end, data on the market and premiums has been considered, as well as the exchanges between France, Spain, Portugal, and Morocco, for the years 2015–2017. The main finding of this work is that the Spanish system, due to the lack of a coordinated/harmonized renewable premium policy, has been “importing” about 40 M€/year of renewable premium from France and 17 M€/year from Portugal while “exporting” about 66 M€/year towards the Moroccan systems.

Graphical Abstract

1. Introduction

The energy consumption of today constitutes an increasing need that is directly related to the development of countries. Awareness of climate change is leading developed countries, those in which the capacity for planning and action is greater, to take measures to prevent global warming and the progressive pollution of the planet.
In this respect, the European Union (EU) has been planning the development of these measures for years, and has followed several energy policies in order to promote sustainable development [1]. In 1990, the EU first introduced the limitation of CO2 generation, and have recently incorporated current strategies towards achieving certain short- and medium-term objectives, such as the ‘2030 Climate and Energy Framework’, and the ‘2050 Low-Carbon Roadmap’ [2]. Long-term EU objectives consist of achieving a decrease in the greenhouse gas emissions of at least 80% by 2050 with respect to 1990 levels, for which intermediate objectives of 40% for 2030 and 60% for 2040 have been proposed. The electric sector is considered sufficiently flexible for an almost complete elimination of its emissions [3] by replacing the most polluting energies with renewable or low-polluting energies, together with a major investment in Smart Grids. For 2050, 85% of the total energy produced is expected to be renewable [4,5,6].
In order to accomplish these objectives, the development and installation of renewable energies has been boosted in recent years by various governments, through subsidies and other types of premiums. There are currently diverse points of view regarding the efficacy and convenience of these subsidies as a method for the promotion of renewables, since they can disserve free competition and increase the final costs to the consumer. However, renewables also introduce benefits into the system, since the market integration of a certain amount of renewable energy obviates the need for the market to include the most expensive and probably polluting generation units, which would otherwise have been cleared. Accordingly, the market integration of renewable energy leads to a downward pressure on clearing prices and to the improvement in air quality and climate [6,7,8,9].
Today, the EU ensures that any subsidy to a Member State complies with competition rules, as defined in the State aid rules [10], in order not to prejudice free competition, thereby allowing only those subsidies that are justified by general economic development. For instance, under this regulation, two highly efficient cogeneration plants in Germany have recently been approved [11], as has an offshore windfarm in Belgium [12].
For the optimization of the use of renewable resources, which are time-variable and not always available, the sole increase of installed renewable capacity would be insufficient, and should come together with other measures. Long-term planning for the optimization of the integration of renewable resources may consider other issues, such as the promotion of the demand response as a flexibility tool for the regional/country system, and the development of storage to time-shift the occasional overproduction by renewables that cannot be used immediately in the regional/country power system. However, the primary necessity to be considered involves the development of a strongly interconnected power system, which allows a wide range of energy exchange between countries. A strongly interconnected power system, with sufficient cross-border capacity, would provide the convergence point of the optimization of renewables and the integration of the European markets into a unified internal energy market. To this end, the EU authorities are encouraging the improvement of the capacity of the cross-border electricity interconnections. Connecting Europe’s electricity systems will allow the EU to boost its security of electricity supply and to integrate more renewables into energy markets. In 2002, the European Council set its first electricity capacity interconnection target at 10% for 2020. In May 2014, the European Commission suggested that the interconnection target should be extended to 15% by 2030 [13]. Consequently, in October 2014, the European Council called for the interconnection of at least 10% of electricity production capacity in the Member States by 2020, endorsed the 15% target for 2030, and pointed out that they will be both attained via the implementation of Projects of Common Interest in energy infrastructure. The November 2017 report on the state of the Energy Union revealed that 11 Member States have yet to reach the 10% electricity interconnection target, and, worse still, the forecast of the Commission is that four Member States (Cyprus, Spain, Poland, and United Kingdom) will fail to reach the 10% interconnection target by 2020.
The Iberian Peninsula presents a highly individual situation since, due to its geographical location, it is especially isolated. The support to the Iberian Peninsula can only come (overland) from Central Europe across the France-Spain border. This boundary has appeared for many years as one of the most congested border crossings throughout the interconnected pan-European power system, according to the European Network of Transmission System Operators for Electricity (Entso-e). Nowadays, the interconnection ratio of the Iberian Peninsula is limited to 2.8%, which includes the recent HVDC interconnection between Spain and France over the eastern Pyrenees, commissioned in 2015. For this reason, Spain and the whole Iberian Peninsula may still be considered to be almost an electricity island. Recently, on 27 July 2018 [14], a meeting took place in Brussels in which the leaders of the European Union committed to strengthening regional cooperation between Spain, France and Portugal in order to better integrate the Iberian Peninsula within the European Electricity Market. Furthermore, a grant agreement for a 280 km power line crossing the Bay of Biscay, for a total of €578 million, was also signed in the meeting, which will constitute the largest Connecting Europe Facility investment ever awarded. By 2025, the projected Bay of Biscay link, with a capacity of 2 × 1 GW, will enable an interconnection capacity of 4.8 GW (up from the existing 2.8 GW), and the interconnection ratio will approach 5%, which is still only half-way to meeting the 2020 target.

Cross-Border Interconnection of Markets

When the electrical systems of two markets/countries are connected by cross-border lines with sufficient interconnection capacity, a new interconnected market emerges. An interconnection with neighbouring countries with enough exchange capacity not only provides the interconnected systems with a greater security of supply and increases efficiency and competition between neighbouring systems, but it also enhances the integration of renewable energy. Cross-border lines also offer the opportunity to take advantage of the geographical distribution of the systems and of the differences in the patterns of social behaviour that finally determine the hourly patterns of energy consumption of the citizens of each region/nation. For example, Spain shares with France the Central European Time (UTC + 1), but while the typical peak hour in France is at 19:00 h, the typical Spanish peak is at 21:00 h. Hence, for the French-Spanish interconnection, these two hours of typical phase-shift of peak hours reduces the interconnected demand at peak-hour, thereby allowing a reduction of the transport losses and greenhouse emissions, as well as the coverage of the peak demand with a lower generation capacity.
As a result of the interconnection, an energy flow runs through the interconnection lines from the market with the lowest price (in a general case of two markets with similar generation mixes, probably the market with a higher proportion of renewables) to the market with the highest price, thereby levelling the price across the whole interconnected market. Although the overall welfare of the interconnected market is higher, there are changes affecting the different agents, including rent transfer between the agents.
The consumers of the formerly cheaper market experience an increment of the new interconnected cleared price. In contrast, the generators of the cheaper market experience a twofold increment of their income, since they sell more energy at a higher price thanks to more generator units being cleared in the interconnected market (those with a marginal price over the initial clearing price but under the interconnected price).
In the more expensive market, its customers experience a reduction of the price, while the generators suffer a twofold income reduction since they sell less energy (the more expensive generators, those with marginal price over the interconnected price, are replaced by generators of the other market with lower marginal prices) and at a lower price.
As can be observed, the interconnection of the markets gives rise to a cross rent transfer from customers of the cheaper market and from generators of the expensive market towards customers of the expensive market and generators of the cheaper market. This is the expected behaviour of the market performance, thanks to which the overall welfare of the new interconnected market is increased.
In the EU, although there is a common directive for renewables, every country has its own support policy to promote renewable energy production. In the case of Spain, consumers have to pay the premium for renewables in their electricity bills. The underlying idea of this extra-market policy is that the more renewable energy is integrated into the market, the lower the wholesale price of electricity becomes in the market, since the cheaper generators of renewables will replace the more expensive conventional generators which would otherwise be the marginal units. This is the well-known merit-order effect of renewables [15,16,17]. As long as the premium for renewables does not exceed the price reduction in the market, then consumers are not overburdened in their bills [18]. Consequently, this policy of incentives for renewables allows the several objectives to be achieved, such as the development of a regional/national green industry, the creation of employment in this sector, and the reduction of CO2 emissions and environmental pollution [19]. All these objectives could theoretically be reached without any additional cost for consumers.
However, as can be observed, the energy transfer through the cross-border interconnection triggers another extra-market rent-transfer mechanism related to the premiums of renewables which, unlike the market, is not regulated or harmonized on a common base, since each country has its own regulations or support schemes.
In the interconnected market, the consumers of the formerly cheaper market have to pay the premiums of the renewable generators in their country, in accordance with their national policy (as before the interconnection), but now they do not fully profit from the merit-order effect, since now the load supplied to the other side of the cross-border line increases the new marginal price. When the markets are interconnected, the renewable generators of the formerly cheaper market no longer substitute the more expensive conventional generators in their own country. In fact, more conventional generators now need to be dispatched to feed the transnational load. Those renewable generators now replace the more expensive generators, but in the other market. In this respect, part of the reduction of CO2 emissions and other environmental improvements are also “exported” through the interconnection.
The physical flow of energy running through the cross-border interconnection lines yields a number of expected rent transfers between agents due to the market rules. That same energy flow, however, is accompanied by other, initially unforeseen types of rent transfers (and environmental effects) that are related to the various national promotion policies of renewables (and other policies), which are different in each country.
In summary, the flow of energy that runs through the interconnection line involves feeding part of the load of one country with generators of the other country. However, due to the differences in support policies for renewables (and other policies), the interconnection also allows part of the premium of renewables, paid by customers of one system, to be transferred to the other side of the border.
Several authors suggest that cooperation regarding cross-border renewables could save billions of euros in the EU, whereby cooperation is understood as the help of foreign countries to meet targets [20]. Only Sweden has embarked on a common renewable energy development plan with Norway, setting up a renewable-energy trading mechanism and common policies [21]. Although concerns about the cross-border effects of renewable energy exchange are present in these studies, no economical quantifications have been found prior to the recent study [22]. The latter highlights the importance of cross-border collaboration in order to make better use of renewable resources at a lower cost. It points out the drawbacks the different national policies and regulations mean, and quantifies the cost they entail for the onshore wind projects of the Pentalateral Energy Forum region, and suggests steps for addressing said drawbacks.
The main objective of this work is to analyse and quantify how the government premiums of renewable energies are distributed between neighbouring countries through the energy exchange at the interconnections. The analysis is focused on the Spanish system and its neighbours, for the three-year period 2015–2017, using the data currently available. This work arises in the context of the project “Optimization of the Planning of the Interconnections for the Integration of the European Market with High Renewable Penetration Level” [23]. This R&D project involves, among other things, the study of the convenience that the homogenization of the rules of the internal market were accompanied by the coordination of the policies of support for renewable energies as well as of other policies related to the EU package on climate and energy. Nevertheless the interest of the authors in the side-effects of the cross-border interconnection links started a few years ago with the development of GEMS (Grid-Constrained Electric Marked Simulator) [24], a software package that reproduces the rules of the market clearing algorithm, EUPHEMIA (EU Pan-European Hybrid Electricity Market Integration Algorithm), and the coupling between the daily electricity markets in Europe. All this previous work indicates that the effect of policies for the support of renewables (and other energy-related policies) through economic incentives could collide with the free competition in the market and are not neutral for the economic agents and citizens of the interconnected markets.
Subsequent to this introduction, the content of the paper is as follows. First the Spanish/Iberian cross-border energy exchange and the policies to promote renewable generation in the interconnected systems of southwestern Europe are briefly surveyed. Section 3 is dedicated to the methodology for the calculation of the exchange of renewable generation between the Spanish system and its neighbouring systems as well as to the evaluation of the corresponding “exchange” of premiums to renewables. A summary of the main results for the three-year period 2015–2017 and a short discussion of the results are included in the following section. The paper closes with the main findings of the work.

2. An Overview of the Iberian/Spanish Cross-Border Exchanges

The Spanish continental electricity system is interconnected with the corresponding systems of France, Andorra, Portugal, and Morocco, as can be seen in Figure 1, adapted from [25]. This figure shows the number of circuits and their corresponding rated voltages on cross-border transmission lines (as of 31 December 2017) in the southwestern ENTSO-E area, as well as the annual energy exchange for 2017 [26].
Figure 2a shows the duration curves of the degrees of utilization of the commercial interchange capacities of the cross-border interconnections between Spain and France, Portugal and Morocco, while Figure 2b shows the annual percentage of days with and without congestion in the interconnections France-Spain and Spain-Portugal for the year 2017 [26]. According to the 2017 System Report of REE (Red Eléctrica de España, the Spanish Transport System Operator) [26], the exchange capacity in the interconnection with France was mainly congested in the direction of importing electricity (France to Spain). The exchange capacity utilization rate was in excess of 95% for nearly 2/3 of the days. More precisely, in 2017, the interconnection capacity was congested in the direction of France to Spain for 65.89% of the days of the year, while the congestion was in the direction Spain to France for 9.36% of the days.
The annual balance of the exchanges in the interconnection with Portugal was also as an importer (Portugal to Spain). Nevertheless, unlike the interconnection with France, the better fit of the cross-border Portuguese interconnection remained without congestion for 93.31% of the days. In 2017, the interconnection capacity was congested in the Portugal-to-Spain direction for only 2.19% of the days, while the congestion was in the Spain-to-Portugal direction for only 4.50% of the time.
The annual evolution of the international exchanges with the Spanish system can be seen in Figure 3. In 2015, when the net balance was almost null, there was a change in the net balance trend of the Spanish energy exchange. Until 2015, in fact for more than a decade, the net balance had an exporter sign but, from that year onwards, the net balance has been reversed and has become an importer.
This change in the Spanish net balance trend can be related to two main factors: on the one hand, the growth of Spanish demand due to the improvement in economic activity; and, on the other hand, the progressive cessation of operations and the withdrawal of certain small, nuclear, coal-fired, and cogeneration plants that have occurred in recent years.
As can be observed, in 2017, the electricity exchange of Spain with the interconnected countries had a net import balance for the second consecutive year, and presents a clearly growing trend over the last 3-year period of about 4.52 TWh/year (over the 4.29 TWh/year of average rate for the five-year period 2013–2017). The greater bidirectional exchanges take place with France and Portugal. The net exchange balance with France and Portugal are both positive (import). Conversely, the Moroccan system always imports energy from Spain, as does that of Andorra, although the exchange with Andorra is relatively small (less than 0.3 TWh/year) and has therefore been disregarded in this work.

State of the Energy Scenario and Policies to Promote Renewable Energies in the Countries Involved

Although there is a common renewable energy directive that sets a compulsory target of 20% final energy consumption from renewable sources by 2020, every EU State Member is committed to reaching their own national targets for renewables, by following their own strategy for the promotion of Renewable Energy (RE). In this section, the renewable policies of the countries under study are summarized. Henceforth, when referring to Spain (SP), France (FR) and Portugal (PT), we will only refer to the continental territories, since these are the interconnected areas.
In Spain, up to 2012, the installation of renewable technologies was strongly boosted by a highly favourable incentive policy. However, in 2012, given the ‘tariff deficit’ of the country, whereby these incentives towards renewables constitute one of the highest costs of the electricity system, and given the additional pressure to balance the costs of the system due to the economic crisis, the government decided to suspend aid for new plants [27]. In 2013, in a more drastic reform, the government adopted measures to guarantee the financial stability of the electricity system. As a result, support for renewables was also eliminated for those installed plants that surpassed what the government considered to be a reasonable level of profit [28,29]. Since then, producers have been compensated with a supplement to the investment based on certain indices linked to 10-year Treasury bonds. This type of support has led to high uncertainty for the investors, which in turn has led to a deceleration of the installation of renewables in this country in recent years [30].
Regarding the cross-border interconnections between France and Spain, the capacity was limited to 1400 MWh until October 2015, when the capacity was doubled thanks to a new interconnection, named Inelfe (INterconnexion Électrique France-Espagne). This constitutes a major technological achievement, and theoretically allows the transport of power along 64.5 km through the Pyrenees in DC (world record at the time) thanks to Voltage Source Converter (VSC) technology [31].
In Portugal, FiT (Feed-in Tariff) remuneration was active until November 2012. Later, until 2015, renewable generators could opt for a general regime on the Wholesale Electricity Market, or for a guaranteed remuneration system dependent on a public tender. However, related to the latter option, no rules have ever been published, nor has any initiative been launched [32]. Since January 2015, a specific regime for small production and self-consumption has been implemented. Furthermore, in April 2015, a 25-year state subsidy for ocean energy technologies was authorized by the European Commission [33].
France promotes renewable sources in three different ways: feed-in tariff, a premium tariff, and tenders for the definition of the premium tariff level. Renewable sources can also draw advantages from tax benefits [34,35].
In Morocco, the main renewable resources are wind and sun. The new projects are assigned through auctions in which the installed capacity is tendered, following the country’s renewable energy target. Two main entities are in charge of managing this process: Office National de l’Electricité (ONE), and Moroccan Agency for Solar Energy (MASEN), responsible for auctioning wind and solar PV capacities, respectively [36]. Since this country is a net electricity importer, no data on renewable-energy policies or subsidies have been required for the analysis reported in this document.

3. Methodology

Hourly data on energy exchange between Spain and its neighbouring countries and annual premiums to renewables corresponding to France, Spain, Portugal, and Morocco, for the three-year period 2015–2017, as well as the corresponding premium paid for renewable-energy generation in every country, are the main information used in this work. Data on hourly energy exchange have been gathered from IESOE, the Electricity Interconnection in southwestern Europe while the information on renewable-energy premiums has been collected from every national agency: CRE, the French Energy Regulatory Commission, CNMC, the National Commission of Markets and Competition of Spain, and ERSE, the Energy Services Regulatory Authority of Portugal.
Hourly energy exchange data (about 26,300 hourly data items per country), available in Excel format, joined with the information remainder has been processed using Matlab. Finally tables and graphs have been created with both Excel and Matlab.

3.1. Hourly Exchange of Renewable Generation Between Countries

The methodology followed to calculate the hourly exchange of renewable generation is based on the assumption of proportionality between the energy mix through the cross-border interconnections and the total energy mix of a country. Accordingly, the estimation of the hourly renewable energy exchange between Spain and each of its neighbouring countries has been based on the hourly energy exchange from Spain to the considered country and the hourly renewable penetration in the Spanish system, that is, the ratio between the hourly renewable-energy generation and the hourly total production of Spain. Given the hourly energy exchange between Spain and its neighbouring countries [37], and the hourly generation of these countries [38], the hourly exchange of the generation of renewable energy between countries A (Spain, for example) and B (France, Portugal or Morocco) can be calculated through the following expression:
E h R E ) A B = E h ) A B · i h ) A B · E h R E ) A E h ) A ,
where E h R E ) A B represents the energy flow exchange at hour h, in MWh, from country A to country B (AB) coming from renewable (RE) generation. The rest of the variables are defined as follows:
  • E h ) A B : hourly net energy exchange between countries A and B (MWh)
  • i h ) A B : binary variable indicating the direction of the hourly flow from country A to country B: i h ) A B = 1 if country A is supplying; i h ) A B = 0 if country A is receiving
  • E h ) A : hourly energy generation in country A (MWh)
  • E h R E ) A : hourly renewable energy production in country A (MWh)
Note that variable E h R E ) A B takes a 0 value if country A is receiving energy from country B ( i h ) A B = 0 ).
The annual amount of renewable energy produced in the system of country A and exchanged with any other country, B, can now be evaluated as:
E y R E ) A B = h = 1 8760 E h R E ) A B = h = 1 8760 E h ) A B · i h ) A B · E h R E ) A E h ) A ,
where E y R E ) A B represents the annual renewable-energy flow exchange (exportation) from country A to country B (AB) throughout the year y.

3.2. Exchange of Premiums Given to Renewable Generation

The estimation of the hourly premium exchange due to exportation of renewable energy between Spain and each of its neighbouring countries is based on the hourly energy exchange from Spain to the considered country, the hourly renewable penetration in the Spanish system, and the hourly premium to renewable production of Spain. Given the hourly energy exchange between Spain and its neighbouring countries [37], the hourly generation of these countries [38], and its hourly premium to renewable generation, then the hourly exchange of premiums given to renewable energy between countries A and B can be calculated through the following expression:
M h ) A B = p h R E ) A · i h ) A B · E h ) A B · E h R E ) A E h ) A ,
where M h ) A B represents the renewable premium flow exchange (€) at hour h, from country A to country B (AB), and p h R E ) A represents the amount of premium per unit of renewable energy produced (€/MWh) paid in country A, at hour h.
The annual amount of renewable premium paid in the system of the county A and exchanged or exported to any other country, B, can now be evaluated as a sum for the 8760 h of the year:
M y ) A B = h = 1 8760 M h ) A B = h = 1 8760 p h R E ) A · i h ) A B · E h ) A B · E h R E ) A E h ) A
where M y ) A B represents the annual renewable premium flow exchange (exportation) from country A to country B in the year y.
The Energy Services Regulatory Authority of Portugal (ERSE) publishes the monthly total payment (income from market + premiums) to the renewable-energy generators in Portugal [39]. Accordingly, the total annual amount of premiums from the Portuguese Government to renewable producers, M y R E ) P T , has been estimated based on the monthly total payment (income from market + premiums) to the renewable-energy generators in Portugal [39], I m R E T ) P T , the monthly renewable energy generated, E m R E ) P T , and the monthly averages of the Electricity Market prices in Portugal [40], p m M ) P T . In this way, the monthly revenues coming from the electricity market, I m R E M ) P T , have been calculated by multiplying the average monthly prices and the monthly energy generated by these technologies:
I m R E M ) P T = E m R E ) P T · p m M ) P T .
The monthly amount of premiums to renewables, M m R E ) P T , has been calculated as the difference between the total of the revenues and the income from the market:
M m R E ) P T = I m R E T ) P T I m R E M ) P T = I m R E T ) P T E m R E ) P T · p m M ) P T .
And the total annual amount of premiums, M y R E ) P T , are given by:
M y R E ) P T = m = 1 12 M m R E ) P T
In France and Spain, since the information concerning the premiums and the FiT paid to the renewable generation per country is only available on a yearly base [35,41], the hourly amount of premium to the renewables per unit of renewable energy production (€/MWh) paid in country A, at hour h, has been estimated as an average value:
p h R E ) A p h R E ) A   A V E R A G E = M y ) A E y R E ) A ,
where M y ) A is the total annual amount of premium to the renewable production (€), and E y R E ) A is the total annual amount of renewable production (MWh) in country A. Accordingly, the annual renewable premium flow exchange (exportation) from country A to country B during the year y, is estimated as:
M y ) A B = h = 1 8760 p h R E ) A · i h ) A B · E h ) A B · E h R E ) A E h ) A M y ) A E y R E ) A · h = 1 8760 i h ) A B · E h ) A B · E h R E ) A E h ) A .
It should be mentioned that 2016 was a leap year, and hence the 8760 h of a normal year in Equations (2), (4) and (5) should be changed to 8784 h for that leap year.

4. Results and Discussion

The yearly amount of premiums to renewable production for Spain, France, and Portugal, for the years 2014 to 2017 are given in Figure 4. In Figure 4a, the yearly premiums for renewables, M y ) A , are represented for Spain, France and Portugal. It can be observed that Spain is the country with the greatest amount of premiums, followed by France. While the annual premiums in Spain and Portugal remain reasonably constant, the case of France exhibits a clear growing trend throughout these last four years.
In Figure 4b, the amount of renewable premium per capita (€/person) is shown [42]. As can be observed, Spain continues to be in the lead regarding the premium given to renewables per capita. However, in Portugal, the premiums per inhabitant clearly surpass that in France, and are nearly of the same order as that in Spain.
Regarding the renewable production, in France, wind generation data has been recorded only since December 2014, which shortens the study to the years 2015 to 2017. Therefore, for the sake of comparison, the rest of the analyses are also focused on the years 2015 to 2017.
Regarding the energy exchanges, Figure 5 shows the yearly percentages of the directions of the energy flow between countries. As can be observed in Figure 5a, for approximately 80% of the time, the energy flows from France to Spain; while in Figure 5b, it flows from Spain to Portugal around 50% of the time, but with more fluctuation; and in Figure 5c, from Spain to Morocco for 100% of the time. The Spanish importation of energy from France and Portugal exhibits opposite trends, as can be observed when comparing Figure 5a,b. When the Spanish importation from Portugal grows, as happened in 2016, the importation from France diminishes.
Figure 6 shows the histograms of the hourly percentage of renewable penetration in Spain (a), France (b), and Portugal (c), for 2017. The renewable penetration has been calculated as the ratio of hourly renewable generation divided by the total hourly generation: 100 · ( E h R E / E h ) . Very similar hourly histograms of renewable production have been obtained for the years 2015 and 2016.
Certain relevant statistics from the histograms of hourly renewable penetration in the three countries, illustrated in Figure 6, have been highlighted in Table 1. As can be observed, Spain and Portugal have very similar median and mean values of hourly renewable penetration, and Portugal stands out as attaining the maximum values, by surpassing 87% of renewable penetration. Furthermore, the standard deviation in Portugal is also greater than in the other countries. France presents very low median and mean values, which can probably be related with the large proportion of nuclear generation in its power mix, which has obviated the need for the development of a great amount of wind power production.
Considering that the hourly percentage of renewables exchanged are the same as those of renewable penetration in the exporting country, the amount of hourly renewables exchanged, E h R E ) A B , has been calculated following Equation (1). The annual amount of renewable exchanged between two counties, E y R E ) A B , has been calculated as the sum of the hourly exchanges for the 8760 h of the year, according to (2), and this has been represented in Figure 7 for: (a) Spain-France; (b) Spain-Portugal; and (c) Spain-Morocco.
As shown in Figure 7a, the amount of renewables exchanged between Spain and France almost doubled in 2017 with respect to 2015. In 2016, Spain supplied more renewable energy to France, while in 2017, the larger flow of renewables was in the opposite direction. As can be seen in Figure 7b, Portugal sent more renewable energy to Spain in the years 2016 and 2017, while in Figure 7c, it can be appreciated that the renewable flow between Spain and Morocco is always in the same direction, towards Morocco.
The annual amount of renewable premiums (M€) that has been used to generate exported renewable energy has been calculated with Equation (5). Since the receiving country is benefitting from this renewable energy, we could say this premium has somehow ‘transferred’ through the interconnection exchange. The annual amounts of renewable premium ‘exchanged’ are represented in Figure 8.
The annual net amounts of renewable premiums (M€) exported through each cross-border interconnection are summarized in Table 2, for the three-year period considered, 2015–2017. As shown in Table 2, a net annual flow of renewable premiums has been sent from France to Spain while a net annual flow of renewable premiums has been sent from Spain to Morocco. The exchange Spain-Portugal fluctuates since the flow was from Spain to Portugal in 2015 but it has reversed in 2016 and 2017.
The results in Table 2 show that the Spanish system is profiting from an average net exchange (import) of more than 40 M€/year of renewable premium from the French system, and about 17 M€/year from the Portuguese system, while “exporting” about 66 M€/year to Morocco. The results also show that, while in 2015, the Spanish system “exported” a net amount of almost 115 M€ of renewable premiums to the neighbouring interconnected systems, from 2016 the situation reversed, and in that year the Spanish system “imported” a net amount of about 40 M€ of renewable premiums and about 48 M€ in 2017.
It is interesting to observe that at present, even though the Franco-Spanish cross-border interconnection is congested in the direction from France to Spain for about 2/3 of the year, the Spanish “importation” of renewable premium from France shows an average annual growing trend with a rate of about 31 M€ a year. This is the current situation when the actual Franco-Spanish interconnection capacity is limited to less than 3%. Accordingly, if the objective of 10% of interconnection capacity had already been reached, then the “imports” of premiums to renewables from France would have been greater, and they would be even higher when the new 15% target had been reached.

Discussion

The main limitation of the results presented in this work is probably the evaluation of the hourly renewable premium of each country, and p h R E ) A , which has been based on an annual average value depending only on the MWh generated, regardless of the type of renewable technology and the possible specific remuneration policies. The premium to the renewable production of a country depends on both the technologies of the renewable-energy plants (wind, solar, etc.) that are participating in the market, and the amount of production of every kind of plant. Each renewable technology has a different level of incentives and those incentives can be limited when the hourly clearing market price exceeds a cap price that warranties the profitability of the technology. For example, in the case of Spain, solar PV production (a 2.2% share of the total peninsular production in 2017) has had an average premium of 300.48 €/MWh in 2017, while wind production (with a share of 19.1% of the total peninsular production in 2017) received an average premium of 41.91 €/MWh. The meaning of these figures can be better appreciated when compared to the average price of energy in 2017 which amounted to 60.6 €/MWh (the second highest price since 2008 when the all-time maximum price of 69.6 €/MWh was registered).
Nevertheless, as was explained in Section 3.2, it has been necessary to adopt this simplification (national hourly renewable premium based on an annual average value) because the amount of premium to renewable production is only available on a common annual basis.
Another interesting issue to address in the future is the possible effect of the interconnection capacity on the flow of renewables and the flow of renewable premiums. As mentioned before, even though the French-Spanish interconnection is almost saturated for approximately 2/3 of the days a year, the “importation” of the premium for renewables from Spain shows a clearly growing trend, since it rose from almost 29 M€ in 2015 up to about 90 M€ in 2017. At this point, it is interesting to consider what will happen when 5% of interconnection capacity has been reached, following the commissioning of the future Bay of Biscay link (expected by 2025), or when the objectives of 10% of interconnection capacity has been reached. For the first milestone, when the interconnection capacity is almost doubled, and taking into account the high degree of saturation of the interconnection, the “imports” of premiums from France could be estimated by means of extrapolating the results of the period 2015–2017. Accordingly, the “imports” of renewable premiums from France would reach the amount of approximately 640 M€ for the year 2025.
As mentioned before, the flow of energy running through the cross-border interconnection lines involves feeding part of the load of one country with generators of the other country. Accordingly, more conventional generation is needed in the exporter system to feed the extra load transferred from the importer system. Consequently, part of the beneficial environmental effects of the integration of renewables in the exporter system, such as the reduction of CO2 emissions and other greenhouse gases, is also exported through the cross-border interconnection lines. This “exchange” of environmental effects, in the opposite direction to the flow of renewables, supposes a cost for the exporting system in terms, for example, of hindering compliance with the national objective of reducing CO2 emissions (Spain is not well placed in this ranking). It also involves a cost in terms of degradation of the nature and environment, as well as in the health of its citizens. This would be the case of Spain from 2003 to 2015 when the Spanish system had a net export exchange towards France. From 2016 onwards, the situation reversed and the Spanish system became a net importer from France. Since then, and given the high share of nuclear production of the French system, the amount of energy exported towards Spain has incremented the amount of nuclear waste in the French system.
As a continuation and extension of the present work, all those other unforeseen “exchanges” derived from the interconnections and influences of the enlarged interconnection capacity will be analysed and evaluated in the future. The remuneration policies of the various renewable technologies will also be considered when more detailed information becomes publicly available.

5. Conclusions

This work has analysed and quantified how the regional/national premiums for renewable energy are distributed between neighbouring countries through the cross-border energy exchange, as a result of the differences in the energy mix of the regional/national markets and in the premiums for policies of renewable energy. The analysis was centred on the Iberian/Spanish system and its neighbours, for the three-year period 2015–2017, although the proposed methodology can be extended to other interconnected systems. The results have shown that, due to the lack of a coordinated common energy policy with its neighbouring systems, and in spite of its high capacity for renewable energy and high level of premiums to renewables of the Spanish national policy, the Spanish system is profiting from an average net exchange of about 40 M€/year of renewable-energy premiums from the French system, and about 17 M€/year from the Portuguese system, while “exporting” about 66 M€/year to Morocco. The study has also shown that, for the period considered, the Spanish system “exported” a yearly net average of about 20 M€ of renewable premiums to the neighbouring interconnected systems, despite the fact that Spain presents a net energy importer balance.
Another interesting result was that even though the interconnection between the French and Spanish systems is almost saturated for approximately 2/3 of the days a year, the “importation” of the premium for renewables from France shows a clearly growing trend, since it rose from about 28 M€ in 2015 up to about 90 M€ in 2017. At this point, and extrapolating the results of the 2015–2017 period considered, it is interesting to take into account that if the objective of 10% of interconnection capacity had already been reached, then the “imports” of premiums would have been even greater, and that they would be even higher when the new 15% target is reached.
As upheld by the European Commission, in the Communication on strengthening Europe’s energy networks, COM(2017)718, “An interconnected European grid will help deliver the ultimate goals of the Energy Union to ensure affordable, secure and sustainable energy to all Europeans”. However, a common and coordinated supranational energy policy is also needed in order to prevent these costly and unintended side effects of both an economic and environmental nature.

Author Contributions

Conceptualization, writing and data analysis were done by J.M.R.-F.; C.G.-Q. wrote manuscript producing graphs and figures; A.M. was responsible for finding data and performing a preliminary report; M.B.-P. wrote and supervised the study and was involved in the theoretical basis of the research; J.M.R.-S. participated in the supervision, commented on the approaches and the funding acquisition.

Funding

This work was partially supported by the Spanish MEC—Ministerio de Economía y Competitividad (Ministry of Economy and Competitiveness) co-funded by the European Commission (ERDF—European Regional Development Fund) under grants PCIN-2015-043, ENE2016-77650-R and fully supported by the European Commission under the grant SI-1778/12/2018.

Conflicts of Interest

The authors declare no conflict of interest.

References

  1. Jos, D.; Peter, V. EU Climate Policy Explained. Available online: https://ec.europa.eu/clima/sites/clima/files/eu_climate_policy_explained_en.pdf (accessed on 19 November 2018).
  2. European Commission. Climate Strategies & Targets. Available online: https://ec.europa.eu/clima/policies/strategies_en (accessed on 19 November 2018).
  3. European Commission. 2050 Energy Strategy. Available online: https://ec.europa.eu/energy/en/topics/energy-strategy-and-energy-union/2050-energy-strategy (accessed on 19 November 2018).
  4. ETIP SNET. News and Articles. Renewable Energy Sources to Account for 85% of Global Electricity Production by 2050. Tuesday. 19 September 2017. Available online: https://www.etip-snet.eu/renewable-energy-sources-account-85-global-electricity-production-2050/ (accessed on 19 November 2018).
  5. DNV·GL. Energy Transition Outlook 2017. A Global and Regional Forecast of the Energy Transition to 2050. Available online: https://eto.dnvgl.com/2017/#Energy-Transition-Outlook (accessed on 19 November 2018).
  6. Scott, M. Half of All Power Set to Come from Renewable Energy by 2050, While Coal Recedes to Just 11%. 22 June 2018. Available online: https://www.forbes.com/sites/mikescott/2018/06/22/half-of-all-power-set-to-come-from-renewable-energy-by-2050-while-coal-recedes-to-just-11/#5acc7c384a1d (accessed on 19 November 2018).
  7. Rathi, A. One of the Biggest Criticisms against Wind and Solar Energy Has Been Quashed. 17 August 2017. Available online: https://qz.com/1054992/renewable-subsidies-are-already-paying-for-themselves/ (accessed on 19 November 2018).
  8. Saénz de Miera, G.; del Río González, P.; Vizcaíno, I. Analysing the impact of renewable electricity support schemes on power prices: The case of wind electricity in Spain. Energy Policy 2008, 36, 3345–3359. [Google Scholar] [CrossRef]
  9. Azofra, D.; Jiménez, E.; Martínez, E.; Blanco, J.; Saenz-Díez, J.C. Wind power merit-order and feed-in-tariffs effect: A variability analysis of the Spanish electricity market. Energy Convers. Manag. 2014, 83, 19–27. [Google Scholar] [CrossRef]
  10. European Commission. Competition. Available online: http://ec.europa.eu/competition/state_aid/overview/index_en.html (accessed on 19 November 2018).
  11. European Commision. State Aid: Commission Approves Support to Two Highly Efficient Cogeneration Plants in Germany. 25 September 2018. Available online: https://ec.europa.eu/info/news/state-aid-commission-approves-support-two-highly-efficient-cogeneration-plants-germany-2018-sep-25_en (accessed on 19 November 2018).
  12. European Commision. Press Release Database. State Aid: Commission Approves €3.5 Billion Support to Three Offshore Windfarms in Belgium. Brussels. 27 September 2018. Available online: http://europa.eu/rapid/press-release_IP-18-5922_en.htm (accessed on 19 November 2018).
  13. European Commission. Energy. Commission Expert Group on Electricity Interconnection Targets. Available online: https://ec.europa.eu/energy/en/topics/infrastructure/projects-common-interest/electricity-interconnection-targets/expert-group-electricity-interconnection-targets (accessed on 19 November 2018).
  14. European Commission. Press Release Database. European Solidarity on Energy: Better Integration of the Iberian Peninsula into the EU Energy Market. Brussels. 27 July 2018. Available online: http://europa.eu/rapid/press-release_IP-18-4621_en.htm (accessed on 19 November 2018).
  15. Roldán-Fernández, J.M.; Burgos-Payan, M.; Riquelme-Santos, J.-M.; Trigo-García, Á.-L. Renewable generation versus demand-side management. A comparison for the Spanish market. Energy Policy 2016, 96, 458–470. [Google Scholar] [CrossRef]
  16. Roldán-Fernández, J.-M.; Burgos-Payan, M.; Riquelme-Santos, J.-M.; Trigo-García, Á.-L. Renewables versus Efficiency: A Comparison for Spain. Energy Procedia 2016, 106, 14–23. [Google Scholar] [CrossRef]
  17. Roldán-Fernández, J.-M.; Burgos-Payan, M.; Riquelme-Santos, J.-M.; Trigo-García, Á.-L. The Merit-Order Effect of Energy Efficiency. Energy Procedia 2016, 106, 175–184. [Google Scholar] [CrossRef]
  18. Roldan-Fernandez, J.-M.; Burgos-Payan, M.; Trigo-Garcia, A.-L.; Diaz-Garcia, J.-L.; Riquelme-Santos, J.-M. Impact of renewable generation in the Spanish Electricity Market. In Proceedings of the 2014 11th International Conference on the European Energy Market (EEM), Krakow, Poland, 28–30 May 2014. [Google Scholar]
  19. Burgos Payán, M.; Roldán Fernández, J.M.; Trigo García, Á.L.; Bermúdez Ríos, J.M.; Riquelme Santos, J.M. Costs and benefits of the renewable production of electricity in Spain. Energy Policy 2013, 56, 259–270. [Google Scholar] [CrossRef]
  20. Reuters: Energy. 14 March 2013. Available online: https://www.reuters.com/article/europe-renewables-cooperation/eu-could-save-billions-with-cross-border-renewables-cooperation-idUSL5N0BDDXU20130314 (accessed on 19 November 2018).
  21. Grande, T.R. Swedish and Norwegian Renewable Energy Policy-the Creation of the World’s First International Green Certificate Market. Masteroppgave ved Institutt for Statsvitenskap, Universitetet I Oslo. Spring 2013. Available online: https://www.duo.uio.no/bitstream/handle/10852/36981/Masteroppgavenxminxfinalx2.pdf?sequence=1 (accessed on 19 November 2018).
  22. Ecofys and Eclareon. Cross-Border Renewables Cooperation. Study on Behalf of Agora Energiewende. 2018. Available online: https://www.agora-energiewende.de/fileadmin2/Projekte/2017/RES-Policy/144_cross-border_RES_cooperation_WEB.pdf (accessed on 19 November 2018).
  23. Optimization of the Planning of the Interconnections for the Integration of the European Market with High Renewable Penetration Level (Optimización de la Planificación de las Interconexiones para la Integración del Mercado Europeo con gran Penetración Renovable), ENE2016-77650-R. Available online: https://investigacion.us.es/sisius/sis_proyecto.php?idproy=27691 (accessed on 19 November 2018).
  24. GEMS. Available online: https://www.ingelectus.com/products/ and https://www.isotrol.com/web/sectores/mercado-electrico/gems/ (accessed on 19 November 2018).
  25. ENSO-e. Statistical Factsheet 2017. 2018. Available online: https://docstore.entsoe.eu/Documents/Publications/Statistics/Factsheet/entsoe_sfs_2017.pdf (accessed on 19 November 2018).
  26. REE-Red Eléctrica de España. Spanish Electricity System 2017 Report. 2018. Available online: https://www.ree.es/en/statistical-data-of-spanish-electrical-system/annual-report/spanish-electricity-system-2017-report (accessed on 19 November 2018).
  27. Royal Decree Law 1/2012 on Revocation of Public Financial Support for New Electricity Plants from Renewable Sources, Waste or CHP. Available online: http://www.boe.es/boe/dias/2012/01/28/pdfs/BOE-A-2012-1310.pdf (accessed on 19 November 2018).
  28. Royal Decree-Law 413/2014 on Electricity Generation by Means of Renewable, Cogeneration and Waste Facilities. Available online: https://www.boe.es/diario_boe/txt.php?id=BOE-A-2014-6123 (accessed on 19 November 2018).
  29. Order IET/1045/2014 of 16 June, Approving the Remuneration Parameters for Standard Facilities, Applicable to Certain Electricity Production Facilities Based on Renewable Energy, Cogeneration and Waste. Available online: http://www.boe.es/boe/dias/2014/06/20/pdfs/BOE-A-2014-6495.pdf (accessed on 19 November 2018).
  30. Eurostat. Statistics Explained; Renewable Energy Statistics. Available online: https://ec.europa.eu/eurostat/statistics-explained/index.php/Renewable_energy_statistics (accessed on 19 November 2018).
  31. INELFE. Interconexión Eléctrica Francia-España or Electricity Interconnection France-Spain. Available online: https://www.inelfe.eu/en/about-inelfe (accessed on 19 November 2018).
  32. Legal Sources on Renewable Energy. Portugal. Available online: http://www.res-legal.eu/search-by-country/portugal/ (accessed on 19 November 2018).
  33. European Commission Press Release. State Aid: Commission Authorises Portuguese Demonstration Scheme for Ocean Energy Technologies. Brussels. 23 April 2015. Available online: http://europa.eu/rapid/press-release_IP-15-4836_en.htm (accessed on 19 November 2018).
  34. Commission de Régulation de l’Énergie. Délibération de la CRE du 13 Juillet 2016 Relative à l’Évaluation des Charges de Service Public de l’Énergie pour 2017. 20 July 2016. Available online: https://www.cre.fr/Documents/Deliberations/Decision/cspe-2017 (accessed on 19 November 2018).
  35. Commission de Régulation de l’Énergie. Annexe 7. Historique des Charges de Service Public de l’Énergie. Available online: https://www.cre.fr/content/download/14718/174766 (accessed on 23 November 2018).
  36. International Energy Agency. Available online: https://www.iea.org/policiesandmeasures/renewableenergy/?country=Morocco (accessed on 19 November 2018).
  37. IESOE. Electricity Interconnection in South-Western Europe. Available online: https://www.iesoe.eu/iesoe/ (accessed on 19 November 2018).
  38. RTE. Actual Generation per Production Type. Available online: http://clients.rte-france.com/lang/an/visiteurs/vie/prod/realisation_production.jsp (accessed on 19 November 2018).
  39. ERSE (Entidade Reguladora Dos Serviços Energéticos). PRE-Produção em Regime Especial. Available online: http://www.erse.pt/pt/desempenhoambiental/prodregesp/Paginas/default.aspx (accessed on 19 November 2018).
  40. OMIE. Available online: http://www.omie.es/reports/index.php?report_id=211# (accessed on 19 November 2018).
  41. CNMC (Comisión Nacional de los Mercados y la Competencia). Información Mensual de Estadísticas Sobre las Ventas de Régimen Especial. Contiene Información Hasta Mayo de 2018. Available online: https://www.cnmc.es/estadistica/informacion-mensual-de-estadisticas-sobre-las-ventas-de-regimen-especial-contiene-21 (accessed on 19 November 2018).
  42. The World Bank. Population Data. Available online: https://data.worldbank.org/indicator/sp.pop.totl (accessed on 19 November 2018).
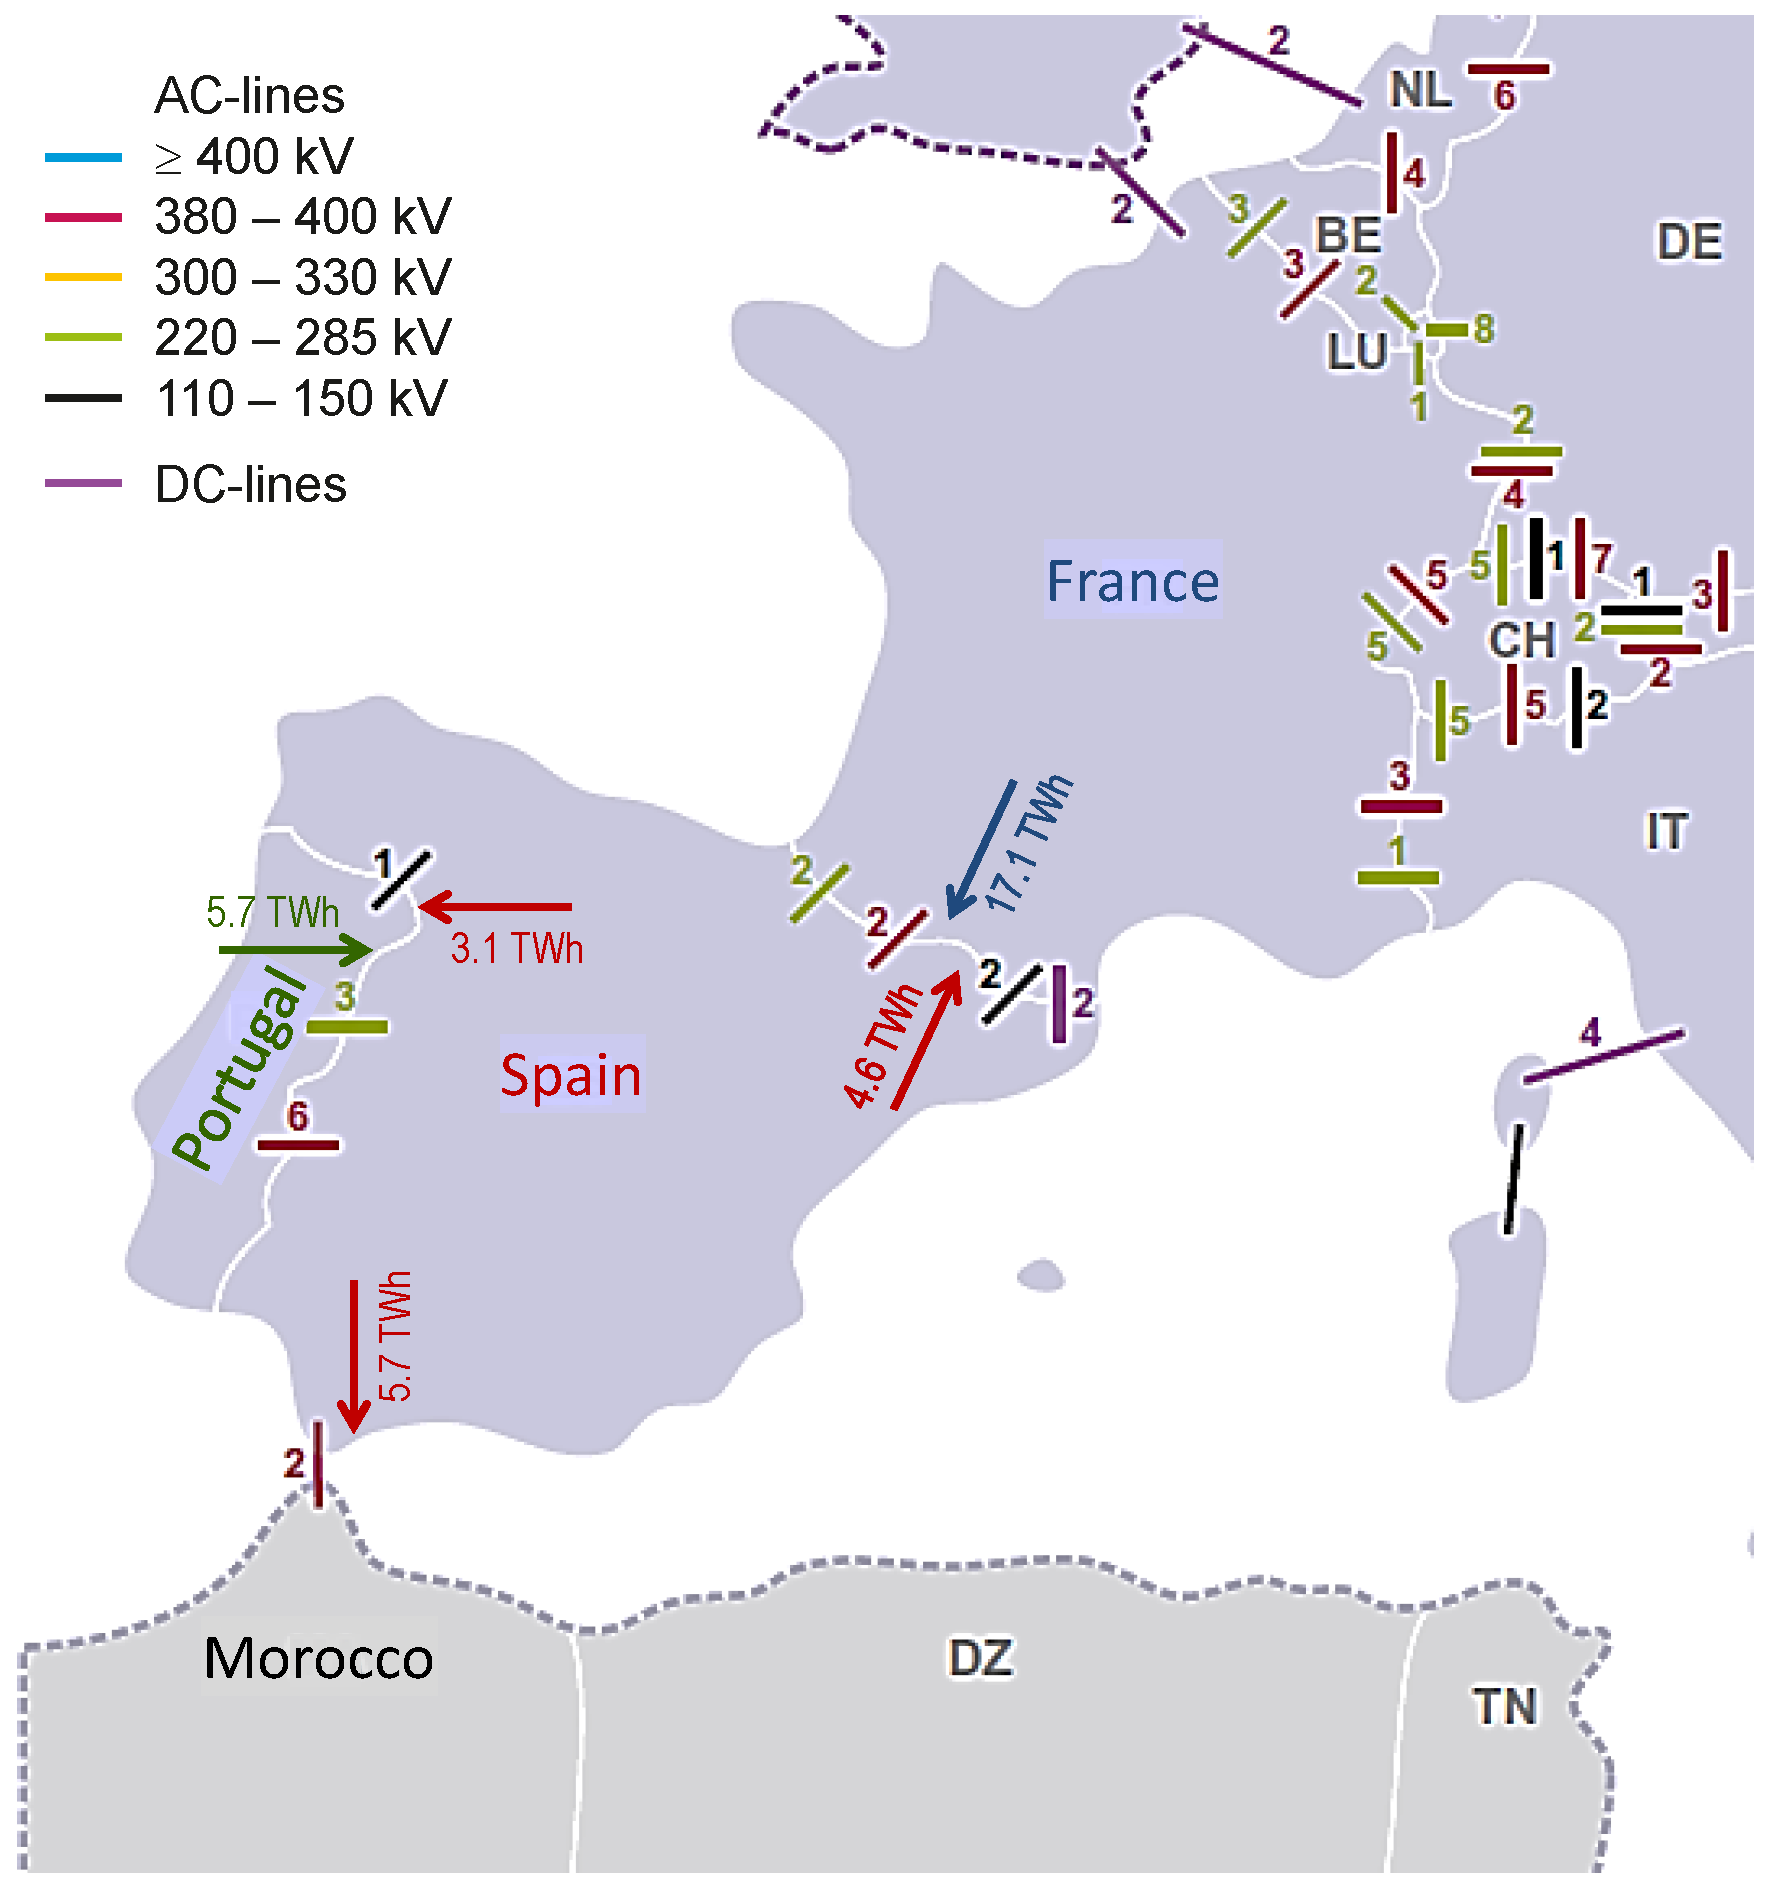
Figure 1. Cross-border interconnection of the Spanish continental electricity system with its neighbouring countries. Number of circuits and rated voltages on cross-frontier transmission lines and annual energy exchanges in 2017.
Energies 11 03277 g001
Figure 2. (a) Hourly load duration curves of the degrees of utilization of the commercial interchange capacities of the Spanish cross-border interconnections and (b) annual percentage of days with and without congestion in the interconnections France-Spain and Spain-Portugal in 2017.
Energies 11 03277 g002
Figure 3. Evolution of the annual international energy exchanges of the Spanish peninsular system.
Energies 11 03277 g003
Figure 4. 2014–2017. (a) Annual amount of premiums to renewable-energy production for Spain (SP), France (FR), and Portugal (PT); (b) yearly renewable-energy premiums per capita.
Energies 11 03277 g004
Figure 5. 2015–2017. (a) Annual percentages of international SP-FR energy exchanges; (b) annual percentages of international SP-PT energy exchanges; (c) annual percentages of international SP-MA energy exchanges.
Energies 11 03277 g005
Figure 6. Histograms of the percentage of hourly renewable penetration, 100 · ( E h R E / E h ) , (a) in Spain; (b) in France; and (c) in Portugal, each for the year 2017.
Energies 11 03277 g006
Figure 7. 2015–2017. Annual amount of renewables exchanged (a) between FR and SP; (b) between SP and PT; (c) between SP and MA.
Energies 11 03277 g007
Figure 8. 2015–2017. Annual amounts of renewable premiums (M€) ‘transferred’ (exported) through international exchanges: (a) between SP and FR; (b) between SP and PT; (c) between SP and MA.
Energies 11 03277 g008
Table 1. Statistics of the percentage of hourly renewable penetration, 100 · ( E h R E / E h ) , for the year 2017.
CountryMedianMeanMaximumStandard Deviation
Spain—SP26.1527.0657.889.99
France—FR6.417.1421.273.59
Portugal—PT26.0929.0787.2315.18
Table 2. Net annual ‘exchanges’ of renewable premiums (M€) between interconnected countries.
Countries201520162017Average
Spain-France (SP-FR)28.45 FR→SP1.87 FR→SP90.45 FR→SP40.26 FR→SP
Spain-Portugal (SP-PT)74.69 SP→PT99.27 PT→SP27.11 PT→SP17.22 PT→SP
Spain-Morocco (SP-MA)68.35 SP→MA60.79 SP→MA69.41 SP→MA66.18 SP→MA
Spain-Neighbour (SP-NE)114.59 SP→NE40.37 NE→SP48.15 NE→SP20.07 SP→NE