Abstract
Since natural gas has become a new star in China’s energy mix, a reliable estimation of the price elasticity of natural gas demand is crucial if we are to understand how energy price changes affect natural gas consumption. In this paper, we conduct a Meta-regression analysis to quantitatively synthesize empirical estimates of the price elasticity of natural gas demand reported in previous studies, provide true underlying values, and explain the heterogeneity of the aforementioned estimates. The Fixed-effects model and ordinary least squares (OLS) are applied to estimate the regression models. As a result, this paper reports a mean elasticity of −1.521 and 0.410 for the short- and long-run own-price elasticity, separately; −0.762 and 0.008 for the short- and long-run cross-price elasticity-coal to natural gas, respectively; 2.122 and 1.884 for the short- and long-run cross-price elasticity-electricity to natural gas, separately; and 2.267 and 1.275 for the short- and long-run cross-price elasticity-oil to natural gas, respectively. Our results suggest that natural gas consumption increases with the decrease of its own and coal prices in the short term and rise of electricity and oil prices. It also shows that almost all heterogeneity can be explained by the type of data, sample period, models of analysis, geographical region, and type of consumer.
1. Introduction
Natural gas is a type of low-carbon energy and it is essential for us to lead a cleaner life and achieve cleaner production. Thus, more and more countries are turning to the use of natural gas as a substitute for energy sources, such as coal and oil, with the increasing awareness of environmental protection worldwide. The Energy Information Administration (EIA) EIA (2017) predicted that the world’s natural gas consumption would reach 177.0 trillion cubic feet in 2040, increasing by 43% from 2015 to 2040 [1]. The share of the world’s natural gas consumption in non-OECD countries will increase from 53% in 2015 to 59% in 2040, in which China will contribute a large proportion. It is reported that natural gas growth is supported by a number of factors: increasing levels of industrialization and power demand (particularly in emerging Asia and Africa); and continued coal-to-gas switching, especially in China [2].
While coal and oil have driven China’s economic success over the past 30 years and enabled China to achieve double-digit economic growth rates for decades, they have left the country with many worsening environmental problems. Today, China’s energy structure has changed significantly by promoting natural gas and other clean energy in the country’s energy mix. In China’s 13th Five-Year Plan, the Chinese government set targets to increase the share of natural gas in the primary energy mix from 5.9% in 2015 to 10% by 2020 and 15% by 2030 [1]. Thus, it is essential to accurately measure the impact of natural gas and related energy price changes on natural gas consumption in order to figure out how natural gas replaces traditional energy. The price elasticities of natural gas demand are an important tool in this situation.
The price elasticity of demand for natural gas is very essential to conduct price reformation, determine the right prices, and formulate energy strategies for environmental and political reasons. Accordingly, a large number of studies on this topic have emerged in the academic community in the past few years. Li et al. (2012) made a comprehensive review on the existing literature studying the price elasticity of natural gas demand worldwide [3]. In her research, 25 studies were reported, which engaged in the estimation of price elasticity in different areas, with different consumers, and with various methods, leading to a great diversity of empirical results. However, the traditional literature review method cannot give an accurate average estimate of elasticity and also cannot identify the factors why the results disperse. Inspired by her research, we perform a quantitative research synthesis technique, called a Meta-regression analysis, to estimate the true underlying value of price elasticity and explain the variations in the estimates collected from the primary literature.
A Meta-analysis was first applied in medical science to summarize the results of clinical trials; one of the earliest Meta-analyses was Simpson and Pearson (1904) [4]. In the field of economics, the first Meta-analysis was conducted by Stanley and Jarrell (1989) [5]. Since then, this method has begun to catch academics’ eyes for quantitatively summarizing and re-studying based on previous research results. When it comes to energy issues, most of the existing studies using this method have focused on the elasticity of gasoline demand (see more details in Espey, 1996; Espey, 1998; Brons et al., 2008; Havranek and Irsova, 2012; Haveranek and Kokes, 2015) [6,7,8,9,10]. Besides this, Hanly et al. (2002) conducted a Meta-analysis focusing on car fuels [11]. Espey and Espey (2004) used this method to study electricity demand [12]. As for natural gas price elasticity, Labandeira et al. (2017) made a detailed summary of existing articles using a Meta-analysis on the topic of energy demand and employed the so-called Heckman Meta-regression, which can be seen in Stanley and Doucouliagos (2007), to obtain average price elasticities of natural gas and identify the variables that explain the heterogeneity of price elasticities reported in the literature [13,14].
In this paper, we follow Labandeira et al. (2017) and concentrate our Meta-regression analysis on the price elasticity of China’s natural gas demand, which is subdivided into the Short-Run Own-Price Elasticity (SO), the Long-Run Own-Price Elasticity (LO), the Short-Run Cross-Price Elasticity-Coal to Natural Gas (SC-Coal), the Long-Run Cross-Price Elasticity-Coal to Natural Gas (LC-Coal), the Short-Run Cross-Price Elasticity-Electricity to Natural Gas (SC-Elec), the Long-Run Cross-Price Elasticity-Electricity to Natural Gas (LC-Elec), the Short-Run Cross-Price Elasticity-Oil to Natural Gas (SC-Oil), and the Long-Run Cross-Price Elasticity-Oil to Natural Gas (LC-Oil) for a more accurate estimation (see Table 1 for more details). To this end, this paper reports a series of mean values of the eight kinds of elasticities. As a secondary outcome, we identify the variables that explain the heterogeneity of price elasticities reported in previous literature.

Table 1.
Elasticity types, abbreviations, and signs in this paper.
In the theory of microeconomics, price elasticity of demand refers to the sensitivity of market commodity demand to price changes. Own-Price Elasticity of demand means how the demand of a commodity changes when its own price fluctuates, such as SO and LO. Generally speaking, for a commodity, when the price falls, the demand increases; when the price rises, the demand decreases. Therefore, usually, the demand price elasticity coefficient is negative. The Cross-Price Elasticity of demand indicates the degree of response to changes in the demand for one commodity to the price movement of another commodity, such as SC-Coal, LC-Coal, SC-Elec, LC-Elec, SC-Oil, and LC-Oil. If the Cross-Price Elasticity of demand is positive, the two commodities are substitutional for each other. If the value is negative, the two commodities are complimentary to each other. The positive and negative signs of elasticities in this paper are shown in Table 1.
The significance and contribution of this article firstly lies in that one can theoretically analyze the relevance of China’s energy prices and natural gas consumption based on the results, which provides a theoretical basis for the adjustment of energy price policies to achieve cleaner production. Secondly, unlike former studies, this article subdivides price elasticity into eight categories to study the long-term and short-term impact on natural gas demand when the related energy price changes by reporting the mean values of these elasticities. Thirdly, it provides a complete Meta-regression analysis framework and a kind of classification method for elasticity for those who want to do similar or further research.
The rest of this paper is organized as follows: Section 2 presents a review on the price elasticity of China’s natural gas consumption that is involved in our Meta-regression analysis. In Section 3, we define the crucial variables and outline the Meta-regression models for the estimation of the mean price elasticities of natural gas in China. Section 4 of this paper presents our empirical results on price elasticities and some analysis on various characteristics of the primary studies that lead to the dispersion of the reported elasticity values. Section 5 provides our conclusions on this topic.
2. Literature Review
2.1. A Review on Studies Involved in Our Research
Although natural gas demand has become a hot topic in academia recently, the existing empirical literature on the price elasticity of natural gas demand in China is relatively rare. In this paper, we actually located 10 studies to conduct the Meta-regression analysis on, covering the time period from 2009 to 2018 as shown in Table 2. These studies yielded a variety of elasticity results with different models, consumers, areas, and data sets. In total, they provided 93 elasticity values of natural gas demand in China, which provide the basis for our following Meta-regression models.
Table 2.
A list of studies in the Meta-regression analysis.
Specifically, Feng et al. (2009) studied Shanghai’s price elasticity of natural gas demand with a log-linear model and reported a value of −0.584 [15]. Gao et al. (2012) studied Chengdu’s price elasticity of natural gas demand, finding the results of [0.07, 0.59] of SO and [2.29, 2.58] of LO [16]. Cheng et al. (2014) focused on the price elasticity of natural gas demand in the Huabei district, finding that the price elasticity is −0.811 when considering price regulation and −0.950 otherwise [17]. Zheng (2012) took Shanghai as an example, and reported values of price elasticity of natural gas demand of −0.477 and −0.284 for the short and long term, separately [18]. Zhang et al. (2018) found that the elasticity values are distinctive in different sectors. In the industrial sector, the SO is 0.222; and the LO is 0.847; while for residential users, the SO is −0.223; and the LO is −0.223 [19].
Wang and Lin (2014) concluded that China’s residential sector is more sensitive to price than the industrial and commercial sectors, with the values of −0.78, 0.04, and −0.39, respectively, in the short term [20]. Yu et al. (2014) studied the price elasticity of natural gas demand in China’s urban residents, finding a price elasticity of −1.431 [21]. Sun and Ouyang (2016) studied the price elasticities of Chinese residential energy demand and reported an own-price elasticity of −0.779 [22]. Zeng et al. (2018) used a linear logarithmic model to study the natural gas demand of China’s households and provided an overall price elasticity of −0.898 in the short term [23]. Zhang and Peng (2012) reported a series of values of cross-price elasticities, such as an SC-Elec of 2.232, an SC-Coal of 0.230 as well as an SC-Oil of 0.609 [24].
2.2. A Review on the Empirical Results Involved in Our Research
The 10 primary studies mentioned above report a quite wide range of price elasticities of natural gas consumption in China for the eight kinds. Table 3 presents the statistics of these elasticity values. Figure 1, Figure 2, Figure 3 and Figure 4 show the dispersions of them. Clearly, there are significant differences among the elasticity values. Thus, to promote natural gas consumption, further research on each kind of price elasticity can better reflect how exactly natural gas demand changes when the natural gas, coal, electricity, or oil price changes.
Table 3.
Statistics of price elasticities of natural gas demand.
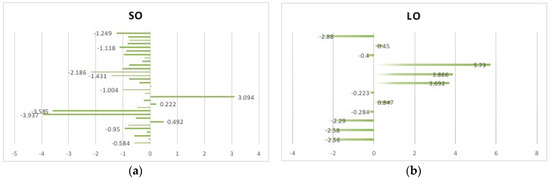
Figure 1.
(a) Describes the Short-Run Own-Price Elasticity (SO); (b) Describes the Long-Run Own-Price Elasticity (LO).
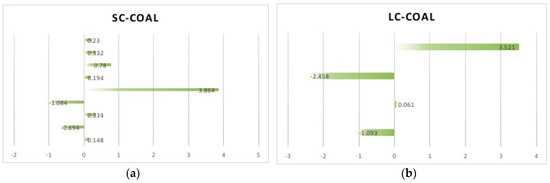
Figure 2.
(a) Describes the Short-Run Cross-Price Elasticity-Coal to Natural Gas (SC-Coal); (b) Describes the Long-Run Cross-Price Elasticity-Coal to Natural Gas (LC-Coal).
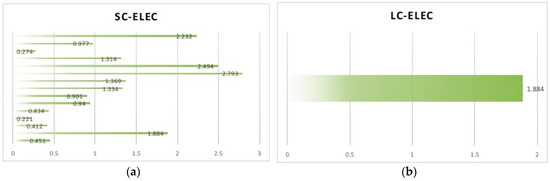
Figure 3.
(a) Describes the Short-Run Cross-Price Elasticity-Electricity to Natural Gas (SC-Elec); (b) Describes the Long-Run Cross-Price Elasticity-Electricity to Natural Gas (LC-Elec).
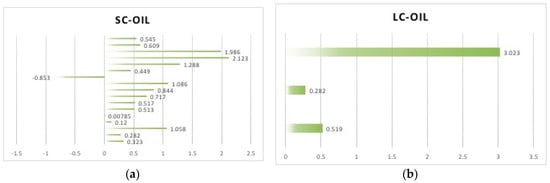
Figure 4.
(a) Describes the Short-Run Cross-Price Elasticity-Oil to Natural Gas (SC-Oil); (b) Describes the Long-Run Cross-Price Elasticity-Oil to Natural Gas (LC-Oil).
SO. At a first glance at Figure 1a, we may notice that there is a large difference between these 32 elasticity values. The St. deviation 1.157 also denotes the dispersion. The values of 3.094, −3.585, and −3.937 are pretty eye-catching because they are large enough for the microeconomic elasticity theory and the developed countries’ level. Specifically, Cheng et al. (2014) found that the SO of Shanxi and Gansu province are −3.937 and −3.585, respectively [17]. The two provinces have low economic development levels and a poor user price tolerance, which is the reason for the higher elasticity than other regions. Zhang et al. (2018) reported the value 3.094 in an analysis of the electric power generation and supply sector [19]. Due to historically low prices and an urgent need for natural gas, the rise in natural gas prices has not led to a reduction in demand.
LO. There are 12 observations of LO in Figure 1b, half of which are greater than 0. This is distinct from the price elasticity theory of demand, which presents a negative value. However, this result is consistent with China’s situation, indicating China’s non-market pricing natural gas market. The values 5.73 and 3.886 were provided by Zhang et al. (2018) for the service sector and the transportation sector, respectively [19]. Due to the low regulatory prices in China’s natural gas market and the demand for clean energy consumption, in the long run, rising prices have not brought about a decline in China’s natural gas demand.
SC-Coal and LC-Coal. The positive elasticity values in Figure 2 reveal that natural gas and coal are a substitute for each other, while the negative ones denote a complementary relationship between them. This finding is contrary to developed countries, which present a substitutional relationship, but is in line with the Chinese reality of a coal-dominated energy structure. For instance, the value 3.864 of SC-Coal denotes a strong substitutional relationship between natural gas and coal in the short run. The value −2.458 of LC-Coal from Zhang et al. (2018) indicates that natural gas and coal consumption are complementary in the long run in the electric power generation and supply sector [19].
SC-Elec and LC-Elec. The positive values in Figure 3a,b denote that natural gas and electricity are substitutional for each other in both the short and long run. The average of SC-Elec and LC-Elec is 1.202 and 1.884, respectively, larger than SC-Coal (0.456), LC-Coal (0.008), SC-Oil (0.068), and LC-Oil (1.275). This suggests that, in general, natural gas is a better substitutional energy for electricity and oil but plays a soft role of substitution for coal. Government can increase alternative energy prices to increase natural gas consumption.
SC-Oil and LC-Oil. We can see from Figure 4a,b that the difference in elasticity values is relatively small and the distribution is relatively even compared to the other types of elasticity. The average of SC-Oil is 0.068, and that of LC-Oil is 1.275. The value −0.853 from Zeng et al. (2018) is based on research at the household level [23]. In fact, the cross elasticities of Liquefied Petroleum Gas (LPG) (We classify it as oil) prices to natural gas demand are positive as a whole. The value −0.853 is occasional in estimation, which literally means nothing in reality. The value 3.023 indicates a strong substitutional relationship between natural gas and oil.
By comparing the empirical results from the previous literature, we have an interesting finding. That is, from a regional perspective, the northwest or north of China tends to have a higher short-term own-price elasticity than other districts. The value −3.937 of Shanxi and the value −3.585 of Gansu compared to −0.950 of the Huabei district from Cheng et al. (2014), the value of −2.186 of the north of China compared to the value of −1.016 of the south of China from Yu et al. (2014), and the comparison among the 10 studies, all can reveal this discovery. Finally, given the large differences between the 10 studies, we perform five Meta-regression analyses on SO, LO, SC-Coal, SC-Elec, and SC-Oil to explore what causes the differences in results and calculate the mean value. As for LC-Coal, LC-Elec, and LC-Oil, we take 0.008, 1.884, and 1.275 (the arithmetic averages from Table 3) as their final mean values, respectively, for the lack of empirical results in previous studies. See Section 3 for more details.
3. Methodology
3.1. Meta-Regression Model
A Meta-regression analysis of the price elasticity of natural gas demand attempts to explain what systematically influences the elasticity estimates by introducing various factors of the preliminary study. In this research, we followed the equation, first suggested by Stanley and Jarrell (1989), and subsequently developed by Nelson and Kennedy (2009) and Labandeira et al. (2017), to explain the variation in these elasticities involved in our paper (see Equation (1)) [13,25]. Specifically, the estimate of the elasticity is used as dependent variable, with the type of data, sample period, models of analysis, estimation method, and other factors as the independent variables. Because it is unit-free and comparable between different studies, elasticity can be used as an effect size, according to Espey (1996) [6].
In Equation (1), bj is an elasticity estimate in a previous study, with j denoting the j-nth study and is influenced by Z as well as β. Z are the k explanatory variables, which measure the relevant characteristics of the empirical research; ak are the coefficients, which reflect the bias introduced by the specific features of previous research; ej denotes error terms; L is the number of studies involved in our analysis; and β represents the average of the elasticity when the remaining explanatory variables are set to zero. In this paper, Equation (1) was applied to explain the variation in the estimates of SO, LO, SC-Coal, SC-Elec, and SC-Oil of natural gas consumption and provide mean values for the five elasticity types, respectively.
3.2. Explanatory Variables
Since the heterogeneity of the 10 empirical studies exerts a non-negligible effect on the estimation of the price elasticity of China’s natural gas demand, we introduced several main factors (constructed as variables 0–1) to find out where the estimation differences come from. Taking into account China’s special situation as a developing country and the price regulation in the natural gas market conducted by the government, we considered the following seven main determinants that may lead to the aforementioned differences among these elasticity estimations.
Type of data. Different estimates of price elasticity of natural gas demand are potentially due to the various data types used in the primary studies. There are three types of data involved in the collected studies: time series data, cross-sectional data, and panel data. We define three dummies Zj1Zj2Zj3 in the meta-regression models such that Zj1 = 1 when referring to time series data, and Zj1 = 0 otherwise; Zj2 = 1 when referring to cross-sectional data, and Zj2 = 0 otherwise; Zj3 = 1 when referring to panel data, and Zj1 = 0 otherwise.
Sample period. The sample period involved in the collected studies is another factor that may affect elasticity values. Consider the world financial crisis that erupted in 2008: it led to a depression of energy prices and maybe a shift towards cheaper energy goods due to the reduction in the disposable income of the public. Hence, we introduce a dummy Zj4 such that Zj4 = 1 when a study uses the Pre-2008 data set, and Zj4 = 0 otherwise. Additionally, the year 2013 is a special year for China. According to the Global Environmental Energy Events in 2013, the number of haze days in Beijing in 2013 exceeded that in any of the past 50 years, after which the use of clean energy to transform energy structures and improve environmental pollution has made natural gas more and more popular. Correspondingly, we define a dummy Zj5 such that Zj5 = 1 when a study uses the 2008–2013 data set, and Zj5 = 0 otherwise; and the dummy Zj6 such that Zj6 = 1 when a study uses the Post-2013 data set, and Zj6 = 0 otherwise.
Models of Analysis. The collected empirical research employed a variety of econometric models, including the Linear Logarithmic model (LLM), the Auto-regressive Distribution Lag model (ARDL), the Co-integration and Error Correction model (CECM), the Almost Ideal Demand System (AIDS), and the Arc Elasticity Calculation (AEC), which may cause elasticity estimation biases. Therefore, we create five dummies to distinguish among them, which are Zj7 such that Zj7 = 1 when a study uses AEC to calculate elasticity, and Zj7 = 0 otherwise; Zj8 = 1 means the study uses LLM to estimate price elasticity, and Zj8 = 0 otherwise; Zj9 = 1 means a study uses ARDL to estimate price elasticity, and Zj9 = 0 otherwise; Zj10 = 1 means a study uses CECM to estimate price elasticity, and Zj10 = 0 otherwise; and Zj11 = 1 means a study uses AIDS to estimate price elasticity, and Zj11 = 0 otherwise.
Estimation Method. The Meta-regression results of Boys and Florax (2007) found that the estimation method had a substantial effect on the results [26]. We introduced two dummy variables to distinguish studies using the Least Squares method (LS) from those applying the Quantile Regression method (QR) or other estimation methods. The dummy Zj12 = 1 means the study uses QR to estimate price elasticity, and Zj12 = 0 otherwise; and Zj13 such that Zj13 = 1 when the study uses LS, and Zj13 = 0 when the study uses others.
Area. Consumers in different geographical regions may have different needs for natural gas. Under this circumstance, we consider two factors that may affect the estimated elasticity: the whole-country level versus the city level, and the North of China level versus the South of China level. To account for regional differences in estimates, we define four dummy variables Zj14, Zj15, Zj16, and Zj17 as follows: Zj14 = 1 means that the study considers the whole country as its research area, and Zj14 = 0 otherwise. Zj15 = 1 means that the study considers the cities of China as its research area, and Zj15 = 0 otherwise. Zj16 = 1 means that the study considers the North of China as its research area, and Zj16 = 0 otherwise. Zj17 = 1 if the study considers the South of China, and Zj17 = 0 otherwise.
Type of consumer. Different consumers have different purposes for using natural gas and thus react distinctly to its price changes, leading to various elasticities. This paper considered the following kinds of consumers: residential, industrial, commercial, electric sector, and all the nation’s people. In this situation, we introduce the dummy Zj18 for residential consumption, where Zj18 = 1 if a study involves a residential consumer; Zj18 = 0 otherwise. We define the dummy Zj19 = 1 when referring to the industrial consumer; Zj19 = 0 otherwise. We define Zj20 = 1 if a study considers commercial consumption; Zj20 = 0 otherwise. Zj21 = 1 indicates a consideration of the electric sector’s consumption; Zj21 = 0 otherwise. Zj22 = 1 means a study involves all types of consumers as a research object; Zj22 = 0 otherwise.
Regulation. Since natural gas plays a crucial role in the national economy and people’s livelihood, the natural gas price has long been controlled by the government in China and remained basically stable. The volatility and fluctuation frequency are very small. Therefore, it is difficult for the natural gas price to play a role in regulating the contradiction between supply and demand. Thus, it may affect the estimated elasticity. Therefore, we define a dummy Zj23 such that Zj23 = 1 when the estimation of elasticity considers price regulation for conducting results, and Zj23 = 0 otherwise.
The above detailed description of the seven main factors that we have abstracted from previous studies provides a useful input to our Meta-regression models. Table 4 shows the description and assignment of explanatory variables included in our models.
Table 4.
Description and assignment of explanatory variables.
3.3. Data and Estimation Method
The data involved in our Meta-regression models are the compiled variables and the price elasticity values from the primary studies as aforementioned in former sections. Given that our model contains only categorical independent variables while the dependent variable is continuous, we follow Labandeira et al. (2017) and estimate the above five models using a Fixed-effects model and an ordinary least squares (OLS) model for our Meta-regression analysis [13]. This research used software R to conduct the analysis. The statistical package is “metafor”.
4. Empirical Results and Discussion
In this section, we discuss the results of the empirical analysis, which is based on the Meta-regression models in Section 3. After conducting the Fixed-effects model and OLS analyses on Equation (1), we obtained a series of average elasticity values and the parameters estimated for every kind of price elasticity.
4.1. Discussion of the Price Elasticity Values
Own-price elasticity. As we can see in Table 5, with a mean SO and LO of −1.521 and 0.410, respectively, reported by the Fixed-effects model, and that of −1.312 and 0.502 separately provided by the OLS estimation, the demand for natural gas is not very price sensitive in the long run but quite sensitive in the short run in absolute value. This means that natural gas consumption will increase with the decrease of its own price in the short term and the increase of it in the long term, which lays the basis for a policy adjustment to achieve cleaner production. It is worth noting that the LO is greater than 0 and smaller than the SO of −1.521 in absolute value. This is contrary to the theory of price elasticity of demand and many other researchers, such as Li et al. (2012) and Labandeira et al. (2017), who found that the own-price elasticity is negative and the LO is bigger than the SO [3,13]. In fact, on the one hand, in China price regulation and imperfections in the market have hindered the regulatory functions of the natural gas price. On the other hand, the government-controlled price of natural gas is relatively low while natural gas as a clean and efficient energy is widely and massively used for a better environment. Thus, natural gas price increases do not lead to reductions in consumption and are less sensitive in the long run, which is also something that needs to be acknowledged in the design of policy instruments for cleaner production.
Table 5.
The average price elasticities in the empirical literature of each kind.
Cross price elasticity: coal. Our results in Table 5 suggest that natural gas and coal are complementary in the short run, with a price elasticity of −0.762, and slightly substitutional in the long run, with a price elasticity of 0.008. Both the SC-Coal and LC-Coal show a lack of price elasticity. This result is inconsistent with the conclusion in most developed countries that natural gas and coal are substitutes for each other. We concluded that a rise in coal price will restrain the demand for natural gas in the short run but will not affect the demand increase in the long run. This is related to China’s long-run coal-based energy mix. In China, coal resources are relatively rich, while natural gas resources are scarce. Besides this, the price of coal is far lower than that of natural gas in China. Thus, increases in coal price may not bring an increase in natural gas consumption, which should be paid extra attention when enhancing natural gas consumption for a better environment.
Cross price elasticity: electricity. As can be seen in Table 5, the Fixed-effects model reports a SC-Elec of 2.122 on average. In this case, the OLS estimation provides slightly higher elasticity values of 2.248 for SC-Elec. The LC-Elec value is 1.884. The results show that there is a strong substitutional relationship between natural gas and electricity in both the short and long term. This conclusion is contrary to Li et al. (2012), who concluded that the cross-price elasticity of alternative energy and natural gas is positive but quite small by focusing on an analysis at the worldwide level [3]. However, it is consistent with the real energy consumption situation in China. In fact, China’s natural gas prices are pretty low compared to those of electricity. The large price gap makes the substitutional relationship strong. For cleaner production, a rise in electricity price can promote natural gas consumption in both the short and long term.
Cross price elasticity: oil. From Table 5, we learn that the SC-Oil and LC-Oil provided by the Fixed-effects model are 2.267 and 1.275, on average, respectively. In addition, the OLS estimation provides slightly higher elasticity values of 2.279 for SC-Oil, which is quite rich in elasticity. The results indicate that natural gas is a superior substitution to oil in China’s energy mix in both the short and the long run. This is mainly because China’s natural gas prices are lower than those of oil. Since a rise in oil price can promote natural gas consumption, it is necessary to change the status of natural gas as a supplement to oil and to take relevant measures to promote the substitution of natural gas for oil.
From the above analysis, we found that most of our results are contrary to that of Li et al. (2012) that concentrates on the price elasticity of natural gas at the worldwide level [3]. This reflects that natural gas consumption in China is quite different from that in developed countries, where people pay more attention to the environment and living standards. Our conclusions are as follows: a change in competitive alternative energy prices does influence natural gas consumption significantly due to the substitutability among energies; and China’s natural gas consumption is more sensitive to electricity and oil price changes but less sensitive to coal price changes both in the short run and the long run. These conclusions suggest that natural gas demand can be enhanced by increasing the prices of coal, electricity, and oil, which can be an environmentally friendly action.
4.2. Discussion for the Parameters of SO, LO, SC-Coal, SC-Elec, and SC-Oil
4.2.1. Discussion for Parameters of the Short-Run Own-Price Elasticity
Table 6 presents the parameter estimation results of SO based on Equation (1). According to Espey and Espey (2004), estimates from time series studies are usually more elastic than other types of data [12]. In our conclusion, cross-sectional data instead of time series data have a significantly higher influence on the estimation of SO in China. As for the sample period, the coefficient “2008–2013” is 3.499, suggesting that the 2008 financial crisis led to a higher short-term price elasticity. The values 5.761 and 5.451 denote that studies using the AEC or LLM models to estimate SO usually generate higher values than those using ADRL or CECM. Besides this, residential and commercial data usually generate larger influences on SO than do industrial consumer data. In addition, there is a significant difference between studies regardless of whether they considered price regulation or not, with the coefficient Zj23 of 3.394. In conclusion, when estimating the Short-Run Own-Price Elasticity of China’s natural gas consumption, one should pay more attention to the type of data, sample period, models of analysis, estimation method, geographical region, type of consumer, and price regulation in the selection of the original data set.
Table 6.
The parameter estimation results of SO.
4.2.2. Discussion for the Parameters of the Long-Run Own-Price Elasticity
Table 7 presents the parameter estimation results of LO based on Equation (1). The parameter Zj5 of 0.272 means that using the 2008–2013 data set did not exert a large influence on LO estimates. There is a similar degree of influence on elasticity estimates among the AEC, LLM, and ARDL models. It is true that the LLM and ARDL methods have positive influences on elasticity estimations, while AEC does negatively. The coefficients of Zj18, Zj19, and Zj20 indicate that those studies using industrial data and residential data to estimate LO can obtain more elastic values than those that used commercial data or otherwise in absolute values. To sum up, one should pay enough attention to the sample period, models of analysis, and type of consumer when collecting data to estimate the Long-Run Own-Price Elasticity of China’s natural gas consumption.
Table 7.
The parameter estimation results of LO.
4.2.3. Discussion for the Parameters of the Short-Run Cross-Price Elasticity-Coal to Natural Gas
Table 8 presents the parameter estimation results of SC-Coal based on Equation (1). Clearly, the North of China level data used in a study generates slightly higher elasticities (in absolute values) than do national-level data. The coefficient Zj1 and Zj2 is −0.184 and 1.130, respectively, suggesting that cross-section studies are found to report higher absolute elasticity estimates than time-series studies when estimating SC-Coal. These results also show a higher short-term sensitivity to coal prices of commercial natural gas demand as compared to the residential or industrial demands. From this discussion, we can conclude that the type of data, models of analysis, geographical region, and type of consumer are very important factors when estimating the Short-Run Cross-Price Elasticity-Coal to Natural Gas of China’s natural gas demand.
Table 8.
The parameter estimation results of SC-Coal.
4.2.4. Discussion for the Parameters of the Short-Run Cross-Price Elasticity-Electricity to Natural Gas
Table 9 presents the parameter estimation results of SC-Elec based on Equation (1). Specifically, cross-section data have a larger influence on the estimation of SC-Elec, which is similar to that of the SO and SC-Coal situations. The coefficient “−0.233” of the 2008–2013 period dummy indicates slight negative influences from the 2008 financial crisis. Also, the model LLM used in collected studies does generate large impacts on SC-Elec estimation. Considering different regions, we find that the North of China tends to have a higher influence on SC-Elec compared to the whole country level. In a word, when estimating the Short-Run Cross-Price Elasticity-Electricity to Natural Gas of China’s natural gas demand, factors including the type of data, sample period, models of analysis, estimation method, and geographical region should be considered due to the influences they exert on the estimation of elasticity values.
Table 9.
The parameter estimation results of SC-Elec.
4.2.5. Discussion for the Parameters of the Short-Run Cross-Price Elasticity-Oil to Natural Gas
Table 10 presents the parameter estimation results of SC-Oil based on Equation (1). Clearly, cross-section data have larger influences on the estimation of SC-Oil than do time series data. In addition, studies employing the “2008–2013” data set can lead to higher price elasticities in absolute values than other data periods in China. Regarding SC-Oil, the China-level data, the North of China level data, and the industrial and residential data can exert a negative influence on elasticity estimations, but there is no significant difference between the results that applied residential level data and industrial level data. In conclusion, one should pay more attention to the type of data, sample period, estimation method, geographical region, and type of consumer used in his paper when estimating the Short-Run Cross-Price Elasticity-Oil to Natural Gas of China’s natural gas demand.
Table 10.
The parameter estimation results of SC-Oil.
4.2.6. A Comprehensive Analysis of the Parameters for SO, LO, SC-Coal, SC-Elec, and SC-Oil
Our results for the individual moderator variables suggest that approximately all the variables can be used to explain the differences in the reported elasticity values. Considering the “Type of data” term, price elasticities from cross-sectional data are significantly higher (in absolute values, as in the previous comparisons) than those from time-series data when estimating the SO, SC-Coal, SC-Elec, and SC-Oil of natural gas demand in China. In terms of the “sample period”, the variable “2008–2013” has a wide range of influence on almost all the equations in our analysis, such as SO, LO, SC-Elec, and SC-Oil, which indicates that the 2008 financial crisis did affect the estimation of all kinds of price elasticities for natural gas demand in China. Regarding the “Models of analysis” term, the use of LLM led to wide influences on the estimations of SO, LO, SC-Coal, and SC-Elec of natural gas demand in China, whereas other models, such as AEC and ARDL, affect the estimation of SO and LO. As for the “Estimation Method” term, there are no systematic differences between estimation results using “QR”, “LS”, or others. In terms of “Geographical region”, natural gas at the China or North of China level is substantially less price-sensitive in values of SO, SC-Coal, SC-Elec, and SC-Oil. Moreover, concerning “Type of consumer”, the price elasticities of commercial demand are significantly higher than those of industrial and residential demands in estimation of SO and SC-Coal. However, in the estimation of LO and SC-Oil, the opposite is true. Finally, when it comes to “Price regulation”, only SO values are affected by considering this term.
5. Conclusions
In this study, we performed a Meta-regression analysis employing the entire set of results selected from the primary literature to provide a benchmark value of elasticity of natural gas and determine the impact of study characteristics on these elasticity values. As a result, the paper reported the mean short-run and long-run own-price elasticities of natural gas demand are −1.521 and 0.410, respectively. On average, this paper also reports a price elasticity of natural gas demand in China for SC-Coal of −0.762, for LC-Coal of 0.008, for SC-Elec of 2.122, for LC-Elec of 1.884, for SC-Oil of 2.267, and for LC-Oil of 1.275. It also provided the values for the parameters of SO, LO, SC-Coal, SC-Elec, and SC-Oil.
The mean values of SO, LO, SC-Coal, LC-Coal, SC-Elec, LC-Elec, SC-Oil, and LC-Oil, which are based on the previous studies involved in our research, are different from the results of Li et al. (2012) and Labandeira et al. (2017). The discussions and comparisons in Section 4.1 have shown our opinion. In conclusion, this is probably because, instead of focusing on the natural gas demand at the worldwide level, our research concentrated on the price elasticity of China’s natural gas demand. In addition, the price regulation and imperfections in China’s natural gas market are the main reasons why most of our results are contrary to others. This also reflects that natural gas consumption in China is quite different from that in developed countries where the natural gas market is mature at present. Figure 1, Figure 2, Figure 3 and Figure 4 shows the dispersion of the elasticity values collected from the primary literature, and our results are the combined effect results of these values in meta-regression models. Obviously, our results are consistent with the primary studies’ results involved in our analysis.
Our conclusions on the analysis of price elasticities are as follows. Firstly, the own-price elasticities indicate that natural gas consumption will increase with the decrease of its own price in the short term and the increase of it in the long term. Secondly, in the long run, there is a slight substitutional relationship between natural gas and coal; while in the short run, natural gas and coal are complementary for each other. Thirdly, there is a strong substitutional relationship between natural gas and electricity or oil both in the short and long run. These conclusions allow us to conclude that natural gas consumption can be enhanced by increasing the coal or oil prices for green development and clean production.
This paper also figured out what caused the variation in previous estimates and how they exert influences. In Section 4.2, we systematically explained how the influencing factors (or the characteristics extracted from the previous research) affect the mean elasticity values of SO, LO, SC-Coal, SC-Elec, and SC-Oil according to the estimation of the regression models, and provided our conclusions for each kind of elasticity. Based on our conclusion, one can make a precise estimation on the specific kind of elasticity. For instance, when estimating SC-Oil, since the type of data, sample period, estimation method, and the region of China as well as the type of consumer considered may lead to heterogeneity in primary estimations, one should pay enough attention to these factors for data selection. In addition, almost all of the factors listed in this paper should be considered when calculating SO.
Supplementary Materials
Supplementary File 1Author Contributions
Conceptualization, J.C. and H.S.; Methodology, J.C. and H.S.; Software, J.C. and H.S.; Validation, J.C. and H.S.; Formal Analysis, X.Z. and S.W.; Investigation, J.C., H.S., and X.Z.; Resources, J.C. and H.S.; Data Curation, H.S.; Writing—original Draft Preparation, H.S.; Writing—review and Editing, J.C., X.Z., and S.W.; Visualization, J.C. and H.S.; Supervision, J.C., X.Z., and S.W.; Project administration, J.C.; Funding acquisition, J.C.
Funding
This research received no external funding.
Acknowledgments
This work was supported by the National Natural Science Foundation of China (No. 71473155) and the Young Star of Science and Technology Plan Project in Shaanxi Province, China (No. 2016KJXX-14).
Conflicts of Interest
The authors declare no conflict of interest.
References
- EIA. International Energy Outlook 2040 (2017 edition). 2017. Available online: https://www.eia.gov/outlooks/ieo/pdf/0484(2017).pdf (accessed on 18 June 2018).
- BP. BP Energy Outlook 2040 (2018 edition). 2018. Available online: https://www.bp.com/content/dam/bp/en/corporate/pdf/energy-economics/energy-outlook/bp-energy-outlook-2018.pdf (accessed on 18 June 2018).
- Li, L.L.; Zhu, K.J.; Yang, J. Literature review on natural gas demand price elasticity. J. Beijing Inst. Technol. 2012, 14, 22–31. [Google Scholar]
- Simpson, R.J.S.; Pearson, K. Report on certain enteric fever inoculation statistics. Br. Med. J. 1904, 2, 1243–1246. [Google Scholar] [CrossRef]
- Stanley, T.D.; Jarrell, S.B. Meta-regression analysis: A quantitative method of literature surveys. J. Econ. Surv. 1989, 3, 161–170. [Google Scholar] [CrossRef]
- Espey, M. Explaining the variation in elasticity estimates of gasoline demand in the United States: A meta-analysis. Energy J. 1996, 17, 49–60. [Google Scholar] [CrossRef]
- Espey, M. Gasoline demand revisited: An international meta-analysis of elasticities. Energy Econ. 1998, 20, 273–295. [Google Scholar] [CrossRef]
- Brons, M.; Nijkamp, P.; Pels, E.; Rietveld, P. A meta-analysis of the price elasticity of gasoline demand. A SUR approach. Energy Econ. 2008, 30, 2105–2122. [Google Scholar] [CrossRef]
- Havranek, T.; Irsova, Z. Survey article: Publication bias in the literature on foreign direct investment spillovers. J. Dev. Stud. 2012, 48, 1375–1396. [Google Scholar] [CrossRef]
- Haveranek, T.; Kokes, O. Income elasticity of gasoline demand: A meta-analysis. Energy Econ. 2015, 47, 77–86. [Google Scholar] [CrossRef]
- Hanly, M.; Dargay, J.; Goodwin, P. Review of Income and Price Elasticities in the Demand for Road Traffic; ESRC TSU Publication 2012/13; Centre for Transport Studies, University of London: London, UK, 2002. [Google Scholar]
- Espey, J.A.; Espey, M. Turning on the lights: A meta-analysis of residential electricity demand elasticities. J. Agric. Appl. Econ. 2004, 36, 65–81. [Google Scholar] [CrossRef]
- Labandeira, X.; Labeaga, J.M.; López-Otero, X. A meta-analysis on the price elasticity of energy demand. Energy Policy 2017, 102, 549–568. [Google Scholar] [CrossRef]
- Stanley, T.D.; Doucouliagos, H. Identifying and Correcting Publication Selection Bias in the Efficiency-Wage Literature: Heckman Meta-Regression; SWP 2007/11; Deakin University: Burwood, Australia, 2007. [Google Scholar]
- Feng, L.; Zhang, D.; Wang, X.Q. Econometric analysis and modeling on residential demand of natural gas in Shanghai. Nat. Gas Ind. 2009, 29, 120–122. [Google Scholar]
- Gao, Q.H.; Ye, Z.L.; Dai, L.; Tan, C.Y. Case study of natural gas price elasticity in Chengdu, Southwest China. Nat. Gas Ind. 2012, 32, 113–116. [Google Scholar]
- Cheng, J.H.; Liu, L.; Wang, X.L.; Xiao, J.Z. Research on the difference analysis of natural gas regional market demand elasticity and the impact of price regulation. China Popul. Resour. Environ. 2014, 24, 131–140. [Google Scholar]
- Zheng, Y. Research on the short-term and long-term demand elasticity of China’s civil natural gas: Taking Shanghai as an example. Spec. Zone Econ. 2012, 11, 49–51. [Google Scholar]
- Zhang, Y.; Ji, Q.; Fan, Y. The price and income elasticity of China’s natural gas demand: A multi-sectoral perspective. Energy Policy 2018, 113, 332–341. [Google Scholar] [CrossRef]
- Wang, T.; Lin, B.Q. China’s natural gas consumption and subsidies—From a sector perspective. Energy Policy 2014, 65, 541–551. [Google Scholar] [CrossRef]
- Yu, Y.H.; Zheng, X.Y.; Han, Y. On the demand for natural gas in urban China. Energy Policy 2014, 70, 57–63. [Google Scholar] [CrossRef]
- Sun, C.W.; Ouyang, X.L. Price and expenditure elasticities of residential energy demand during urbanization: An empirical analysis based on the household-level survey data in China. Energy Policy 2016, 88, 56–63. [Google Scholar] [CrossRef]
- Zeng, S.P.; Chen, Z.M.; Alsaedi, A.; Hayat, T. Price elasticity, block tariffs, and equity of natural gas demand in China: Investigation based on household-level survey data. J. Clean. Prod. 2018, 179, 441–449. [Google Scholar] [CrossRef]
- Zhang, C.M.; Peng, S.N. Analysis of the market position of natural gas in China based on energy production and consumption elasticity. Adv. Mater. Res. 2012, 343–344, 212–215. [Google Scholar] [CrossRef]
- Nelson, J.P.; Kennedy, P.E. The use (and abuse) of meta-analysis in environmental and natural resource economics: An assessment. Environ. Resour. Econ. 2009, 42, 345–377. [Google Scholar] [CrossRef]
- Boys, K.A.; Florax, R.J.G.M. Meta-regression estimates for CGE models: A case study for input substitution elasticities in production agriculture. In Proceedings of the American Agricultural Economics Association Annual Meeting, Portland, OR, USA, 29 July–1 August 2007. [Google Scholar]
© 2018 by the authors. Licensee MDPI, Basel, Switzerland. This article is an open access article distributed under the terms and conditions of the Creative Commons Attribution (CC BY) license (http://creativecommons.org/licenses/by/4.0/).