Article

Design of an Emergency Energy System for a City Assisted by Renewable Energy, Case Study: Latakia, Syria

1
Department of Sustainable Technologies, Faculty of Tropical AgriSciences, Czech University of Life Sciences Prague, Kamýcká 961/129, 16500 Prague, Czech Republic
2
Department of Electrical Power Engineering, Faculty of Electrical Engineering, Czech Technical University in Prague, Technická 2, 16627 Prague, Czech Republic
3
Chercheur Associé au Laboratoire ICAR, UMR 5191, CNRS, Université Lumière Lyon 2, ENS de Lyon, 15, Parvis René Descartes BP 7000, CEDEX 07, 69342 Lyon, France
4
Chercheur Associé au Centre Max Weber UMR 5283, Projet JADN, Institut des Systèmes Complexes, Université Lumière Lyon 2, 5 Avenue Pierre-Mendès-France, 69676 Bron, France
5
Department of Health Care Disciplines and Population Protection, Faculty of Biomedical Engineering, Czech Technical University in Prague, Sportovců 2311, 27201 Kladno, Czech Republic
*
Author to whom correspondence should be addressed.
Energies 2018, 11(11), 3138; https://doi.org/10.3390/en11113138
Submission received: 18 October 2018 / Revised: 8 November 2018 / Accepted: 10 November 2018 / Published: 13 November 2018
(This article belongs to the Section A: Sustainable Energy)

Abstract

:
Electrical energy is one of the most important daily needs. Shortage of energy can be very dangerous for any society. This can affect the standard of living and quality of life of the people and even endanger the lives of those in hospitals, and so forth. Developed countries do not face such risks in general because they have well organized electrical systems and high energy security. The developing countries are faced daily with electric system collapses, especially in the case of wars, where many parts of the electrical grid in the country can be damaged and fuel transmission lines for generators cut off. Urban areas in developing countries should have a strategic plan to deal with any unexpected occurrence of energy shortages using any available renewable energy sources. City of Latakia is located in the region which has been suffering from the consequences of war for more than six years. The fact that a high number of migrants from other cities have come to Latakia along with a lack of fuel makes the energy shortage in the city worse. An emergency system could use the cheapest available renewable energy sources in addition to few big portable generators to provide an acceptable energy supply for the most needed requirements of daily life.

1. Introduction

The discovery of electricity was one of the most important things which moved civilization on to the level it is at present. Getting a continuous and stable electric-power supply is one of the most important needs of human existence in the modern age, especially in cities where daily human activities are high both during the day and night hours [1]. Our high dependence on electricity in modern life in all sectors such as health, education, industry, business, communication, transport, food, … etc. makes long-term interruption in electricity supply equivalent to a disaster in modern life. Therefore, any interruption to electricity supply for long hours significantly affects social economic life, causes financial loss, negatively affects a nation’s economy, decrease the Gross Domestic Product (GDP), retards development and daily life activities [2,3,4].
Using electrical energy in the cities does not result in any emissions because power plants are usually located far from the cities so that their effects on human health and the environment in cities is reduced to the barest minimum. But due to poverty and weak infrastructure in developing countries, old ways of heating or cooking such as diesel and wood-burning are being used, most especially in the suburbs of cities. Using such methods is very harmful to people’s health and the surrounding environment since they emit a lot of emissions [5,6]. In the same way, energy stored in fossil fuels that is released by human activity causes environmental pollution. Furthermore, fossil fuel energy resources are exhaustible and alternatives will be needed in the near future [7]. The extensive exploitation of renewable energy sources in cities has become an essential and practical strategy for fostering sustainable development [8].
Renewable energy sources such as solar, wind and biomass energy has become an essential part of the modern grid owing to the fact that renewable energy resources are clean and cannot be depleted; other reasons are that this reduces global warming, that there are limited levels of fossil fuel in the world and that diversification of energy sources achieves high levels of energy security, in addition to improving voltage profile and power quality [7,9,10,11,12,13,14]. A lot of developing countries are susceptible to armed conflicts, natural disasters, regional and international disputes, economic crises, wars… and so forth which can affect power supply and rapidly increase the population in some regions due to migration from the neighbouring areas. In such cases an energy crisis can force people to use all alternative solutions to continue their daily life, even the oldest ones. An energy crisis in itself and these alternative solutions for it can have considerable negative effects on health, environment, education… etc. Most cities in the developing countries have renewable sources which have not yet been invested in, especially biomass and solar energy. Renewables can play a major role in mitigating an energy crisis especially in the remote areas of developing countries. Considerable research has been done on the ability of renewable energy sources to solve the problems related to energy shortages. Some of these projects have been proposed to mitigate electric-power crises in Pakistan, China and Bangladesh [15,16,17,18] and others are about to be implemented in Africa and India [19,20,21]. In addition, Renewable energy sources, together with the use of new eco-sustainable systems with low energy consumption [22,23] and new building technologies that use the new generation of low-cost Smart-Windows [24], could be associated with local energy sources that can play an important role in the emergency system for any city or country but we also need a stable source of energy.
Continuous electricity supply enhances energy security, as energy security is a very important aspects of the energy plans of countries, mostly in situations where it is essential to have many sources of energy supply and to also have alternative sources of power in case of armed conflicts, natural disasters and so forth. Power shortages and climate change are two great problems today. For this reason, the power sector must get rid of carbon emitting plants to create a pollution-free environment [21]. It is hoped that renewable energy sources will help to reduce energy crises and prevent further climate change. Renewable energy is one of the fundamental resources needed to help achieve the social, economic and environmental goals of mankind [25,26,27]. Access to clean energy is essential for well-being, poverty reduction and the sustainable development of cities [28]. These resources, in combination with several large portable power plants could be very effective in facing crises. Energy security plans can be locally or centrally organized. Local plans may be more efficient because each municipality can adopt a strategy according to its geographical location and the available energy sources. As result of the above, designing and implementing an emergency energy system is highly important for every city in the developing countries.
In this paper, the Syrian city, Latakia is discussed as a case study of a city which has faced an unexpected energy crisis and its related consequences. The methodology adopted in the study and the data sources used for the analysis are also discussed in order to present the energy crisis effects on urban areas and to show the importance of emergency energy systems. The data presented in this article has been collected by the authors and several volunteers.

2. Methodology

Designing the emergency energy system and figuring out its capacity depend on two important factors which can arise when any city, in particular, faces an unexpected situation. These two factors are:
1.
Energy shortage (electricity): We can consider 6 emergency levels according to the electricity cut off hours per day as shown in Table 1.
For our methodology, we will assume an average case where rationing hours are 6 daily, corresponding to emergency level 3, which implies a 25% decrease in the energy supply; we will also consider the expected demand for energy for this city in the future over the next 2 years, where the total system will be updated every 2 years.
2.
Migration: where in case of war or natural disasters, people migrate to other safe cities or areas and this causes an increase in residential energy consumption. We will consider 4 emergency levels according to the population increase percentage as Table 2 shows:
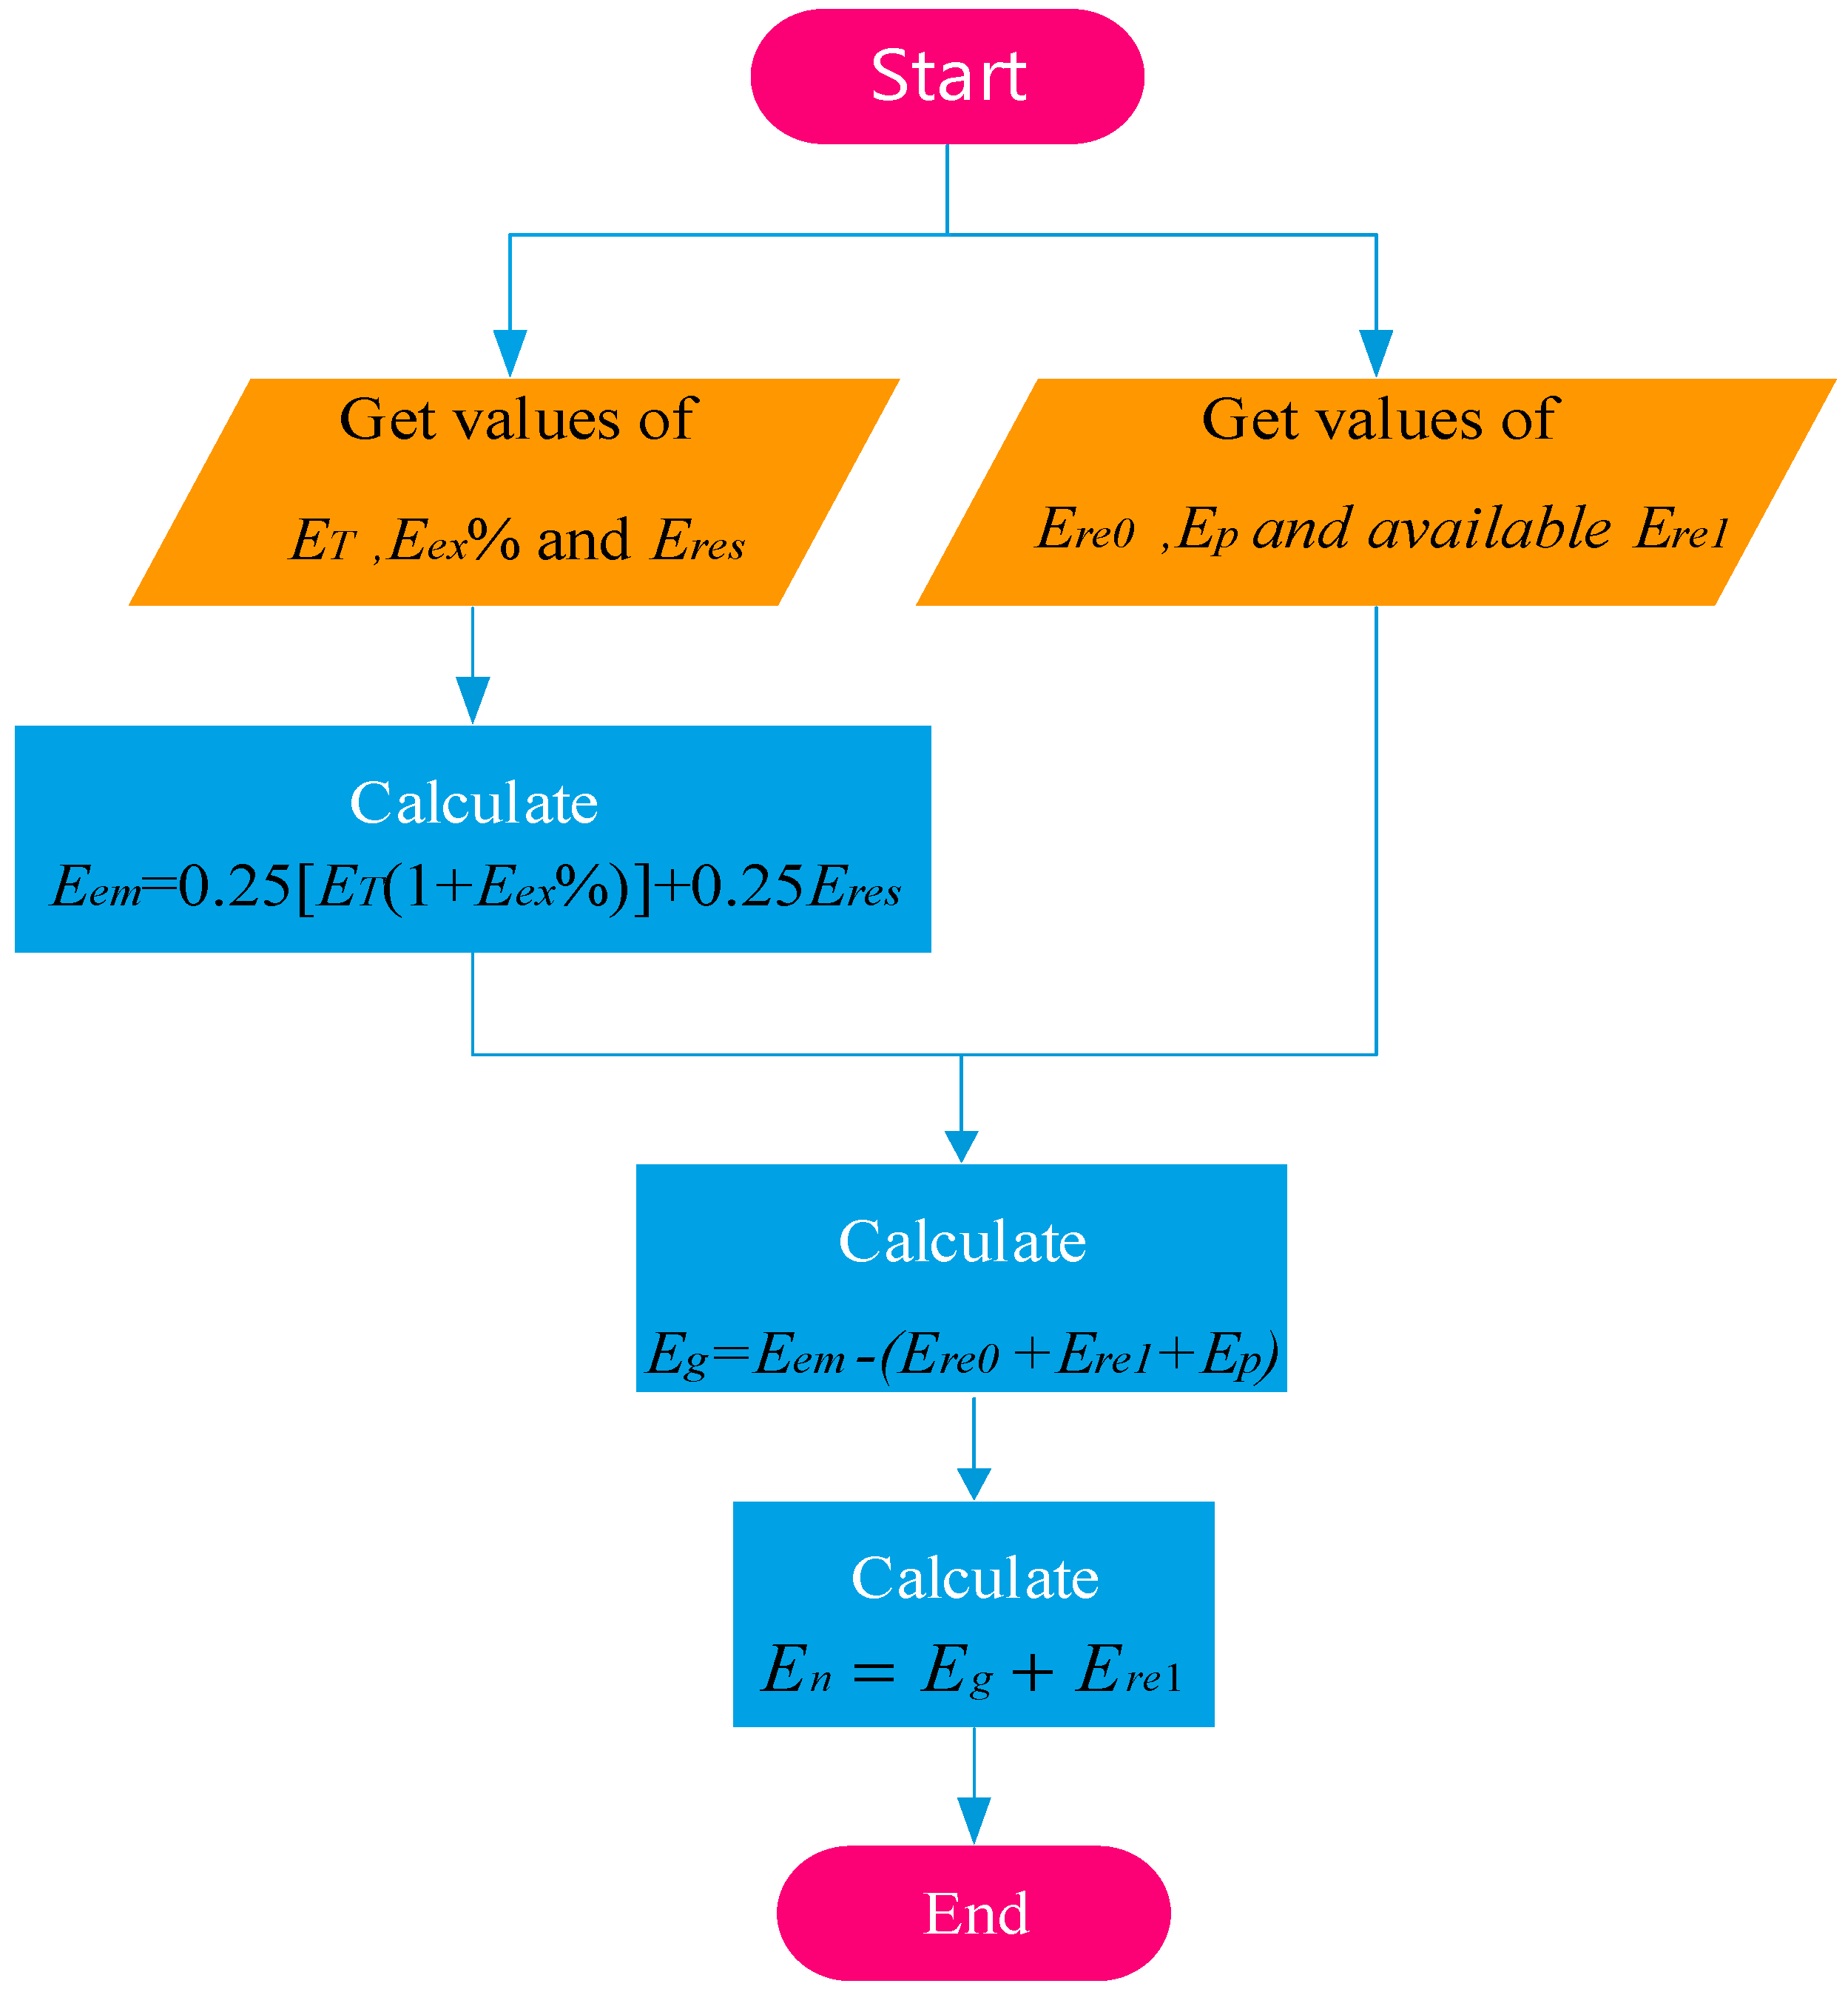
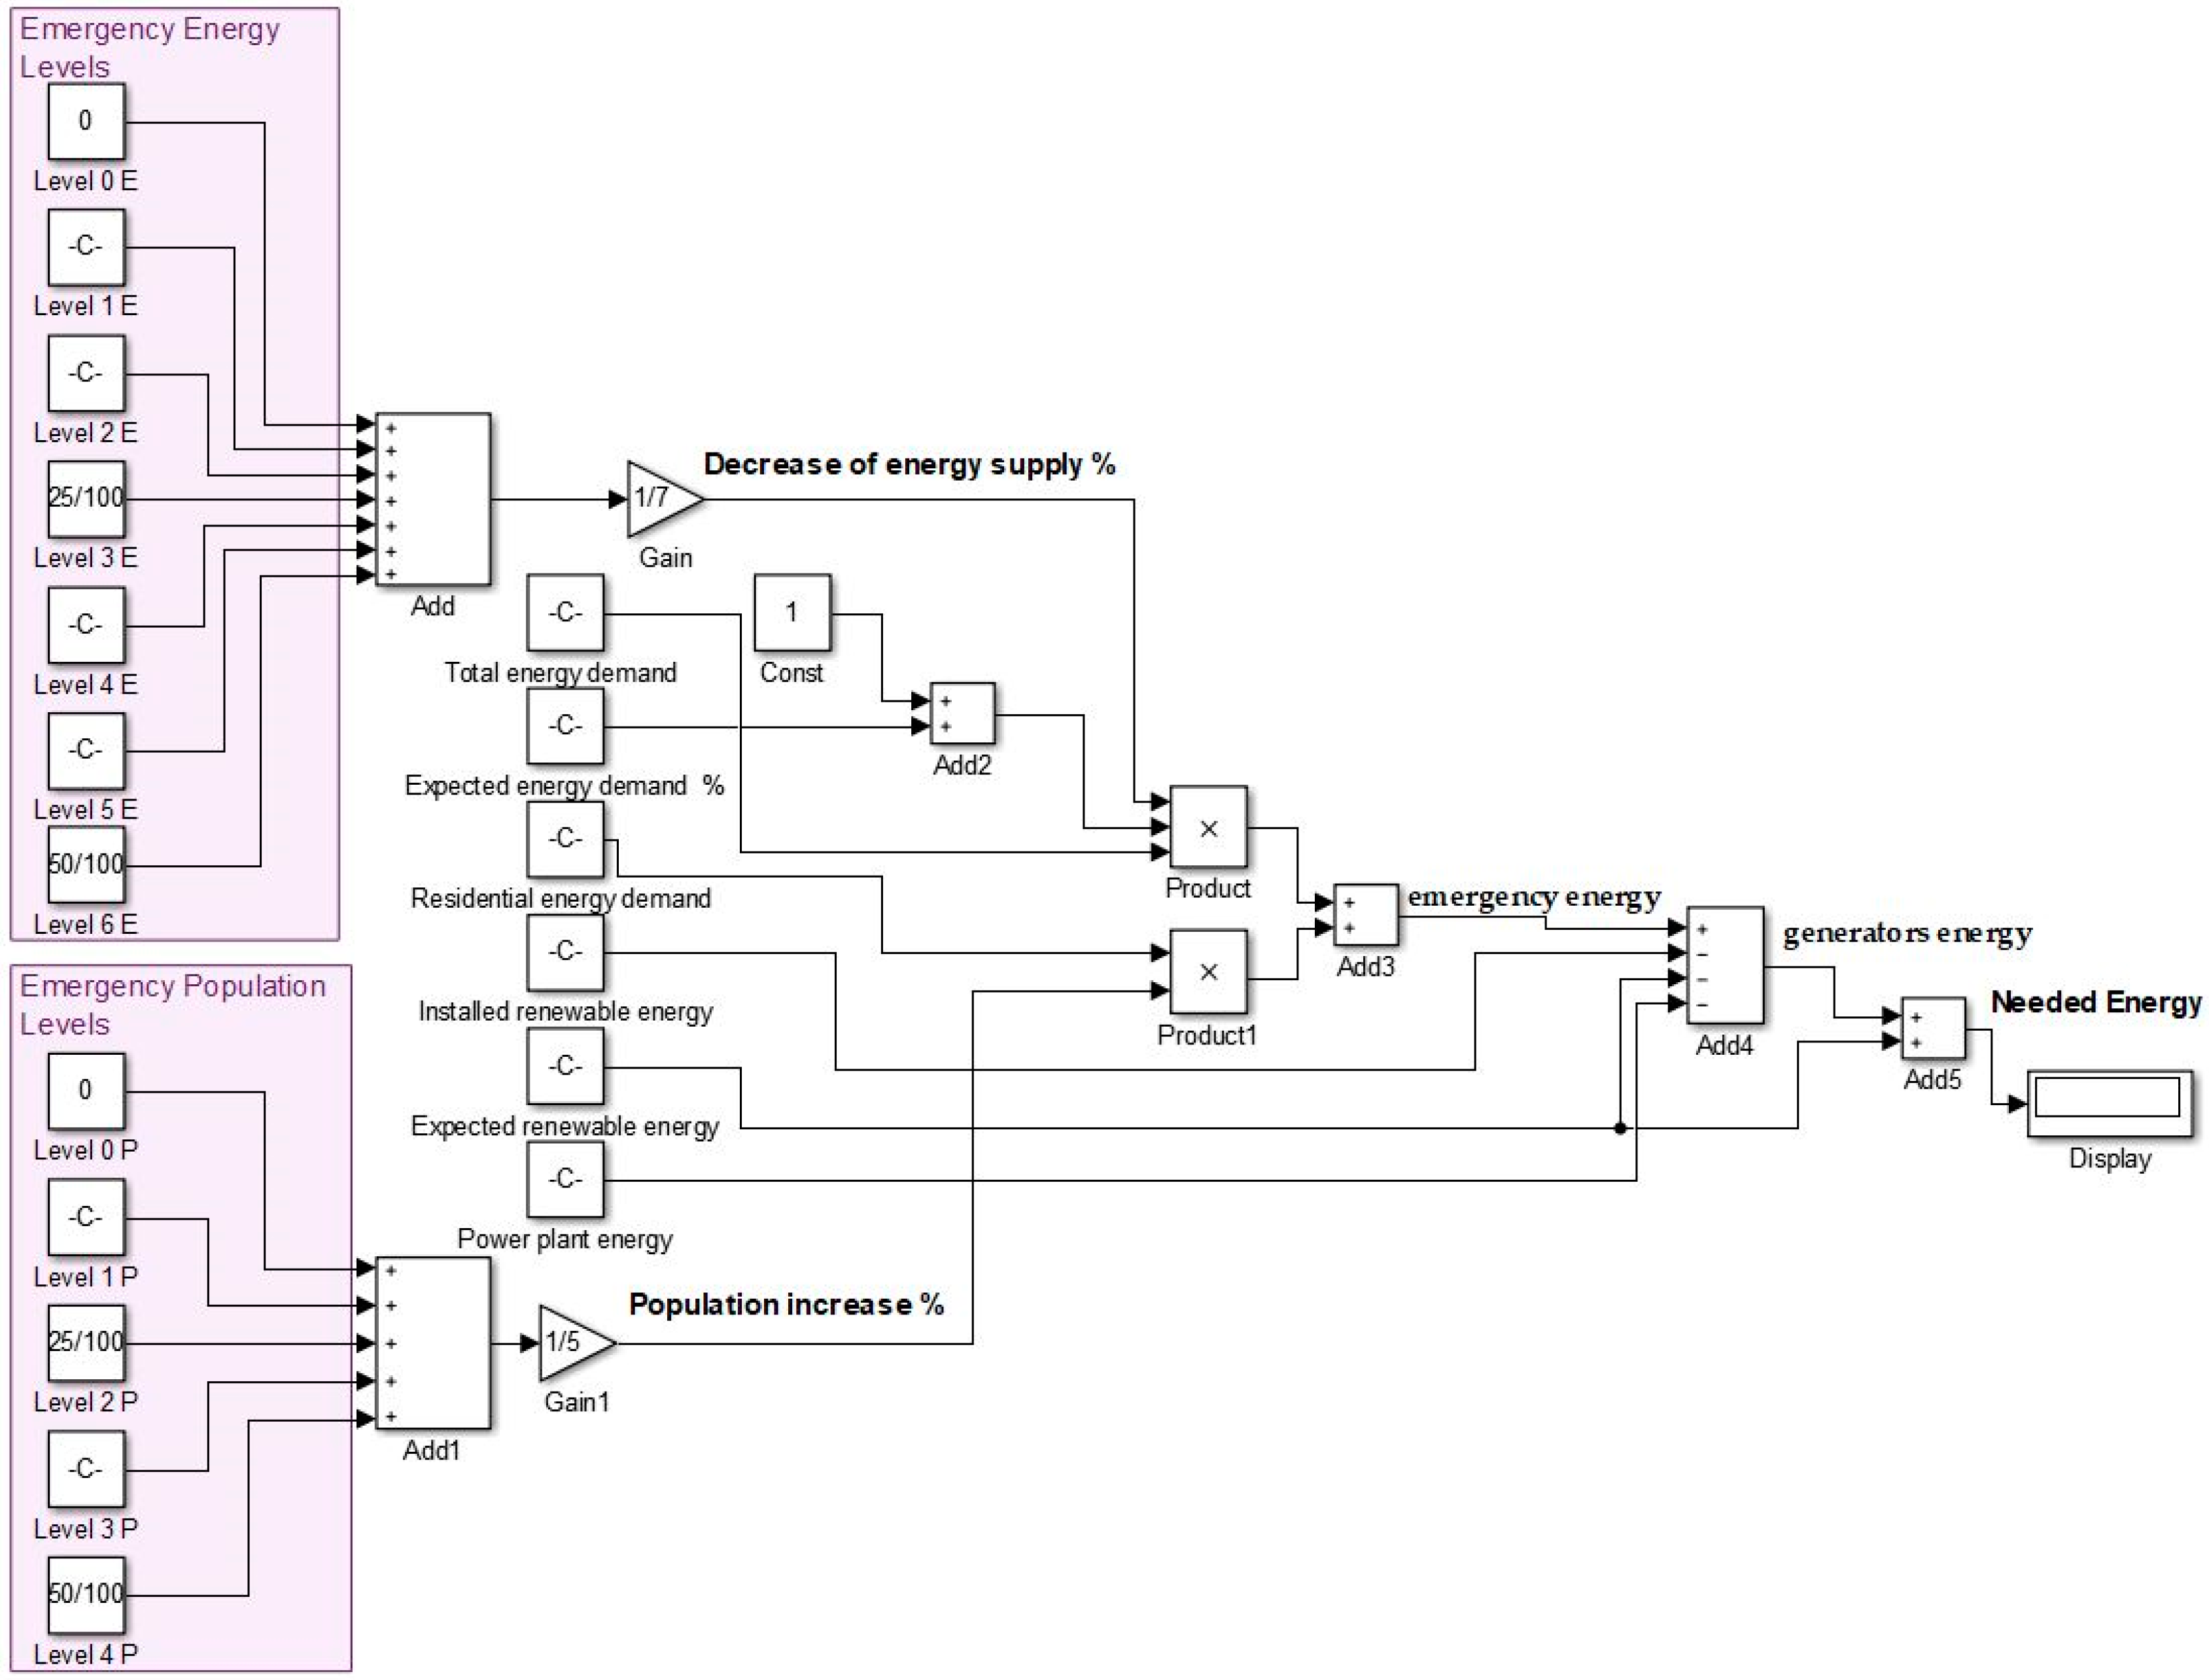
Here we will also consider the average case where the percentage of population increase is 25% corresponding to emergency level 2. Any expected increase in the demand for energy due to the native population increases will not be considered because they are included in the previous factor.
Using these two factors we can define an emergency energy function according to the following Equation (1):
  E e m = 0.25 [ E T ( 1 + E e x % ) ] + 0.25 E r e s  
where:
  • E e m : emergency energy.
  • E T : total energy demand for the city in 1 year.
  • E e x % : the percentage of expected energy demand for the next 2 years.
  • E r e s : residential energy demand in the city.
This emergency energy will come from different sources:
  • Power plants: if there is a power plant close to the city and the fuel supply for this plant is secure and stable.
  • Installed renewable sources: if any renewable sources are installed in city and the expected energy can be produced from them.
  • Uninstalled renewable energy: the cheapest and most available renewable energy sources in the city which could be shared to solve the energy shortage problem.
  • Portable generators energy: these generators can share the load with the previous sources whenever energy produced from renewable sources can-not be expected or is not stable, as we have to use alternative stable sources of electricity when renewable energy sources supply a city alone. These portable generators could be such as are used for industrial and commercial activities inside and outside the city and when any unexpected situation arises, they can be moved to residential areas where special rooms and filters should be used to reduce the noise and pollution inevitable with them.
The emergency energy produced can be as shown in the following Equation (2):
  E e m = E p + E r e 0 + E r e 1 + E g  
where:
  • E p : energy supplied from the power plant in one year (known).
  • E r e n 0 : energy supplied from installed renewable sources in one year (known).
  • E r e n 1 : expected energy produced from renewable sources which can be installed in one year (unknown).
  • E g : expected energy produced from generators which can be installed in one year (unknown).
The needed energy can be as in the following Equation (3):
  E n = E e m E r e 0 E p  
Now we have to calculate E r e n 1 and E g . Here we can consider two kinds of sources; the first is stable sources and the second is unstable sources, where the relationship between them can be formulated according to the following Equation (4):
  E e m = E s + E u s  
  • Stable sources: which include power plants and portable generators can give stable power for all day and which we can describe in the following Equation (5):
      E s = E p + E g  
  • Unstable sources: which include the installed and expected installed renewable sources; such sources are not stable sources and are related to the weather in general and we can describe them as in the following Equation (6):
      E u s = E r e 0 + E r e 1  
In our emergency system we will depend on both these, where we will consider the following mathematical relations (7) and (8):
  E s 0.5 E e m  
  E u s 0.5 E e m  
where the unstable source consists of renewable energy units. In some cities it could be very hard to produce half of the emergency energy from renewable sources. In addition, the stable source should provide at least half of the emergency energy, because a stable power source is very important for some serious sectors in every city. Therefore, the required energy from the generators could be calculated as in the following Equation (9):
  E g = E s E p  
And the required energy from the renewable sources will be according to the next Equation (10):
  E r e 1 = E u s E r e 0  
We can use the following algorithm to express the methodology and how we can get the required values as shown in Figure 1.
And in Figure 2 you can see MATLAB Simulink model for the calculations of the methodology.

3. Case Study: Latakia City, Syria

3.1. The Effects of the War on Syria

As the consequence of the occurring Syrian civil war, the whole region is unstable since 2011. Long lasting conflict remains because of the fragmented impact of many groups, including radical Islam militias, and so forth... the Syrian government and its service institutions, in addition to the civil people have faced many pressures and changes in many sectors. We mention that the presenting data from Latakia and Syria came from views, surveys, follow ups and contact with the responsible governmental institutions during the period 2011–2016.

3.1.1. The Social Sector (Especially the Family)

We not that spread of divorce, widows, orphans, disabled children because of losing body-parts due to injuries suffered because of the war, child labour, as a result of destitution, widespread increases in need and poverty, psychological and sexual violence against women and children … and so forth.

3.1.2. The Educational Sector

A large number of schools have stopped functioning and staff are out of work because of the destruction they have suffered in addition to the external migration and internal migration which forced hundreds of thousands of children to leave their schools, estimated at 3 million children, thus increasing the illiteracy rate among children in Syria after 2011, where, before this date, illiteracy was almost non-existent, as the percentage of children enrolled in basic education at the beginning of the academic year 2011 was 98%, declining in 2015 to less than 50%.

3.1.3. The Economic Sector

We note increases in poverty, weakening purchasing power due to rising prices and increase unemployment.

3.1.4. The Security Sector

We note a lack or loss of security and safety in most cities.

3.1.5. The Service Sector

We note the inability of state institutions to provide the necessary services to citizens as a result of the pressures imposed by the war, especially in the field of providing the necessary oil derivatives for daily life, in addition to an electrical energy shortage which has caused many to use alternative solutions which are nonetheless unable to compensate for shortfall in covering electricity demand while contributing to a large extent to increased pollution of the environment, with significant repercussions for public health.

3.1.6. The Demographic Sector

A new demographic map has been established that has affected the whole of Syrian geography, especially the Syrian regions and cities which are considered as safer than others, due to the absence of Islamic groups. This new demographic map has been formed due to the growth of two types of migration: External and internal where the internal one was to the safe areas and cities of Syria (Damascus City, Tartus City and Latakia City).
The Latakia portion from that migration was the largest compared to other cities when compared to its population and geographical area. Although there are no accurate statistical studies of the internal migration population, the estimated numbers indicate that one million inhabitants have reached the centre of Latakia governate and its regions and villages.
In our study we will study the energy problem and especially electricity.

3.2. An Overview of the Electricity System and Energy Sources in Latakia before the War

The supply of electricity and energy in Latakia before the war in 2010 was very effective where electricity was available 24/7 [29] and was used in all industrial, commercial, agricultural and residential sectors. Energy sources used was typically diesel or electricity for heating and gas for cooking.
Latakia city gets electricity through three 230/66 kV distribution stations which are connected to the national power system which run on various sources as shown in Figure 3 [29] where Syria depends on fossil fuels especially fuel and gas to get electricity and some renewable energy sources such as hydro energy and very small applications of solar and wind energy.
Most of these energy sources were available locally from oil and gas wells where oil production was 380,000 barrels per day and gas production was 21 million m3 per day in 2010. Syria also has two refineries which produce diesel, fuel and other products.

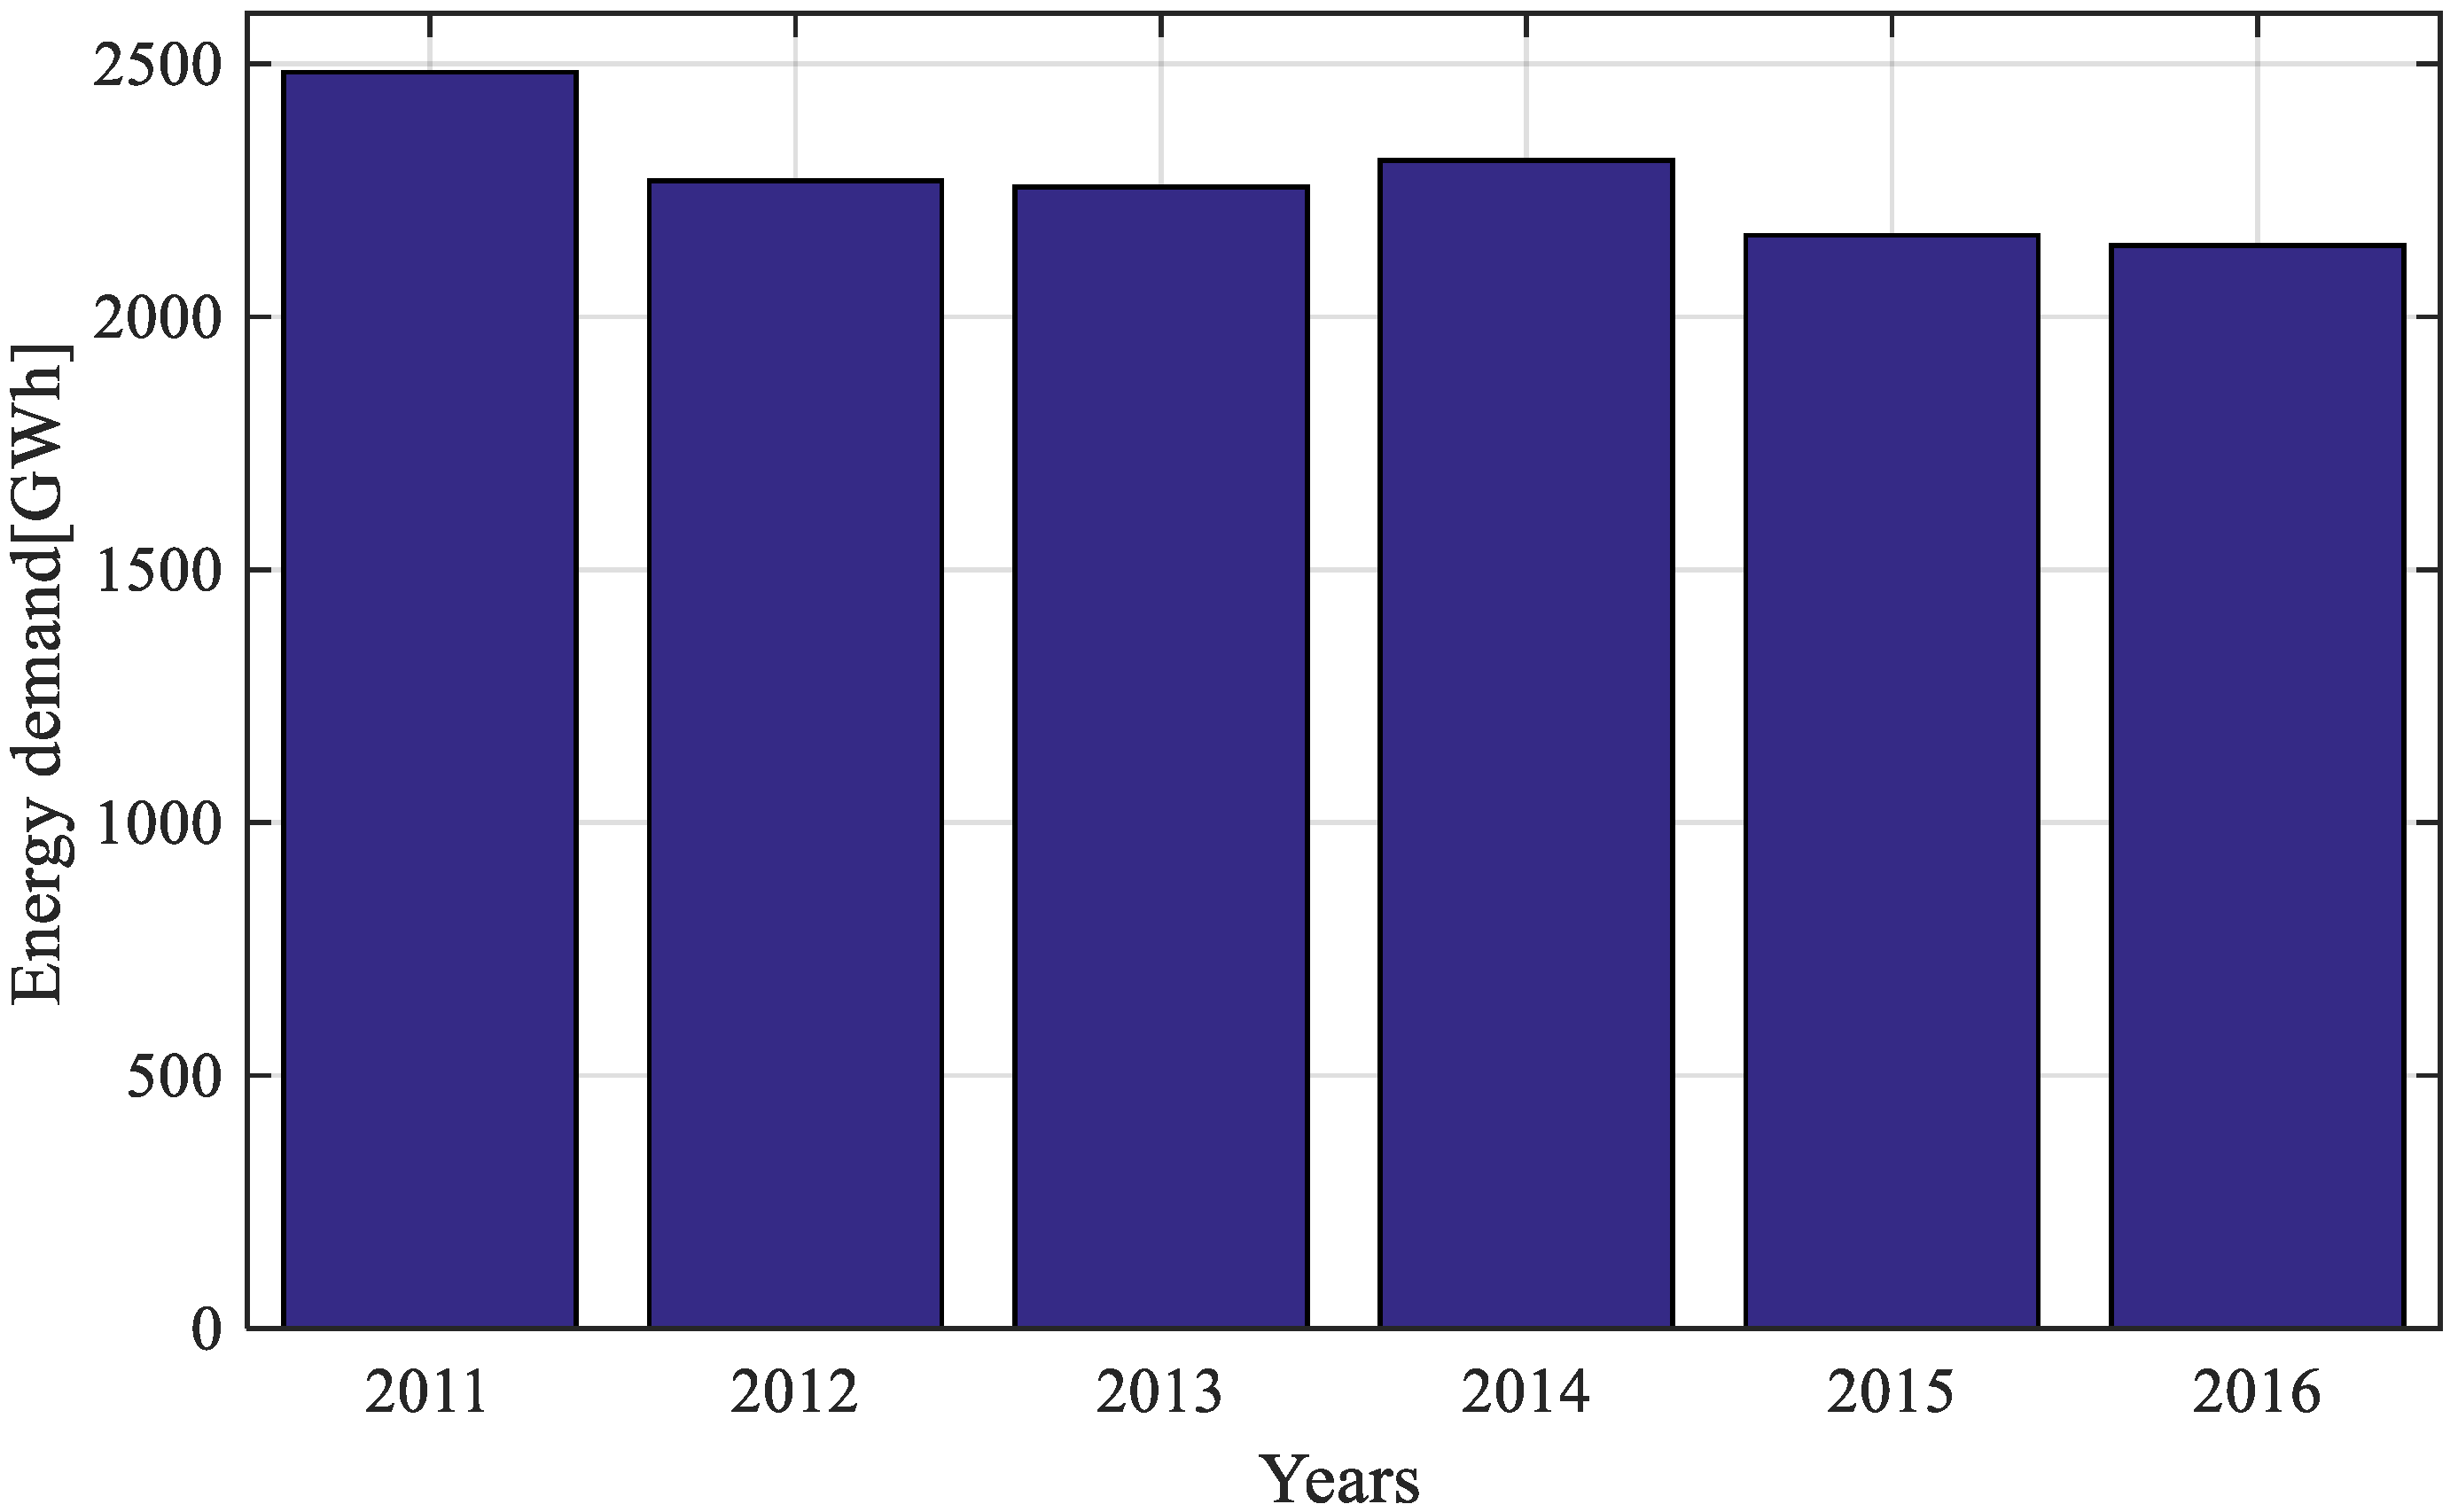
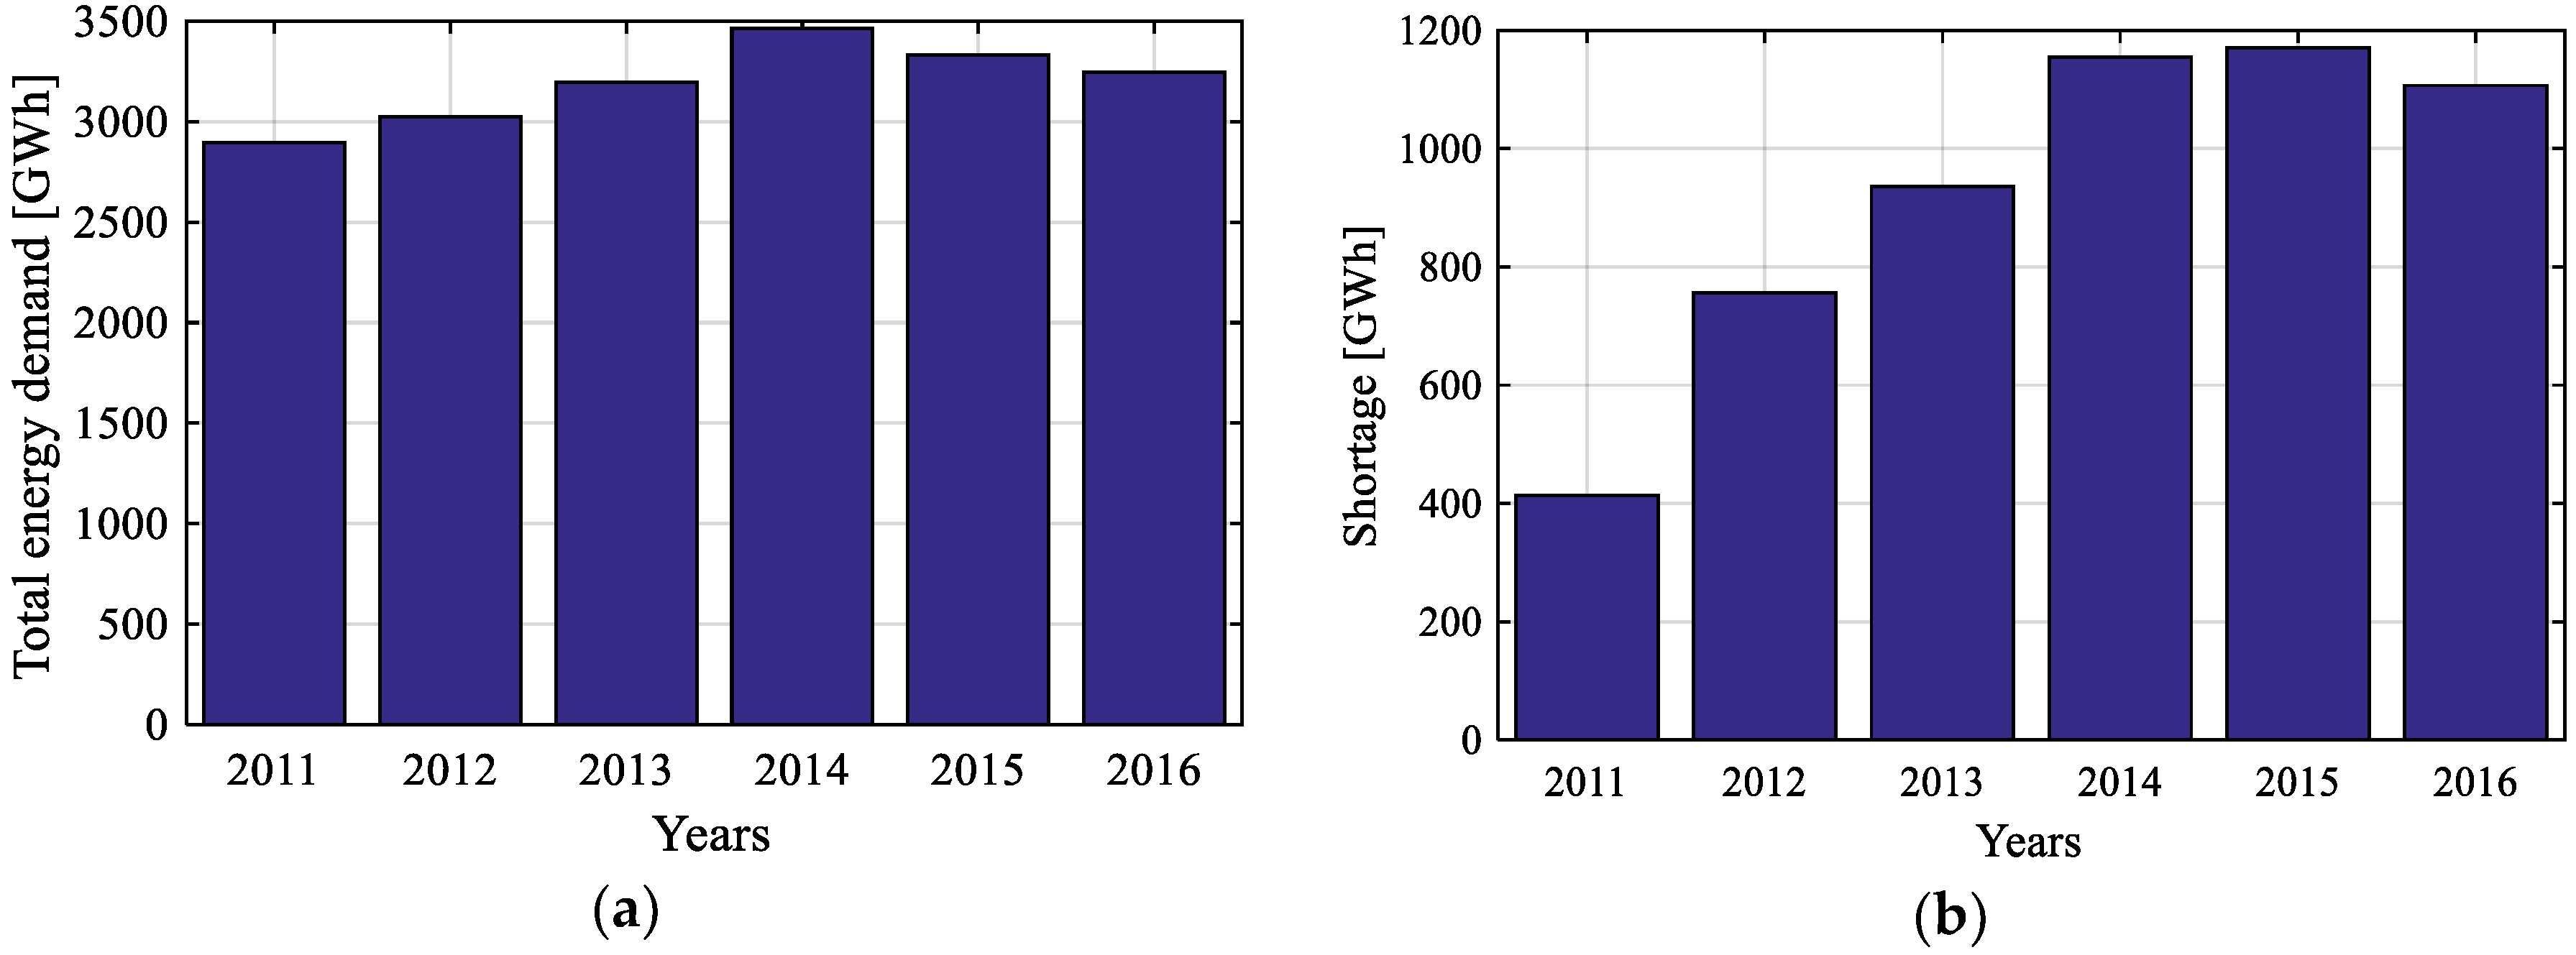
3.3. The Energy Shortage in Latakia during the War

We can summarize the energy situation from 2011 till 2016 with the following:

3.3.1. Rationing Hours

Since the start of the war in Syria in 2011 electricity hours started to decrease using a power rationing system where rationing hours were as shown in Figure 4 from [29] where we can notice an increase in rationing hours from 4 h in 2011 up to 14 h in 2015.

3.3.2. Peak Power Demand

Figure 5 [29] shows how peak demand has changed in Latakia where we can notice gradual increase from 2011 till 2015 and the highest increase was in 2015 where it is about 50% for to many reasons especially-migration from other parts of Syria to Latakia city. Also, we can notice that the increase in 2016 is less than 2015 as some families came back to Aleppo and Homs.

3.3.3. Peak Power Demand

Concerning demand for electric power there are two conditions:
1.  With Power Rationing
Figure 6 [29] shows the demand in this condition where the energy demand decreases slightly but in general we can say that it does not change a lot after 2011 because the available energy sources were limited and that expound the reason of rationing hours increase.
2.  Without Power Rationing
Where the Syrian ministry of electricity gave an approximate value for the demand for electric power every year. Figure 7 [29] shows total energy demand without power rationing and the relevant shortage values where we can notice that the energy demand without rationing is much bigger than it is with rationing and that demand is seen as increasing slightly after 2011. Regarding the energy shortage the figure shows how it increased rapidly between 2011 and 2014; the changes then become smaller because most people migrated to Latakia city during the period 2011 to 2014.

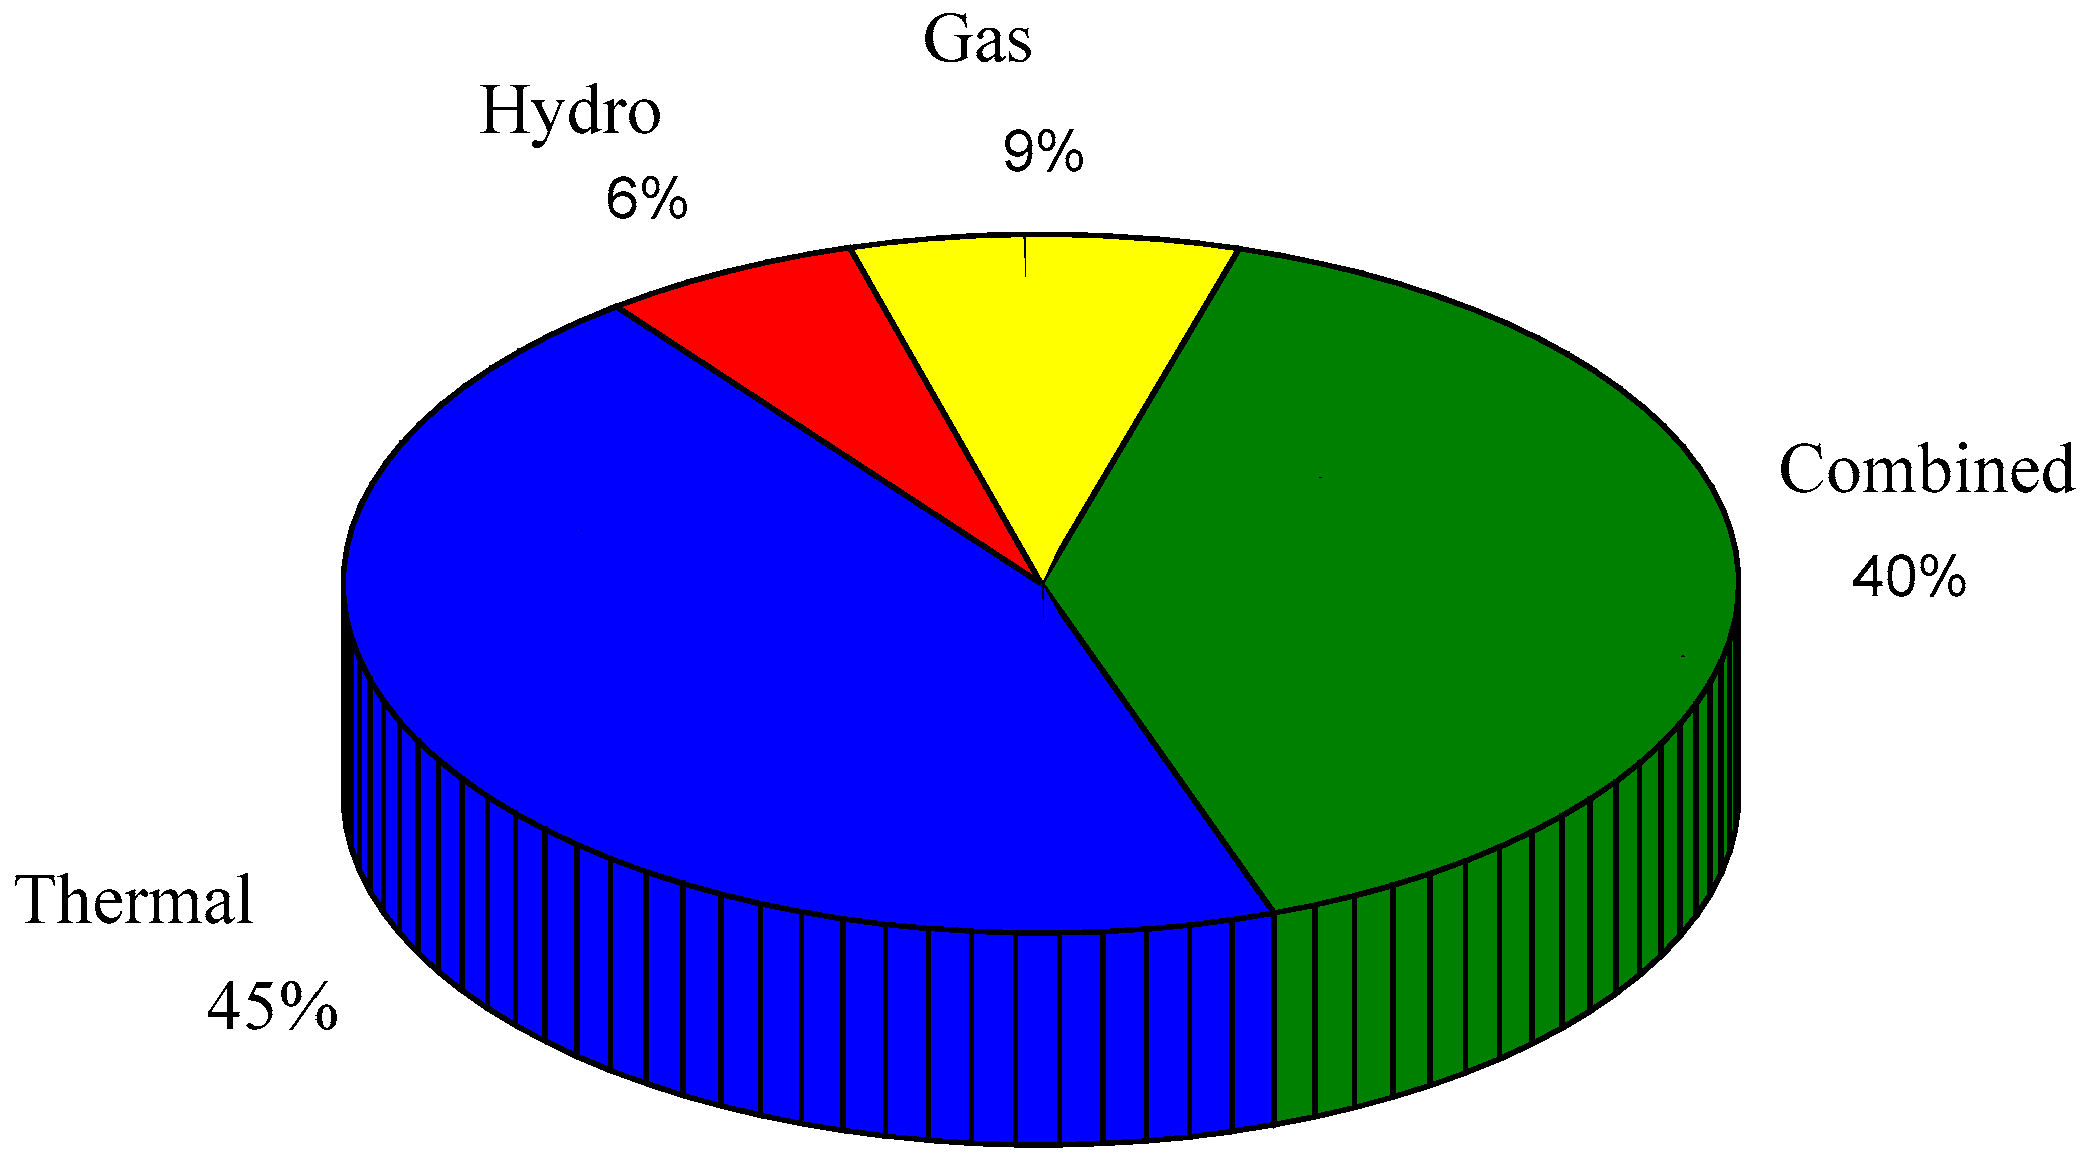
3.3.4. Energy Resources

Oil production decreased to 14,000 barrels per day and natural gas to 8.2 million m3 per day.

3.4. Causes of the Energy Shortage

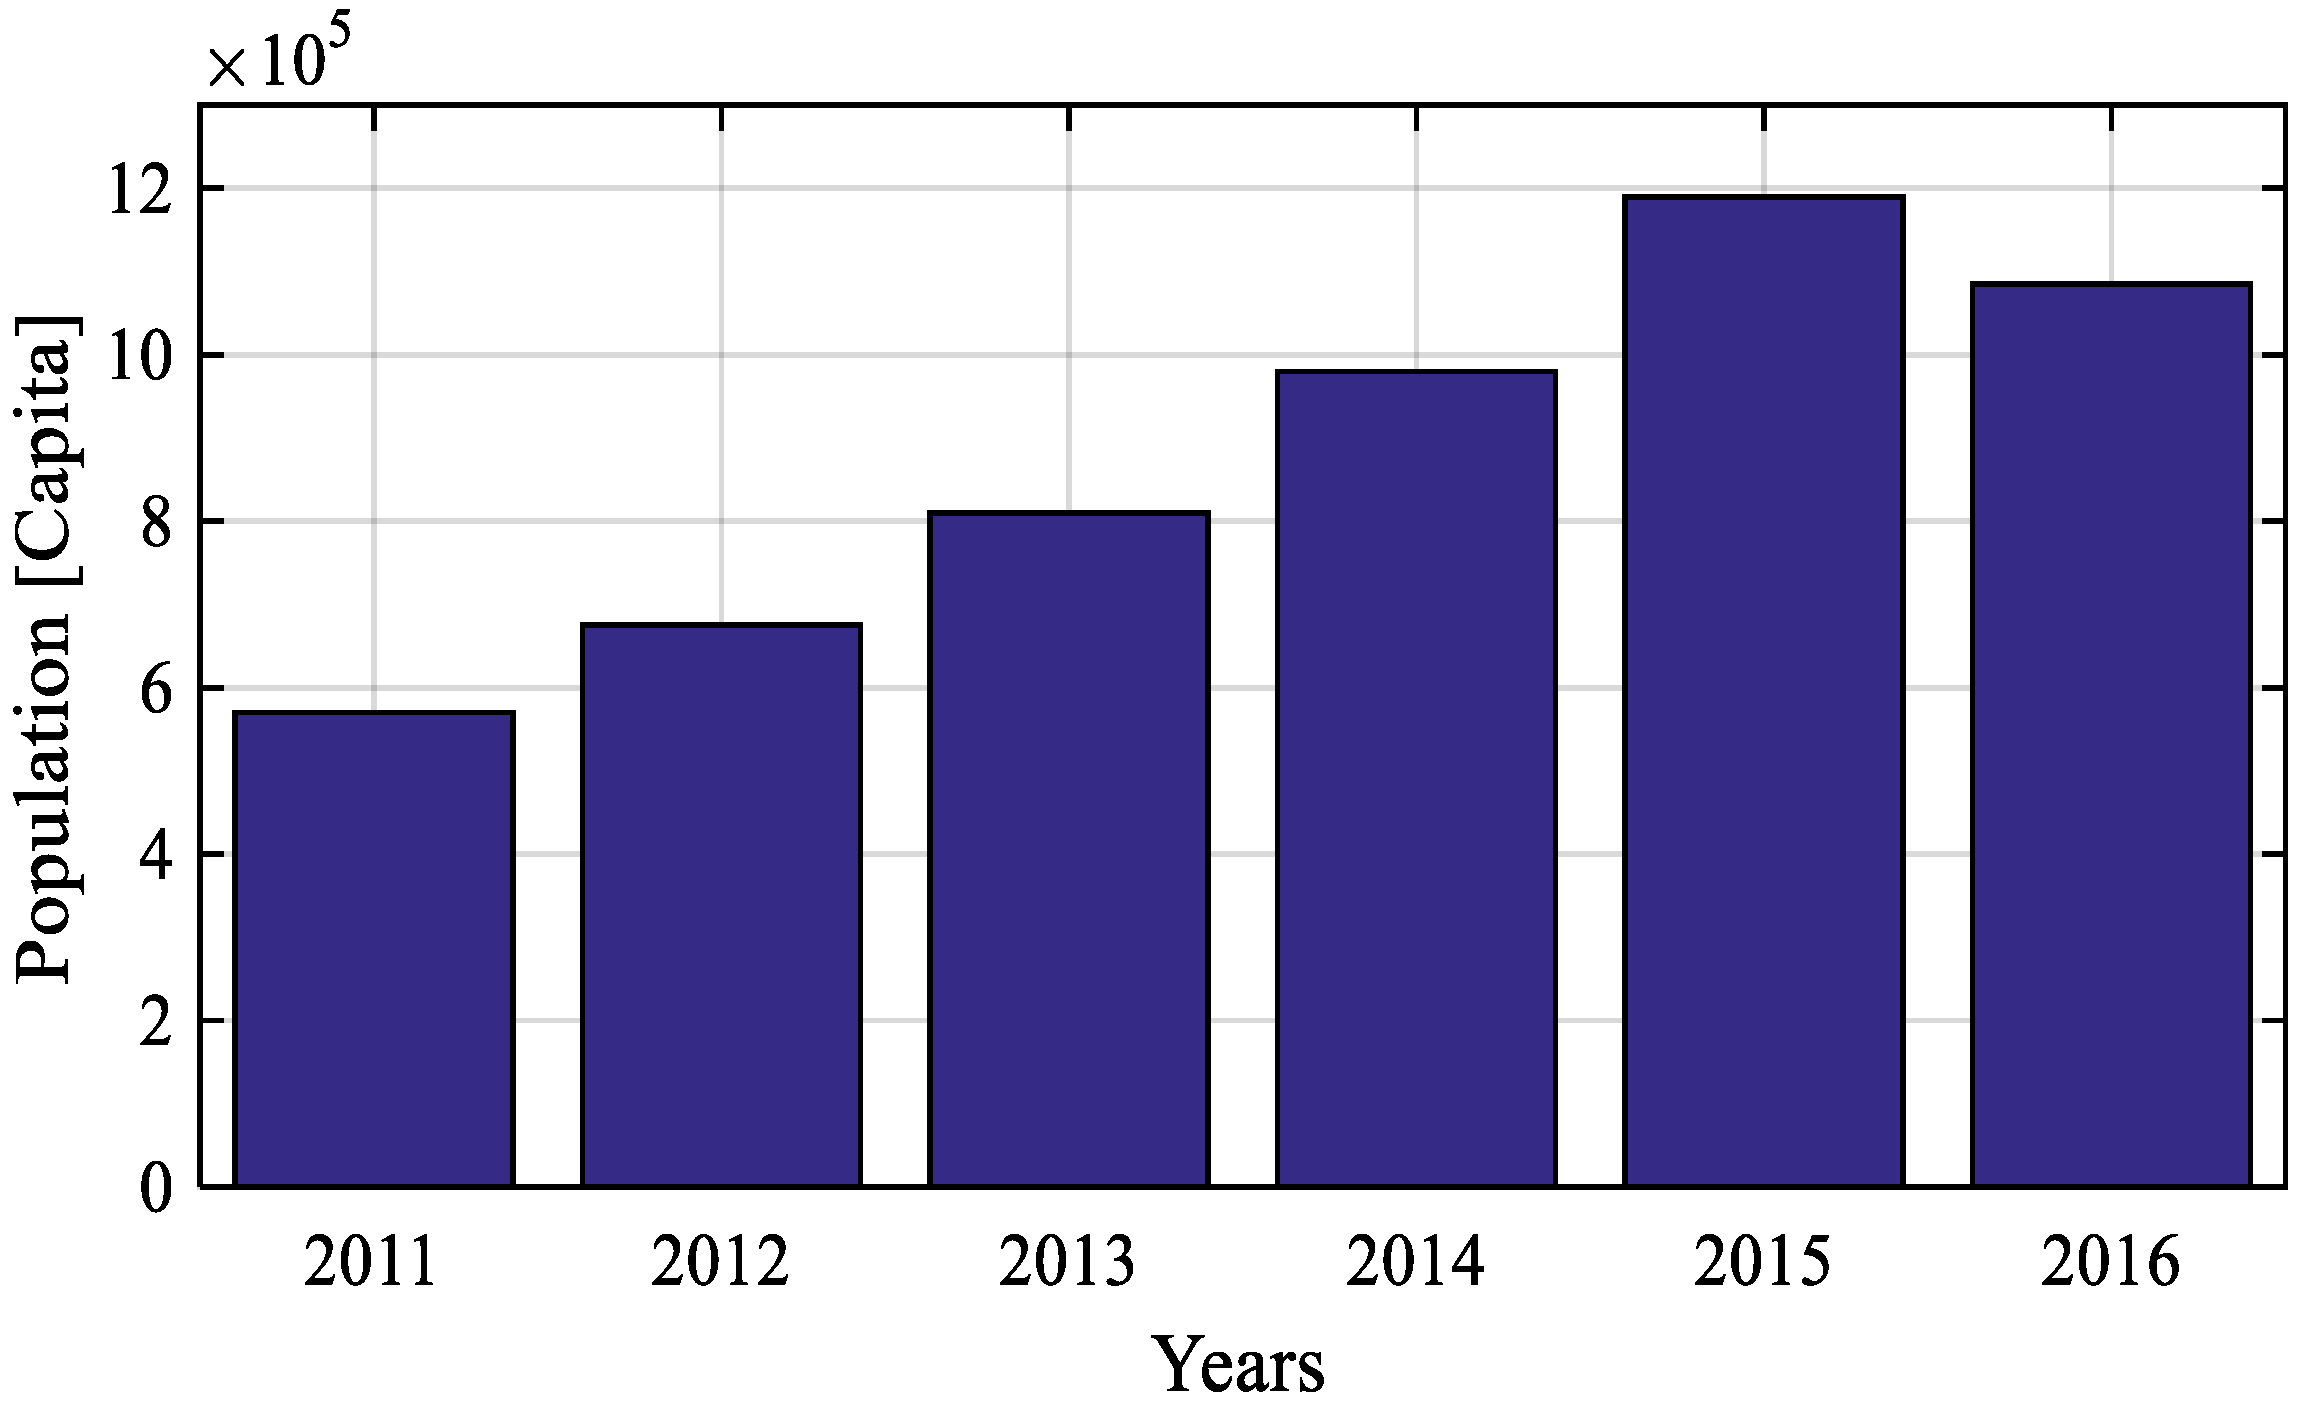
  • The appearance of ISIS in Syria has made people abandon their houses and go to safe areas and Latakia city is one of the safest cities in Syria as we mentioned before. And this has caused an increase in the population of Latakia city as shown in Table 3 and Figure 8 according to estimates, there being no formal statistics for the population. The numbers and percentages shown in the table relate to the population change only in the city centre of Latakia because most of the migrants live in the centre of the city in its various neighbourhoods. The change in the percentage in 2016 was a result of the liberation of Aleppo and Homs cities from radical Islamic groups, which contributed to the return of people from those cities to their homes.
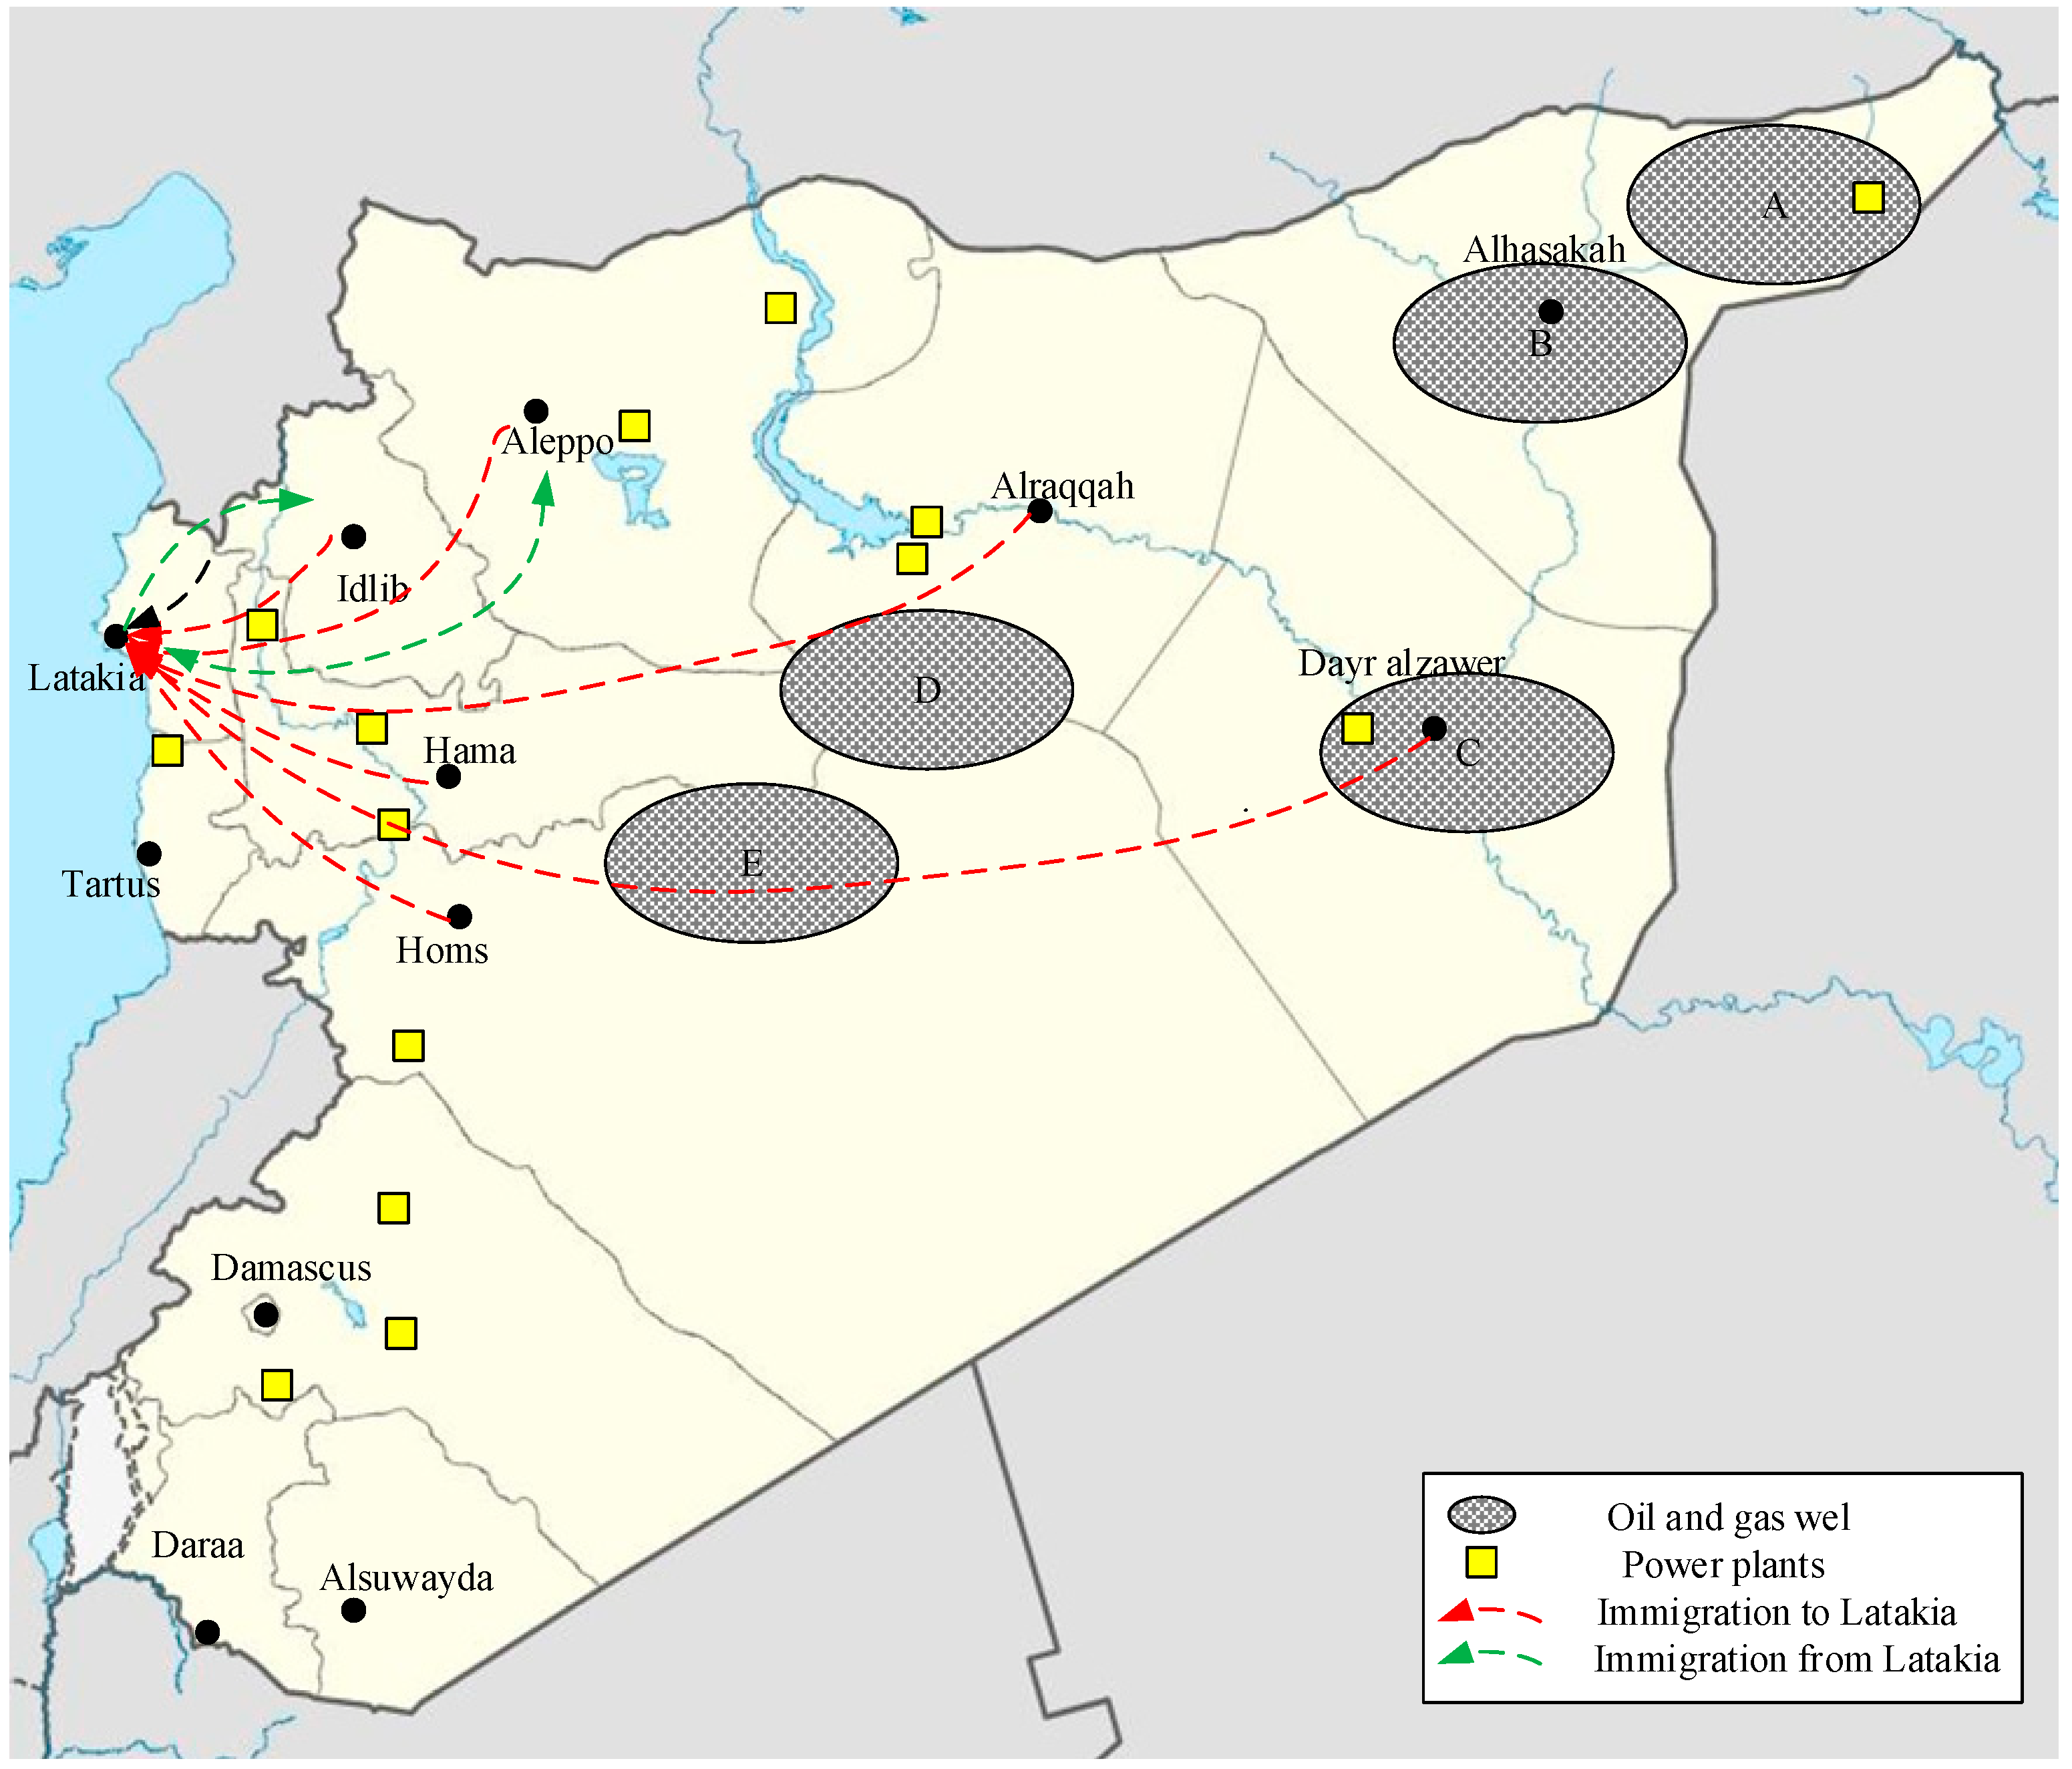
  • Significant decreases in oil and gas production were because ISIS captured most oil and gas wells in Homs and Deir Alzor as shown in Figure 9.
  • The destruction of power plants and transmission lines by ISIS and other “terrorists groups” such as in Homs, Aleppo and Hama reduced the ability to generate energy and to transmit it between governates. Figure 9 shows the power plants in Syria.
Figure 9 below shows the migration tracks of people from Aleppo, Hama, Idlib and Latakia rural to Latakia city where we can notice the high number of population who came to Latakia city and the locations of oil and gas wells which were located in the areas in the control areas of ISIS in addition to power plants.

3.5. The Current Solutions to the Shortage

Since 2011 people have started using 3 utilities to face energy shortages:
1.
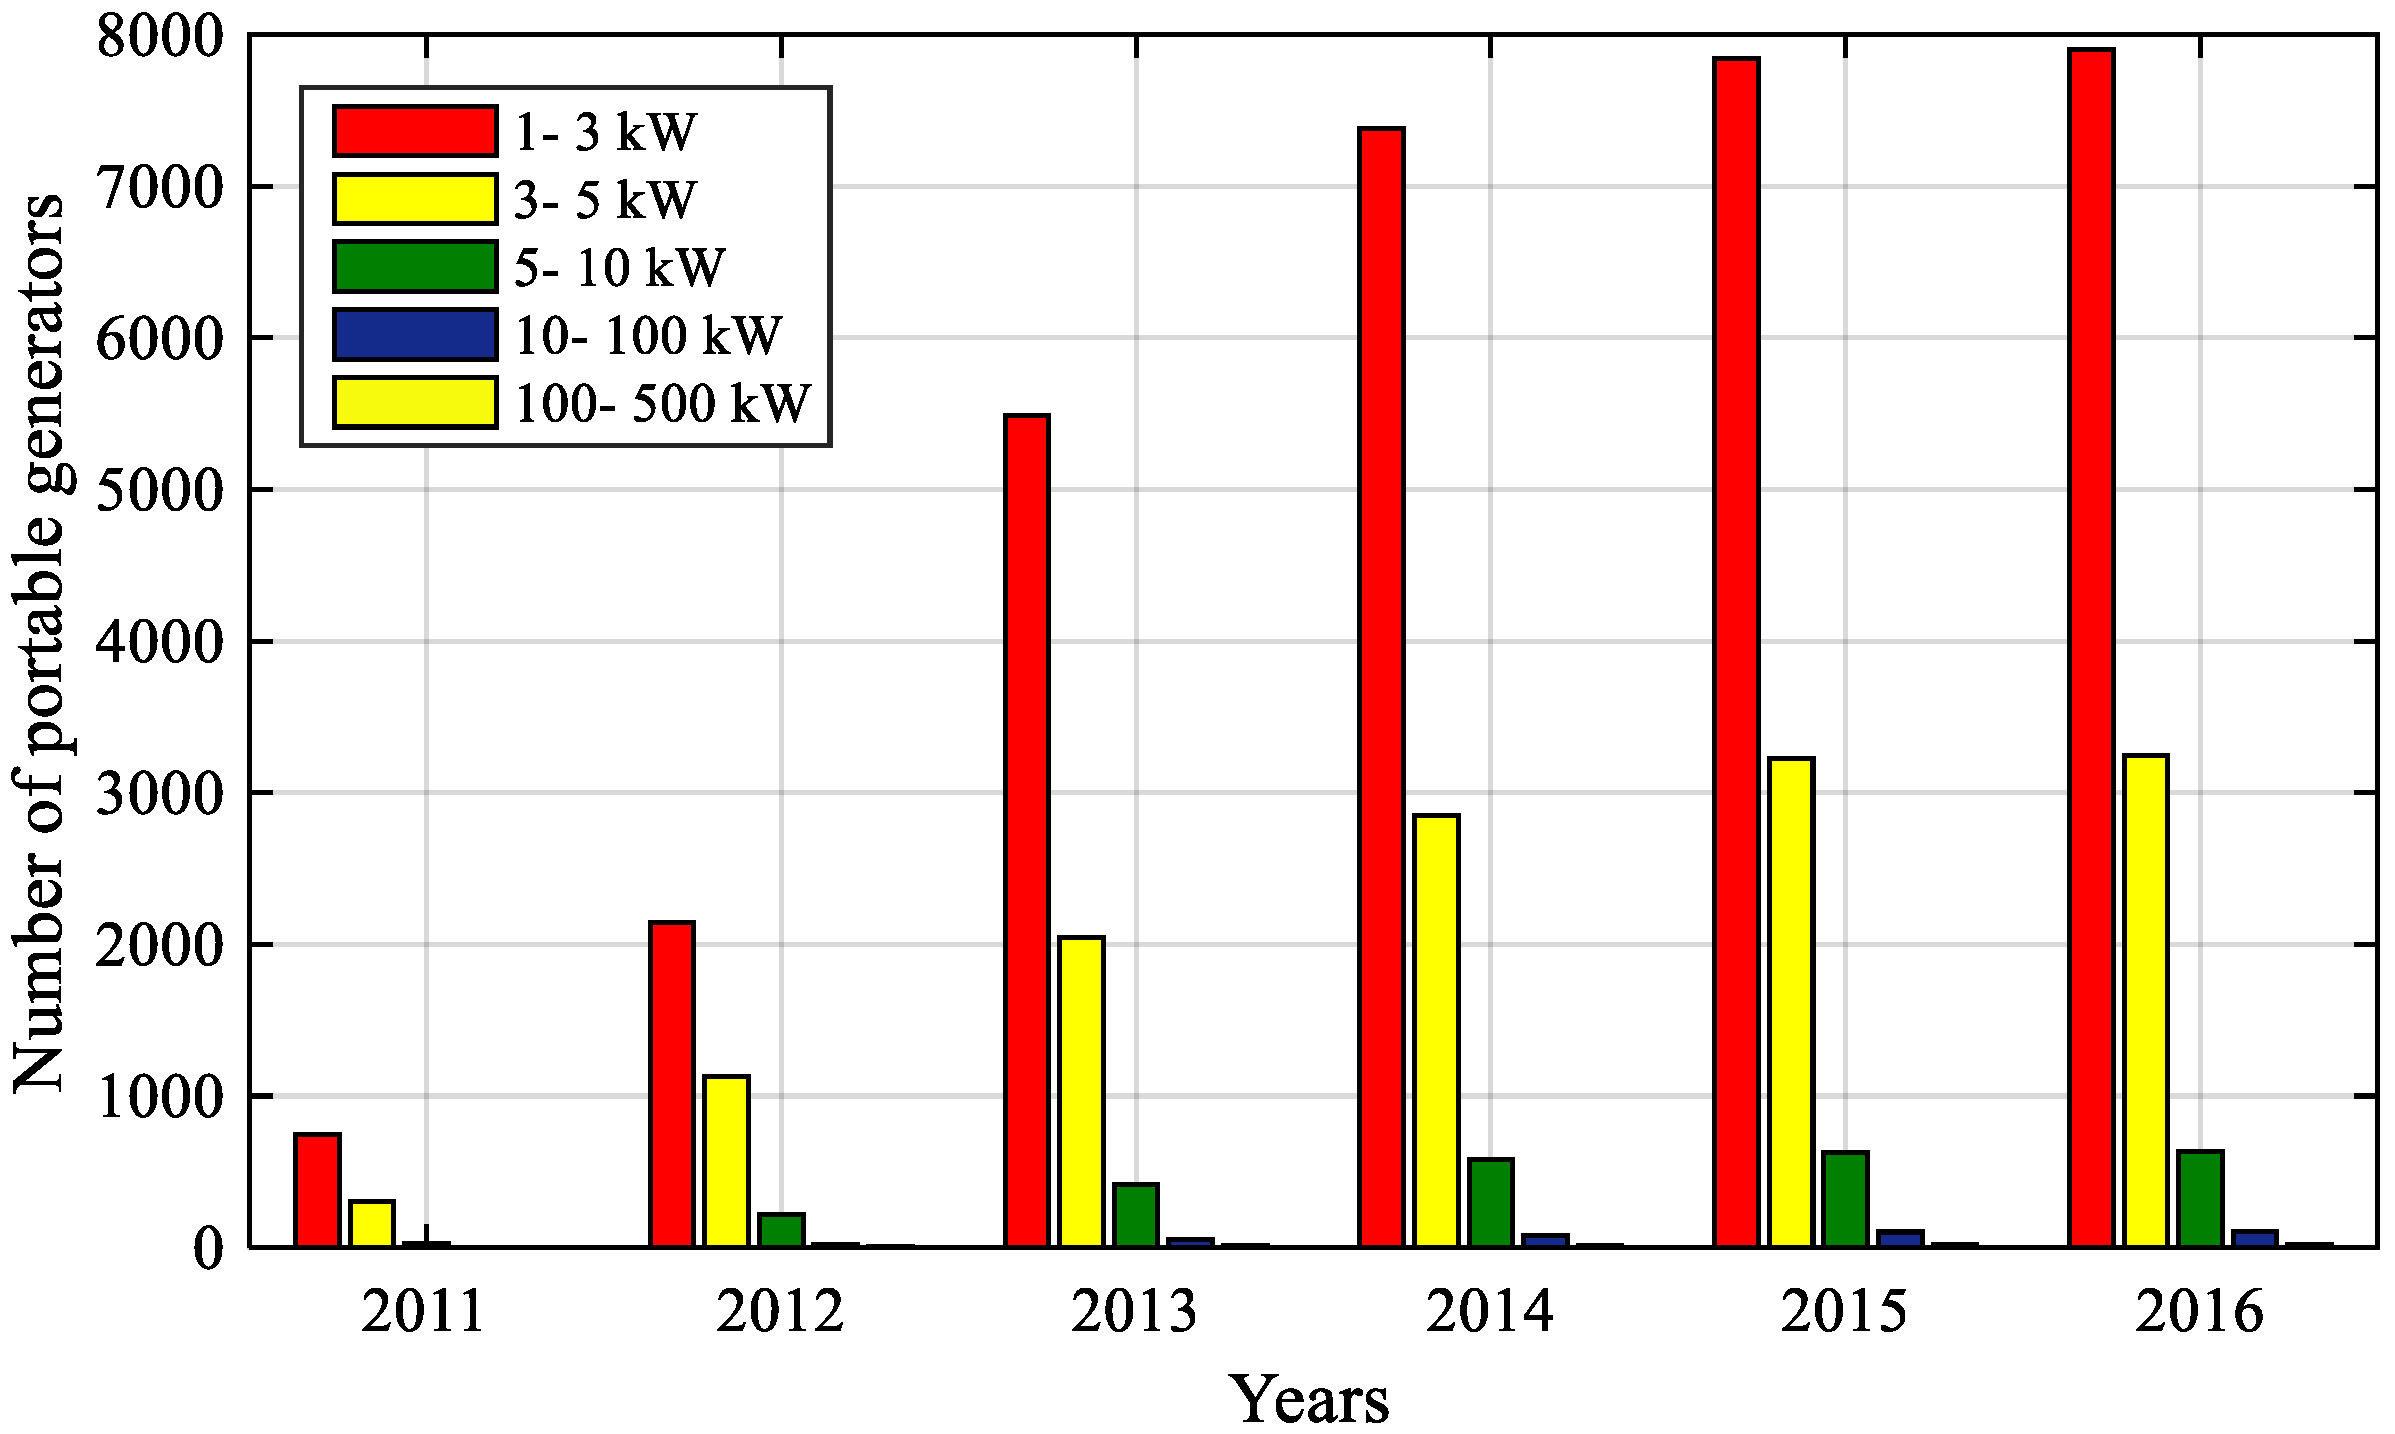
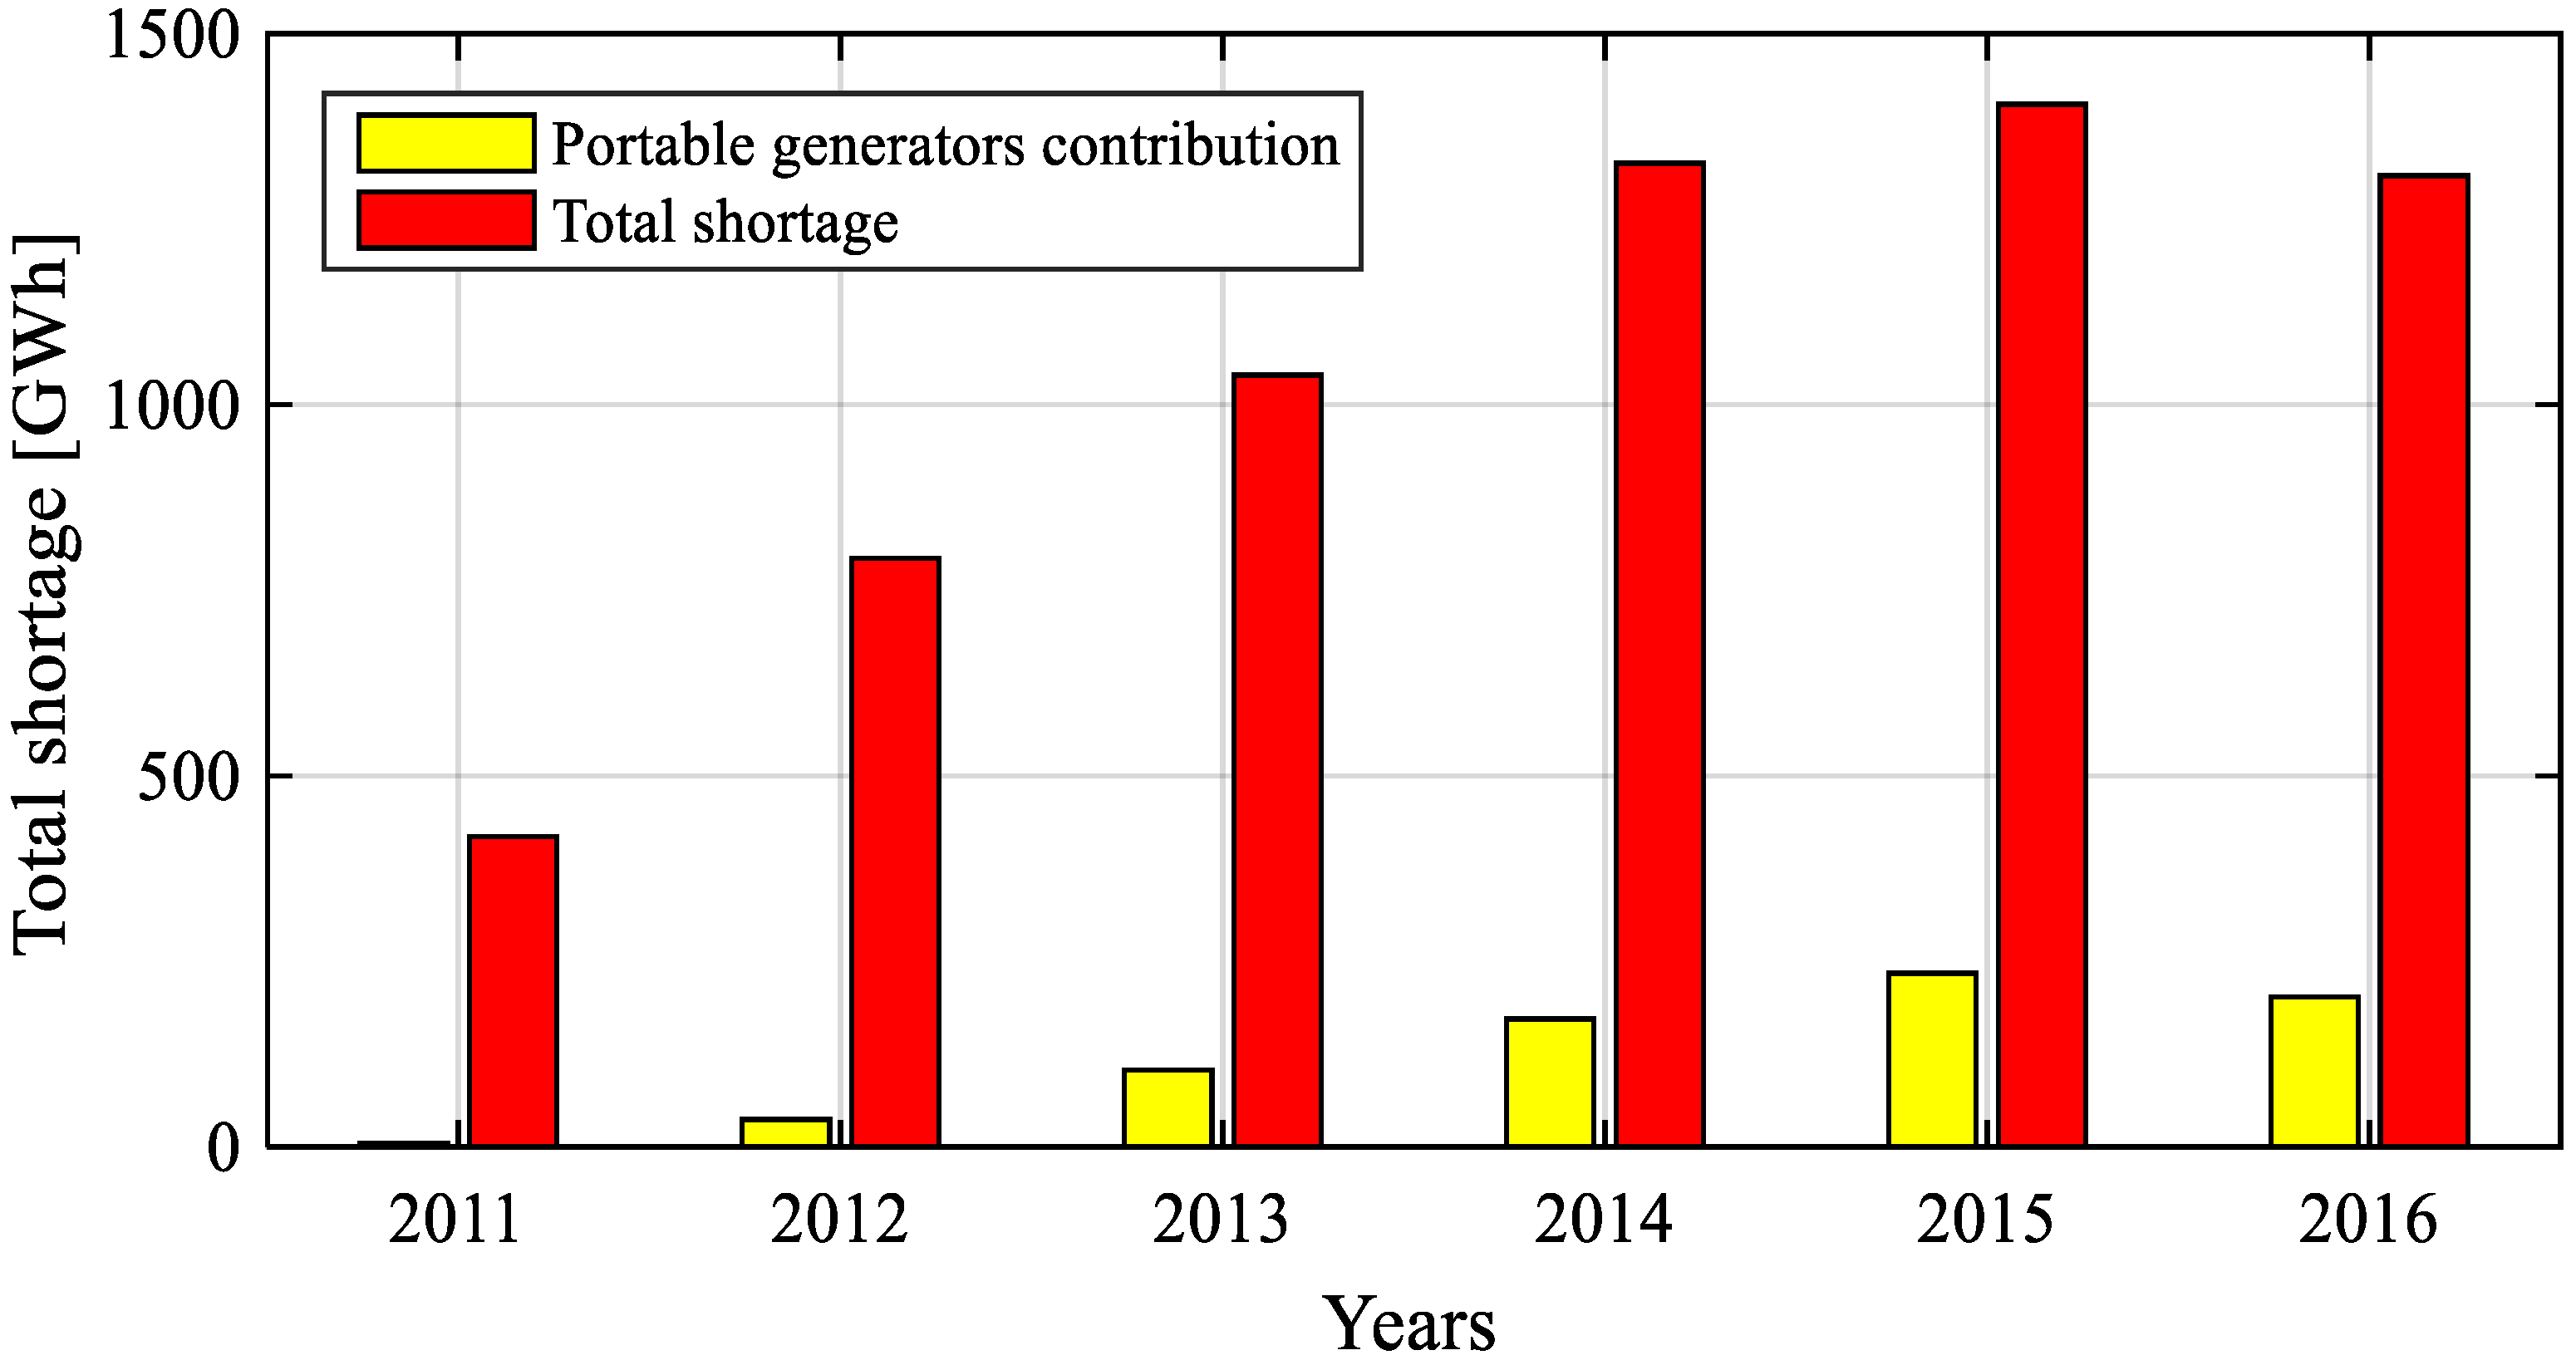
Diesel and gasoline generators: with different power capacities from 1 kW up to over 500 kW. Figure 10 shows the number of generators in use from 2011 till 2016 where a rapid increase can be seen during the period 2011 to 2014 because of the big increase of population in this period due to migration as mentioned before. Also, we can notice that the highest increase where in the generators with small capacities due to the daily life needs of families such as lighting or some electronic devices.
In Figure 11 we can see old diesel generators deployment in the streets of Latakia city with apparent oil leakage and significant production of harmful noise pollution and toxic exhaust gases.
And the average power supplied by these generators for each year can be calculated according to the number of rationing hours as shown in Figure 12 using the following Equation (11):
  E = ( P m 1 · n 1 + P m 2 · n 2 + P m 5 · n 5 ) · C · 365  
where:
  • E: The generated energy for each year.
  • P m 1 ,   P m 2   P m 5 : The average power for each group of generators.
  • n 1 ,   n 2   n 5 : The number of generators for each group.
  • C : The number of rationing hours for each year.
  • 365: The number of days in a year.
We have calculated the short-fall before considering the power generated from portable generators by adding the power generated from these generators to the short-fall so that the real short-fall is as shown in Figure 12 where the figure shows that the real short-fall in power is bigger. The generated energy from portable generators is about 10% of the real short-fall in general and that is make us understand how the energy crisis where bad in city especially if we know that a lot of people were using only batteries for lights during nights.
2.
Batteries: there are different capacities of 7–300 Ah batteries where in general every home has 1 or 2 batteries with most of these batteries being of inferior types or recycled so that they have to change them every year or sometime after 6 months. These batteries are used in general for lighting where they are connected to LED lamps. They are also used to charge mobile phones and TV’s. Figure 13 shows how the batteries are used in homes.
3.
Wood is used for heating in Latakia suburbs and most of this wood comes from rural areas and forests in Latakia where a lot of trees are being cut down and some forests have disappeared or semi disappeared.

3.6. Effects of the Current Solutions

3.6.1. Health

Using such methods increases a number of diseases [30] such as:
  • Respiratory system diseases including asthma and bronchitis: where most of the generators are of inferior types and are installed in the streets, they emit a considerable amount of gas emissions such as carbon dioxide (CO2), carbon monoxide (CO) and nitrogen Oxide (NOx) … and so forth. Wood combustion also emits a lot of gases especially (CO) which is very harmful to babies, children and older people.
  • We see an increase in sight diseases because of LED lights where most of these lights produce focused light which can be harmful for eyes or be weak when the battery is close to exhausted.
  • Likewise, for hearing diseases where most of the generators do not have good mufflers or do not have any at all which causes a lot of noise especially for people who work close to them and this can affect their hearing.
  • And other diseases related to the toxic chemicals and gas emissions from expired batteries where most of these are thrown randomly on open lands or into waterways.

3.6.2. Environment

Using a lot of generators of inferior types, in addition to batteries and wood, can cause a lot of pollution in the city [31] where the pollutants from each source are:
  • Generator pollutants: Carbon dioxide (CO2), carbon monoxide (CO), Nitrogen Oxide (NOx), Hydrocarbons (HC) and Particulate Matter (PM).
  • Battery pollutants: Improper or careless handling of waste batteries can result in the release of corrosive liquids and dissolved metals that are toxic to plants and animals. Improper disposal of batteries in landfill sites can result in the release of toxic substances into groundwater and the environment.
  • Wood pollutants: Carbon monoxide (CO), irritant compounds, polycyclic aromatic hydrocarbons (PAHS), volatile organic compounds, dioxins and carbon Monoxide (CO).

3.6.3. Education and Social Problems

  • Increases in noise in buildings and streets have made concentration harder for the students [32] in addition to the stress caused by such noise especially because most of these portable generators are cheap and poor quality and cause high noise levels.
  • Additional difficulties in studying over prolonged periods arise from bad lightings because most of the lights used during the rationing hours are LED lights, which are concentrated and strong at the beginning and very low after some time because of the cheap and poor quality of the batteries.
  • We note increases in the living costs for families which are already have financial problems.

3.7. Designing an Emergency System

We have made an overview of the electrical situation and energy crisis in Latakia city in Syria. Now we will apply the previous methodology for Latakia as if an emergency system had been applied in 2010 and we will see the advantages of such a system.
The power demand in Latakia in 2010 was E T = 2,733,732 GWh and the residential power demand was about 70% of that, so it was about E r e s = 1,913,612 GWh. The expected increase in energy demand for the next 2 years for Latakia was about E e x = 11%. Therefore, according to Equation (1) The emergency energy would be E e m = 1237.014   GWh . This energy could be obtained with co-generators powered by gas oil, capable of supplying both electrical and thermal energy, typical hospital requests [33]. These co-generators should be monitored with new “E-sensing” control systems in order to keep under check the presence of any pollutants dangerous to human health [34].
Now we will calculate the energy needed according to Equation (3):
For E p : there is no power plant near Latakia city therefore, E p = 0   GWh .
For E r e 0 : in Latakia city there are only some solar applications such as solar panels in Tishreen university also some installed panels on the communications tower in addition to some domestic solar applications and the estimated energy produced by them is about 0.671 GWh. Therefore, the needed energy is E n = 1236.343 GWh.
According to Equations (7) and (8):
E s 618.172   GWh E u s 618.172   GWh  

3.7.1. For Unstable Sources

In Latakia city there are only a limited number of solar panel applications such as the solar panels in Tishreen University and also some panels installed on the communications tower in addition to some domestic solar applications with an estimated energy produce by these of about 0.671 GWh.
Biomass energy: There is a large area of landfill near Latakia in Al-Bassa which receives about 1100 ton/day. Therefore, if we build a power plant to produce electricity from this waste, the generated electrical energy according to [35,36,37] will be about 660 MWh per day and 240.9 GWh.
Also, we have a high solar radiation in Latakia. In Latakia we have two choices to install solar panels:
1.
On buildings rooves such as on schools, universities, residential buildings, … etc. as shown in Table 4.
Thus, the area would be S = 144,700 m2.
2.
On the unused lands around the city which cannot be used for agriculture or buildings. The area of these lands is about 214,000 m2.
So, the total area would be about 358,700 m2
According to Photovoltaic Geographical Information System [38], we have got Figure 14 and Figure 15 for Latakia. In Figure 14 we can notice the location choosing and the optimal slope of the solar panels which is θ = 31 ° . And in Figure 15 we got the average daily sum of global irradiation per square meter without taking into consideration the power losses G 0 = H d = 5.9   kWh / m 2 . day . And if we take losses into consideration the average daily sum of global irradiation will be:
  G = E d = 4.33   kWh / m 2 . day  
To calculate the electrical power which could be calculated from solar energy it will be used one solar panel with high power (420 W) due to the big areas and big demand of electric power. Therefore, we will calculate the needed area for each solar panel so we can calculate the total number of solar panels and electricity production. The calculations should be made on the 21 December because that is when the sun will be lowest in the sky where the shadow will be the longest and solar altitude angle α. And it should be used suns azimuth angle ψ to know the Sun’s relative direction along the local horizon. These angles could be calculated from [39] where for Latakia we got:
α = 17.34 ° · ψ = 137.24 °
To calculate the distance between the solar rows it should be calculate the high of the solar panel from the Equation (11):
  h = x · s i n θ  
where:
  • x: length of the solar panel (m).
  • θ : optimal slope angle (degree).
Therefore, h = 1.0177   m .
After that it will be calculated the maximum shadow length   D Equation (13):
  D = h / t a n α  
Therefore, D = 3.26   m .
Then it could be calculating the distance between the solar rows D (Minimum array row spacing) from the Equation (14):
  D = D · c o s ( 180 ψ )  
Therefore, D = 2.393   m .
So, the area for each solar panel is sum of the area which the solar panel covers on the roof and the area of its shadow according to Equation (15):
  S 1 = x · c o s ( θ ) · y + D · y  
where:
  • y: width of the solar panel (m).
Therefore, S 1 = 5.353   m 2 .
So, the number of solar panels which could be installed is calculated from Equation (16):
  N = S / S 1   = 358 , 700 / 5.353 = 67 , 009   s o l a r   p a n e l  
The generated energy from the selected solar panel is calculated using the Equation (17):
  E m = A · η · G  
where:
  • A: The solar panel area ( 2.588   m 2 ).
  • η : solar panel efficiency (16.23%).
  • G 
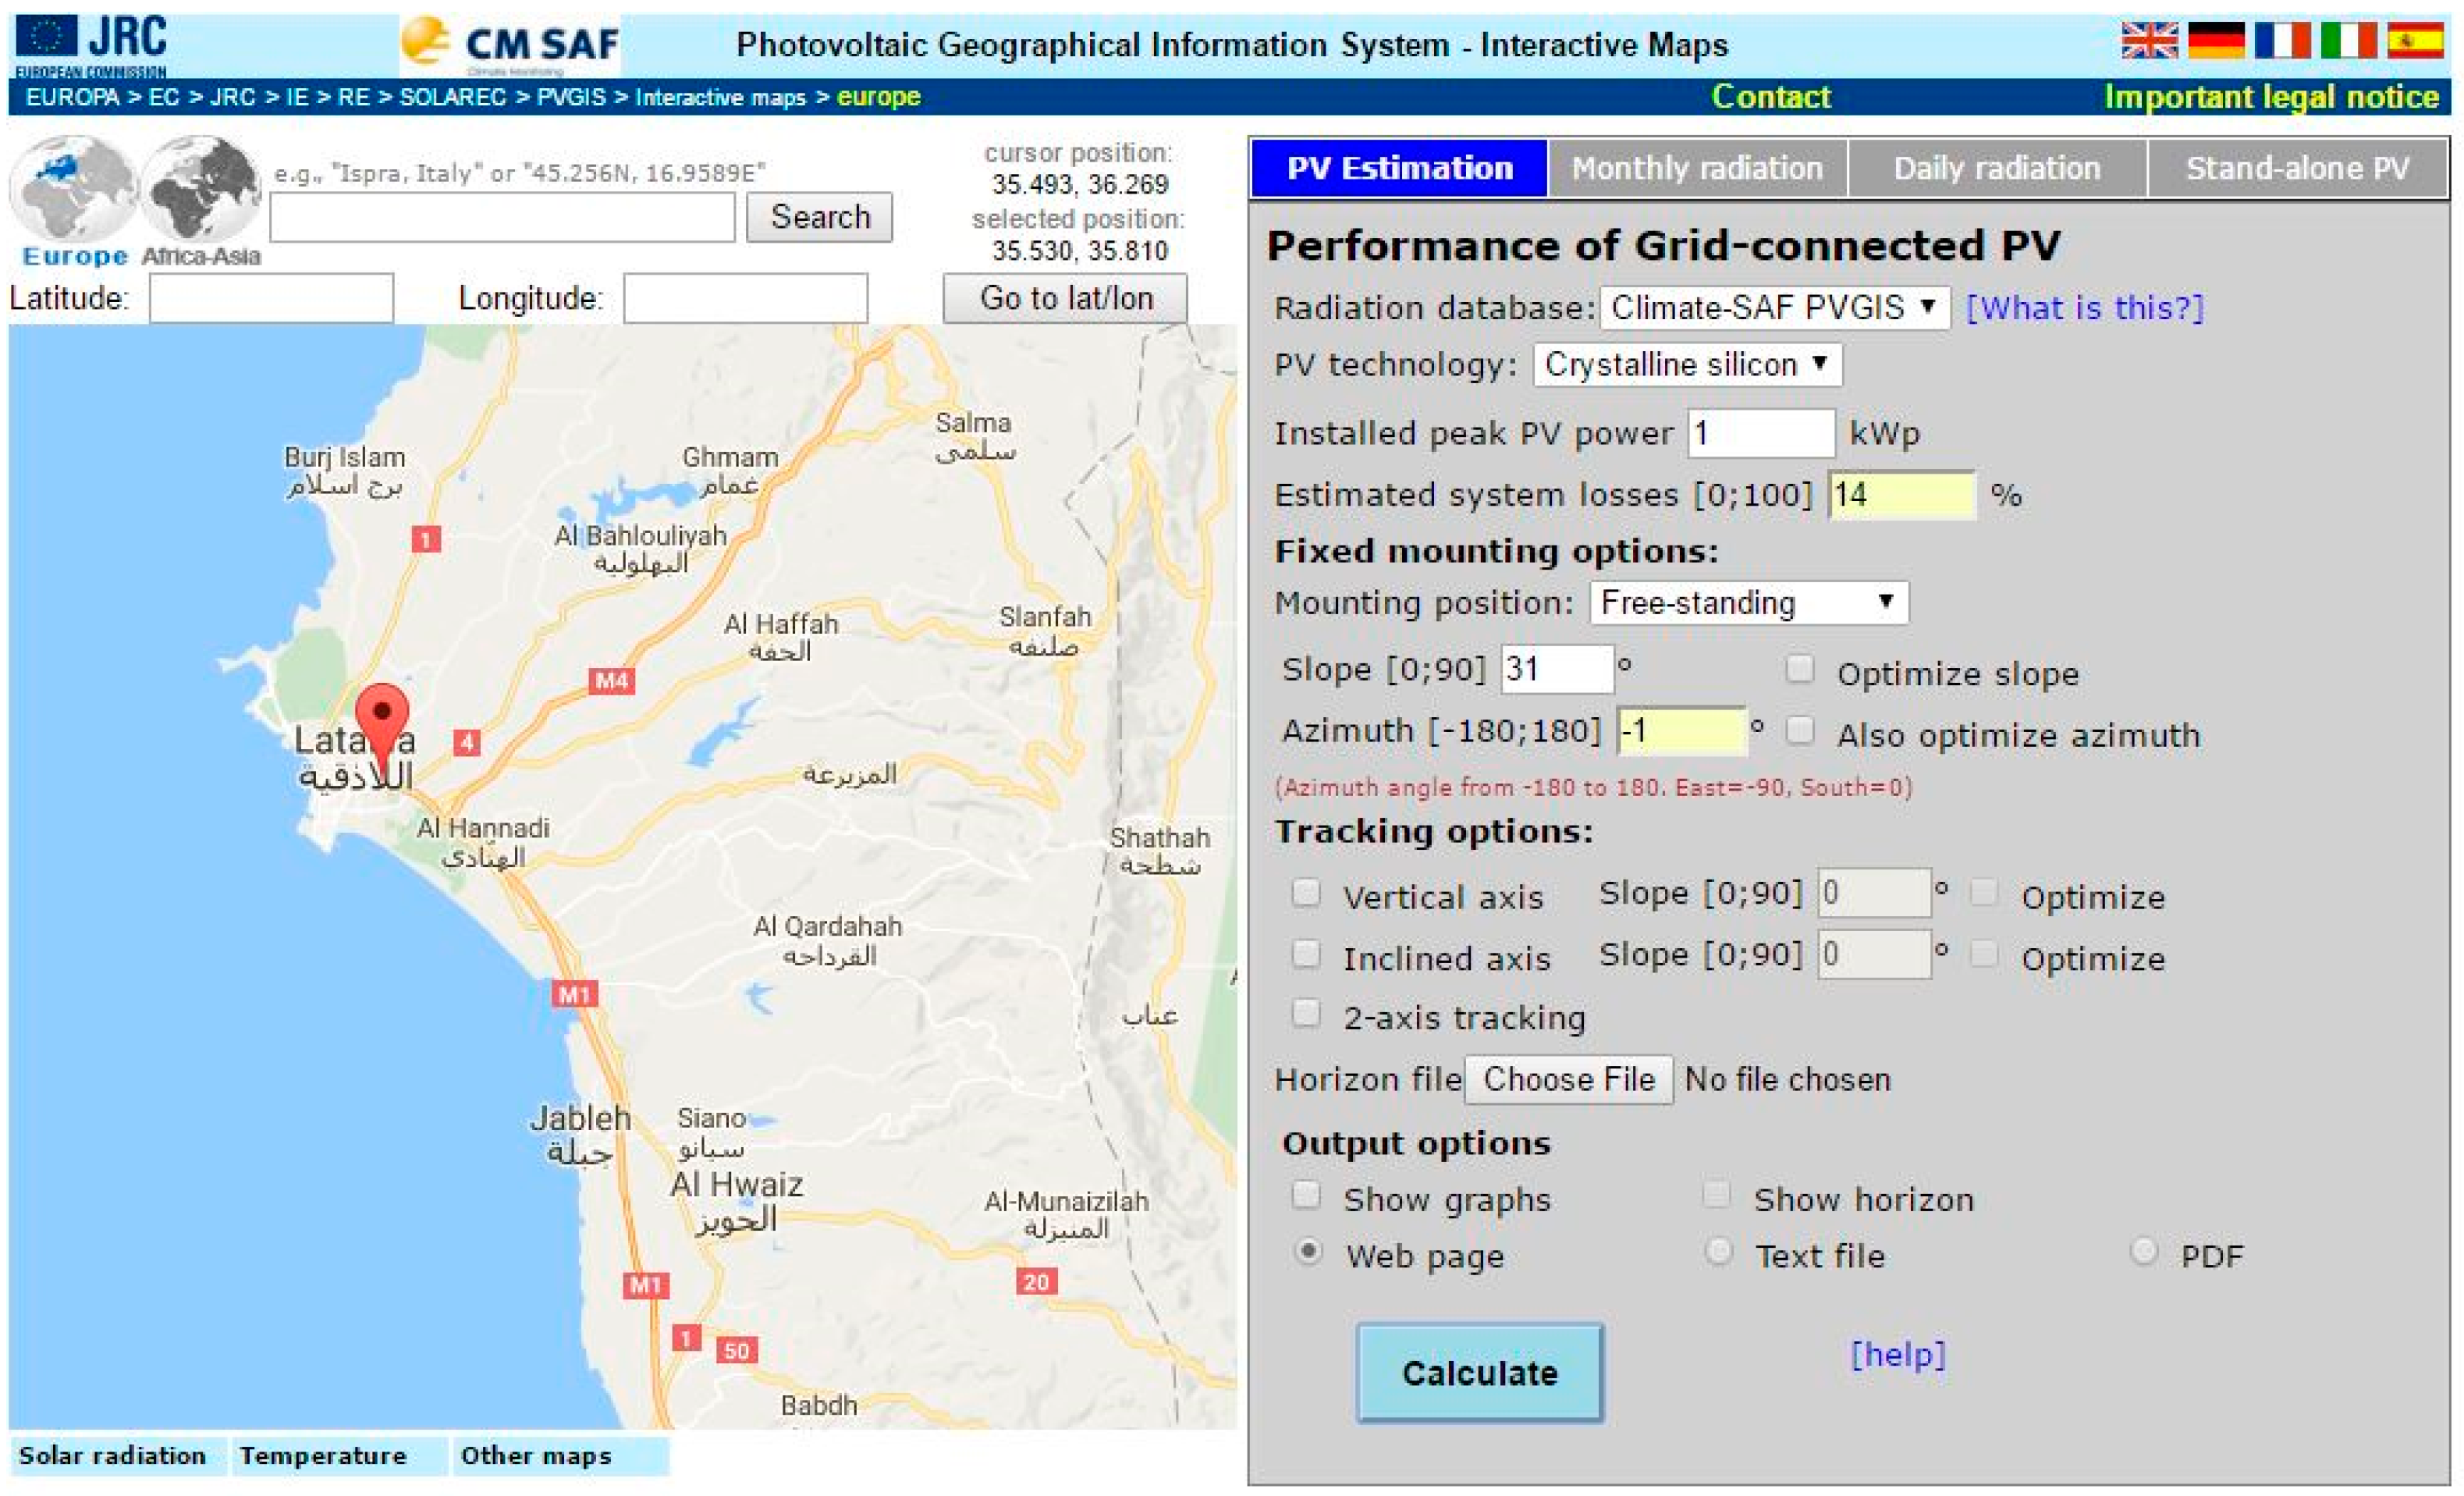
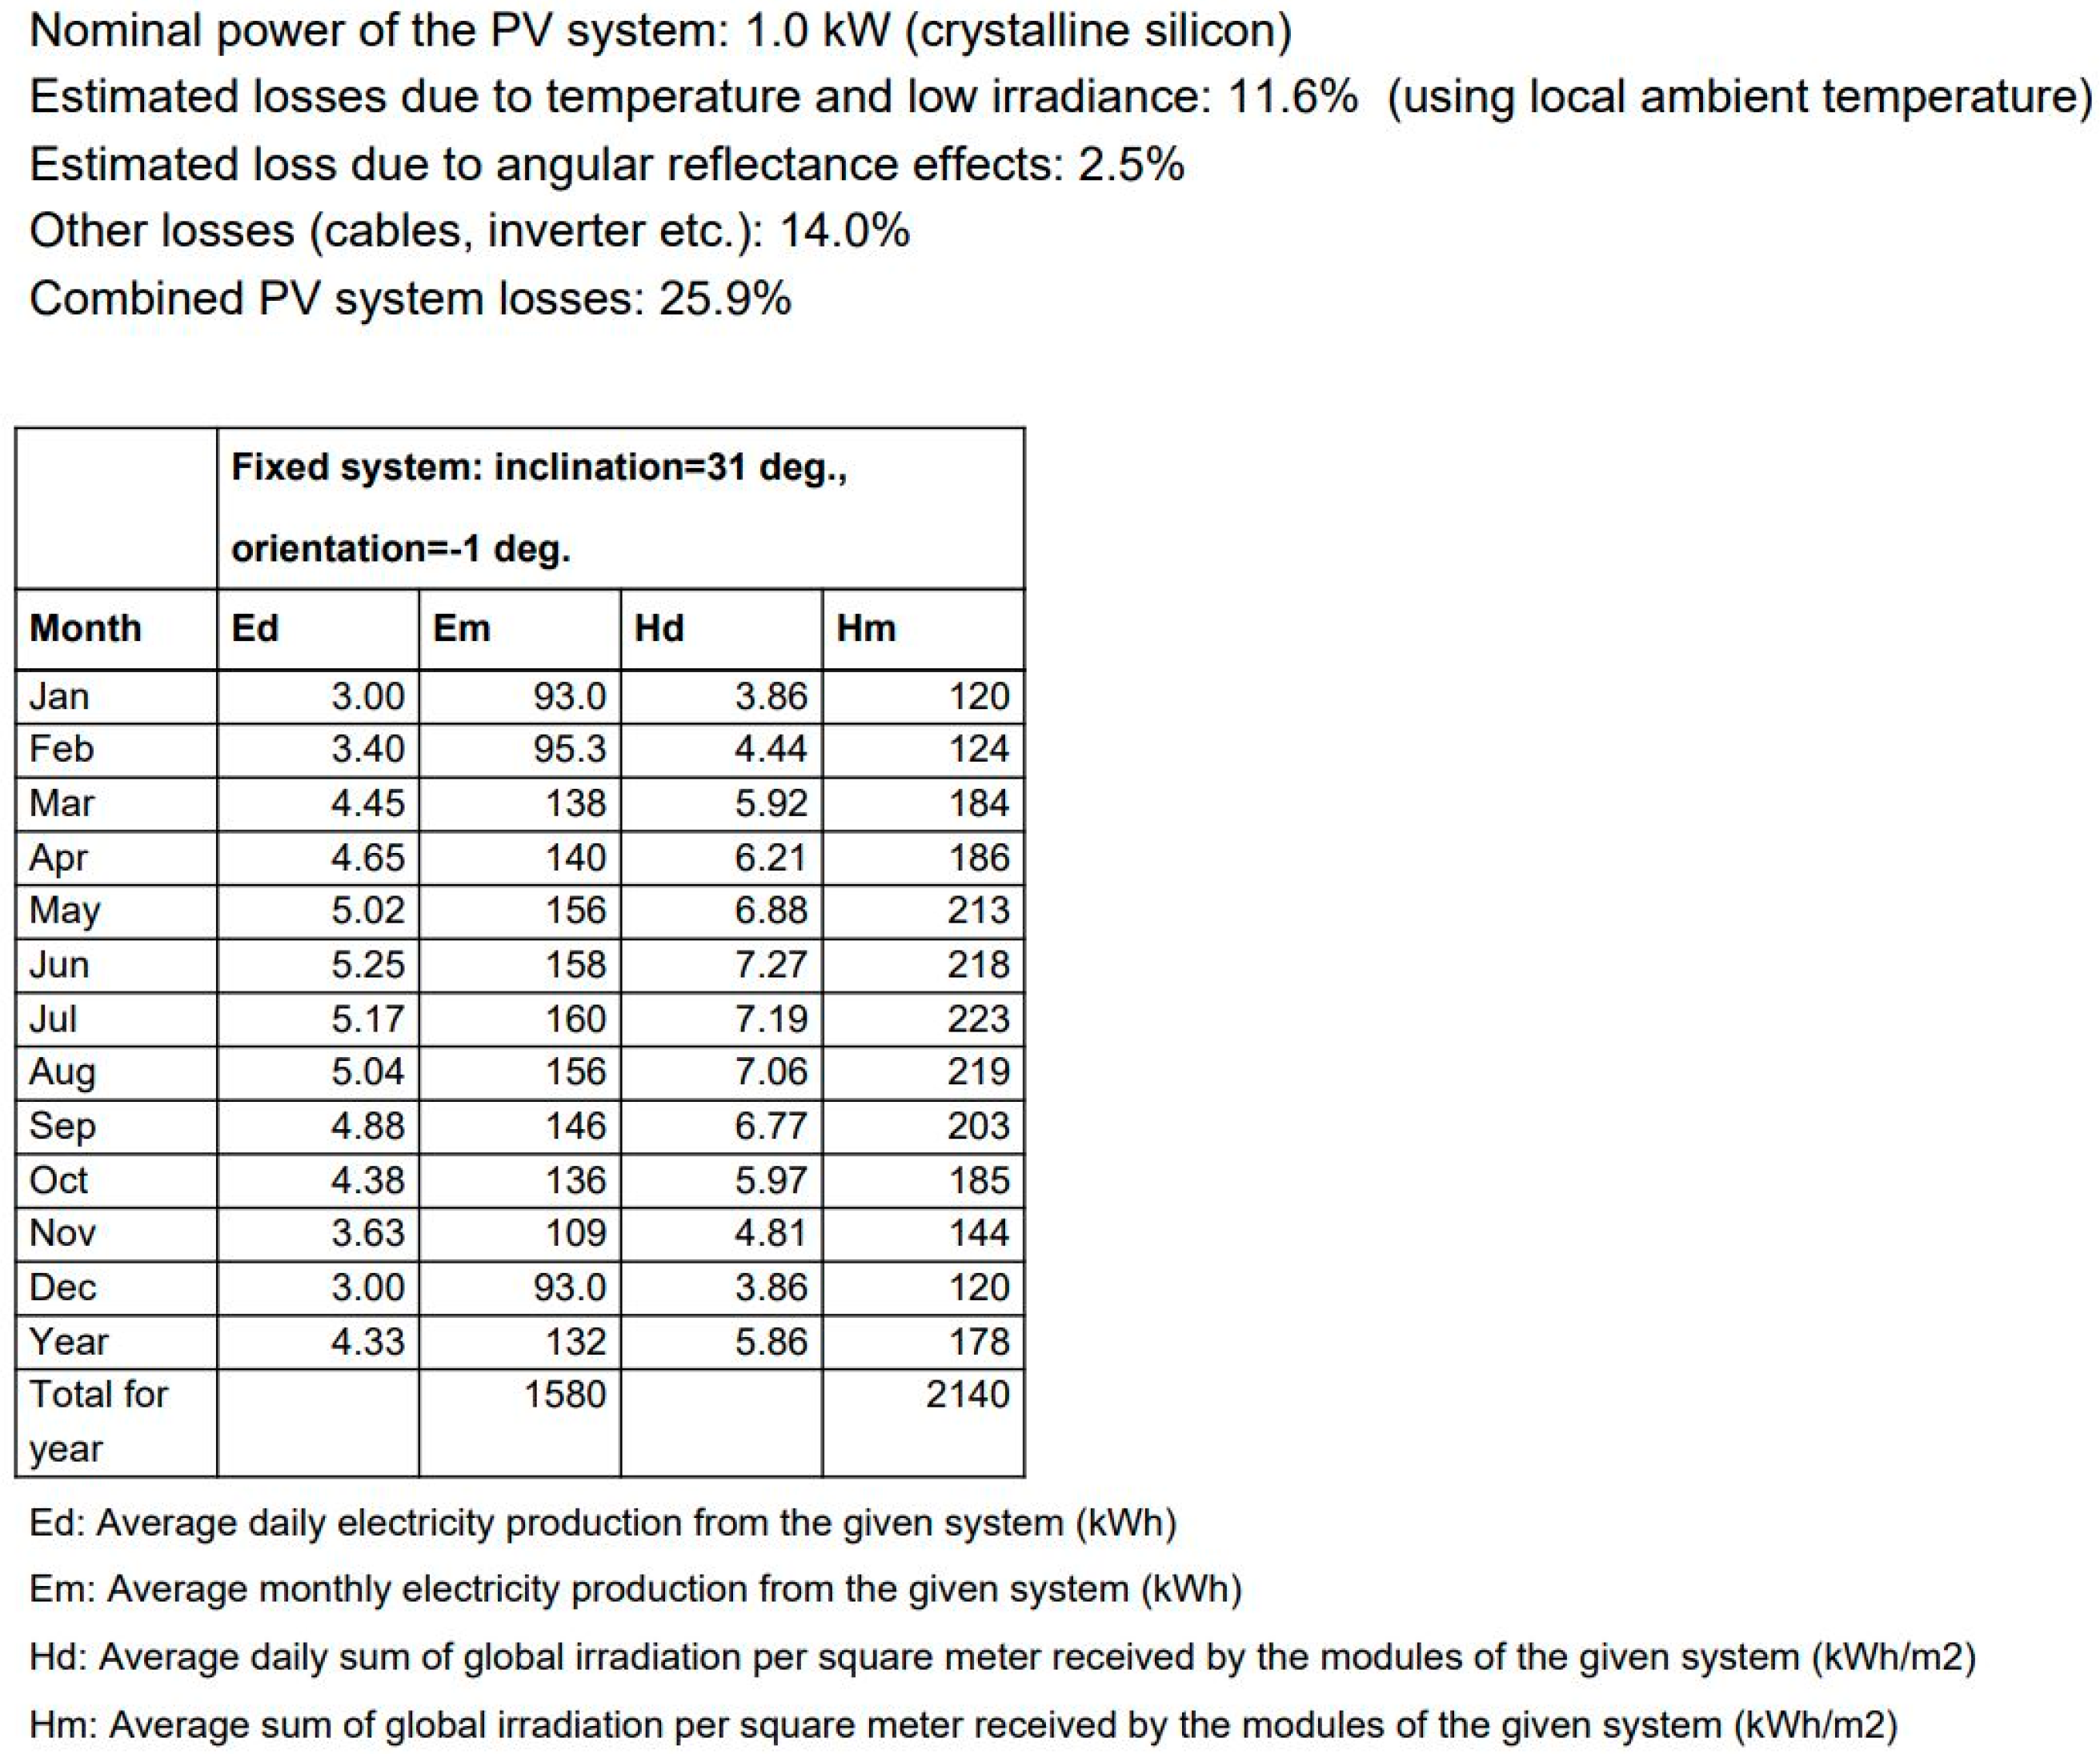
: Average daily sum of global irradiation (4.33 kWh/m2·day).
Therefore, E m = 1.819   kWh · day .
So, the generated energy from all the solar panels for a year will be according to Equation (18):
  E = 365 · N · E m  
Therefore, E = 44.49   GWh .
According to previous calculations, the total energy which could be generated from renewable sources is E u s = 286.061 GWh per year.

3.7.2. For Stable Sources

  E s = E e m E u s = 950.953   GWh  
We have to install portable generators where the available portable generators before the war were only a few ones with small capacities so we can consider that E g = 0 . Therefore, the power of these generators should be P p = E p / 8760 = 108.556   MW .

3.8. The Advantages of the Proposed Emergency System If It Was Applied before the War

3.8.1. For the Electricity Situation

We can find the effect of this system for each year since 2011 by dividing the total energy which could be generated by the emergency system by the total short-fall for each year as shown in Figure 16.
So, the proposed solution will compensate for the power generated from the generators because the total generated power from emergency system is 1237.014   GWh per year and the highest generated power from generators was 234.281 GWh in 2015 in addition to reducing the rationing hours as shown in Table 5.

3.8.2. For the Environment and Health

1.
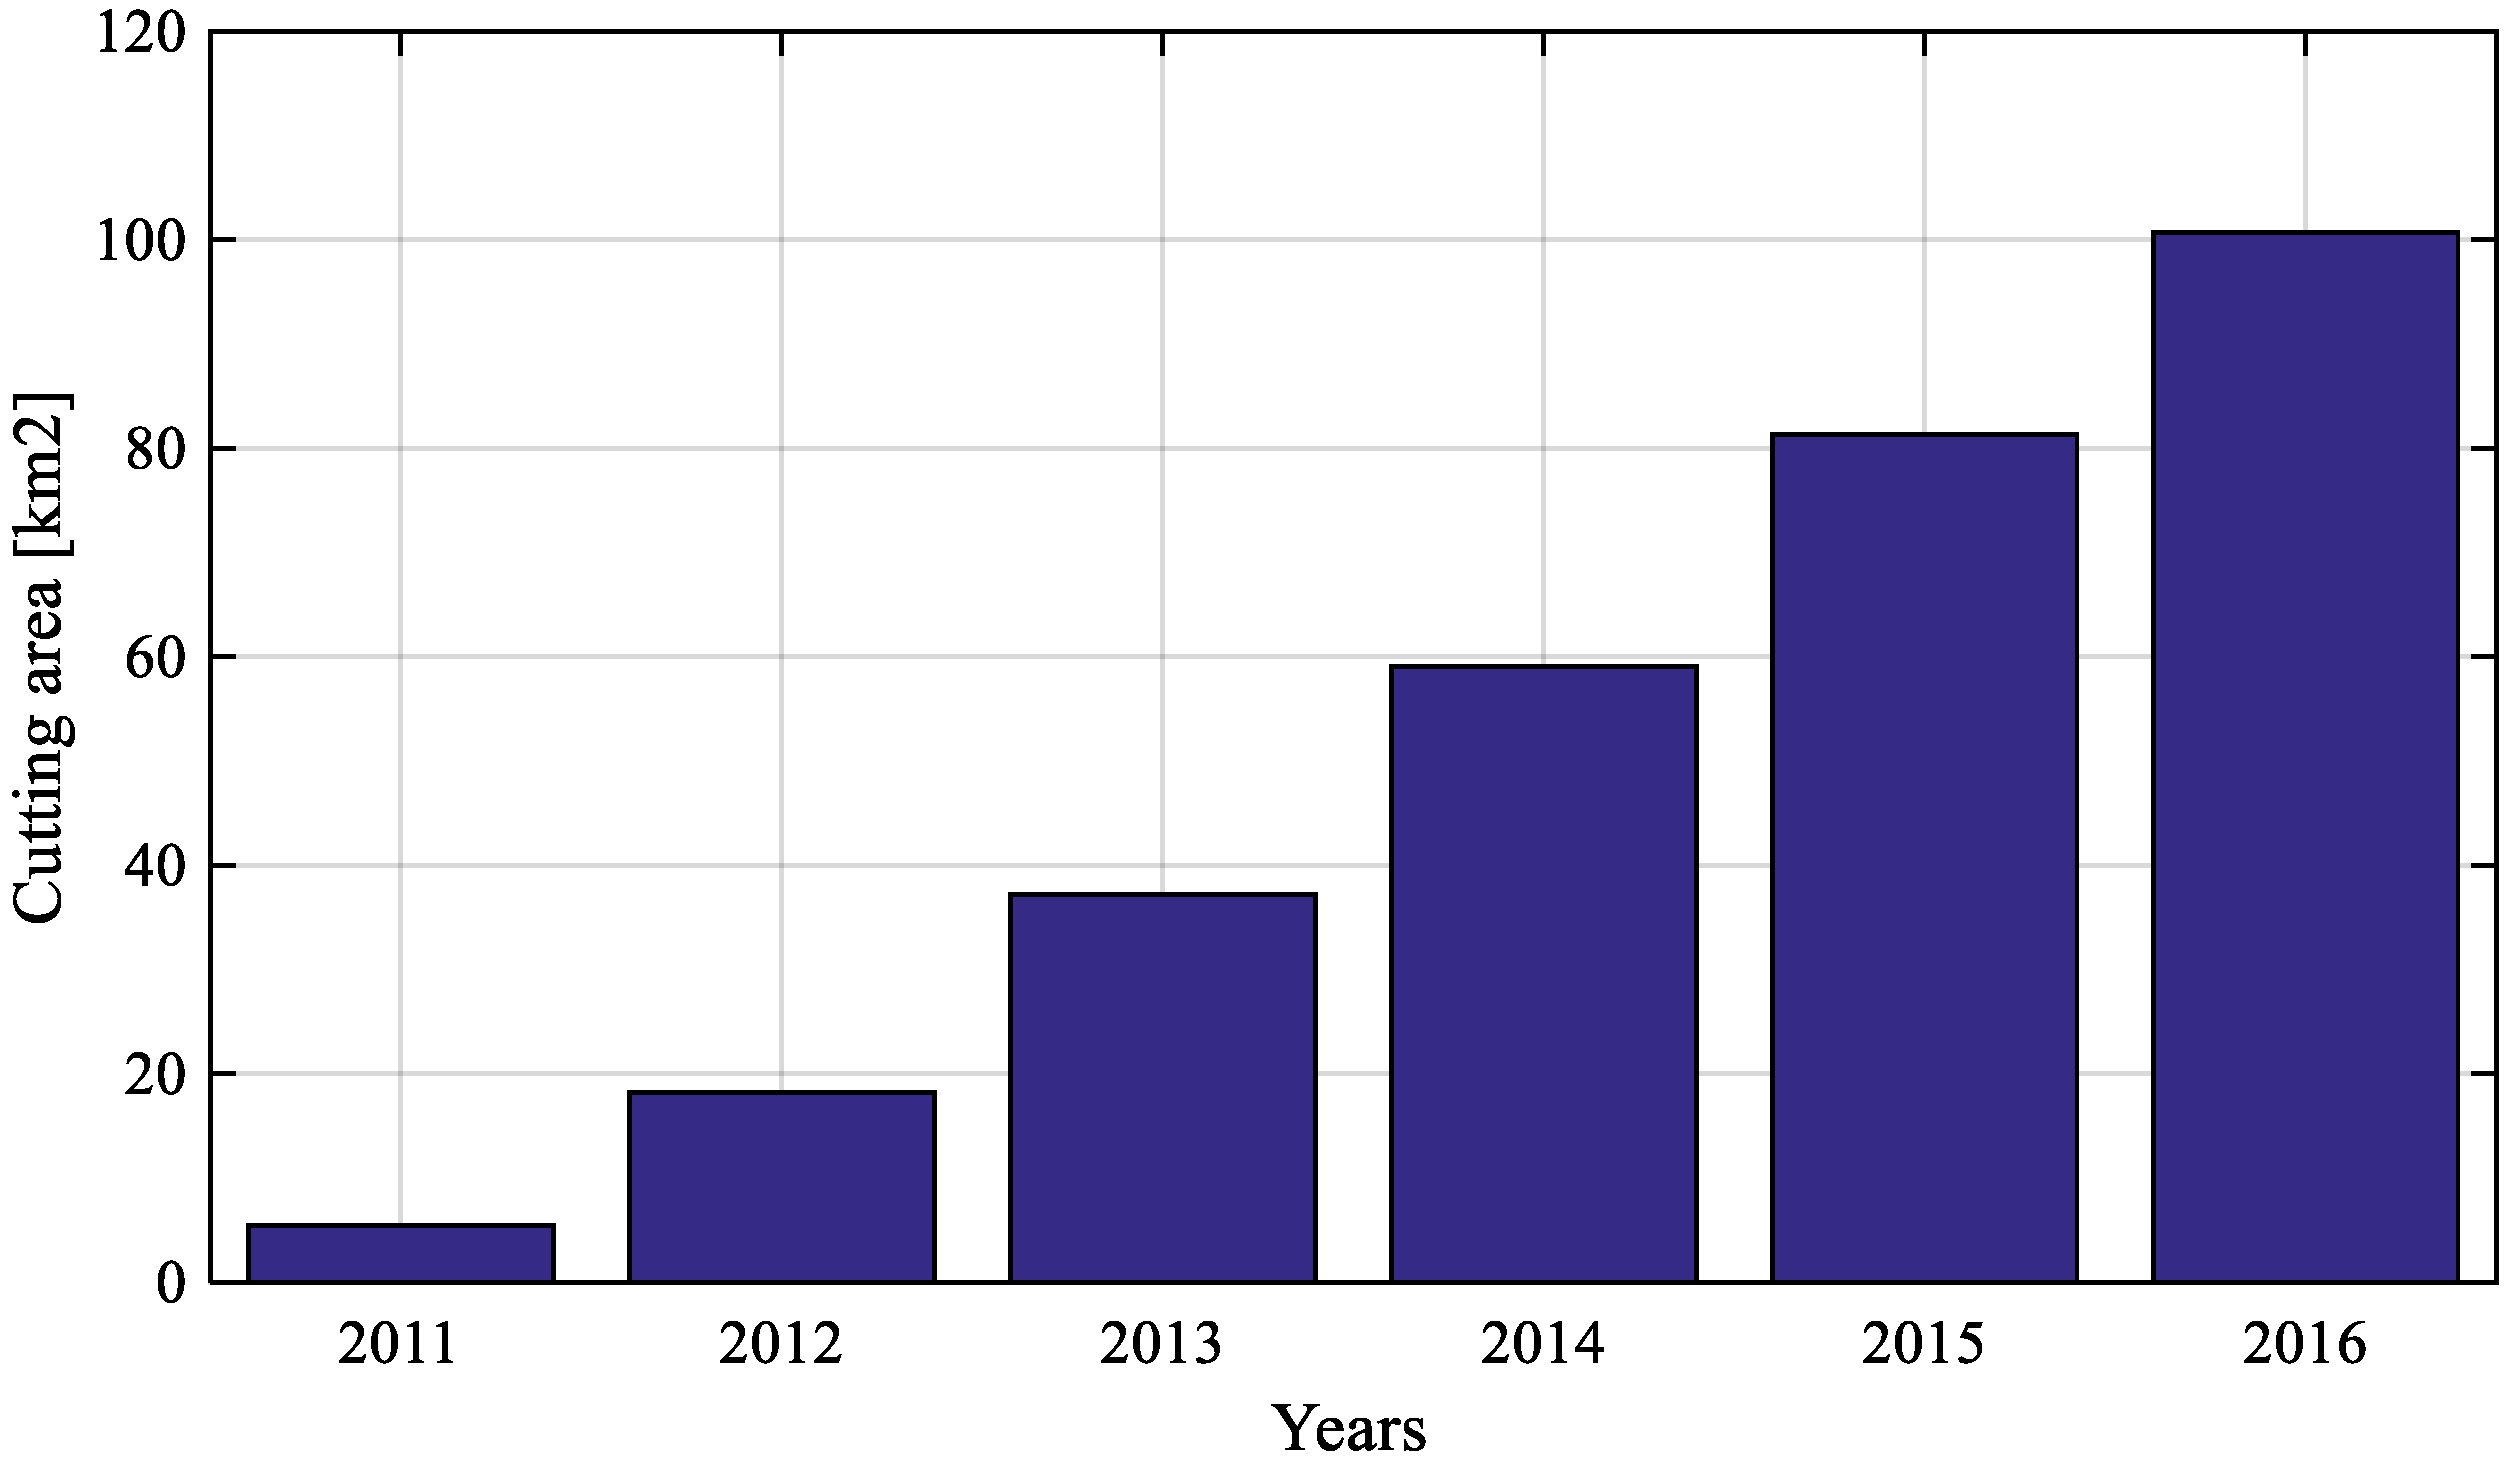
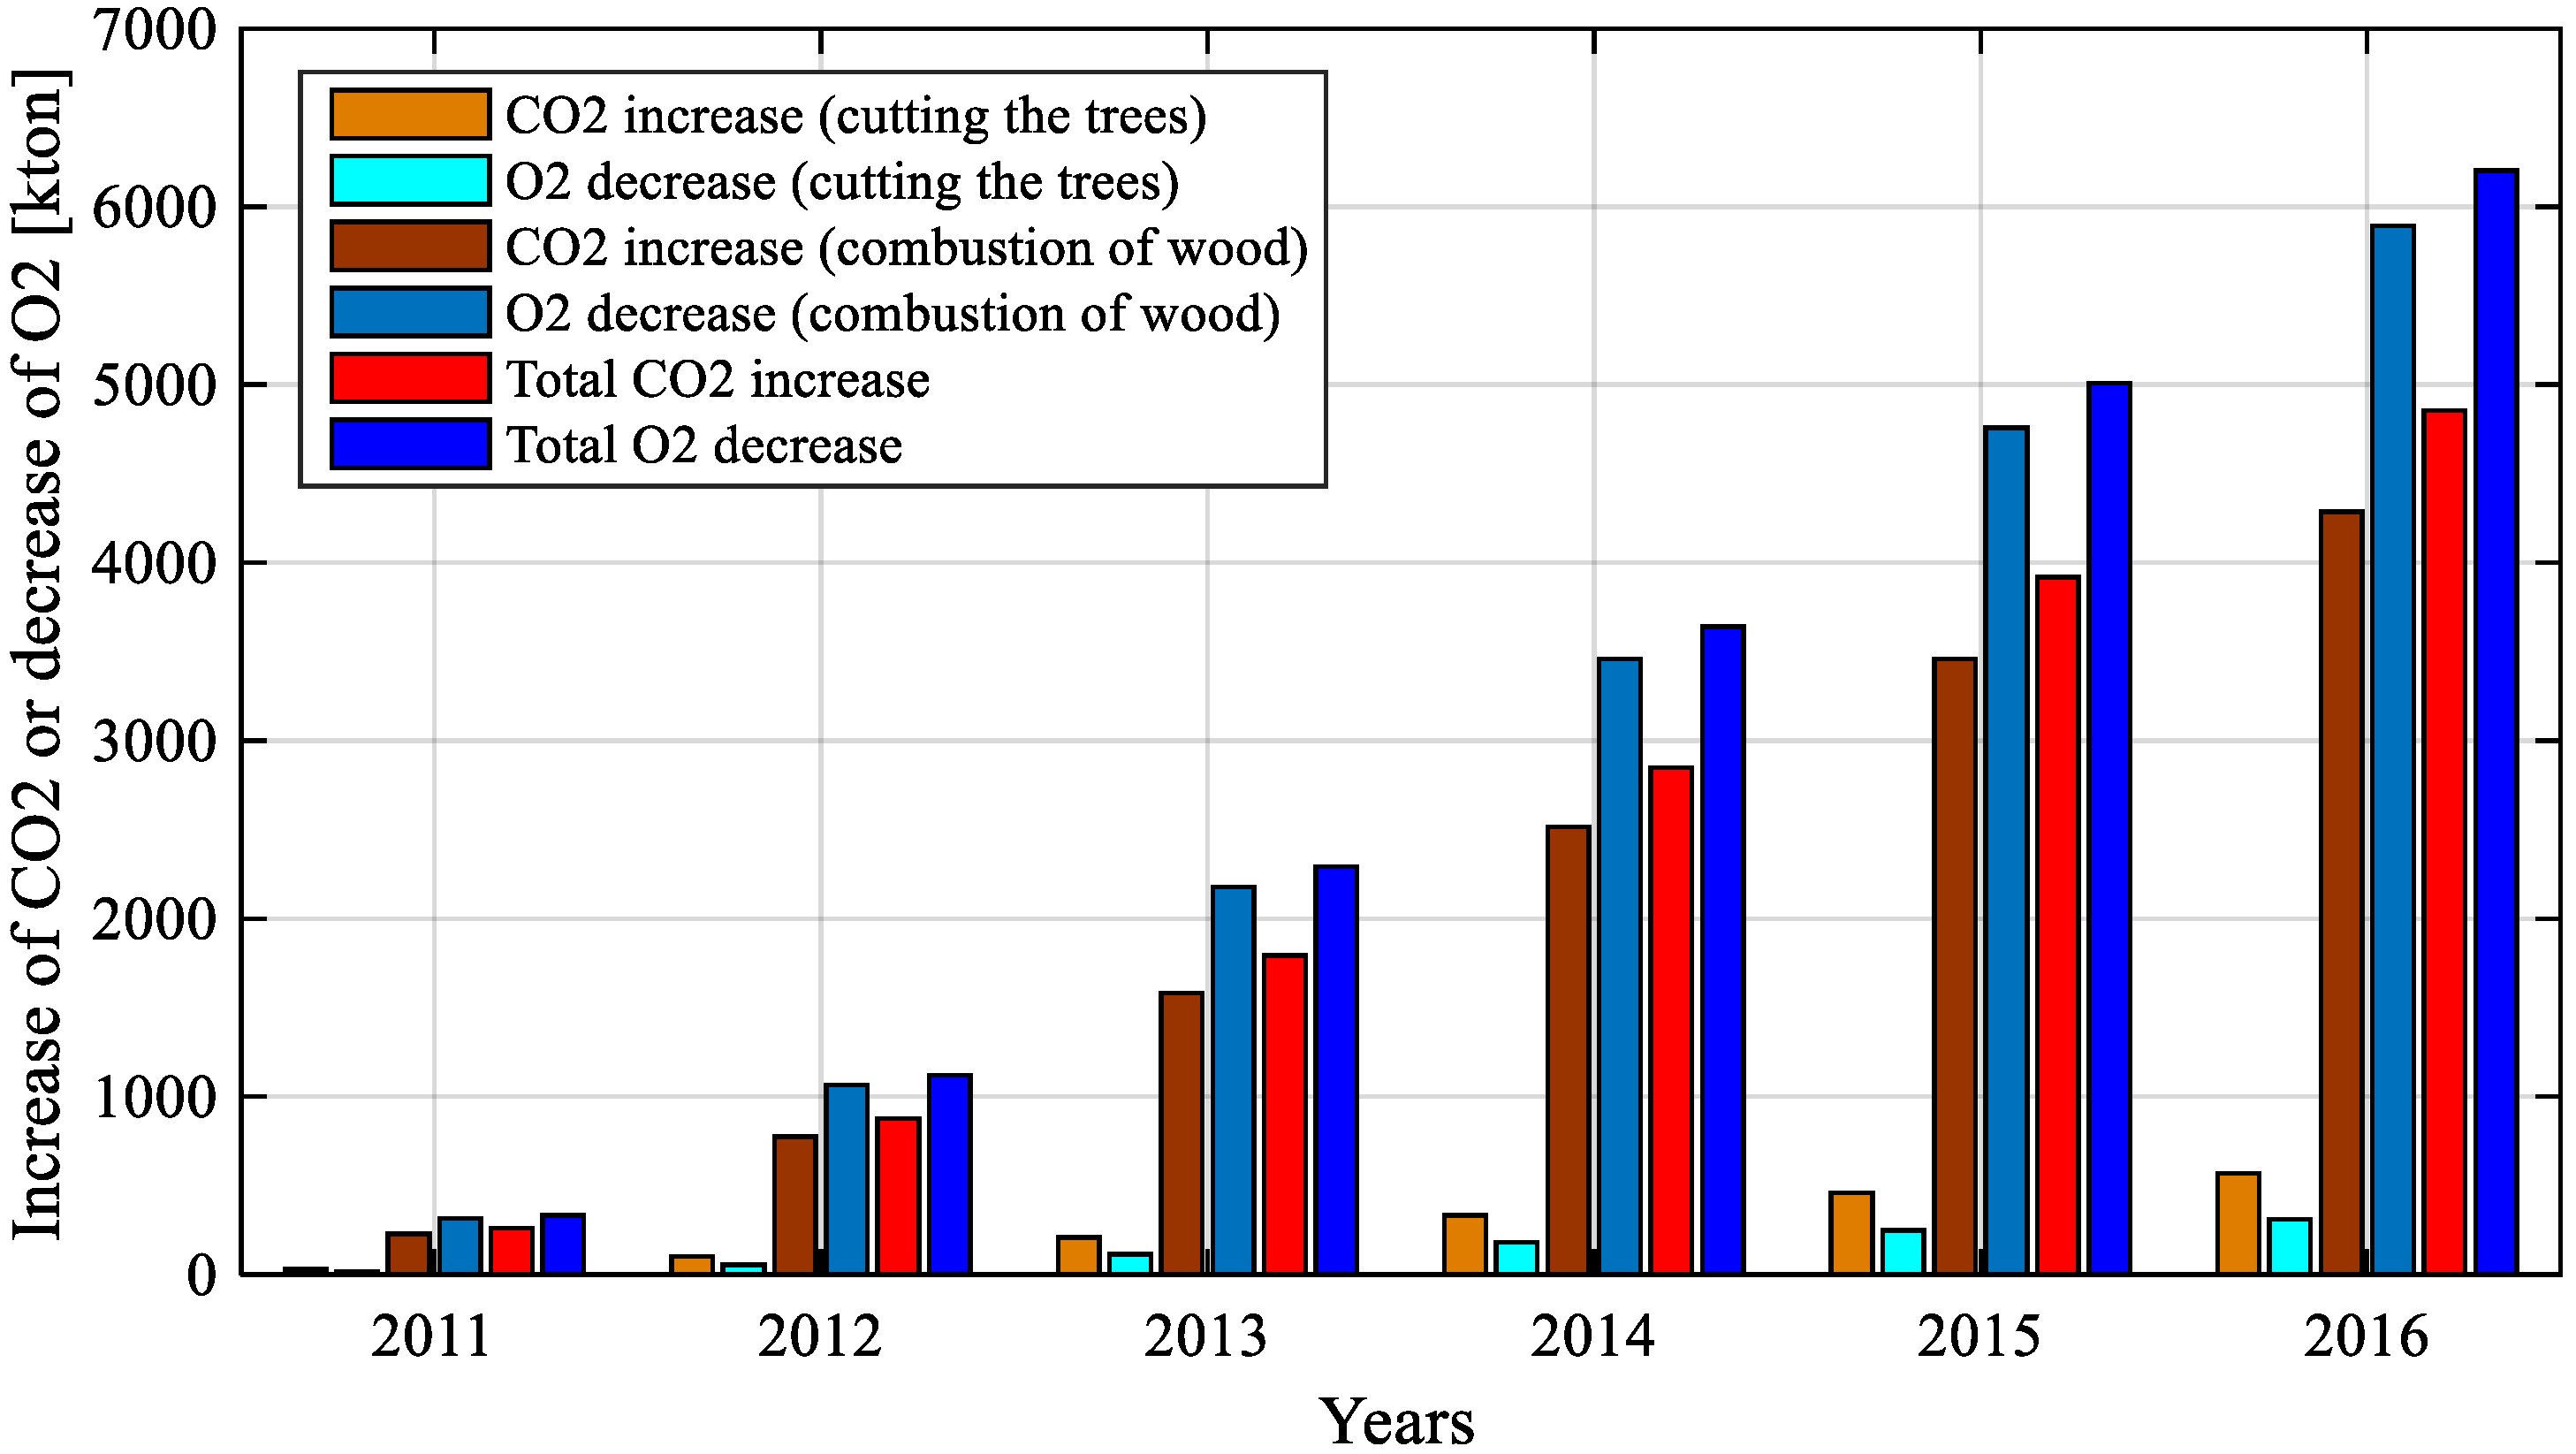
Forests: Figure 17 shows the forests which has been cut in Latakia, where we can notice that the increase is gradual and it is not related to the energy shortage or demand because of many reasons. People move toward using wood because it is cheap also it is hard to control all the lands and forests to prevent this from happening.
Cutting the trees will cause an increase in (CO2) and a decrease in (O2), where according to Reference [40,41] trees with a height of 9–12 dbh produce 22.6 kg (O2)/year and urban whole tree carbon storage densities average 7.69 kg/m2 of tree cover per year where tree cover in Latakia is about 40% on average. Also, combustion of wood causes an increase in (CO2) and a decrease in (O2) and according to [42] the carbon concentration is about 45.7–60.7% in subtropical/Mediterranean species where each tree weighs about 120 kg. Therefore, cutting the trees and burning them will be very harmful to the environment. If the emergency system had been used in Latakia city it would have been able to reduce the emissions which have occurred in the 6 years as shown in Figure 18.
2.
Generators: According to [40] the emissions from diesel generator sets are a mixture of gases primarily comprised of Carbon Monoxide (CO), Oxides of Nitrogen (NOx), unburned Hydrocarbons (HC) and soot particles (particulate matter or PM). Emission norms are specified based on the number of grams of these compounds present in diesel exhaust per kilowatt-hour of electricity generated. The emission limits reached of (NOx) are up to 9.2 g/kWh, 1.3 g/kWh in the case of (HC), 3.5 g/kWh in the case of (CO) and 0.3 g/kWh of (PM). Figure 19 shows the emissions from the portable generators which shows how these generators could be harmful for people’s health and the environment inside the city. Thus, the reduced amounts of emissions during the 6 years would be as shown in the figure.

4. Conclusions

Lack of planning of secure energy sources and depending on one source to generate electricity can lead to energy crises in the case of unexpected situations such as armed conflicts. Renewable energy sources are secure because they can work as local energy sources so they can play a major role in the emergency system for any city or country but we need stable sources of energy too. This research could be used to design a local emergency system for any city depending on many factors such as population, energy demand, available renewables sources, and so forth, which will be very useful for energy security in any city or country. Designing the emergency energy system has been done according to points such as capacity of the system, future needs, expected threats on the system. In addition, to make sure that the system will be stable and able to provide the most needed requirements of the city by choosing more than half of the system as big portable generators. This research gives a guide for any city or governate all needed parameters to start designing emergency energy system. The case of Latakia city is a real case so these data can be used as a basis for designing an emergency security system in the current world with insecure fuel lines, wars and disasters. This information and data could be used also as a reference for further studies regarding electricity and the environment in Latakia or Syria.

Author Contributions

Conceptualization, G.F., V.K., S.F., and I.A.; Methodology, G.F.; Software, G.F., and I.A.; Validation, T.I. and V.K.; Formal Analysis, G.F., I.A., T.I., F.O.I., and Z.M.; Investigation, J.T., Z.M., T.I., S.F., and V.K.; Resources, G.F., V.K, S.F. and I.A.; Writing-Original Draft Preparation, G.F., I.A., V.K., F.O.I.; Project Administration, Z.M., V.K., J.T., I.A., and G.F.

Funding

This research was supported by the “Environmental and non-waste technologies for sustainable development of energy use and agriculture” grant number 20185011 Internal grant of CULS FTA Prague and Grant Agency of the Czech Technical University in Prague (grant No. SGS17/181/OHK3/3T/13).

Acknowledgments

The financial support of the “Environmental and non-waste technologies for sustainable development of energy use and agriculture” grant number 20185011 Internal grant of CULS FTA Prague and Grant Agency of the Czech Technical University in Prague (grant No. SGS17/181/OHK3/3T/13) are highly acknowledged.

Conflicts of Interest

The authors declare no conflict of interest.

References

  1. Zohuri, B. Electricity, an Essential Necessity in Our Life. In Application of Compact Heat Exchangers for Combined Cycle Driven Efficiency in Next Generation Nuclear Power Plants; Springer: Cham, Switzerland, 2016; pp. 17–35. ISBN 978-3-319-23537-0. [Google Scholar]
  2. Lorde, T.; Waithe, K.; Francis, B. The importance of electrical energy for economic growth in Barbados. Energy Econ. 2010, 32, 1411–1420. [Google Scholar] [CrossRef]
  3. Amadi, H.N. Impact of power outages on developing countries: Evidence from rural households in Niger Delta, Nigeria. J. Energy Technol. Policy 2015, 5, 51–58. [Google Scholar]
  4. Siddiqui, A.S.; Ahmad, A.; Athar, A. Economic impact of power outage on GDP of India. Int. J. Eng. Technol. Manag. Appl. Sci. 2013, 3, 150–162. [Google Scholar]
  5. Ali, R. Effect of Diesel Emissions on Human Health: A Review. Int. J. Appl. Eng. Res. 2013, 6, 1333–1342. [Google Scholar]
  6. Hine, D.W.; Marks, A.D.; Nachreiner, M.; Gifford, R.; Heath, Y. Keeping the home fires burning: The affect heuristic and wood smoke pollution. J. Environ. Psychol. 2007, 27, 26–32. [Google Scholar] [CrossRef]
  7. Abuelrub, A.; Saadeh, O.; Al-Masri, H.M. Scenario Aggregation-Based Grid-Connected Photovoltaic Plant Design. Sustainability 2018, 10, 1275. [Google Scholar] [CrossRef]
  8. Seyedmahmoudian, M.; Soon, T.K.; Jamei, E.; Thirunavukkarasu, G.S.; Horan, B.; Mekhilef, S.; Stojcevski, A. Maximum Power Point Tracking for Photovoltaic Systems under Partial Shading Conditions Using Bat Algorithm. Sustainability 2018, 10, 1347. [Google Scholar] [CrossRef]
  9. Miller, W.; Liu, A.; Amin, Z.; Wagner, A. Power Quality and Rooftop-Photovoltaic Households: An Examination of Measured Data at Point of Customer Connection. Sustainability 2018, 10, 1224. [Google Scholar] [CrossRef]
  10. Alrikabi, N.K.M.A. Renewable energy types. J. Clean Energy Technol. 2014, 2, 61–64. [Google Scholar] [CrossRef]
  11. Owusu, P.A.; Asumadu-Sarkodie, S. A review of renewable energy sources, sustainability issues and climate change mitigation. Cogent Eng. 2016, 3, 1167990. [Google Scholar] [CrossRef]
  12. Musa, S.D.; Zhonghua, T.; Ibrahim, A.O.; Habib, M. China’s energy status: A critical look at fossils and renewable options. Renew. Sustain. Energy Rev. 2017, 8, 2281–2290. [Google Scholar] [CrossRef]
  13. Ouyang, X.; Lin, B. Impacts of increasing renewable energy subsidies and phasing out fossil fuel subsidies in China. Renew. Sustain. Energy Rev. 2014, 37, 933–942. [Google Scholar] [CrossRef]
  14. Fandi, G.; Ahmad, I.; Igbinovia, F.O.; Muller, Z.; Tlusty, J.; Krepl, V. Voltage Regulation and Power Loss Minimization in Radial Distribution Systems via Reactive Power Injection and Distributed Generation Unit Placement. Energies 2018, 11, 1399. [Google Scholar] [CrossRef]
  15. Shakeel, S.R.; Takala, J.; Shakeel, W. Renewable energy sources in power generation in Pakistan. Renew. Sustain. Energy Rev. 2016, 64, 421–434. [Google Scholar] [CrossRef]
  16. Khalil, H.B.; Zaidi, S.J.H. Energy crisis and potential of solar energy in Pakistan. Renew. Sustain. Energy Rev. 2014, 31, 194–201. [Google Scholar] [CrossRef]
  17. Zheng, Y.H.; Li, Z.F.; Feng, S.F.; Lucas, M.; Wu, G.L.; Li, Y.; Li, C.H.; Jiang, G.M. Biomass energy utilization in rural areas may contribute to alleviating energy crisis and global warming: A case study in a typical agro-village of Shandong, China. Renew. Sustain. Energy Rev. 2010, 14, 3132–3139. [Google Scholar] [CrossRef]
  18. Halder, P.K.; Paul, N.; Joardder, M.U.H.; Sarker, M. Energy scarcity and potential of renewable energy in Bangladesh. Renew. Sustain. Energy Rev. 2015, 51, 1636–1649. [Google Scholar] [CrossRef]
  19. Aliyu, A.K.; Modu, B.; Tan, C.W. A review of renewable energy development in Africa: A focus in South Africa, Egypt and Nigeria. Renew. Sustain. Energy Rev. 2017, 81, 2502–2518. [Google Scholar] [CrossRef]
  20. Tripathi, L.; Mishra, A.K.; Dubey, A.K.; Tripathi, C.B.; Baredar, P. Renewable energy: An overview on its contribution in current energy scenario of India. Renew. Sustain. Energy Rev. 2106, 60, 226–233. [Google Scholar] [CrossRef]
  21. Mas’ud, A.A.; Wirba, A.V.; Muhammad-Sukki, F.; Albarracín, R.; Abu-Bakar, S.H.; Munir, A.B.; Bani, N.A. A review on the recent progress made on solar photovoltaic in selected countries of sub-Saharan Africa. Renew. Sustain. Energy Rev. 2016, 62, 441–452. [Google Scholar] [CrossRef] [Green Version]
  22. Piccolo, A.; Siclari, R.; Rando, F.; Cannistraro, M. Comparative Performance of Thermoacoustic Heat Exchangers with Different Pore Geomeyries in Oscillatory Flow. Implementation of Experimental Techniques. Appl. Sci. 2017, 7, 784. [Google Scholar] [CrossRef]
  23. Cannistraro, M.; Mainardi, E.; Bottarelli, M. Testing a Dual-Source Heat Pump. Math. Model. Eng. Probl. 2018, 5, 197–204. [Google Scholar] [CrossRef]
  24. Cannistraro, M.; Castelluccio, M.E.; Germanò, D. New Sol-Gel Depostion Technique in the Smart Windows Computation of Possible Applications of Smart-Windows in Buildings. J. Build. Eng. 2018, 19, 295–301. [Google Scholar] [CrossRef]
  25. Teske, S.; Fattal, A.; Lins, C.; Hullin, M.; Williamson, L.E. Renewables Global Futures Report: Great Debates towards 100% Renewable Energy; REN21: Paris, France, 2017. [Google Scholar]
  26. Zhang, X.; Vesselinov, V.V. Integrated modeling approach for optimal management of water, energy and food security nexus. Adv. Water Resour. 2017, 101, 1–10. [Google Scholar] [CrossRef]
  27. Yan, X.; Jiang, D.; Fu, J.; Hao, M. Assessment of Sweet Sorghum-Based Ethanol Potential in China within the Water-Energy-Food Nexus Framework. Sustainability 2018, 10, 1046. [Google Scholar] [CrossRef]
  28. Mainali, B.; Luukkanen, J.; Silveira, S.; Kaivo-oja, J. Evaluating Synergies and Trade-Offs among Sustainable Development Goals (SDGs): Explorative Analyses of Development Paths in South Asia and Sub-Saharan Africa. Sustainability 2018, 10, 815. [Google Scholar] [CrossRef]
  29. Ministry of Electricity Syria (Data of Syrian Electric Network). Available online: http://www.moe.gov.sy/ar/ (accessed on 13 November 2018).
  30. Adefeso, I.B.; Sonibare, J.; Akeredolu, F.; Rabiu, A. Environmental impact of portable power generator on indoor air quality. In Proceedings of the 2012 International Conference on Environment, Energy and Biotechnology, Kuala Lumpur, Malaysia, 5–6 May 2012; Volume 33. [Google Scholar]
  31. Bolling, A.K.; Pagels, J.; Yttri, K.E.; Barregard, L.; Sallsten, G.; Schwarze, P.E.; Boman, C. Health effects of residential wood smoke particles: The importance of combustion conditions and physicochemical particle properties. Part. Fibre Toxicol. 2009, 6, 29. [Google Scholar] [CrossRef] [PubMed]
  32. Olamijulo, J.O.; Ana, G.R.; Morakinyo, O.M. Noise from Portable Electric Power Generators in an Institutional Setting: A Neglected Risk Factor. Int. J. Environ. Monit. Anal. 2016, 4, 115–120. [Google Scholar] [CrossRef]
  33. Cannistraro, G.; Cannistraro, M.; Galvagno, A.; Trovato, G. Evaluation Technical and Economic the Integrations of Co-Trigeneration Systems in the Dairy Industry. Int. J. Heat Technol. 2016, 34, 332–336. [Google Scholar] [CrossRef]
  34. Cannistraro, M.; Lorenzini, E. The Application of the New Technologies “E-Sensing” in Hospitals. Int. J. Heat Technol. 2016, 34, 551–557. [Google Scholar] [CrossRef]
  35. Maisiri, W.; van Dyke, L.; De Kock, J.A.; Krueger, D. Financial analysis of waste-to-energy grate incineration power plant for a small city. In Proceedings of the 2015 International Conference on the Industrial and Commercial Use of Energy (ICUE), Cape Town, South Africa, 18–19 August 2015; pp. 379–387. [Google Scholar]
  36. Marculescu, C.; Alexe, F.; Bacalum, F.; Doncea, S. Alternative fuels production and properties characterization using food industry waste to energy conversion. In Proceedings of the 2016 IEEE International Conference on Emerging Technologies and Innovative Business Practices for the Transformation of Societies (EmergiTech), Balaclava, Mauritius, 3–6 August 2016; pp. 345–350. [Google Scholar]
  37. Khelidj, B.; Abderezzak, B.; Kellaci, A. Biogas production potential in Algeria: Waste to energy opportunities. In Proceedings of the 2012 International Conference on Renewable Energies for Developing Countries (REDEC), Beirut, Lebanon, 28–29 November 2012; pp. 1–5. [Google Scholar]
  38. Photovoltaic Geographical Information System. Available online: http://re.jrc.ec.europa.eu/pvgis/apps4/pvest.php (accessed on 2 January 2018).
  39. Earth System Research Laboratory Global Monitoring Division. Available online: https://www.esrl.noaa.gov/gmd/grad/solcalc/ (accessed on 12 January 2018).
  40. Nowak, D.J.; Hoehn, R.; Crane, D.E. Oxygen production by urban trees in the United States. Arboric. Urban For. 2007, 33, 220–226. [Google Scholar]
  41. Nowak, D.J.; Greenfield, E.J.; Hoehn, R.E.; Lapoint, E. Carbon storage and sequestration by trees in urban and community areas of the United States. Environ. Pollut. 2013, 178, 229–236. [Google Scholar] [CrossRef] [PubMed] [Green Version]
  42. Thomas, S.C.; Martin, A.R. Carbon content of tree tissues: A synthesis. Forests 2012, 3, 332–352. [Google Scholar] [CrossRef]
Figure 1. Proposed algorithm for the emergency system.
Energies 11 03138 g001
Figure 2. MATLAB Simulink model for the proposed methodology.
Energies 11 03138 g002
Figure 3. Power plant in Syria.
Energies 11 03138 g003
Figure 4. Electricity supply during years 2010–2016.
Energies 11 03138 g004
Figure 5. Peak power demand 2010–2016.
Energies 11 03138 g005
Figure 6. Energy demand 2010–2016.
Energies 11 03138 g006
Figure 7. (a) Total energy demand (without rationing) 2010–2016; (b) Energy shortage 2010–2016.
Energies 11 03138 g007
Figure 8. Population changes in Latakia 2011–2016.
Energies 11 03138 g008
Figure 9. Migration tracks, oil and gas wells and power plants.
Energies 11 03138 g009
Figure 10. Number of portable generators 2011–2016.
Energies 11 03138 g010
Figure 11. Old portable generators in Latakia’s streets.
Energies 11 03138 g011
Figure 12. Portable generators energy contribution and total energy shortage 2011–2016.
Energies 11 03138 g012
Figure 13. Installed batteries in homes in Latakia city.
Energies 11 03138 g013
Figure 14. Photovoltaic Geographical Information System for Latakia and optimal slope.
Energies 11 03138 g014
Figure 15. Solar radiation data and electricity production in Latakia.
Energies 11 03138 g015
Figure 16. Emergency system contribution to energy shortage coverage 2011–2016.
Energies 11 03138 g016
Figure 17. Cut area of forests in Latakia rural 2011–2016.
Energies 11 03138 g017
Figure 18. Increase in (CO2) and decrease in (O2) due to cutting the trees and the combustion of wood.
Energies 11 03138 g018
Figure 19. Emission from the portable generators 2011–2016.
Energies 11 03138 g019
Table 1. Emergency levels and the corresponded electricity cut off hours.
Emergency LevelCut Off Hours per Day
12
24
36
48
510
612
Table 2. Emergency levels and the corresponded population increase.
Emergency LevelPopulation Increase %
112.5%
225%
337.5%
450%
Table 3. Population changes in Latakia and causes of migration 2011–2016.
YearPopulationChange Percentage %Cause of the Increase
2011570,000-No migration
2012675,00018.42%Migration from Idlib, Hama and Homs
2013810,00042.1%Migration from Aleppo
2014980,00071.93%Migration from Aleppo and Latakia rural
20151,190,000108.77%Migration from Aleppo and Latakia rural
20161,085,00090.35%Going back to Aleppo and Homs
Table 4. Area of building roofs in Latakia city.
BuildingsArea (m2)
Schools54,000
Faculties and university buildings21,600
Government buildings23,100
Residential buildings46,000
Table 5. Comparison of rationing hours with and without the emergency system.
YearRationing Hours (without Emergency System)Rationing Hours (without Emergency System)
201140
201280
2013100
20141248 min
2015141 h 40 min
20161240 min

