1. Introduction
In commercial wind-power generation, most attention is placed on the deployment of horizontal axis wind turbines (HAWTs) as they are thought to be more efficient than the vertical axis wind turbines (VAWTs) [
1]. However, recent studies on VAWTs found that they can be driven by gentler winds and have no need of yaw. These advantages make VAWTs ideal for urban power generation [
1,
2].
VAWTs can be generally divided into two types: drag-type and lift-type. Lift-type VAWTs have a bigger tip-speed ratio; thus, they can convert the highest amount of energy. Lift-type VAWTs, such as the Darrieus rotor with egg-beater blades (
-type) and the Darrieus rotor with straight blades (H-type), are the most widely used VAWTs [
3,
4]. Furthermore, their designs were improved with computer fluid dynamics (CFD) and finite element analysis (FEA), making them more efficient in energy conversion [
5,
6,
7]. However, studies on VAWTs are limited when compared to those on horizontal wind turbines. Although several laboratory vibration tests were performed to study the dynamic behavior of VAWTs [
8,
9,
10,
11], only a limited number of field vibration measurements were conducted. Some studies showed that the vibration of the VAWT support structure may be influenced by the wind turbine’s operation [
9]. Although there are some research reports about the development of rooftop VAWTs which can make better use of high-altitude winds [
12,
13], very few instances of on-site monitoring are published.
The implementation of structural health monitoring (SHM) systems in a structure can help ensure optimal performances of the structure. This is achieved via real-time vibration measurements and a better understanding of the dynamic loads [
14,
15,
16]. The SHM of wind turbine towers was proposed for system monitoring and was integrated into the Supervisory Control and Data Acquisition (SCADA) systems [
17,
18,
19,
20]. The SHM of HAWT towers concerns problems including resonance responses caused by operation frequency or blade passing frequency [
21,
22,
23], foundation scouring [
24], blade flange conditions [
25], and structural performances under extreme events [
26,
27].
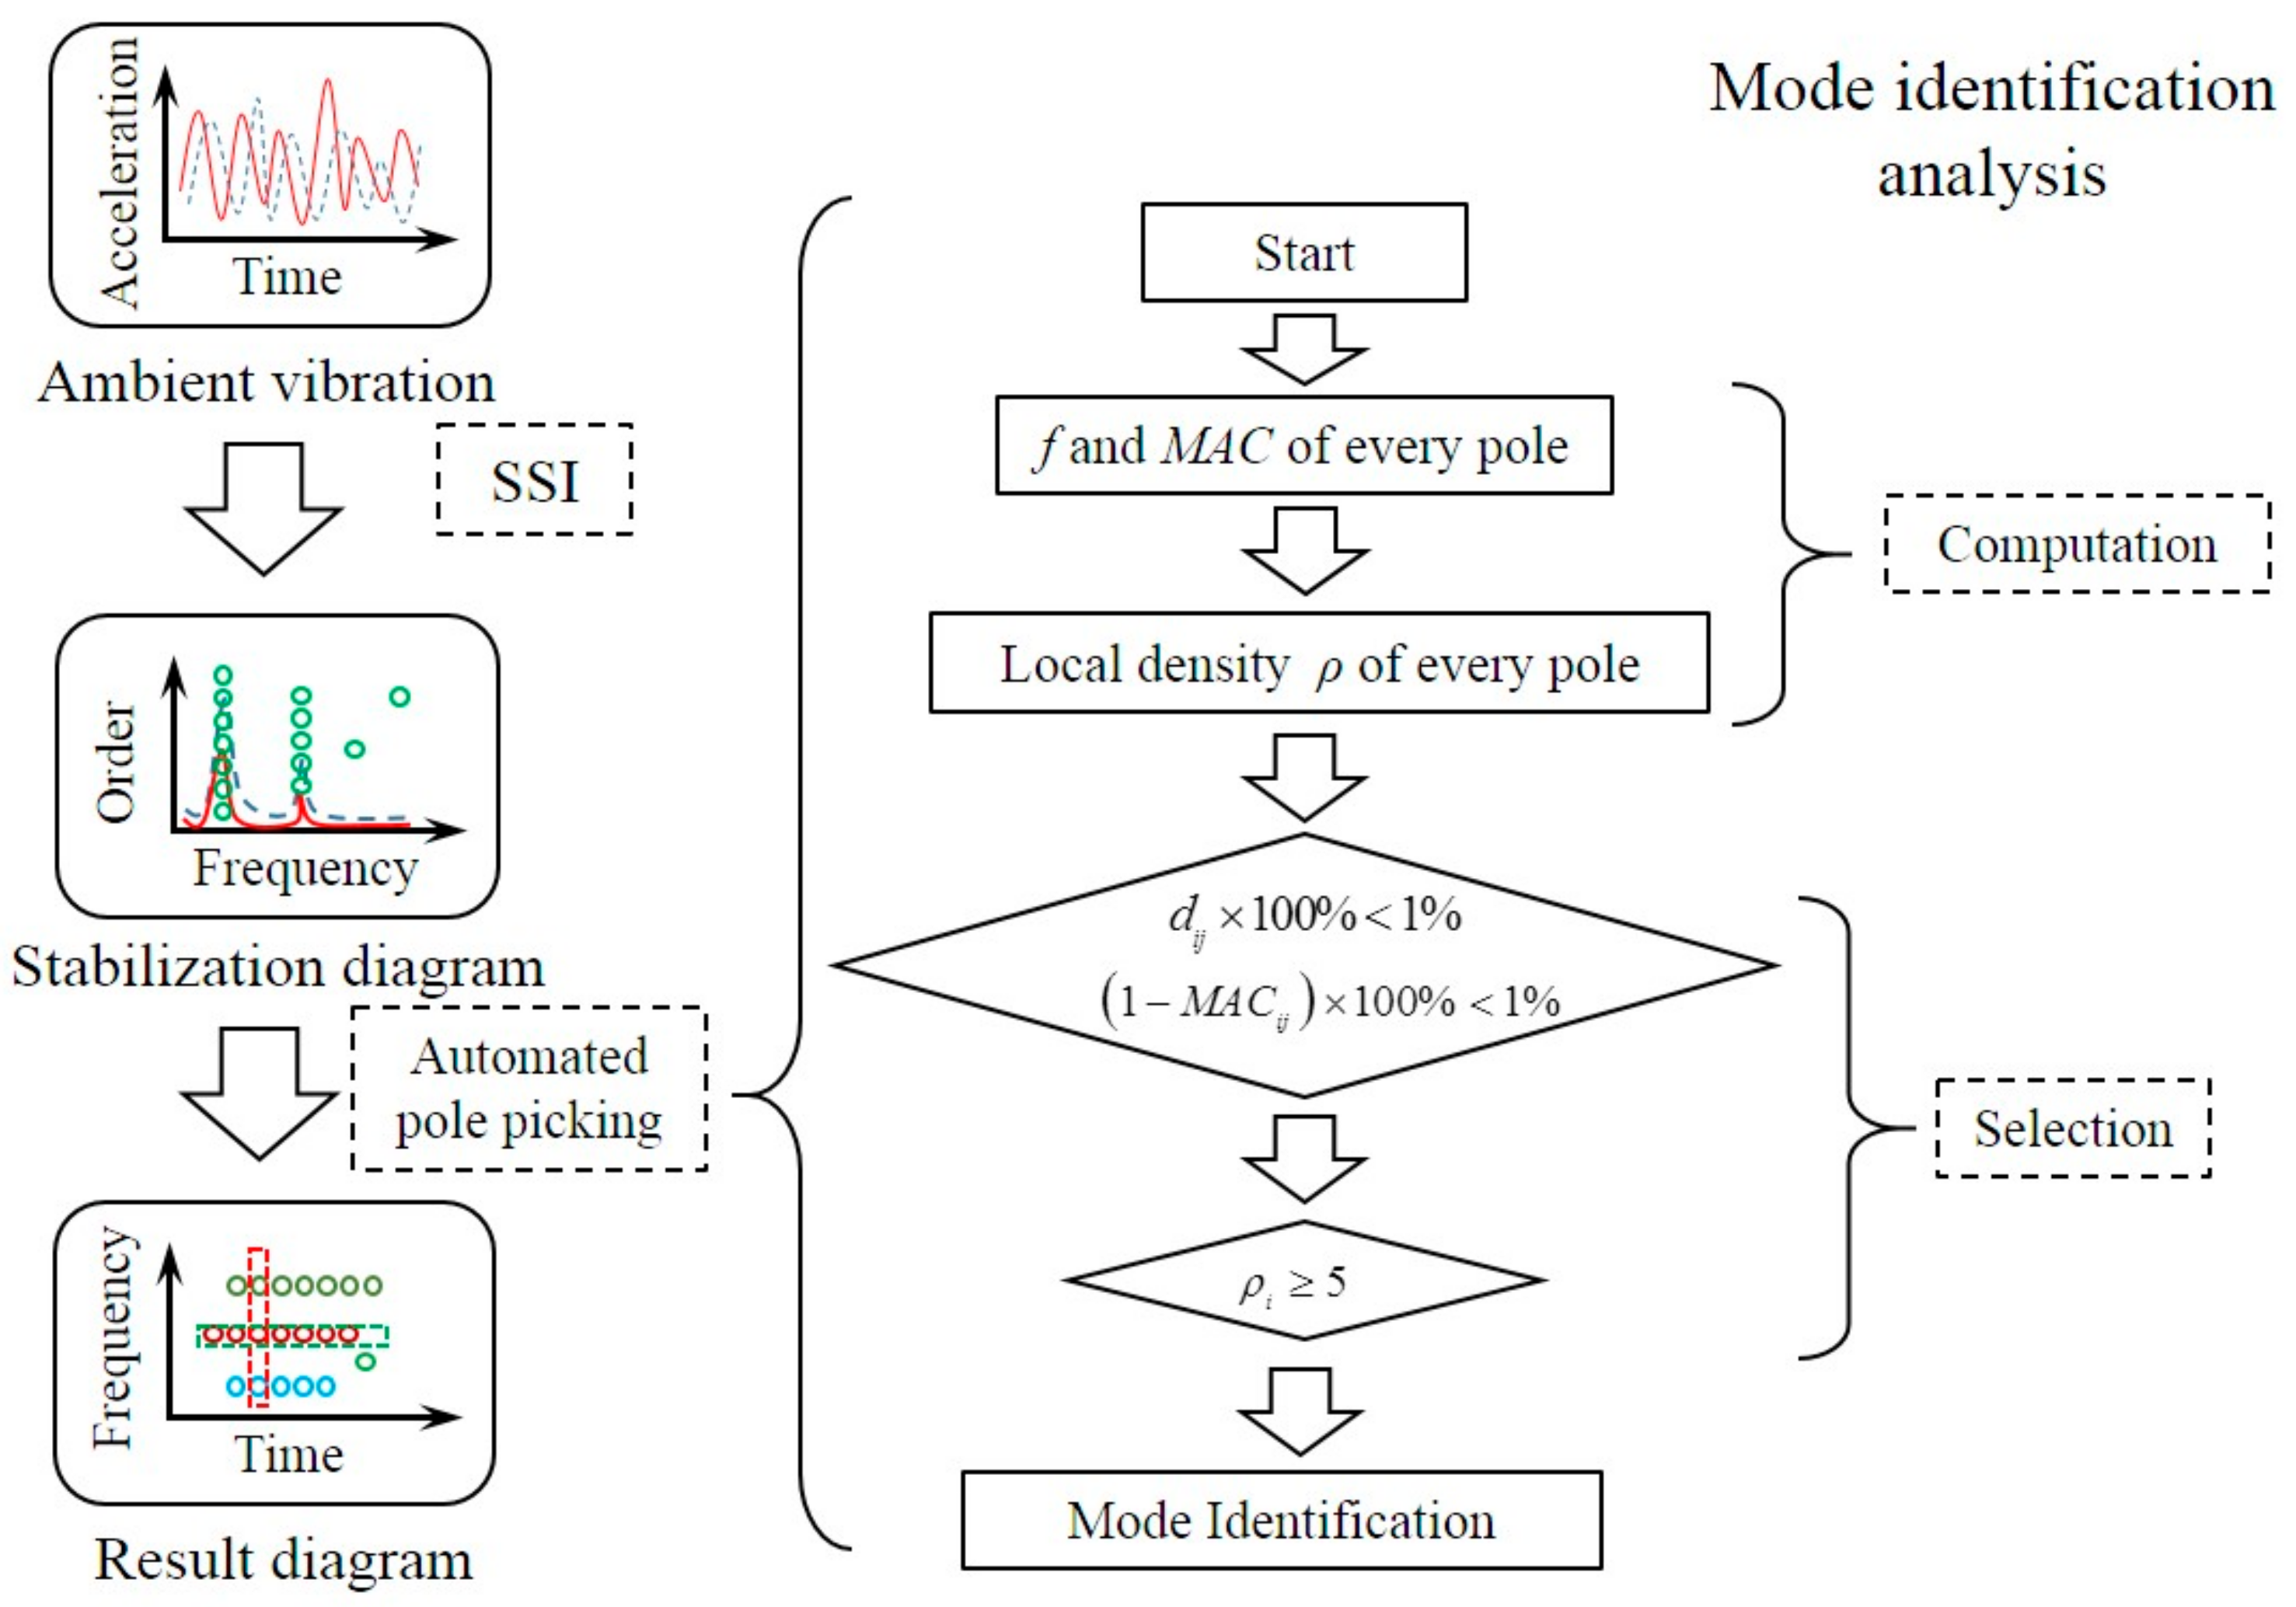
Understanding the dynamics of VAWTs can be helpful for improving the design of VAWTs and the implementation of SHM in the VAWT systems. In this paper, along with the installation of an H-type VAWT on the roof of a 24-story dormitory building, a structural health monitoring system was implemented, and the dynamic responses of the VAWT were studied and reported. The objective of this study was to understand how the VAWT behaves dynamically under normal operation conditions. Ambient vibration measurements were obtained for both the building and the VAWT, including the support tower. The data were analyzed to find the interactions between the building and the VAWT structure, as well as the environmental effects on the vibration responses. To facilitate modal parameter identification, an automated algorithm based on stochastic subspace identification (SSI) and a fast clustering algorithm was developed. The results are presented herein along with discussions on the interactions between the building and the tower and their significance for condition monitoring.
The paper is organized as follows: in
Section 2, the VAWT is firstly introduced and the vibration measurement campaign is described. Data analyses and a discussion of the results are provided in
Section 3 and
Section 4, respectively. The findings are summarized in
Section 5.
2. The VAWT Wind Turbine and Vibration Measurements
An H-type VAWT was installed on the roof of a 24-story dormitory building belonging to the Tongji University, Shanghai, China (referred to as the #6 building at the Zhangwu campus).
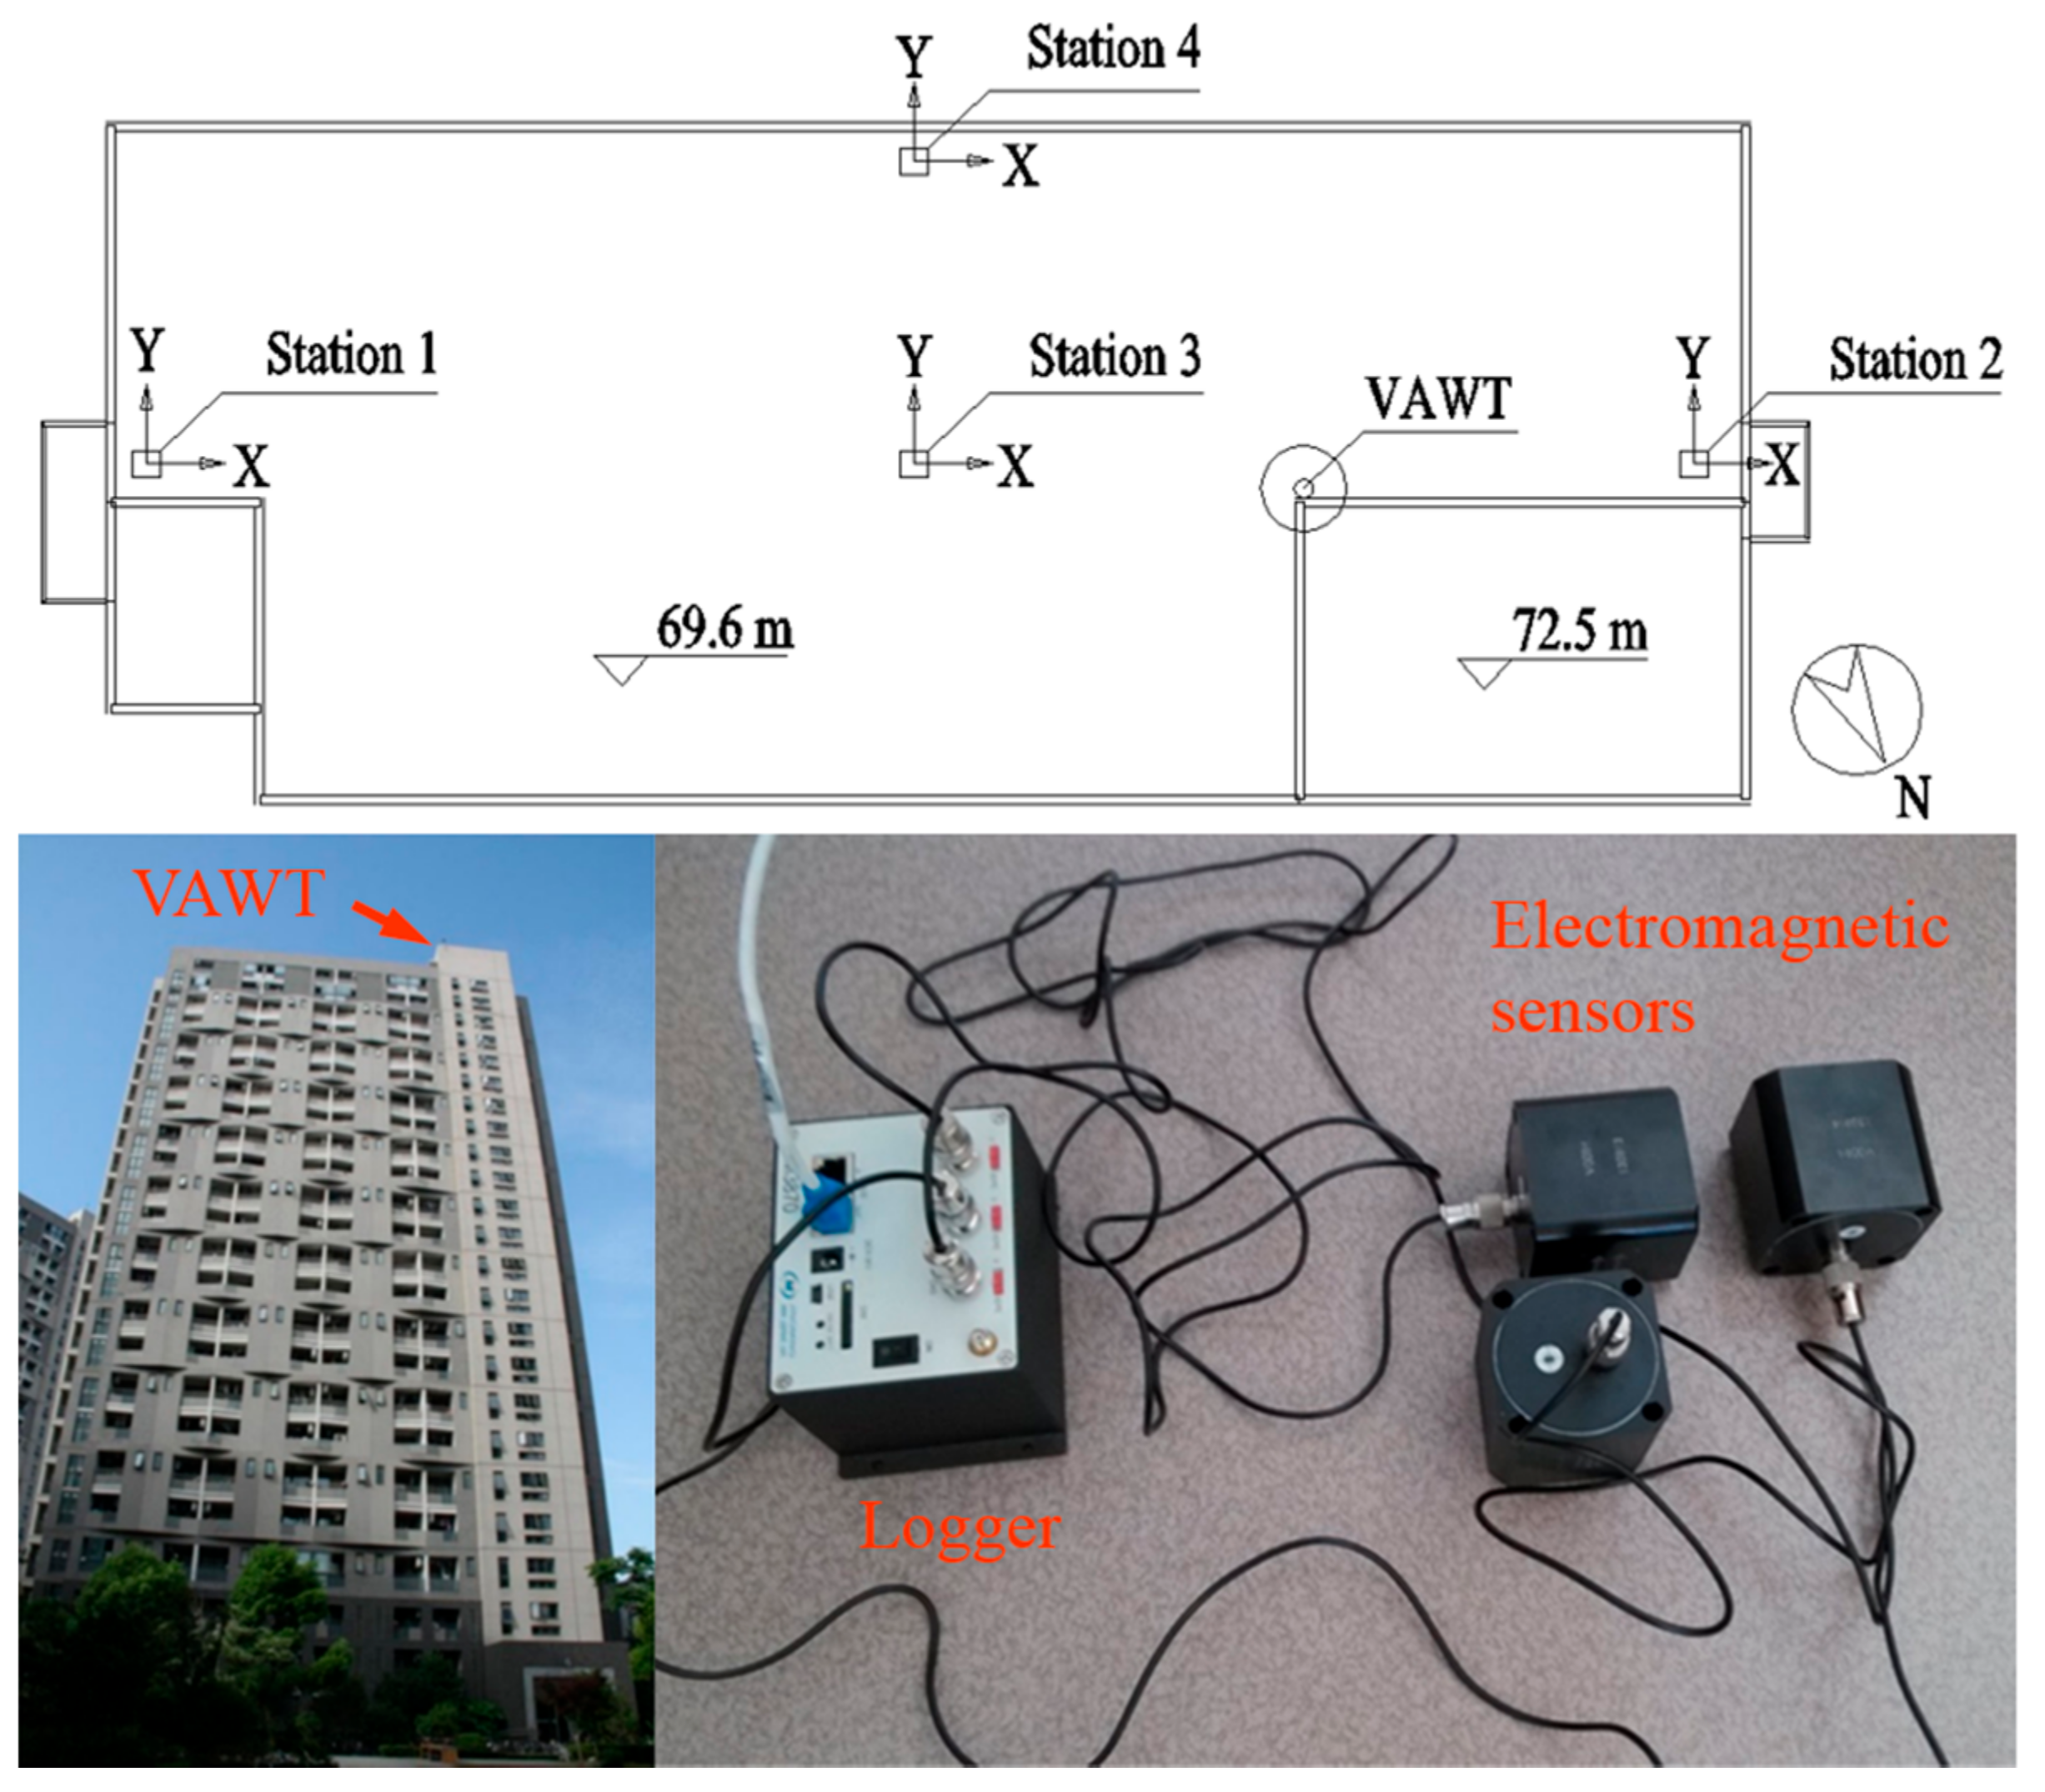
Vibration measurements of the #6 building were conducted prior to the VAWT installation. Several electromagnetic accelerometers were placed on the building’s rooftop, and the lateral movements of the building along both the X-direction (longer axis) and the Y-direction (shorter axis) were measured. These electromagnetic accelerometers, with a moving coil as the sensing unit, have good performances in the low-frequency range. Details of the electromagnetic accelerometers can be found in
Table 1.
Figure 1 shows the #6 building, the relative location of the VAWT, and the deployment of the vibration sensors. Accelerations of the roof of the #6 building were measured with a sampling frequency of 128 Hz, and the duration of the building acceleration data was around 9 min.
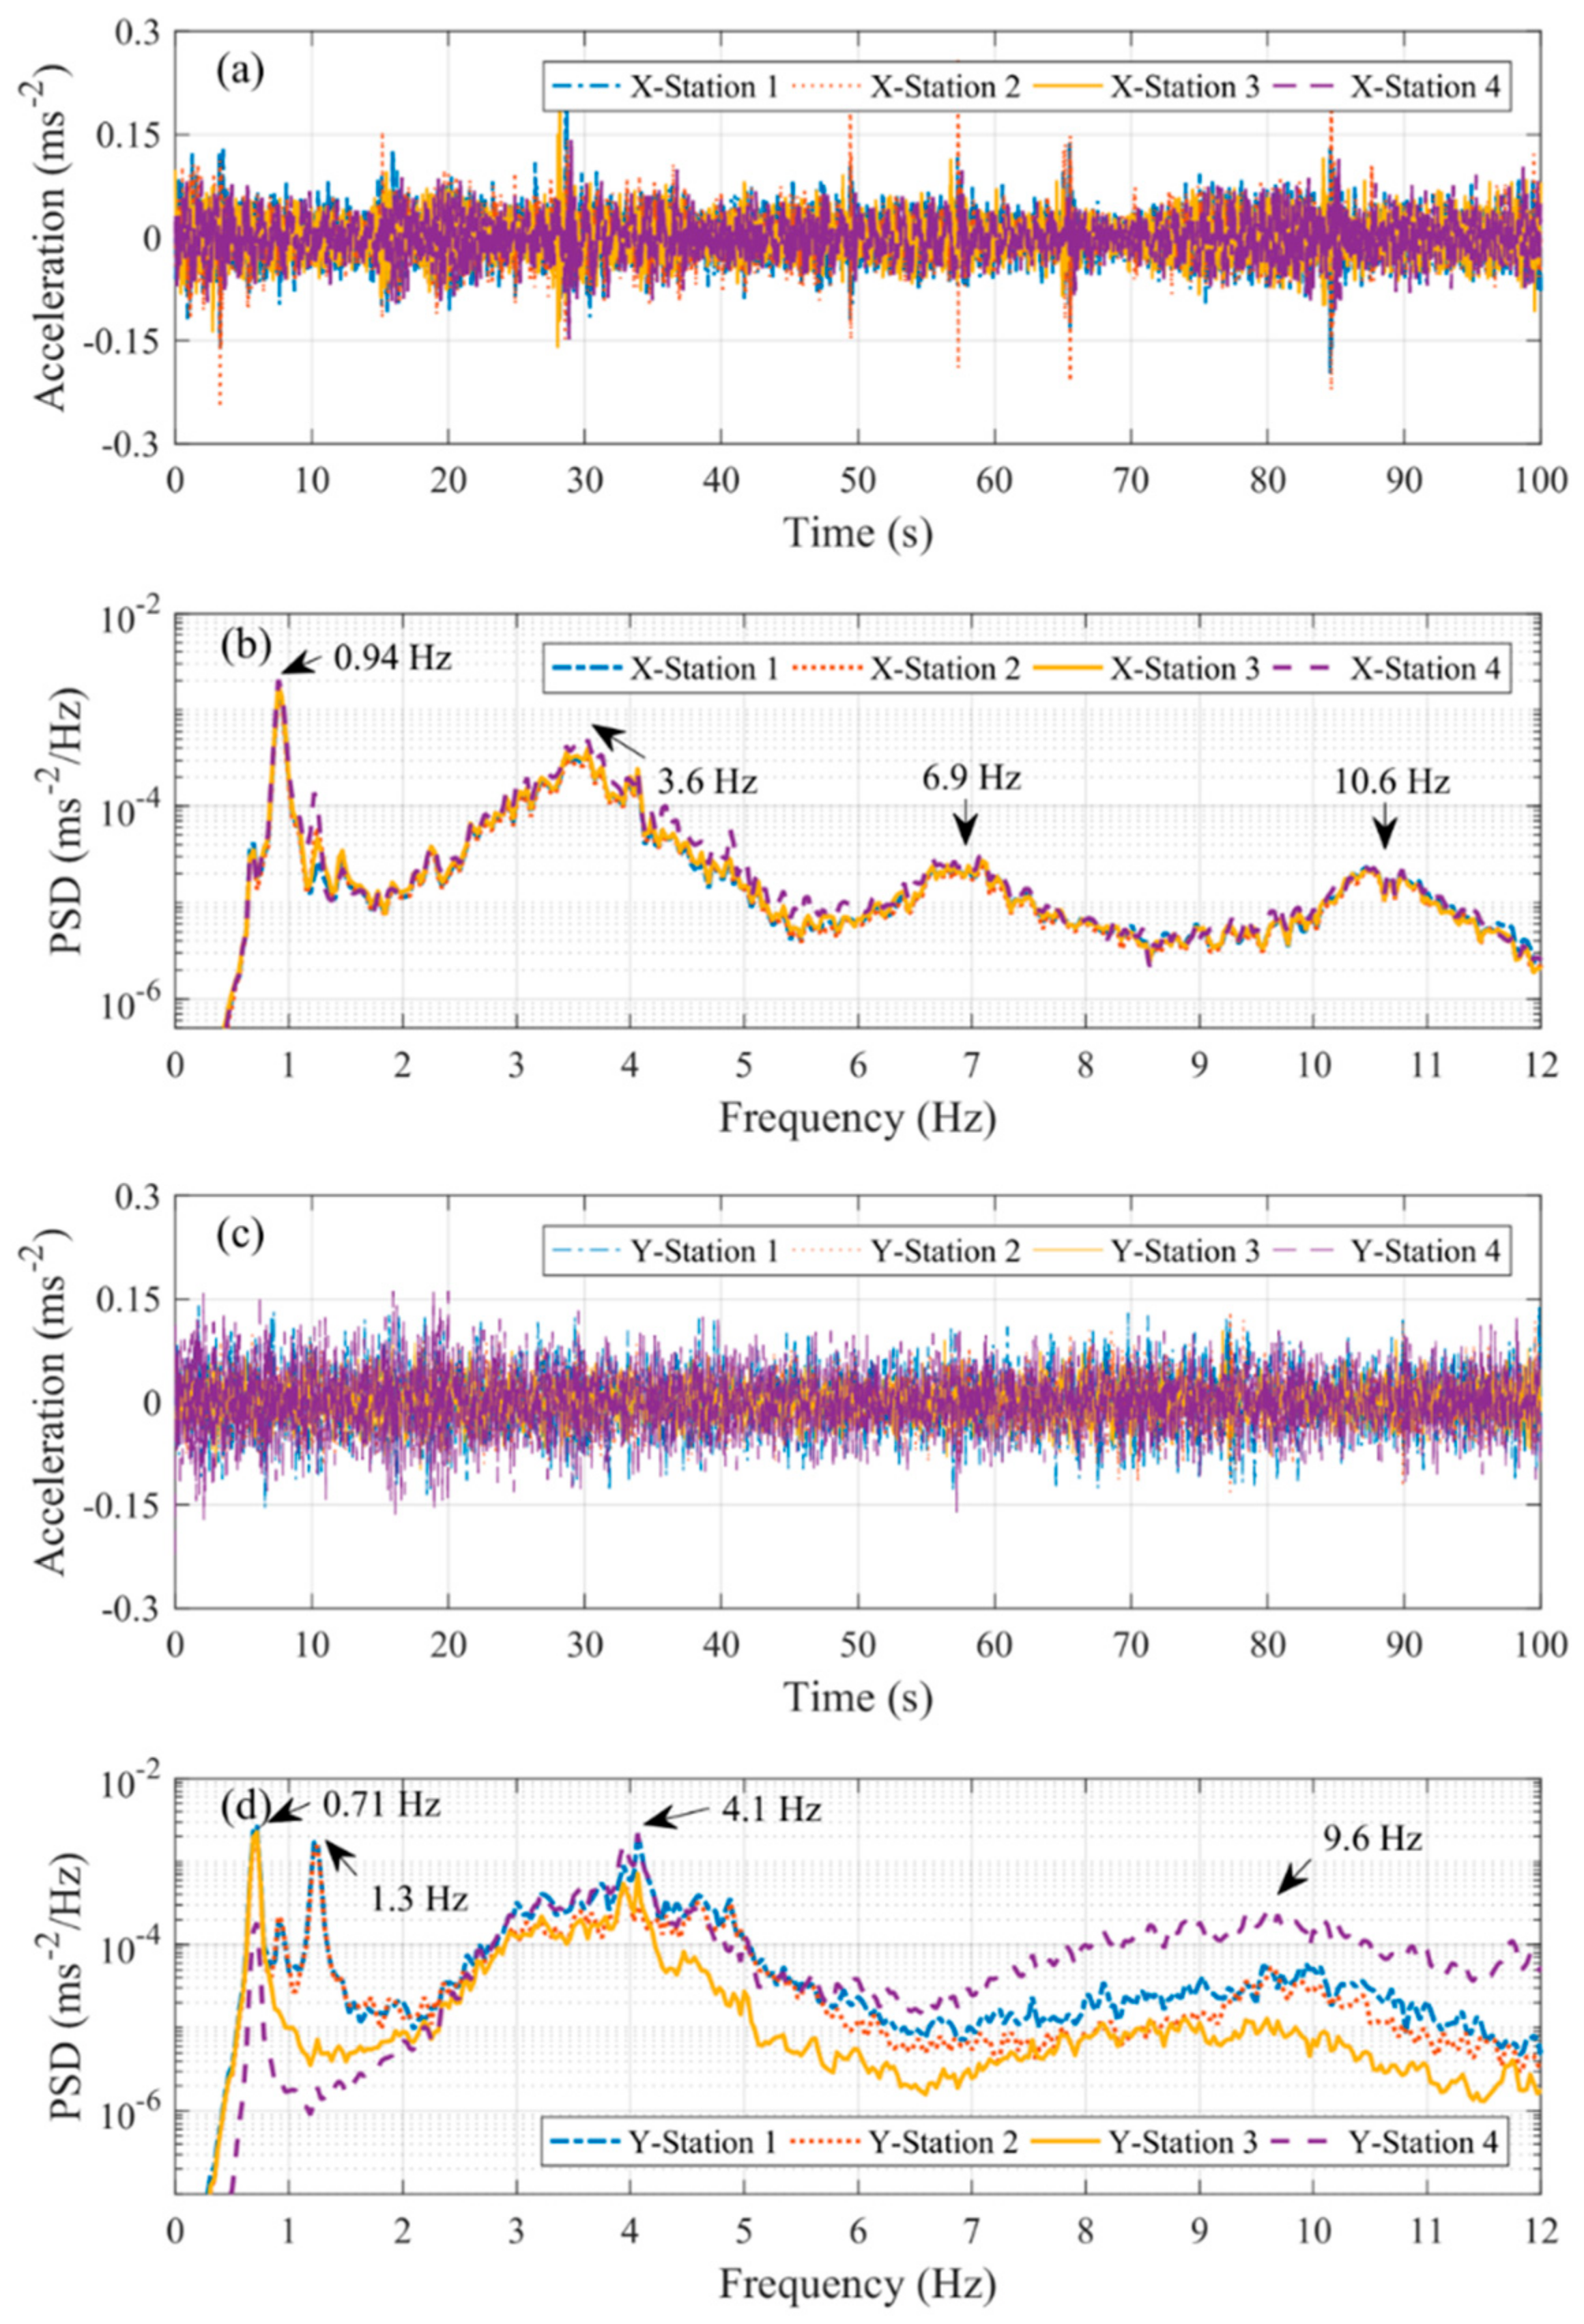
Both the vibration-time histories and the power spectrum density (PSD) of the roof were obtained along the X- and Y-directions. The building vibrations obtained are shown in
Figure 2. Based on the PSD diagram, the first few modes of natural frequencies of the #6 building are shown to be less than 12 Hz (
Table 2). The peaks of higher vibration modes are not as obvious as the lower modes; thus, high-frequency modes are more difficult to determine (
Figure 2b,d). The frequencies shown in
Table 2 were the measured natural frequencies of the #6 building. The roof vibrations, shown in
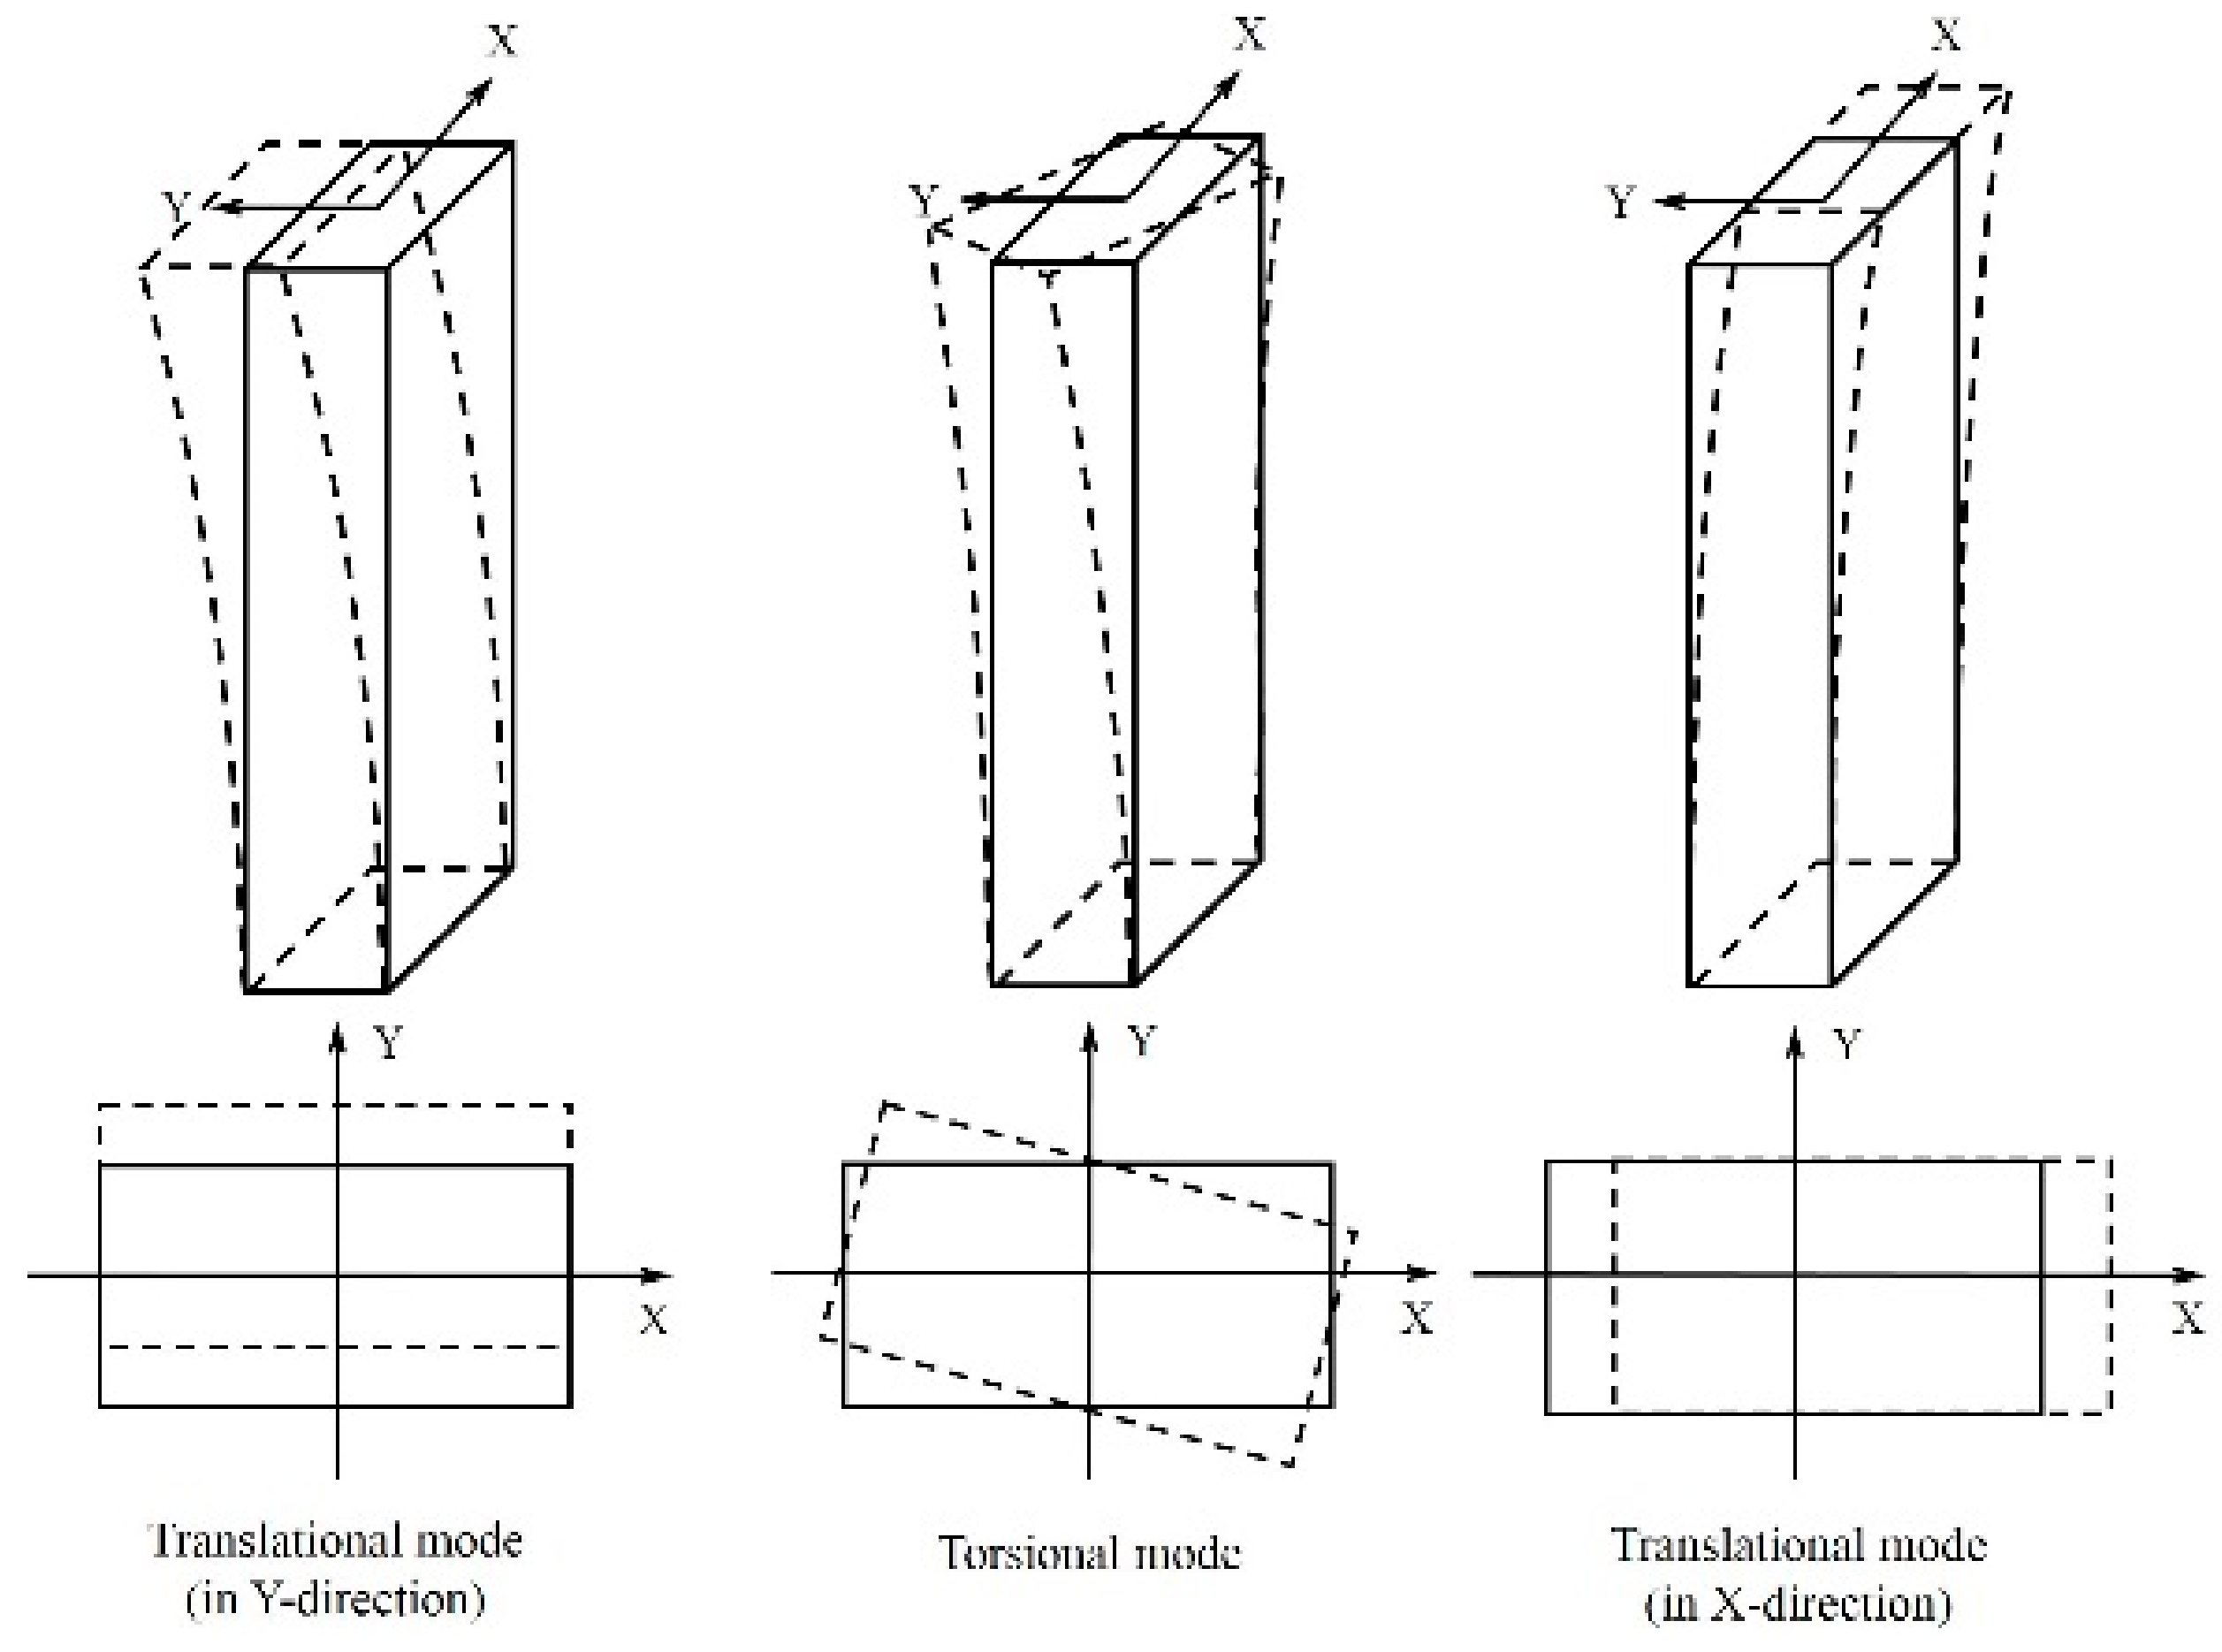
Figure 3, include (1) translational motion along the X-direction, (2) translational motion along the Y-direction, and (3) torsional motion. Since the long axis of the building is along the X-direction, the torsional motion (corresponding to 1.3 Hz) can be observed for the Y-direction measurements of Station 1 and Station 2, indicating possibly more torsional vibration for a substructure (e.g., a VAWT) if it is installed on the edge of a building than for one installed at the center of the building.
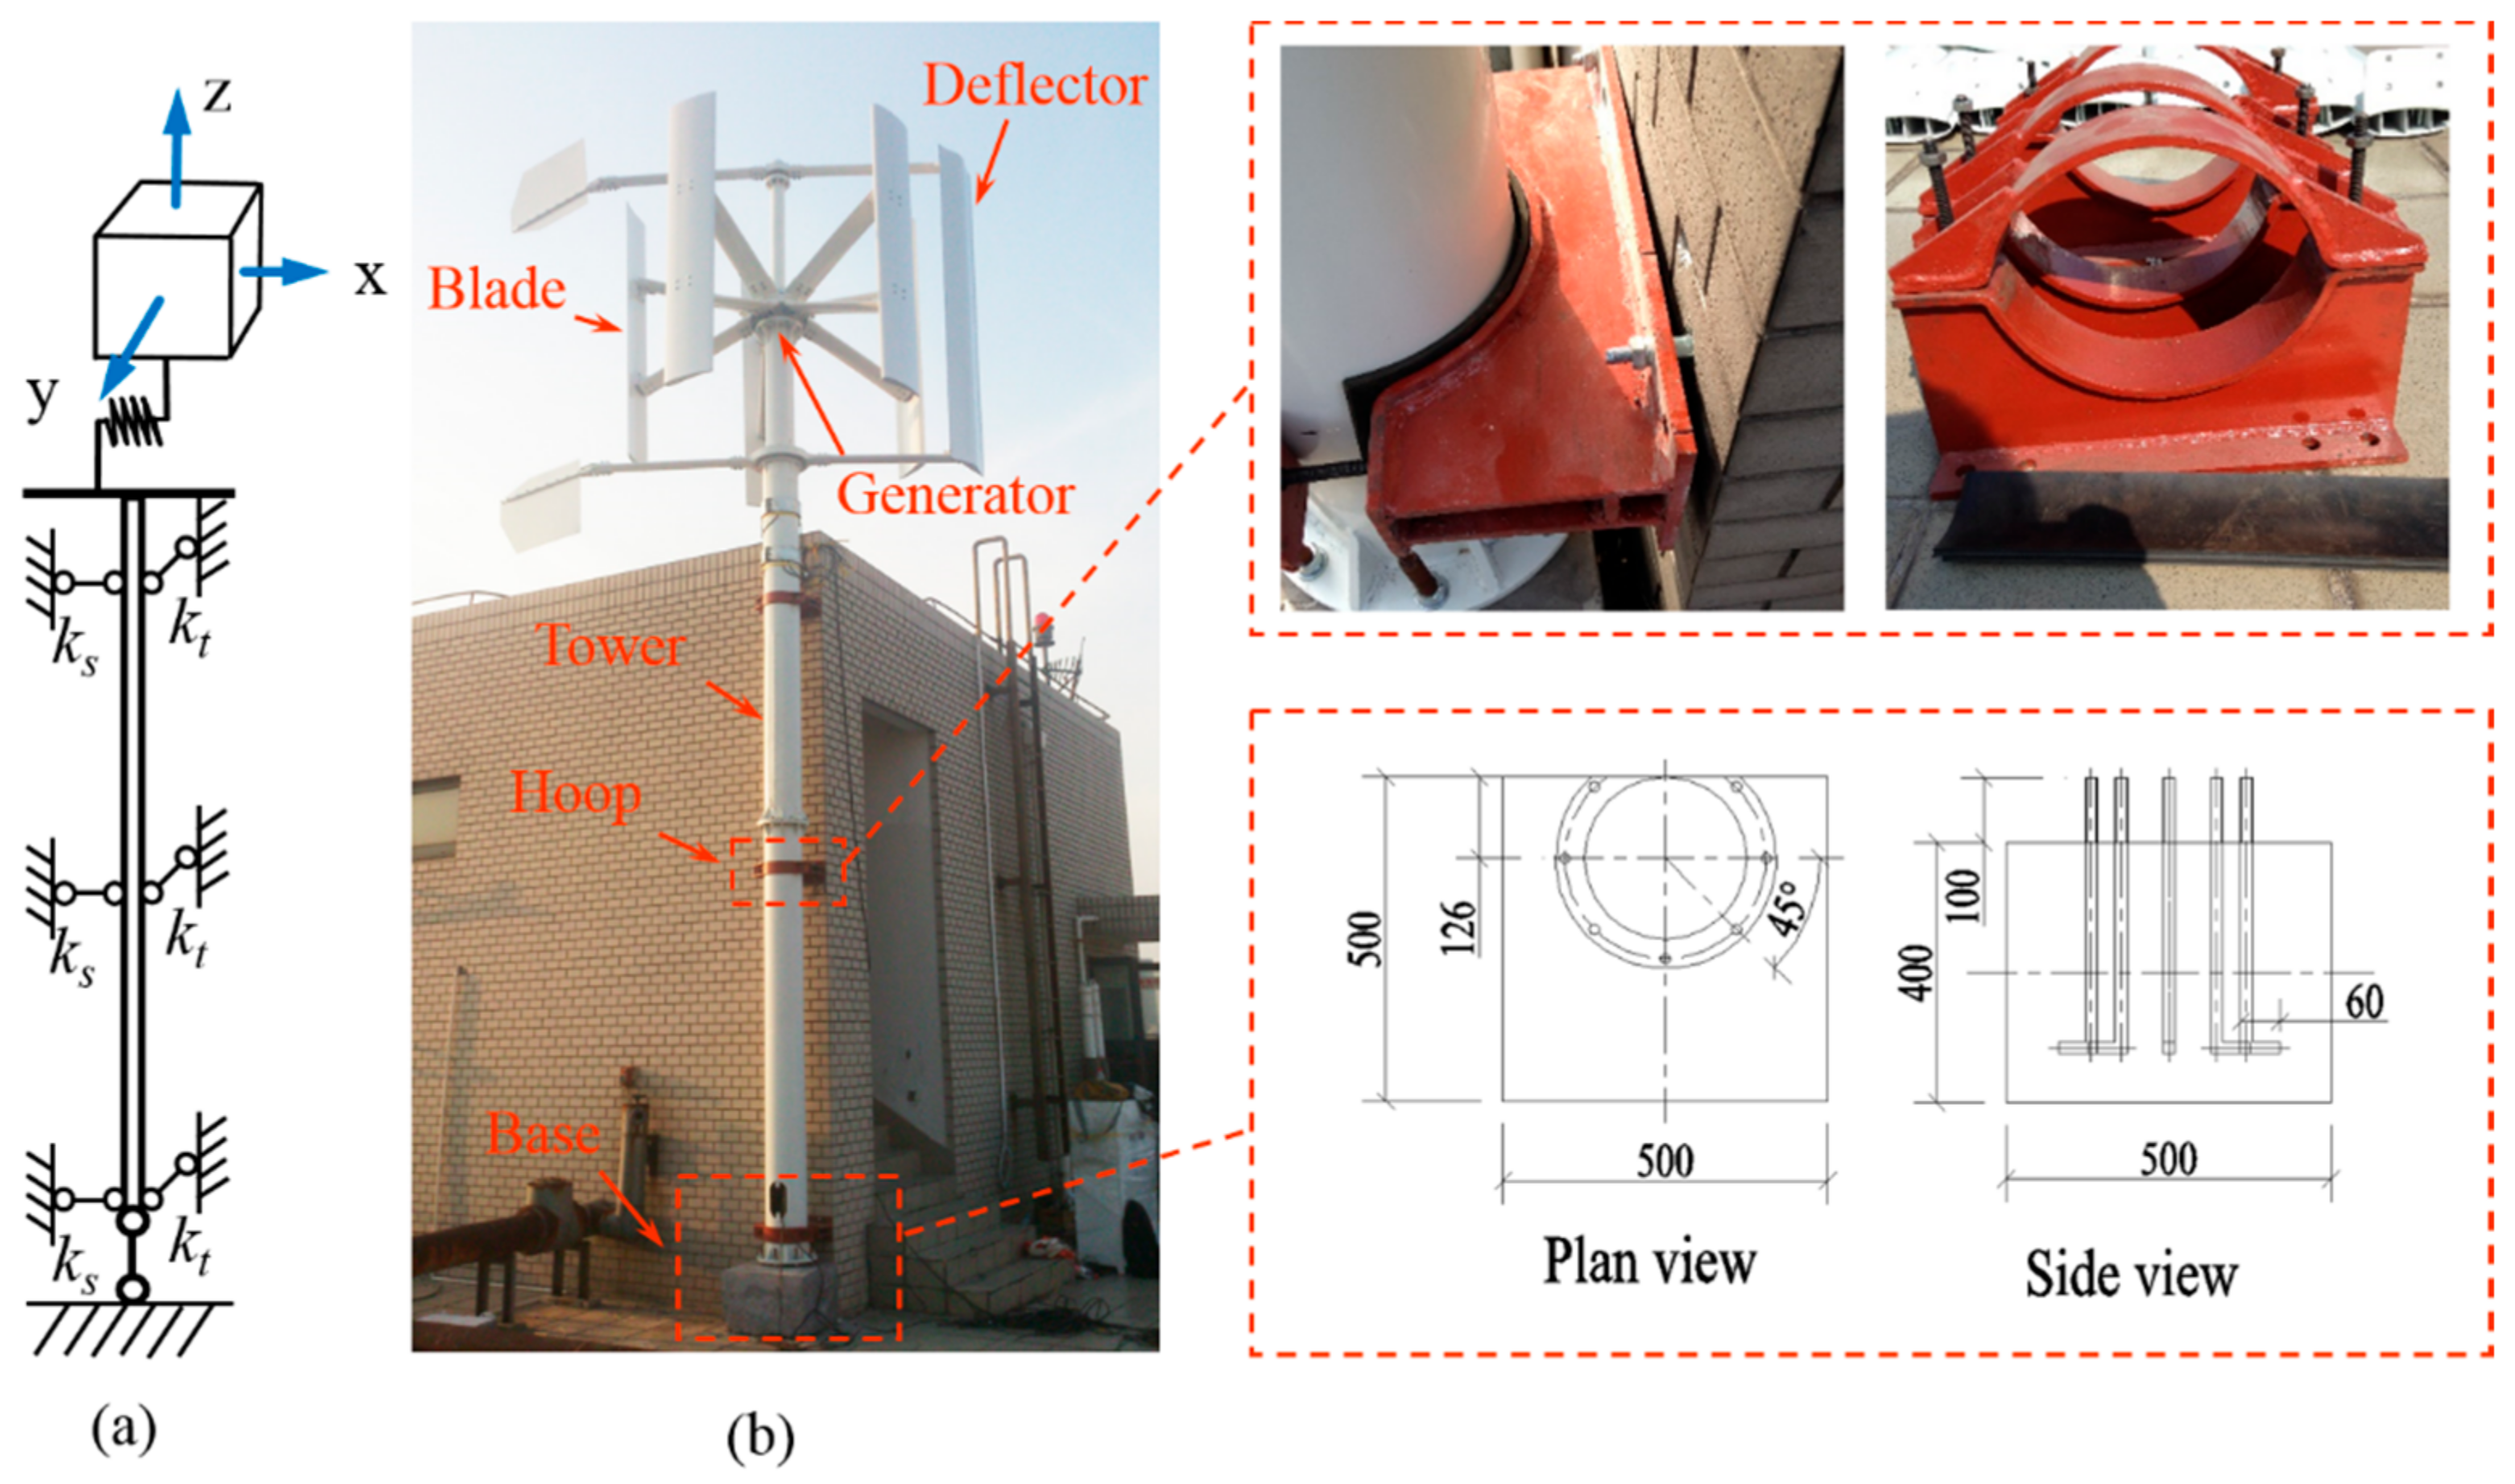
The VAWT consists of a power generation component that includes five turbine blades, a deflector, a generator, and a hollow shaft.
Figure 4 shows the wind turbine, which is attached via metal-strip hoops to the exterior of an extension structure for the elevator shaft on the rooftop. The design details of the VAWT are listed in
Table 3. The metal-strip hoops were designed to laterally constrain the wind turbine tower and were embedded into the wall of the #6 building with expansion bolts. To reduce vibration of the tower, rubber gaskets were placed between the hoops and the tower. There were three hoops attached to the structure with the last hoop very close to the base block. Details of the hoops can be seen in
Figure 4. The heavy concrete base block, laid on the roof, was used to weigh down the tower. Bolts were embedded into the concrete base block (foundation) and were connected to the bottom flange of the tower. The bolt size and anchor depth are shown in
Table 4.
The theoretical frequencies of the VAWT structure were also calculated before the installation to avoid the resonance issue, considering building vibrations. The vibration responses of interest for the wind turbine are the lateral movements of the power generation component as described in the simplified model shown in
Figure 4a [
28]. Other than the rigid foundation at the base, the bending behaviors of the tower are critically limited by the stiffness of the three hoop supports on the tower shaft. As shown in
Figure 4, the hoops consist of half-rings connected to the hoop base using the bolt connectors and rubber gaskets. Hence, the constraining actions of the hoops can be described as shear in the perpendicular direction to the bolts (X-direction) and tension in the bolt connection direction (Y-direction). Also shown in
Figure 4 is the simplified dynamic model of the monitoring system, which includes the wind generation component (rigid mass) and the connection to the top hoop support (rod). Different stiffness models can be constructed for the hoop support. The tensile stiffness of a single hoop,
, can be described as
where
,
, and
are the tensile stiffness of M10 bolts and M12 bolts, and the compression stiffness of the rubber gaskets, respectively. The shear stiffness of a single hoop
can be described as
where
is the shear stiffness of the M12 bolts. In the following discussion, the vibration responses of the wind turbine are separated into the shear (X) direction and the tension (Y) direction. Using this very simplistic dynamic model, the fundamental frequencies of the tower were derived as 7.2 Hz in the shear direction (X-direction of the tower shaft and X-direction of the building) and 6.0 Hz in the tension direction (Y-direction of the tower shaft and Y-direction of the building).
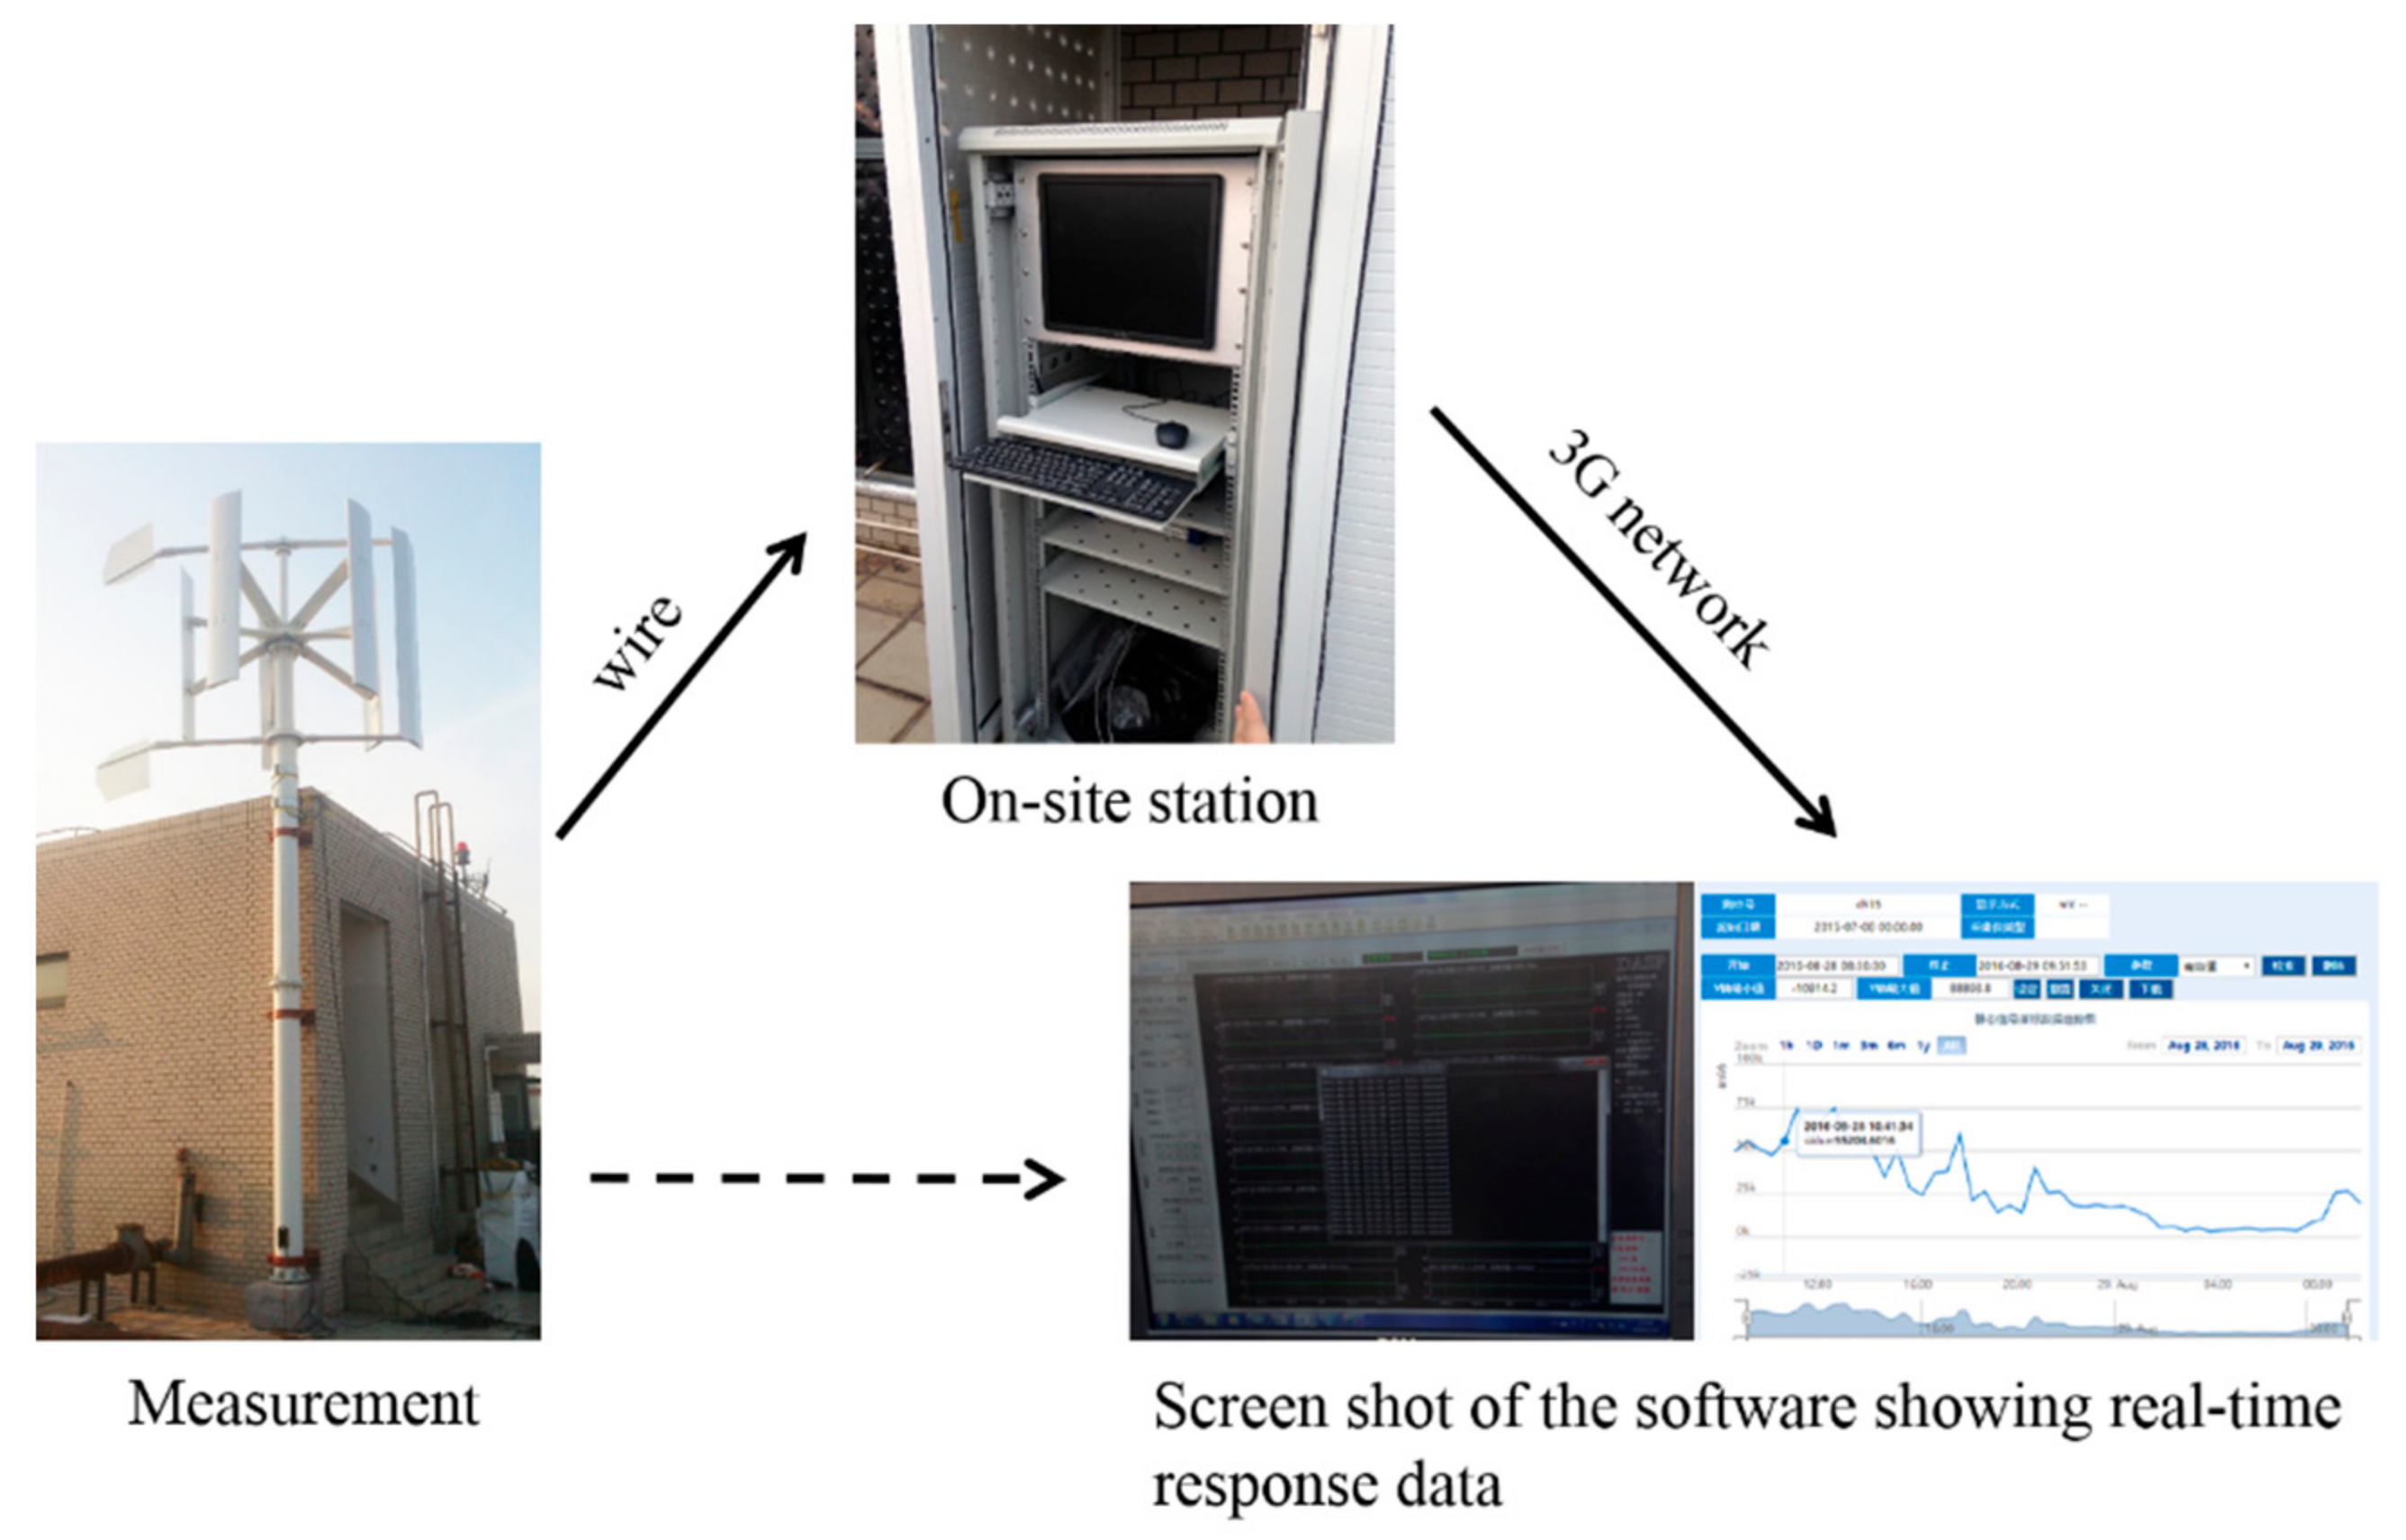
A monitoring system was designed for the data collection, storage, and processing. Parameters associated with environment, power generation, and structural performances were collected continuously. Measurements were stored in a computer installed on the roof. The system was also designed to allow remote monitoring of data.
Figure 5 shows the monitoring setup of the VAWT tower. In this case, a third-generation (3G) network was used for the wireless data transmission. This paper focuses on vibration data collected from this condition monitoring system.
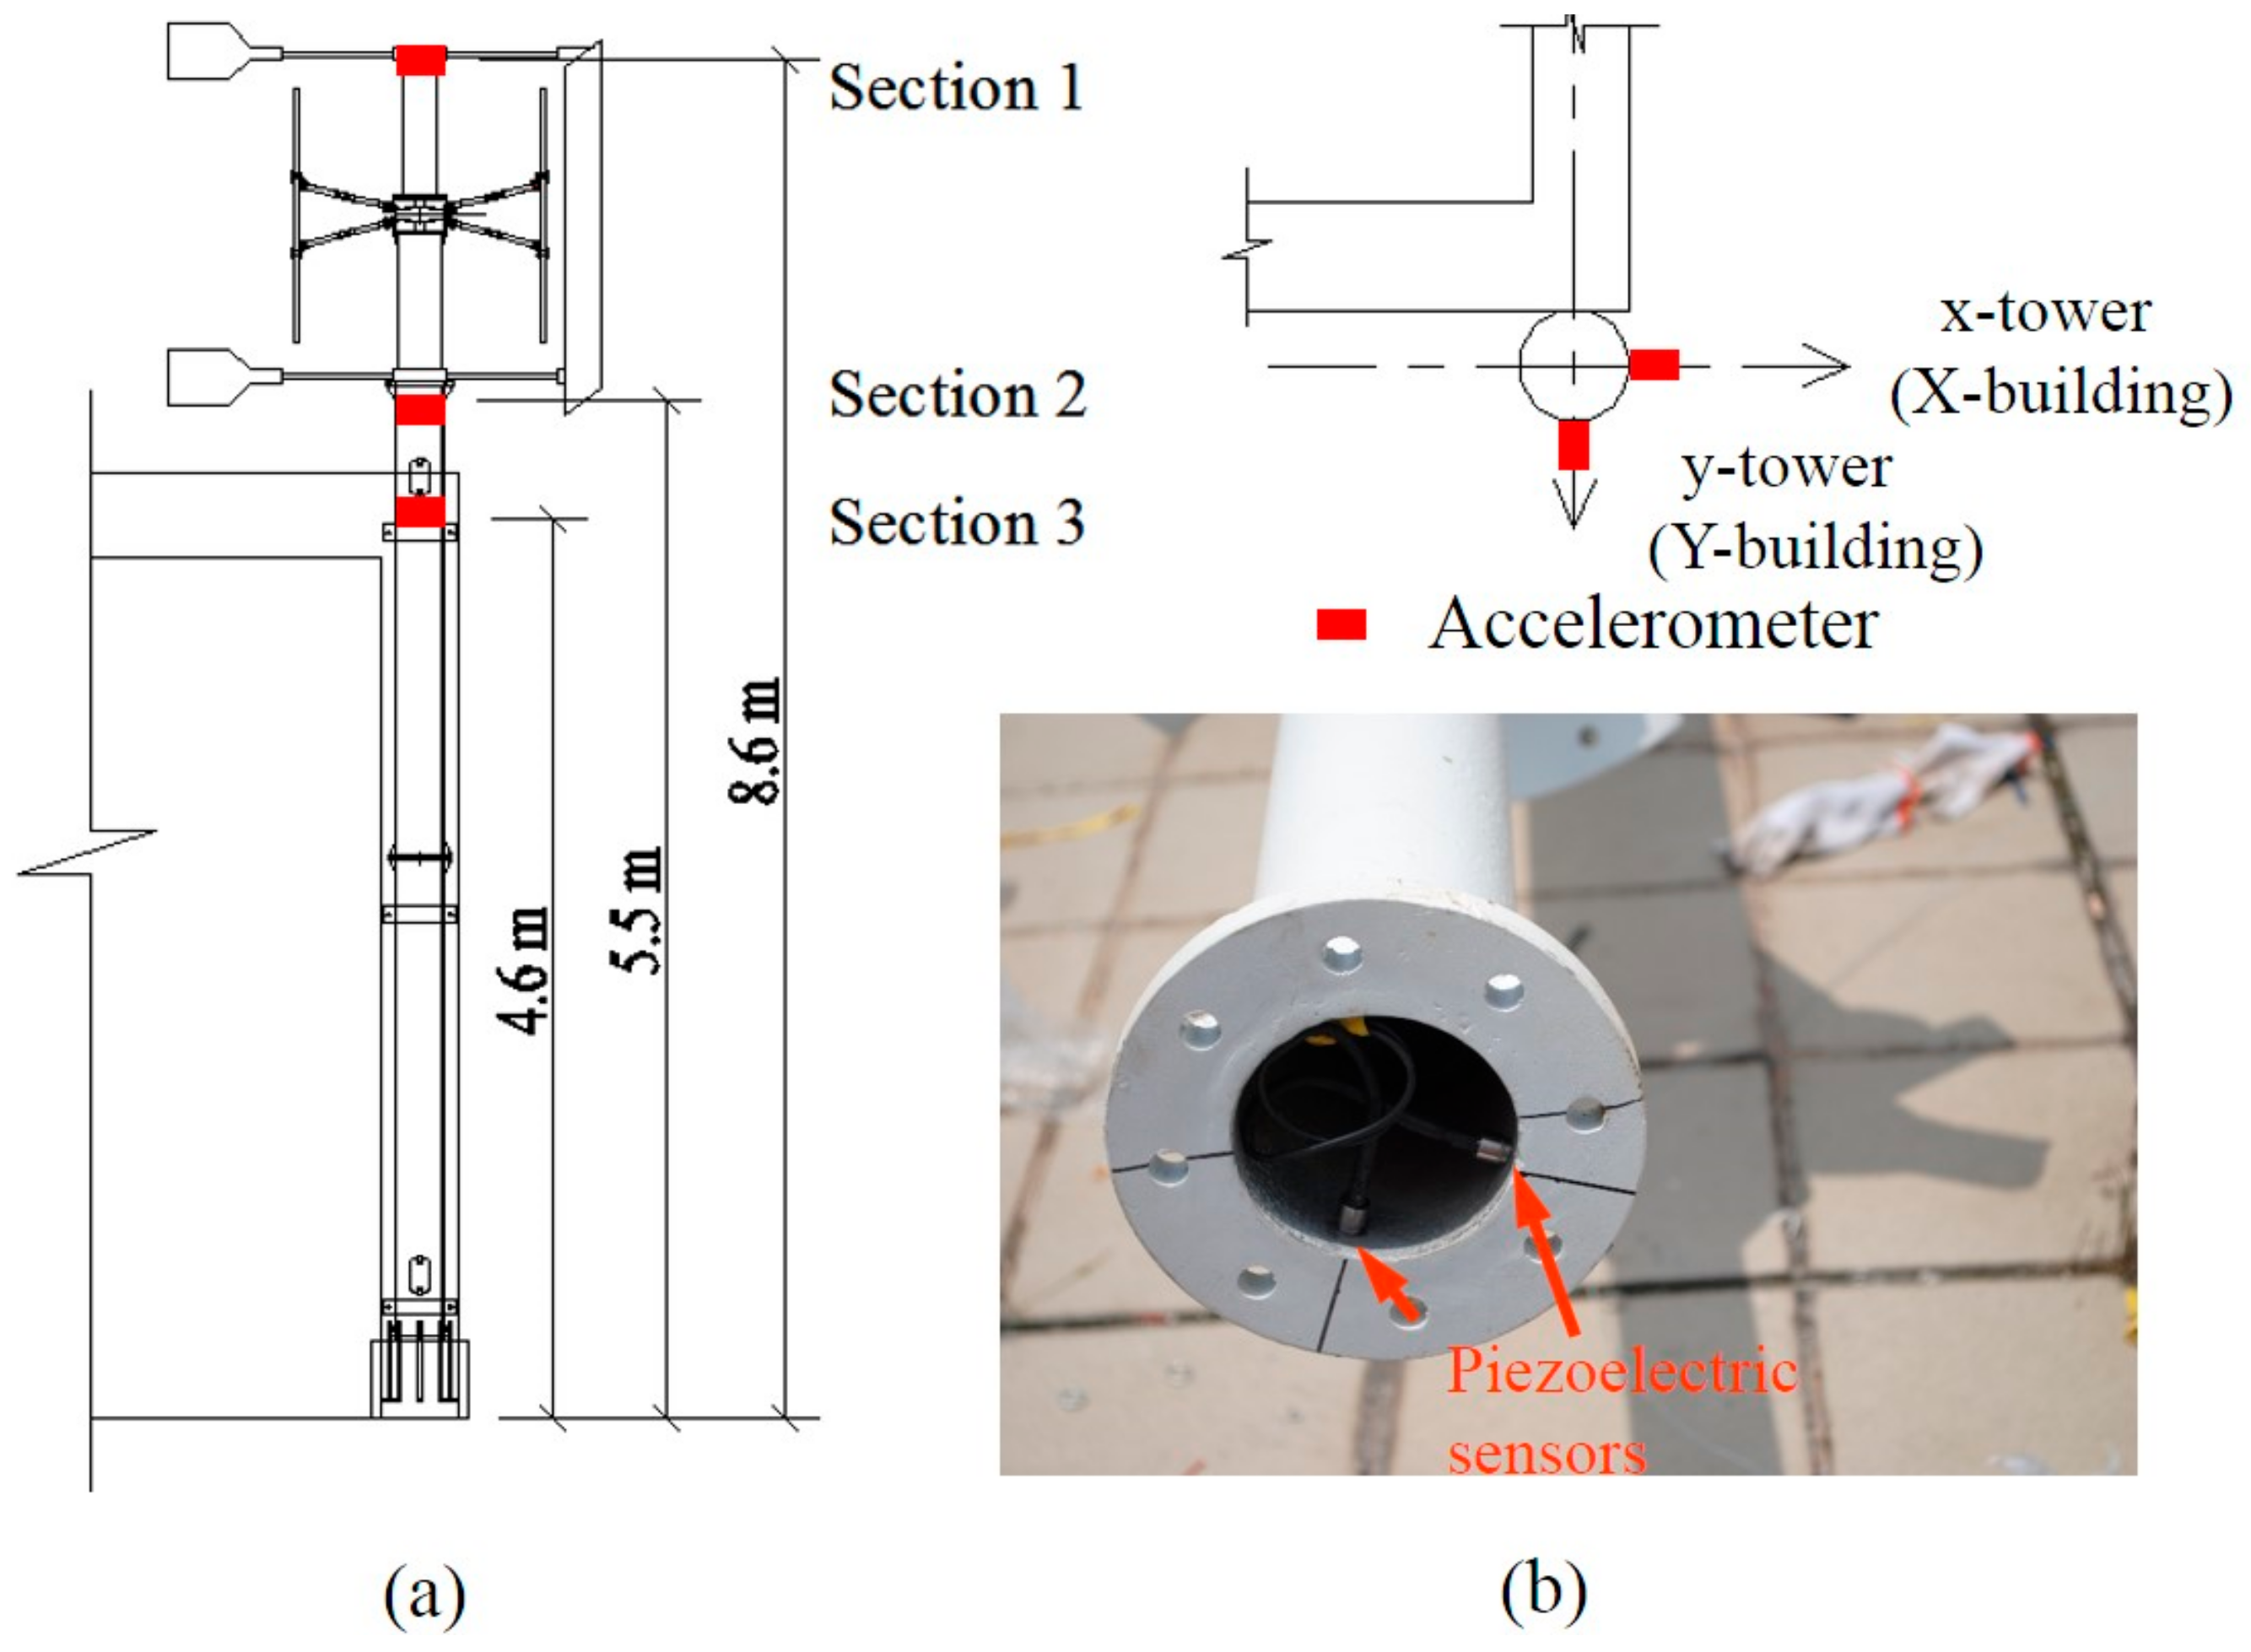
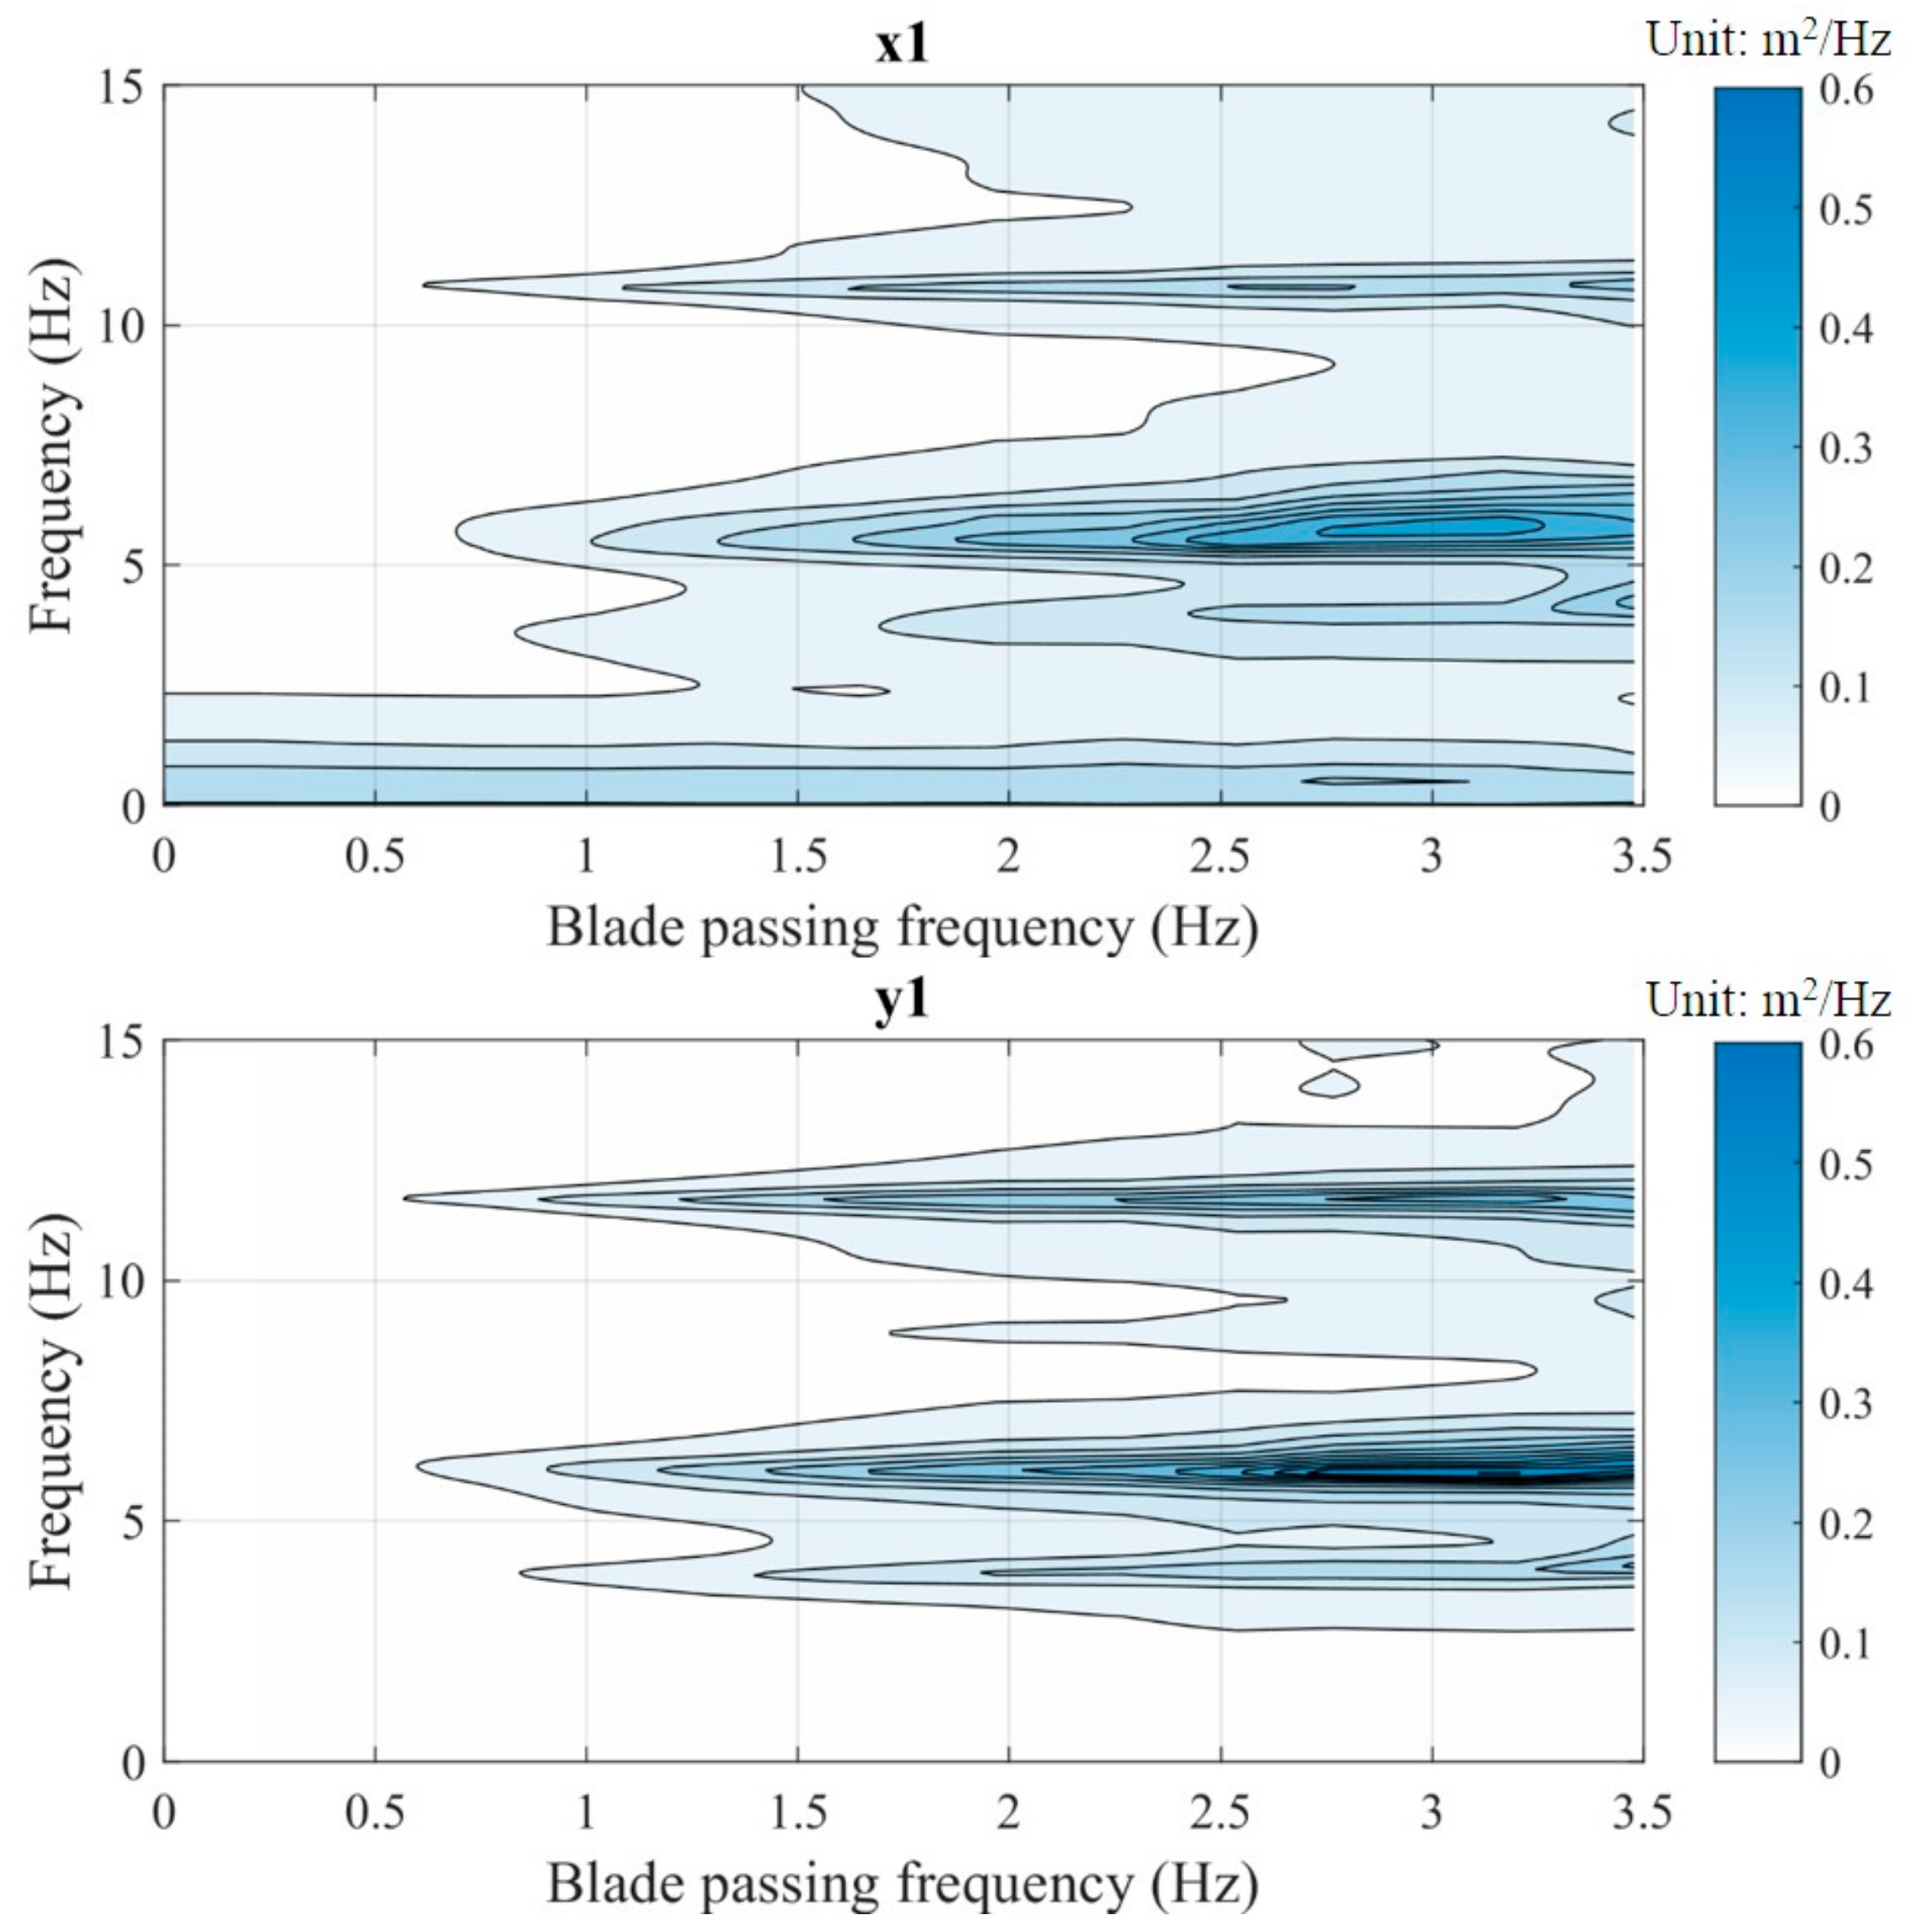
To measure the vibration modes of the wind turbine, along with the installation of the VAWT, three pairs of piezoelectric accelerometers were mounted along the tower at three sections with different heights; each pair had two sensors, deployed in two directions perpendicular to each other at each section: (a) the X-direction which runs perpendicular to the hoop bolts (shear direction), and (b) the Y-direction which parallels the tensioning of the hoop bolts.
Figure 6 shows the sensor locations, which were designated as cross Sections 1–3. Sensors in cross Section 1 (the generator) were installed inside the tower shaft; thus, the set-up was not influenced by the rotating blades. The other section sensors were installed on the outside surface of the tower. Different from electromagnetic sensors, a piezoelectric sensor adopts a piezoelectric crystal as the sensing unit, and it can be made into a smaller size compared to that of the electromagnetic ones. Details of the piezoelectric accelerometers deployed for tower testing can be found in
Table 1.
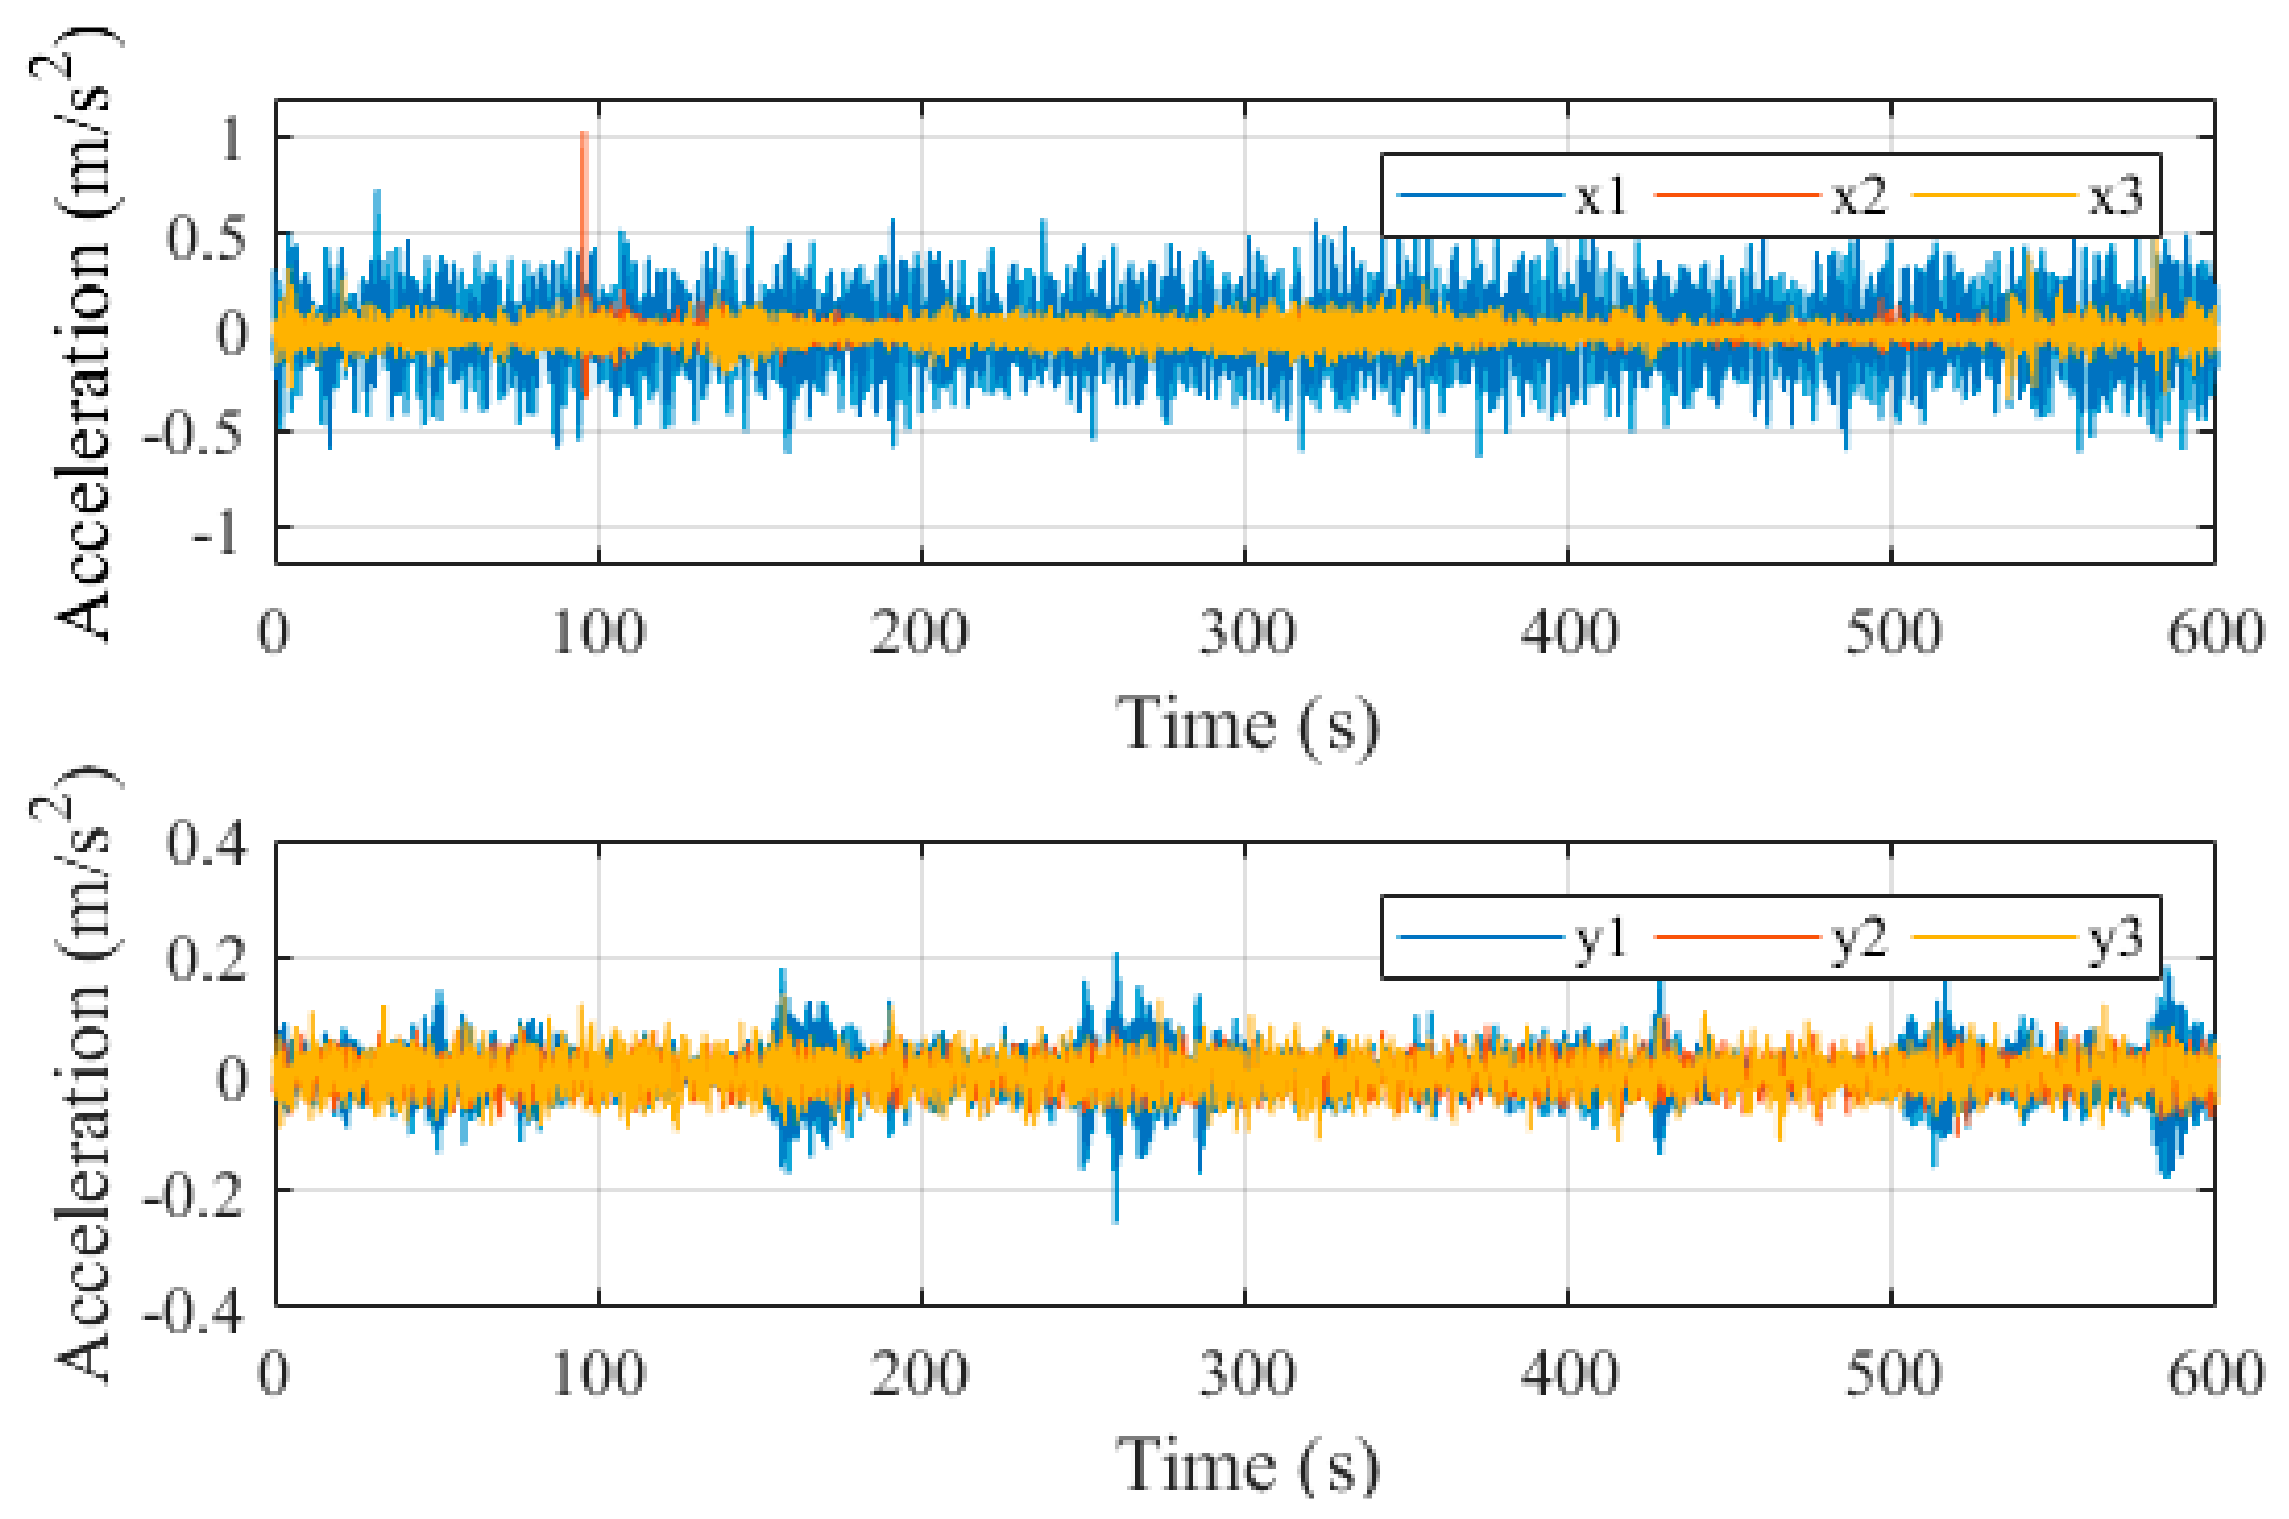
To monitor the environmental conditions, a tachometer, a thermometer, and a voltmeter were also installed. The tachometer was used to measure the rotation speed of the wind turbine. The thermometer kept track of the daily environmental temperature changes near the structure. The power generation of the wind turbine in Watts could be translated from the measurements obtained by the voltmeter. The sampling frequencies of all the measured data were set at 1024 Hz. Typical acceleration time histories for a time window of 10 min are shown in
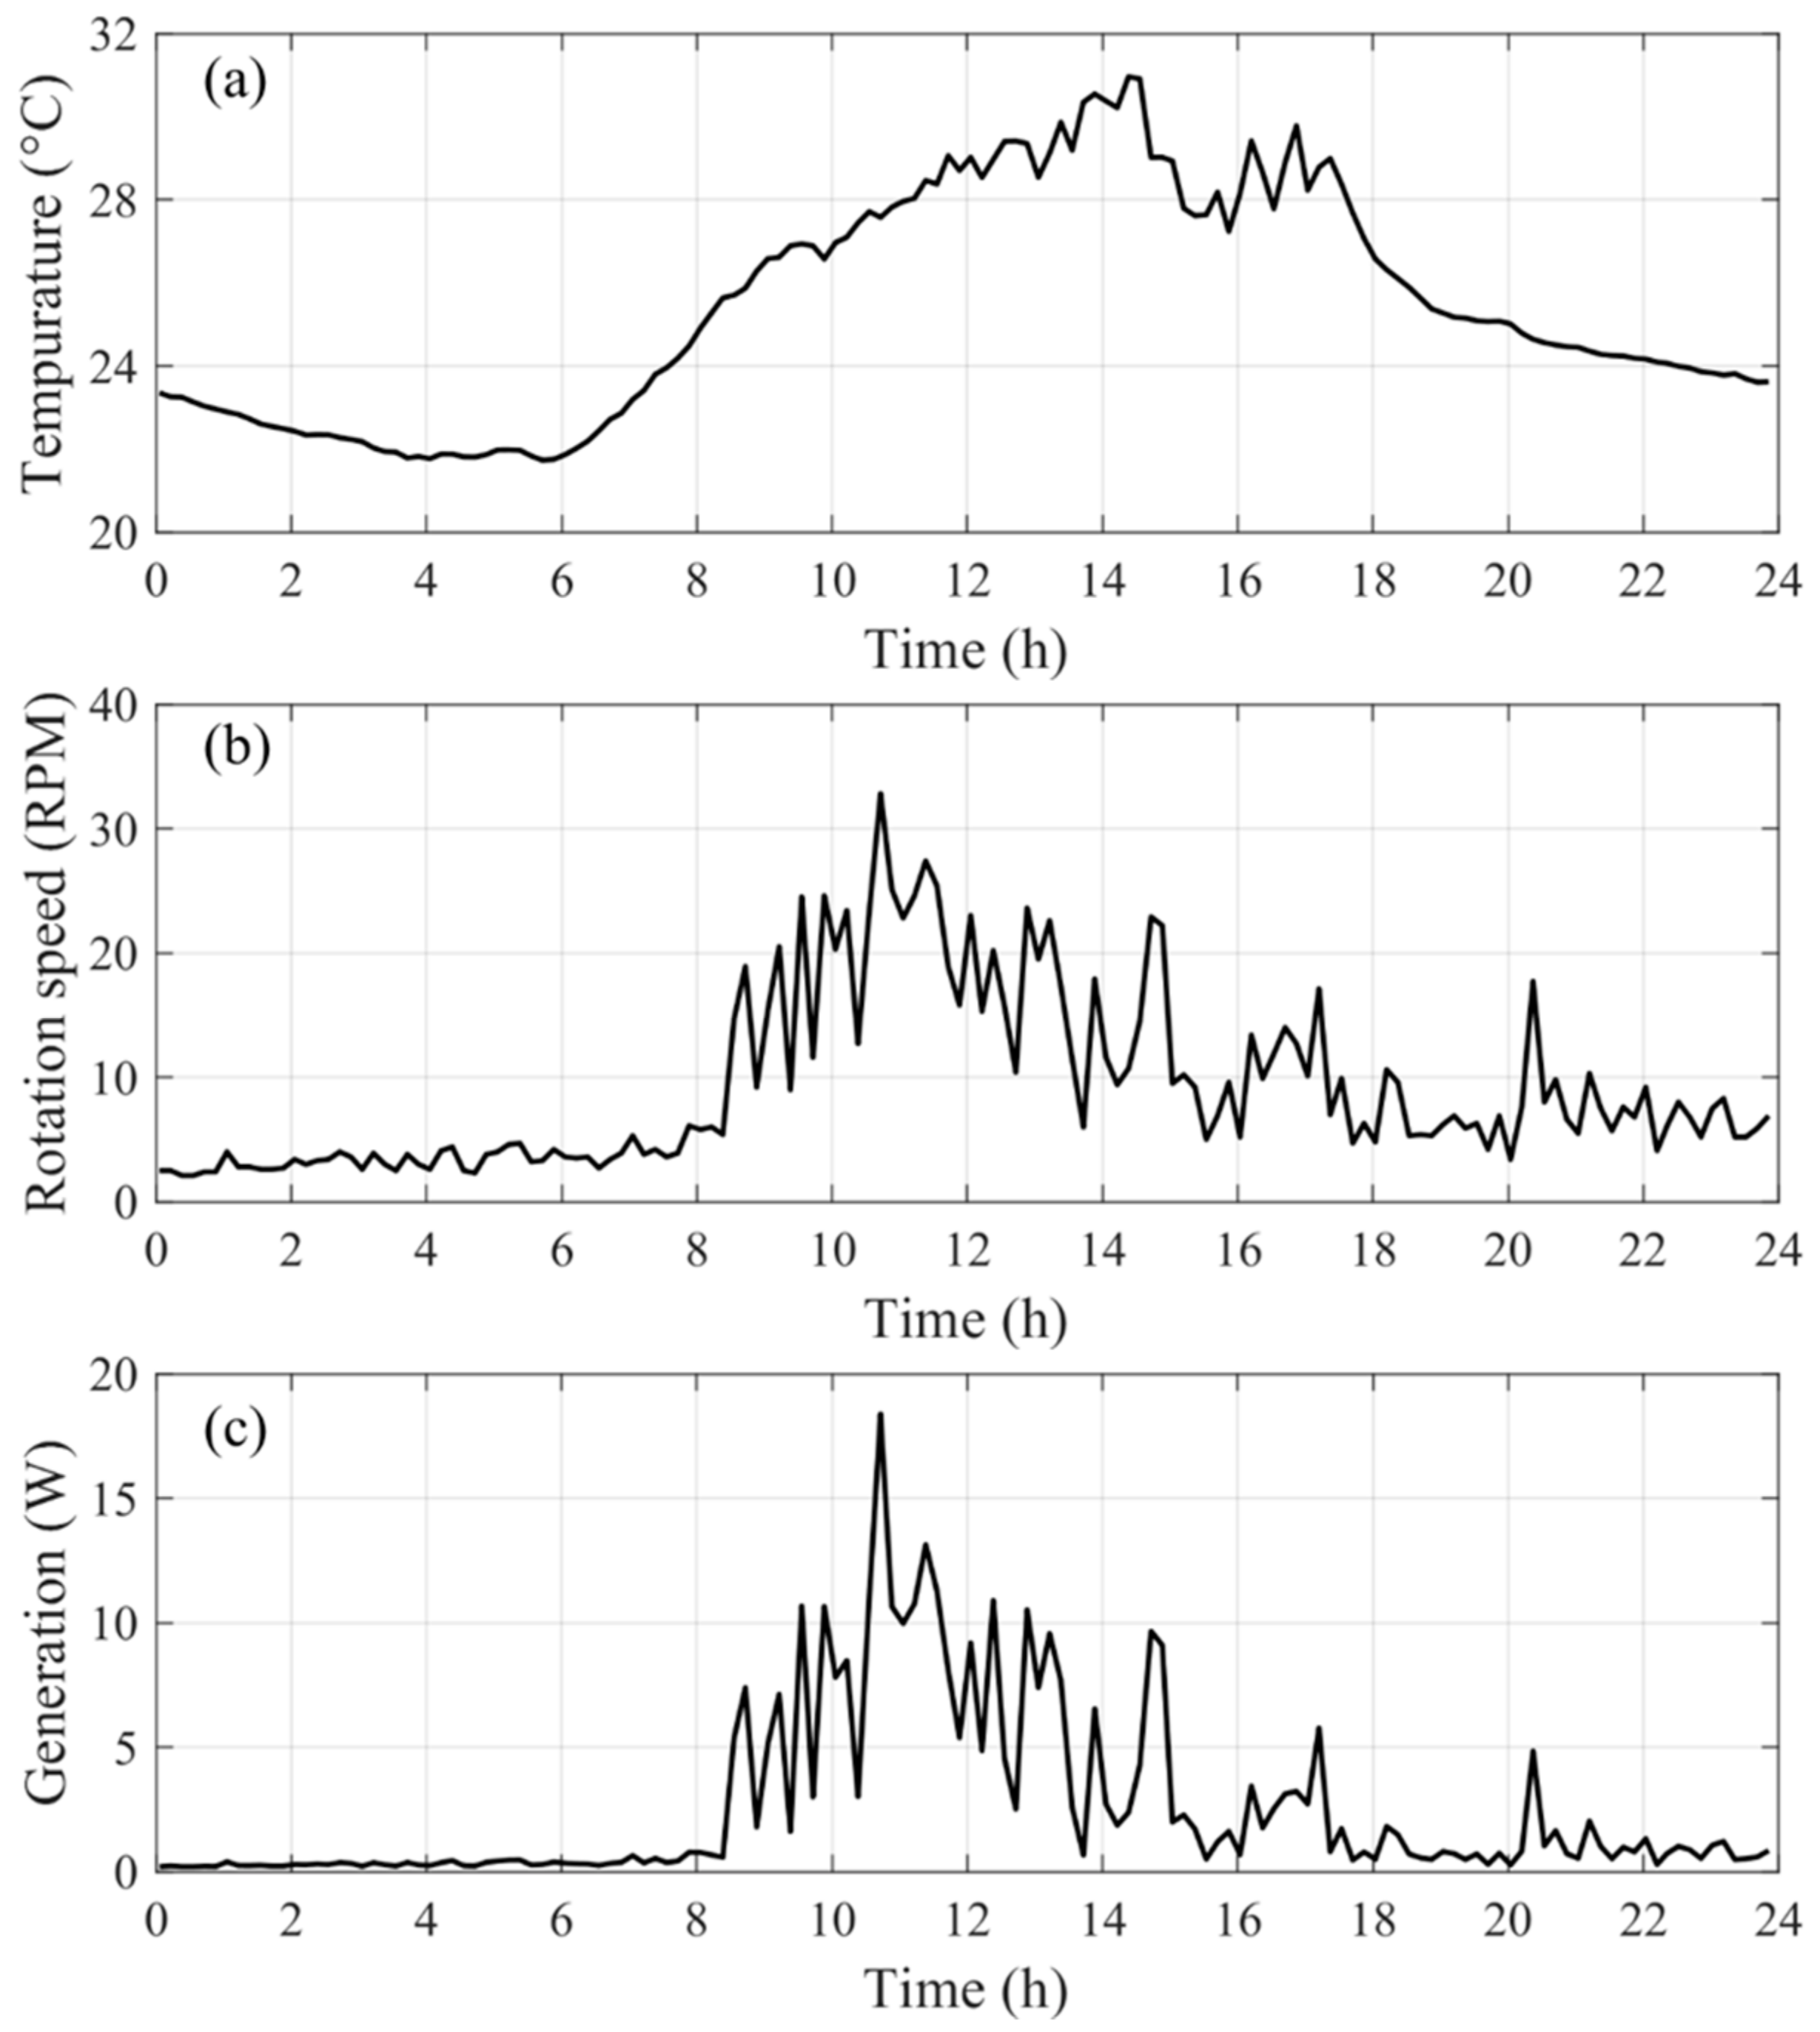
Figure 7. Accelerations labeled x1, x2, and x3, and y1, y2, and y3 correspond to cross Sections 1–3 along the X-direction and the Y-direction of the tower, respectively. Typical time histories in a day (24 h) of rotation speed, temperature, and voltage (power generation) recorded on 28 August 2016 are presented in
Figure 8.
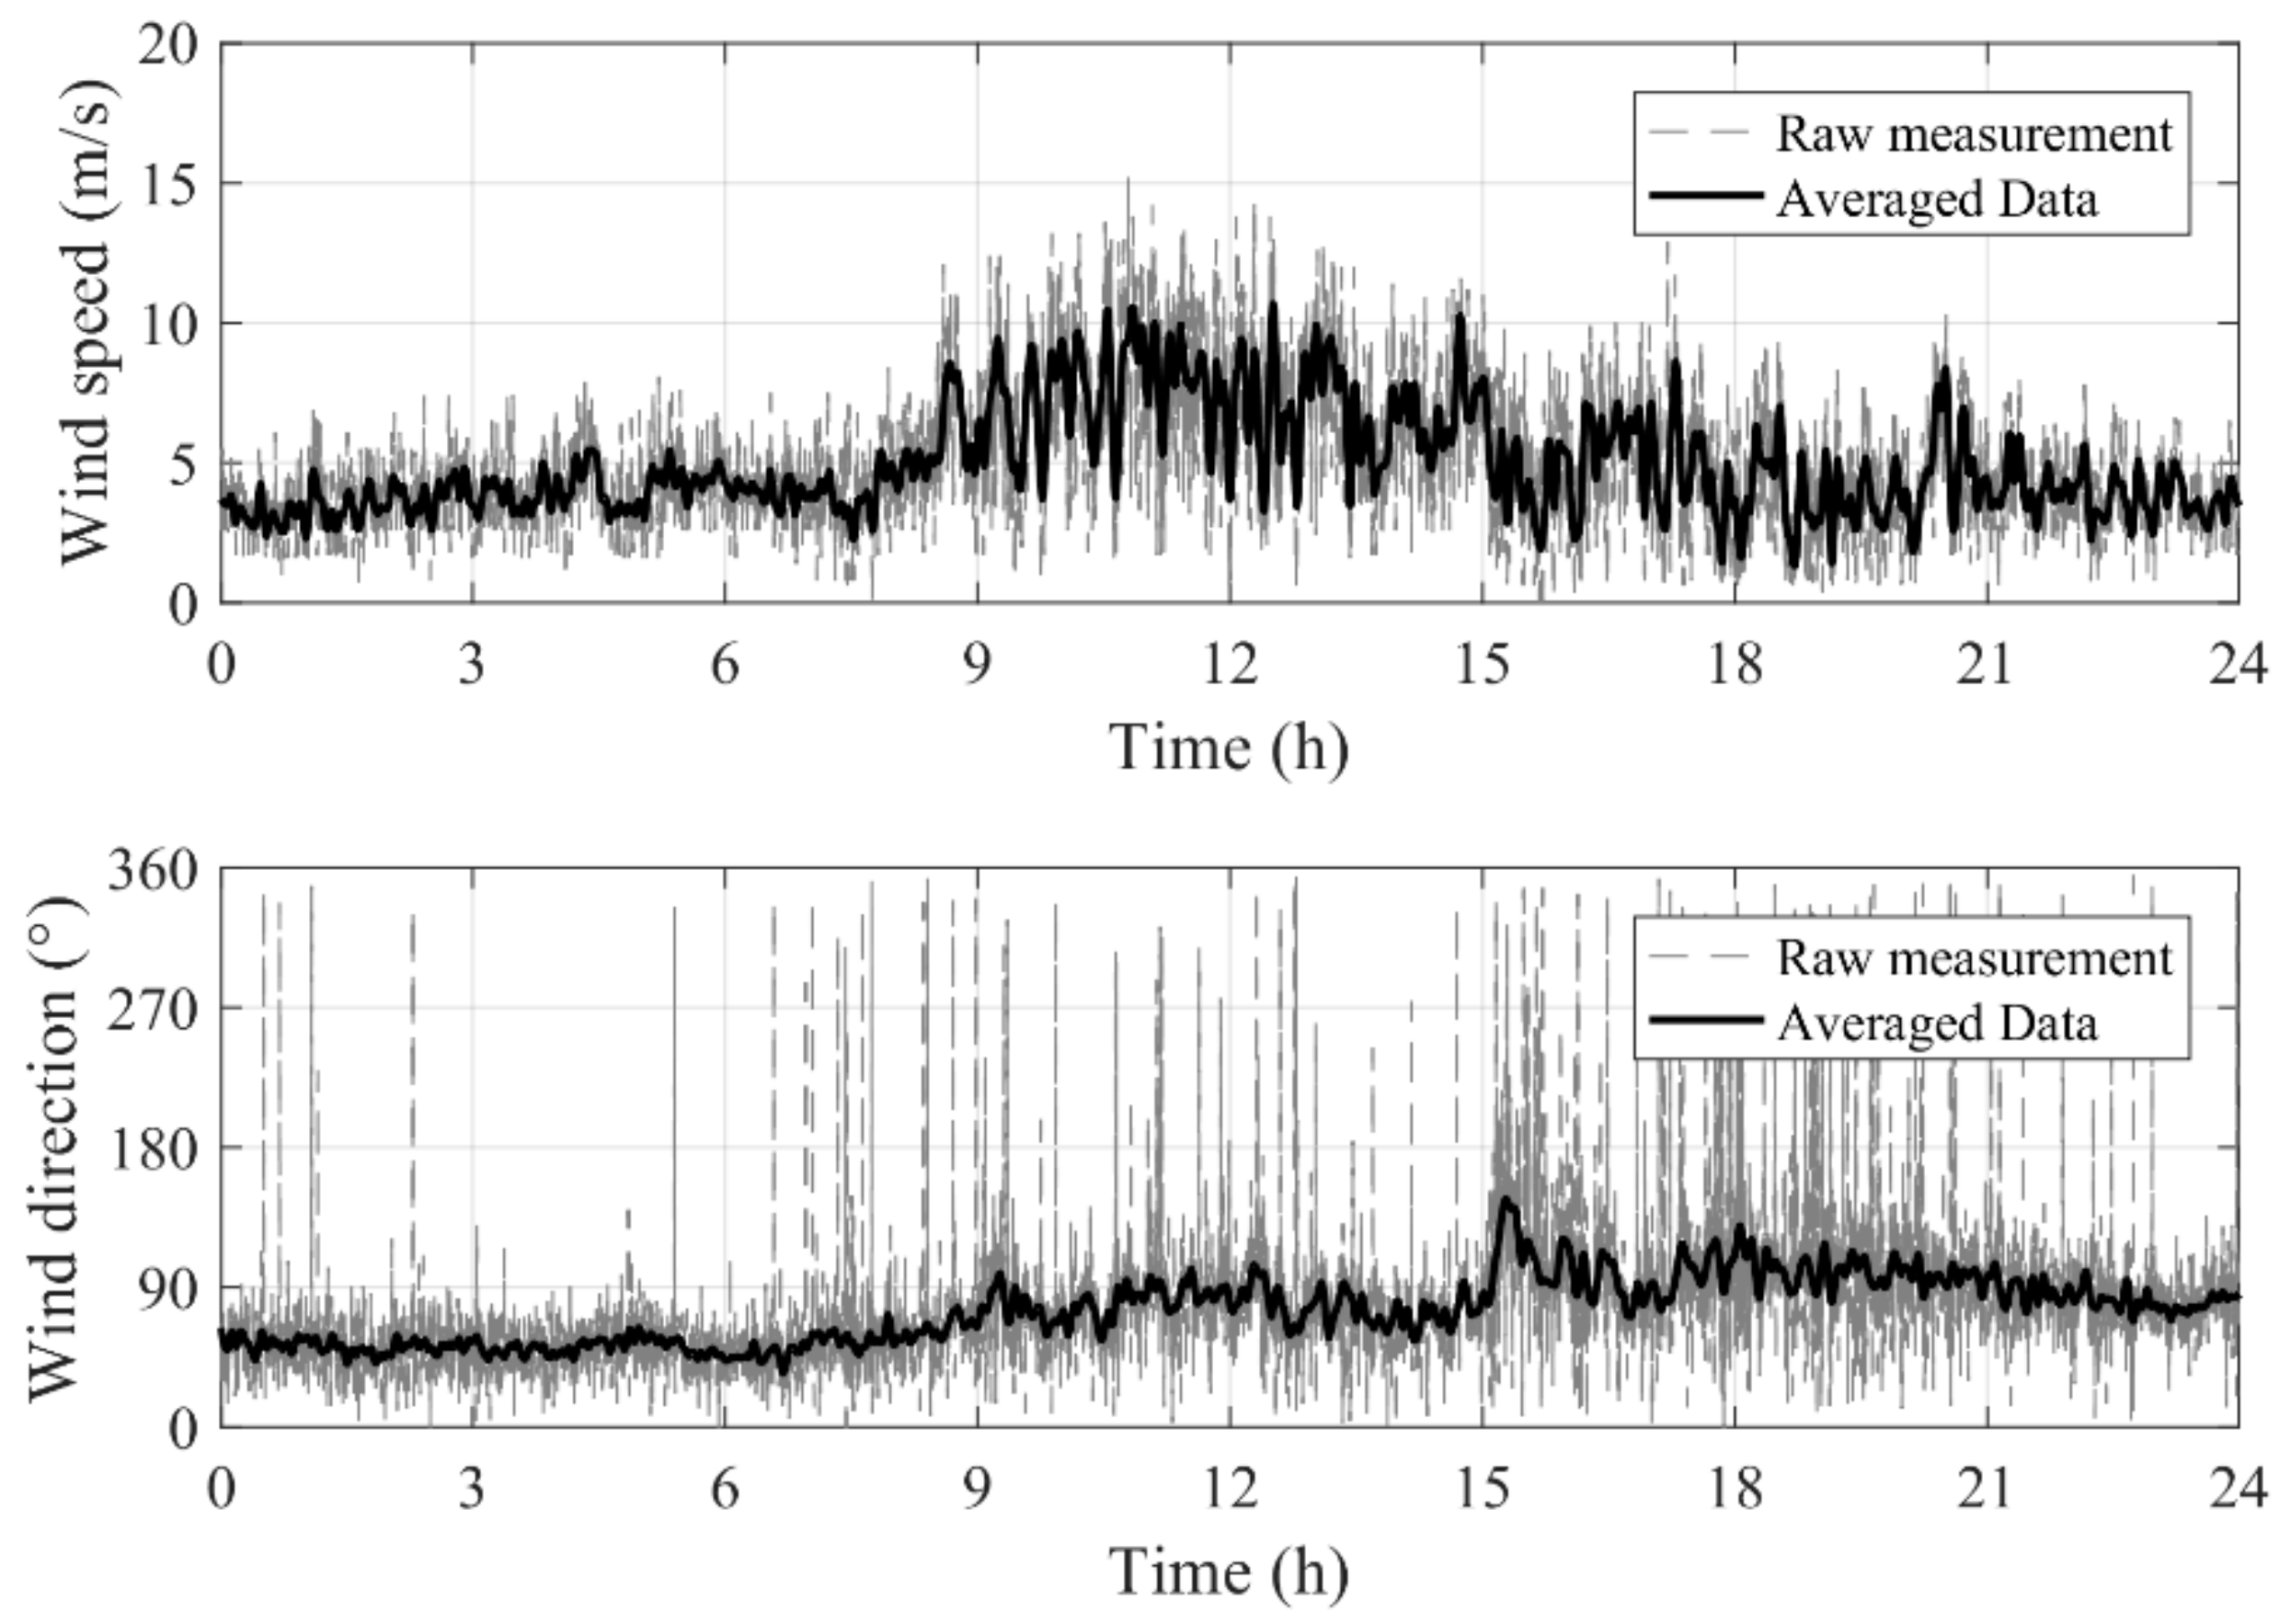
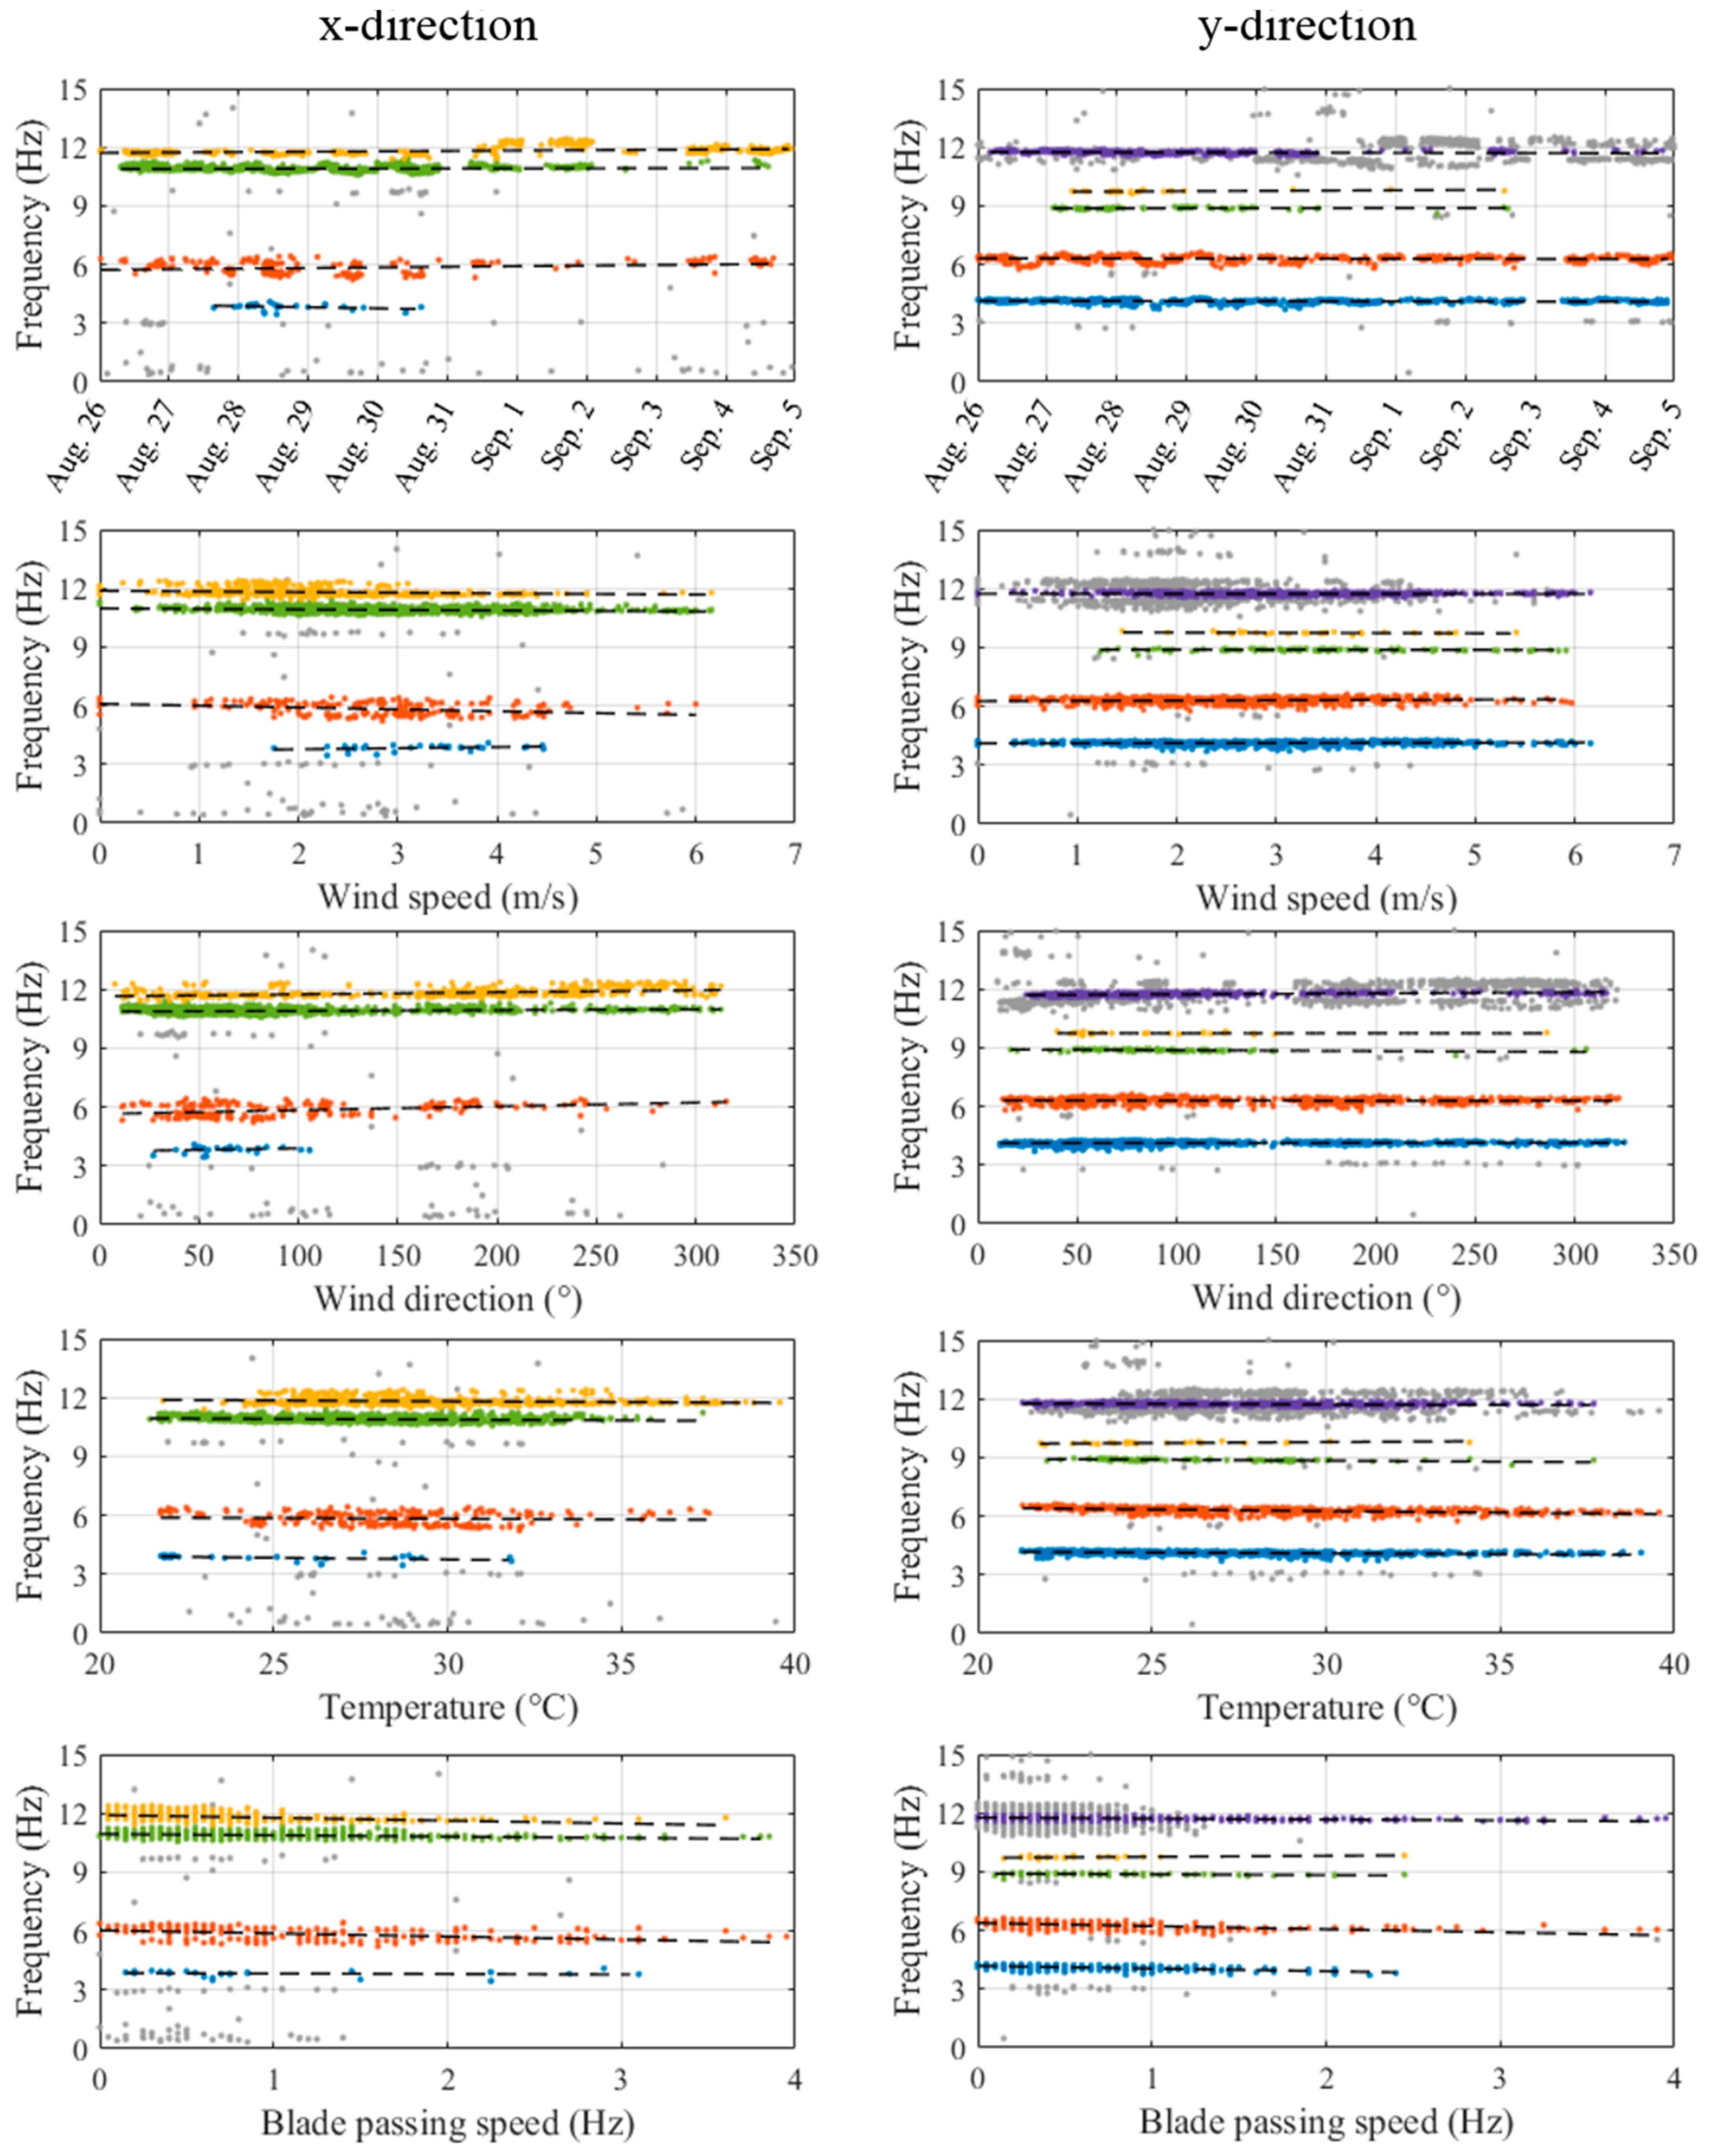
A cup anemometer with a wind-direction indicator was installed near the VAWT, which measured the speed and direction of the incoming wind. The anemometer was the F220S model manufactured by the Nanhua Electronics Company, Shanghai, China. Measurements of wind speed and wind direction were recorded about every 10 s. The definition of wind direction was as follows: 0° corresponded to the north direction, and 90° corresponded to the east direction. Since the wind field in urban areas can be quite complex, both the wind speed and direction measurements fluctuated constantly. Only the moving averages with a step length of 10 min were used in current study.
Figure 9 shows a typical recorded wind scenario throughout a day (28 August 2016) and its moving average. It can be seen from
Figure 8 and
Figure 9 that both the maximum wind speed and the maximum temperature occurred at noon, and the temperature and the wind speed were strongly correlated. The rotation speed, which should be linear to the quadratic of the wind speed, only had a medium correlation (the correlation coefficient was 0.581) with the raw wind speed, and was strongly correlated (the correlation coefficient was 0.888) with the average wind speed. This happened since the rotation of the VAWT calls for a continuous wind force rather than a gust. The correlation coefficients between the rotation speed, wind speed, and temperature calculated with both raw wind-speed data and averaged wind-speed data are shown in
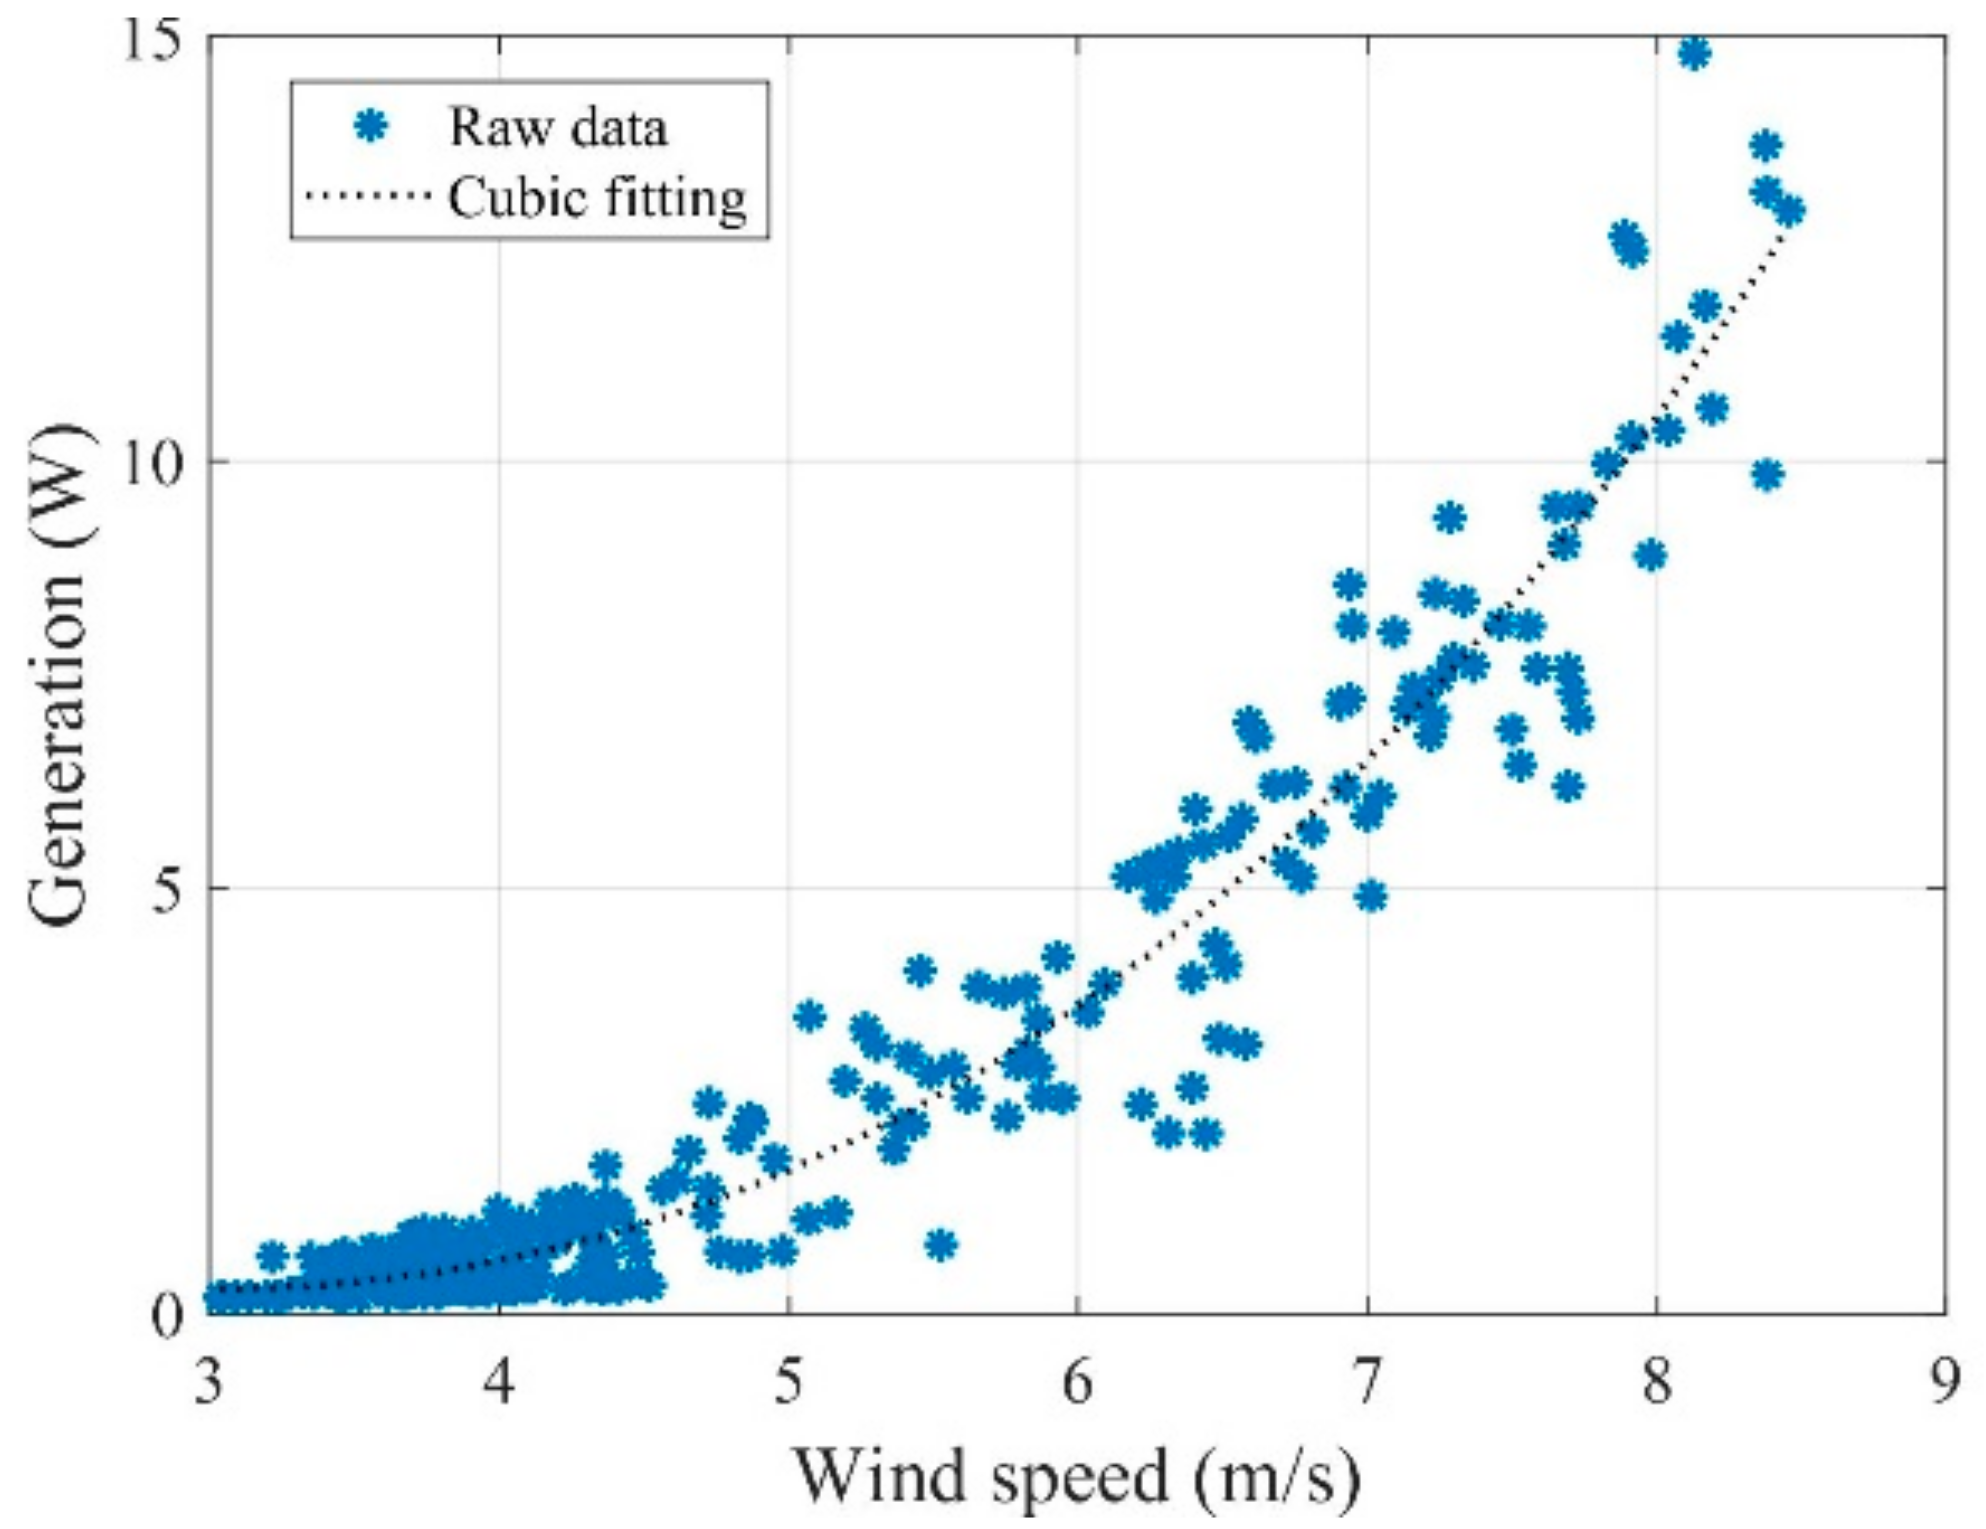
Table 5. The relationship between the power and the wind speed is also provided in
Figure 10.
5. Conclusions
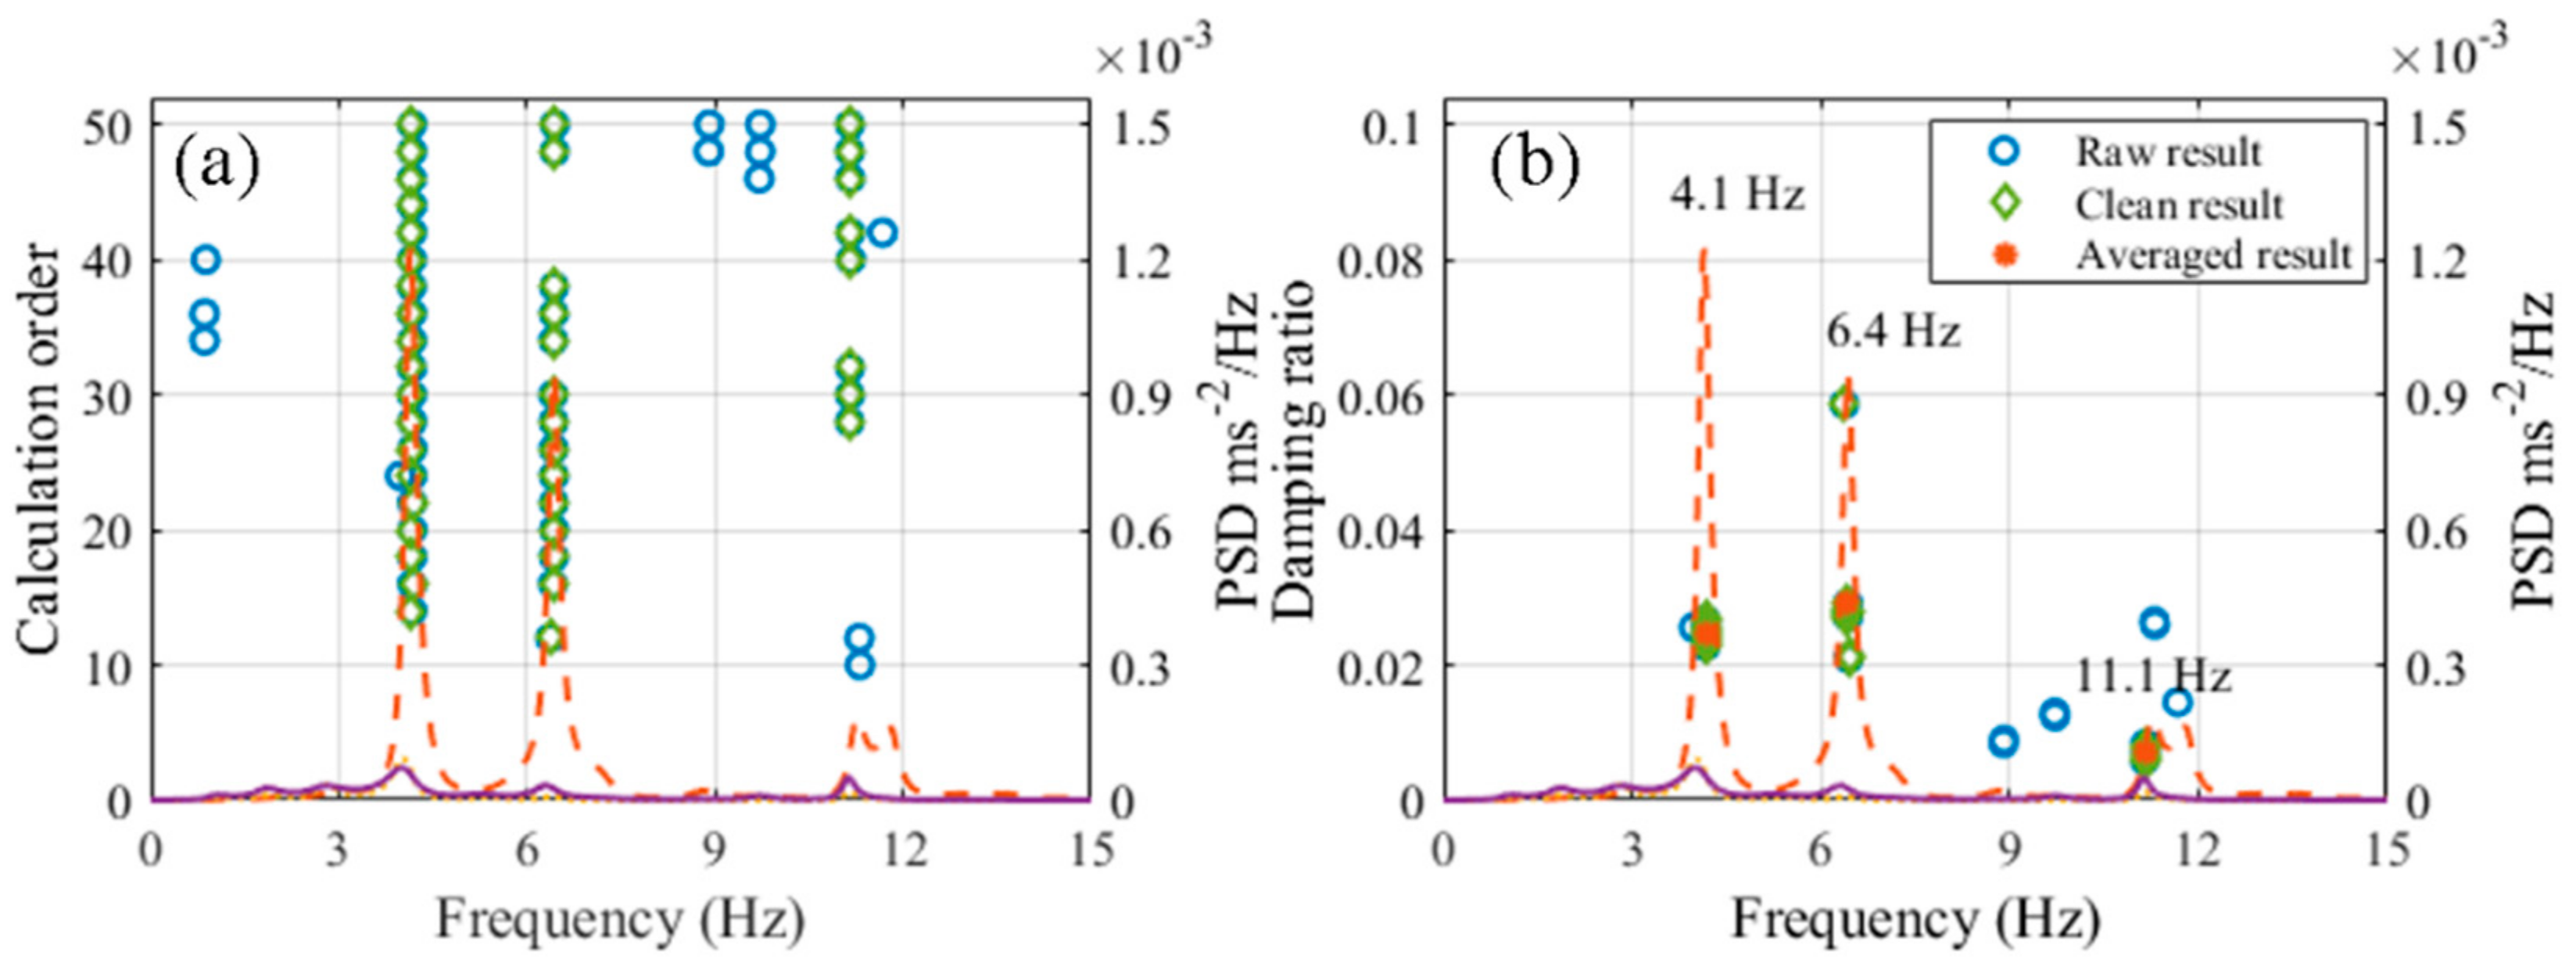
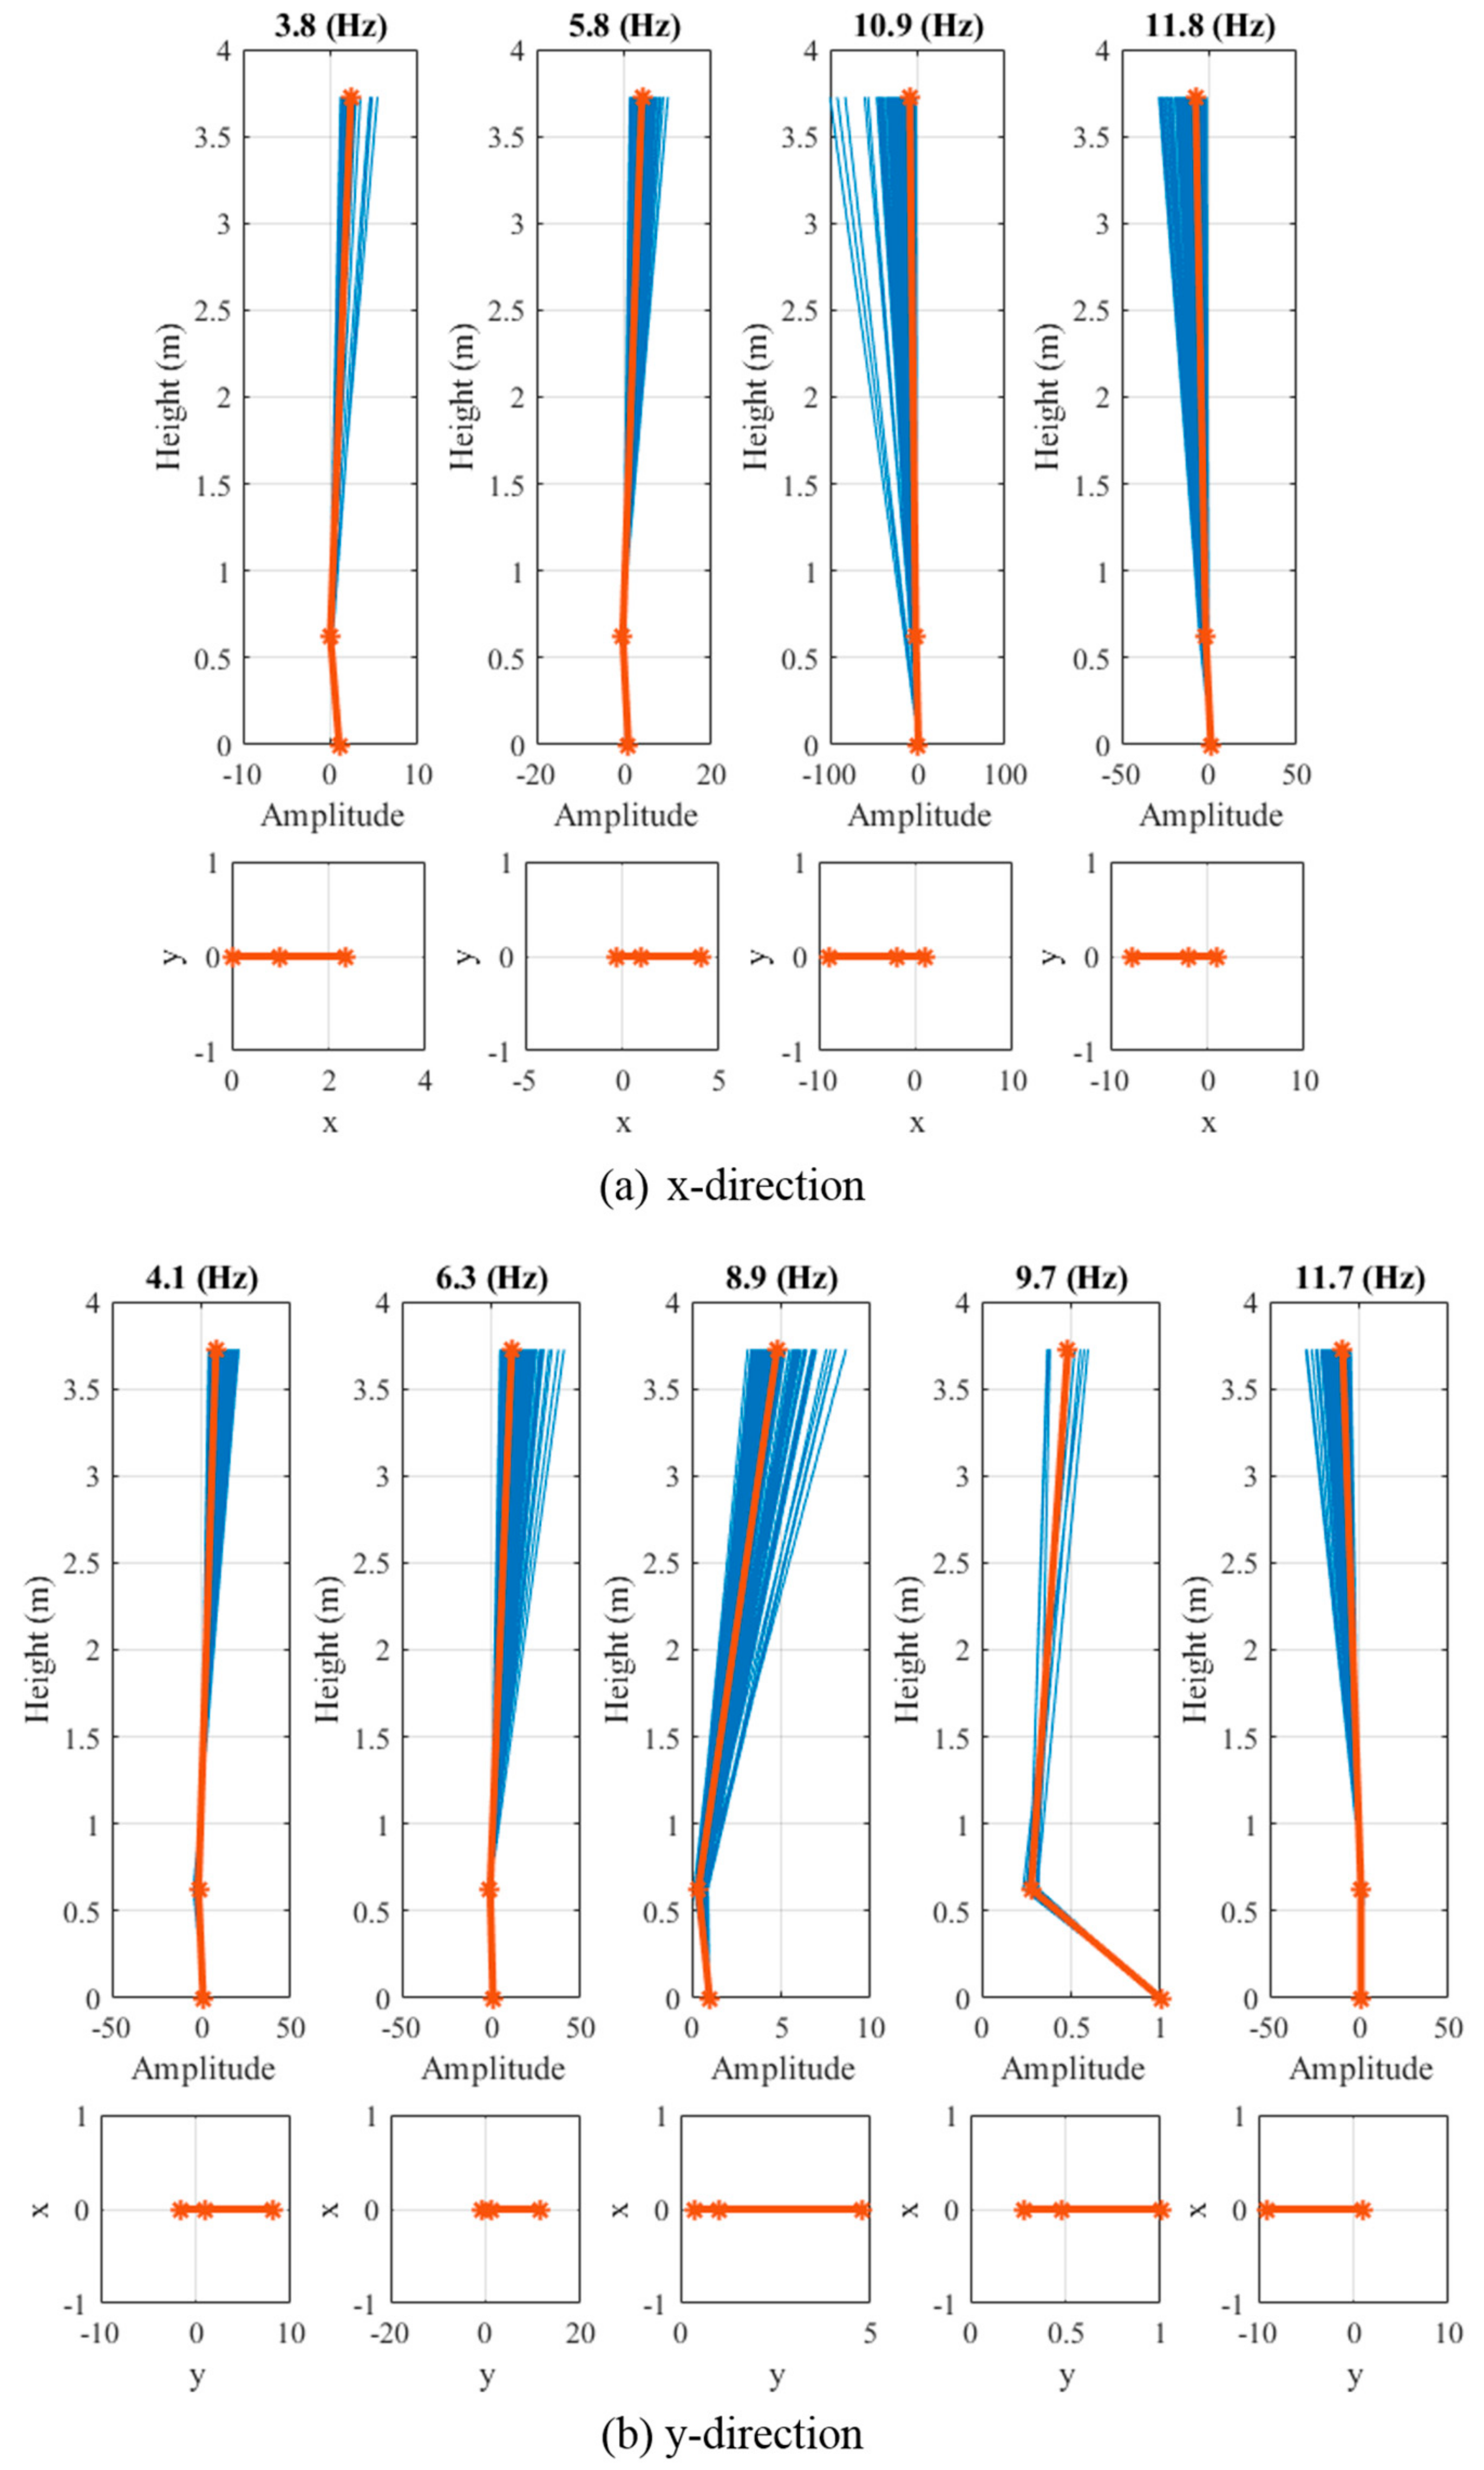
This paper presents a field vibration study of an H-type VAWT on a rooftop. To understand the vibration performances of the VAWT installed on the rooftop of the #6 building at Tongji University, a health monitoring system was implemented, and the dynamic behaviors of the VAWT were studied using vibration measurements under ambient conditions. To process the vibration data, an automated algorithm based on stochastic subspace identification (SSI) and a fast clustering approach was developed and presented to show how modes could be determined. The modified method helps accommodate the frequency and mode shape requirements for mode identification, and the results successfully identified several modes of the VAWT tower vibration along the tension direction and shear direction of the hoop connection.
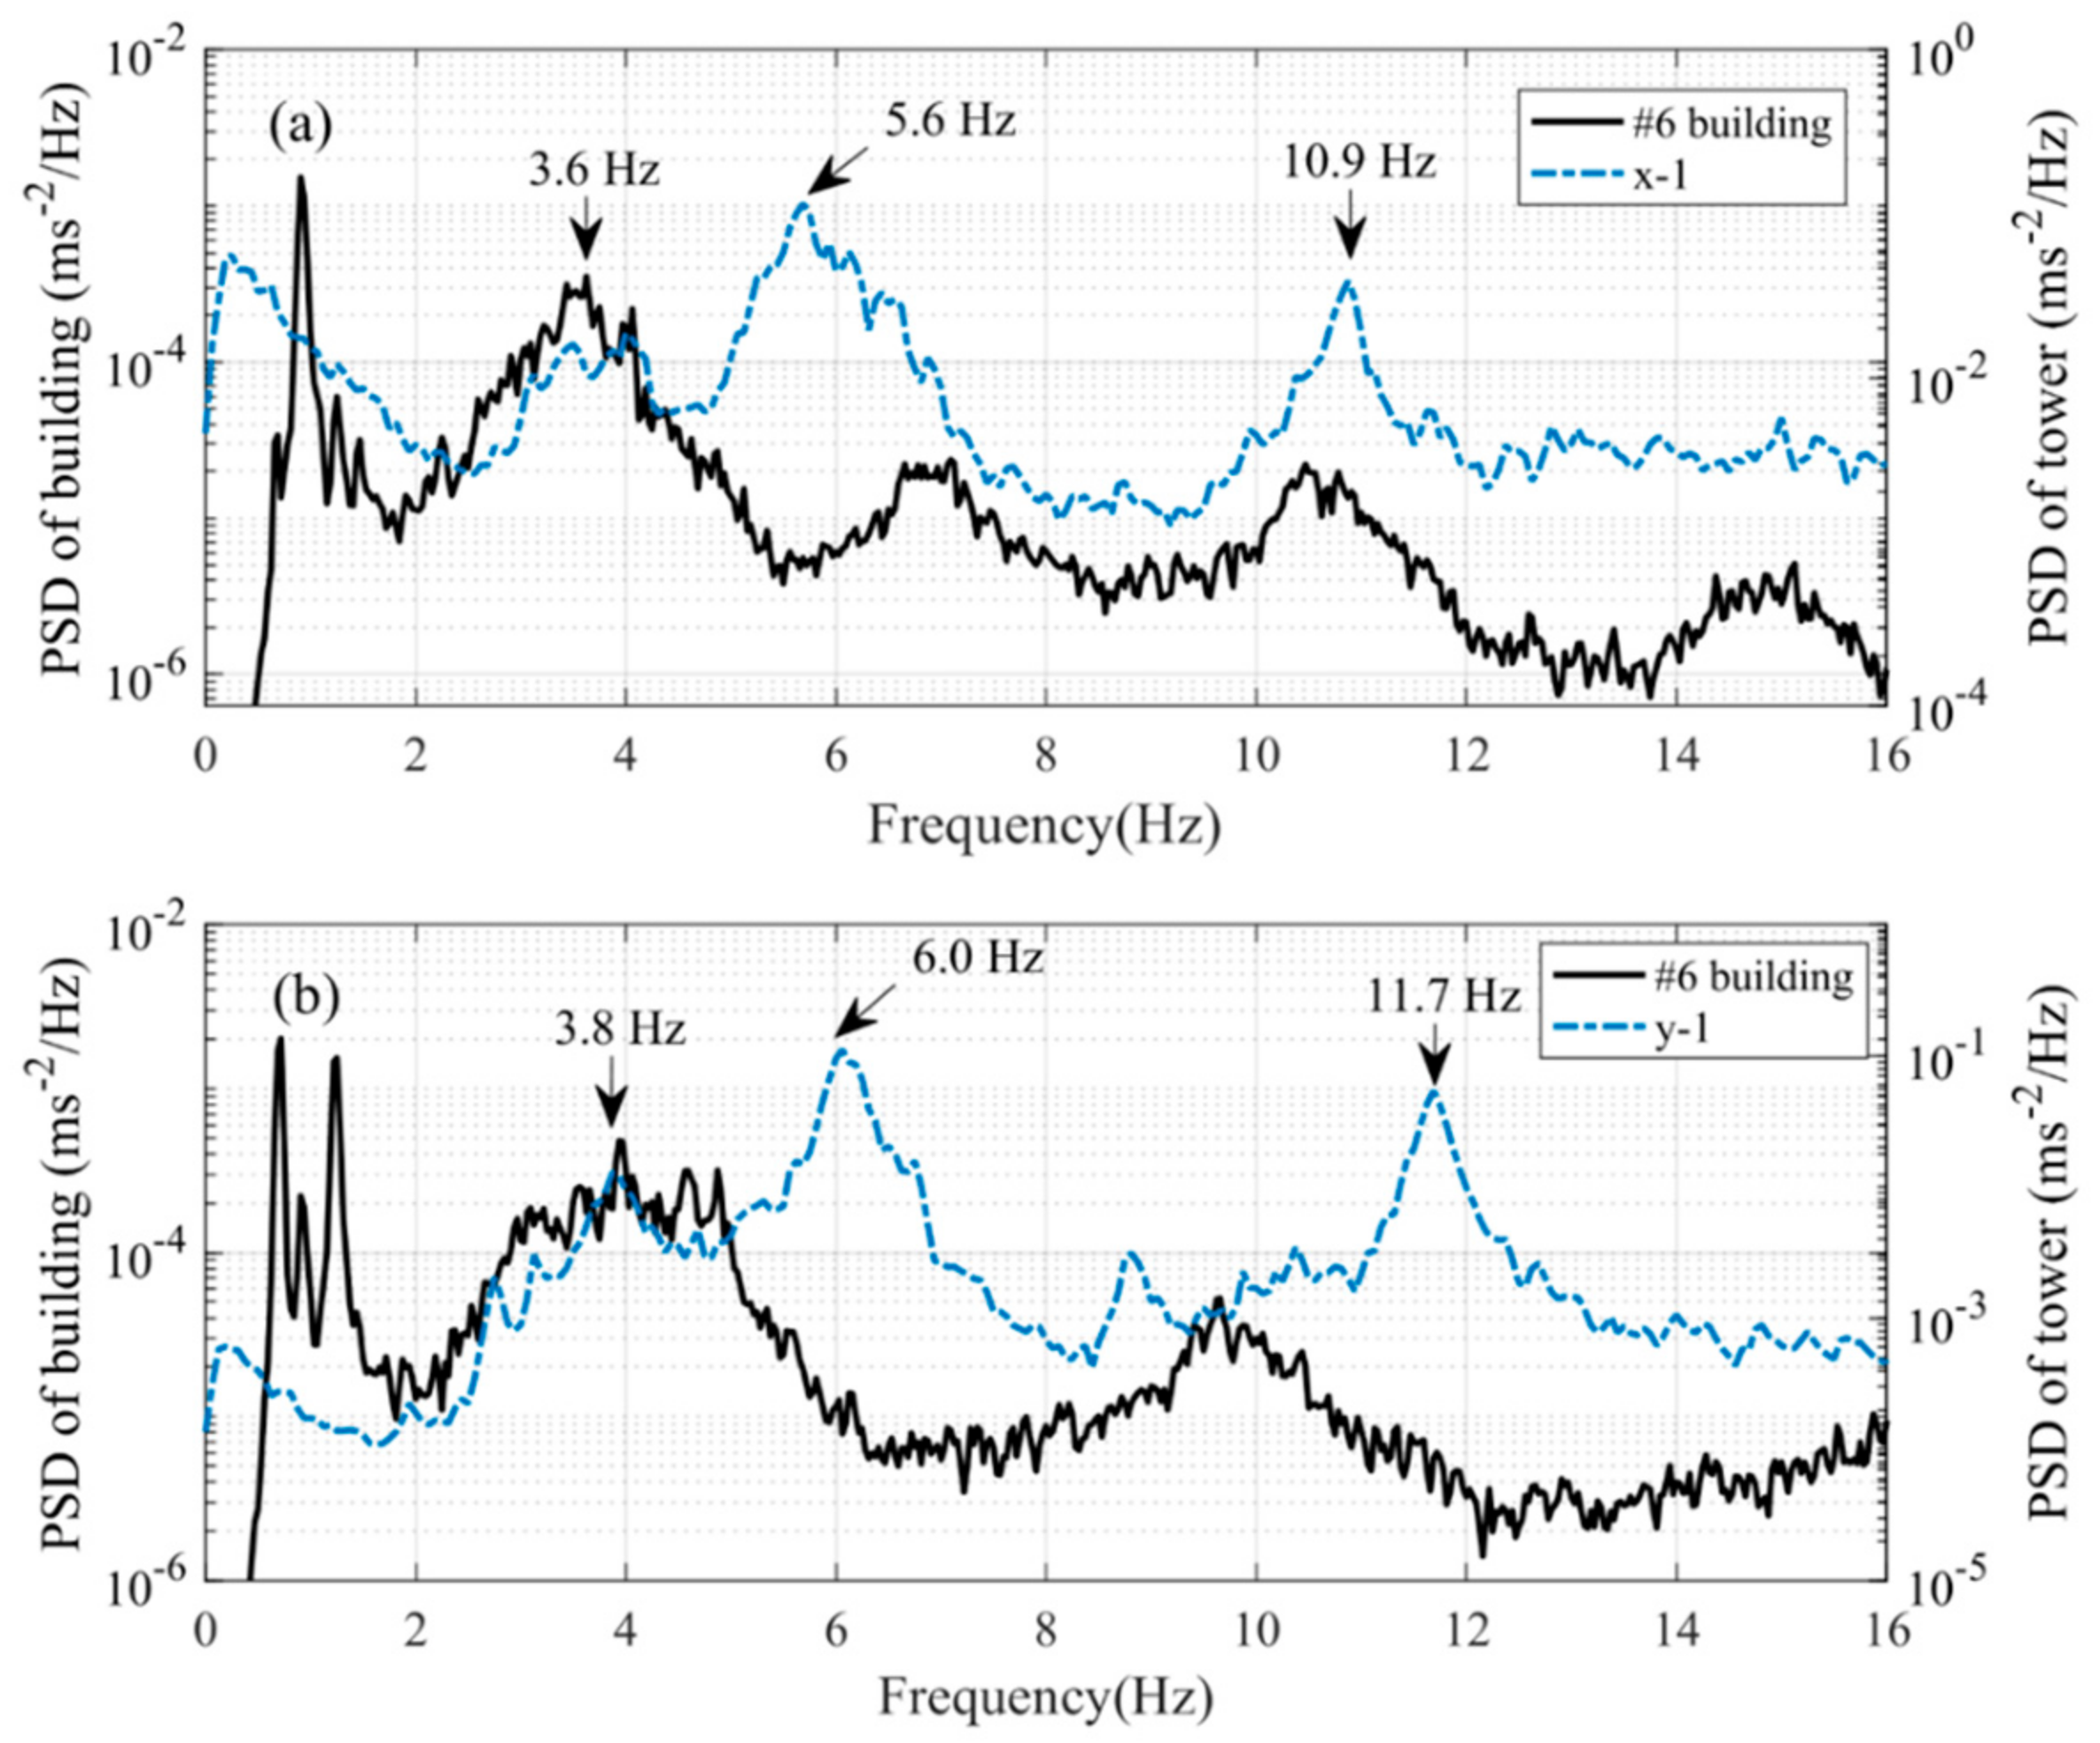
The results showed that some of the vibration responses of the VAWT tower (e.g., 3.6 Hz along the X-direction and 3.8 Hz along the Y-direction) may be affected by the vibrations of the #6 building. Hence, the modal behaviors can be differentiated into building-associated and non-building-associated modes. Among the vibration frequencies identified from both the building and tower measurements, the first mode vibration of the building (0.94 Hz along the X-direction, 0.71 Hz along the Y-direction, and 1.3 Hz in torsion) has little influence on tower vibration. The second bending modes of the building along both directions (3.6 Hz along the X-direction and 4.1 along the Y-direction), however, can affect tower vibration, since the frequencies of the second mode of the building are relatively close to those fundamental frequencies of the tower. This observation is important for the structural health monitoring and life-cycle condition maintenance strategy of the VAWT. The understanding of the effect of building-associated and non-building-associated modes on the VAWT tower responses may also help improve the design of the VAWT tower.
The environmental effects on the ambient vibration data were also investigated, and it was found that the blade rotation speed had a significant effect on the VAWT vibration PSD amplitudes, as shown in
Figure 13, indicating that higher blade rotation speeds can result in higher vibration amplitudes of the wind turbine. On the other hand, temperature and wind direction, in general, had little effect on the PSD amplitudes.


