1. Introduction
In recent years, tight sandstone reservoirs have gradually become a hotspot of natural gas exploration and development in the world. Tight sandstone gas accounts for a growing proportion of natural gas production. Meanwhile, the complexity of the reservoir formation mechanism of tight sandstone reservoirs has brought many difficulties for exploration and development. Many scholars have been put forward their own views about the forming reasons of tight sandstone from sedimentation to diagenesis.
The Ordos Basin is rich in oil and natural gas [
1,
2], and the coal-bearing strata are enriched with abundant coal-measure gas resources [
3,
4]. Tight sandstone, thick mud shale and coal measures are successively used as reservoirs, source rocks and caprocks, which have unique and favorable conditions for reservoir [
5,
6]. In recent years, major breakthroughs were made in tight gas exploration in China. The new round of resource evaluation results shows that the total natural gas resources in the Ordos Basin is 15.16 × 10
12 m
3, of which the tight gas resources are 10.37 × 10
12 m
3, accounting for 68% of the total natural gas resources [
7,
8,
9]. Meanwhile, it has been found that six kinds of proven gas fields with more than 100 billion cubic meters of proven reserves, such as Sulige, Wushenqi, Daniu, Shenmu, Jingbian and Zizhou. The Upper Paleozoic of Basin developed four formations: Taiyuan, Shanxi, Shihezi and Shiqianfeng from top to bottom with a total sediment thickness of 700 m [
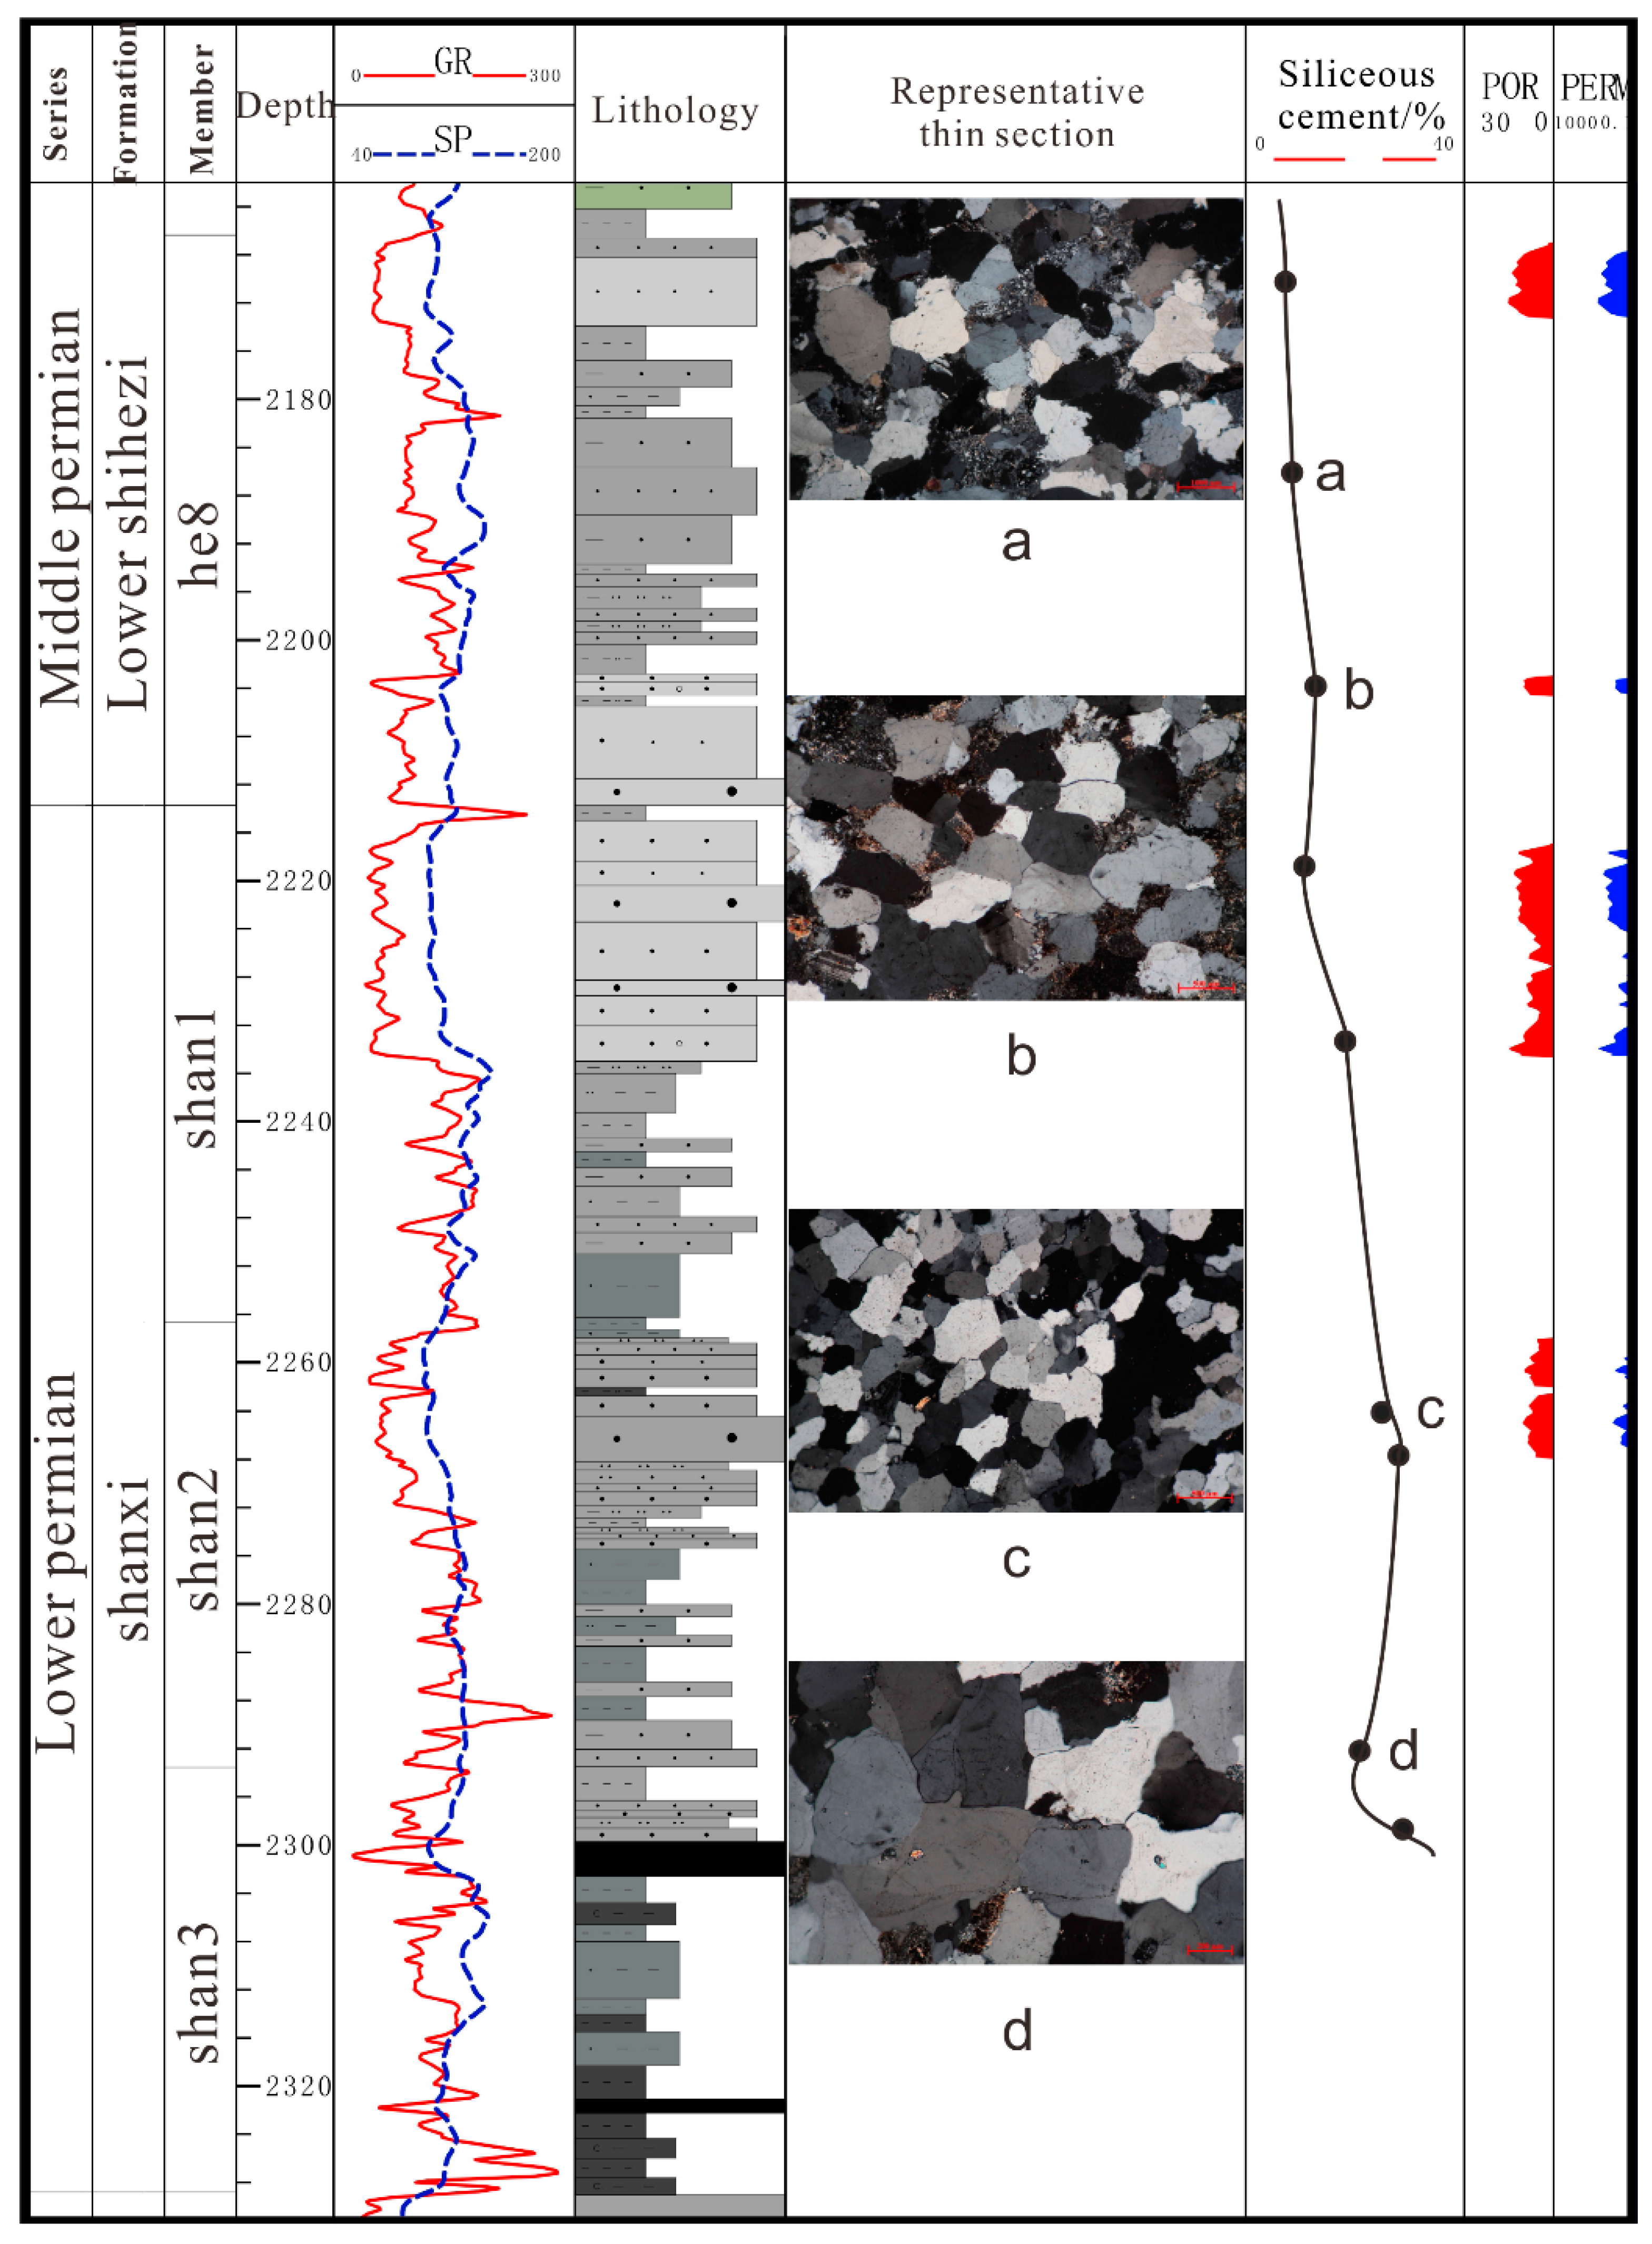
10]. The Shihezi formation, of which the He8 section is in the Middle Permian, and the Shanxi Formation, of which the Shan1 and Shan2 sections are in the Lower Permian, sandstone reservoirs of the Upper Paleozoic are the main oil and gas exploration target in the area, and. This article focuses on the He8, Shan1 and Shan2 section.
Unconventional natural gas reservoirs of coal measures are characterized by low porosity and low permeability. The reservoir physical property is the key factor that determines the type of gas reservoirs and the difficulty of development. The geological elements such as rock composition, cementation type, content, and skeleton particle characteristics of coal measures should be studied emphatically. Despite significant progress in the exploration of tight sandstone gas in the Upper Paleozoic in recent years, there have been no systematic studies on issues such as natural gas migration, accumulation processes and accumulation patterns. He8, Shan1 and Shan2 sections are the main reservoir of tight sandstone gas in the study area. The geological factors such as reservoir rock composition, cement type, content, and skeleton particle characteristics are bound to affect reservoir physical properties [
11,
12,
13]. The cementation is the most important diagenesis of the Upper Paleozoic in the study area [
14]. The difference in the type, content and formation mode of cement will also build different patterns of reservoir physical properties.
The physical properties of tight sandstone reservoir are affected by sedimentation, diagenesis, and tectonic process [
15]. Compaction and cementation have a great impact on the evolution of tight sandstone. Based on the theories of crystal growth including layer growth theory and crystal thermodynamics, growth mechanism of siliceous cements in tight sandstone has been studied.
Siliceous cement is one of the most common minerals in clastic rock and the most important diagenetic material affecting the quality of siliciclastic reservoirs [
16,
17]. Siliceous cements are formed in most sedimentary basins at diagenetic temperatures of 60–145 °C [
18], meaning that from the early diagenesis and late diagenesis siliceous cementation can occur. The influence of the quality of the formation has always been one of the hotspots of scholars at home and abroad, including siliceous sources that form siliceous cements [
19,
20], effects of hydrocarbon intrusion on quartz cementation [
19,
20,
21], establishment of diagenetic models associated with siliceous cements [
22,
23], the growth rate of siliceous cements [
23], influences of clay minerals on sandstone cementation [
24,
25], fluid–rock interactions with sandstones [
26] and other issues.
In this paper, the formation mechanism of siliceous cementation in the tight sandstone, the evolution mode of tight sandstone and its influencing factors are explored, respectively.
2. Geological Setting
From the perspective of the overall tectonic unit, the Ordos Basin is in the western part of the North China Plate and is also in the central and western parts of the North China Craton Basin, classified as a secondary tectonic unit [
27]. It began to accept sediments from the Middle and Late Proterozoic, and experienced many tectonic movements, eventually forming multicycle cratonic basin with an integrated stable settlement platform [
10]. According to the structural characteristics of the basin, it can be divided into six first-order tectonic units such as the Yimeng uplift, Jinxi flexural fold belt, Yishan slope, Tianhuan depression, Weibei uplift and western margin thrust tectonics. The entire outline of the Ordos Basin presents a rectangle. From the aspect of the profile, it is gentle in the west and steep in the east, showing asymmetric weeper syncline.
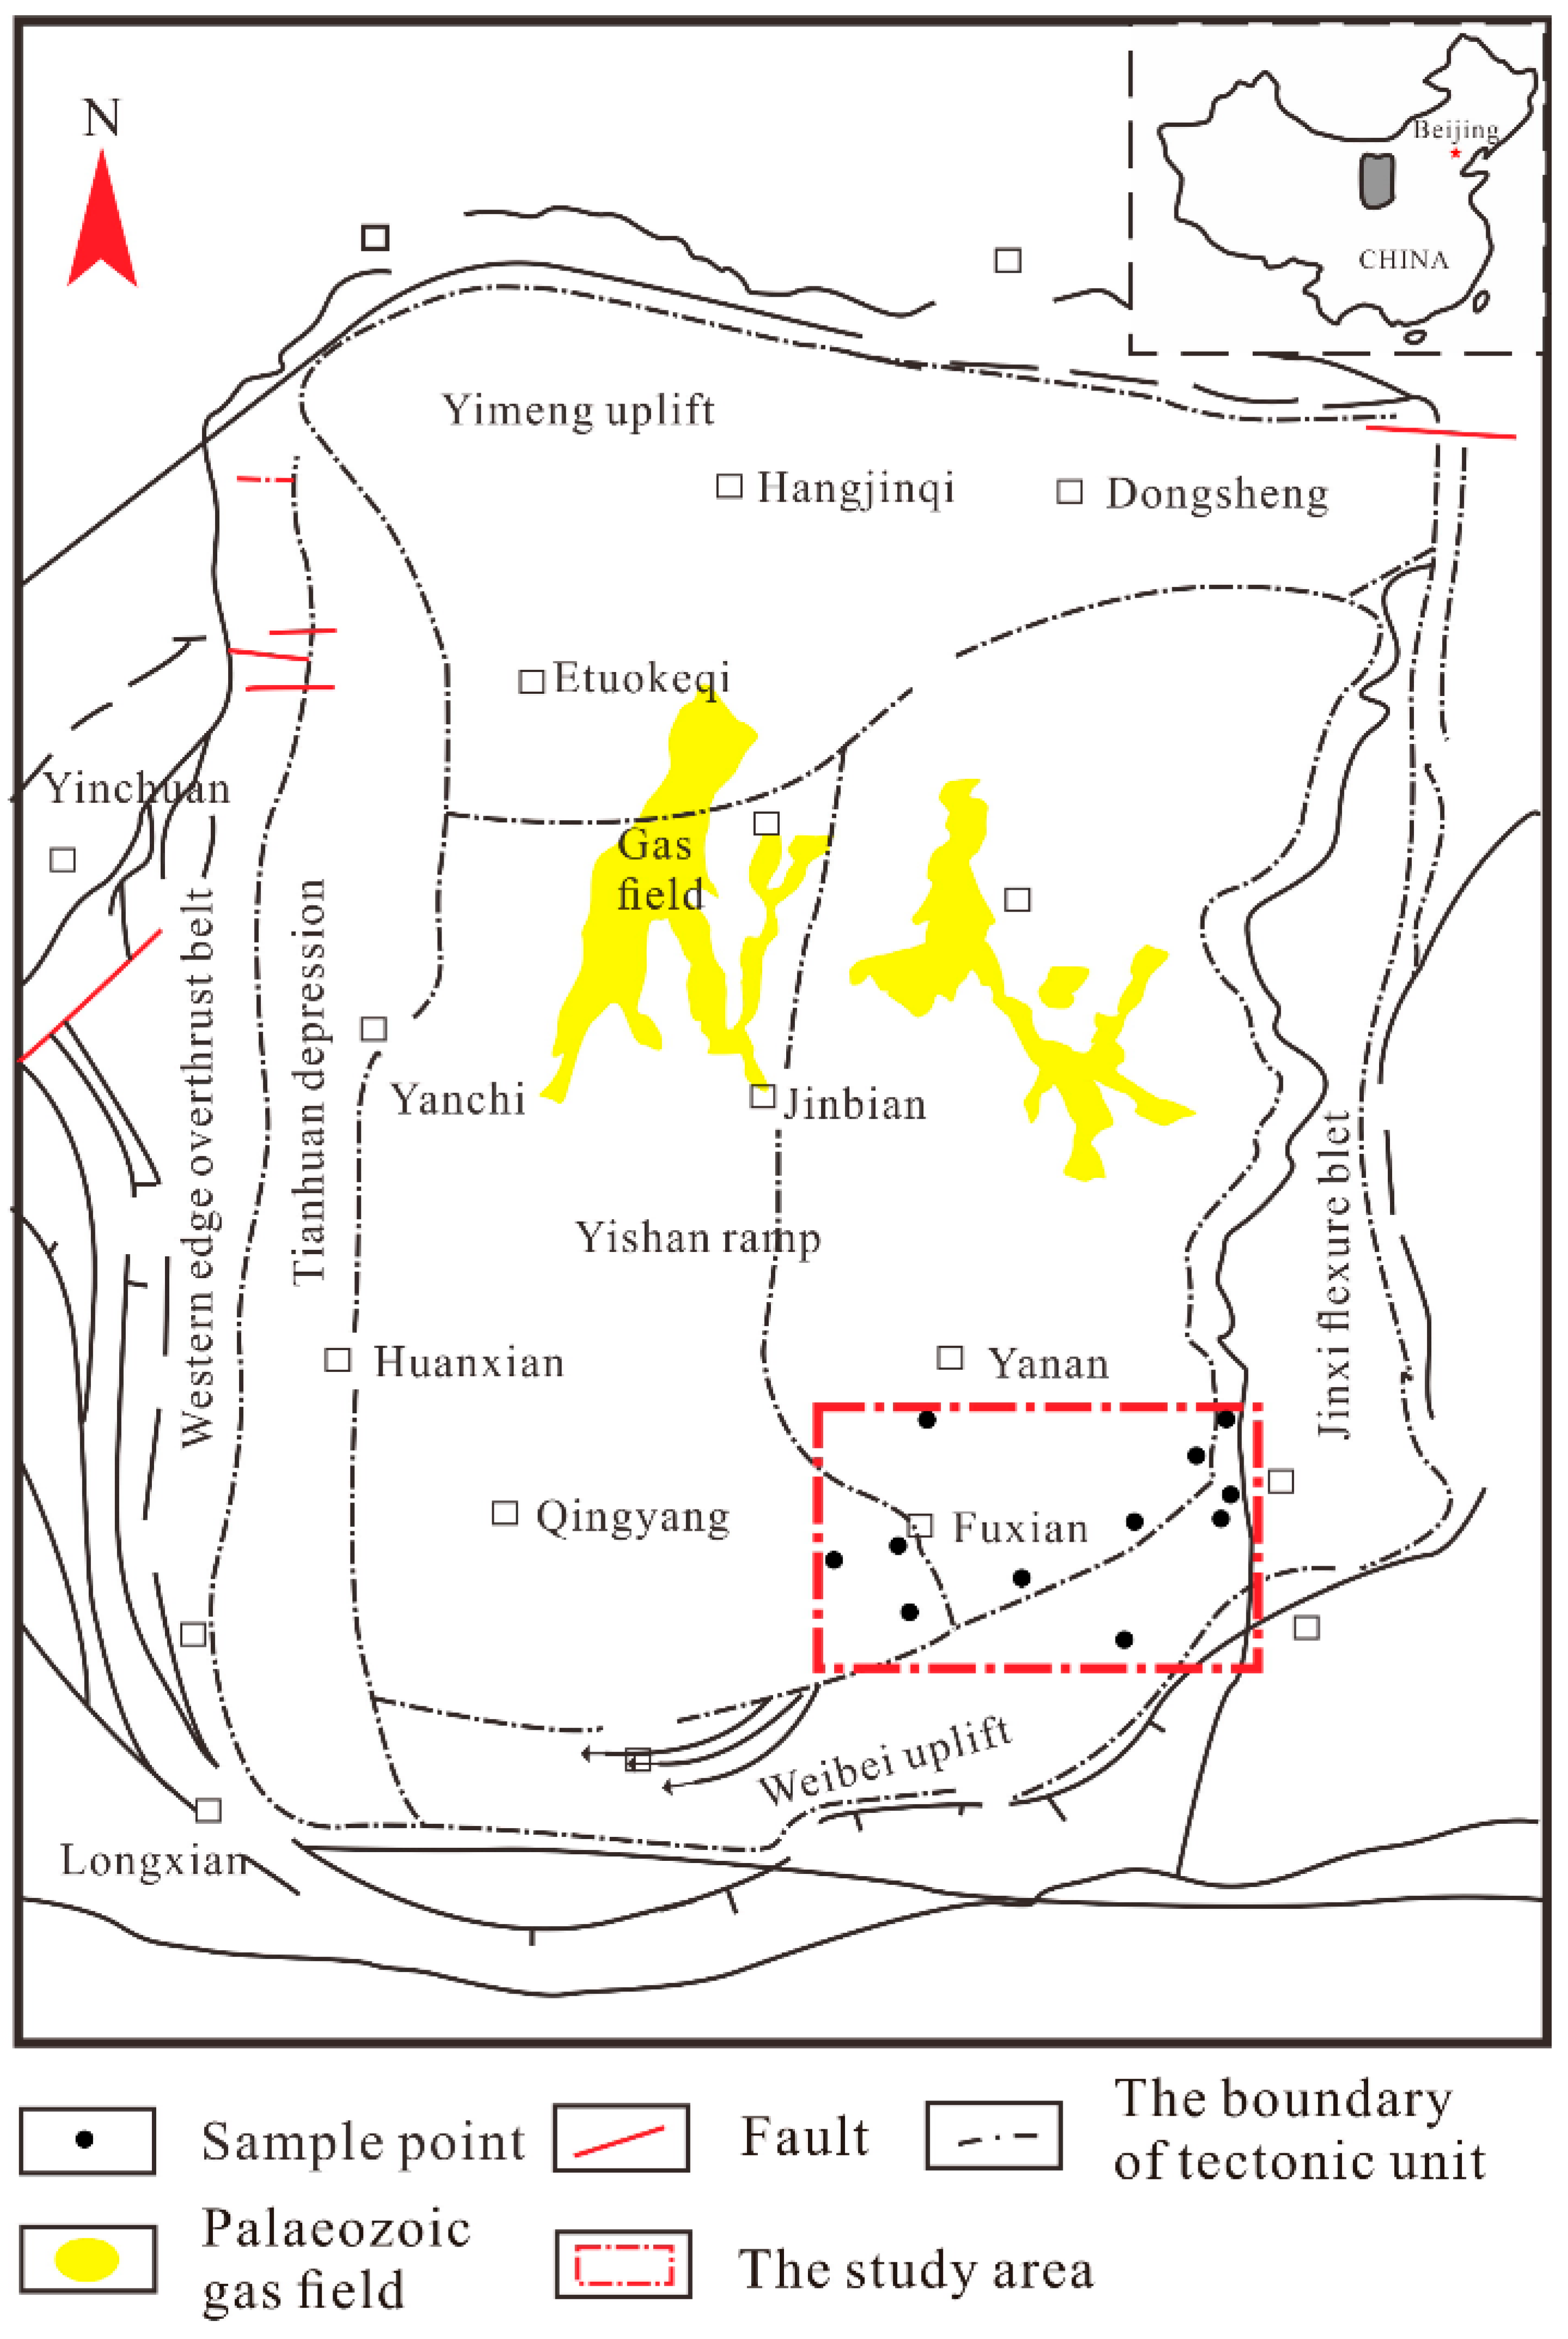
The study area is in the south of Yanchang gas field, north of northern Hebei uplift, west of Jinxi flexural fold belt, east of Tianhuan depression, and the area is about 8000 km
2 (
Figure 1). A set of marine-continental transitional coal-measure strata in the Benxi Formation-Shanxi Formation of the Upper Paleozoic [
9]. This period was an important coal accumulation period in the Late Paleozoic in North China and formed a set of widely distributed coal-bearing strata [
28,
29,
30]. Continuous hydrocarbon generation provides a rich source of gas for the formation of tight gas reservoirs.
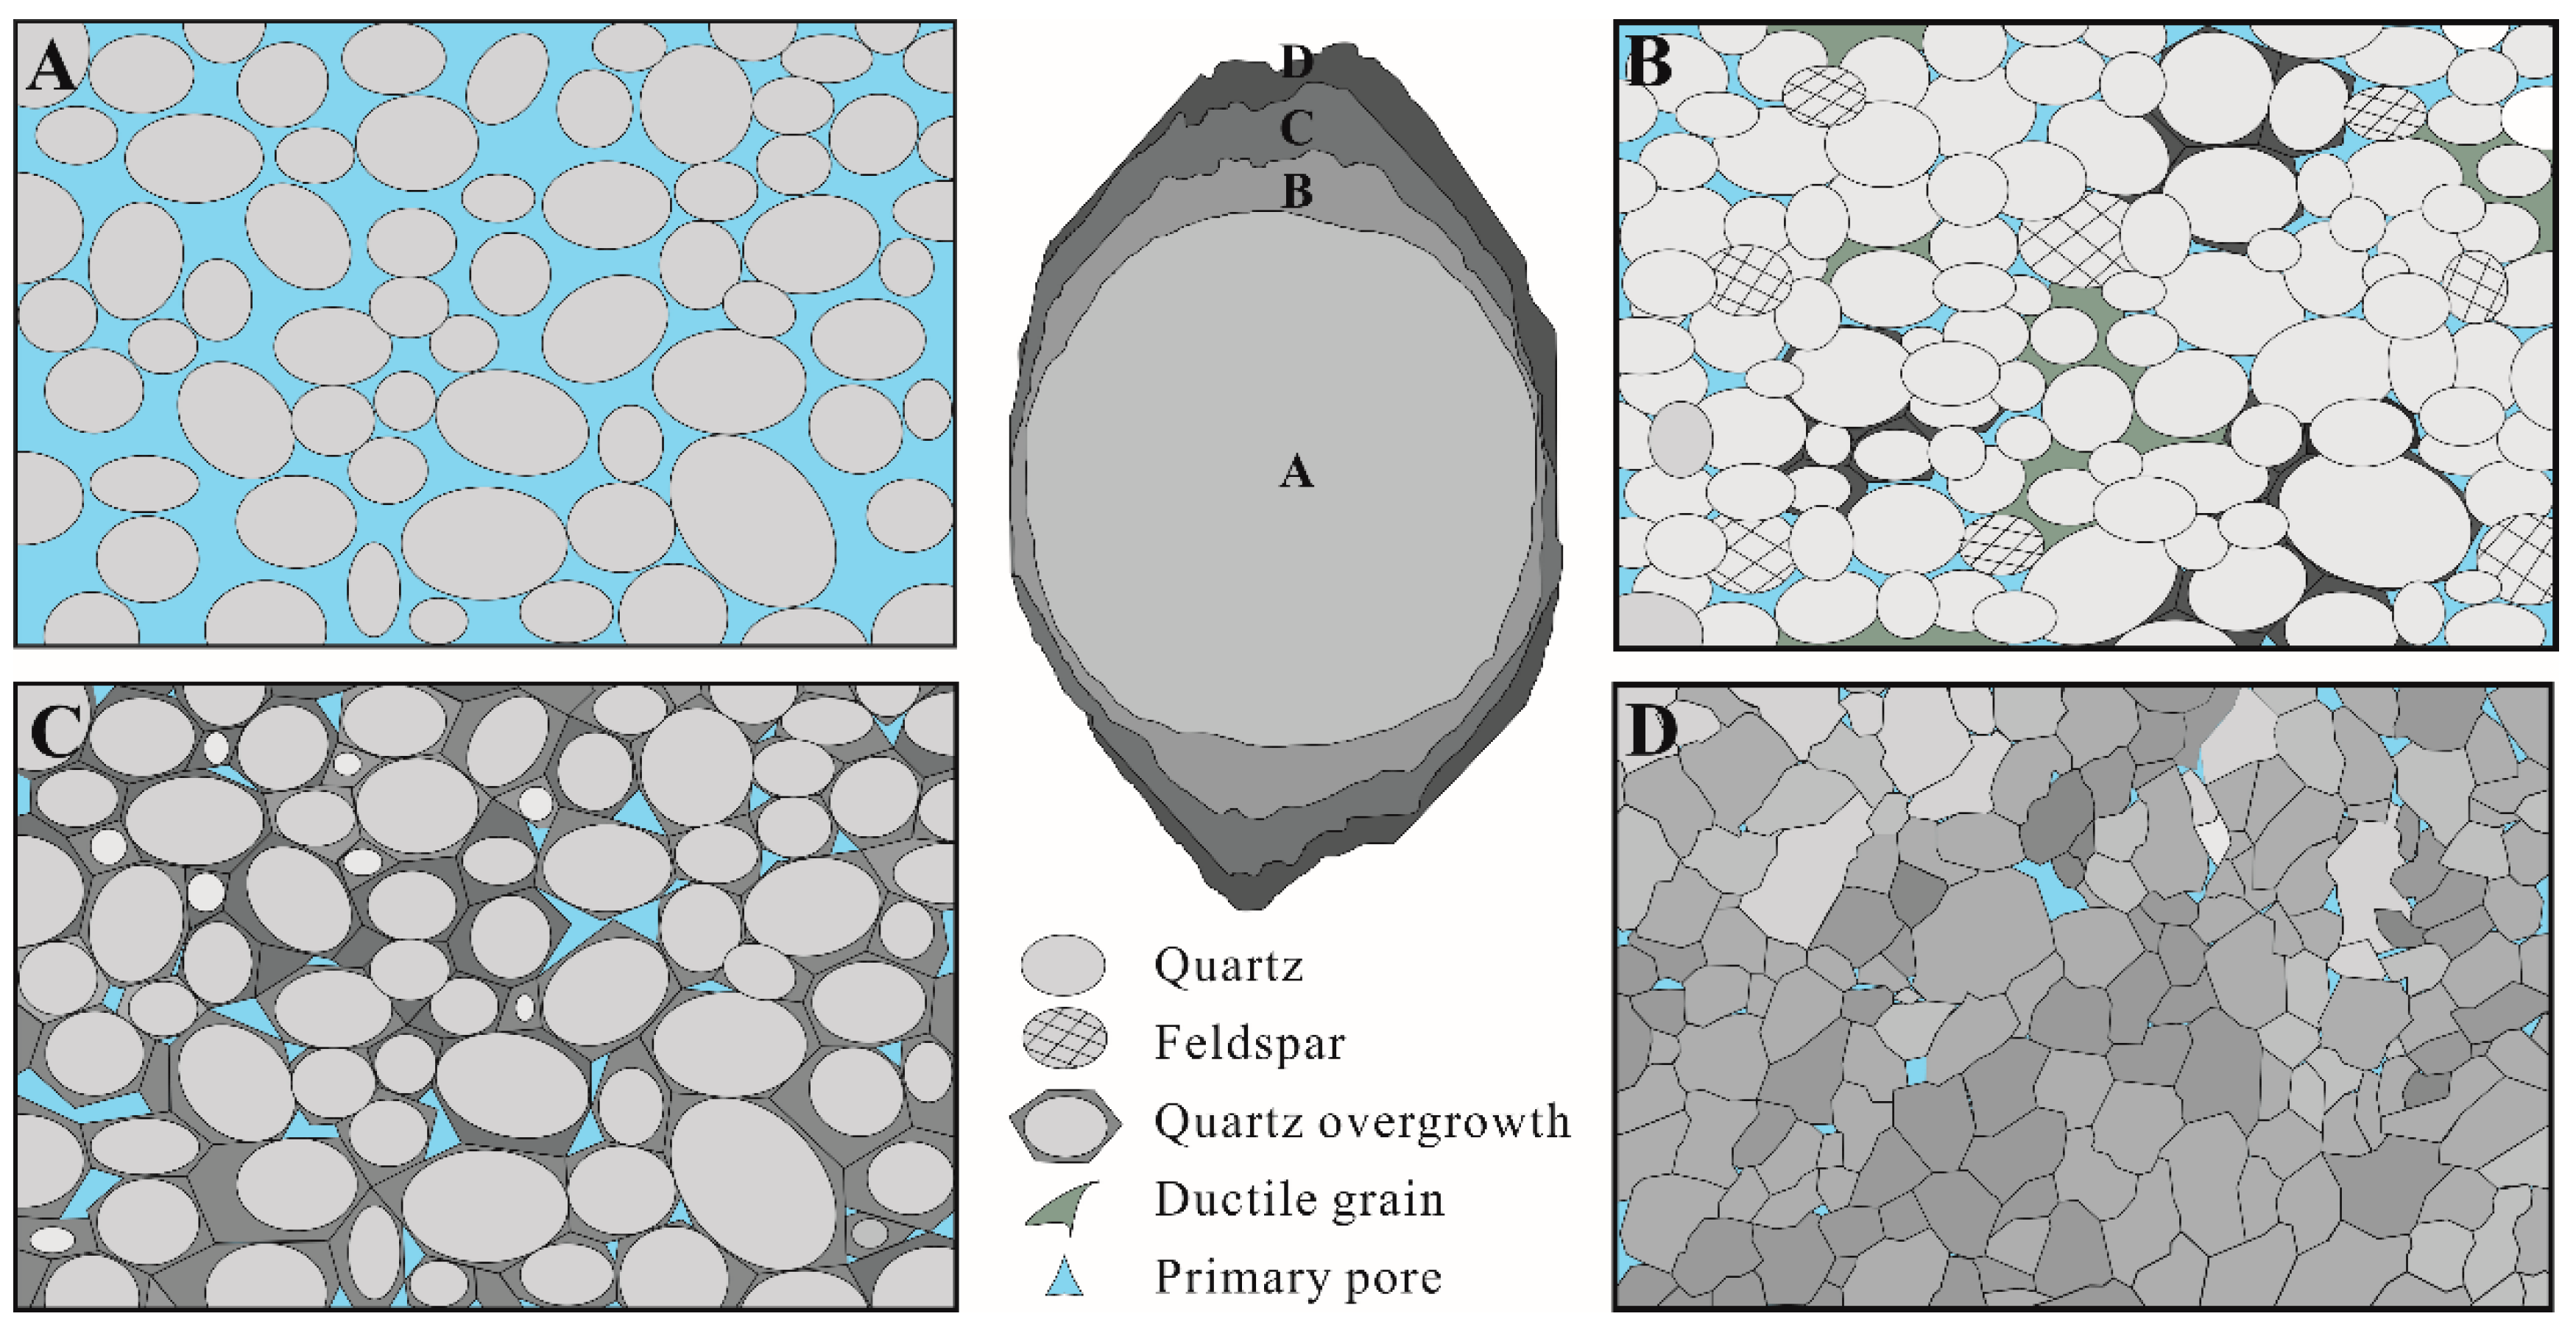
The He8 section, Shan1 section and Shan2 section of the study area develop various degrees of silicic cementation affected at different depth by diagenesis. Generally, the siliceous content increases from top to bottom (
Figure 2). The siliceous cement of the He8 section is mainly composed of “point-like” cementation, while the siliceous cementation of the Shan1 section is mainly distributed with porphyritic texture that the siliceous cements is very developed in the concentrated position of the quartz particles.
In this paper, the formation mechanism of siliceous cementation in the tight sandstone, the evolution mode of tight sandstone and its influencing factors are explored, respectively.
3. Samples and Methodology
Sixty-nine representative tight sandstone core samples were selected from eleven wells drilled in Southeast Ordos Basin. The ternary diagram of lithology shows that the samples are mainly consisted with quartz sandstone and lithic quartz sandstone (
Figure 3). Every sample were cut into three parts for casting thin sections, scanning electron microscope and element analysis. Chemical composition of minerals was determined in 69 polished thin sections using a Leica ckx53 microscope (Nikon, Aachen, North Rhine Westphalia, Germany) and a Nikon microscope (Nikon, Tokyo, Japan) equipped with a CL8200-MK5 cathode luminescence optical system (Cambridge Image Technology Ltd., London, UK). In addition, the Nikon microscopy equipped with a cathode luminescence optical system were also used to observe the characteristic of quartz growth and crystallization period with a beam voltage of 17 kV and a current of 600 μA. Characteristics of crystal growth and distribution on were observed using a FEI Quanta 200F SEM (Thermo Fisher, Beijing, China) (20 KV, high vacuum mode) with gold-coated samples. The third part of samples were powdered for element and clay minerals analysis using ICAP RQ ICP-MS (Thermo Fisher, Beijing, China). The siliceous cements were determined by counting 20 × 20 points in each thin section. In addition, before the experiments, conventional core analysis of matrix permeability was performed using a SL-5 rock permeability (Cambridge Image Technology Ltd., London, UK) with a temperature and pressure of 24 °C and 91.5 KPa. All the tests and analyses were experimented at China University of Geosciences in Beijing, following the standard regulation “SY/T 5336-1996” of China.
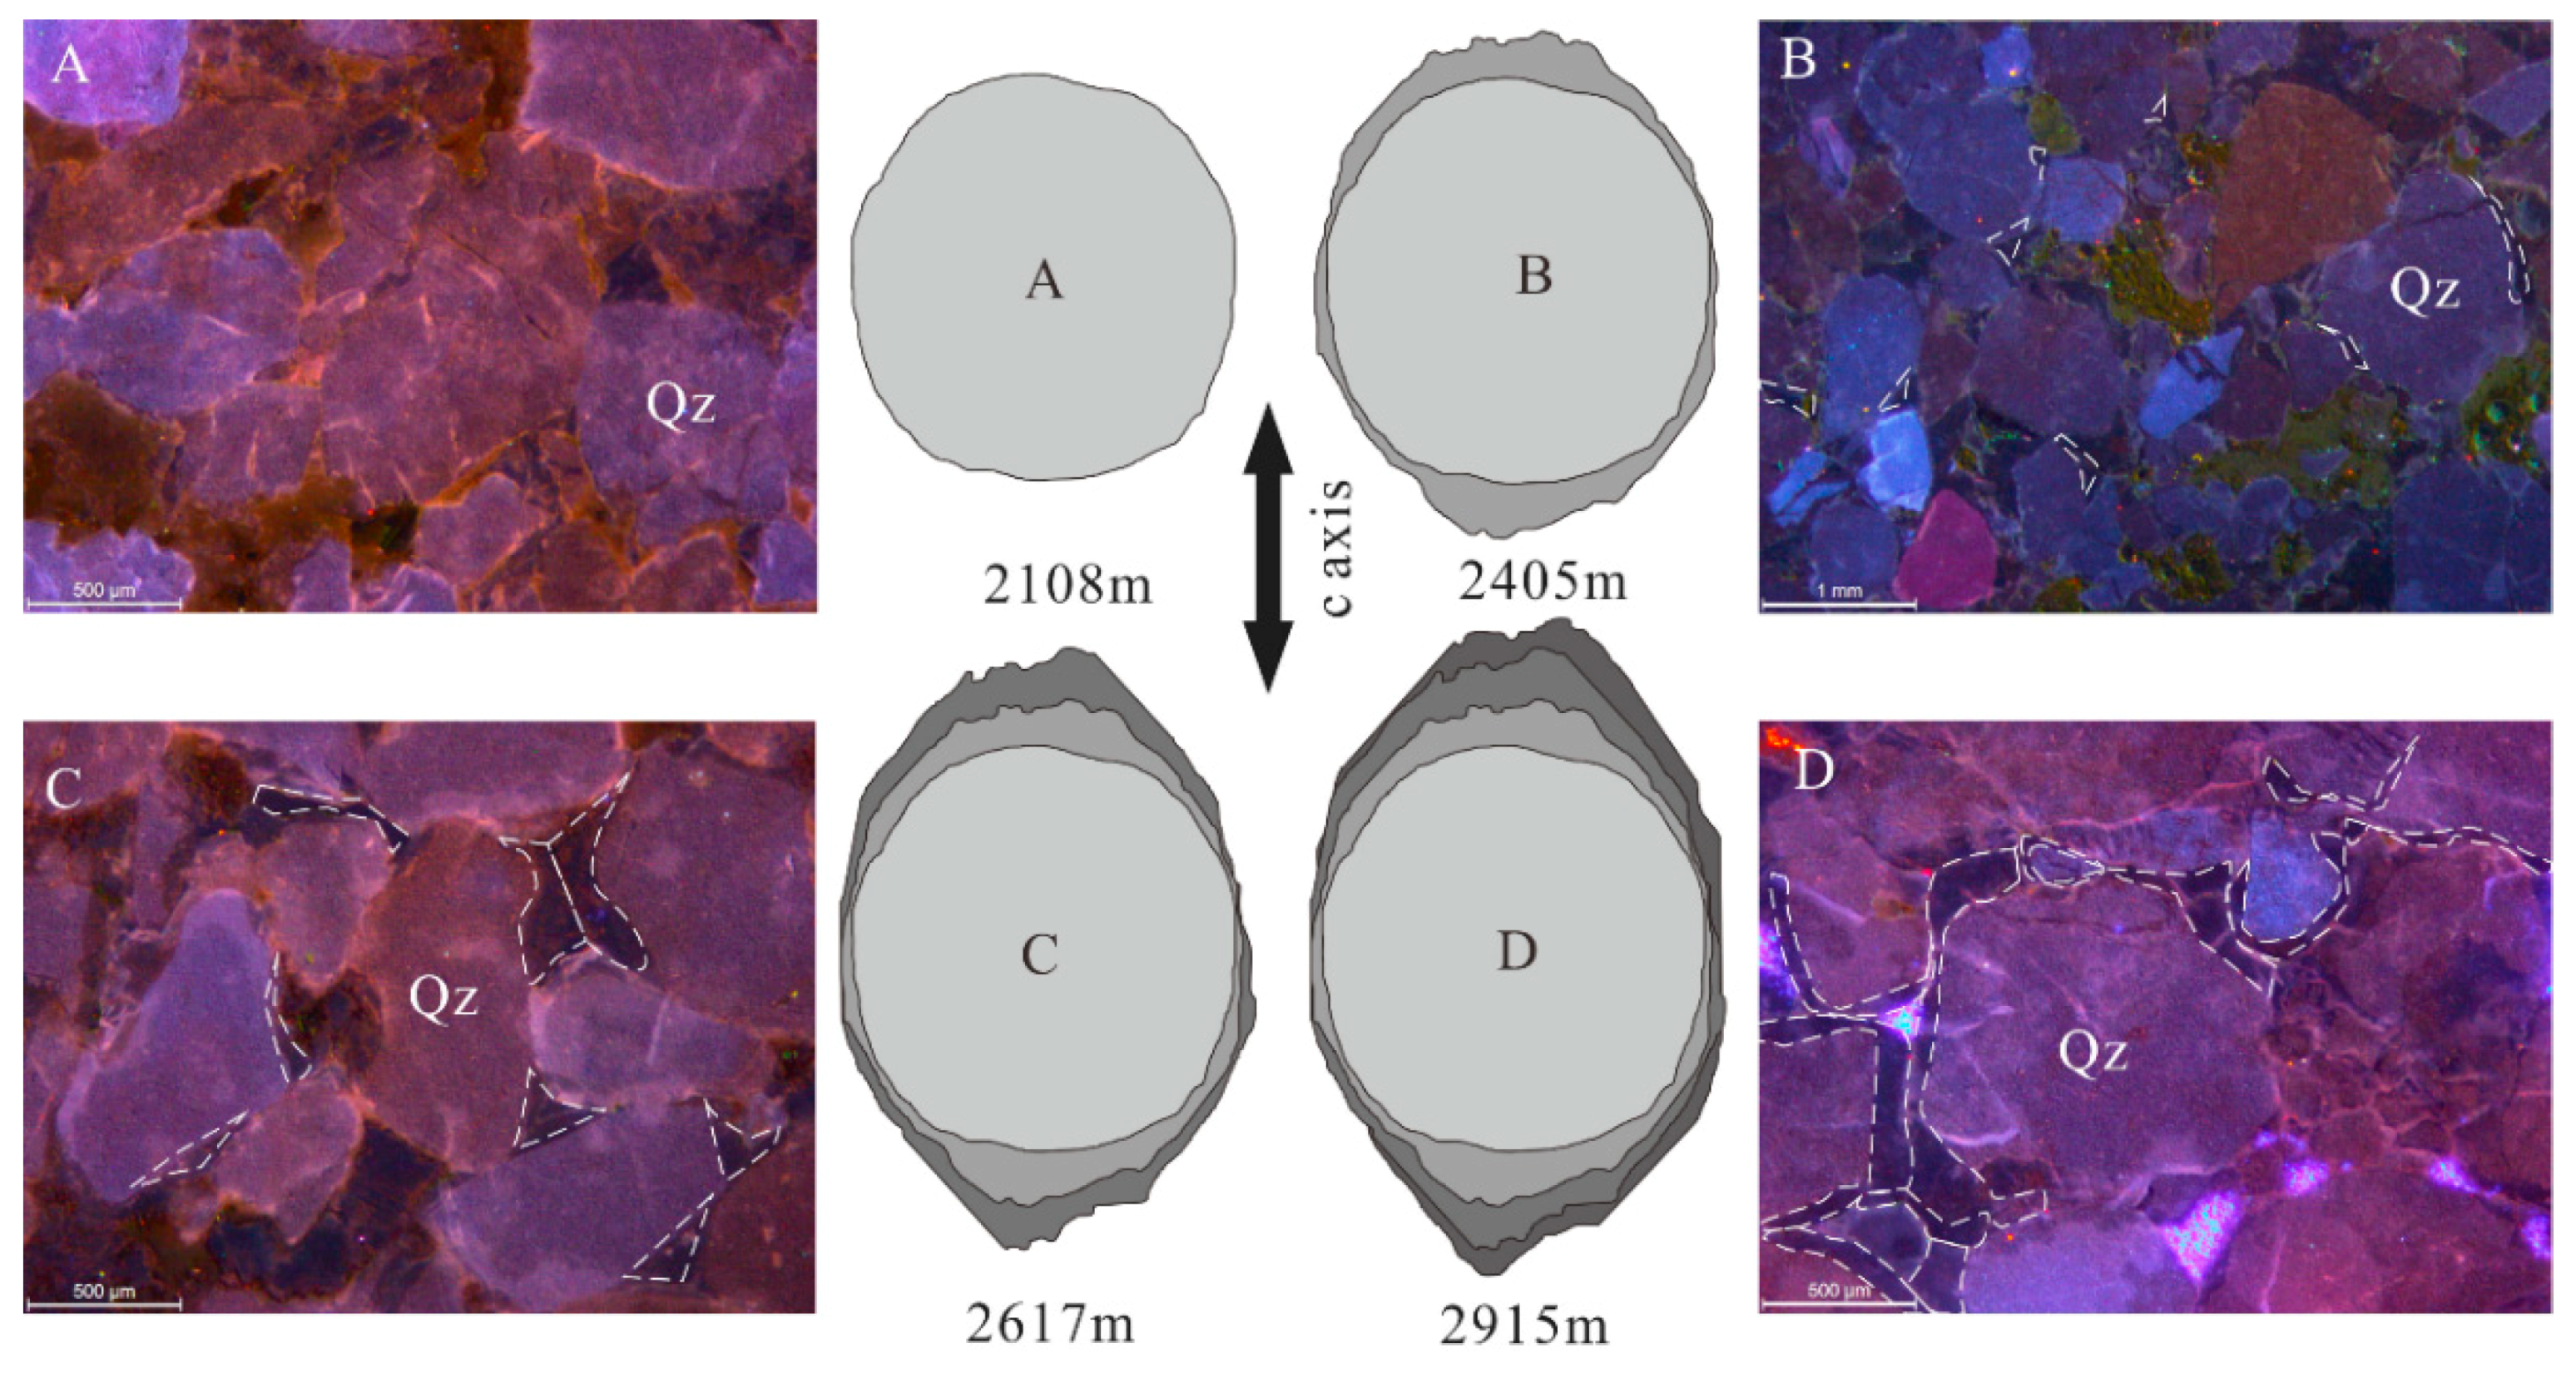
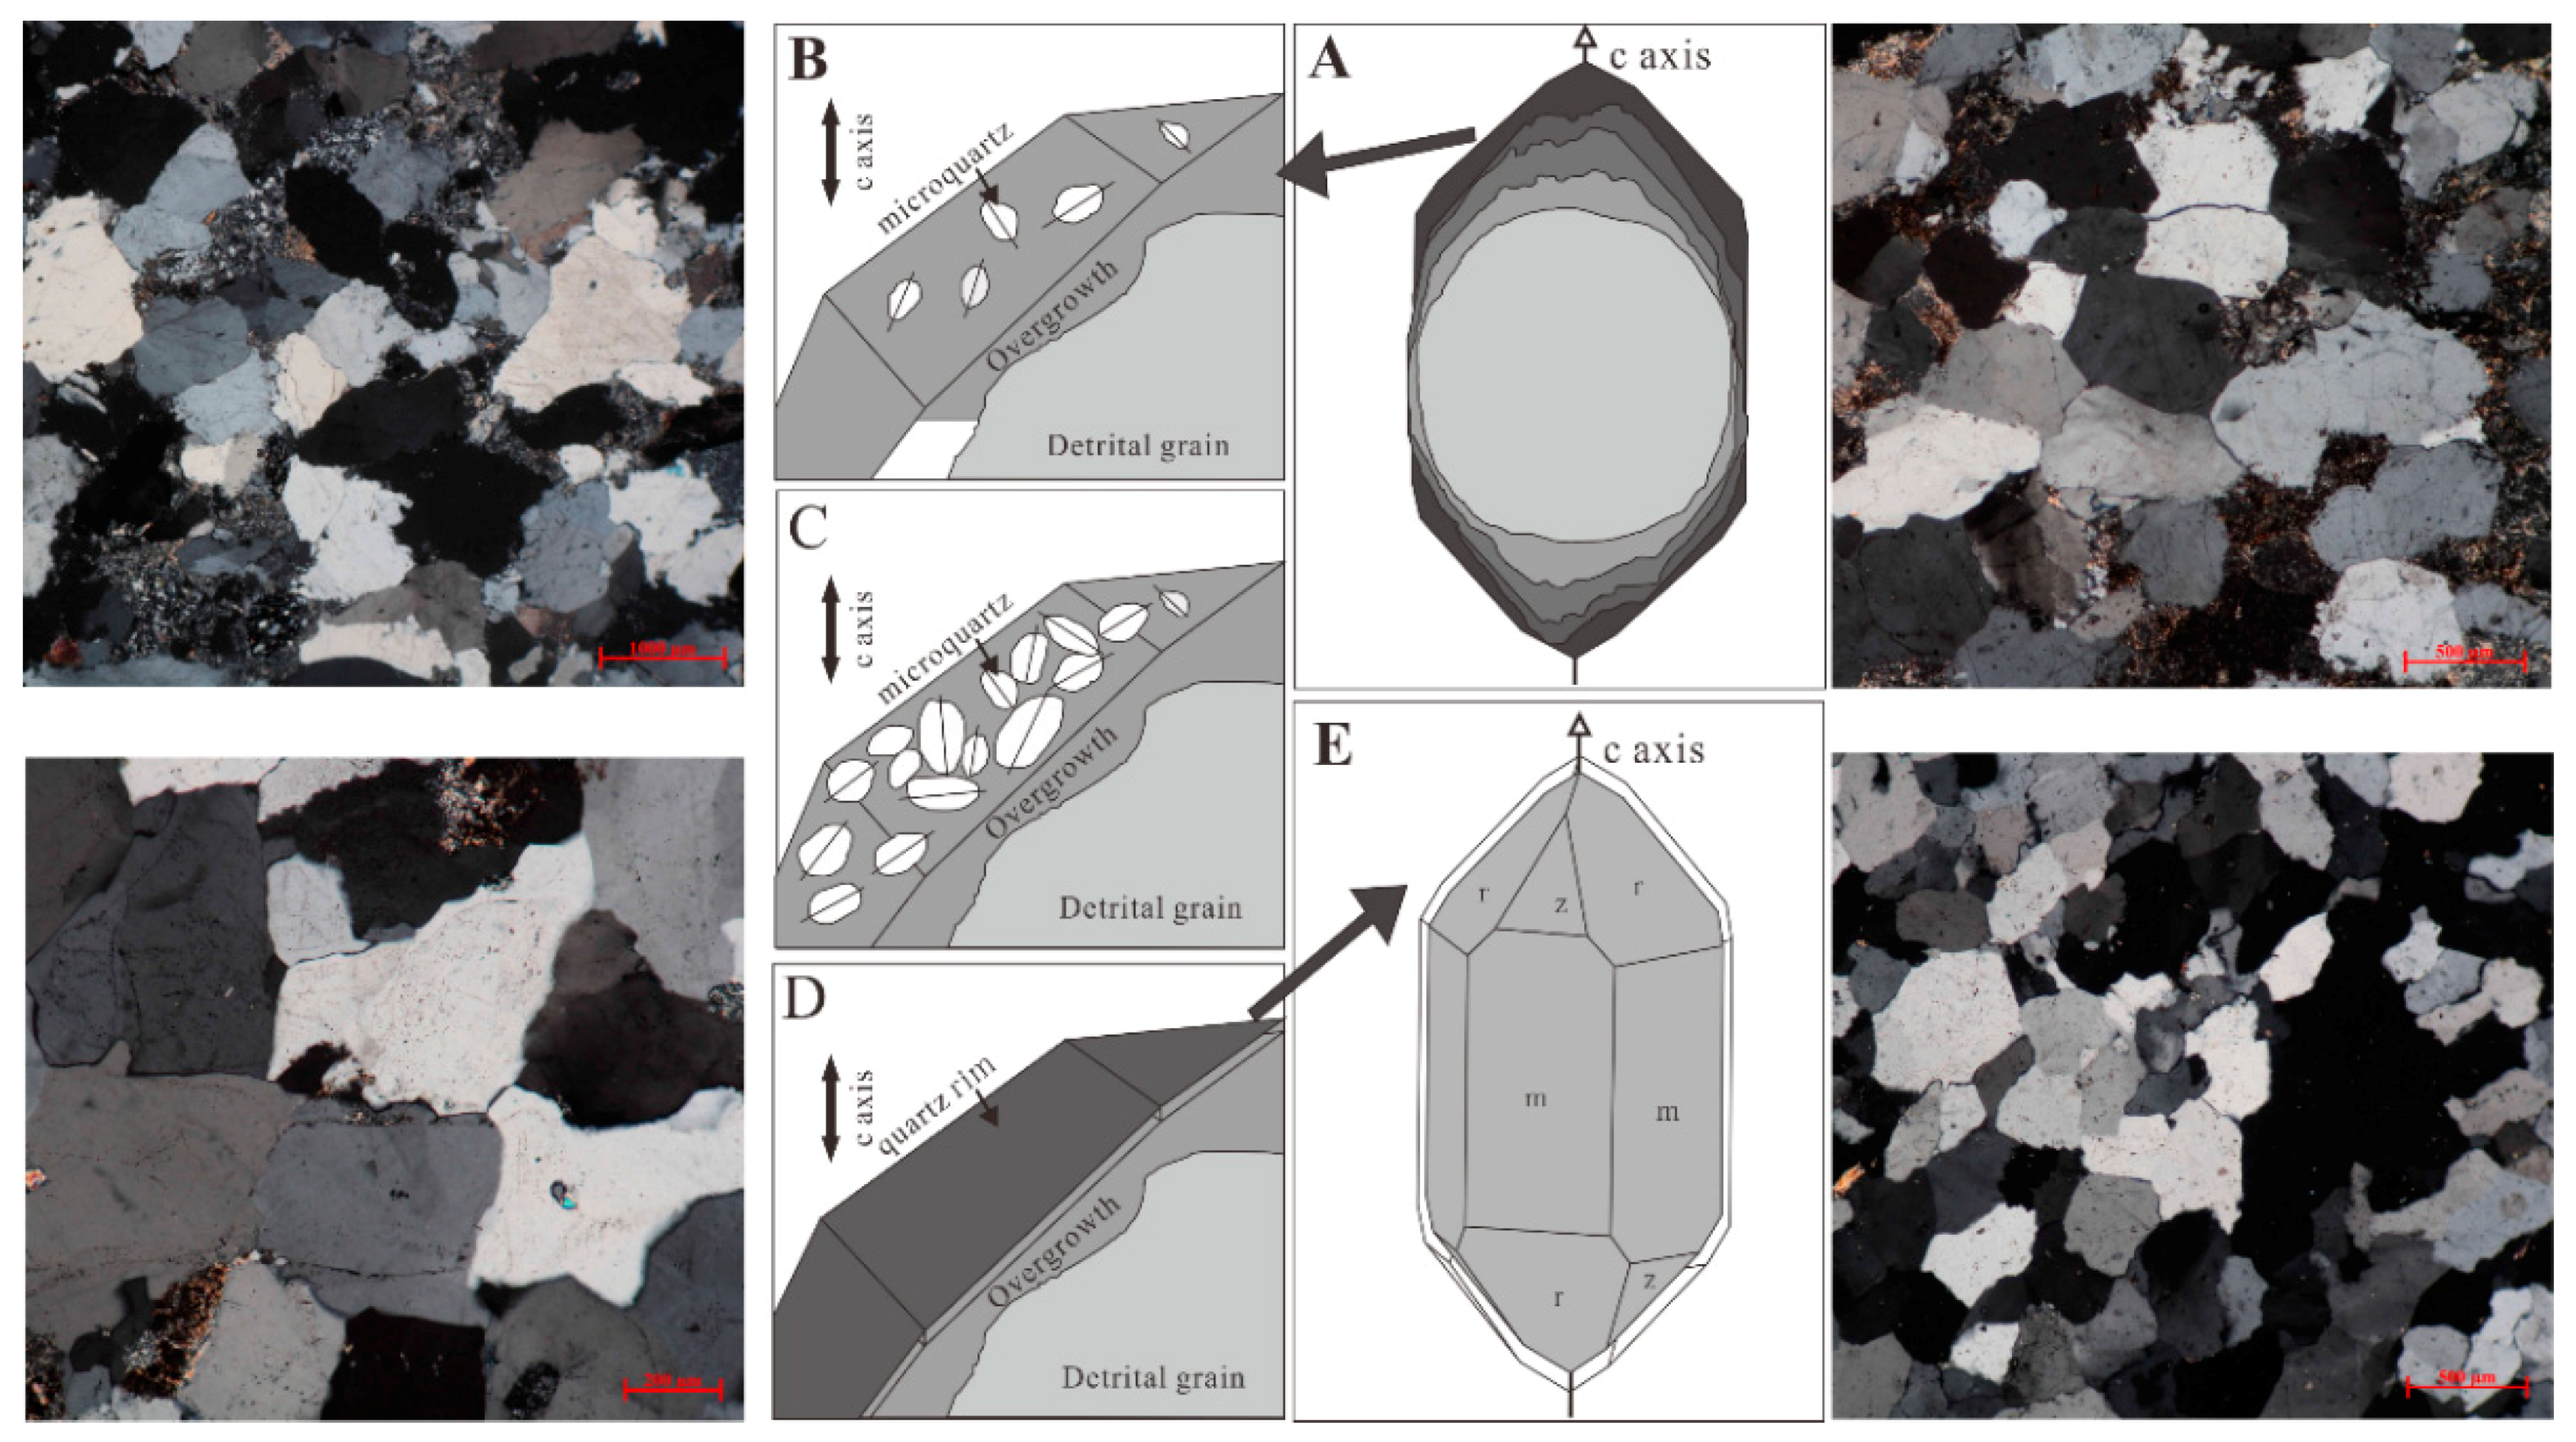
The mechanism of nucleation of quartz is observed and analyzed at the very beginning with cathode luminescence (CL) experiments and scanning electron microscope (SEM). As the result of
Figure 4 and
Figure 5, the whole siliceous cementation of the study area could be divided into two processes: quartz overgrowth from the rounding grains to the hexagonal dipyramid crystal and the process of coaxial growth, which will be discussed in the following parts. Based on the characteristics of quartz growth, the two different models of the formation of tight sandstone, quartz sandstone and lithic quartz sandstone, are established separately. The 2D and 3D models of quartz growth and diagenesis evolution were made respectively with CorelDRAW (X7, Corel, Ottawa, ON, Canada) and Autodesk 3Ds Max software (2016, Autodesk, Toronto, ON, Canada). Furthermore, the physical factors affecting tight sandstone reservoirs: sedimentary, diagenetic, and post-diagenetic are discussed as well in the end, relying on the X-ray diffractions and statistical calculation.
4. Discussion
4.1. Mechanism of Nucleation of Quartz Overgrowth
Many scholars have studied the influence of siliceous cementation on the physical properties of sandstone reservoirs [
31,
32]. Lander studied the growth evolution rate of quartz. The experimental object is a quartz particle with very good roundness (
Figure 4A). It is pointed out that the cement is firstly grown along the C-axis of quartz. The growth rate of crystal a-axis and r-axis is far less than C-axis. Eventually, quartz was completely restored to a hexagonal dipyramid crystal by the overgrowth effect of quartz, but the subsequent crystal overgrowth and the evolution models were not further explored. Based on Lander’s theory, the growth characteristics of quartz particles in the study area were further observed and summarized by SEM and cathodoluminescence experiments. It was found that after the quartz particles were restored to hexagonal dipyramid crystals, the whole crystal would further grow and grow form. The growth form is a large amount of microcrystalline quartz randomly growing on the surface of the crystal. As the depth of the formation increases, microcrystalline quartz forms a new layer of cementation and adheres to the surface of the original quartz particles. The subsequent siliceous cementation is a process of syngenetic growth (
Figure 5).
Therefore, according to the characteristics of quartz cementation growth, the entire siliceous cementation is divided into two parts. The first part is the process in which the weathered and rounded particles in the formation are restored to the hexagonal dipyramid crystal by siliceous cementation. The second part is the process of coaxial growth that the hexagonal dipyramid crystal continues to increase with the form of micro-quartz film. The overall siliceous cementation increases with the increasing depth of the formation. Meanwhile, siliceous cementation has different effects on the reservoir at each stage.
4.2. Models of the Formation of Tight Sandstone
As siliceous overgrowth of quartz continues, the cementation at different stages will have different effects on the porosity and permeability of reservoirs, including pore distribution, mechanical properties of reservoir and permeability. According to the crystal growth theory above, the densification process of quartz sandstone and lithic quartz sandstone was studied respectively, and the corresponding 2D and 3D diagenetic evolution models were established. According to the crystal growth theory above, the densification process of quartz sandstone and lithic quartz sandstone was studied respectively, and the corresponding 2D and 3D diagenetic evolution models were established. The siliceous cementation is divided into two stages. The weathered and rounded quartz is restored to the original hexagonal dipyramid, and the hexagonal dipyramid quartz further grows into a larger grain. However, the reservoirs in the actual stratum will be subjected to other diagenesis such as compaction and dissolution. Since compaction and cementation are the most important diagenesis of densification of sandstone, therefore, the main effects of compaction and diagenesis on the reservoir are mainly considered here.
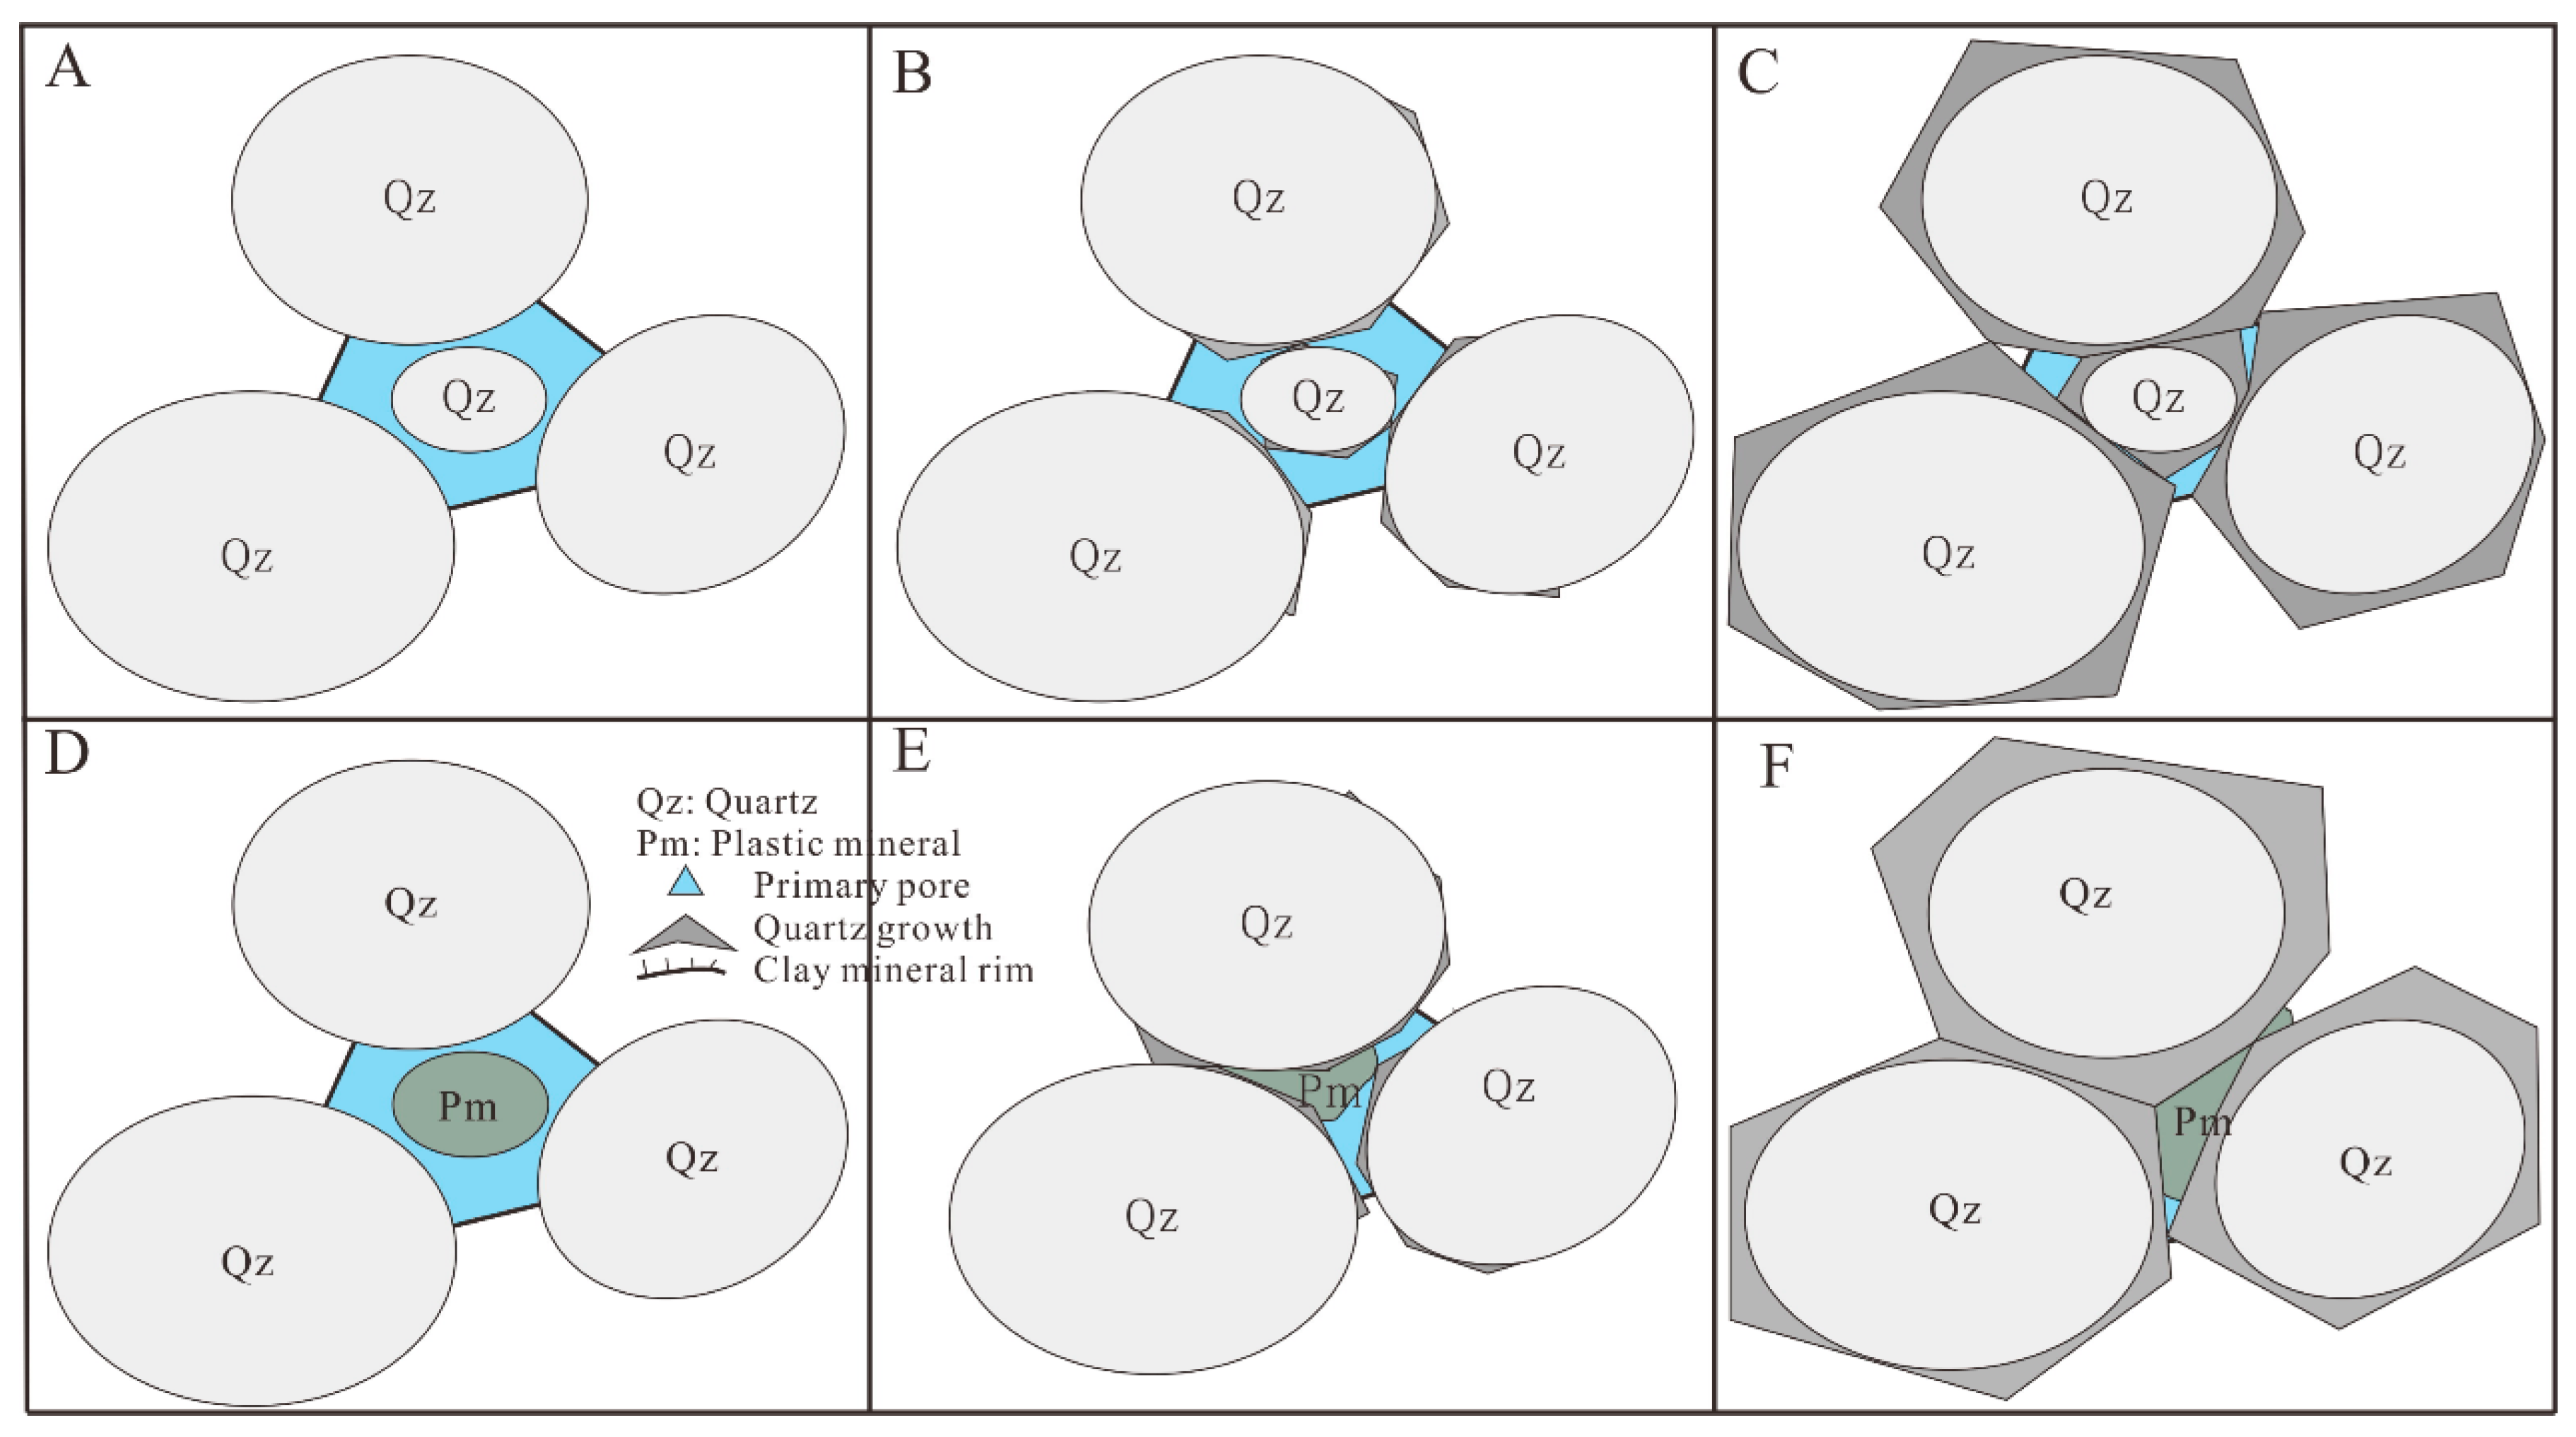
4.2.1. Formation Mechanism of Quartz Sandstone
According to the characteristics of siliceous cementation in the study area and the petrological characteristics of quartz sandstone, the densification of quartz sandstone is divided into four stages: primary deposition (
Figure 6A), weak siliceous development (
Figure 6B), and recovery of quartz particles. When it is a hexagonal double cone (
Figure 6C) and when the particles are further enlarged (
Figure 6D).
In
Figure 6A, the particles are mainly consisted of quartz with a small amount of rock fragments among them. There are large primary pores between the particles, and the primary porosity is 30–40%, which is the stage of early diagenesis. The quartz particles correspond to in
Figure 6A.
Figure 6B shows the quartz particles develop a small amount of siliceous cement on the C-axis with a point-thin film occurrence. The quartz in the stratum is distributed with porphyritic texture and some of rock fragments are compacted in the form of “false matrices”. The particles are mainly contacted with point-line occurrence. At this stage, the primary porosity is 8–15%, forming a relatively high porosity of tight sandstone.
Figure 6C shows that many matrices, clay minerals, and rock fragments converse into siliceous cements under the stage of middle diagenesis, and quartz particles are restored into hexagonal dipyramid by siliceous cements. At the same time, the sandstone is completely densified with a residual primary porosity of 5–10%. The formation is dominated by SiO
2 with a strong pressure resistance.
Figure 6D shows that the quartz particles further grow, and the formation is over densified with a few matrices. Meanwhile, the particles are completely composed of quartz with a primary porosity less than 5%. The permeability is drastically reduced, and particles are contacted with mosaic occurrence.
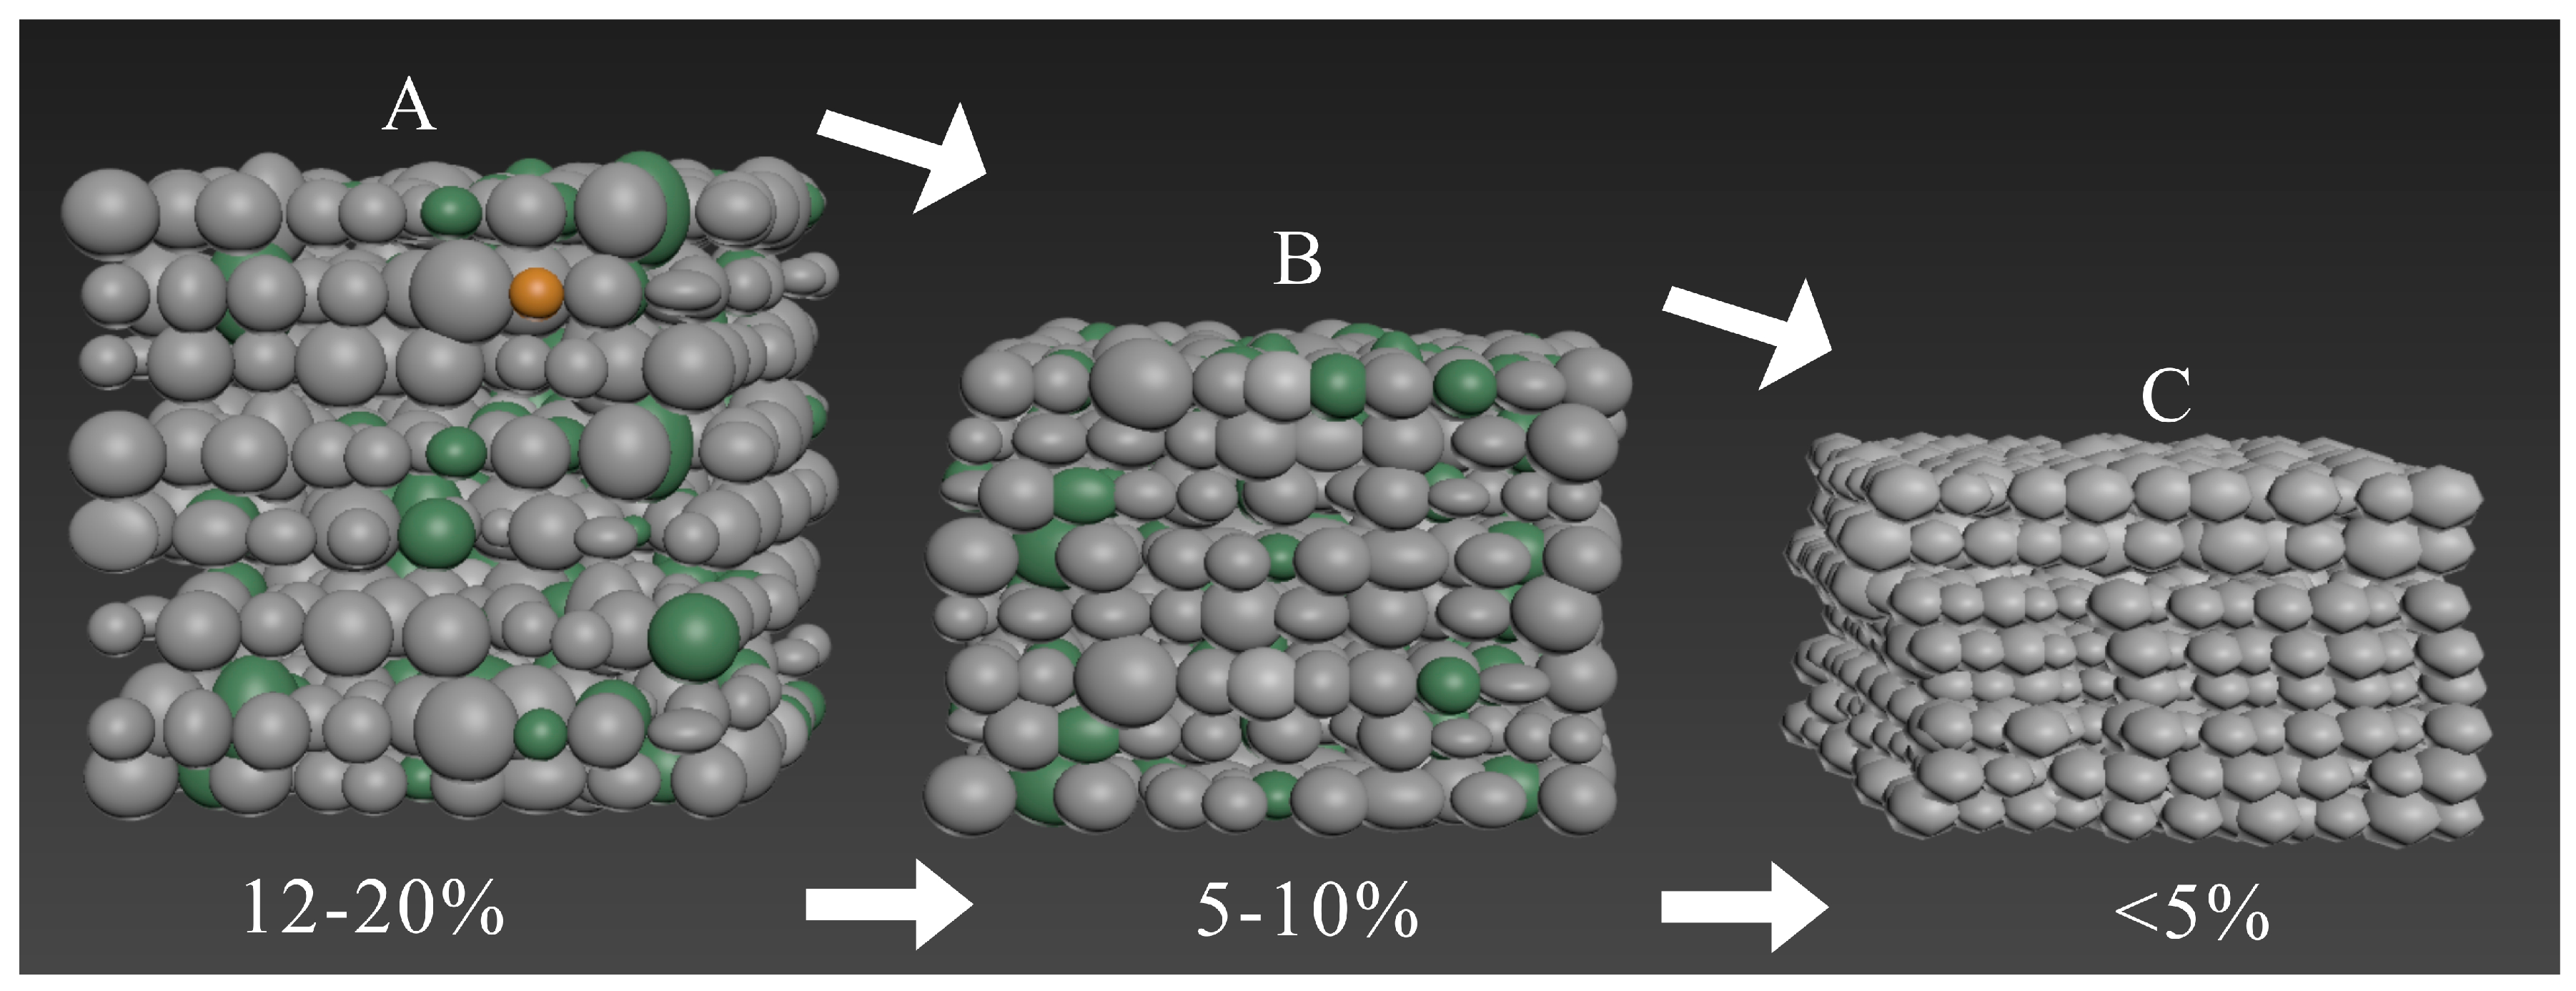
To clearly show the densification process of the entire sandstone, the quartz sandstone densification was modeled by 3dx Max, as shown in
Figure 7. In
Figure 7A–C correspond to
Figure 6A–C respectively, representing the early, middle, and late diagenetic periods. In the period of A to B, the whole quartz sandstone reservoir is mainly affected by compaction. The unit volume is greatly reduced, and the contact form of particles is changed from basement to particle. At this time, siliceous cementation is not developed. From the period of B to C, it is obvious that the volume of the unit sandstone is slightly reduced. Particles are mainly composed of quartz with a large amount of siliceous cementation. The contact type changes from point occurrence to quartz overgrowth occurrence. This part of densification is mainly controlled by siliceous cementation. Therefore, the densification of sandstone can be divided into two stages. The first period is the early-middle diagenetic stage when the quartz sandstone is mainly subjected to compaction, and the unit volume is reduced by 40–50% at this stage. The second stage is the middle-late diagenesis stage. At this time, the unit volume of reservoir is basically unchanged, and the densification is dominated by siliceous cementation by which the volume of internal sandstone is bonded together, with a result of increasing density and decreasing primary porosity.
It can be said that densification of sandstone is a process of divergence and convergence. All kinds of rock fragments, minerals, matrices, and clay minerals are dissolved or converted into siliceous cements. Finally, only quartz, the most stable mineral, is left in the formation. The two stages of densification of quartz sandstone can be summarized as “First shrink, and then expend”. “shrink” is that the volume of quartz sandstone is reduced at the early-middle diagenetic stage. The “expand” is the middle-late diagenesis stage. The unit volume is not changed at this stage, but the particles become larger by siliceous cementation, which can be said to be “expanded” in disguise.
The overall unit volume is reduced first, and then the internal particles are expanded as a whole, which is the essence of densification.
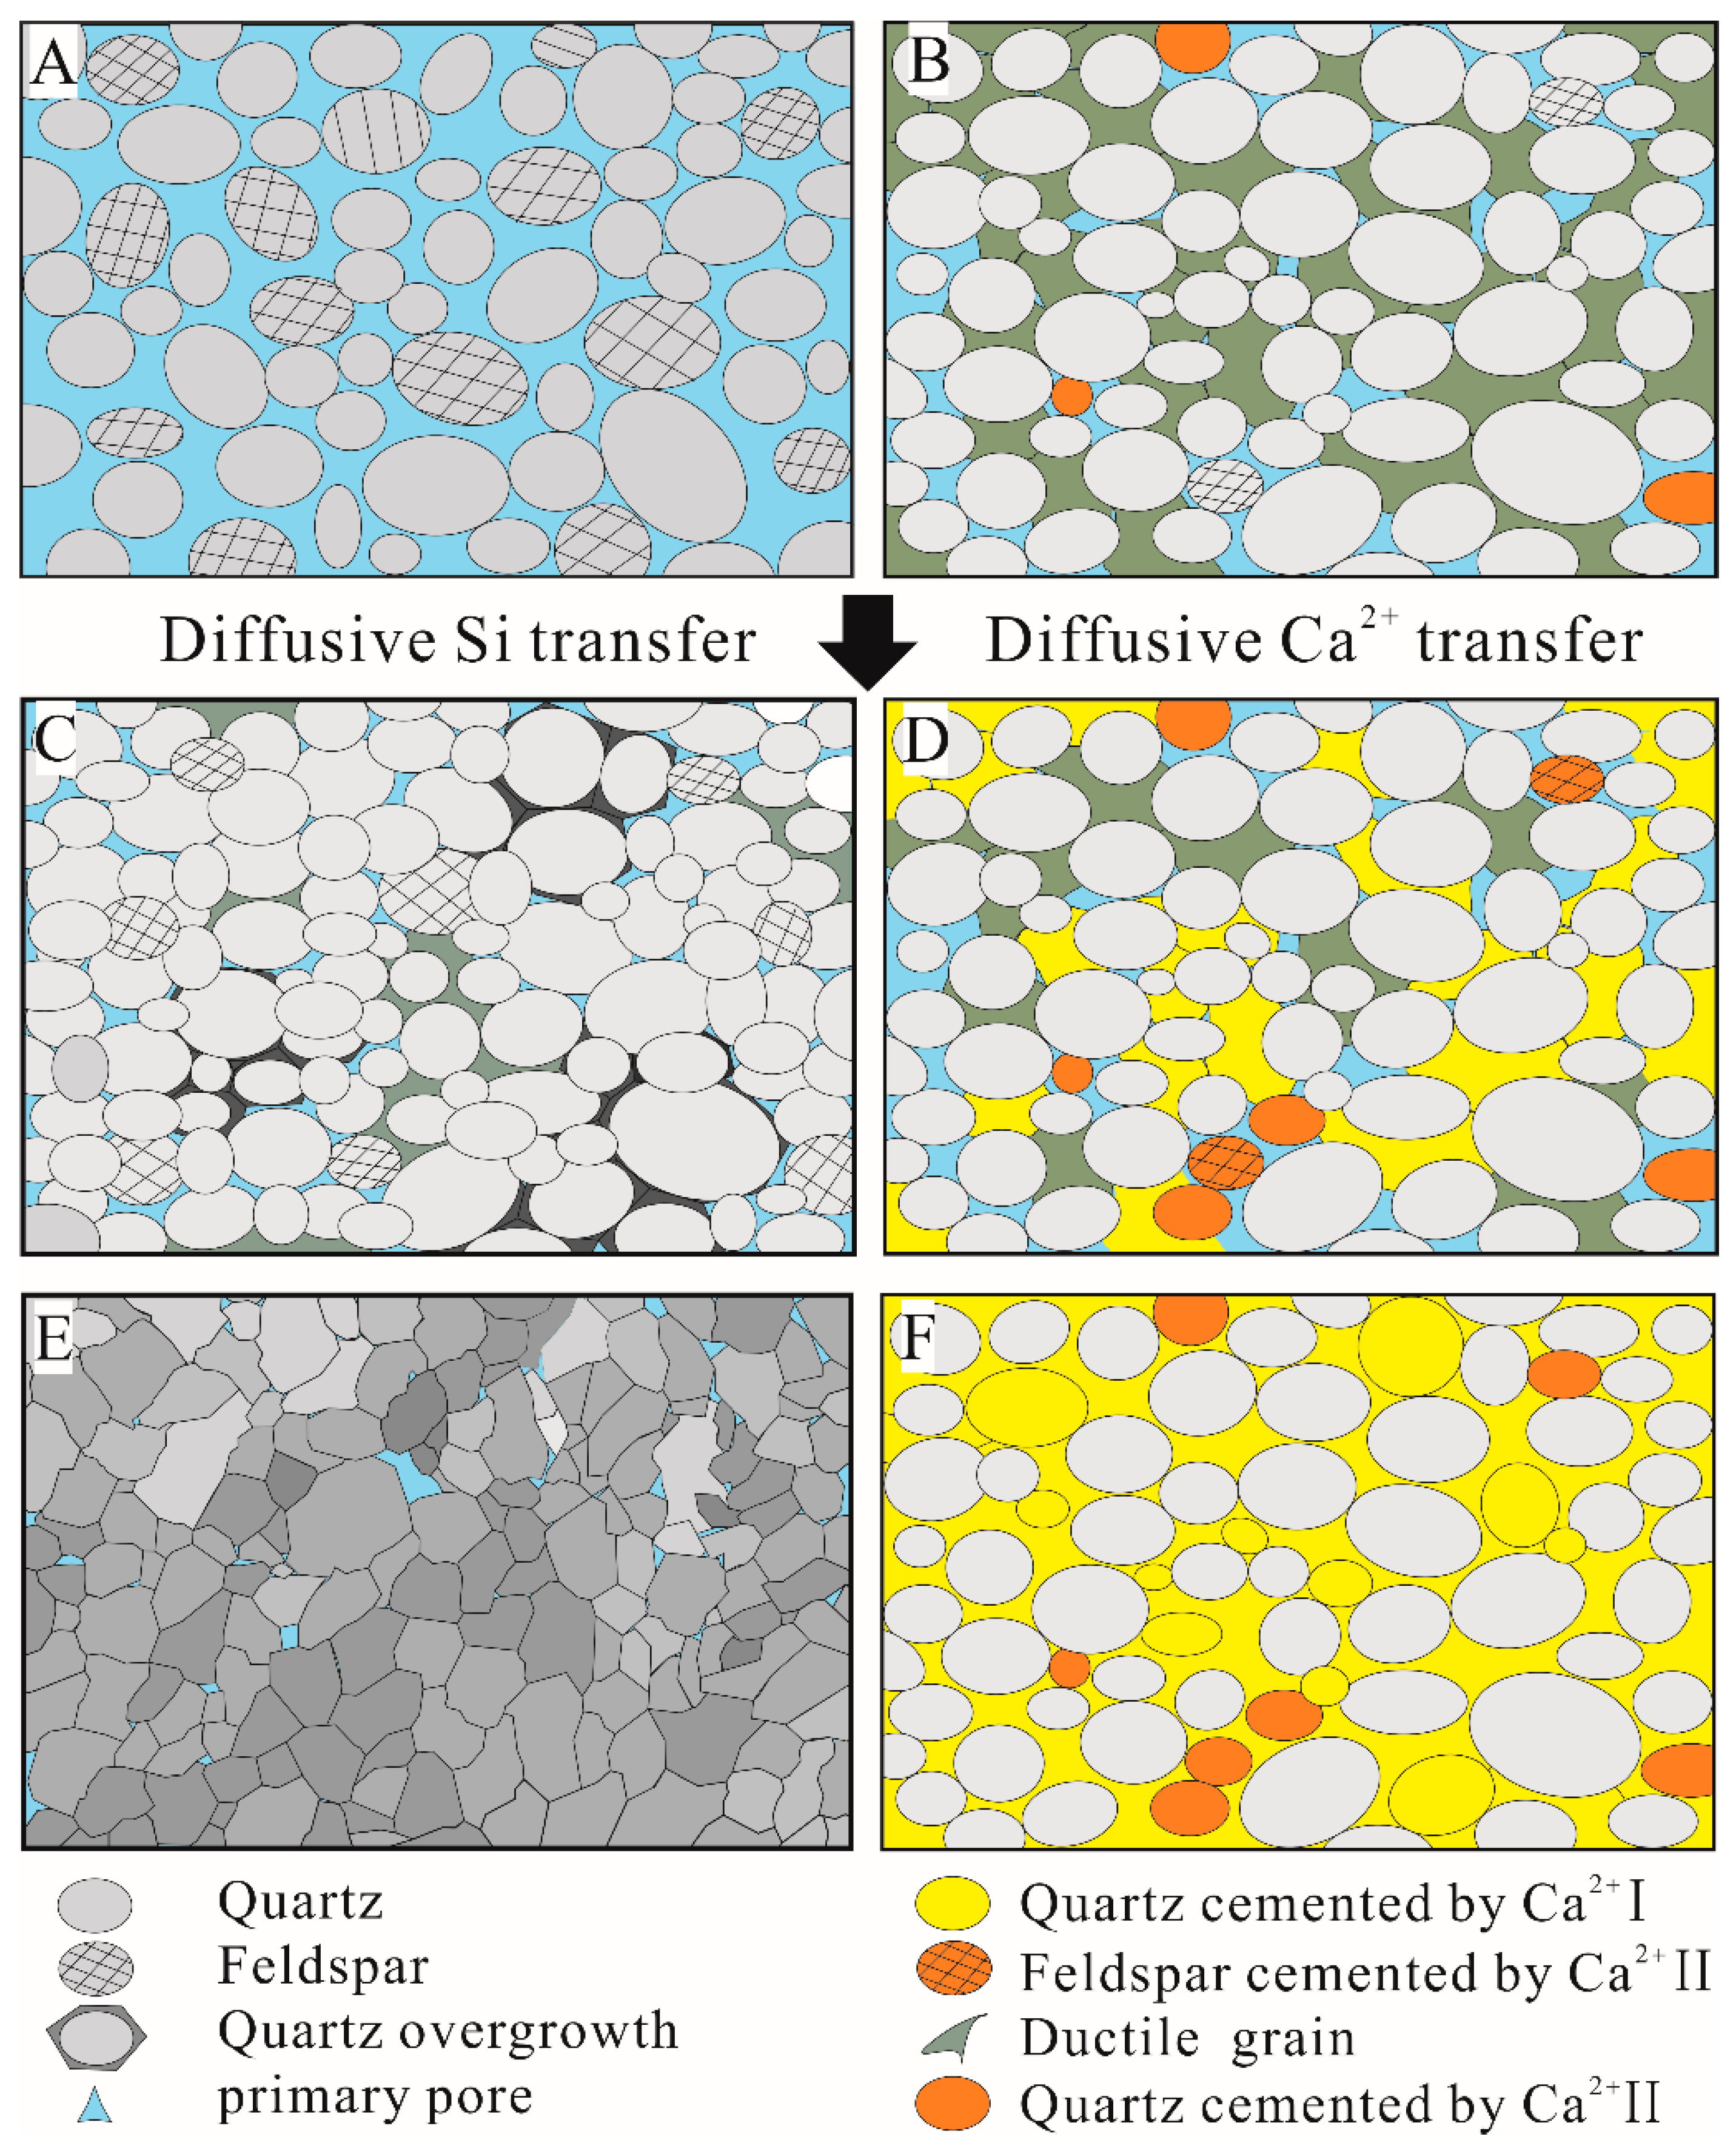
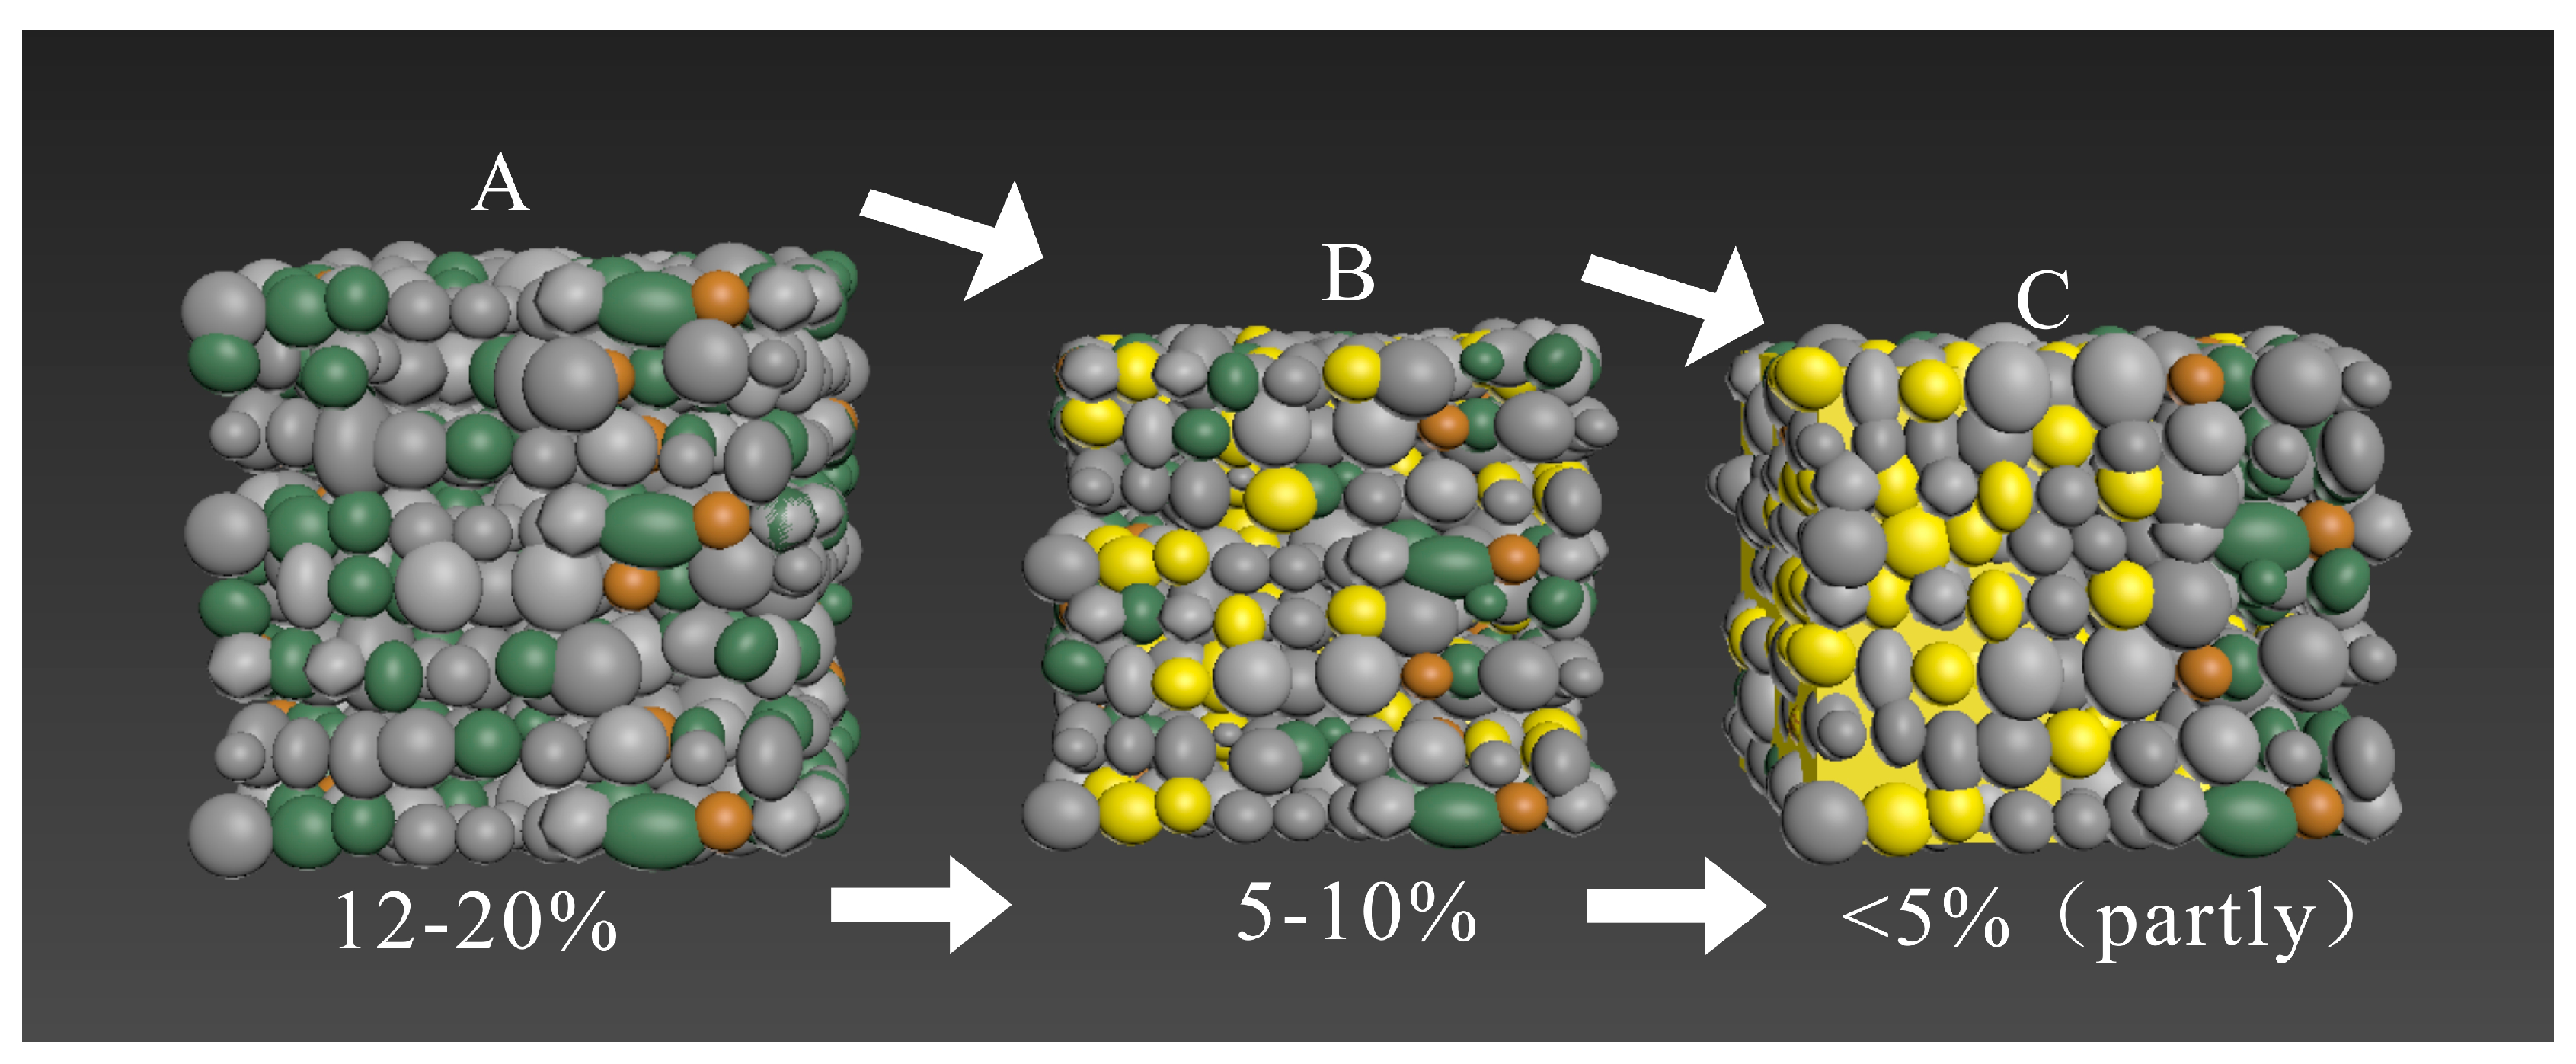
4.2.2. Formation Mechanism of Lithic Quartz Sandstone
Compared with quartz sandstone, the lithologic characteristics of the lithic quartz sandstone, which are different from that of the quartz sandstone reservoir, in the study area are relatively complex during the process of its compaction due to the rock fragments and heterogeneity contained within it. Similarly, based on SEM, cathodoluminescence and cast thin sections, the distribution characteristics of reservoir particle and cement growth characteristics of lithic quartz sandstone in the study area were observed and summarized. The densification of lithic quartz sandstone was divided into two modes. The first mode is the densification process A-B-C-E dominated by siliceous cementation (
Figure 8), and the other one is the calcium-dominated densification process A-B-D-F (
Figure 8).
Similar to the densification of quartz sandstone, the entire siliceous cementation is divided into four stages: primary sedimentation (
Figure 8A), early-middle diagenesis (
Figure 8B,C), and middle-late diagenesis (
Figure 8D). In
Figure 7A, the rock fragments are very developed and intercalated between the quartz particles, which are mainly supported by the matrices, with a primary porosity of 30–40%. When subjected to certain compaction, the rock fragments’ own wriggling behavior leads to its attachment to quartz grains in the form of false matrices. Based on this situation, when fluids of different properties in the formation are exchanged with rock fragments, two permeate streams will be formed, one for siliceous permeate and the other for calcareous percolation, which are discussed separately below.
The first one is the densification process dominated by siliceous cementation. The debris particles in the formation receive fluid dissolution, forming a large amount of Si
2+. A large amount of Si
2+ forms siliceous cement in the C-axis direction of the quartz particles, some of which are distributed with porphyritic texture (the black grey one in
Figure 6C). At this period, the content of rock fragments in the stratum is greatly reduced. Under the action of the subsequent fluid, the residual matrices and debris particles are basically replaced by siliceous, forming a reservoir similar to tight quartz sandstone. For the tight reservoir of lithic quartz dominated by siliceous fluids, the densification is characterized by the transformation of lithic quartz sandstone to quartz sandstone, and the formation mechanism of tight sandstone is similar to the quartz sandstone described above.
The second one is the densification process dominated by calcareous cementation. The formation is subjected to leaching of Ca
2+ fluid. Under the leaching of Ca
2+, many unstable mineral and particles such as rock fragments, matrices, and clay minerals in the formation are replaced by calcium cements, forming a “point-like” distribution of calcium cementation (
Figure 8D). This kind of “point” calcareous cementation can occur in any period after deposition, and many primary pores are filled with calcium, locally a band of calcium filling. If the fluid carrying a large amount of Ca
2+ is continuously leaching the formation, the lithic quartz sandstone will eventually form the pattern in
Figure 8F. The grains together with the matrix form a continuous crystalline calcium cement, and the primary pores are destroyed, leaving only some residual primary pores. This type of formation is very poor in physical properties and cannot serve as an effective tight sandstone reservoir.
Figure 9 is the 3D evaluation model of lithic quartz sandstone.
4.3. Influence Factors of Tight Sandstone Reservoir
There are three major types of physical factors affecting tight sandstone reservoirs: sedimentary, diagenetic, and post-diagenetic. The effects of particle size, siliceous cement content and chlorite film on reservoir physical properties are discussed.
4.3.1. Content of Siliceous Cement
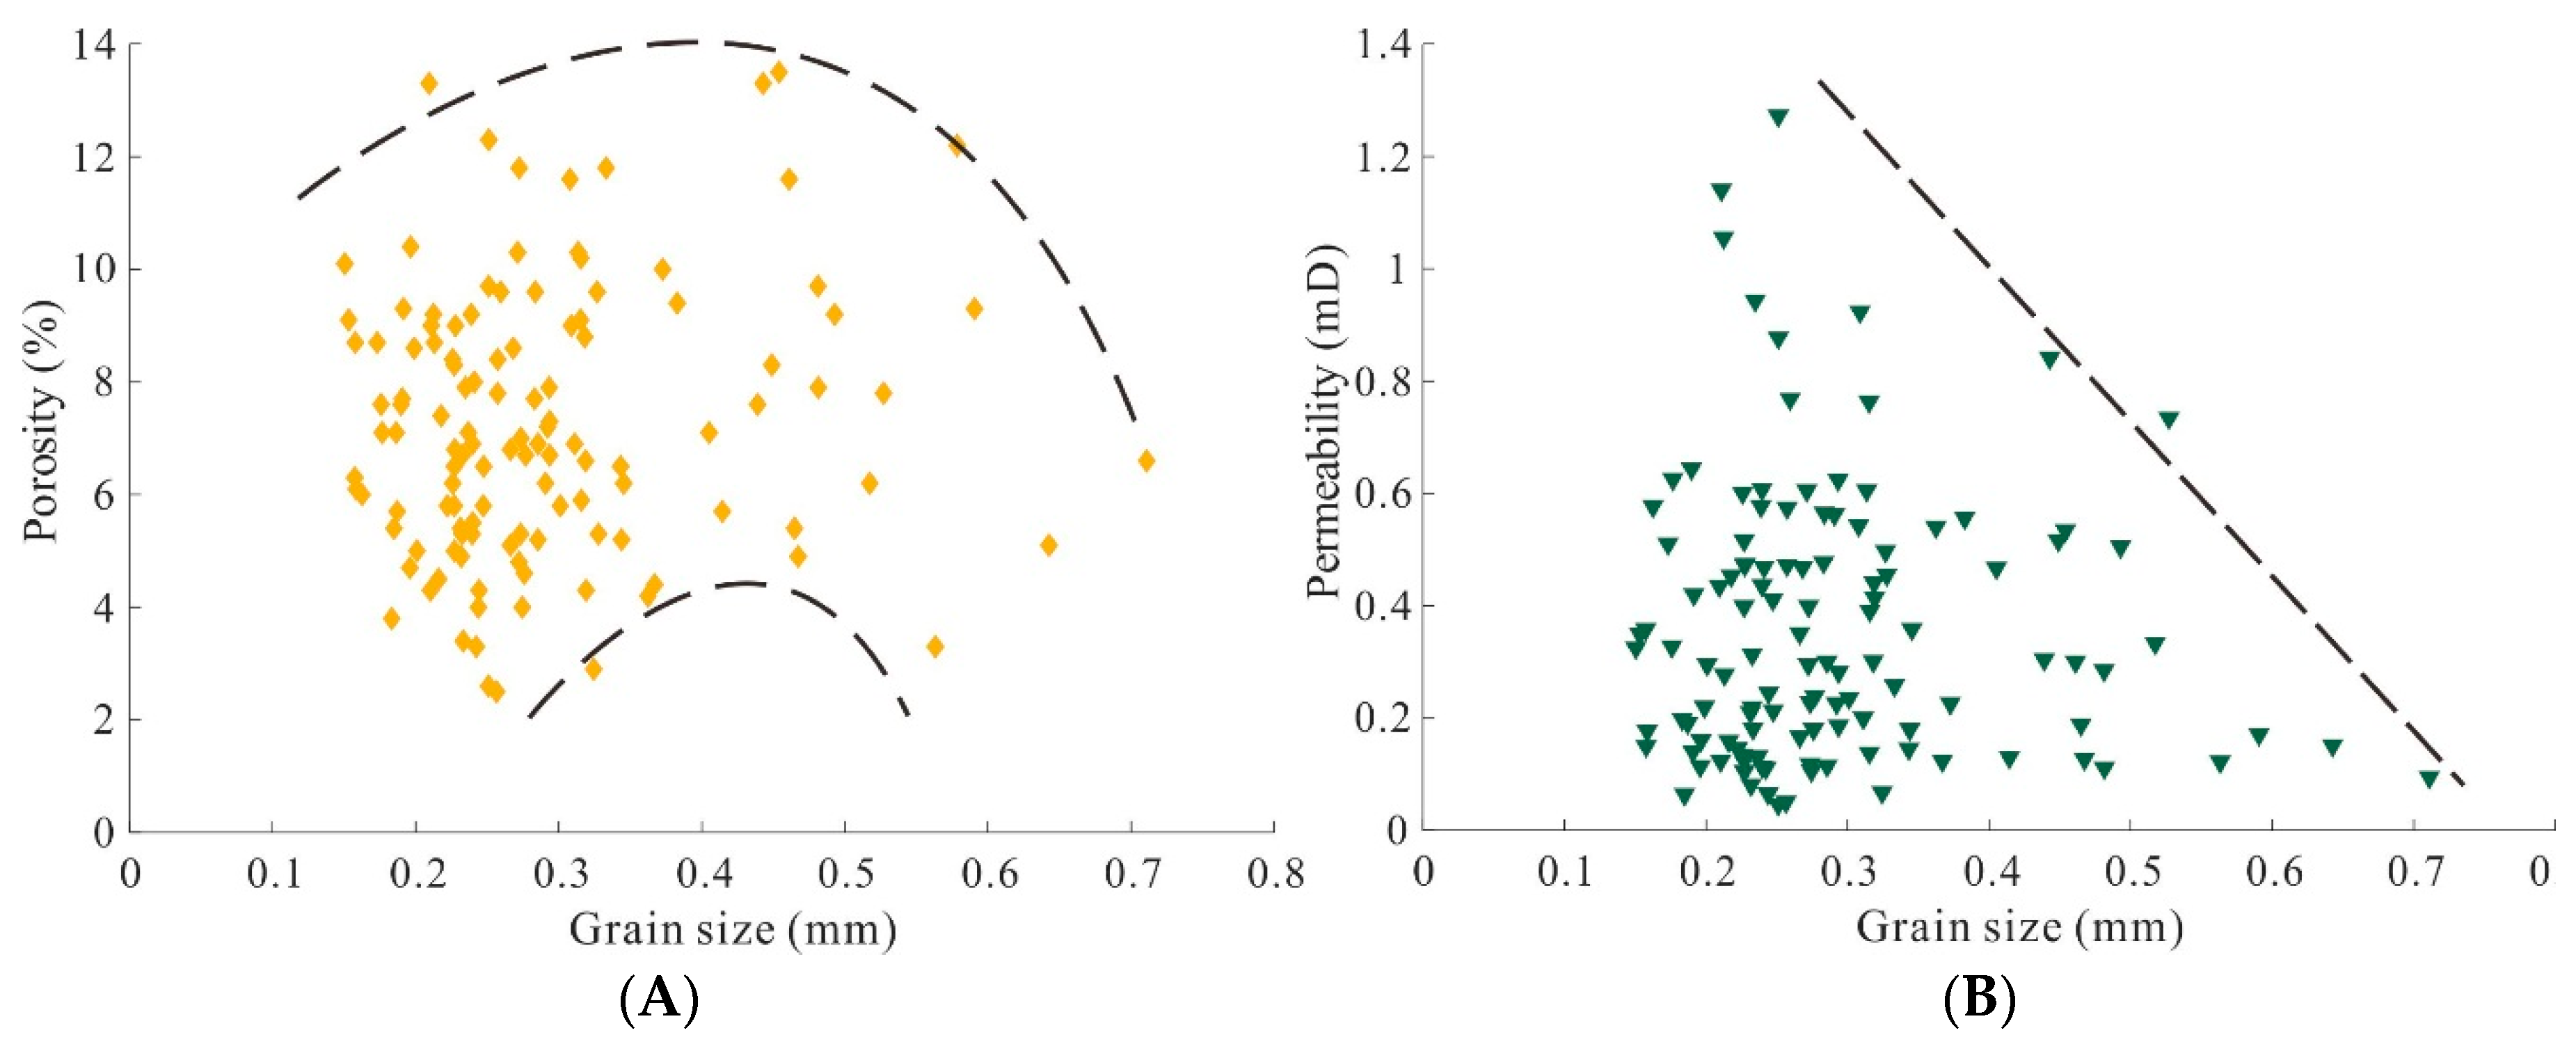
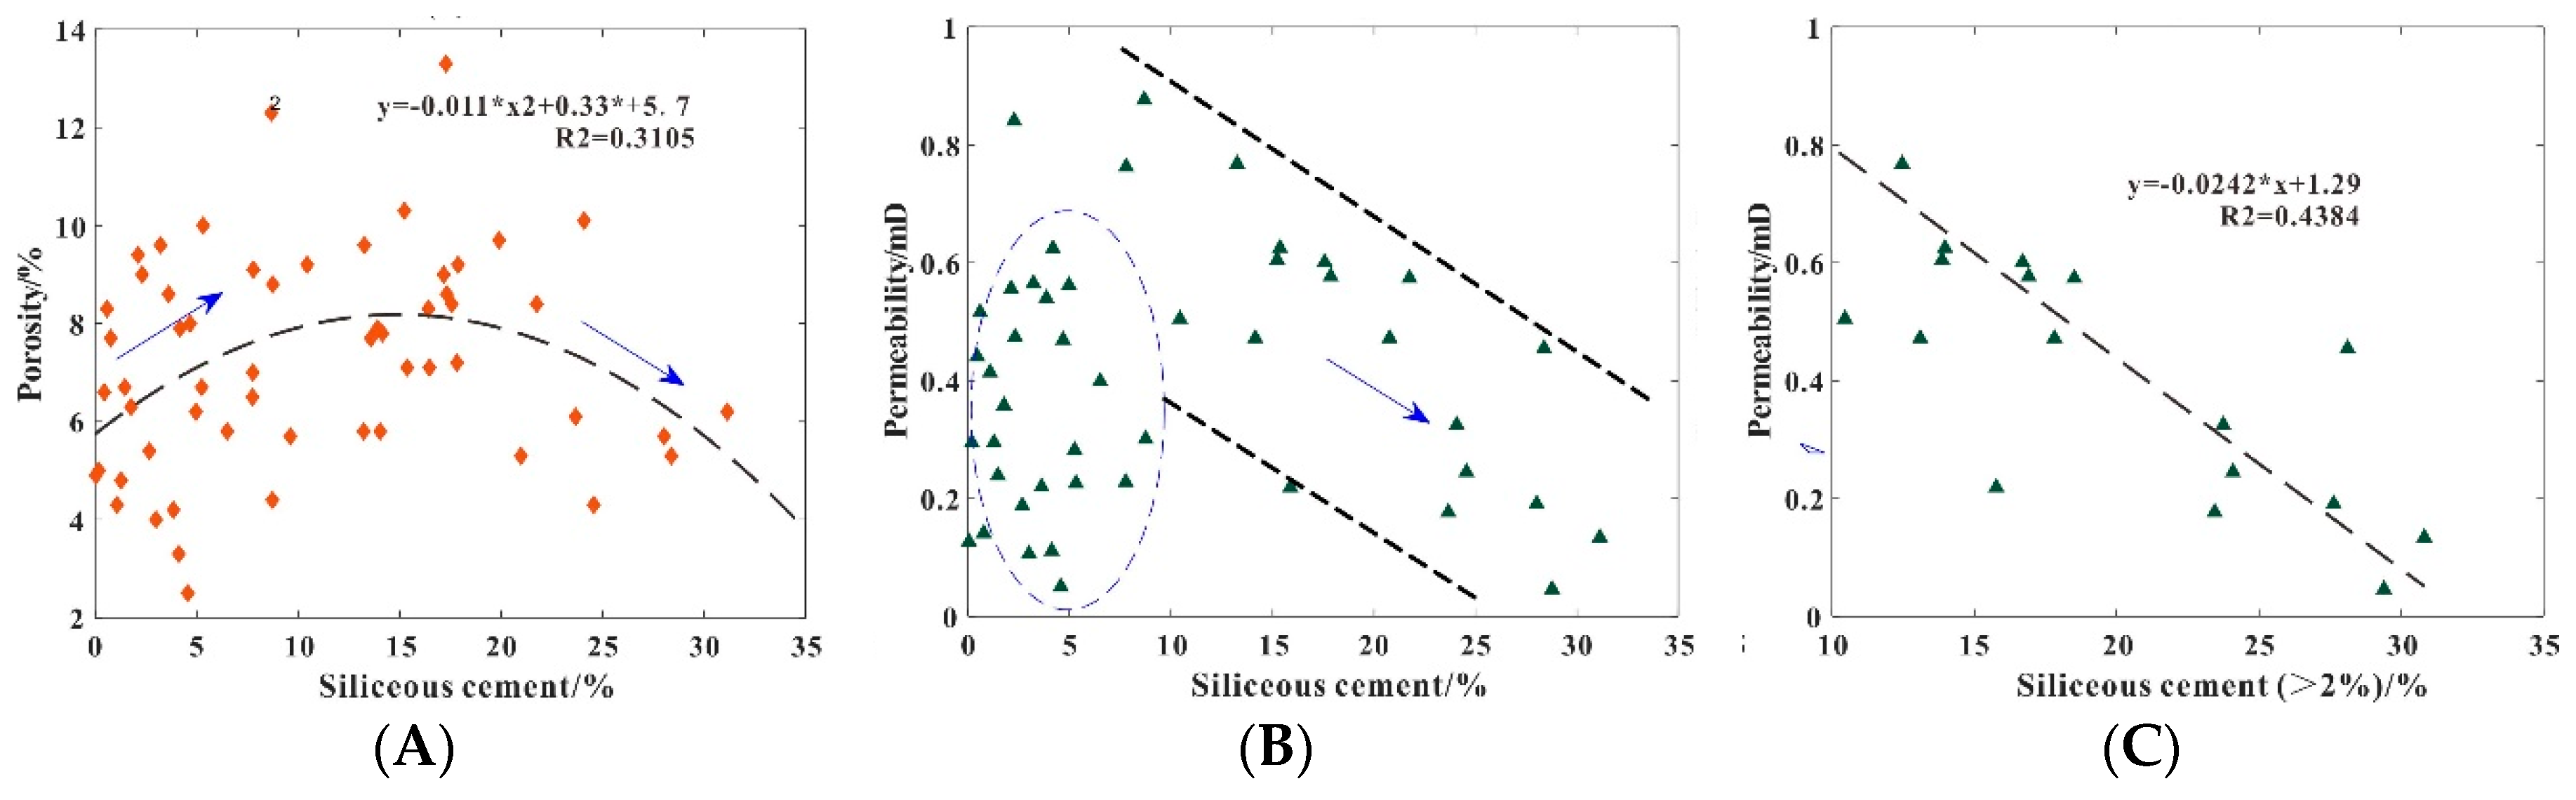
During the densification process of quartz sandstone, the characteristics of different siliceous cements have various kinds of effects on the physical properties of the reservoir. The pore distribution and physical properties of the reservoir are also affected by the contents of different siliceous cements. In this study, the relationship between the content of quartz sandstone cements and the permeability of reservoir in the study area was statistically determined by counting points 20 × 20 in every thin section. The average value of cements content was calculated from 4 thin sections of each sample, and the relationship diagram was established with the porosity and permeability of the reservoir in the study area (
Figure 10).
The
Figure 10A shows the relationship between the content of siliceous cement and the porosity of the reservoir. It can be clearly seen that when the content of siliceous cement is less than 15%, the porosity increases with the increasing of the content of cement. Compared with the situation of cements less than 10%, the porosity of tight sandstone decreases with increasing siliceous cements as the fitting curve shows. This phenomenon is mainly influenced by the second siliceous cementation, during which quartz constantly grew to a hexagonal dipyramid crystal. In this regard, at the beginning, as content increases, the siliceous cement which distributed as porphyritic texture greatly increases the reservoir compression resistance, so that many intergranular pores remain between the quartz particles. However, as the cementation continues to deepen, the quartz particles return to the original hexagonal dipyramid crystal, and the arrangement between the particles becomes tight. The intergranular pores originally reserved between the particles are also filled by the siliceous cements, which eventually leads to the continuous decrease of the reservoir pores. The
Figure 10B shows the relationship of reservoir permeability and siliceous cements. For the permeability of the reservoir, when the content of siliceous cement in the local stratum is less than 10%, the permeability of the reservoir is distributed from 0 to 0.6 mD (
Figure 10B). This stage is the early stage of diagenesis, when the clay minerals in the stratum are developed with few conversions to siliceous cement. The main factor affecting the permeability is the content of clay minerals just like porosity. However, as the diagenesis continues to intensify, the clay minerals gradually transform into siliceous cements, and the main affecting factor is siliceous cements between grains. Thus, Siliceous cements (the content more than 10%) are separated from all the data as
Figure 10C shows. When the siliceous cements developed from rounding particles to a hexagonal dipyramid crystal, the permeability decreases with the increasing content of siliceous cements as the fitting curve shows. Most of the intergranular pores would be filled with siliceous cements during this stage. Although the siliceous cements attached to the particles retains a certain number of intergranular pores, it would hinder the penetration of the fluid. Eventually, the permeability decreases as the siliceous cement increases. The pattern diagram is shown in
Figure 11.
Based on the different petrological characteristics of quartz sandstone and lithic quartz sandstone, the following will be discussed separately. In
Figure 11A–C, is the evolution process of primary intergranular pores and quartz cement in quartz sandstone. When the content of siliceous cement is small, many primary intergranular pores remain between the intergranular pores (
Figure 11B). However, as the cement continues to develop, the intergranular pores are continuously filled by the cement, resulting in a continuous decrease in porosity. At the same time, since the permeability in the formation mainly depends on the development of pore-throat, the development of the siliceous cement will preferentially develop in the C-axis direction of the particles where the particles contact, and that is the position of pore-throat. Thus, with the increasing of cements, many pore-throats are filled with siliceous cement and the formation permeability is continuously reduced. Correspondingly,
Figure 11D–F is the primary pore evolution of lithic quartz sandstone. As the depth of the stratum increases, the diagenesis continues to improve and the siliceous cement increases. The rock fragments originally retained between the particles form false matrices under the compaction, filling the primary pores. On the one hand, a large amount of primary porosity is filled with siliceous cement, and on the other hand, the remaining debris will also fill the primary intergranular pores in the form of pseudo-hybrids, so the physical properties of lithic quartz sandstone are reduced at each stage compared to quartz sandstone.
4.3.2. Grain Size
Based on the thin sections of samples, the particle size was calculated by counting points of 20 × 20. The results were taken from the average of the four thin sections and the relationship with the porosity of the reservoir was established in
Figure 12.
In the left picture, there is no obvious law of scatter distribution, which shows that there is no obvious linear relationship between reservoir particle size and permeability, and the particle range is mainly concentrated in 0.18–0.6 mm. The porosity ranges from 2% to 14%, In the right figure, when the reservoir particle size is less than 0.35 mm, there is no obvious scatter relationship of grain size and permeability when the particle size is larger than 0.35 mm,
Figure 12B shows a non-linear trend that the permeability of the tight sandstone decreases continuously with the increase of the particle size, but there is no obvious linear relationship in the range of the particle size below 0.35 mm. As the law of crystal growth pointed out by Berger the growth content of crystals increases with the increasing grain size of the crystal at a same volume [
17]. For the quartz grains, the grains with large grain size would develop more siliceous cements than the fine ones. Therefore, when the reservoir particle size is low, the intergranular pores with more siliceous contents are greatly developed than the larger particles. When different degrees of siliceous cement are developed, the porosity is distributed from low to high as well as permeability. However, as the particle size continues to increase, the reservoir space will continue to increase, and the quartz particles will have enough space to crystallize. As discussed above, as the siliceous cement increases, the reservoir will preserve a certain number of intergranular pores, so the porosity will increase (the particle size ranges from 0.35 to 0.5 mm). However, the permeability will decrease as the siliceous cement continues to increase, and thus the above situation is formed.
4.3.3. Influences of Clay Mineral Rim on Tight Sandstone
M.D Wilson (1992) proposed the term “inherited clay rims” to describe coats of detrital clay on framework particles in which the clay was present on the grains before they reach the deposition location after transport [
33]. Many studies have shown that mineral films such as chlorite film or illite film provide a protective mechanism for the reservoir’s primary intergranular pores, meanwhile, inhibiting siliceous cementation [
34].
Most scholars mainly focus on conventional reservoirs [
35,
36]. To investigate the relationship between siliceous cementation and chlorite film in tight sandstone, the characteristics of chlorite films developed in the study area were observed based on SEM images. Similarly, since quartz sandstone and lithic quartz sandstone have different petrological characteristics, two lithologies are explored separately.
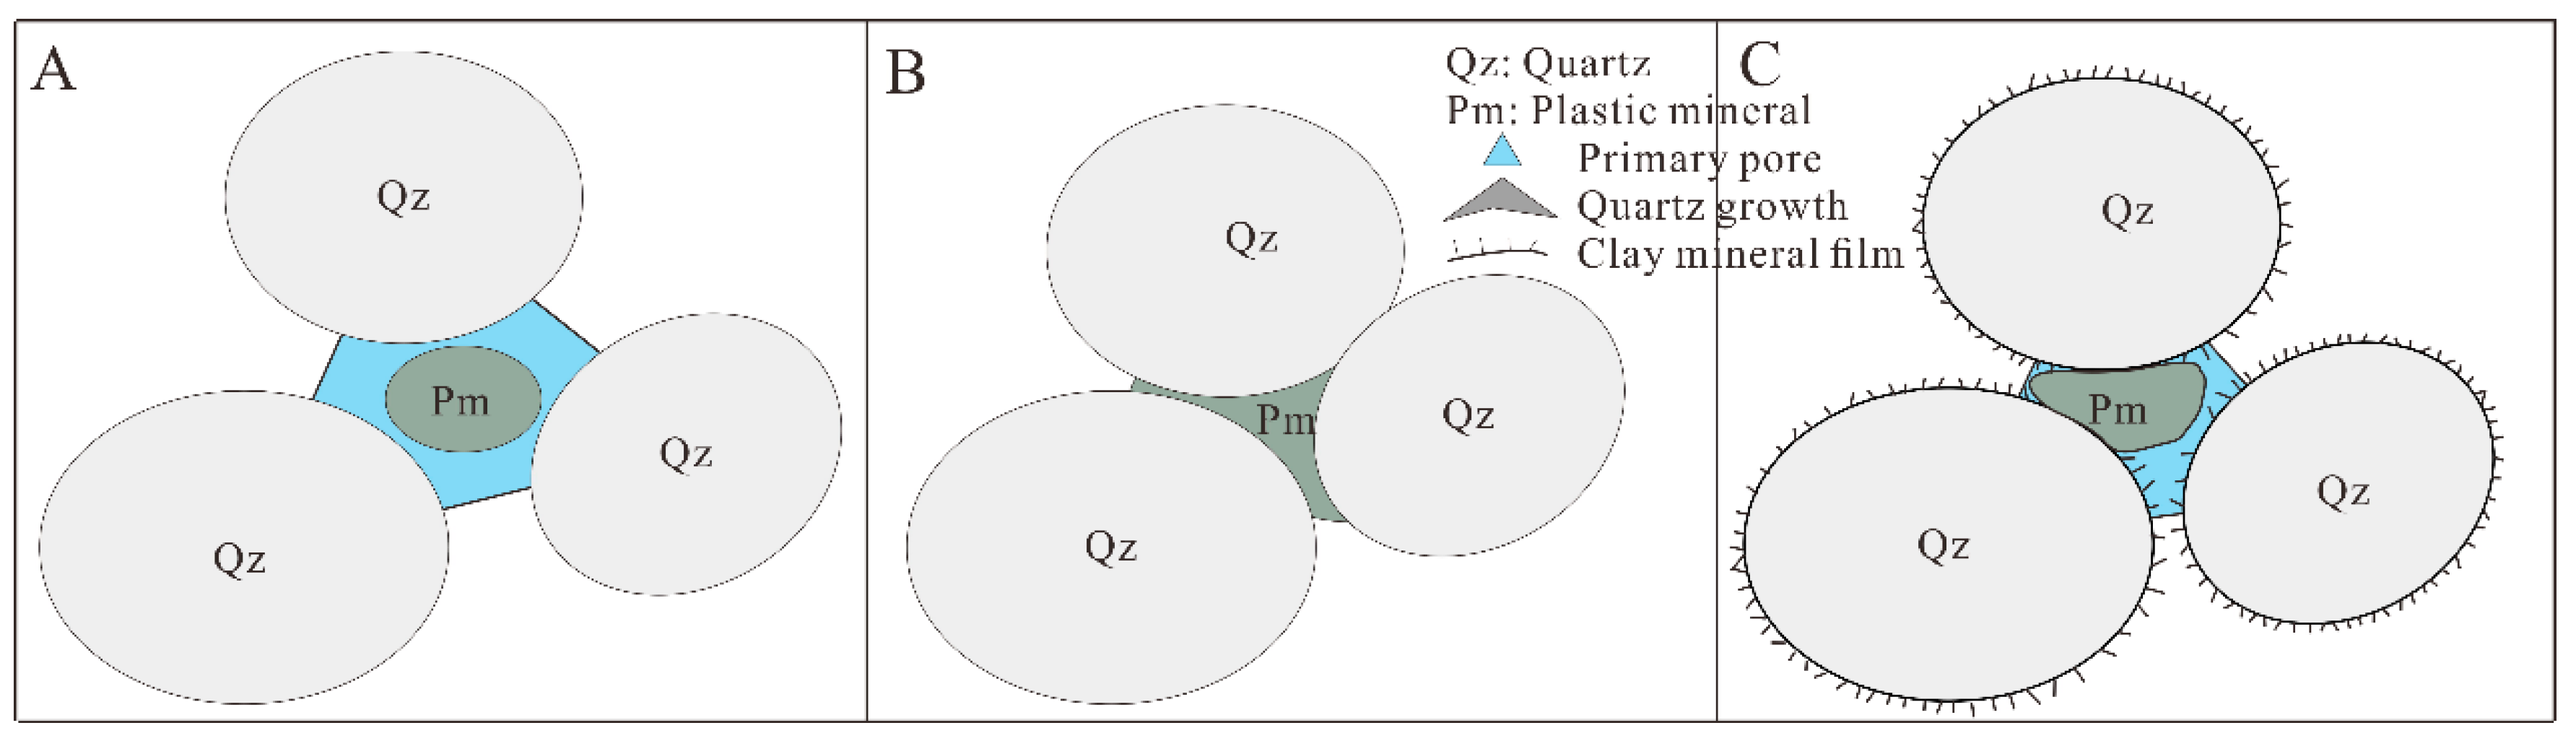
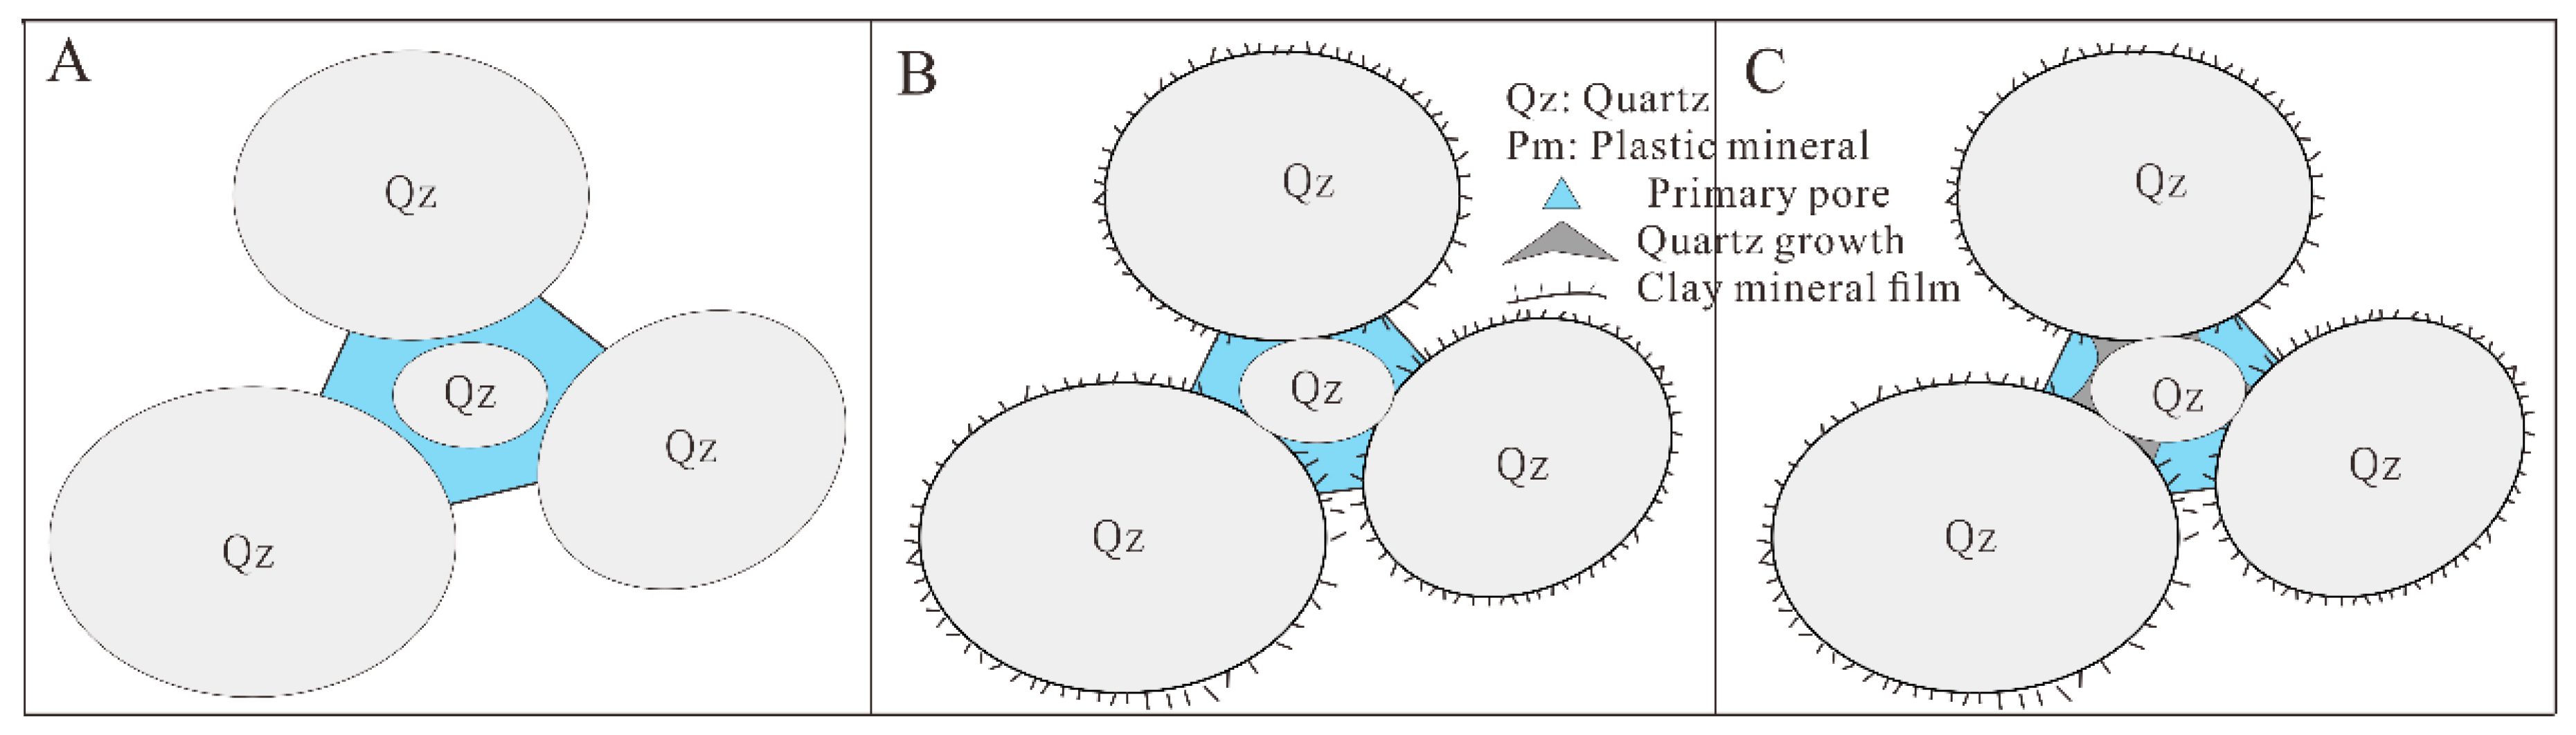
In
Figure 13A–C are the intergranular siliceous growth mechanism of the tight quartz sandstones, which also corresponds to the cementation state of the above quartz grains from deposition to hexagonal dipyramid crystal, and the primary porosity keeps decreasing. In the figure, when the quartz sandstone particles are in the B–C state, quartz are in point-to-line contact with strong compression resistance. Meanwhile, a certain number of primary intergranular pores are retented, and the reservoir at this situation has very good physical properties. When the clay mineral film is developed in the formation (
Figure 13A–C), due to the unstable active energy and chemical energy limitation, the siliceous cement cannot grow on the grains, and the siliceous material can only be developed where the intergranular particles are in contact. The siliceous cement slowly increases outwards, while retaining a certain number of primary pores. This is the mechanism by which tight quartz sandstones that develop clay mineral films can preserve a certain number of primary pores.
Compared with the reservoir-forming mechanism of quartz sandstone reservoirs with clay mineral films, the lithic quartz sandstones have different reservoir formation mechanisms due to the presence of more debris particles in the formation.
Figure 14A,B is a stratum of undeveloped clay mineral film. In addition, under compaction, the false matrices formed by rock fragments fills the primary pores, as a result, he porosity is greatly reduced. On the contrary, In
Figure 6A–C, particle develops clay mineral film. Because the mechanical properties of the rock fragments are weak, after a certain compaction, deformation will occur. Therefore, as the depth of burial increases, the compaction of the formation will continue to improve, and the final residual primary porosity will be filled by matrices. In the early-meddle diagenetic stage, after the formation particles are subjected to a certain compaction effect, the particles are in point-line contact. At this time, the siliceous cements will develop in the position where particles contact each other so that some primary porosity will be retented by the siliceous cements and clay mineral together. However, with the increasing of compaction and cementation, the residual primary pores will be destroyed just like the situation in
Figure 11F.
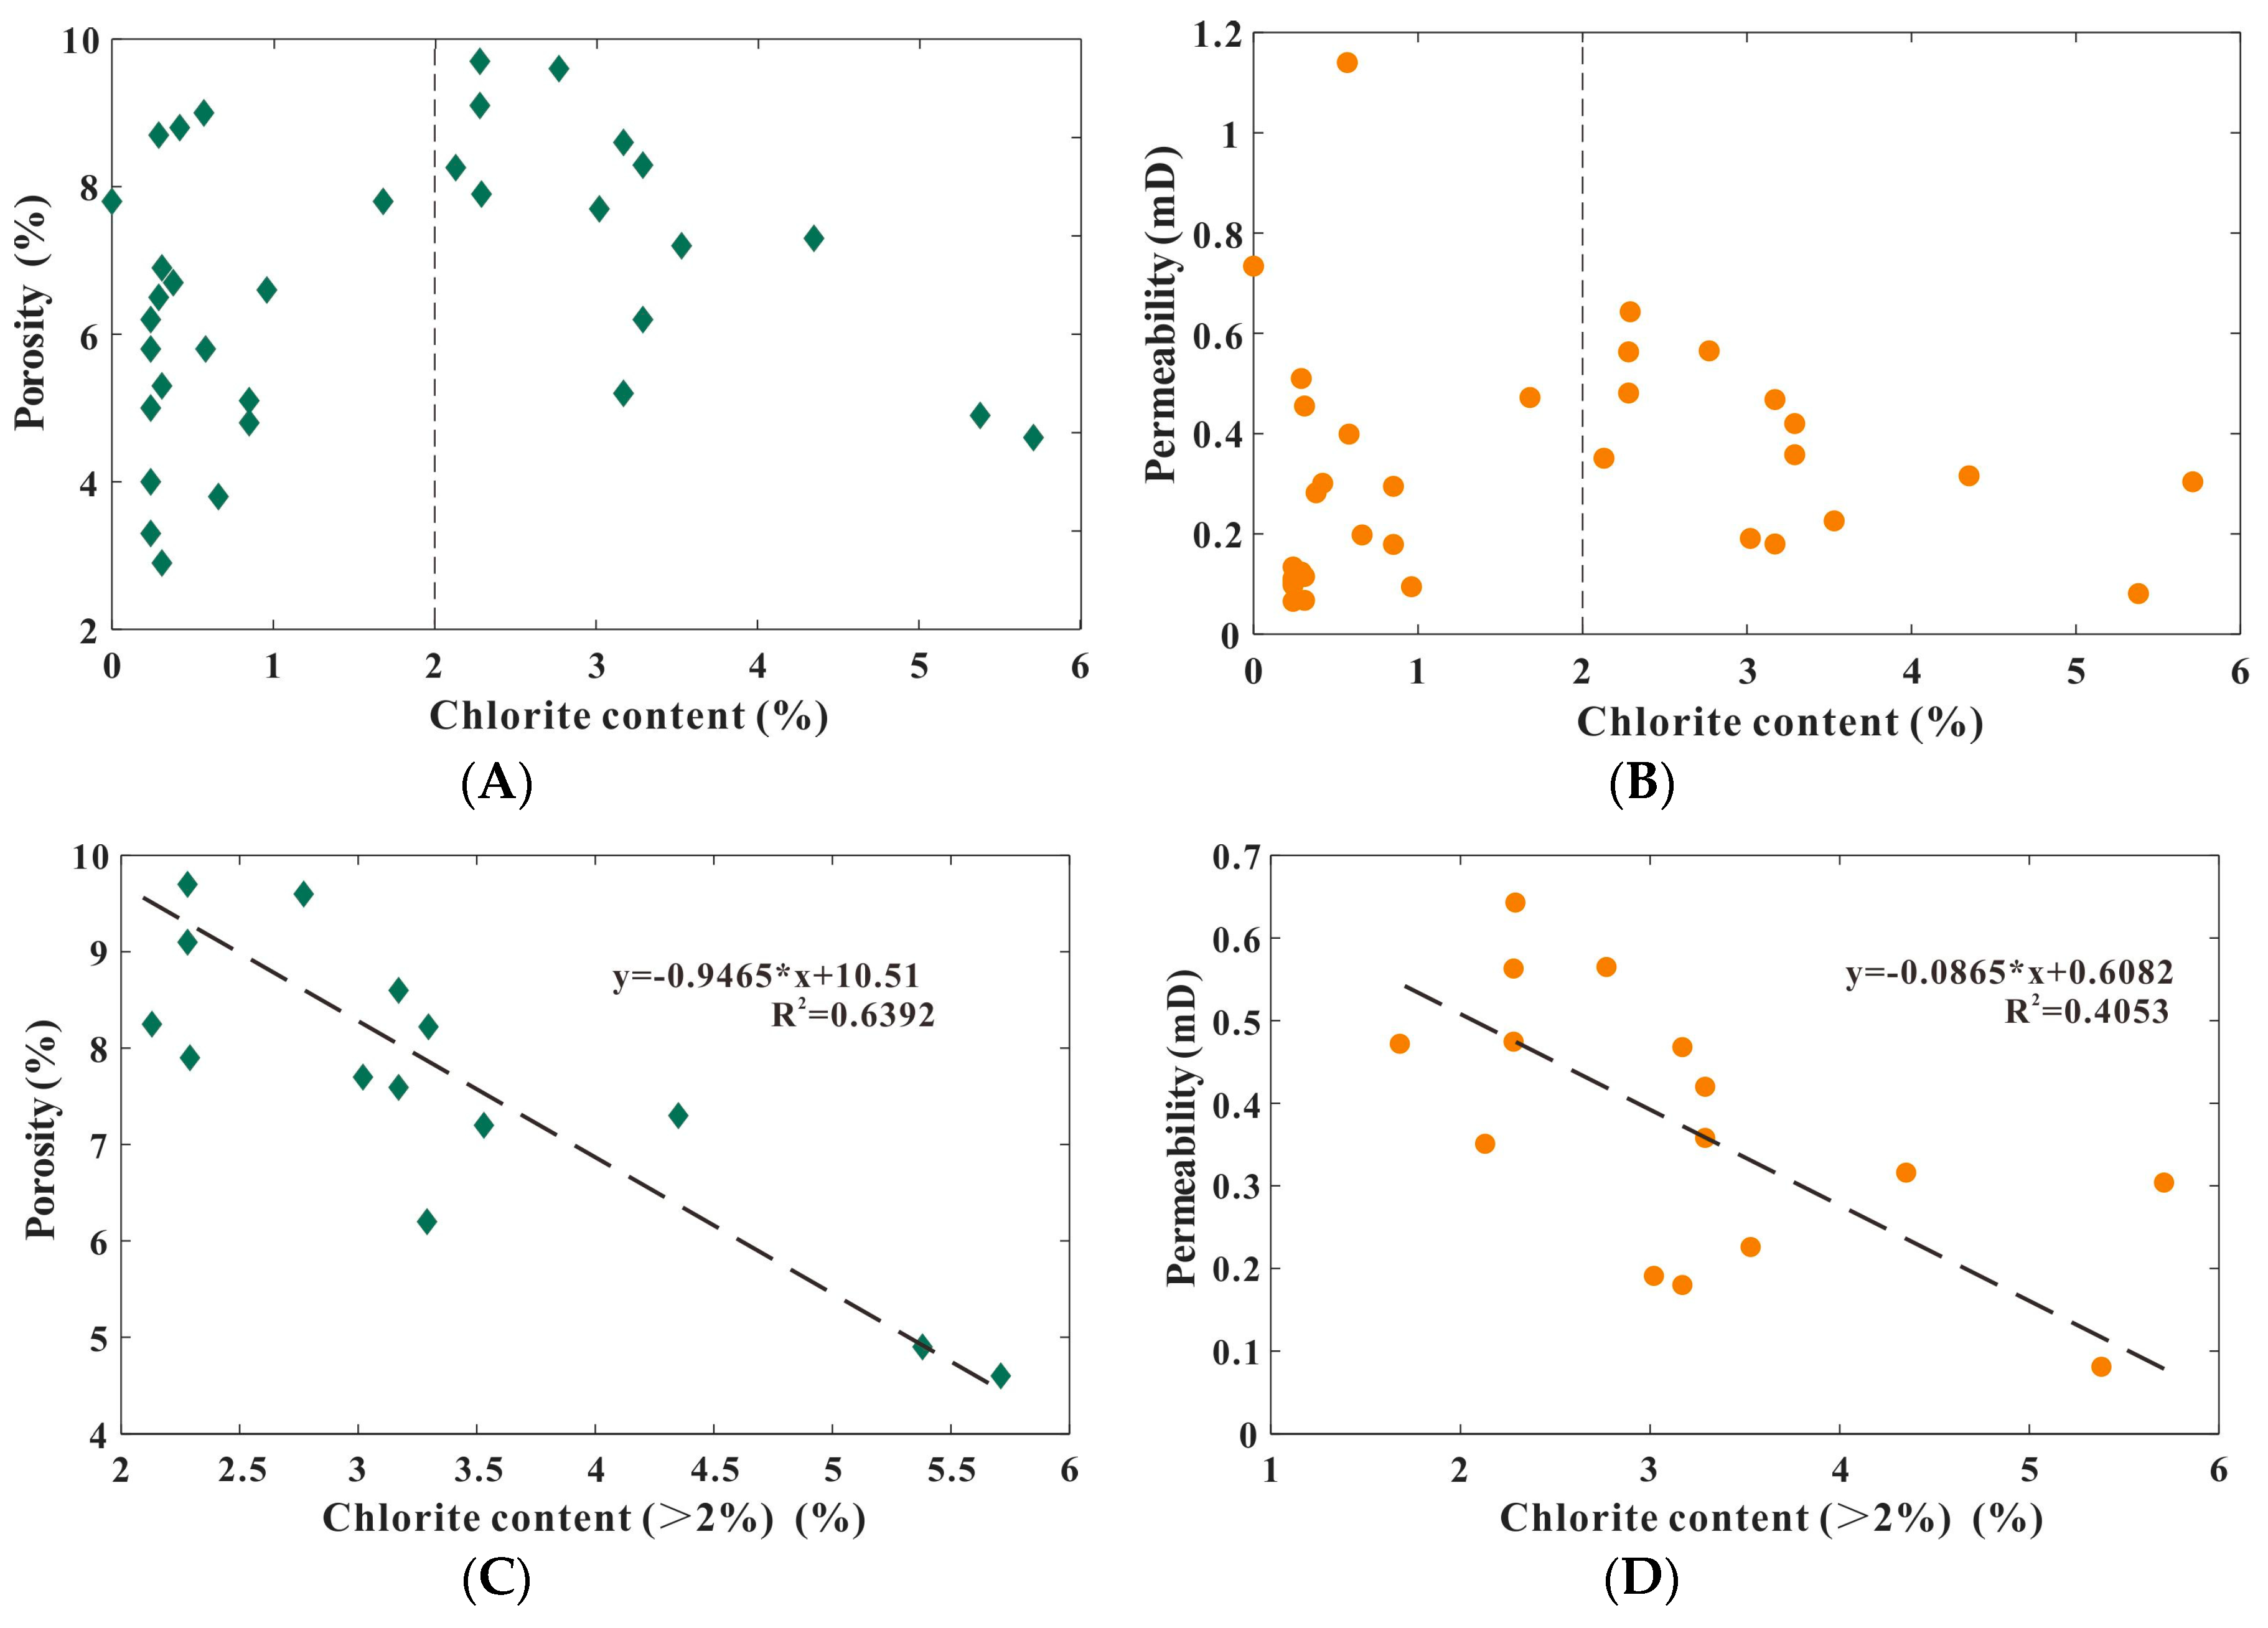
At the same time, by means of observing for chlorite, the existing form of chlorite in the study area is mainly composed of particles film. Therefore, the content of chlorite obtained by X-ray diffraction analysis is the content of chlorite film. The relation plots between chlorite content analyzed with X-ray diffraction analysis and Porosity or Permeability are established below (
Figure 15).
Both scatter plots (
Figure 15A,B) show a similar linear relationship. When the chlorite content is less than 2%, the porosity and permeability distributed at random as in
Figure 10. The main reason is that the siliceous cements is related to the content of chlorite. With the increasing diagenesis, most of the chlorite are reacting with fluids to siliceous cements. When the chlorite content is higher than 2%, the porosity and permeability of samples are distributed from low to high, and when the content is higher than 2%, the porosity and permeability of the formation decrease with increasing content. In this regard, the chlorite content in the formation will decrease with the diagenesis, which continuously transform into siliceous cements. Therefore, as the chlorite content decreases with the formation, the siliceous content continues to increase. The primary porosity in the strata is retained by siliceous cements and chlorite films, but the stratum is in the middle diagenetic period, and the porosity and permeability are affected by siliceous distribution and petrological characteristics, with the range from low to high. Therefore, in the early-middle diagenesis period, the chlorite film has a certain constructive effect on the reservoir.
5. Conclusions
The entire quartz crystallization in tight sandstone is divided into two parts. The first part is the process in which the weathered and rounded particles in the formation are restored to the hexagonal dipyramid crystal by siliceous cementation. The second part is the process of coaxial growth that the hexagonal dipyramid crystal continues to increase with the form of micro-quartz film. The densification of sandstone is a process of divergence and convergence. All kinds of rock fragments, minerals, matrices, and clay minerals are dissolved or converted into siliceous cements. Finally, only quartz, the most stable mineral, is left in the formation.
The highest-quality tight sandstone reservoir in the study area is in the first stage of siliceous cementation with the cement content of 10–15% and particles size of 0.2–0.3 mm. The relatively high-quality reservoir is the section grains with a clay mineral film and a siliceous cement content of 5–12%. When the content of siliceous cement is less than 15%, the porosity increases with the increasing of the content of cement. At more than 20%, the porosity decreases with increasing, and the reservoir porosity is highest when the cement content is 15–20%.

