Article

Investigating Influential Factors of the Gas Absorption Capacity in Shale Reservoirs Using Integrated Petrophysical, Mineralogical and Geochemical Experiments: A Case Study

1
State Key Laboratory of Petroleum Resources and Prospecting, China University of Petroleum, Beijing 102249, China
2
College of Geosciences, China University of Petroleum, Beijing 102249, China
3
School of Geosciences, China University of Petroleum (Huadong), Qingdao 266580, China
4
Laboratory for Marine Mineral Resources, Qingdao National Laboratory for Marine Science and Technology, Qingdao 266071, China
5
Hubei Subsurface Multi-Scale Imaging Key Laboratory, Institute of Geophysics and Geomatics, China University of Geosciences, Wuhan 430074, China
*
Author to whom correspondence should be addressed.
Energies 2018, 11(11), 3078; https://doi.org/10.3390/en11113078
Submission received: 17 August 2018 / Revised: 31 October 2018 / Accepted: 2 November 2018 / Published: 8 November 2018
(This article belongs to the Special Issue Flow and Transport Properties of Unconventional Reservoirs 2018)

Abstract

:
Estimating in situ gas content is very important for the effective exploration of shale gas reservoirs. However, it is difficult to choose the sensitive geological and geophysical parameters during the modeling process, since the controlling factors for the abundance of gas volumes are often unknown and hard to determine. Integrated interdisciplinary experiments (involving petrophysical, mineralogical, geochemical and petrological aspects) were conducted to search for the influential factors of the adsorbed gas volume in marine gas shale reservoirs. The results showed that in shale reservoirs with high maturity and high organic content that the adsorbed gas volume increases, with an increase in the contents of organic matter and quartz, but with a decrease in clay volume. The relationship between the adsorbed gas content and the total porosity is unclear, but a strong relationship between the proportions of different pores is observed. In general, the larger the percentage of micropores, the higher the adsorbed gas content. The result is illuminating, since it may help us to choose suitable parameters for the estimation of shale gas content.

1. Introduction

The role of shale gas is becoming increasingly important nowadays due to the large consumption and shortage of conventional resources, and due to technological advances in oil and gas development. However, it is still challenging to estimate the gas contents of the reservoir condition since the occurrence mechanism of the shale gas reservoir is far more difficult than in conventional reservoirs. It is reported that the adsorbed gas volume accounts for more than 50% of the total gas in the pore system [1,2,3,4]. Therefore, investigating the influential and controlling factors of the adsorbed gas is significant for shale gas reservoir characterization.
Literature data have shown that gas absorption capacity is influenced by many factors, including geochemical parameters, such as the total organic matter content (TOC), kerogen types, as well as thermal maturity [1,2,5,6], pore volume and pore size distribution [1,7], petrological and mineralogical factors [8,9], and environmental factors such as the buried temperature and pressure.
Although some researchers observed that absorption capacity decreases with the increase of the TOC [10], it is generally accepted that organic matter is the primary control factor in the adsorbed gas volume and is positively correlated with the TOC [11,12,13,14]. In addition, the adsorbed gas volume increases with the confining pressure, whereas it decreases inversely to the temperature [9,15,16,17]. The relationship of the adsorbed gas volume to the porosity, pore size, specific surface area and mineralogical parameters are far more complex. In general, micropores represent the controlling factors for gas adsorption and storage, where the adsorption quantity increases with an increase in micro-porosity. The main reason for this is that the internal surface area and the adsorption energy of the small pores is higher than the large pores [1,6,7,18]. Nevertheless, recent reports revealed that the mesopores and macropores are also good places for methane adsorption [10,14,19], and some observed a negative correlation between the adsorbed gas volume and the porosity [13].
Various methods were proposed to investigate the influential factors of the adsorbed gas volume, most of which were independent and dispersed, and the adsorption theory and behavior are not fully understood. Hence, some relationships were established empirically, and are of local use only. Furthermore, some studies focused only on a small aspect of the influential factors, which may lead to incorrect results.
In this paper, we designed a comprehensive experiment to measure the petrophysical, petrological, mineralogical, geochemical and gas adsorption parameters. These experiments included petrophysical measurements such as porosity and permeability, pore structure measurements such as low field nuclear magnetic resonance (NMR) and carbon dioxide (CO2)/nitrogen (N2) adsorption experiments, geochemical measurements, such as vitrinite reflectance, pyrolysis and residual analysis, petrological analysis, such as X-ray diffraction (XRD), thin section, scanning electron microscope (SEM), and isothermal adsorption measurement. The main objective is to explore the influential and controlling factors of the gas adsorption capacity.

2. Materials and Methods

2.1. Materials

We collected 22 shale samples from the lower Cambrian Formation of Southern China. The reservoir is a typical marine shale gas reservoir in China, and most of the pore spaces are filled with methane. As seen in Figure 1, there are black shales, with ultralow porosity and permeability. Petrophysical, geochemical, mineralogical and pore structure examinations were carried out for all samples.

2.2. Petrophysical Measurements

Before the measurements, cylinder samples which were 2.5 cm in diameter and 3–5 cm in length were heated at a temperature of 100 °C, with the aim of washing out the drilling muds, light hydrocarbon, free water, and capillary bound water. In the following, the helium porosity and permeability were obtained using the AP-608 automated permeameter-porosimeter (Coretest Systems, Inc., Reno, NV, USA). Next, the water was injected into the samples by an auto-saturator container with a confining pressure of 20 MPa to ensure that the water saturation of each sample was 100%. The low field NMR relaxation data was collected at this state using the MesoMR23-060H, with a main frequency of approximately 21.3 MHz. Compared with conventional instruments which have a main frequency of approximately 2 MHz, the dead time was reduced to 0.01 ms and the minimal echo time was reduced to 0.06 ms, through the automatic field locking and high order shimming system that was used to improve the performance of the magnetic field. Conventional Carr-Purcell-Meiboom-Gill (CPMG) pulse sequences and the Butler-Reeds-Dawson (BRD) algorithm were adopted to activate and invert the relaxation signals [20].

2.3. Low Pressure N2 Adsorption and MIP Experiments

The low pressure nitrogen gas adsorption technique, combined with the BJH (Barret-Joyner-Halenda) model was used to obtain the pore diameter distribution and specific surface area. We used cylinder core samples, aiming to keep the original pore structure in its native state during measurement. All tests and analysis were performed with the QuadraSorb SI (Quantachrome Instruments, Boynton Beach, FL, USA) and the accessional software QuadraWin version 5.04. Prior to measurement, these samples were degassed under a vacuum at 200 °C for 12 h. Then, the degassed samples were exposed to N2 at a temperature of −196 °C for the experiments. In addition, Mercury intrusion porosimetry (MIP) analysis was performed by the Micrometrics Autopore TM IV 9505 (Micromeritics Instruments Corporation, Norcross, GA, USA) and the maximal pressure was 200 MPa. MIP tests were performed in the last procedure. The low pressure N2 adsorption experiments were carried out by the CNPC key well logging laboratory. To reach the pressure equilibrium during the N2 adsorption, the time for each pressure point was more than 2 h, until the pressure variation was less than 0.003 MPa in 10 min.

2.4. Geochemical and Mineralogical Examinations

We conducted the geochemical and mineralogical experiments using the drilling cuttings at the same depth. High pressure methane adsorption isotherm experiments were carried out for samples that were crushed and dried, using the gravimetric sorption analyzer IsoSORP® that was manufactured by Rubotherm, Germany, in order to obtain the adsorbed gas volume. Before the experiments, the samples were pretreated to powders with size ranges from 20 to 40 meshes, then dried and vacuumed to remove the remaining water and unpurified gas. We used methane as the adsorbed gas. We collected 12 pressure points for every measurement. TOC and vitrinite reflectance (Ro), as well as the Backscatter electron (BSE) images were also obtained. The experimental details are elaborated in our previous publication [21].

3. Results and Discussions

3.1. Gas Adsorption Volume Correction

Figure 2a shows a typical isothermal adsorption data of one shale sample. The black dots represent the adsorbed gas content at different pressures. The data can be divided into three sections. The first section occurs at the low pressure range (with a pressure lower than 5 MPa), where the adsorbed gas content increases linearly with the pressure. The second section occurs at the medium pressure range (with pressure from 5 MPa to 15 MPa), where the adsorbed content increases smoothly and reaches the equilibrium state. The third section emerges in the high pressure range (with a pressure larger than 15 MPa), where the adsorbed content decreases with the pressure. The phenomenon mentioned above is termed as excess adsorption [22]. It is an essential characteristic of the supercritical fluid [23], which often appears in the high pressure range. The red line in Figure 2a shows the fitting results of the conventional Langmuir model. Obviously, the two-parameter Langmuir isotherm equation failed to characterize the adsorption characteristic precisely.
In this study, we adopt the published method to correct the effect of the excess adsorption [22,24,25], which is expressed as:
V i = V L P i P L + P i ( 1 ρ g , i ρ a )  
where V i and ρ g , i are the adsorbed gas content in m3/t and the gas density in g/cm3 with the corresponding equilibrium pressure Pi; ρ a is the density of the adsorbed phase in g/cm3, VL is the Langmuir volume in m3/t, and PL is the Langmuir pressure in MPa.
As shown in Figure 2b, the blue line represents the fitting result of the improved model, and the red dots represent gas density values at different pressures. The fitting result is improved greatly using this model. The computed Langmuir volume is required to correct to the reservoir condition, however. Based on the Langmuir equation, the adsorbed gas volume at the reservoir pressure can be expressed as:
V r = V L P r P L + P r
where Vr is the adsorbed gas volume.
The temperature correction equation is expressed as:
V r c = V r × 10 c ( T e T r )  
where V r c is adsorbed gas volume after temperature correction, T e and T r are temperatures for experiments and reservoir condition, respectively, and c is the calibration factor. In this study, the temperature effect can be omitted since there is a slight difference between the experimental temperature and the reservoir temperature.

3.2. Pore Structure Characterization

We make full use of the pore size evaluation methods to characterize the pore structure and their distributions completely. Figure 3a,b shows the thin section and secondary electron SEM measurements of one shale sample. Due to the low resolution it is difficult to discriminate and quantify the pore information. Figure 3c gives the BSE of the same sample. In comparison, the pore morphology is cleared provided and can be characterized with image processing methods. However, the SEM cannot represent the full pore information due to the high heterogeneity of shale samples. Figure 3d–f shows the corresponding MIP, LPGA (low pressure gas adsorption) and NMR results. The pore size obtained from the MIP and LPGA results are unimodal distributed and the mainstream pore throat radius is nanoscale, which is accordance with the BSE result. However, the NMR T2 spectrum is bimodal, revealing a higher resolution of the pore size distribution. Assuming the pore geometry is cylindrical, we can obtain the surface-relaxivity parameter as in Reference [26]:
ρ 2 = r L P G A 2 T 2  
where ρ 2 is the surface-relaxivity parameter in μm/s, r L P G A and T 2 are pore radius in μm and transversal relaxation time in ms, respectively, which can be obtained by LPGA and NMR experiments, respectively.
The scaling factor between the pore throat radius obtained by MIP and the T2 by NMR experiments can be can be expressed as:
C = r M I P T 2  
where C is the scaling factor and r M I P is the pore throat radius from the MIP experiments.
Relationships among transversal relaxation time and pore radius obtained from different methods are far more intricate, and sometimes they are difficult to convert using simple equations. In this study, ρ 2 and C can be approximately obtained using the simple peak method, where they are 3.56 μm/s and 5.42 μm/s, respectively. It was also observed that the first peak of the T2 spectrum was symmetrical, whereas the pore radius distribution obtained by LPGA was asymmetrical. The intrinsic mechanism is unknown. This may due to the limitation of N2, which suits the rock with mesopores (2–50 nm) and fails to characterize other pores [27]. Using the multi-Gaussian fitting technology [28] and the scaling factors, the T2 spectrum can be transformed to the pseudo-pore radius distribution. In this study, the cutoff value for different pore types is 2.5 ms, and the corresponding pore radius is similar to the cutoff value of clay bound pore. Using ρ 2 as 3.56 μm/s, the corresponding pore radius can be computed as 17.8 nm. If we use the C as 5.42 μm/s, the pore radius can be computed as 13.55 nm. This comparison shows that both measurements and transformations include minor errors. Therefore, the T2 cutoff value is fixed as 2.5 ms.

3.3. Effects of Geochemical Properties

As shown in Figure 4a, there is a clear positive linear relationship between the adsorbed gas content and the TOC. This was contributed to by the development of small pores in the kerogen, which are very likely to adsorb methane. The correlation of the adsorbed gas content to Ro is not obvious. However, there exists a significant negative correlation between the volume of adsorbed gas and the maximum pyrolysis temperature (Tmax). The possible cause may be that as the pyrolysis temperature increases, the shale maturity increases and the original pores in the rock are occupied by asphaltenes or generated oil and gas, increasing the difficulty of the gas diffusing into pores, as well as reducing the adsorbed gas content. Moreover, we also observed that the volume of adsorbed gas was negatively correlated with the production index (PI). The PI is defined as S1/(S1 + S2), where S1 is adsorbed free liquid hydrocarbons and S2 represents the residual petroleum potential. This indicates that the adsorbed and free hydrocarbon bears a competitive relationship in reservoir pores.

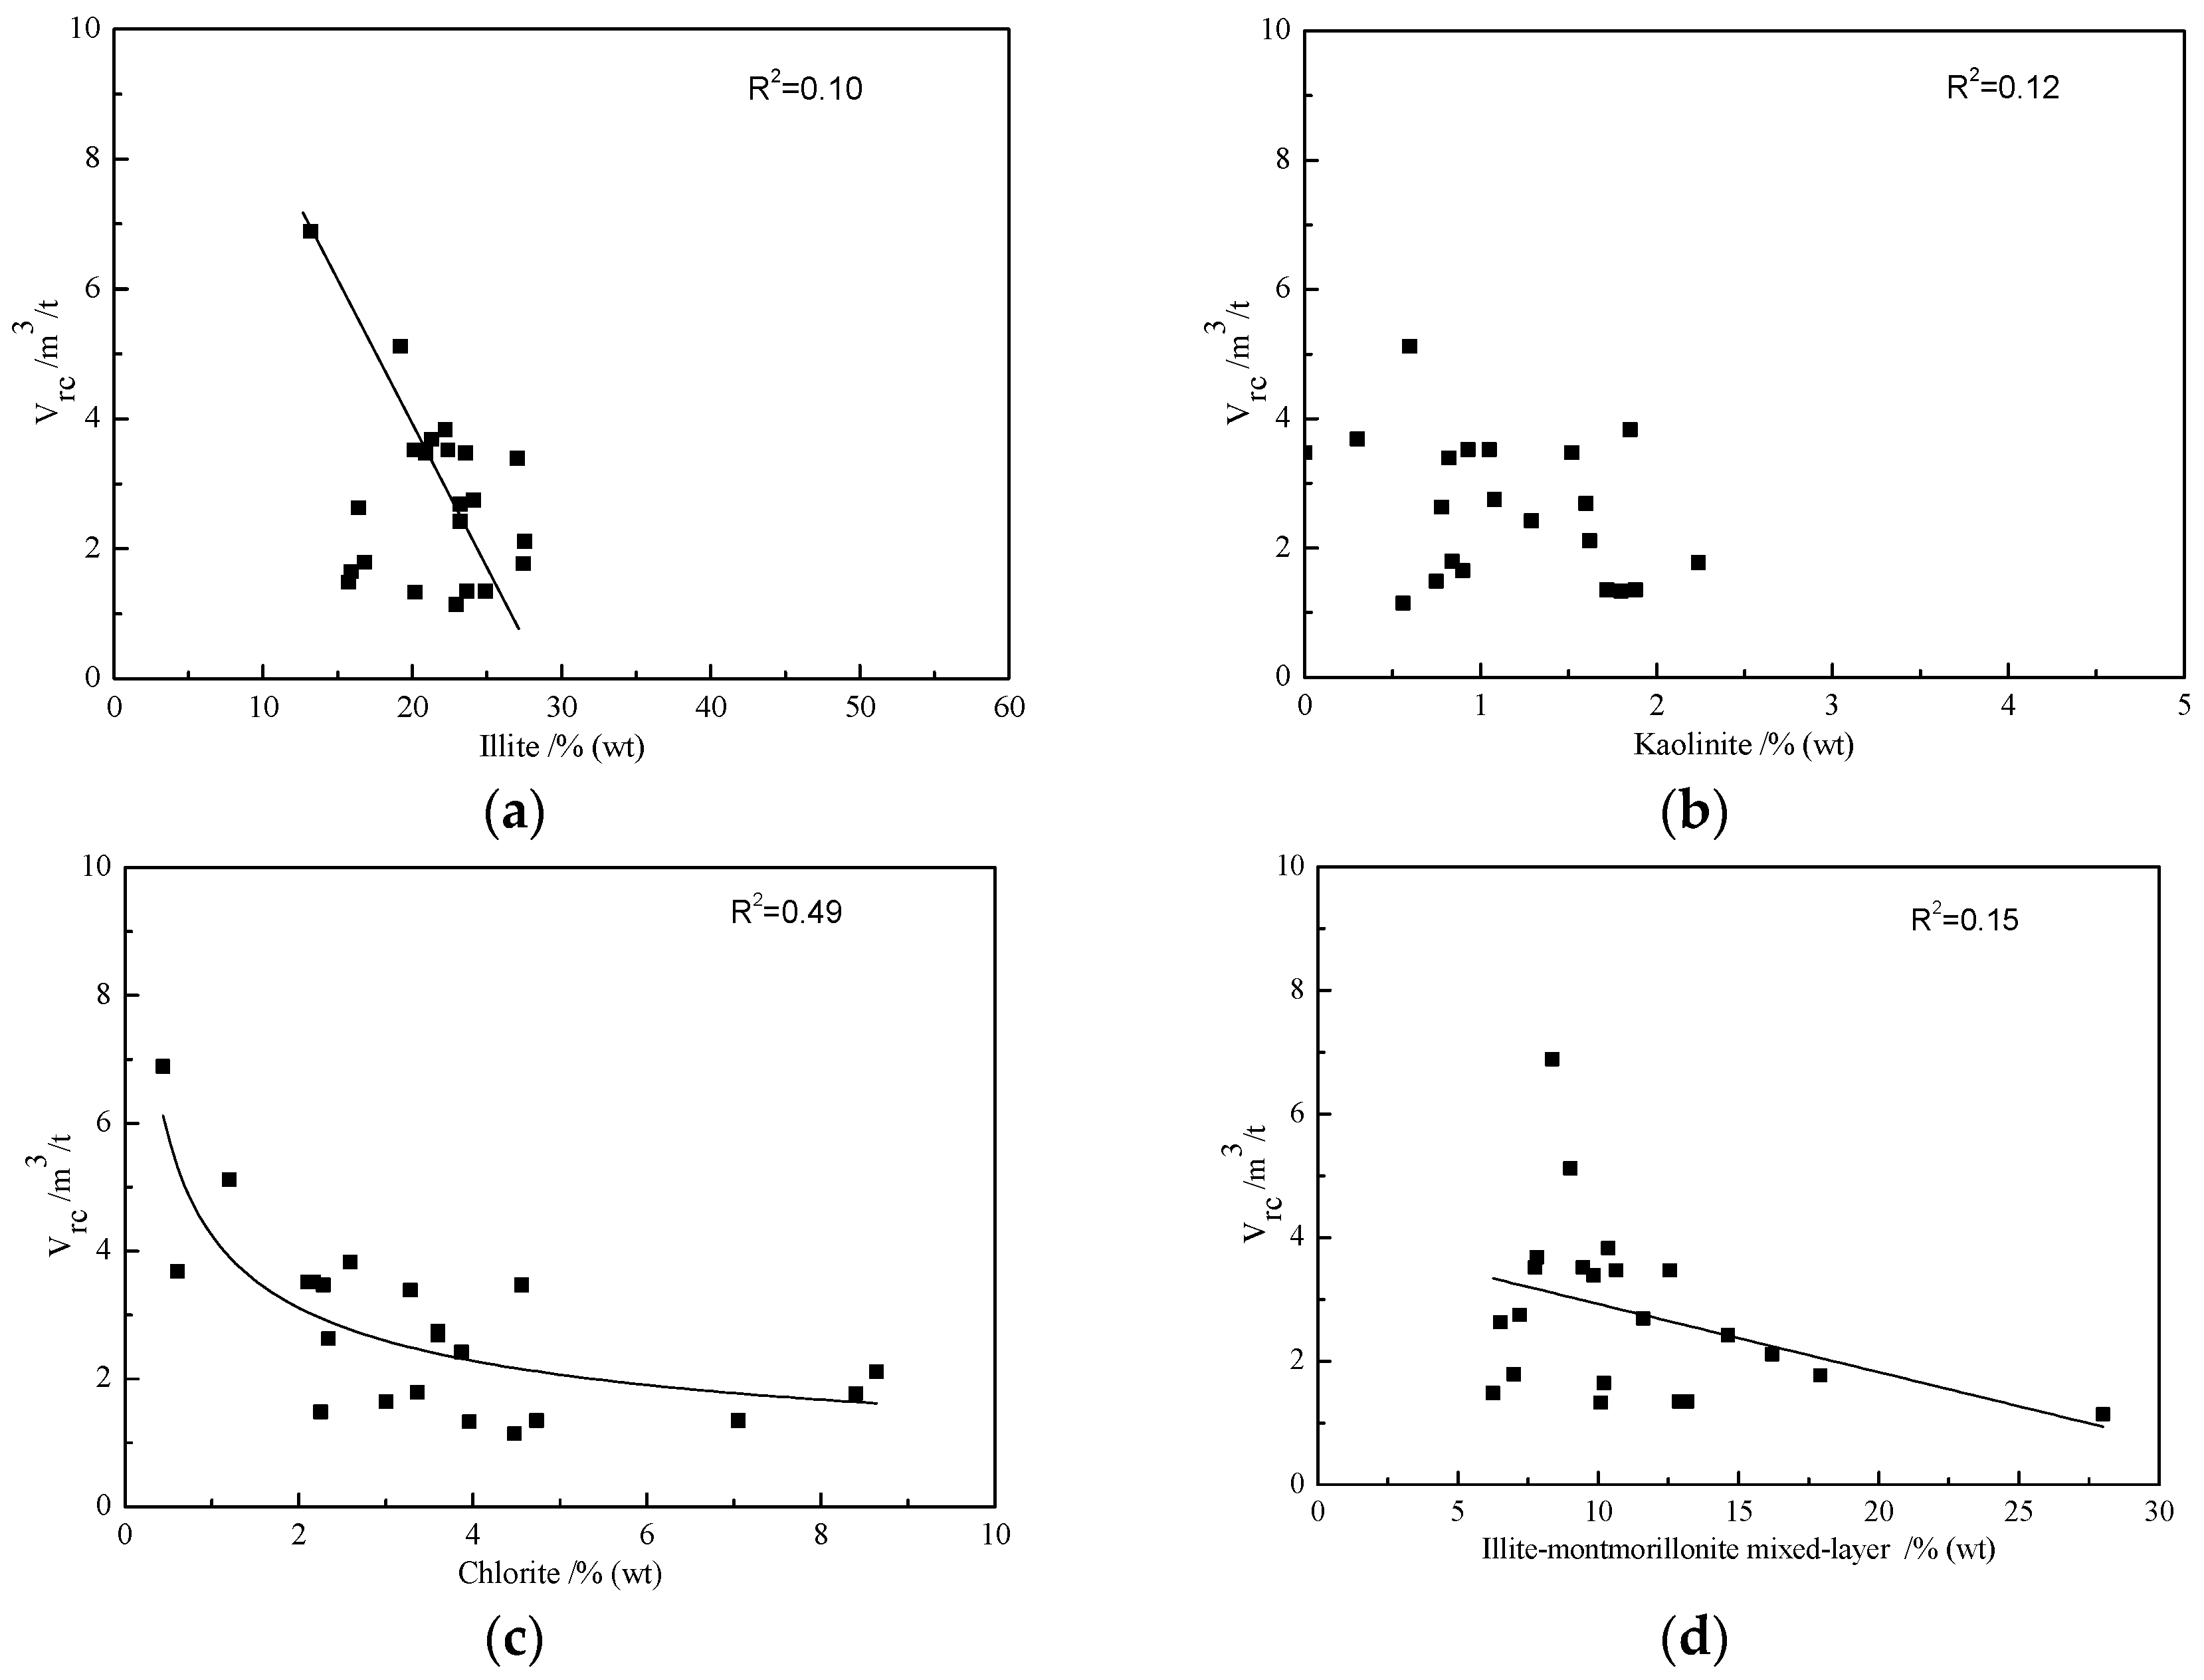
3.4. Effects of Mineralogical Compositions

Figure 5 presents the influential factors of mineral compositions on adsorption capacity. It is shown that the quartz and the pyrite play a positive role on the adsorption, but the clay plays a negative role on the adsorption capacity. It is noted that no correlations between the adsorbed gas volume and the feldspar, calcite and dolomite contents were found. This may be because the quartz contains a large amount of biogenic silica, which has strong adsorption capacity. This agrees with the published results [15,29]. The target formations were deposited in the deep water shelf and contained a large number of siliceous organisms (diatoms, radiolarians, sponger, sponge bone needles, etc.). Meanwhile, we also observed a large number of fossils in the bedding of the rock samples. With the abundance of siliceous biological debris, a lot of micropores developed, which increases the specific surface of gas adsorption, leading to the positive role of the quartz. Moreover, quartz is a rigid mineral with strong compaction resistance, providing good preserving conditions in the pore space.
Pyrite is an indicating mineral for a strongly reducing environment, revealing the sedimentary environment is conducive to the preservation of keogen. The higher the pyrite content, the higher the degree of organic matter enrichment. Thus, its positive correlation with the adsorbed gas content was observed.
Other substances such as feldspar, calcite, and dolomite show weak relationships with the adsorbed gas content, revealing that they are not the main controlling factors of adsorption. Additionally, an abnormal phenomenon was observed where the clay volume is inversely proportional to the adsorbed gas content. It can be interpreted that owing to the high maturity and volume of the kerogen, the contribution of the clay becomes less insignificant.
We used the XRD analysis to get the quantitative information of the clay composition. In the studied region, the clay mineral is dominated by illite, with an average proportion of 58.6%, followed by a mixed layer of illite and smectite, with an average proportion of 29.5%. Kaolinite and chlorite content was less, and no smectite was found. In order to further investigate the effect of different clay minerals on the adsorption capacity, we conducted univariate analysis on different types of clay, as shown in Figure 6. It can be seen that the illite, chlorite and mixed layers of illite and smectite positively correlated to the adsorbed gas content. The specific surface area of kaolinite is usually lower than 10 m2/g, while smectite has a very high specific surface area of up to 900 m2/g. The kaolinite content was too low to analyse, besides the electrification and hydrophilicity of clay minerals restrict their ability to accumulate the oil and gas. During the strong diagenesis stage, the organic acids produced by shale can dissolve the calcareous minerals and block the interlayer pores to some extent.

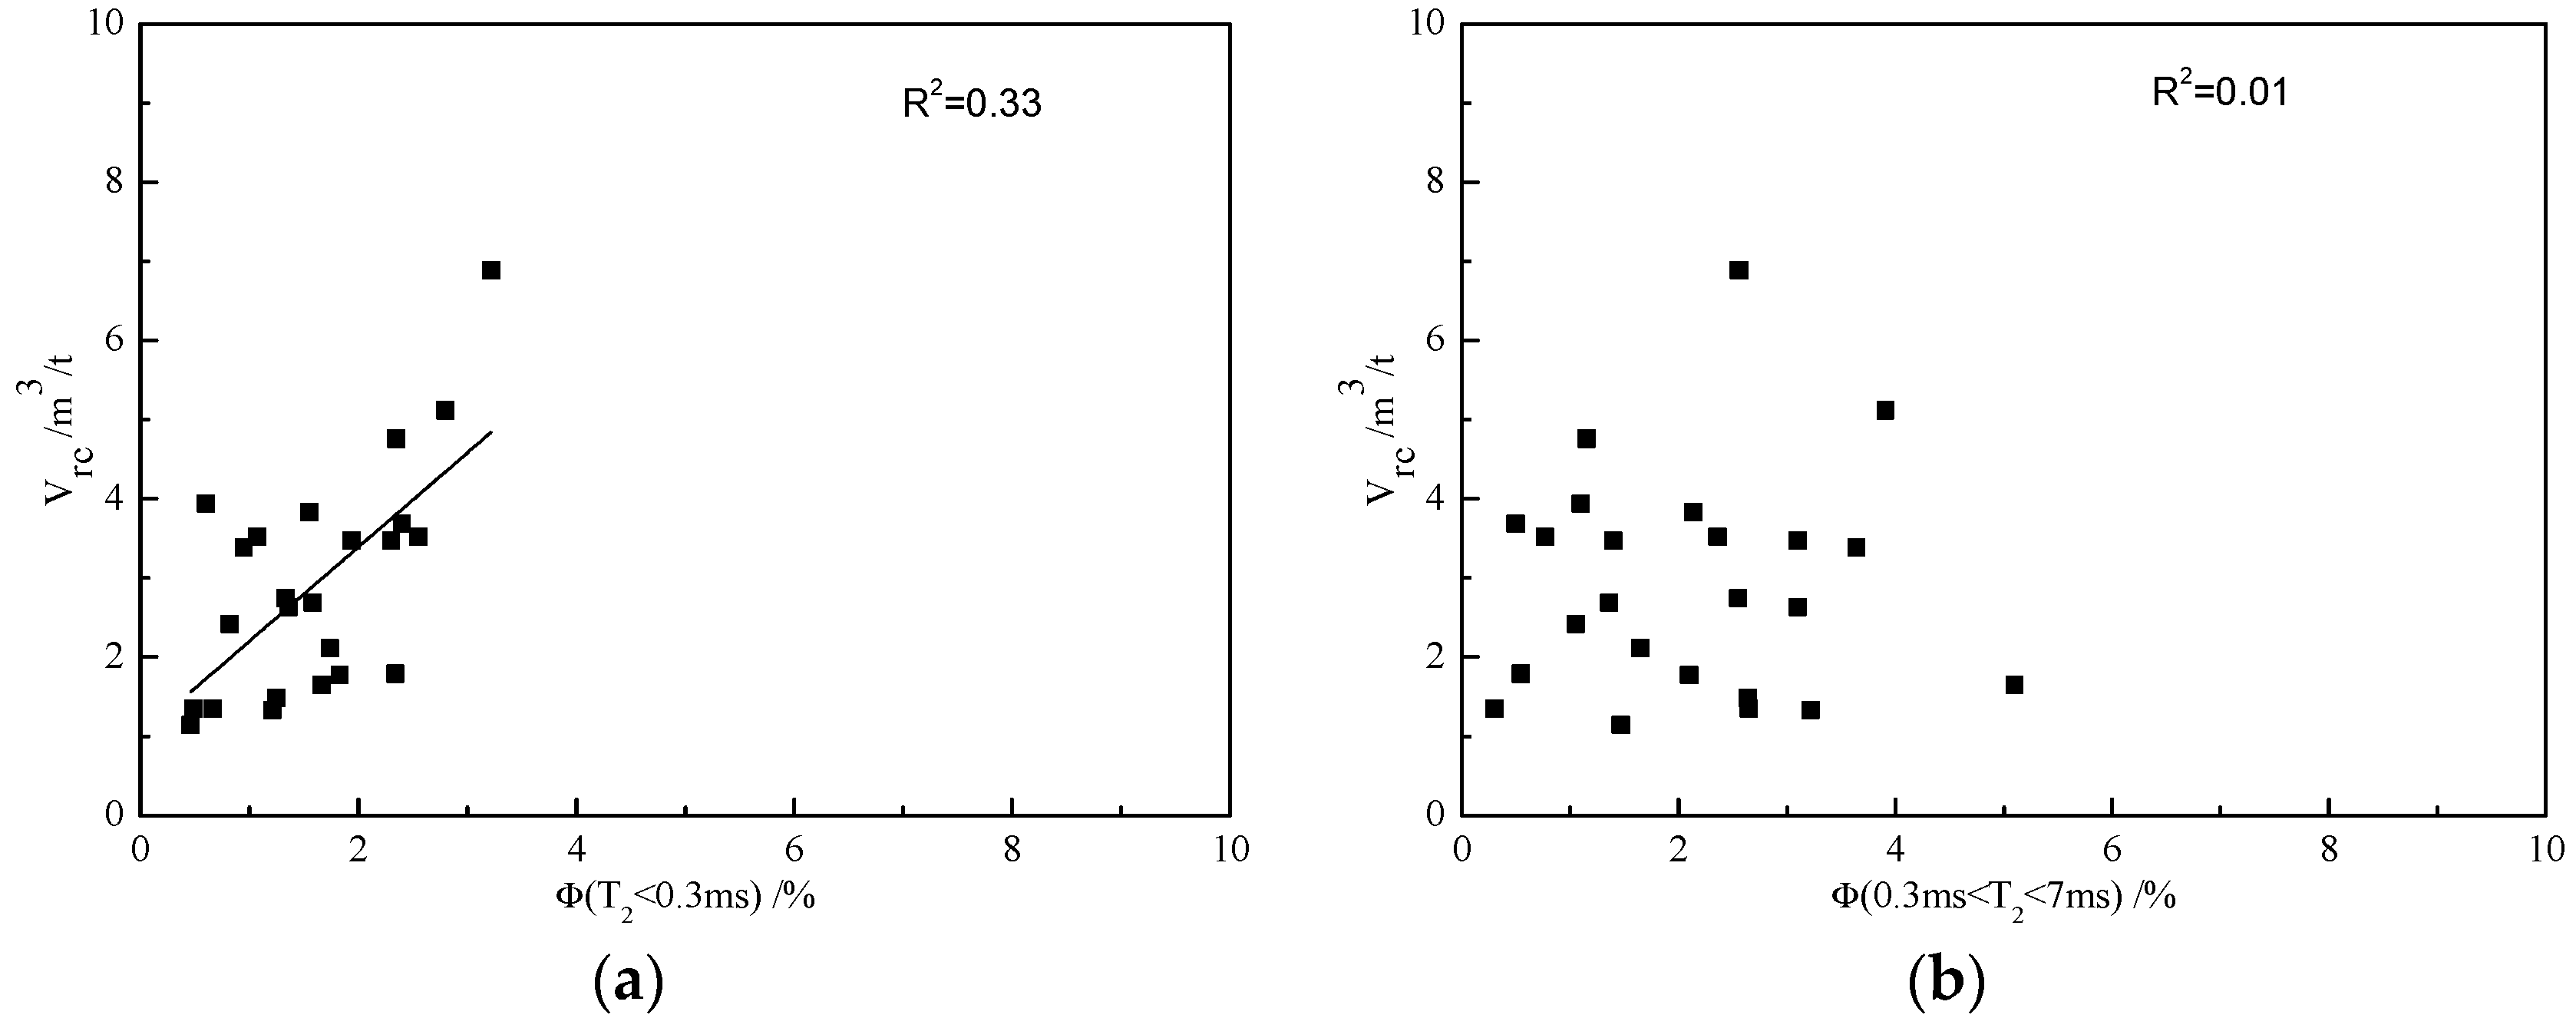
3.5. Effects of Pore Size Distribution

Figure 7 depicts the influential factors on pore volume at different pore size ranges and the pore specific surface area on the adsorption capacity. It can be seen the total porosity and the macroporosity have almost no contribution to the adsorbed gas content. Noticeably, the adsorbed gas content bears a favorable linear relationship with the number of micropores and the specific surface area, indicating that the adsorbed gas is mainly located in micropores. This relationship further supports the reasoning of the above T2 cutoff value for the segmentation of pores. The adsorbed gas was mainly adsorbed in micropores, revealing the majority of gas adsorption was associated with the kerogen. In addition, the thermal maturation process provided favorable conditions for the development of micropores and the surface area, enlarging the adsorption space for the gas [30,31,32]. Moreover, much more extensive research is still required to better explain the adsorption and storage behavior of the gas in shale reservoirs.
Subsequently, we applied the criterion recommended by the International Union of Pure and Applied Chemistry (IUPAC) to classify the pore system into micropore, mesopore and macropore [33], and get their proportions by NMR. According to the surface relaxivity, this classification corresponds to the pores divided by T2 < 0.3 ms, 0.3 ms < T2 <7 ms, and T2 > 7 ms. The relationship between the adsorption content and different pore proportions is shown in Figure 8. It is obvious that the content of adsorbed gas positively correlates to the microporosity, where the coefficient of correlation is lower than that which was computed using the cutoff of 2.5 ms, indicating that the criterion of IUPAC is not suitable for the studied samples.

4. Conclusions

A series of experiments were carried out on a marine shale reservoir to investigate the factors controlling the gas adsorption capacity. Through analysis and discussion, the following conclusions were obtained: (1) The development of biogenic siliceous minerals results in an increase in the number of micropores in the rock, which in turn causes an increase in the specific surface area. This leads to an overall positive relationship between the adsorption gas content and the quartz content; (2) The adsorbed gas content is negatively correlated to clay contents the adsorption ability of clay is lower than the kerogen and the quartz; (3) The adsorbed gas is likely to store in tiny pores with smaller pore diameters; (4) The conventionally used pore classification criteria by the IUPAC may need further discussion, since the porosity of micropores, mesopores and macropores calculated by IUPAC standards cannot work well with some shale reservoirs.
However, the characteristics of petrology, source rock, and reservoir space of shale are not independent to each other. We only analyzed the influencing factors of the adsorbed gas content based on the experimental statistical relationship. Theoretical simulations were not conducted on the mechanism to study the intrinsic control factors of adsorbed gas content. In the future, we will carry out related work and enhance the reliability of the results.

Author Contributions

Conceptualization, Z.F. and X.G.; formal analysis, J.H.; investigation, Z.F. and J.H.; methodology, X.G. and P.Z., and J.L.; supervision, J.H.; validation, J.L.; Writing—original draft, X.G. and Z.F.; writing—review and editing, X.G. and Z.F.

Funding

This research was funded by the National Science and Technology Major Project of China [2017ZX05039], Fundamental Research Funds for the Central Universities [16CX05004A,18CX06025A], and National Key Foundation for Exploring Scientific Instrument of China [2013YQ170463].

Conflicts of Interest

The authors declare no conflicts of interest.

References

  1. Ross, D.J.K.; Bustin, R.M. The importance of shale composition and pore structure upon gas storage potential of shale gas reservoirs. Mar. Petrol. Geol. 2009, 26, 916–927. [Google Scholar] [CrossRef]
  2. Hu, H. Methane adsorption comparison of different thermal maturity kerogens in shale gas system. Chin. J. Geochem. 2014, 33, 425–430. [Google Scholar] [CrossRef]
  3. Li, J.; Yan, X.; Wang, W.; Zhan, Y.; Yin, J.; Lu, S.; Chen, F.; Meng, Y.; Zhang, X.; Chen, X.; et al. Key factors controlling the gas adsorption capacity of shale: A study based on parallel experiments. Appl. Geochem. 2015, 58, 88–96. [Google Scholar] [CrossRef]
  4. Montgomery, S.L.; Jarvie, D.M.; Bowker, K.A.; Pallastro, R.M. Mississippian Barnett Shale, Fort Worth basin, north-central Texas: Gas-shale play with multi-trillion cubic foot potential. AAPG Bull. 2005, 89, 155–175. [Google Scholar] [CrossRef]
  5. Zhang, T.; Ellis, G.; Ruppel, S.; Milliken, K.; Yang, R. Effect of organic-matter type and thermal maturity on methane adsorption in shale-gas systems. Org. Geochem. 2012, 47, 120–131. [Google Scholar] [CrossRef]
  6. Topóra, T.L.; Derkowski, A.; Ziemiański, P.; Szczurowski, J.; McCarty, D.K. The effect of organic matter maturation and porosity evolution on methane storage potential in the Baltic Basin (Poland) shale-gas reservoir. Int. J. Coal Geol. 2017, 180, 46–56. [Google Scholar] [CrossRef]
  7. Wang, Y.; Zhu, Y.; Liu, S.; Zhang, R. Pore characterization and its impact on methane adsorption capacity for organic-rich marine shales. Fuel 2016, 181, 227–237. [Google Scholar] [CrossRef]
  8. Aringhieri, R. Nanoporosity characteristics of some natural clay minerals and soils. Clays Clay Miner. 2004, 52, 700–704. [Google Scholar] [CrossRef]
  9. Ji, W.; Song, Y.; Jiang, Z.; Wang, X.; Bai, X.; Xing, J. Geological controls and estimation algorithms of lacustrine shale gas adsorption capacity: A case study of the Triassic strata in the southeastern Ordos Basin, China. Int. J. Coal Geol. 2014, 134, 134–135. [Google Scholar] [CrossRef]
  10. Zhong, J.; Chen, G.; Lv, C.; Yang, W.; Xu, Y.; Yang, S. Experimental study of the impact on methane adsorption capacity of continental shales with thermal evolution. J. Nat. Gas Geol. 2016, 1, 165–172. [Google Scholar] [CrossRef]
  11. Gasparik, M.; Bertier, P.; Gensterblum, Y.; Ghanizadeh, A.; Krooss, B.M.; Littke, R. Geological controls on the methane storage capacity in organic-rich shales. Int. J. Coal Geol. 2014, 123, 34–51. [Google Scholar] [CrossRef]
  12. Xiong, F.; Wang, X.; Amooiea, M.A.; Soltanian, M.R.; Jiang, Z.; Moortgat, J. RETRACTED: The shale gas sorption capacity of transitional shales in the Ordos Basin, NW China. Fuel 2017, 208, 236–246. [Google Scholar] [CrossRef]
  13. Guo, S.; Lü, X.; Song, X.; Liu, Y. Methane adsorption characteristics and influence factors of Mesozoic shales in the Kuqa Depression, Tarim Basin, China. J. Pet. Sci. Eng. 2017, 157, 187–195. [Google Scholar] [CrossRef]
  14. Zhou, S.; Xue, H.; Ning, Y.; Guo, W.; Zhang, Q. Experimental study of supercritical methane adsorption in Longmaxi shale: Insights into the density of adsorbed methane. Fuel 2018, 211, 140–148. [Google Scholar] [CrossRef]
  15. Ji, W.; Song, Y.; Jiang, Z.; Chen, L.; Li, Z.; Yang, X.; Meng, M. Estimation of marine shale methane adsorption capacity based on experimental investigations of Lower Silurian Longmaxi formation in the Upper Yangtze Platform, south China. Mar. Petrol. Geol. 2015, 68, 94–106. [Google Scholar] [CrossRef]
  16. Ma, X.; Song, Y.; Liu, S.; Jiang, L.; Hong, F. Experimental study on history of methane adsorption capacity of Carboniferous-Permian coal in Ordos Basin, China. Fuel 2016, 184, 10–17. [Google Scholar] [CrossRef]
  17. Pang, Y.; Soliman, M.Y.; Deng, H.; Xie, X. Experimental and analytical investigation of adsorption effects on shale gas transport in organic nanopores. Fuel 2017, 199, 272–288. [Google Scholar] [CrossRef]
  18. Han, H.; Zhong, N.; Ma, Y.; Huang, C.; Wang, Q.; Chen, S.; Lu, J. Gas storage and controlling factors in an over-mature marine shale: Acase study of the Lower Cambrian Lujiaping shale in the Dabashan arclike thrustefold belt, southwestern China. J. Pet. Sci. Eng. 2016, 33, 839–853. [Google Scholar] [CrossRef]
  19. Xing, J.; Hu, S.; Jiang, Z.; Wang, X.; Wang, J.; Sun, L.; Bai, Y.; Chen, L. Classification of controlling factors and determination of a prediction model for shale gas adsorption capacity: A case study of Chang 7 shale in the Ordos Basin. J. Pet. Sci. Eng. 2018, 49, 260–274. [Google Scholar] [CrossRef]
  20. Ge, X.; Liu, J.; Fan, Y.; Xing, D.; Deng, S.; Cai, J. Laboratory investigation into the formation and dissociation process of gas hydrate by low field NMR technique. J. Geophys. Res.-Sol. Earth 2018, 123, 3339–3346. [Google Scholar] [CrossRef]
  21. Ge, X.; Fan, Y.; Cao, Y.; Li, J.; Cai, J.; Liu, J.; Wei, S. Investigation of organic related pores in unconventional reservoir and its quantitative evaluation. Energy Fuel 2016, 30, 4699–4709. [Google Scholar] [CrossRef]
  22. Heller, R.; Zoback, M. Adsorption of methane and carbon dioxide on gas shale and pure mineral samples. J. Uncon. Oil Gas Resour. 2014, 8, 14–24. [Google Scholar] [CrossRef]
  23. Zhou, S.; Wang, H.; Xue, H.; Guo, W.; Lu, B. Difference between excess and absolute adsorption capacity of shale and a new shale gas reserve calculation method. Nat. Gas Ind. 2016, 36, 12–20. [Google Scholar]
  24. Gasparik, G.; Ghanizadeh, A.; Bertier, P.; Gensterblum, Y.; Bouw, S.; Krooss, B.M. High-pressure methane sorption isotherms of black shales from the Netherlands. Energy Fuel 2012, 26, 4995–5004. [Google Scholar] [CrossRef]
  25. Rexer, T.F.T.; Benham, M.J.; Aplin, A.C.; Thomas, K.M. Methane adsorption on shale under simulated geological temperature and pressure conditions. Energy Fuel 2013, 27, 3099–3109. [Google Scholar] [CrossRef] [Green Version]
  26. Singer, P.M.; Rylander, E.; Jiang, T.; McLin, R.; Lewis, R.E.; Sinclair, S.M. 1D and 2D NMR core-log intergration in organic shale. In Proceedings of the International Symposium of the Society of Core Analysts, Napa Valley, CA, USA, 16–19 September 2013. [Google Scholar]
  27. Kuila, U.; Prasad, M. Specific surface area and pore-size distribution in clays and shales. Geophys. Prospect. 2013, 61, 341–362. [Google Scholar] [CrossRef]
  28. Ge, X.; Fan, Y.; Cao, Y.; Xu, Y.; Liu, X.; Chen, Y. Reservoir pore structure classification technology of carbonate rock based on NMR T2 spectrum decomposition. Appl. Magn. Reson. 2014, 45, 155–167. [Google Scholar] [CrossRef]
  29. Jarvie, D.M.; Hill, R.J.; Ruble, T.E.; Pollastro, R.M. Unconventional shale-gas systems: The Mississippian Barnett Shale of north-central Texas as one model for thermogenic shale-gas assessment. AAPG Bull. 2007, 91, 475–499. [Google Scholar] [CrossRef]
  30. Chalmers, G.R.; Bustin, R. Lower Cretaceous Gas Shales of Northeastern British Columbia: Geological Controls on Gas Capacity and Regional Evaluation of a Potential Resource. Bull. Can. Pet. Geol. 2008, 56, 1–21. [Google Scholar] [CrossRef]
  31. Loucks, R.G.; Reed, R.M.; Ruppel, S.C.; Jarvie, D.M. Morphology, genesis, and distribution of nanometer-scale pores in siliceous mudstones of the Mississippian Barnett Shale. J. Sediment. Res. 2009, 79, 848–861. [Google Scholar] [CrossRef]
  32. Milliken, K.L.; Rudnicki, M.; Awwiller, D.N.; Zhang, T. Organic matter-hosted pore system, Marcellus Formation (Devonian), Pennsylvania. AAPG Bull. 2013, 97, 177–200. [Google Scholar] [CrossRef]
  33. Rouquerol, J.; Avnir, D.; Fairbridge, C.W.; Everett, D.H.; Haynes, J.M.; Pernicone, N.; Ramsay, J.D.F.; Sing, K.S.W.; Unger, K.K. Recommendations for the characterization of porous solids. Pure Appl. Chem. 1994, 66, 1739–1758. [Google Scholar] [CrossRef]
Figure 1. Typical core photo of the underground shale sample.
Energies 11 03078 g001
Figure 2. The typical adsorption isotherm curve and fitting results: (a) The fitting result of the conventional model; (b) the fitting result of the modified model.
Energies 11 03078 g002
Figure 3. The typical pore morphology and pore size distributions: (a) Thin section; (b) SEM image; (c) BSE image; (d) pore radius by MIP; (e) pore radius by LPGA; (f) NMR T2 spectrum.
Energies 11 03078 g003
Figure 4. Relationships between the adsorbed content and geochemical parameters: (a) total organic matter content (TOC); (b) Ro; (c) Tmax; (d) production index (PI).
Energies 11 03078 g004
Figure 5. Relationships between the adsorbed gas content and the main compositions of mineral volumes: (a) Quartz volume; (b) feldspar volume; (c) calcite volume; (d) dolomite volume; (e) pyrite volume; (f) clay volume.
Energies 11 03078 g005
Figure 6. Relationships between the adsorbed gas content and the main compositions of clay: (a) Illite volume; (b) kaolinite volume; (c) chlorite volume; (d) illite-montmorillonite mixed-layer volume.
Energies 11 03078 g006
Figure 7. Relationships between the adsorbed gas content and the pore size parameters: (a) Total porosity; (b) microporosity; (c) cacroporosity; (d) BJH specific surface area.
Energies 11 03078 g007
Figure 8. Relationships between the adsorbed gas content and the pore proportions by IUPAC: (a) Microporosity; (b) mesoporosity.
Energies 11 03078 g008

