Article

Experimental and Numerical Collaborative Latching Control of Wave Energy Converter Arrays

1
Ångströmlaboratoriet, Division of Electricity, Uppsala University, Lägerhyddsvägen 1, 75237 Uppsala, Sweden
2
School of Engineering, University of Plymouth, Drake Circuit, Plymouth PL4 8AA, UK
*
Author to whom correspondence should be addressed.
Energies 2018, 11(11), 3036; https://doi.org/10.3390/en11113036
Submission received: 8 October 2018 / Revised: 26 October 2018 / Accepted: 29 October 2018 / Published: 5 November 2018

Abstract

:
A challenge while applying latching control on a wave energy converter (WEC) is to find a reliable and robust control strategy working in irregular waves and handling the non-ideal behavior of real WECs. In this paper, a robust and model-free collaborative learning approach for latchable WECs in an array is presented. A machine learning algorithm with a shallow artificial neural network (ANN) is used to find optimal latching times. The applied strategy is compared to a latching time that is linearly correlated with the mean wave period: It is remarkable that the ANN-based WEC achieved a similar power absorption as the WEC applying a linear latching time, by applying only two different latching times. The strategy was tested in a numerical simulation, where for some sea states it absorbed more than twice the power compared to the uncontrolled WEC and over 30% more power than a WEC with constant latching. In wave tank tests with a 1:10 physical scale model the advantage decreased to +3% compared to the best tested constant latching WEC, which is explained by the lower advantage of the latching strategy caused by the non-ideal latching of the physical power take-off model.

Graphical Abstract

1. Introduction

Since the electric revolution started in the 19th century, the consumption of electrical energy has risen to more than 20 PWh in 2015 [1] and is expected to rise further [2]. To fulfill these demands in an environmentally friendly way, energy harvested from ocean waves may play an important role. However, even after decades of research [3] and a better predictability compared to wind energy [4], the levelized costs of energy are still too high. Cutting down these costs is a challenge in which this paper wants to contribute by investigating a model-free latching algorithm for wave energy converters (WECs) in arrays.
Many different WEC designs have been proposed [5] and can generally be divided into three categories based on their interaction with the wave: terminator, attenuators, and absorber. This paper will focus on absorber WECs of the heave buoy type, where a buoy is connected to a generator, here idealized as a perfect linear damper, converting the buoy’s motion into electrical energy. However, the algorithm presented here is suitable also for other converter designs.
Fuels have a high energy density, enabling generators in traditional power plants to produce several MW; most renewable energy resources have a much lower energy density. To generate electrical energy in the scale of traditional power plants, arrays of converters must be installed. Optimal power absorption is obtained when the WEC oscillates in resonance with the incident waves. To force this situation, a wide range of control strategies have been proposed [6], of which latching, first proposed by Budal and Falnes in 1978 [
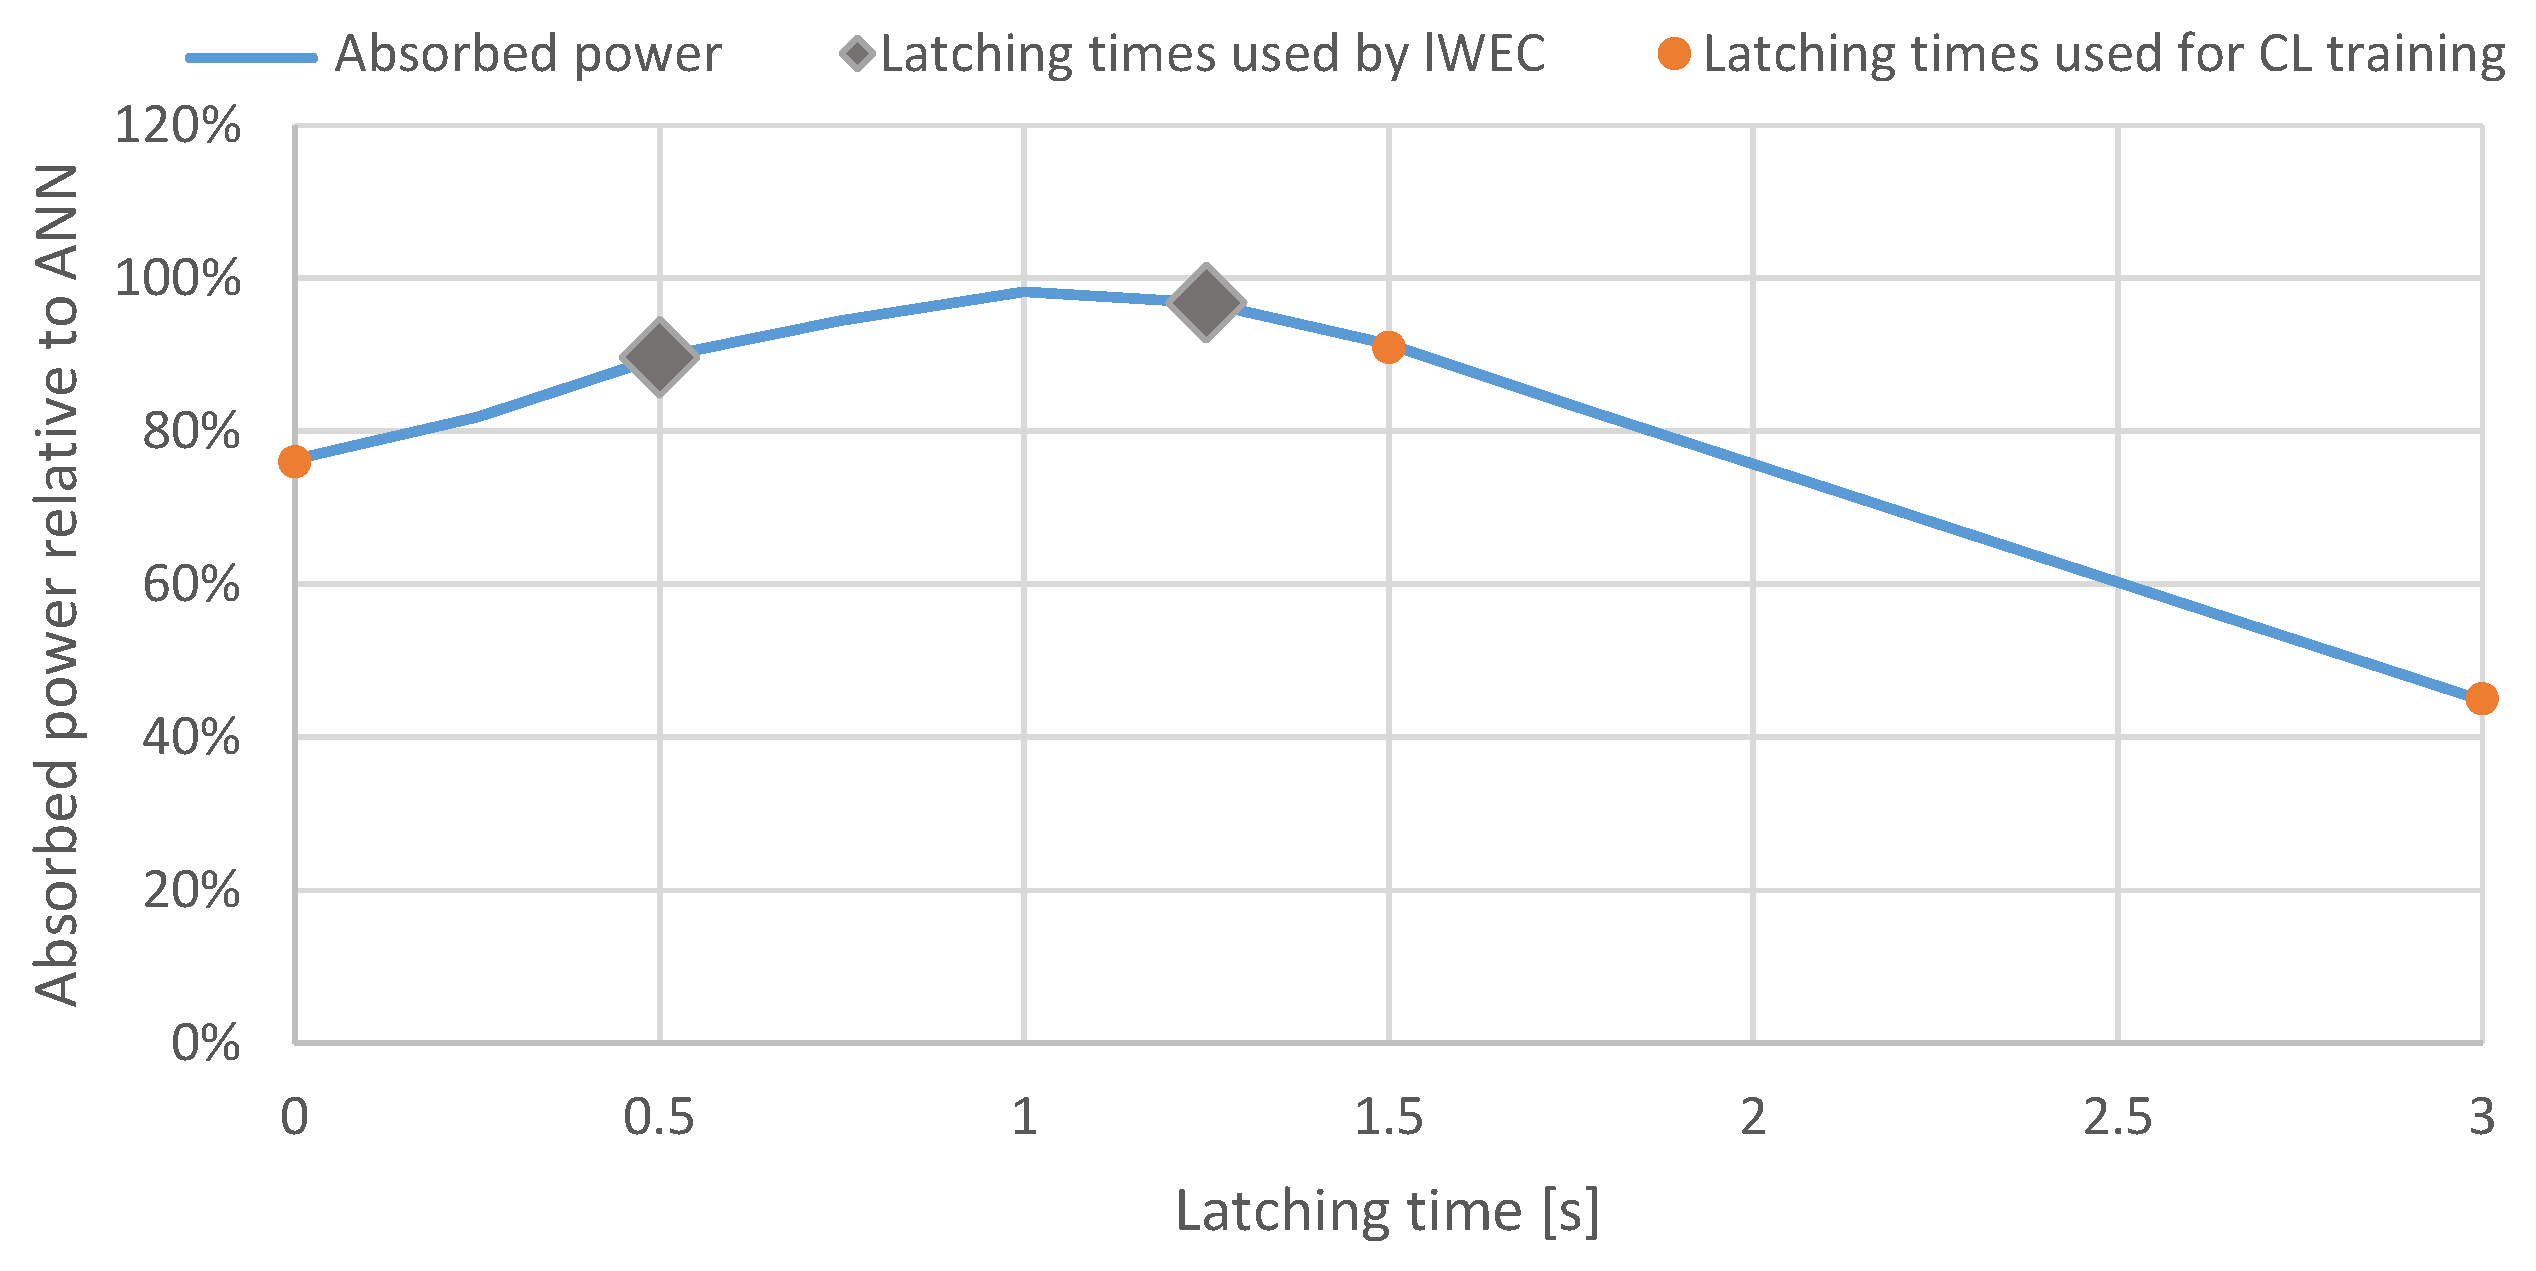
7], is one of the best known. To use latching, the damped frequency of the WEC must be higher than the wave frequency, then the phase offset introduced while latching the generator position—mostly done at the extreme position of the movement—can increase the power absorption. In case the frequency of the WEC is much higher than the frequency of the wave, the optimal latching time is 1/4th of the wave length. Implementing latching strategies for irregular, unknown wave climates is a topic of on-going research [8,9,10,11,12]. Most latching strategies for irregular waves rely on short term wave forecasting and analytical or numerical modelling of the WEC.
The performance of forecast and model dependent control strategies rely heavily on the quality of the model and its parametrization. The fact that WECs may operate in wave farms, lead to new collaborative approaches. In [13], WECs that are affected by the wave first pass the measured wave data to the other WECs, so that these have a-priori information about the coming wave. In [14] a model-free control strategy was presented using a collaborative reinforcement machine learning (CL) of WECs in an array. This paper enhances the idea of CL to find the latching time for an array of WECs in irregular waves.
Machine learning is often used to forecast, for example waves [15] and wave power generation [16] or to characterize wave energy resources [17]. For control purposes, there are a few examples where machine learning approaches have been used: in [18], an artificial neural network (ANN) was used for reactive control, in [11] an artificial neural oscillator was used to bring a latching device in resonance with the waves and in [19] an ANN was controlling the damping of a WEC.
The collaborative learning strategy presented in this paper assumes that several identical latching-controllable WECs are placed in a line parallel to the wave front of unidirectional, irregular waves. At least one of the WECs must be learnable; here a “shallow” artificial neural network (ANN) is used and one WEC does not perform latching but measures the wave. Every time a peak or trough is detected by the measuring WEC a message with the measured mean wave period is sent to all WECs. This information is used by the internal policy of each WEC to decide on a latching time. The absorbed power during a wave and the applied latching time is shared with the other WECs. The learnable WECs adjust their policy based on the best result of all WECs. The focus is to obtain a simple and graspable algorithm which will help to gain an understanding on how the CL obtain its results.
In this paper, it is assumed that the best control strategy for a single WEC is also the best control strategy for each WEC in the array, as the effects between WECs in a row parallel to the wave crest (see also [20,21]) may have neglectable small influence on the optimal control parameter.
The new control strategy is evaluated using a numerical, time-domain-based simulation and a motor-based physical scale model operating in the Ocean Basin Wave Tank in the COAST laboratory of the University of Plymouth, UK.
The paper is structured as follow: first, the control strategies used are presented in Section 2, then the numerical model is described in Section 3. The set-up of the numerical and physical experiments is the topic of Section 4, followed by the results in Section 5 and the discussion in Section 6. Conclusions of the results and an outlook of potential further work is given in Section 7.

2. Control Strategies

2.1. Collaborative Learning

CL requires two or more WECs that are arranged horizontally to the incoming wave crest. An example of such a set-up can be found later in this paper in Figure 5. Of these WECs at least one must be learnable (lWEC) and one is working as central WEC, measuring the incident waves.
As presented in this study, the strategy is only capable to handle WECs with similar characteristics and unidirectional waves. For multi-directional sea states, the algorithm would in addition have to calculate the time delay between the WECs and handle the communication between the WECs accordingly.
The central WEC does not have to be controllable. Its purpose is to continuously measure the wave and determine the crests and troughs by analyzing its translator position. Due to latching, the other WECs may have a phase offset between WEC and wave, and so crests and troughs may be estimated at different times by different WECs. The central WEC synchronizes the latching of the WECs by sending the “Latch” signal simultaneously to all WECs. It is, therefore, important to ensure that the phase offset for the central WEC is neglectable.
All other WECs must be able to latch the translator, measure their absorbed power and communicate with the central WEC, to whom they will send the information about the absorbed power and applied latching time after each wave. The control strategies of these WECs can be various, for instance, they might be WECs with a constant latching time (cWECs) which are not learnable, or self-learning WECs, but at least one must be a CL learning WEC (lWEC).
The lWECs must be equipped with a machine learning algorithm, like a variable look-up-table (LUT) or an ANN. In this paper, an ANN is used. The machine learning algorithm gets an input which is related to the sea state and outputs the control parameter, here the latching time. Choosing suitable in- and output parameters is essential for successful learning.
One central WEC and two or more latchable WECs, among at least one lWEC, are placed parallel to the unidirectional wave front. The CL is performed in the following steps:
  • The central WEC detects an extremum (crest or trough).
  • The central WEC calculates the wave period from the time passed since the last extremum and calculates the mean wave period for the last waves. Then it sends the “Start” (Latch event) message to all converters.
  • The WECs will apply a latching time based on their policy and the mean wave period. They continuously measure their absorbed energy.
  • The central WEC detects an extremum and sends a “Stop” signal.
  • The WECs calculate their average absorbed power and send this information together with the applied latching time to the central WEC.
  • The central WEC compares the power absorption and sends the applied latching time of the WEC which absorbed the most power together with the mean wave period to the lWECs.
  • The lWECs adapt their policies based on the mean wave period and the best applied latching time.
  • After the training is finished, the procedure repeats from step 3.
The previous implementation of this algorithm used a “deep” ANN [14] to estimate the optimal damping at each time from a short time series of the line force signal. However, despite the deep network the ANN was not able to classify the sea state correctly; the variation of the waves in the short term is hard to predict.
In this paper, we choose instead the approach of using a small “shallow”-ANN with three hidden layers and three neurons in each hidden layer. Assuming that a wave state will not change rapidly, the average wave period of the last nine waves is used as the input. This may reduce the noise in the learning data and the ANN can focus on learning the best latching time for a sea state rather than a single wave optimization. The mean wave period is hereby encoded in 10 input units of which only one is active at a time, each representing a wave period interval. Input unit one is representing a wave period between 0 and 1 s, and input neuron 10 represents a wave period between 8 and 9 s. Similarly, the output layer consists of 13 neurons, each assigned to a latching time, ranging from 0 s for output unit one, to 3 s for output unit 13. A SoftMax function determines the highest output unit. A sketch of the network can be found in Figure 1.
After the learning phase, the performance of the WEC is tested in new sea states. The learning is deactivated and the lWECs will rely on the policy learned to find the suitable control parameters.

2.2. Linear Latching Time Control

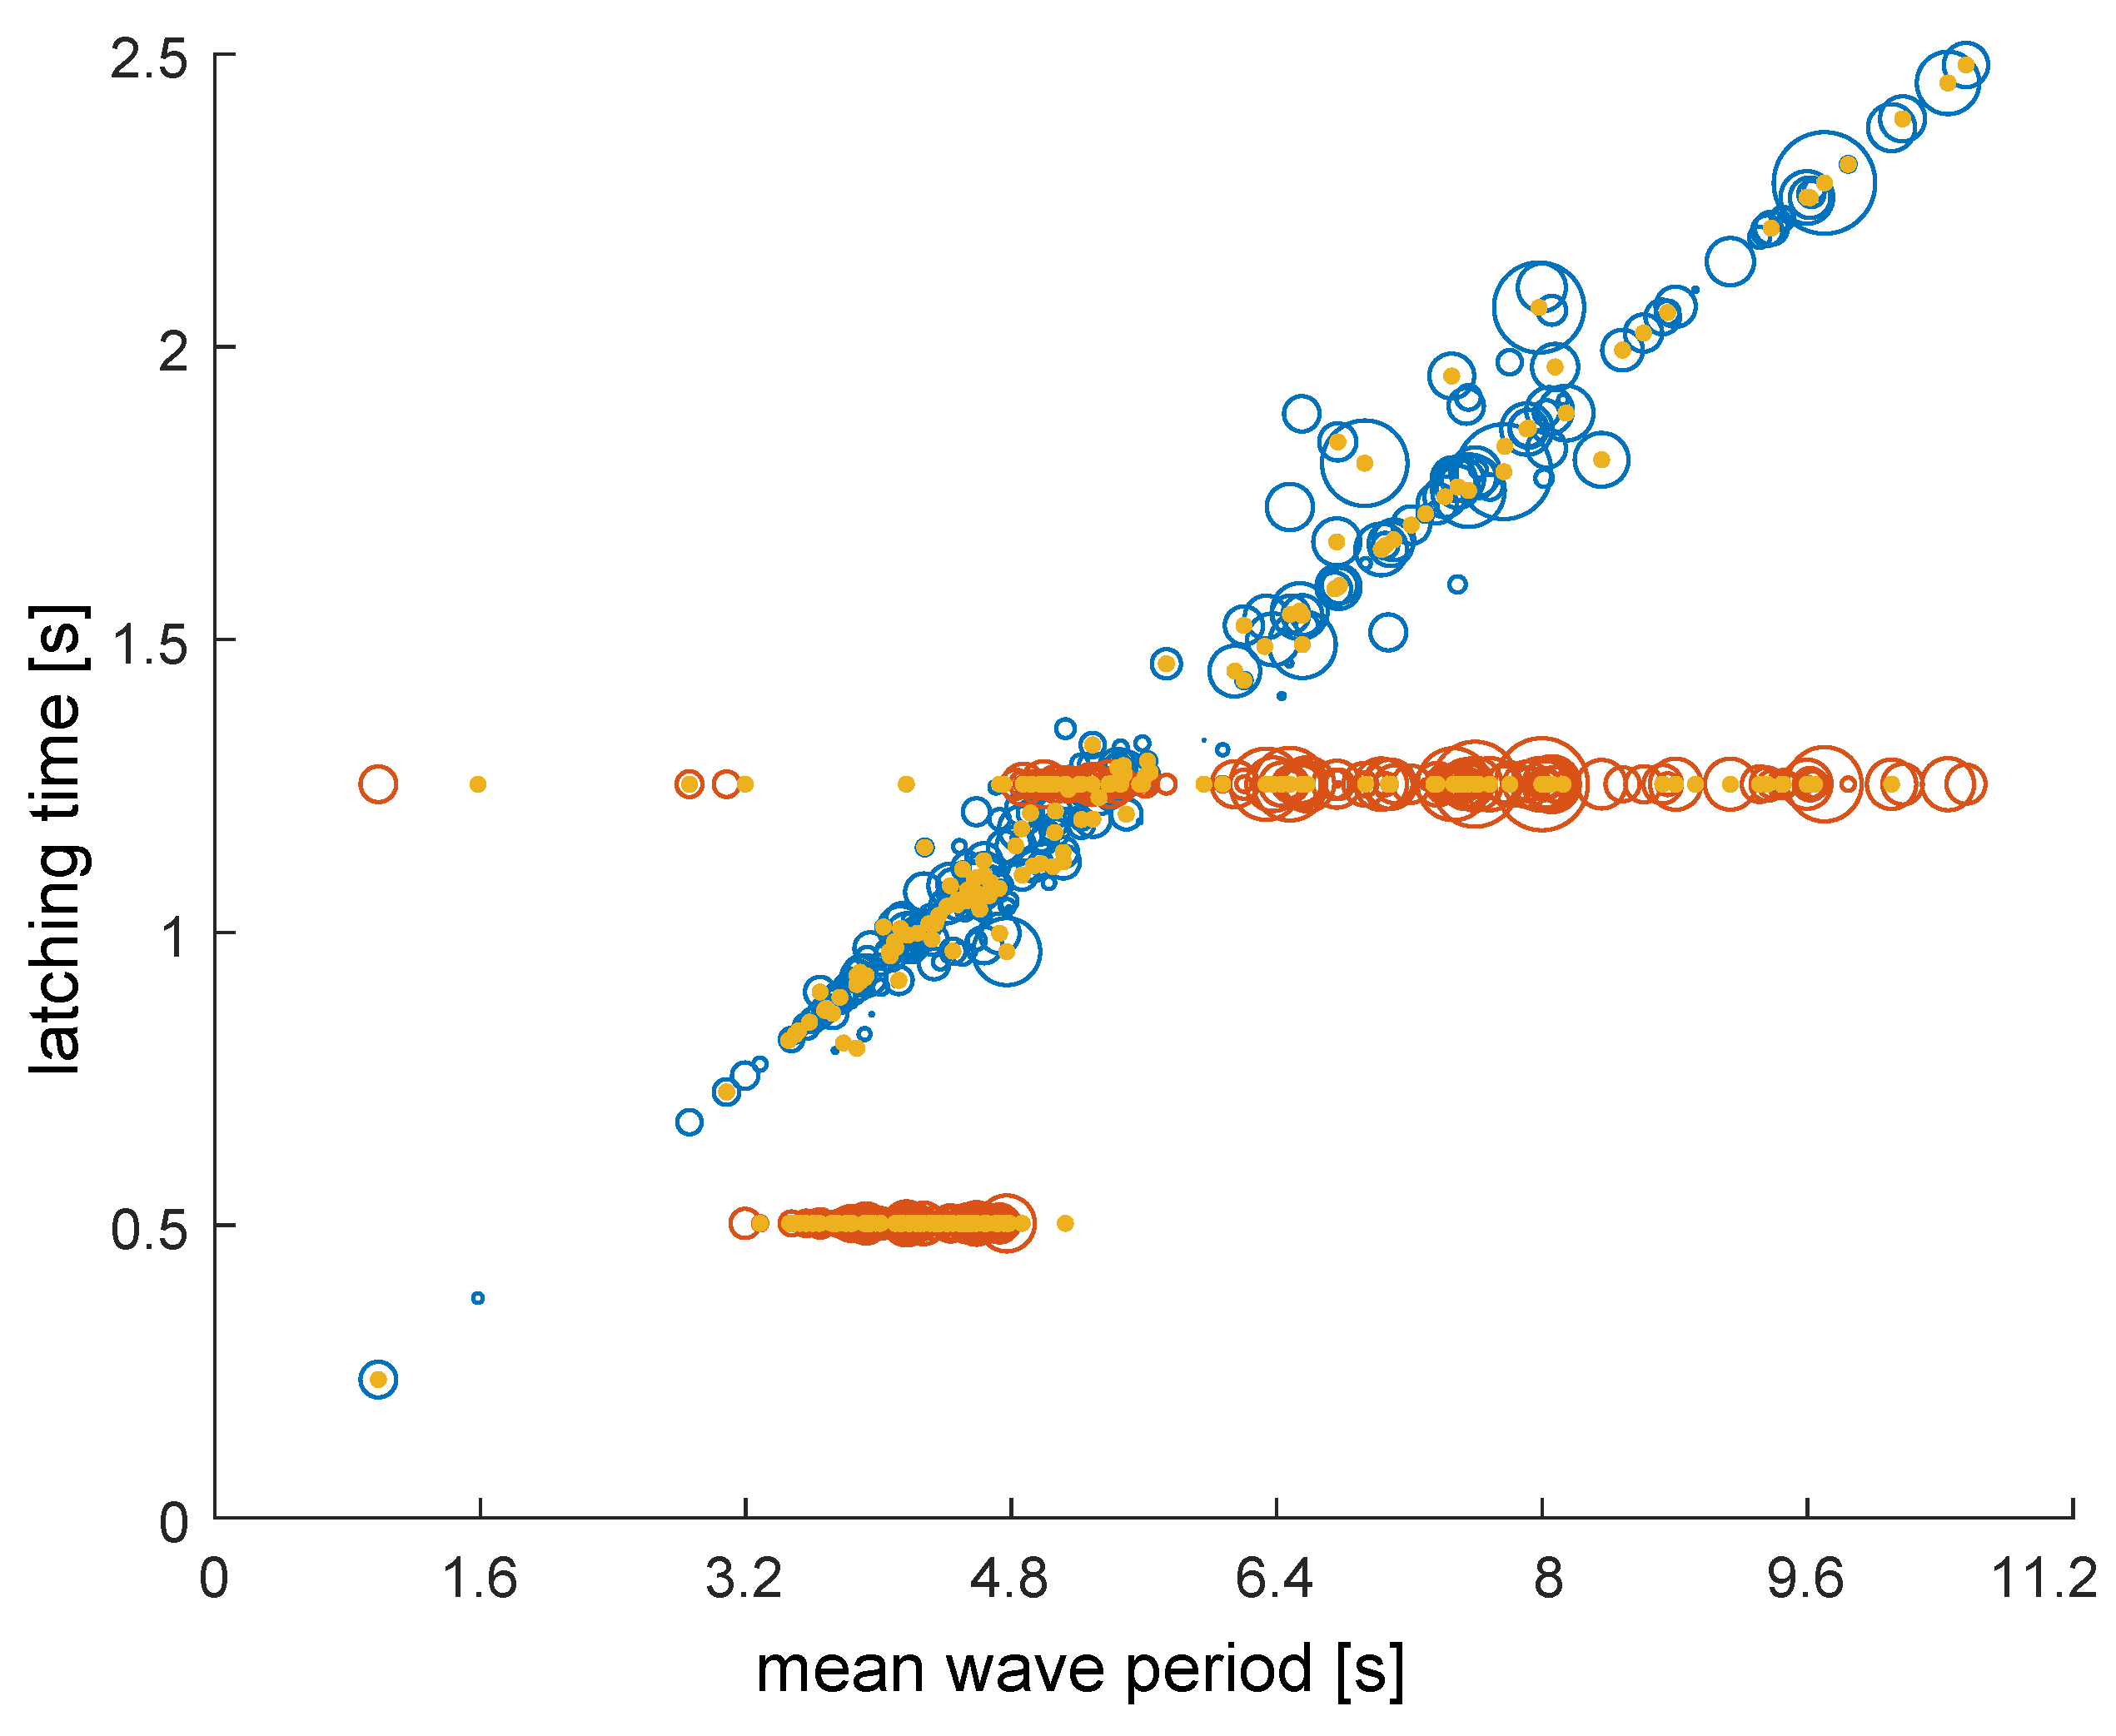
As the optimal latching time is the difference between the wave period and the WECs natural period of oscillation, there should be a linear relation between wave period and latching time. Ideally the latching time is 1/4th of the wave period, if latched two times per period. As the wave period is not known in advance, the mean period p ¯ w , over the last nine waves which is also used in the CL strategy, is used to determine the latching time T L :
T L = c p ¯ w ,
where the constant c is obtained experimentally. This control is referred to as linear latching in this paper.
Due to the theoretical relationship between wave period and optimal latching time, it is expected that this strategy will outperform all other strategies and is therefore used as a reference.

3. Numerical Model

The simulation was performed using a two-body model (buoy and generator) for each WEC. It is based on linear potential flow theory, assuming non-steep waves and an irrotational and incompressible fluid. These assumptions are in good agreement with the sea states used and the characteristics of water. The hydrodynamic coefficients of the body-fluid interactions were calculated using boundary equation method (BEM) with the software WAMIT [22]. To reduce the complexity, it is assumed that the buoy has only one degree of freedom (x) in the heave direction. More about the theory used for the model can be found in [23].
The incident wave will act with a force F e , i on the buoy:
F e , i ( t ) = f e ( t ) η i ( t ) ,
with η being the surface elevation and f e ( t ) being the impulse response function of the buoy to the surface elevation. The index i refers to the buoy number in the array. Similarly, the radiated wave, caused by the motion of the buoy is obtained:
F r , i ( t ) = j = 0 n h i , j ( t ) x ˙ j ( t ) ,
where h i , j is the response function of how the motion of buoy i influences buoy j. The hydrostatic force is the product of the buoyancy b b at equilibrium and the offset (measured from the equilibrium) position of the buoy x ( t ) ,
F h , i ( t ) = b b x ( t ) .
The equation of motion for buoy i is:
x ¨ i = ( F e , i + F L , i + F r , i + F h , i + F g B , i ) / ( m B + m A ) ,
with F L , i being the line force (see below), m A the added mass and F g B , i is the weight force of the buoy: F g B , i = m b g , where m b is the mass of the buoy. The buoys are, as well as the line and the generator, identical for all WECs. The generator is modelled as an ideal mass-damper system:
y ¨ i = ( y ˙ i γ m T g F L , i ) / m T ,
with γ being the electrical generator damping, m T the weight of the translator and y i the position of translator i.
The buoy and the generator are connected by a line, which will only contribute with a force if it is under tension, and with no force if slack:
F L , i = c l ( x i y i ) + d l ( x ˙ i y ˙ i ) , x i > y i 0 , e l s e ,
where c l (set to 1 GN/m) is the line stiffness and d l (set to 10 kNs/m) is the line damping.
The coupled Equations (5)–(7) were solved using a delayed differential equation solver (DDE) with a constant time step of 1 ms.

4. Experiments

In the simulation as well as in the physical wave tank tests the CL strategy was performed with four WECs: one central buoy without latching, two with constant latching (cWEC) time and one ANN-based lWEC. The WECs used for numerical and physical experiments differ slightly, details for both WECs can be found in Table 1.
In the numerical simulation, the central WEC was modelled as a latching WEC with a latching time of 0 s but the same damping and characteristics as the other WECs, so that it could participate in the CL as a cWEC. In the wave tank test, the generator damping for this WEC was set lower to increase the accuracy of the wave detection and therefore its power absorption is not included in the CL strategy.
The central WEC estimates extremes with its translator position. To avoid saddle points detected as extremes and problems caused by high frequency oscillations, the central WEC will wait after an extreme position until it moves a distance ε in the opposite direction, before sending the wave detection command. A sketch of the extreme detection algorithm can be found in Figure 2.

4.1. Wave Sequences

All sea states used in this paper are calculated based on the Bretschneider spectrum and are characterized by the significant wave height H s and the energy period T e .
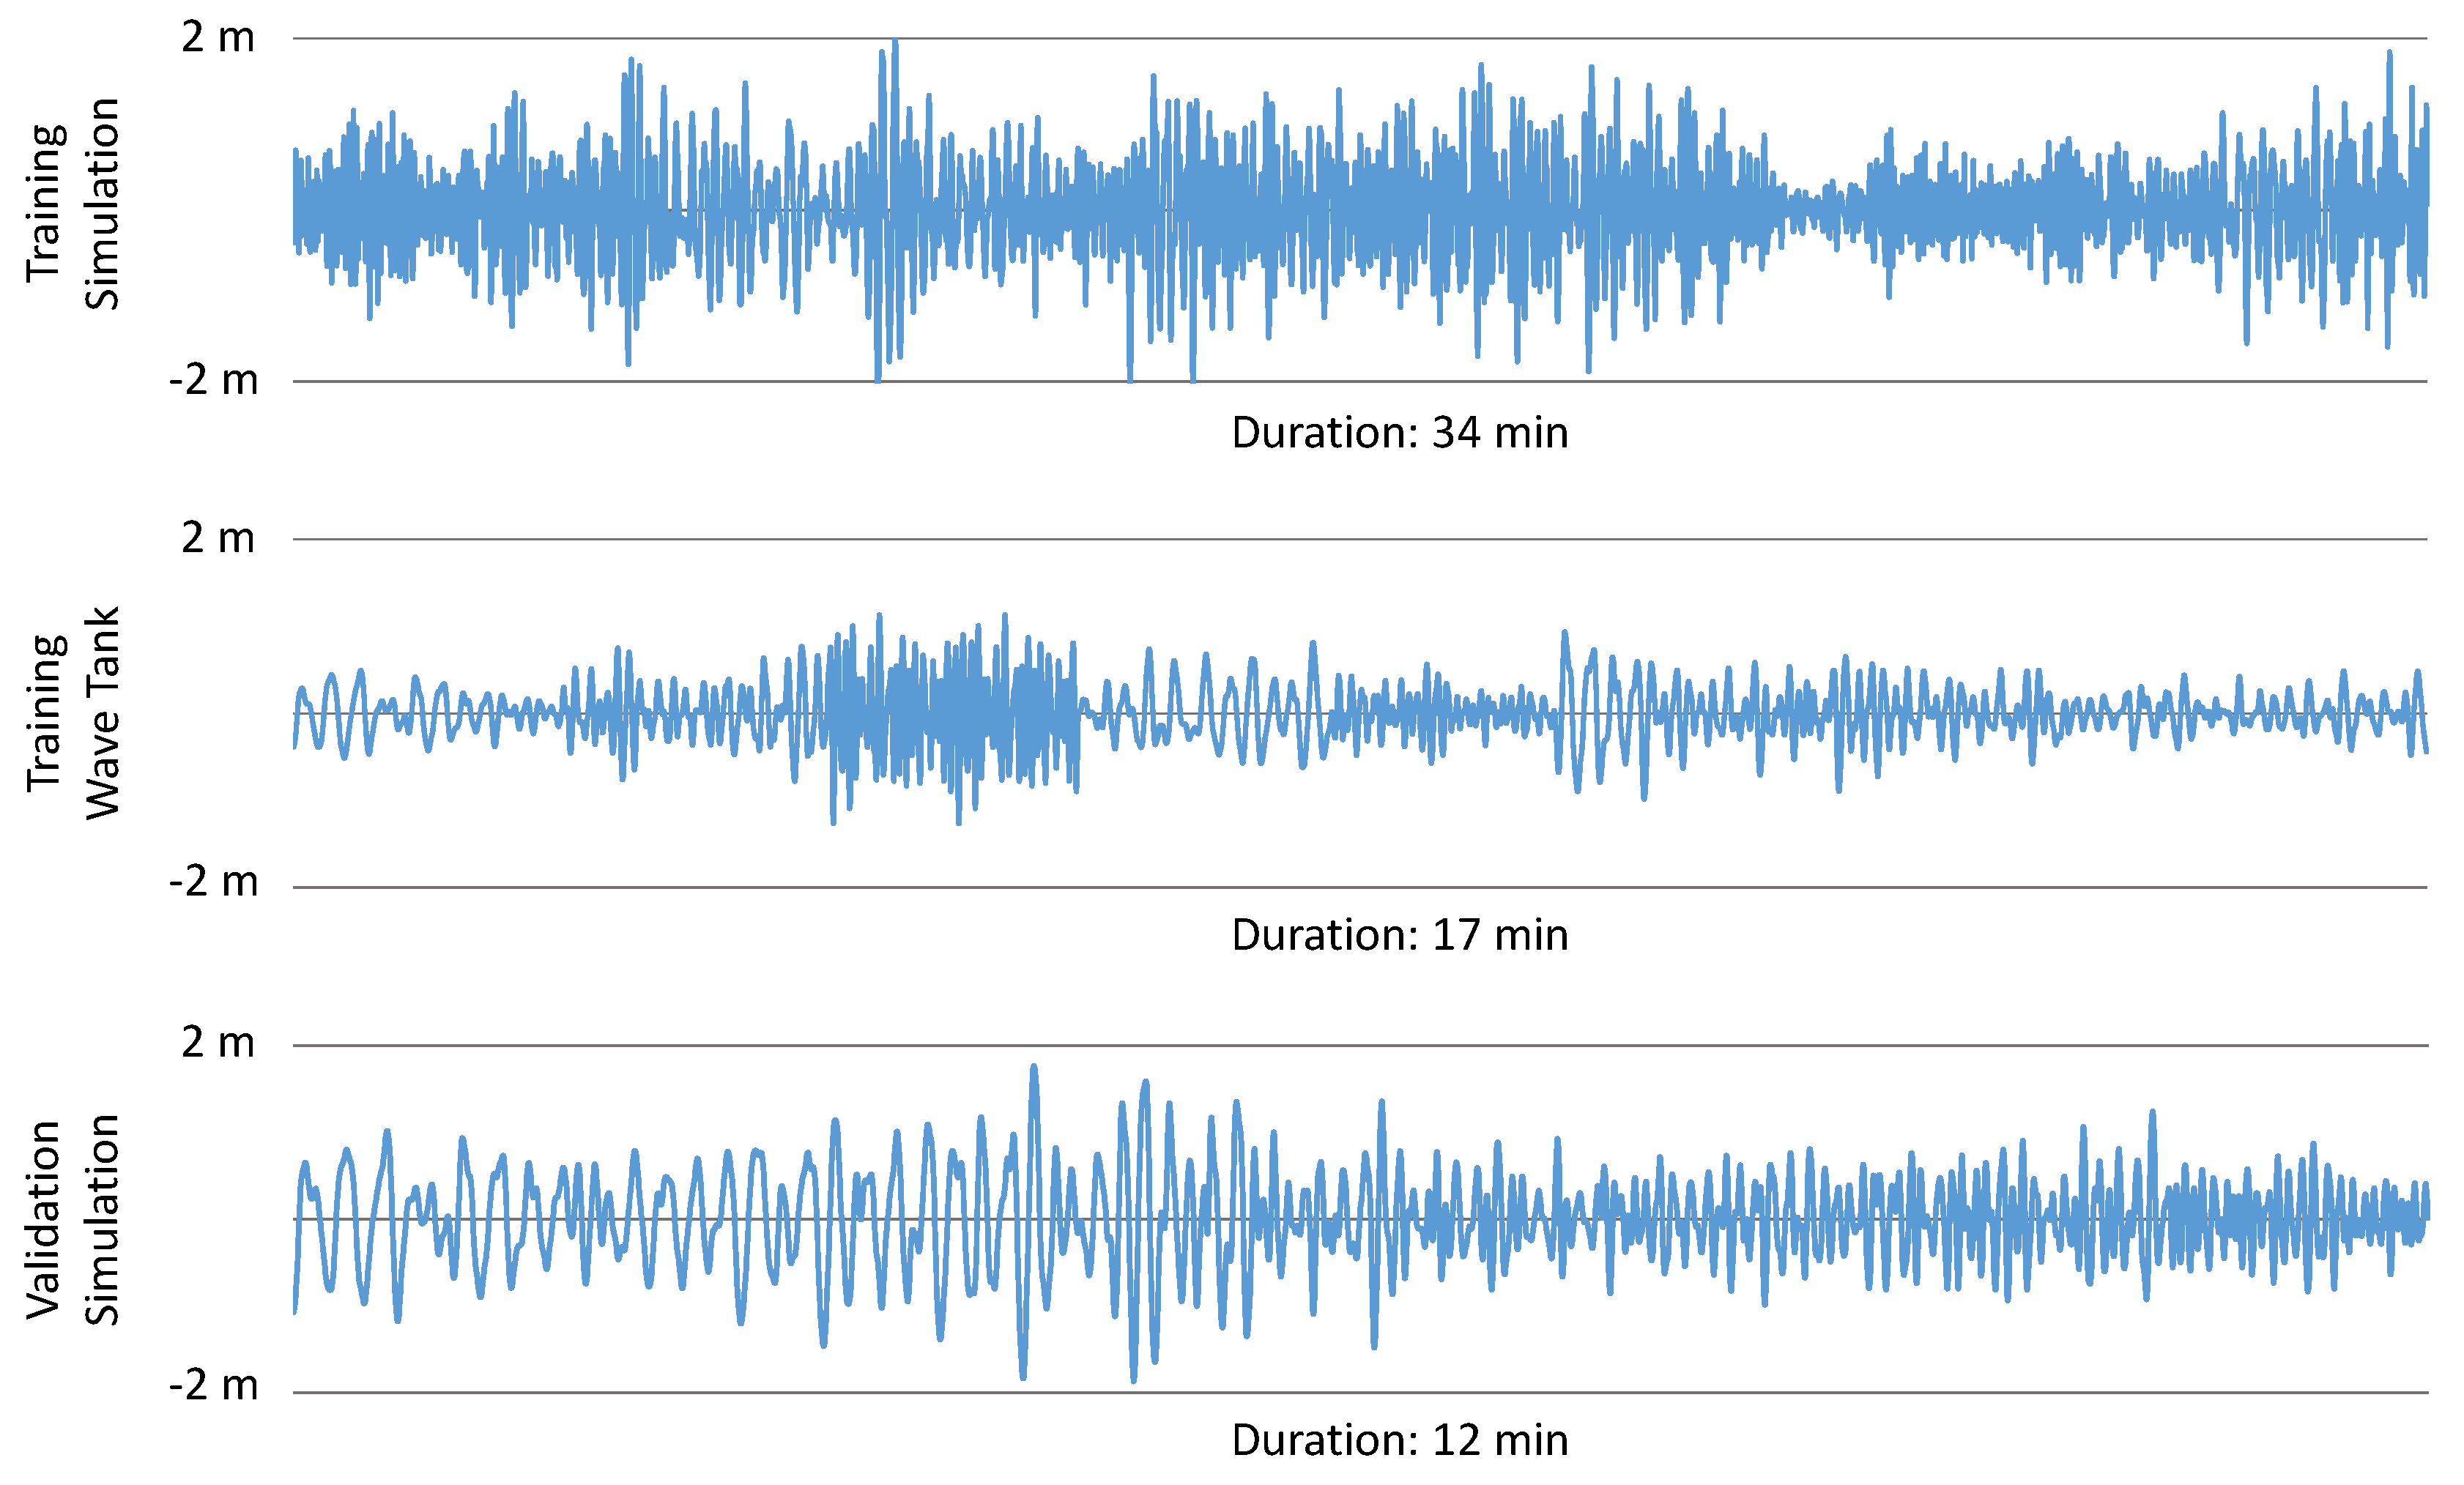
Besides single sea states used for evaluation in the numerical and wave tank tests, three wave sequences containing a medley of sea states are used for training (numerical and physical tests) and evaluation (only numerical tests). These sequences are made of wave energy periods between T e = 3.5   s , and T e = 9.5   s . In the simulation the wave heights are ranging from H s = 0.75   m to H s = 3.25   m , while for the wave tank tests they are limited to H s = 1.75   m to avoid large forces on the equipment. The training waves are longer and consist of more sea states. While using the same pool of sea states, there is no overlap of sea states between training and validation waves. Training and validation sequences can be seen in Figure 3.

4.2. Simulation

First, the latching time constant c for the linear latching control was determined with the training wave to c = 0.22 . The pre-tests showed that the position in the array has a small influence on the absorbed power: The WECs in the outer position absorbed slightly more power. Therefore, the performance of each strategy was evaluated at the same array position.

4.3. Wave Tank Test

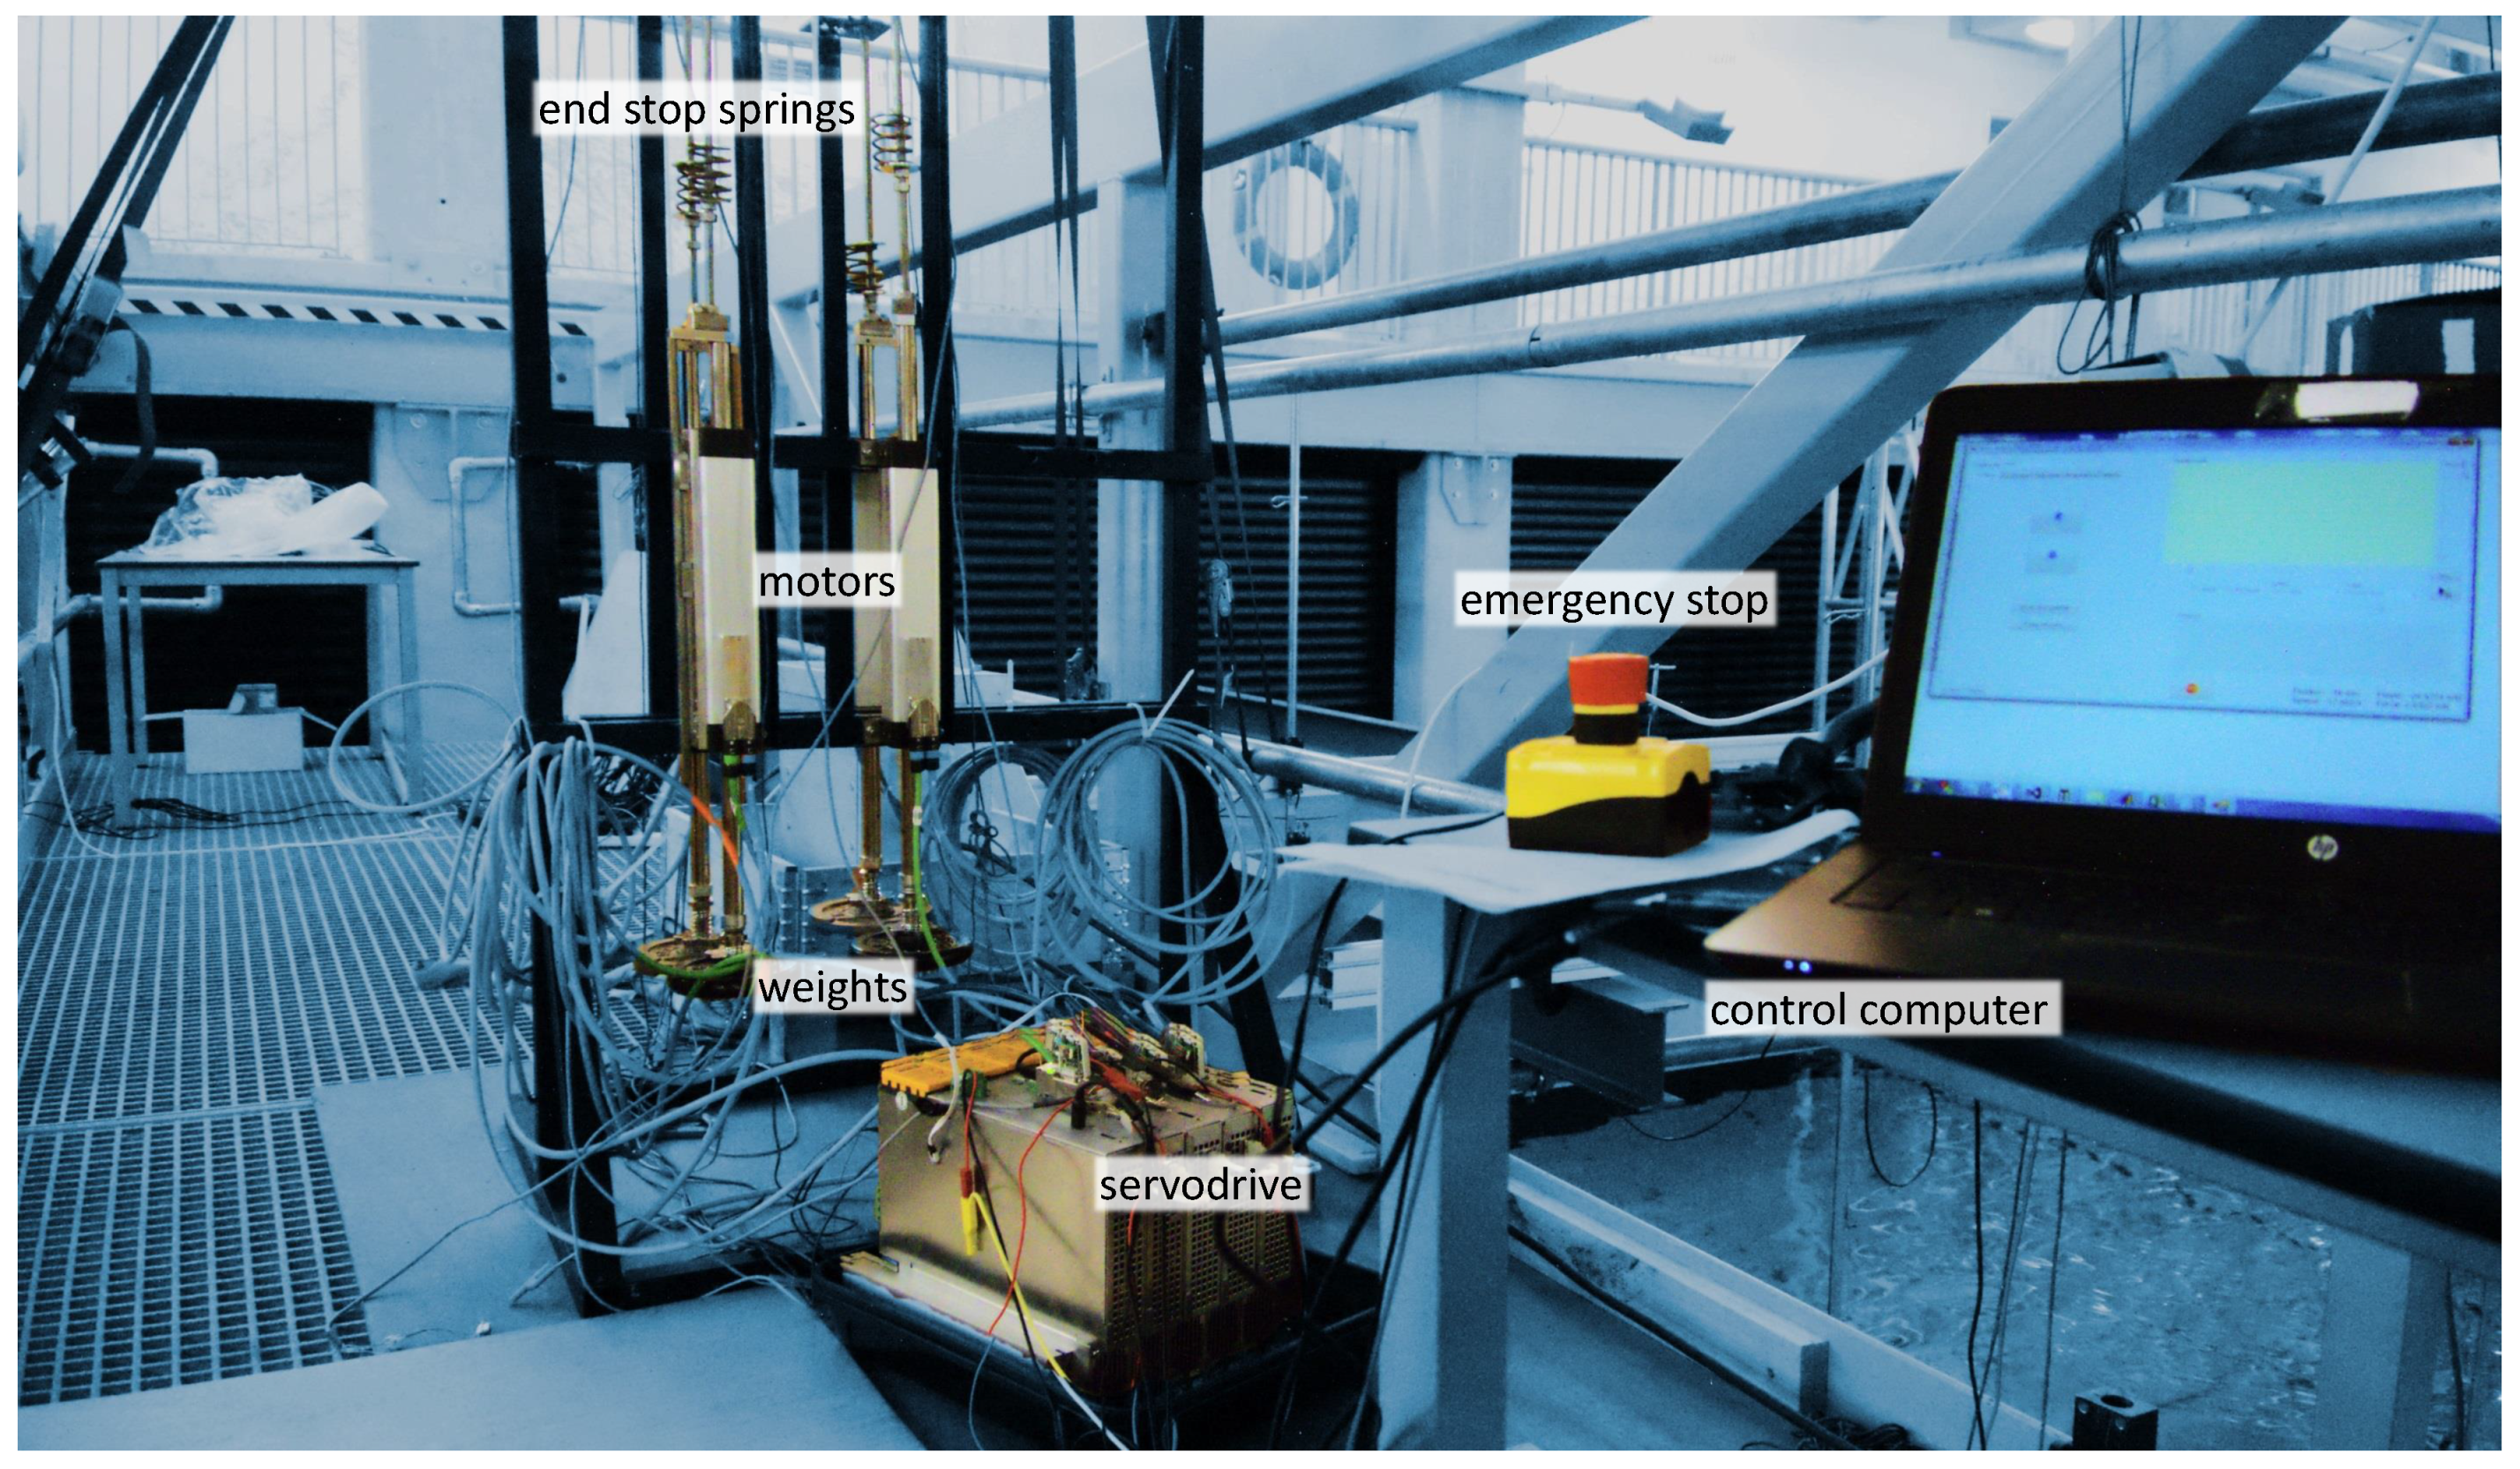
One of the big issues with advanced control algorithms and especially latching is, that they might be comparably easy to implement in a numerical simulation, but not in a real control system. To validate the strategy presented under conditions close to reality, a physical 1:10 scale model was built and tested in the ocean basin wave tank in the COAST laboratory of the University of Plymouth. The mechanical set-up, which can be seen in Figure 4, consists of a Parker ETT-050 tubular electric motor, mounted on a steel frame. A rod is installed on the top of the motor, holding one spring on the upper and lower end of the stroke length, preventing the set-up from damage when moving beyond the stroke limit. On the lower end of the rod a weight is installed, so that the total weight of the translator is about 5 kg. The translator of the motor is attached via a line to the buoy. The motor stands on a gantry over the wave basin and is connected to the buoy via a line, which is guided by a pulley system first above the gantry, then to the bottom of the wave basin and from there to the buoy. The parameters of the physical model can be found in Table 1.
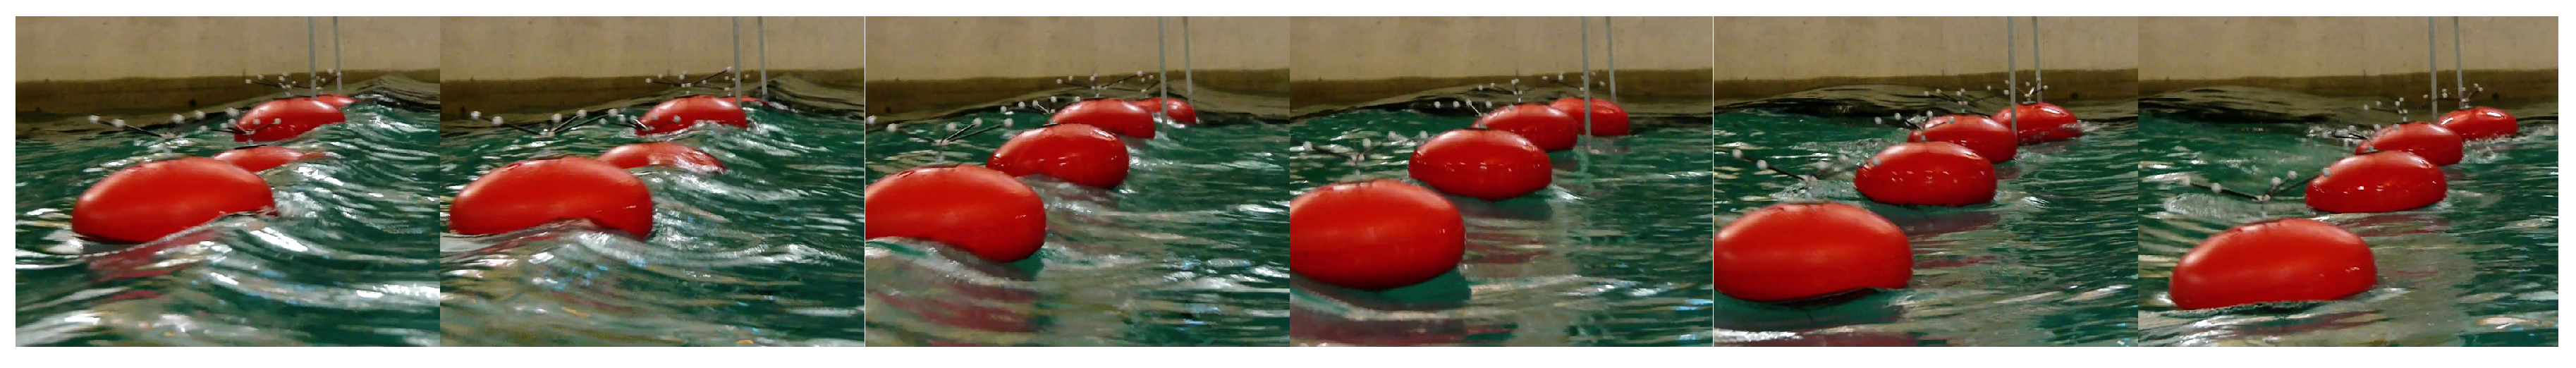
The position of the four WECs used in the wave tank can be seen in Figure 5 and the latching of a buoy in the array can be seen as a picture sequence in Figure 6. To calibrate the system different sea states were run while all WECs applied the same latching, so the influence of the position and the mechanical differences on the absorbed power of each WEC could be estimated. It showed, that the power differs significantly between the WECs: WEC D (normally performing the long constant latching time) and B (normally performing the lWEC) reaches 80% and 98% of the power of WEC A (normally performing the short constant latching time). This difference was not considered during the learning process. Small differences between the WECs may also appear in reality. However, to be able to compare the strategies accurately, the absorbed power in the results was corrected accordingly.
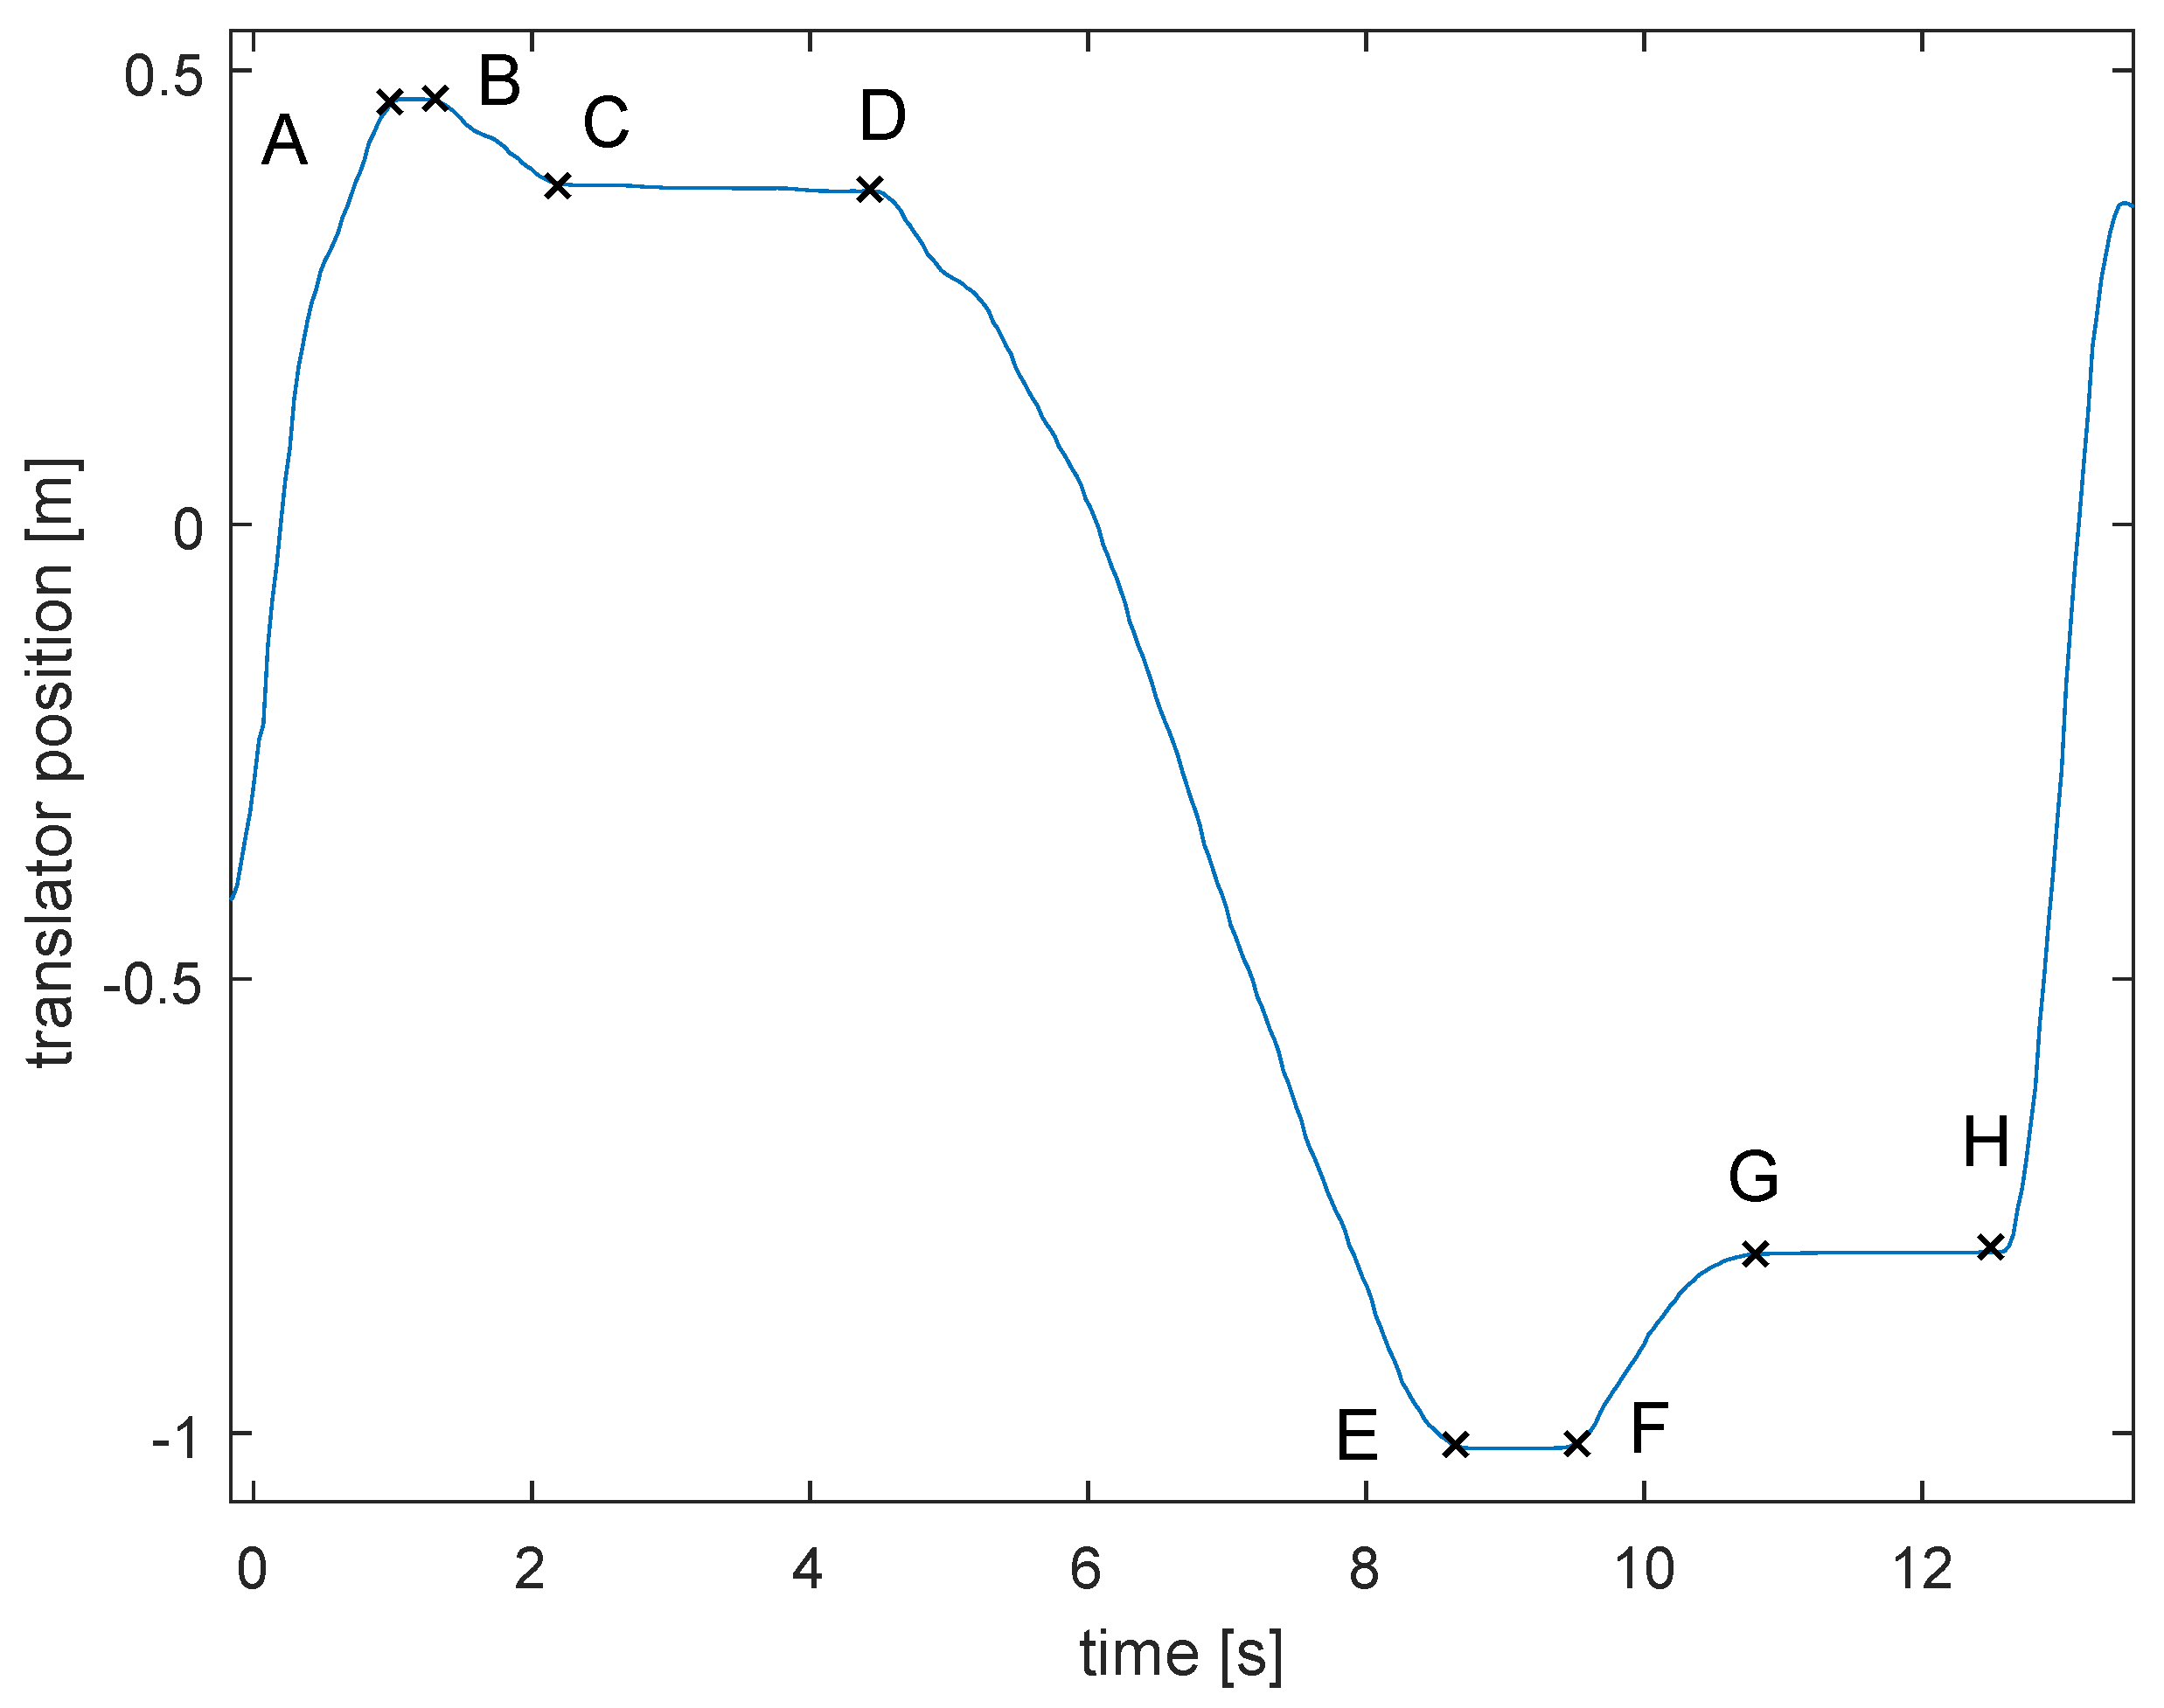
Due to limitations in the dynamics of the electromechanical system, the latching is non-ideal, as can be seen in Figure 7: In the unlatched state, while applying constant damping, the motor works in current control mode, applying a current proportional to the velocity to simulate the generator damping. Between A and B (E-F) the translator is stuck, as the motor needs time to ramp the current down. Shortly after B (F) the crest (trough) is detected, forcing the motor to switch into velocity control mode (with the set value 0) and starts ramping the motion down. Therefore, it must work against the increasing force of the generator weight (buoy). The motor is finally stopped in point C (G). At D (H) the translator is unlatched. These delays must be considered when choosing the latching time.

4.4. Differences of the CL in Numerical and Physical Tests

The control software for the physical WEC and the simulation provide the same interface for the control algorithm, so the same implementation of the ANN runs on both systems. However, the time for the wave tank test was limited and the absorbed power could not be compared as well between the WECs as in the simulation. After a few test runs it was decided to change the parameters of the algorithm slightly:
  • The number of periods which are averaged was reduced from nine to four, as the sea states in the training wave sequence were shorter.
  • The absorbed power was not considered in the learning rate.
  • The quantization of the wave periods was (due to rounding issues during the scaling conversion) limited to values between 0 and 3.12 s in steps of 0.26 s (full scale equivalent).
The learning is done in two steps: First online, during the wave tank test: Here the ANN gets direct feedback about the efficiency of its chosen values. The obtained data is then used for offline learning to speed up the process.

5. Results

5.1. Numerical Simulation

The three constant latching times were chosen, so that they represent a wide range of latching times and at the same time are not too close to the optimal constant latching time: Figure 8 shows the absorbed power in dependence of different latching times in the test wave sequence and sets the latching times used by the cWECs and the lWECs in relation. Reference (100%) is the absorbed power of the lWEC for the same wave sequence. The three constant latching times used by the cWECs during the CL training phase are indicated as orange dots and the latching time then chosen by the lWEC as grey diamonds. It is remarkable, how the lWEC chooses its latching times compared to the optimal constant latching time (1 s) and the constant latching times used to train it (0 s, 1.5 s and 3 s): Despite the fact that the latching times used to learn the lWEC are far away from the optimal constant latching time, the lWEC learned to choose latching times closer to the optimal value: one is 0.25 s longer and one is 1 s shorter than the optimal constant latching time. As this is the validation sequence, the lWEC was never trained on it, but instead relied on the training it had received during the training sequence.
Figure 9a,b marks the applied latching time that resulted in the highest power absorption (the winning latching time) for each event initiated by the central WEC. The glowing blue dots represents the chosen latching time of the lWEC, corresponding to the grey diamonds in Figure 8. It is clearly visible that all cWECs have winning latching times (orange dots in Figure 9), so they all actively participated in training the lWEC.
The chosen latching time of the lWEC is also compared to the linear latching time. Figure 10 shows how the strategies differ: While the linear latching time is proportional to the mean wave period (circles outside this line are errors that occurred when combining the data sequence of several runs and are caused by the slightly different sea states due to reflections and radiated waves), the ANN of the lWEC switches between only two values: For periods under 3.5 s and over approximately 4.8 s the 1.25 s latching time is chosen; for the periods in-between the ANN outputs a latching time of 0.5 s.
The lWEC, the linear latching time WEC and the best performing cWEC (according to Figure 8: 1.25 s) were then used to generate a power matrix using 15 sea states with a full scale equivalence duration of 20 min and ranging between H s = 0.75 m, T e = 3.5 s and H s = 3.25 m, T e = 9.5 s. As reference a WEC without latching is used. The results can be seen in Figure 11.

5.2. Physical Scale Test

The latching times for the cWECs were chosen to 0.25   s and 2.62   s (full scale equivalent). After the training, the strategy was evaluated in two sea states, with H s = 1.75   m and T e = 9.5   s and T e = 4.5   s . The absorbed power of all WECs for each sea states as well as the accumulated power over both sea states can be seen in Figure 12, where the mean power of all WECs in a category is used as reference.

6. Discussion

6.1. Challenges for Learning

The performance of an ANN depends heavily on how good the different output patterns can be identified based on the input data. The challenge for the ANN can be seen in Figure 9b: The latching times leading to the highest power absorption (orange dots) for a mean wave period, are widely distributed. A correlation between mean wave period and latching time can hardly be recognized, but this data is the basis on which the ANN must find its strategy. The reasons for the noise are various:
  • The periods and wave heights vary a lot between the wave crest and trough, so the mean wave period is only a rough indicator on what period the next wave will have.
  • The wave height has an influence on the optimal latching time.
  • The dynamic state of the WEC has an influence. A WEC might be in a better latching position compared to another because of the previous chosen latching time.

6.2. The ANN Strategy

The idea behind comparing the linear latching time with the ANN is the fact that linear relationships are hard to learn for ANNs, especially as the ANN in this paper is designed as a classical categorizing network. ANNs categorize the inputs with hyperplanes; a linear correlation would require many hyperplanes and thus a very complex (“deep”) ANN. The latching times chosen by the ANN, which can be seen from the grey diamonds in Figure 10, is the opposite to that of the linear latching control: Just two latching times were chosen in dependence of the mean wave period (see Figure 9b). The number of latching times used may be limited by the noisy learning data, the use of just one input parameter and the size of the network. However, even with just two latching times, the ANN is able to use them very efficiently: The chosen values are mostly lower than these used by the linear latching algorithm which can be understood as a conservative approach: A shorter latching time will absorb power in the case that the wave is longer than expected as well as if the wave is shorter than expected. If the latching time is bigger than the optimum, there is the chance that no power is absorbed at all. Contrary to that observation, for wave periods below 3.2 s, a high latching time is used (see Figure 9b). Two possible explanations can be given: Mean wave periods smaller than 3.2 s occur rarely, this might not happen often enough to train the network properly. However, the ANN is, despite the high latching period, successful. A powerful long period wave among the low-power, short period waves may also lead to a beneficial high latching.

6.3. Performance in the Numerical Simulation

Comparing the absorbed power of the cWEC with the linear latching WEC and the lWEC in the power matrix shown in Figure 11, both the lWEC and the linear latching WEC perform better than the cWECs in 80% of all tested sea states. The linear latching time WEC is beneficial over the lWEC in 73% of all sea states. However, the differences between linear latching and lWEC are mostly very small. The optimal natural frequency of the WEC for a specific wave period should decrease as the wave height increases (see [23]). In agreement with this, the advantage of the linear latching WEC over the cWEC gets smaller for higher waves. However, for the lWEC this relationship is not as clear: For the wave period of T e = 3.5 s, the cWEC outperforms the lWEC for the lowest wave height, while for all other wave heights the lWEC absorbs more power. This might be explained with the conservative approach the ANN learned. Further experiments could use the mean wave height as a second input which could have the potential to significantly increase the absorbed power of the lWEC, as it eases the classification of the sea states.
Noticeable is also the good performance of the constant latching time. The reason for this is probably due to the low inertia and generator damping leading to high oscillation frequency of the WEC and making it to ideal devices for latching, but also leading to a poor capture width without control. In a small region around T e = 5.5   s / H s = 1.75   m , it outperforms the cWEC and the lWEC, showing that an uncontrolled WEC with its natural frequency properly tuned to a wave frequency may in a small number of sea states harvest as much energy as a controlled one. See also [23,24] for proposals of uncontrolled WECs designed to match the frequencies of specific sea states.

6.4. Wave Tank Test Results

In a controlled environment where the dynamics of the devices are known, a model-based optimal control strategy as presented in various articles before (see [9] for latching and [25,26] for damping control) may be the best solution. However, when it comes to the non-ideal and highly non-linear physical WEC model, the robustness of the controller is challenged, which is the main reason for developing model-free strategies. The imperfection of the physical model and the wave tank were seen as ideal for testing the CL strategy: Due to reflection of the wave tank, the generated wave has some noise. The dead time in the latching mechanics, manufacturing and assembling tolerances lead to slightly different characteristics of the WECs. Therefore, the assumption that the characteristics and surface elevation are equal for all WECs is violated. When comparing small to full scale one need to consider inevitable scaling effects, this is well described in [27]. However, issues regarding the used Froude scaling were not considered in this work, as the above-mentioned disturbances may be several magnitudes higher.
For the wave tank tests, the advantage of the CL control compared to a constant latching time is smaller than in the simulation. While in the simulation the lWEC absorbs about 30% more power than the best cWEC in some sea states, in the wave tank test this benefit shrinks to 3 %, as can be seen in Figure 12. This must be put into perspective by the fact, that in the wave tank test the absorbed power of the different latching times differ only slightly between the sea states (about 8%). It may be due to the WEC’s non-ideal latching behavior. However, more important than an increase in absorbed power is the fact that the CL strategy is robust enough to handle the noises and different behavior between the WECs.
In addition to the increased overall power, Figure 12 shows that the ANN latching time performance is more balanced than the constant latching time periods; In both sea states the power absorption is above the average, but not dominant over the best cWEC: In the T e = 4.5   s sea state it is beaten by the short latching time, and in the T e = 7.5   s sea state it absorbs only 1% more power than the long latching time. However, it is always significantly better (5% and 8%) than the worst cWEC. As an implication of this, the CL strategy could lead not only to increased total power absorption, but also to lower power fluctuations, which is a desired result when connecting the wave energy devices to the electric grid.

6.5. Comparison to Central Pattern Generator Control

Unlike the controller presented in this paper, the neural inspired controller (Lamprey central pattern generator) in [28] triggers the unlatching based on the buoy’s displacement and its internal pattern generator; the weights of the network are optimized by a genetic algorithm. In numerical simulations it outperforms optimal damping by more than +225% for a single buoy in an irregular sea state, which is more than the benefit the lWEC has over a not optimized non-latching WEC in this paper. Since the results between the papers are not directly comparable due to the different sea states and WECs, it would be interesting to see how the central pattern generator would perform in CL.

7. Conclusions and Outlook

In this paper, a collaborative control strategy, that parallelizes the training of a machine learning algorithm for WECs in an array is presented. The strategy was first presented in [
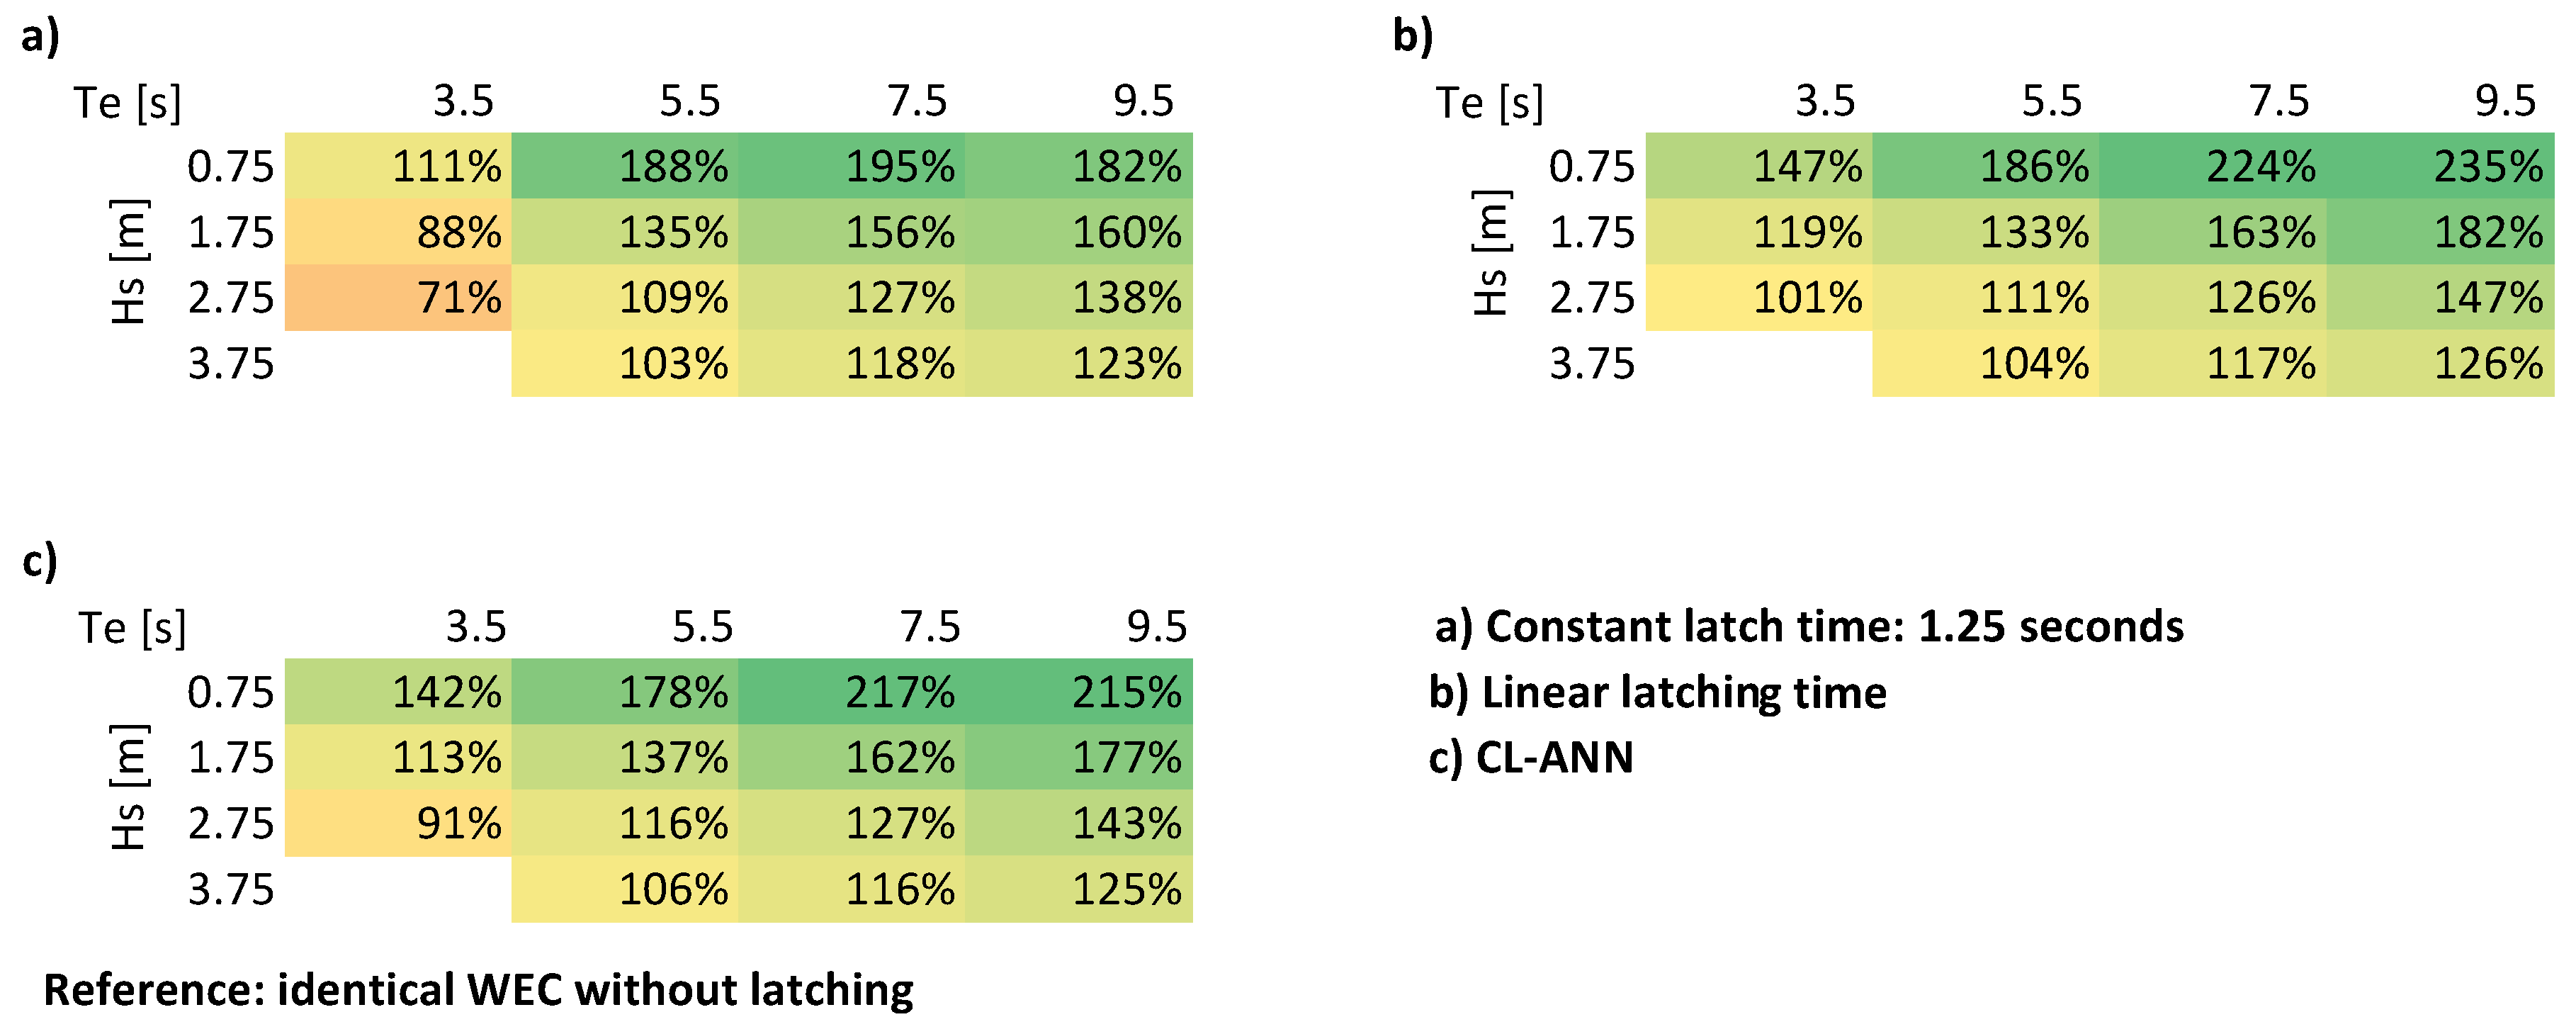
14] for a generator damping control and in this paper adapted for latching control. The lWEC was able to absorb more power than all cWECs, in the numerical simulation and in the wave tank tests, reaching nearly the efficiency of a WEC with average wave period proportional latching time. Unlike most control strategies it is not relying on a model; a complex characterization and modelling of the device, as for example mandatory for model prediction control, is not necessary.
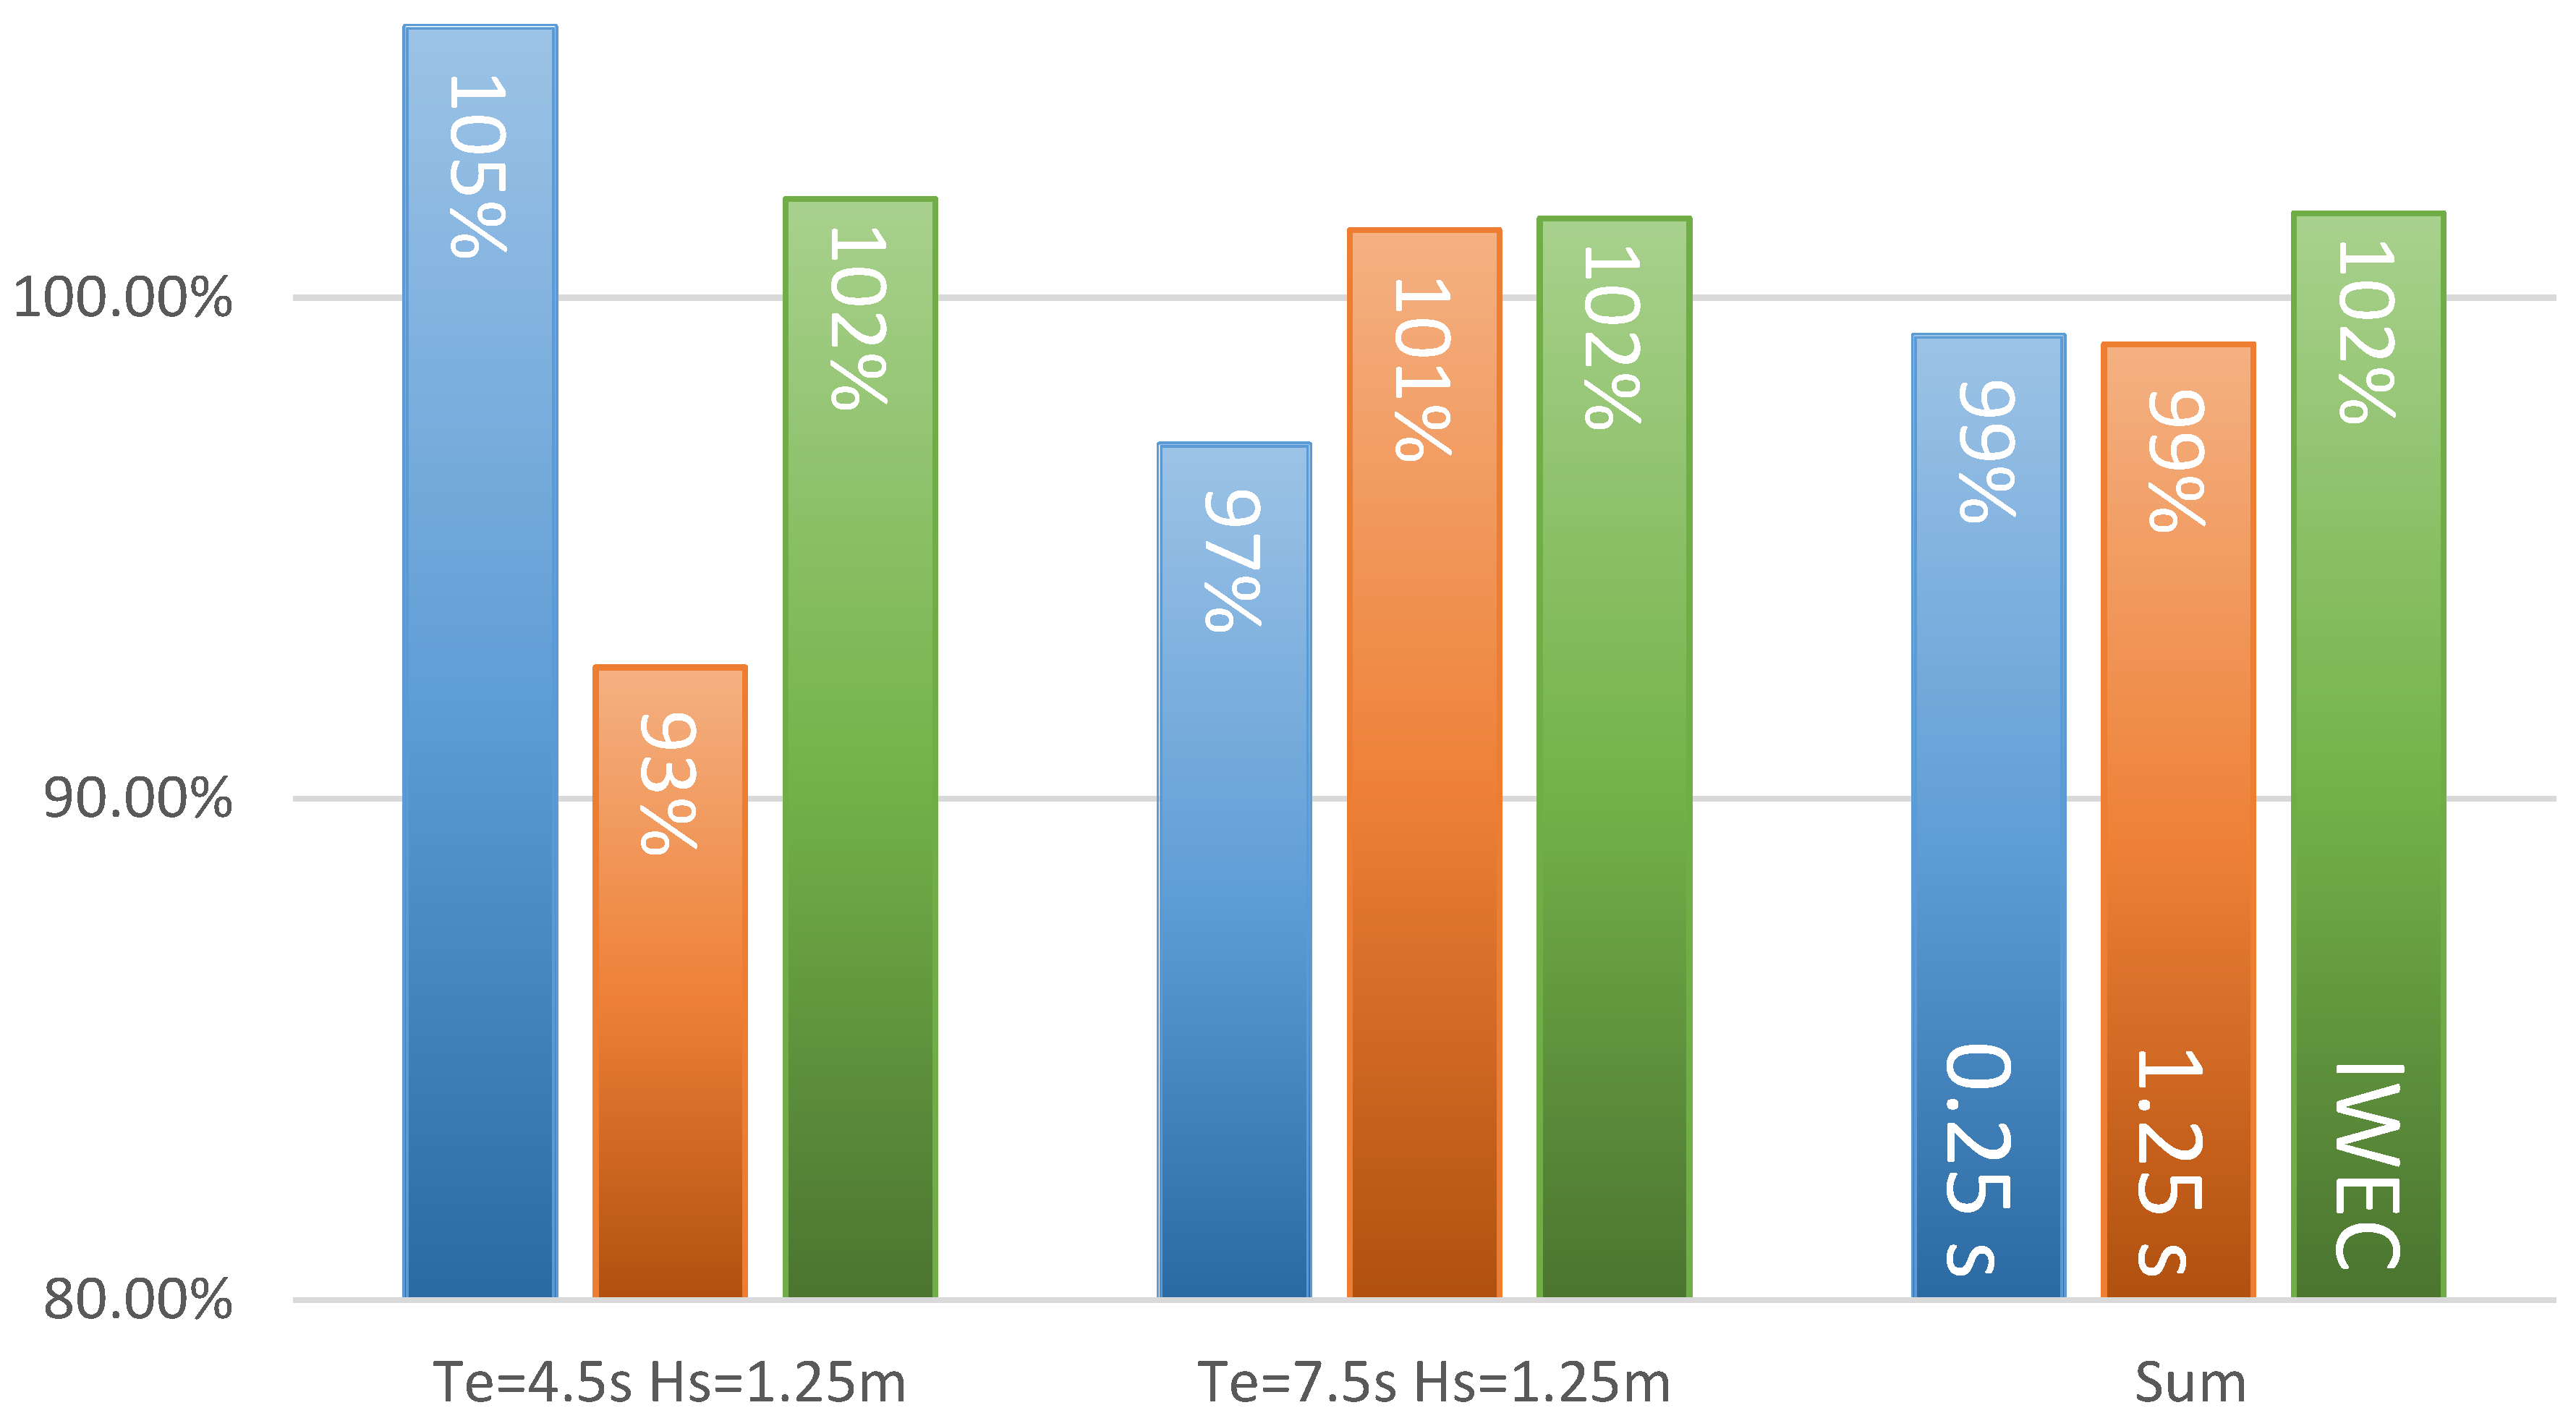
In the simulation, for some sea states the lWEC absorbs more than 30% more power compared to the best constant latching time in the test wave, and more than double the amount of the WEC without latching. The benefit is smaller in the wave tank test, were the lWEC absorbs overall only +3% more power than the best constant latching. This is caused by a non-optimal latching WEC, which lowers the advantage of the latching strategy in general.
A model-free, robust and easy to implement control algorithm with high efficiency is of course the ultimate goal of a control strategy, and it is, therefore, not surprising that this control strategy performs well when it comes to simplicity and robustness but is not as efficient as previously proposed model predictive or optimal control algorithms. However, the concept of collaborative learning is promising.
Another limitation is how the strategy handles omnidirectional waves and differences in the characteristic of the WECs. Here, an internal model of the WEC itself and a representation of the wave farm layout (maybe both combined in a self-organizing feature map) can be a possible solution. However, the wave tank test showed that it tolerates small divergences in the WECs characteristics.
With just one input parameter, the mean wave period of the previous waves, and a very small ANN, the lWEC used in this paper is very simple. Further work could focus on more complex ANNs, using more or different input units, for example adding the mean wave height or using a convolution network with a wave sequence as input, which could lead to a better categorization and may increase the performance of the lWEC significantly.

Author Contributions

The general conceptualization and methodology were done by S.T. who also wrote most of the paper. The conceptualization and design of the physical PTO were done by J.E., M.E. and S.T. For the planning of the wave tank experiments M.H. contributed with his experiences. The simulation tool was written by S.T. based on previous work from M.E. M.G., J.E. and J.I. were involved in all stages of the project and contributed with ideas and advice. Project administration, including supervision, was done by M.G., J.E., M.E., M.H. and J.I. M.G., J.E. and J.I. were furthermore responsible for the funding acquisition. All authors contributed to the paper with reviewing and editing.

Funding

The authors want to thank the Swedish Energy Agency (project number 40421-1), the Swedish Research Council (VR, grant number 2015-04657) and the Åforsk Foundation (ref. nr. 16-591) for funding this research. This work was supported by Stand Up for Energy.

Acknowledgments

This paper would not exist in this form without the help of Tom Tosdevin who helped with the wave tank tests. With their fast and uncomplicated help from the team of Plymouth University’s COAST laboratory, especially Kieran Monk, Alastair Reynolds, Hannah Poulson, Gregory Nash and Andy Oxenham played an important part in securing that the PTO was finished in time.

Conflicts of Interest

The authors declare no conflict of interest.

Abbreviations

The following abbreviations are used in this manuscript:
ANNArtificial neural network
BEMBoundary equation method
CLCollaborative learning
COAST laboratoryCoastal, ocean and sediment transport laboratory;
Facility at the University of Plymouth containing the wave tank
DDEDelayed differential equation
ggravity acceleration
PTOPower take-off
WAMITWaveAnalysisMIT; Wave interaction analyzing tool
WECWave energy converter

References

  1. International Energy Agency. Electricity Statistics. Available online: https://www.iea.org/statistics/ (accessed on 21 July 2018).
  2. International Energy Agency. World Energy Outlook 2017. Available online: https://www.iea.org/weo2017/ (accessed on 21 July 2018).
  3. Clément, A.; McCullen, P.; Falcão, A.; Fiorentino, A.; Gardner, F.; Hammarlund, K.; Lemonis, G.; Lewis, T.; Nielsen, K.; Petroncini, S.; et al. Wave energy in Europe: current status and perspectives. Renew. Sustain. Energy Rev. 2002, 6, 405–431. [Google Scholar] [CrossRef]
  4. Chozas, J.; Kofoed, J.; Sørensen, H.C. Predictability and Variability of Wave and Wind: Wave and Wind Forecasting and Diversified Energy Systems in the Danish North Sea; Technical report; Department of Civil Engineering, Aalborg University: Aalborg, Denmark, 2013. [Google Scholar]
  5. Drew, B.; Plummer, A.R.; Sahinkaya, M.N. A review of wave energy converter technology. Proc. Inst. Mech. Eng. Part A: J. Power Energy 2009, 223, 887–902. [Google Scholar] [CrossRef] [Green Version]
  6. Todalshaug, J.; Falnes, J.; Moan, T. A Comparison of Selected Strategies for Adaptive Control of Wave Energy Converters. J. Offshore Mech. Arct. Eng. 2011, 133. [Google Scholar] [CrossRef]
  7. Budal, K.; Falnes, J. Wave power conversion by point absorbers. Nor. Marit. Res. 1978, 6, 2–11. [Google Scholar]
  8. Babarit, A.; Duclos, G.; Clément, A. Comparison of latching control strategies for a heaving wave energy device in random sea. Appl. Ocean Res. 2004, 26, 227–238. [Google Scholar] [CrossRef]
  9. Valério, D.; Beirão, P.; da Costa, J.S. Optimisation of wave energy extraction with the Archimedes Wave Swing. Ocean Eng. 2007, 34, 2330–2344. [Google Scholar] [CrossRef]
  10. Lopes, M.; Todalshaug, J.; Gomes, R.; Moan, T.; Gato, L.; Falcao, A. Experimental and numerical investigation of non-predictive phase-control strategies for a point-absorbing wave energy converter. Ocean Eng. 2009, 36, 386–402. [Google Scholar] [CrossRef]
  11. Mundon, T.R.; Murray, A.F.; Hallam, J.; Patel, L.N. Causal Neural Control of a Latching Ocean Wave Point Absorber. In Artificial Neural Networks: Formal Models and Their Applications—ICANN 2005: 15th International Conference, Warsaw, Poland, September 11–15, 2005. Proceedings, Part II; Duch, W., Kacprzyk, J., Eds.; Springer: Berlin/Heidelberg, Germay, 2005; pp. 423–429. [Google Scholar]
  12. Feng, Z.; Kerrigan, E.C. Latching control of wave energy converters using derivative-free optimization. In Proceedings of the 52nd IEEE Conference on Decision and Control, Florence, Italy, 10–13 December 2013. [Google Scholar] [CrossRef]
  13. Meunier, P.E.; Alain, H.; Gilloteaux, J.C.; Kerkeni, S. Development of a methodology for collaborative control within a WEC array. In Proceedings of the 12th European Wave and Tidal Energy Conference, Cork, Ireland, 27 August–1 September 2017. [Google Scholar]
  14. Thomas, S.; Giassi, M.; Göteman, M.; Eriksson, M.; Isberg, J.; Ransley, E.; Hann, M.; Engström, J. A model free control based on machine learning for energy converters in an array. Preprints 2018, 2018100774. [Google Scholar] [CrossRef]
  15. Castro, A.; Carballo, R.; Iglesias, G.; Rabuñal, J. Performance of artificial neural networks in nearshore wave power prediction. Appl. Soft Comput. 2014, 23, 194–201. [Google Scholar] [CrossRef]
  16. Ni, C.; Ma, X. Prediction of Wave Power Generation Using a Convolutional Neural Network with Multiple Inputs. Energies 2018, 11, 2097. [Google Scholar] [CrossRef]
  17. Sánchez, A.S.; Rodrigues, D.A.; Fontes, R.M.; Martins, M.F.; de Araújo Kalid, R.; Torres, E.A. Wave resource characterization through in-situ measurement followed by artificial neural networks’ modeling. Renew. Energy 2018, 115, 1055–1066. [Google Scholar] [CrossRef]
  18. Anderlini, E.; Forehand, D.; Bannon, E.; Abusara, M. Reactive control of a wave energy converter using artificial neural networks. Int. J. Mar. Energy 2017, 19, 207–220. [Google Scholar] [CrossRef]
  19. Kraft, K.; Sjölund, J. Artificiella Neurala Nätverk För Punktabsorberande Vågkraftverk: Energiuppskattning Och Aktiv Styrning. Master’s Thesis, Uppsala University, Uppsala, Sweden, 2016. [Google Scholar]
  20. Borgarino, B.; Babarit, A.; Ferrant, P. Impact of wave interactions effects on energy absorption in large arrays of wave energy converters. Ocean Eng. 2012, 41, 79–88. [Google Scholar] [CrossRef]
  21. Giassi, M.; Göteman, M.; Thomas, S.; Engström, J.; Eriksson, M.; Isberg, J. Multi-parameter optimization of hybrid arrays of point absorber Wave Energy Converters. In Proceedings of the 12th European Wave and Tidal Energy Conference, Cork, Ireland, 27 August–1 September 2017. [Google Scholar]
  22. WAMIT User Manual Version 7.0; User Manual; WAMIT, Inc.: Chestnut Hill, MA, USA, 2013.
  23. Thomas, S.; Giassi, M.; Göteman, M.; Hann, M.; Ransley, E.; Isberg, J.; Engström, J. Performance of a Direct-Driven Wave Energy Point Absorber with High Inertia Rotatory Power Take-off. Energies 2018, 11, 2332. [Google Scholar] [CrossRef]
  24. Engström, J.; Eriksson, M.; Isberg, J.; Leijon, M. Wave energy converter with enhanced amplitude response at frequencies coinciding with Swedish west coast sea states by use of a supplementary submerged body. J. Appl. Phys. 2009, 106. [Google Scholar] [CrossRef]
  25. Wang, L.; Engström, J.; Göteman, M.; Isberg, J. Constrained optimal control of a point absorber wave energy converter with linear generator. J. Renew. Sustain. Energy 2015, 7. [Google Scholar] [CrossRef]
  26. Li, G.; Belmont, M.R. Model predictive control of sea wave energy converters—Part I: A convex approach for the case of a single device. Renew. Energy 2014, 69, 453–463. [Google Scholar] [CrossRef]
  27. Viviano, A.; Naty, S.; Foti, E. Scale effects in physical modelling of a generalized OWC. Ocean Eng. 2018, 162, 248–258. [Google Scholar] [CrossRef]
  28. Mundon, T.; Murray, A.F.; Wallace, A.R. Toward a Biologically Inspired, Neural Control Mechanism for Multiple Degree of Freedom Wave Energy Converters. In Proceedings of the 9th European Wave and Tidal Energy Conference, Southampton, UK, 5–9 September 2009. [Google Scholar]
Figure 1. The artificial neural network uses a linear activation function for the input, logistic activation function for the hidden units and a SoftMax for the output.
Energies 11 03036 g001
Figure 2. Flowchart of the algorithm used to detect the latch event, which is executed by the central WEC in both the numerical and the physical tests. After a maximum is detected, the central WEC waits for a decrease specified by the threshold ε , then it sends the latch event. Then the central WEC starts waiting for a minimum. As soon as it is detected, the central WEC waits for an increase. As soon as the position is higher than the minimum plus the threshold ε it sends the latch event again. Then the search for a crest starts again. Short cuts (arrows in red and green) between the states ensure that the algorithm never gets stuck when overlooking an extreme.
Energies 11 03036 g002
Figure 3. Time series of the wave sequences used for training and validation.
Energies 11 03036 g003
Figure 4. Set-up for the wave tank test. From middle to the right: The four linear motors on the frame, the servodrives; on the table: emergency stop and control computer.
Energies 11 03036 g004
Figure 5. The four buoys in the wave tank.
Energies 11 03036 g005
Figure 6. Picture sequence of latching of buoy B (second buoy from front) during collaborative learning: in the first picture the buoy is latched and significantly lower than the surrounding buoys. In picture 2 the wave crest is close to the buoy, which is released and in picture 3, it is on the same height as the other buoys. In picture 4 and 5 the buoy stays unlatched and is getting in phase with the wave again, before the latching starts again during the trough (picture 6).
Energies 11 03036 g006
Figure 7. The latching sequence for a latch time of 2.5 s at a regular wave with a period of 11.5 s and a significant wave height of 1.25 m. Point A-C (E-G) indicate the process from detecting a maximum (minimum) until stopping the translator movement, while D (H) indicates the unlatching point.
Energies 11 03036 g007
Figure 8. Plot of all relevant latching times and their relationship to the optimal constant latching time: In blue, a constant latching time sweep for the evaluation wave sequence. On this curve the latching times applied by the lWEC after training (grey diamonds) and the constant latching times used by the cWECs during learning (orange) are plotted. The reference (100%) is the absorbed power of the lWEC in this wave sequence. Obtained with the numerical simulation.
Energies 11 03036 g008
Figure 9. The winning latching times (in orange) plotted over the time duration of the wave sequence (a) and the mean wave period (b). Each point represents one interval between the extremes. The latching times of the lWEC are marked as glowing blue points. Recorded during the evaluation wave sequence with one central WEC, two cWECs and one lWEC. Obtained with the numerical simulation.
Energies 11 03036 g009
Figure 10. The chosen latching time of the lWEC (orange circles) compared to that of the linear latching controller (blue circles). The size of the circle is proportional to the absorbed power. The yellow solid dot inside a circle states that this latching time is best. Obtained with the numerical simulation.
Energies 11 03036 g010
Figure 11. Power matrices of three latching strategies in relation to a constant damping, no latching strategy. Damping for all WECs was set to 70   kNs / m . Obtained with the numerical simulation.
Energies 11 03036 g011
Figure 12. Absorbed power of the three PTOs (two cWECs with 0.25 s and 1.25 s latching time and one lWEC) during the wave tank test in two sea states. Reference is the mean value of the absorbed power for all WECs for the specific sea state. The significant wave height is for all cases H s = 1.25   s . The sum is then formed by adding the absorbed power of both sea states. Obtained with experimental data.
Energies 11 03036 g012
Table 1. Parameters of the simulation and physical model. The latter is Froude-scaled full scale equivalent.
ParameterSimulationPhysical Model
translator mass ( m w )5000 kg5000 kg
buoy mass ( m b )5000 kg5000 kg
buoy shape ( m b )cylindricalellipsoid
buoy diameter ( m b )3.2 m5 m
stroke length ( m b )unlimited3.2 m
PTO damping ( d P T O )150 kNm/s63 kNm/s

