Technical Note

Joint Elasticity Effect on the Failure Behaviours of Rock Masses using a Discrete Element Model

1
The State Key Laboratory of Coal Resources and Safe Mining, School of Mines, Key Laboratory of Deep Coal Resource, Ministry of Education of China, China University of Mining & Technology, Xuzhou 221116, China
2
School of Civil, Environmental and Mining Engineering, The University of Adelaide, Engineering North, Adelaide, SA 5005, Australia
3
Department of Transportation Science and Engineering, Beihang University, Beijing 100191, China
*
Author to whom correspondence should be addressed.
Energies 2018, 11(11), 2968; https://doi.org/10.3390/en11112968
Submission received: 14 September 2018 / Revised: 28 October 2018 / Accepted: 29 October 2018 / Published: 1 November 2018

Abstract

:
It is widely accepted that the mechanical properties and failure behaviours of a rock mass are largely dependent upon the geometrical and mechanical properties of discontinuities. The effect of joint elasticity on the failure behaviours of rock masses is investigated using a discrete element model, namely, the synthetic rock mass model. Here, uniaxial compression tests of the numerical model are carried out for the rock mass model with a persistent joint to analyse the role of joint elasticity in the failure process with various joint orientations, β. A strong correlation between the joint elasticity and failure strength is found from the simulation results: a positive relationship when the joint orientation β < φ j ; a negative relationship when the joint orientation φ j < β < 90 ° ; and a very limited effect when the joint orientation β = 90 ° . Additionally, it is shown that the joint elasticity is the governing factor in the transition of failure modes, especially from the sliding failure mode along the joint to the mixed sliding-tensile failure mode.

1. Introduction

Rock masses are naturally heterogeneous and discontinuous because of pre-existing weaknesses such as discontinuities, pores, inclusions, etc. Undoubtedly, the mechanical properties and failure behaviours of rock masses are largely influenced by these pre-existing weaknesses.
Most rock masses demonstrate anisotropic characteristics regarding strength and deformation properties due to the orientated weaknesses such as bedding, layering and lamination planes or fractures [1,2,3]. The estimation of anisotropic mechanical properties for these rock masses is critically important in rock engineering applications such as rock slope, rock tunnel, underground excavation, etc. To fully capture the mechanical properties of anisotropic rock masses, many laboratory studies have been performed on the sedimentary rocks [4,5] and jointed rock masses [6,7,8]. The results obtained from those laboratory tests indicate that the weakness orientation largely influences the failure strength of rock masses. The maximum strength can be achieved when the loading direction is nearly normal or parallel to the weakness plane, whereas the minimum strength occurs when the loading direction is 30° to 60° to the weakness plane. Additionally, the failure modes of the anisotropic rock masses depend on the loading direction [8,9].
Many failure criteria [10,11,12] have been proposed to describe the anisotropic characteristics of failure strength of anisotropic rock masses based on either the mathematical analysis or experimental results. Based on previous studies, Duveau et al. [13] classified the existing failure criteria into three groups, which include the mathematical models [11,14], the empirical models [2,5] and the discontinuous models [10,12]. Based on their assessment, they recommended the discontinuous models with two identified failure modes, i.e., sliding failure along the joint and shearing failure of rock matrix. However, the mixed failure mode is widely observed when the joint orientation becomes larger than the joint friction angle in previous studies [6,7,8].
Additionally, the failure strength is less than the prediction when the joint orientation is less than the joint friction angle, while the prediction underestimates the failure strength when the joint orientation is beyond the joint friction angle [12]. It may lie in the fact that the failure behaviours are influenced by the joint properties [15,16]. Previous studies [17,18] revealed that the joint elasticity plays an essential role in strength reduction for specimens with horizontal joints and the elastic mismatch between the joint material and the intact rock is widely observed in rock engineering due to the weathering effect [19,20,21]. Also, the elastic mismatch in the rock masses may result in the spacing joints within a fractured layer being subjected to extension [22] and tensile failure under uniform remote compression [23]. However, its effect on the failure strength and failure behaviours is ignored in these studies.
Numerical methods, including continuum method and discontinuum method, provide us with an effective way to investigate mechanical behaviours of the rock mass. Verma and Singh [24] simulated rock mass under triaxial compression using the fast Lagrangian analysis of continua (FLAC). The results from numerical simulations are in agreement with theoretical results, however, without comparison with laboratory results. The specimen slenderness and joint orientation effects on rock strength were studied by Wasantha et al. [25] using a discrete element model (DEM). Although these numerical models can reproduce the theoretical prediction with similar assumptions, there are several drawbacks cannot be ignored: (a) the constitutive model must be specified; (b) failure to simulate the fracturing process. The synthetic rock mass model (SRM) [26] overcomes these drawbacks using an assembly of the nonuniform size of particles connected by contacts.
A couple of studies contributed to mechanical behaviours of rock mass using the SRM are summarized in Table 1. Among these studies, some [7,27,28] mainly focused on the parameters of the smooth joint model (SJM) effect on the failure behaviours using compression and shear tests. Additionally, geometry parameters of fractures, including roughness, spacing, number of joints, joint orientation and continuity factor, effect on the failure behaviours of the jointed rock mass were explored by many researchers [29,30,31]. The anisotropic behaviours of the jointed rock mass were further modelled using a set of persistent parallel joints [32] or a set of non-persistent joints [33]. Zhang et al. [34] investigated the scale effect of intact rock using small random joints in the particle-based model. However, the joint elasticity effect on the failure behaviours of rock masses was ignored by the previous studies.
In this study, the SRM is employed to regenerate rock mass model with a persistent joint. Then, the joint elasticity effect on the failure behaviours of rock masses is explored for numerical models with different joint orientation angles and joint stiffness.

2. Simulation Methodology and Validation

2.1. Simulation Methodology

The SRM is composed of two parts: the bonded particle model (BPM) and the smooth joint model (SJM). A brief description of the SRM is presented in this section and more detailed descriptions about this model have been given in previous studies e.g., [26].
The BPM, with homogeneous and isotropic characteristics, is suitable to simulate the failure process of intact rock regarding microstructures and mechanical responses [37]. The movement of particles obeys Newton’s law of motion while the interaction between particles is defined through contact models. In this paper, the flat joint model (FJM) is used to represent intact rock and the smooth joint model (SJM) is used to represent discontinuity.

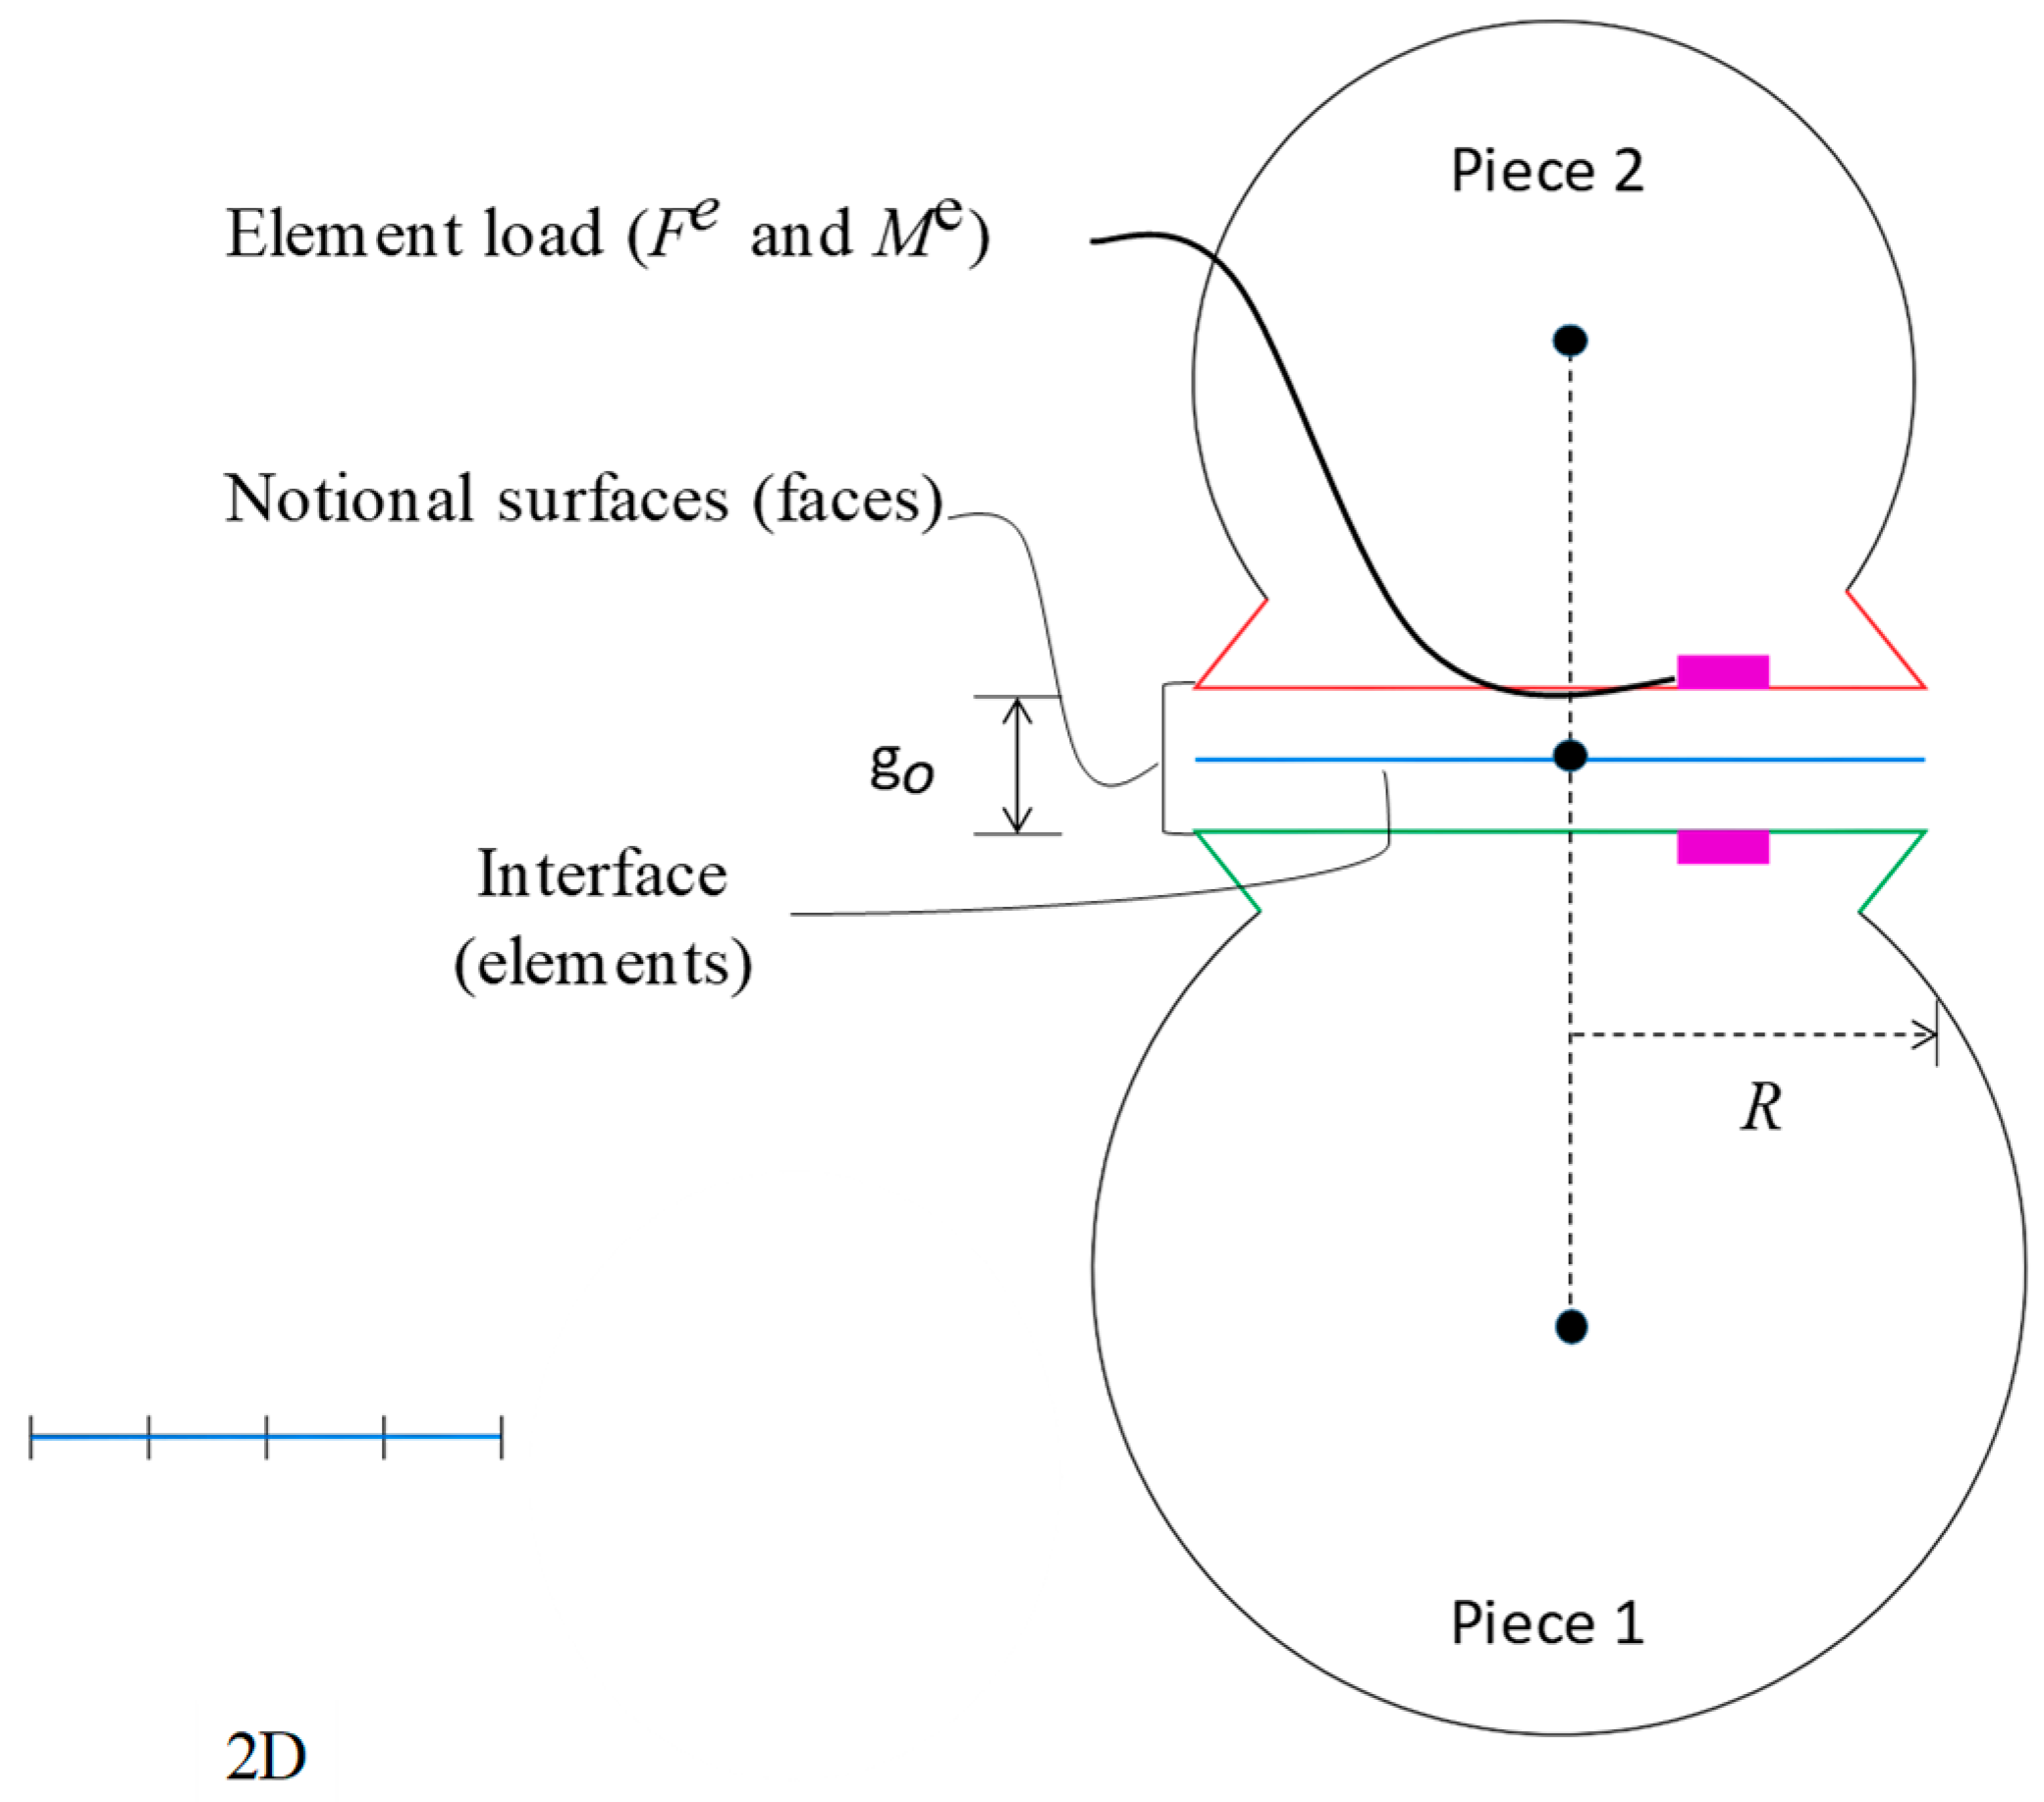
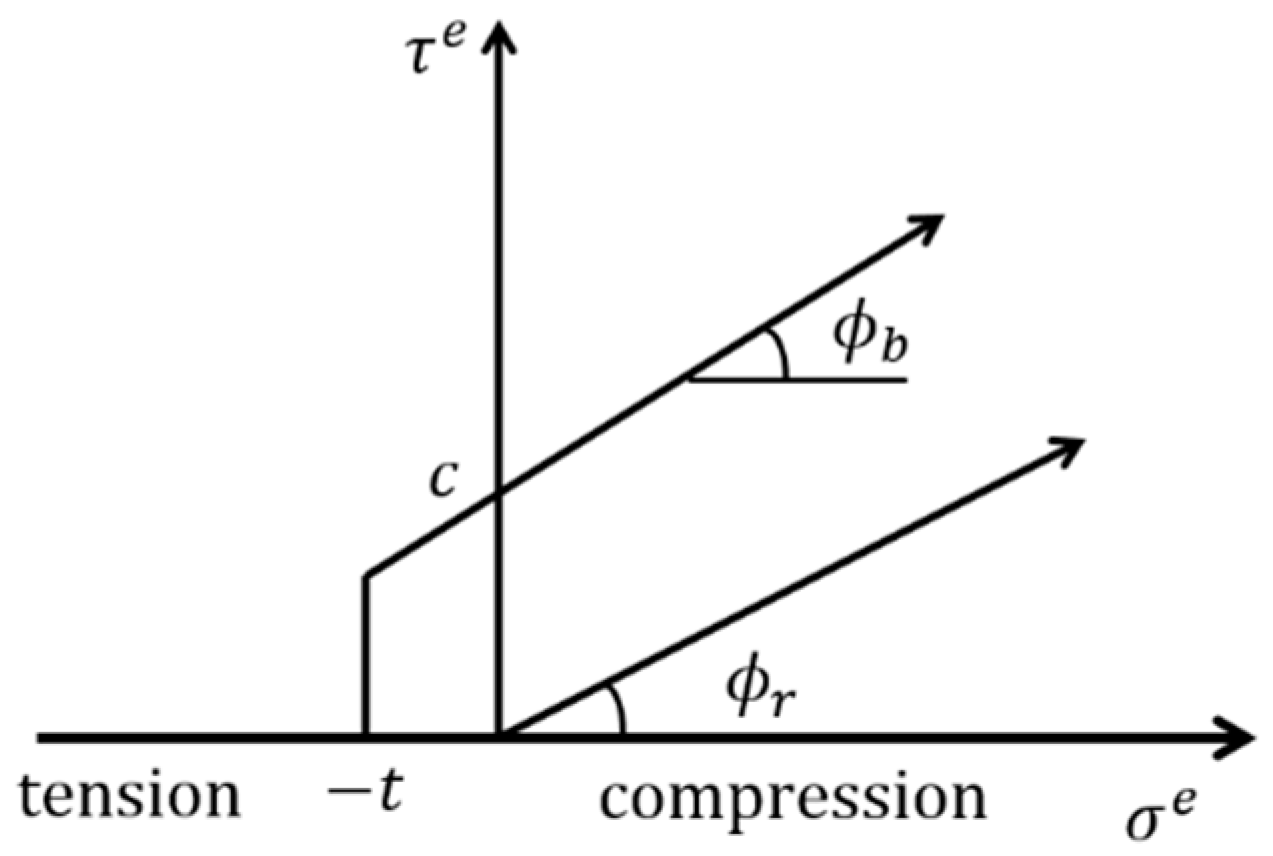
2.1.1. The Flat Joint Model (FJM)

The FJM consists of rigid particles joined by an interface that can sustain bond damage, as shown in Figure 1. The interface, a straight line in 2 dimensions (2D), can be discretized into several elements. Each element carries a force ( F e ) and a moment ( M e ), and can be either bonded or unbonded, which provides the linear elastic macro-properties. In particle flow code (PFC), the FJM element is installed when the gap between two particles is smaller than a specified installation gap g 0 .
When the FJM is active, each element with a force ( F e ) and a moment ( M e ) acting at the contact location on the equal and opposite notional surfaces obeys the force-displacement law. The normal force ( F n e ) and moment ( M e ) can be updated in the normal direction and the shear force ( F s e ) can be calculated in the tangent direction. Therefore, the element normal stress and shear stress are given by:
σ e = F n e A e
τ e = F s e A e
where A e is the element length in 2D. The bonded element and unbonded element of the FJM have distinctive mechanical behaviours which are governed by the microscopic parameters. The strength envelope of bonded elements is shown in Figure 2.
Under tension, the bonded element sustained by the tensile strength of the bond until the tensile stress exceeds the critical value. Then, the bonded element becomes an unbonded element and formulates a micro-tensile crack. Under compression, the bonded element and the unbonded element of the FJM follow Mohr-Coulomb (MC) criterion with a tension cut-off and the Coulomb sliding criterion, respectively:
τ e = c b   +   σ e tan ϕ b
τ e = σ e tan ϕ r
where c b is the bond cohesion; ϕ b and ϕ r are the local friction angle and residual friction angle, respectively. The bonded element will break into a micro-shear crack when the shear strength of the bond is exceeded.

2.1.2. The Smooth Joint Model (SJM)

To simulate the behaviours of discontinuities, the SJM was proposed by Mas Ivars et al. [40]. The SJM provides the macroscopic linear elastic behaviours when bonded, and linear elastic and friction resisting behaviours when the interface breaks. Unlike the FJM, the interface in the SJM does not resist the relative rotation of particles, as shown in Figure 3. Therefore, the two particles using the SJM can slide past each other instead of moving around each other. An SJM can be inserted into FJMs to simulate behaviours of a discontinuity.

2.2. Model Calibration and Validation

The robustness and correctness of the numerical model are validated using experimental results [8]. A series of uniaxial compressive strength (UCS) tests were carried out on Hawkesbury sandstone specimens with the orientated persistent joint. The specimen was cut into two pieces using a water-jet, and a thin layer of plaster of Paris paste was applied as the weakness of the joint. The mechanical properties of intact rock and joint are summarized in Table 2 and will be used as reference data for calibration study in Section 2.2.1. Then, the experimental results are plotted on Figure 4 for further validation in Section 2.2.2.

2.2.1. Model Setup and Calibration

In this study, a rectangular rock specimen of 54 mm × 108 mm, which contains a random non-uniform particle assembly, was numerically generated and subjected to uniaxial compression to obtain calibrated experimental macro-properties of Hawkesbury sandstone [8]. The loading rate was set to be small enough (0.02 m/s) to ensure the quasi-static loading condition [41]. The calibration procedure proposed by our previous study [42] was used to calibrate intact rock properties. The experimental results and numerical results after the calibration are listed in Table 2, which show a good agreement between experimental results and numerical results. On the other hand, a calibration procedure proposed by Bahaaddini et al. (2013) [43] was used to calibrate the joint mechanical properties such as the normal stiffness, shear stiffness, joint friction angle and cohesion by performing normal deformability tests and direct shear tests. However, since the normal deformability tests are not routinely carried out as a standard procedure in most rock tests, the normal stiffness and shear stiffness are usually lacking in previous investigations. Therefore, in this study, the normal stiffness (800 GPa/m) and shear stiffness (400 GPa/m) were set large enough to minimise their effects on the mechanical properties to reproduce the theoretical predictions at first, and direct shear tests were carried out to match the cohesion and friction angle of sandstone. The macro-properties of numerical and experimental results are summarised in Table 2. The numerical results are in good agreement with the experimental results, with a value of the coefficient of variation (COV) less than 2%.

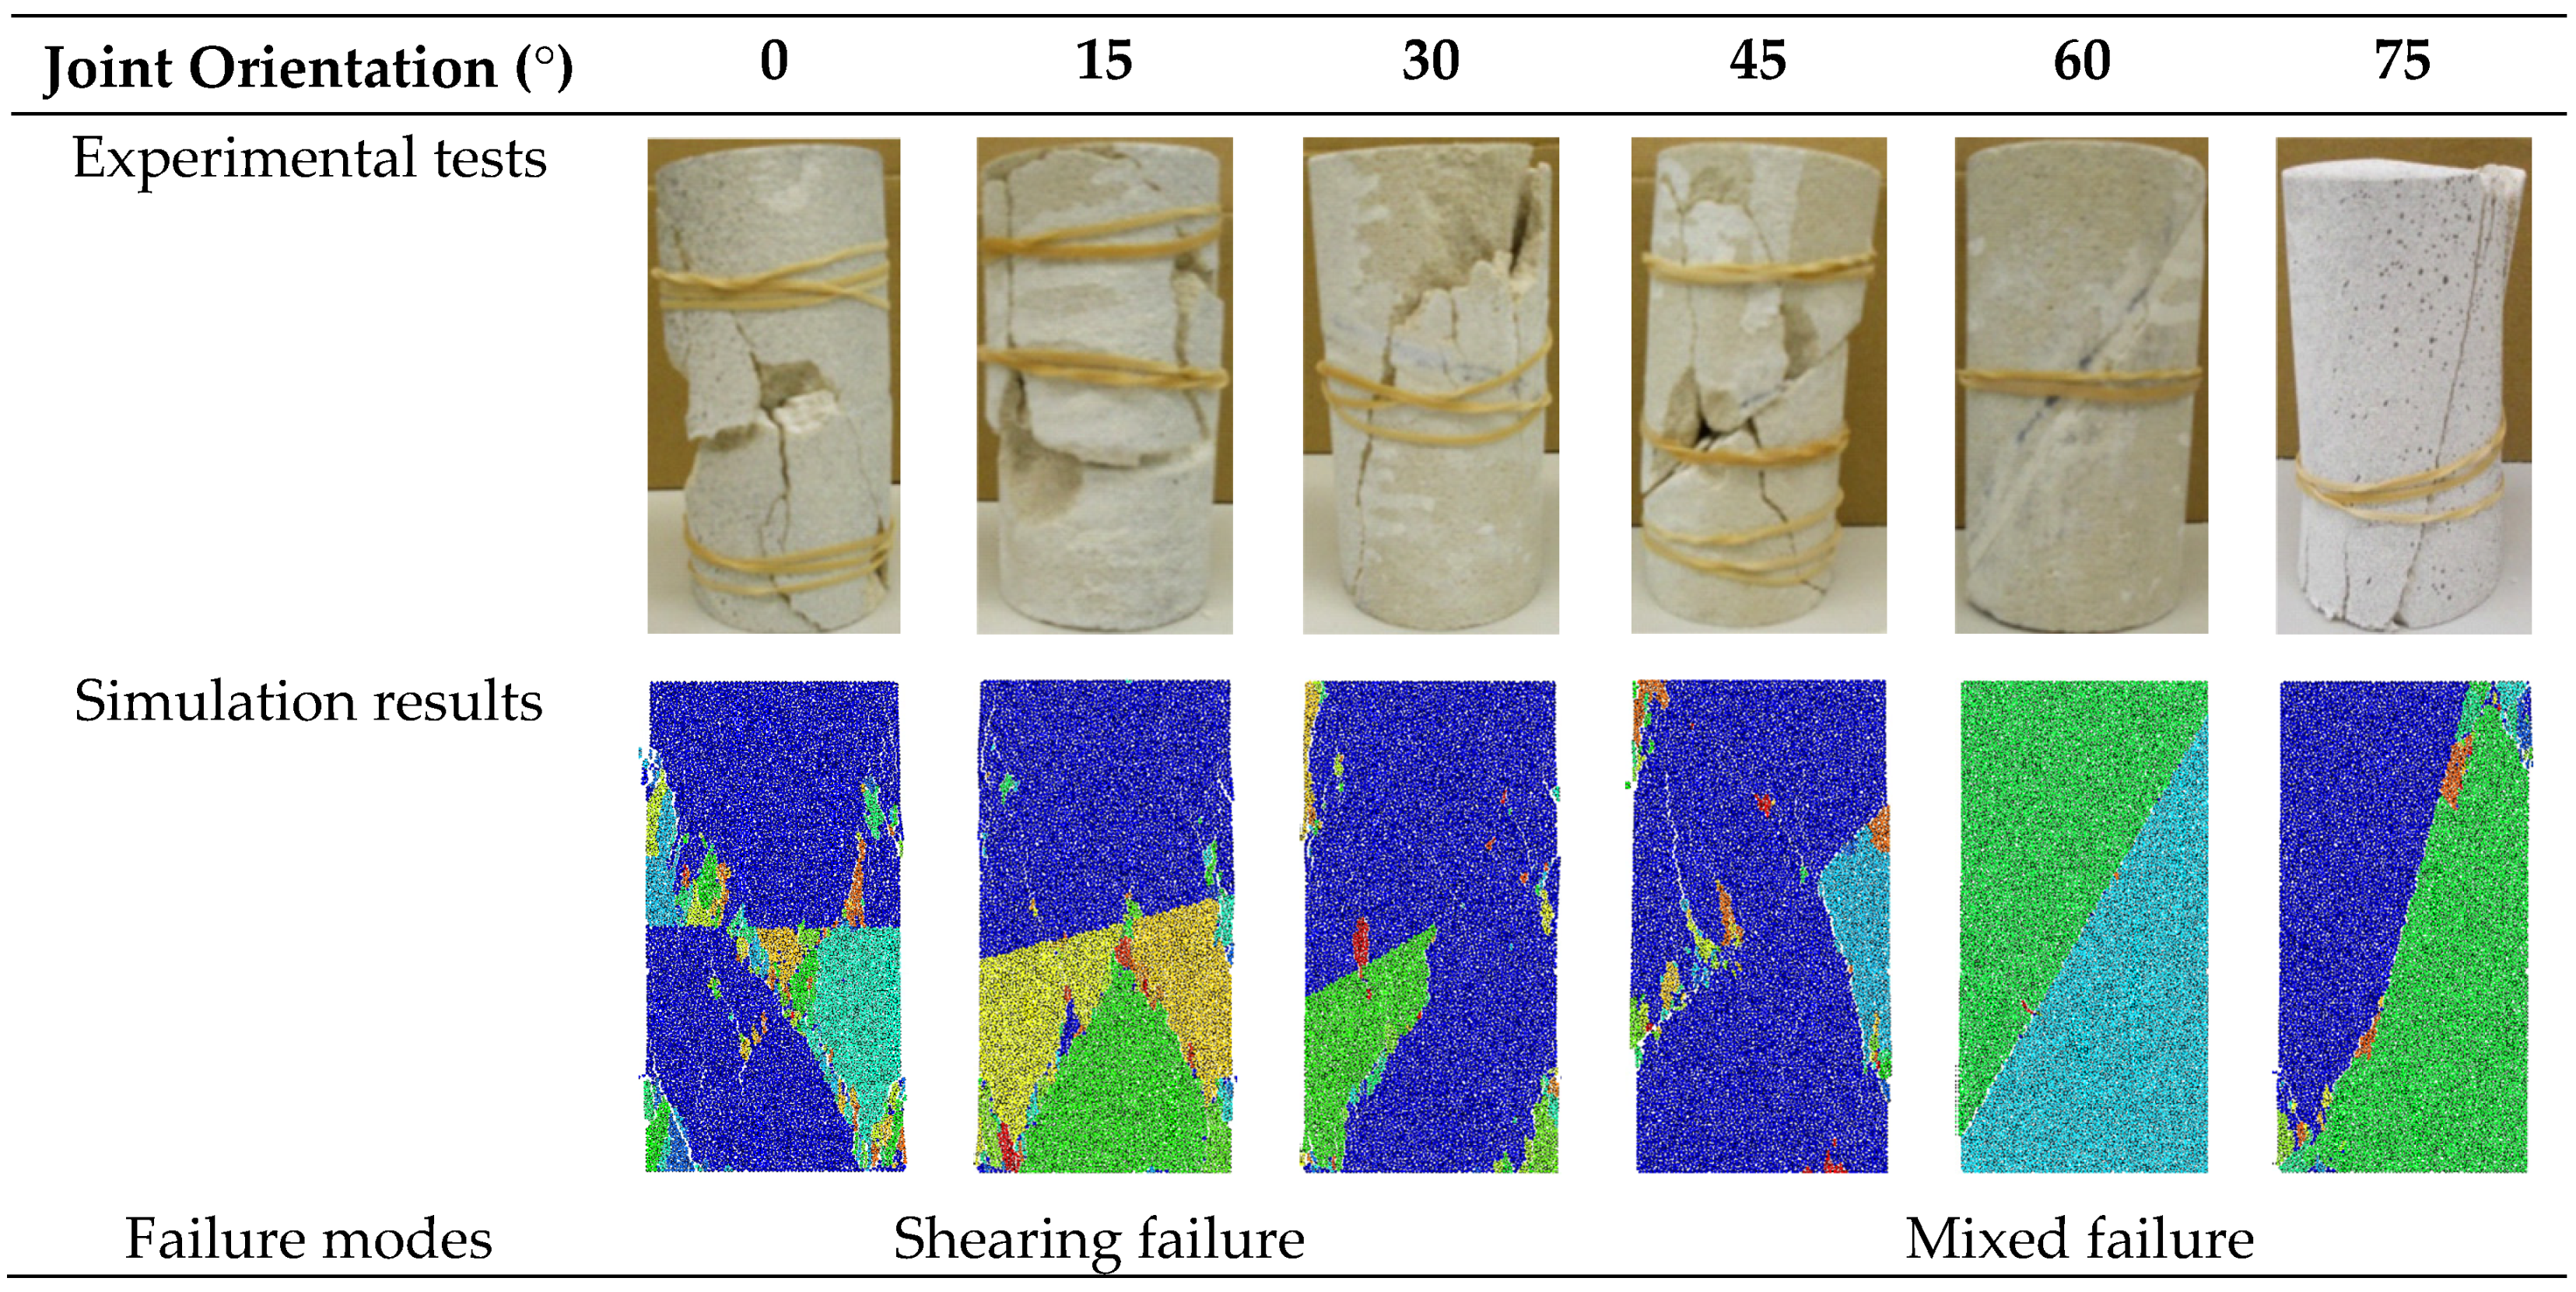
2.2.2. Model Validation

It is a prerequisite to validate the robustness and correctness of our numerical model before investigating the joint elasticity effect on the failure behaviours of rock masses. The numerical model with various joint orientations was subjected to uniaxial compression. Then, the derived failure strengths were compared with the Jaeger’s failure criterion:
σ 1 = { 1 + sin φ 1 sin φ σ 3 + 2 c   cos φ 1 sin φ , β < φ j   o r   β = 90 ° σ 3 + 2 c j + 2 σ 3 tan φ j sin 2 β ( 1 tan φ j tan β ) , ϕ j β < 90 °
where σ 1 and σ 3 are the major and minor principal stress, respectively; c and φ are cohesion and internal friction angle of the intact rock, respectively; c j and φ j are joint cohesion and joint friction angle, respectively; β is the joint orientation. The comparison between numerical results and the theoretical predictions demonstrates that our numerical model can capture the anisotropic characteristics of the rock mass failure strength (see Figure 4).

3. Simulation Results

3.1. Failure Strength

Using the SRM, the rock specimen models with various joint orientations were subjected to uniaxial compression to investigate the joint elasticity effect on the failure strength and failure behaviours of rock masses. Note that the joint may connect with platens when β > 63 ° as the ratio of specimen height to width is 2 in this study. Under such conditions, the specimens may suffer rupture behaviours [8,9]. To remove the effect of specimen configuration on failure strength, we take no account of these extreme results when 63 ° < β < 90 ° .
The normal stiffness of the SJM was set to 800 GPa/m, 400 GPa/m, 200 GPa/m, 100 GPa/m, 80 GPa/m, 60 GPa/m, 40 GPa/m and 20 GPa/m, and the corresponding deformation moduli of rock masses were 10.57 GPa, 9.83 GPa, 8.57 GPa, 6.86 GPa, 6.18 GPa, 5.39 GPa, 4.22 GPa and 2.63 GPa, respectively, while the stiffness ratio (shear to normal stiffness ratio) of the SJM was kept as a constant value of 0.5. The results, see Figure 5a, show the effect of normal stiffness of the SJM on the failure strength of the jointed rock mass. When β < φ j , the failure strength of the jointed rock mass is positively related to the normal stiffness, due to the increase of transferred shear stress around the joint interface. However, an opposite tendency is observed: the failure strength of jointed rock masses with inclined joint increases as the normal stiffness decreases when φ j < β < 90 ° . The failure strength of jointed rock mass when the joint orientation β = 40 ° can equal these failure strengths in the jointed rock mass model with a sub-horizontal joint. The effect of joint normal stiffness on the failure strength can be ignored when the joint is vertical, with the COV value less than 2%. This may lie in that the transferred stress can be ignored when the joint orientation parallels to the loading orientation.
The effect of the stiffness ratio on the failure strength is investigated by varying the stiffness ratio from 0.1 to 1 while the normal stiffness is fixed to 800 GPa/m. The effect of smooth-joint stiffness ratio on the failure strength can be ignored since the COV value of different orientation is less than 10%, see Figure 5b. Its effect on the failure strength is relatively larger when φ j < β < 90 ° , with COV values large than 5% while the others less than 2%. Therefore, the elastic properties of smooth-joint on the failure strength of the jointed rock mass are mainly dependent on the level of normal stiffness of the joint compared with the stiffness ratio.

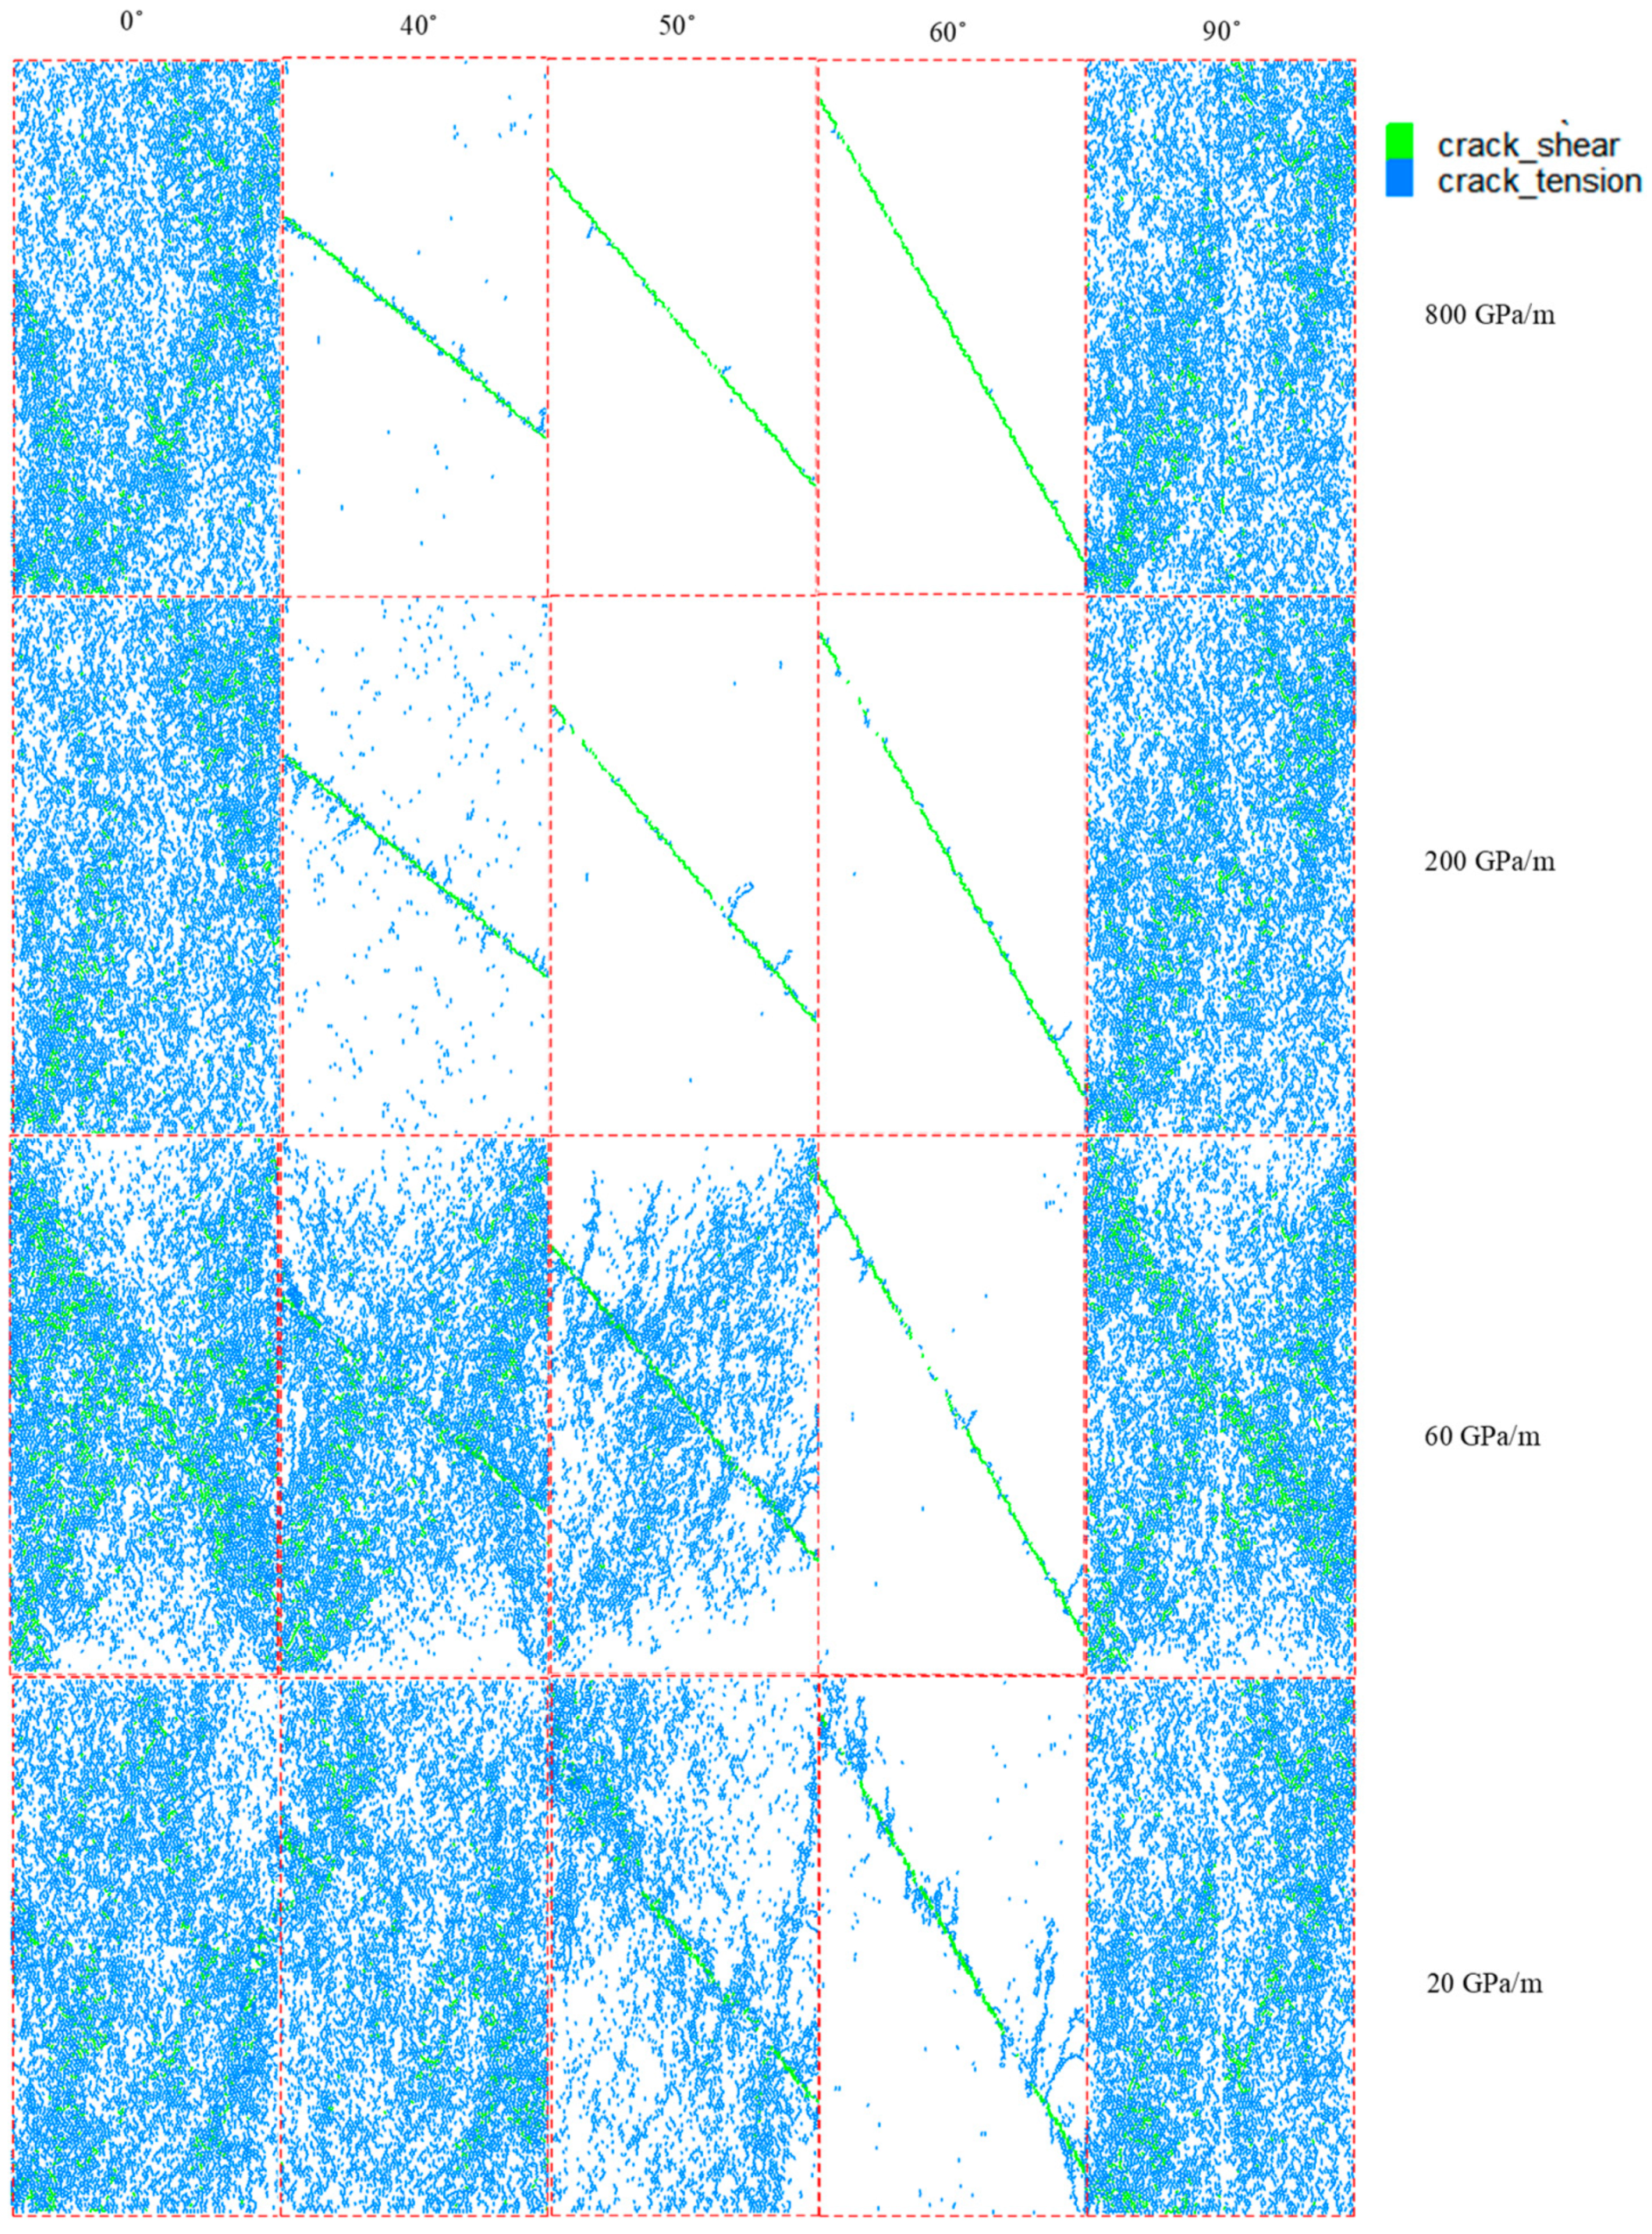
3.2. Degree of Fracturing

When the jointed rock mass specimen is subjected to the uniaxial compression, the damage evolution can be expressed in terms of the number of micro-cracks that are generated during the failure process. The number of micro-cracks can be regarded as an indicator of damage of the jointed rock masses.
The results in Figure 6 show the number of accumulated micro-cracks of jointed rock mass with an inclined joint, which demonstrates an evident anisotropic characteristic. When β < φ j , the number of micro-cracks can be regarded as a constant value with a small variation. However, the number of accumulated micro-cracks experiences a considerable fluctuation when φ j < β < 90 ° . Like the failure strength, the fluctuation of number of micro-cracks was influenced by the joint orientation, which decreases as the joint orientation increases and reaches its minimum value when the joint orientation is close to 60°. The figure also indicates that more intact rock failure is involved when φ j < β < 90 ° as the joint stiffness decreases.

4. Discussion

Our simulation results show that there is a strong correlation between the elastic mismatch of intact rock and joint material and the failure strength of rock mass. The soft joint in the rock mass can reduce the failure strength when β < φ j while increase the failure strength when φ j < β < 90 ° . This is a consequence of the alternation of failure mechanism. Many researchers attempted to understand the macroscopic deformation and failure behaviours of rock materials from a micro-mechanical perspective [23,44]. Most microscopic mechanisms, such as the wing crack model, force-chain crack model and stress transfer model, are available to explain compression-induced local tension regions inside the rock specimen [23,45,46], which leads to the macroscopic failure. For the rock mass with a soft joint, we consider it as a 3-layer model with a softer layer between two stiffer layers [47,48,49]. Under compression, the softer body has the tendency to expand further than the stiffer body, inducing tensile stress around the interface. As a result, tensile cracks initiate in the stiffer body when the tensile stress exceeds the tensile strength of the material, leading to a transition of the macroscopic failure mode.
When β < φ j , the rock mass may not fail as sliding along the joint. As shown in Figure 7, when the jointed rock mass with a horizontal or sub-horizontal joint, local tensile cracks were formed as a result of elastic mismatch between joint material and intact rock material [17]. The failure of numerical model with horizontal or sub-horizontal joints takes place with tensile cracks around the interface and then spreads upwards and downwards of the model. Therefore, the tensile failure is involved in the failure process, resulting in failure strength reduction. This phenomenon has been widely reported in literature [17,18,50].
When φ j < β < 90 ° , the failure strength is dependent on the joint shearing strength when only sliding failure occurs without considering joint elasticity. However, when the joint becomes softer, the tensile cracks induced by the elastic mismatch will change the failure behaviours of the rock mass from the sliding failure mode to mixed failure mode, see Figure 8. These results are consistent with previous laboratory studies [6,7,8]. It is interesting to see that the joint elasticity has larger effect on the failure strengths when β = 40 ° compared with β = 50 ° and β = 60 ° (see Figure 5). This may lie in the fact that the transferred stress depends both on the elastic mismatch and the joint orientation. It is much easier to obtain transferred stress to exceed the intact rock tensile strength before failure when the joint orientation is closer to the friction angle. Therefore, more intact rock failure will be involved in the failure process when φ j < β < 90 ° , see Figure 8. As expected, the joint elasticity has a very limited effect on the failure strength when the joint orientation is parallel to the principal stress direction.
From a micromechanical perspective, initiation, propagation and coalescence of micro-cracks can well explain the macroscopic failure of rocks. To understand the failure process better, the tensile and shear cracks are plotted for various joint orientations in Figure 9. The results show that the joint elasticity has no obvious effect on the microcrack distribution when β = 0 ° and β = 90 ° for the post failure models. However, more micro-cracks appear in the failure model as the joint become softer when φ j < β < 90 ° , indicating that more intact rock elements fail when φ j < β < 90 ° , which confirms the existence of the failure mode transition.
When the normal stiffness and stiffness ratio are set to 32 GPa/m and 0.5, our numerical model can reproduce the failure strength and failure modes reported in a previous study [8], see Figure 4 and Figure 10. The simulation results using the SRM model can produce the complex failure behaviours observed in experimental results: shearing failure when β 30 ° and mixed failure when 45 ° β 75 ° . As expected, a rupture behaviour happens when the joint connects the platens as discussed in Section 3.1.

5. Conclusions

In this study, the SRM approach was employed to demonstrate the importance of the joint elasticity effect on the failure behaviours of the jointed rock mass. From our analysis, the following conclusions can be stated:
  • The failure strength of the jointed rock mass was strongly influenced by the joint elasticity. A positive relationship and a negative relationship between the joint elasticity and failure strength of the jointed rock mass were observed from the simulation results when β < φ j and φ j < β < 90 ° , respectively. However, the joint elasticity had limited effect on the failure strength when β = 90 ° .
  • The failure mode of the jointed rock mass was closely related to the joint elasticity. When φ j < β < 90 ° , a failure mode transition from sliding failure to mixed failure mode was observed as joint elasticity became smaller. When β < φ j , the jointed rock mass was prone to fail in a tensile failure mode with softer joint.
  • A close connection between the degree of fracturing of the jointed rock mass and joint elasticity was found under uniaxial compression. When φ j < β < 90 ° , more micro-cracks appeared in the jointed rock mass as the joint became softer. However, it had limited effect on the degree of fracturing when β < φ j .
The findings of this study showed that the SRM can reproduce complex behaviours of the jointed rock mass considering joint elasticity observed in the laboratory. Additionally, the failure mechanism of the jointed rock mass was clearly demonstrated based on the stress transfer model. Therefore, the SRM method is recommended to investigate the field applications where engineering design must take the stability of the jointed rock mass, containing large-scale and sometimes weathered joint networks, into account. However, the applicability of this method for field application may need to be further explored due to the complicated application environments. But for now, this study may serve as a basis and a reference for investigations on the mechanical properties of the jointed rock mass with soft joints.

Author Contributions

Conceptualization, C.Z. and Y.Y.; methodology, C.Z.; validation, C.Z.; formal analysis, C.Z. and Y.Y.; investigation, C.Z.; resources, Y.Y.; writing—original draft preparation, C.Z.; writing—review and editing, C.Z., Y.Y., Z.W. and J.D.; supervision, Y.Y.; project administration, C.Z.

Funding

Financial support for this work was provided by National Key R&D Program of China (2018YFC0604701), the Natural Science Foundation of Jiangsu Province (No. BK20181358), and the Priority Academic Program Development of Jiangsu Higher Education Institutions.

Acknowledgments

The PhD scholarship provided by the China Scholarship Council (CSC) to the correspondent author is gratefully acknowledged. The authors would like to thank Leticia Mooney for her editorial support during preparation of this paper.

Conflicts of Interest

The authors declare no conflict of interest.

References

  1. Bozorgzadeh, N.; Harrison, J.P. Heteroscedasticity of axial strength of transversely anisotropic rock. Géotech. Lett. 2014, 4, 322–329. [Google Scholar] [CrossRef]
  2. Shi, X.; Yang, X.; Meng, Y.; Li, G. An anisotropic strength model for layered rocks considering planes of weakness. Rock Mech. Rock Eng. 2016, 49, 3783–3792. [Google Scholar] [CrossRef]
  3. Wang, Y.; Li, C.; Hu, Y.; Mao, T. Brazilian test for tensile failure of anisotropic shale under different strain rates at quasi-static loading. Energies 2017, 10, 1324. [Google Scholar] [CrossRef]
  4. Saeidi, O.; Rasouli, V.; Vaneghi, R.G.; Gholami, R.; Torabi, S.R. A modified failure criterion for transversely isotropic rocks. Geosci. Front. 2014, 5, 215–225. [Google Scholar] [CrossRef]
  5. Mclamore, R.; Gray, K.E. The mechanical behavior of anisotropic sedimentary rocks. J. Eng. Ind. 1967, 89, 62–73. [Google Scholar] [CrossRef]
  6. Li, W.; Rezakhani, R.; Jin, C.; Zhou, X.; Cusatis, G. A multiscale framework for the simulation of the anisotropic mechanical behavior of shale. Int. J. Numer. Anal. Methods Geomech. 2017, 41, 1494–1522. [Google Scholar] [CrossRef] [Green Version]
  7. Hu, W.; Kwok, C.Y.; Duan, K.; Wang, T. Parametric study of the smooth-joint contact model on the mechanical behavior of jointed rock. Int. J. Numer. Anal. Methods Geomech. 2017, 1–19. [Google Scholar] [CrossRef]
  8. Wasantha, P.L.P.; Ranjith, P.G.; Viete, D.R. Specimen slenderness and the influence of joint orientation on the uniaxial compressive strength of singly jointed rock. J. Mater. Civ. Eng. 2013, 26, 06014002. [Google Scholar] [CrossRef]
  9. Wasantha, P.L.P.; Ranjith, P.G.; Viete, D.R. Effect of joint orientation on the hydromechanical behavior of singly jointed sandstone experiencing undrained loading. J. Geophys. Res. Solid Earth 2014, 119, 1701–1717. [Google Scholar] [CrossRef] [Green Version]
  10. Jaeger, J.C. The frictional properties of joints in rock. Pure Appl. Geophys. 1959, 43, 148–158. [Google Scholar] [CrossRef]
  11. Nova, R. The failure of transversely isotropic rocks in triaxial compression. Int. J. Rock Mech. Min. Sci. 1980, 17, 325–332. [Google Scholar] [CrossRef]
  12. Fjær, E.; Nes, O.M. The impact of heterogeneity on the anisotropic strength of an outcrop shale. Rock Mech. Rock Eng. 2014, 47, 1603–1611. [Google Scholar] [CrossRef]
  13. Duveau, G.; Shao, J.F.; Henry, J.P. Assessment of some failure criteria for strongly anisotropic geomaterials. Mech. Cohes.-Frict. Mater. 1998, 3, 1–26. [Google Scholar] [CrossRef]
  14. Tsai, S.W.; Wu, E.M. A general theory of strength for anisotropic materials. J. Compos. Mater. 1971, 5, 58–80. [Google Scholar] [CrossRef]
  15. Boon, C.W.; Houlsby, G.T.; Utili, S. DEM modelling of a jointed rock beam with emphasis on interface properties. Géotech. Lett. 2015, 5, 49–55. [Google Scholar] [CrossRef] [Green Version]
  16. Wang, X.; Zhou, K.; Wu, M.S. Interface cracks with surface elasticity in anisotropic bimaterials. Int. J. Solids Struct. 2015, 59, 110–120. [Google Scholar] [CrossRef]
  17. Walker, P.E. The Shearing Behaviour of Jointed Rock Model; Queen’s University of Belfast: Belfast, UK, 1971. [Google Scholar]
  18. Lama, R.C.; Vutukuri, V.S.; Saluja, S.S. Handbook on Mechanical Properties of Rocks; Testing Techniques and Results; Trans Tech Publications: Stafa-Zurich, Switzerland, 1978; Volume IV. [Google Scholar]
  19. Barton, N.; Choubey, V. The shear strength of rock joints in theory and practice. Rock Mech. 1977, 10, 1–54. [Google Scholar] [CrossRef]
  20. Barton, N. Review of a new shear-strength criterion for rock joints. Eng. Geol. 1973, 7, 287–332. [Google Scholar] [CrossRef]
  21. Gupta, A.S.; Seshagiri Rao, K. Weathering effects on the strength and deformational behaviour of crystalline rocks under uniaxial compression state. Eng. Geol. 2000, 56, 257–274. [Google Scholar] [CrossRef]
  22. Bai, T.; Pollard, D.; Gao, H. Explanation for fracture spacing in layered materials. Nature 2000, 403, 753–756. [Google Scholar] [CrossRef] [PubMed]
  23. Bourne, S.J. Contrast of elastic properties between rock layers as a mechanism for the initiation and orientation of tensile failure under uniform remote compression. J. Geophys. Res. 2003, 108, 2395. [Google Scholar] [CrossRef]
  24. Verma, A.K.; Singh, T.N. Modeling of a jointed rock mass under triaxial conditions. Arab. J. Geosci. 2010, 3, 91–103. [Google Scholar] [CrossRef]
  25. Wasantha, P.L.P.; Ranjith, P.G.; Viete, D.R. Specimen slenderness and the influence of joint orientation on the uniaxial compressive strength of jointed rock: A numerical study. In Proceedings of the ISRM Regional Symposium-7th Asian Rock Mechanics Symposium, Seoul, Korea, 15–19 October 2012; International Society for Rock Mechanics: Lisboa, Portugal, 2012; pp. 174–180. [Google Scholar]
  26. Mas Ivars, D.; Pierce, M.E.; Darcel, C.; Reyes-Montes, J.; Potyondy, D.O.; Paul Young, R.; Cundall, P.A. The synthetic rock mass approach for jointed rock mass modelling. Int. J. Rock Mech. Min. Sci. 2011, 48, 219–244. [Google Scholar] [CrossRef]
  27. Huang, D.; Wang, J.; Liu, S. A comprehensive study on the smooth joint model in DEM simulation of jointed rock masses. Granul. Matter. 2015, 17, 775–791. [Google Scholar] [CrossRef]
  28. Bahaaddini, M.; Hagan, P.C.; Mitra, R.; Hebblewhite, B.K. Parametric Study of Smooth Joint Parameters on the Shear Behaviour of Rock Joints. Rock Mech. Rock Eng. 2015, 48, 923–940. [Google Scholar] [CrossRef]
  29. Lambert, C.; Coll, C. Discrete modeling of rock joints with a smooth-joint contact model. J. Rock Mech. Geotech. Eng. 2014, 6, 1–12. [Google Scholar] [CrossRef]
  30. Zhao, W.; Huang, R.; Yan, M. Mechanical and fracture behavior of rock mass with parallel concentrated joints with different dip angle and number based on PFC simulation. Geomech. Eng. 2015, 8, 757–767. [Google Scholar] [CrossRef]
  31. Cheng, C.; Chen, X.; Zhang, S. Multi-peak deformation behavior of jointed rock mass under uniaxial compression: Insight from particle flow modeling. Eng. Geol. 2016, 213, 25–45. [Google Scholar] [CrossRef]
  32. Park, B.; Min, K.-B. Bonded-particle discrete element modeling of mechanical behavior of transversely isotropic rock. Int. J. Rock Mech. Min. Sci. 2015, 76, 243–255. [Google Scholar] [CrossRef]
  33. Duan, K.; Kwok, C.Y. Discrete element modeling of anisotropic rock under Brazilian test conditions. Int. J. Rock Mech. Min. Sci. 2015, 78, 46–56. [Google Scholar] [CrossRef]
  34. Zhang, Q.; Zhu, H.; Zhang, L.; Ding, X. Study of scale effect on intact rock strength using particle flow modeling. Int. J. Rock Mech. Min. Sci. 2011, 48, 1320–1328. [Google Scholar] [CrossRef]
  35. Zhao, W.; Huang, R.; Yan, M. Study on the deformation and failure modes of rock mass containing concentrated parallel joints with different spacing and number based on smooth joint model in PFC. Arab. J. Geosci. 2015, 8, 7887–7897. [Google Scholar] [CrossRef]
  36. Duan, K.; Kwok, C.Y.; Pierce, M. Discrete element method modeling of inherently anisotropic rocks under uniaxial compression loading. Int. J. Numer. Anal. Methods Geomech. 2015, 32, 189–213. [Google Scholar] [CrossRef]
  37. Potyondy, D.O.; Cundall, P.A. A bonded-particle model for rock. Int. J. Rock Mech. Min. Sci. 2004, 41, 1329–1364. [Google Scholar] [CrossRef]
  38. Potyondy, D.O. A flat-jointed bonded-particle material for hard rock. In Proceedings of the 46th US Rock Mechanics/Geomechanics Symposium, Chicago, IL, USA, 24–27 June 2012; American Rock Mechanics Association: New York, NY, USA, 2012. [Google Scholar]
  39. Wu, S.; Xu, X. A study of three intrinsic problems of the classic discrete element method using flat-joint model. Rock Mech. Rock Eng. 2016, 49, 1813–1830. [Google Scholar] [CrossRef]
  40. Mas Ivars, D.; Potyondy, D.; Pierce, M.; Cundall, P. The smooth-joint contact model. In Proceedings of the 2008 8th WCCM8-ECCOMAS, Venice, Italy, 30 June–4 July 2008. [Google Scholar]
  41. Zhang, X.P.; Wong, L.N.Y. Choosing a proper loading rate for bonded-particle model of intact rock. Int. J. Fract. 2014, 189, 163–179. [Google Scholar] [CrossRef]
  42. Zhou, C.; Xu, C.; Karakus, M.; Shen, J.A. Systematic approach to calibrate micro-parameters for macro-rock properties of a flat joint bonded particle model (BPM). Geomech. Eng. 2018, 16, 471–482. [Google Scholar] [CrossRef]
  43. Bahaaddini, M.; Sharrock, G.; Hebblewhite, B.K. Numerical investigation of the effect of joint geometrical parameters on the mechanical properties of a non-persistent jointed rock mass under uniaxial compression. Comput. Geotech. 2013, 49, 206–225. [Google Scholar] [CrossRef]
  44. Griffith, A.A. The phenomena of rupture and flow in solids. Philos. Trans. R. Soc. Lond. Ser. A Contain. Pap. Math. Phys. Character 1921, 221, 163–198. [Google Scholar] [CrossRef]
  45. Mandl, G. Rock Joints; Springer: Berlin, Germany, 2005. [Google Scholar]
  46. Kemeny, J.M.; Cook, N.G.W. Micromechanics of deformation in rocks. In Toughening Mechanisms in Quasi-Brittle Materials; Springer: Berlin, Germany, 1991; pp. 155–188. [Google Scholar]
  47. Cox, H.L. The elasticity and strength of paper and other fibrous materials. Br. J. Appl. Phys. 1952, 3, 72–79. [Google Scholar] [CrossRef]
  48. Hobbs, D.W. The Formation of Tension Joints in Sedimentary Rocks: An Explanation. Geol. Mag. 1967, 104, 550–556. [Google Scholar] [CrossRef]
  49. Amann, F.; Button, E.A.; Evans, K.F.; Gischig, V.; Blümel, M. Experimental Study of the Brittle Behavior of Clay shale in Rapid Unconfined Compression. Rock Mech. Rock Eng. 2011, 415–430. [Google Scholar] [CrossRef]
  50. Lama, R.D. The Uniaxial Compressive Strength of Jointed Rock; Institute of Soil Mechanics and Rock Mechanics: Karlsruhe, Germany, 1974; pp. 67–77. [Google Scholar]
Figure 1. A typical schematic diagram of the FJM [38]. Note R represents the half-length of the FJM interface.
Energies 11 02968 g001
Figure 2. Failure envelopes for bonded element and unbonded element [39]. (Note tension is negative and compression is positive in this study).
Energies 11 02968 g002
Figure 3. Kinematic models. (a) The FJM. (b) The SJM.
Energies 11 02968 g003
Figure 4. Comparison between the Jaeger’s criterion, experimental results [8] and numerical simulations.
Energies 11 02968 g004
Figure 5. Effect of normal stiffness (a) and stiffness ratio (b) of the SJM on the failure strength of the jointed rock mass.
Energies 11 02968 g005
Figure 6. Accumulated number of micro-cracks with different joint normal stiffness under various joint orientations.
Energies 11 02968 g006
Figure 7. Photographs of specimens showing fractures propagating upward and downwards from a persistent horizontal joint.
Energies 11 02968 g007
Figure 8. Post-peak failure images with different joint elastic property with joint orientation β = 30°. (a) 400 GPa/m and (b) 20 GP/m.
Energies 11 02968 g008
Figure 9. Accumulated micro-cracks of rock mass model with various joint elasticity.
Energies 11 02968 g009
Figure 10. The comparison post-failure images and modes between experimental tests from [8] and numerical results.
Energies 11 02968 g010
Table 1. Summary of previous studies using the SRM.
ReferenceJoint TypeTestResearch Scope
[27]A single non-persistent jointUCCompressive study on the SJM.
[7]A single persistent jointUC and TCParametric study on the SJM.
[28]A single roughness jointDSExplore the SJM parameters effect on the shear behaviour of the jointed rock mass.
[29]A single roughness jointDSJoint roughness effect on shear behaviours.
[35]A set of persistent parallel jointsUCSpacing and number of parallel joints effect on failure behaviours of the jointed rock mass.
[31]A set of non-persistent jointsUCJoint orientations and continuity factors effect on the deformation behaviour of the jointed rock mass.
[32]A set of persistent parallel jointsUCModeling of mechanical behaviour of transversely isotropic rock.
[36]A set of non-persistent jointsUCModeling of inherently anisotropic rocks.
[34]Random jointsUCStudy of scale effect on intact rock strength.
This studyA single persistent joint UCInvestigation of joint elasticity effect on the failure behaviours of rock masses
UC, TC and DS represent uniaxial compressive test, triaxial compressive test and direct shear test, respectively.
Table 2. Mechanical properties of Hawkesbury sandstone [8] and calibrated BPM material.
Intact Rock PropertiesJoint Properties
Type of TestUCS (MPa)Tensile Strength (MPa)Young’s Modulus (GPa)Poisson’s RatioFriction Angle (°)Cohesion (MPa)
Experimental 50.804.0011.000.2032.002.20
Numerical 50.174.0811.020.2031.792.19
COV (%)0.511.400.130.000.460.32

