Article

Benefits of Medium Temperature Solar Concentration Technologies as Thermal Energy Source of Industrial Processes in Spain

by
Isidoro Lillo-Bravo
1,*,
Elena Pérez-Aparicio
2,
Natividad Sancho-Caparrini
2 and
Manuel Antonio Silva-Pérez
1
1
Department of Energy Engineering, Universidad de Sevilla, Camino de los Descubrimientos s/n, 41092 Seville, Spain
2
Andalusian Association for Research and Industrial Cooperation, Camino de los Descubrimientos s/n, 41092 Seville, Spain
*
Author to whom correspondence should be addressed.
Energies 2018, 11(11), 2950; https://doi.org/10.3390/en11112950
Submission received: 31 July 2018 / Revised: 2 October 2018 / Accepted: 23 October 2018 / Published: 29 October 2018
(This article belongs to the Special Issue Sustainable Energy Systems)

Abstract

:
This paper analyses the possible applications of medium temperature solar concentration technologies, Compound Parabolic Collector, Linear Fresnel Collector and Parabolic Trough Collector in the Spanish industrial sector. Results of this study allow evaluating whether or not solar technologies are an alternative to conventional sources. This possibility is analyzed energetically, economically and environmentally. Results show that the percentage of solar use is decisive in determining the true thermal energy generation cost. The other essential parameter is the solar field area due to produce economy of scale that reduces investment costs. Fluid temperature has significant influence mainly in Compound Parabolic Collector technology. Results obtained in this paper collect multiple alternatives and allow comparing for different scenarios the suitability to replace conventional energy sources by thermal energy obtained from medium temperature solar concentration technologies from an economic perspective. For instance, for percentage of solar use equal to 100%, the lowest thermal energy generation costs for each technology are 1.3 c€/kWh for Compound Parabolic Collector technology, fluid temperature of 100 °C and industrial process located in Seville, 2.4 c€/kWh for Linear Fresnel Collector technology, fluid temperature of 170 °C and industrial process located in Jaen, 3.3 c€/kWh for technology, fluid temperature of 350 °C and industrial process located in Jaen. These costs are lower than conventional energy sources costs.

1. Introduction

World consumption of primary energy is growing as though supplies of fossil energy carriers were unlimited and climate change was not occurring [1]. Global primary energy consumption increased by 1% in 2016, following growth of 0.9% in 2015 and 1% in 2014. This compares with the 10-year average of 1.8% a year. As was the case in 2015, growth was below average in all regions except Europe and Eurasia. All fuels except oil and nuclear power grew at below-average rates. The analysis of the primary energy consumption distribution shows that oil remains being the most consumed primary energy, 31.7% over the total. Coal remains as the second energy resource with 28.1%. Natural gas appears in the third position; its consumption represents 21.6% of the total [2]. These data show that fossil fuels are still the most used primary energies. The sum of their consumption is around 80% of the total.
The analysis of the distribution of energy end-uses shows that 46% of energy consumption is used to satisfy cooling or heating processes requirements at industrial, residential or tertiary levels. Most of this energy is produced from fossil fuels and only 15% comes from renewable energies. The remaining 54% consumed energy is divided between electricity and transport, 32% and 22% respectively [3]. These figures clearly show the importance of global energy consumption for thermal purposes and the low percentage that is satisfied by renewable energies.
Solar thermal energy is one of the alternatives that nowadays present a greater potential to reduce the fossil fuels consumption. Solar technologies can be applied in lots of industrial processes, mainly due to the temperature range that they allow, from 45 °C to 400 °C. Higher temperatures could even be covered if it would be necessary, although this is not usual in industrial processes. To select one or other of the available solar technologies, it is crucial to analyse the industrial processes thermal requirements whose needs are to be met. Table 1 shows the industrial processes temperature range susceptible of this study [4,5].
In addition to the heat transfer fluid temperature, another important issue to assess the suitability of solar technologies as provider of thermal energy for industrial processes are the daily, monthly or annually thermal energy consumption time profiles.
In recent years, several studies have discussed the possibilities of jointly using a solar installation and an industrial process. These studies highlight the advances that are still necessary in solar installations to be correctly coupled to industrial processes, analyse the potential in regions like Latin America [6]. Aristoteles Aidonis et al. [7] analyse the potential in the Mediterranean region and identify the most promising sectors within industry like food products and beverages and textiles. Pierres Krummenacher et al. [8] identify practical constraints and analyse the complexity of heat supply in most industrial processes proposing a methodology to identify these points. N. Cottret et al. [9] evaluate the current market situation and finally identify crucial points yet to be solved, such as high investment costs, the lack of specific skills of many designers and installers, lack of public financing or low cost of conventional energies. In [10] is shown and overview of selected demonstration projects, proposing some actions, such as increase the demonstration projects to gain more experience, propose financial incentives to companies and promote training course for professionals. As medium temperature solar technologies adapt to industrial processes requirements, solar installations will become viable [11,12].
The literature review indicates that there is a lot of research about the comparison of Parabolic Trough Collector (PTC) and Linear Fresnel Collector (LFC) for electricity applications (Askaru et al. [13], Sharma et al. [14], Rovira et al. [15]), but only a few researches for heat production for industrial processes. The application of these solar technologies for electricity production has thermal temperature level, control of the system, equipment and costs very different that for heat production for industrial processes. Accordingly, results and conclusions are not comparable. For instance, Rovira et al. [15], compare the annual performance and economic feasibility of integrated solar combined cycles, with PTC and LFC, using different gas turbines and different pressure levels that feed the steam turbine to produce electricity. They found that the PTC produces more useful energy but the LFC is more sustainable choice financially. Sharma et al. [14] compare PTC, LFC and Compact Linear Fresnel Reflector (CLFR) fields in terms of energy losses, net energy collection by fluid, electricity generation and cost of electricity for the location of Murcia (Spain). They found that there is no significant difference in the performance of LFC and CLFR field and the PTC is generally a better choice than the LFC financially. Daniele Cocco et al. [16] combined production of electricity and heat in the dairy sector using an Organic Rankine Cycle. They found that PTC and LFC could be a promising option if electricity and heat are both required. In this case, a suitable energy storage section that provides flexibility to the installation is required.
Solar energy possibilities as source of energy supply for industrial processes have aroused the interest of many countries and several authors. There have been initiatives for the analysis of these possibilities in different countries, among which highlight the studies carried out in Australia [17,18], Germany [19], Tunisia [20] or Mexico [21]. Although the common objective of these studies is to analyse the viability of solar technologies as energy supply source for industrial processes, each study has been focused from the particular point of view of each country, that is, each study analyse the solar concentration technologies potential related to the predominant industrial process of the considered country. As consequence of the positive results of these studies and of the expectation created in the industrial sector there are a huge number of specific applications that are in the development process to achieve that solar energy technologies cover the industrial process thermal requirements [22]. There are also several reports that analyse, regardless the country, the solar technologies possibilities as thermal energy supplier for industrial processes, from the oil industry to the paper, textile or pharmaceutical industry [23,24,25,26,27,28,29]. Evangelos et al. [30] compare and evaluate energetically, exergetically and financially the performance of PTC and LFC for the climate conditions of Athens (Greece) for electricity and heat production. Results show the higher optical performance of PTC. During winter, LFC presents extremely low optical performance due to the low values of the IAM. Among the hypotheses made by Evangelos et al. stand out that they do not consider the Compound Parabolic Collector (CPC) technology as an alternative for the production of thermal energy, they evaluate the facility energy production at the solar field output without considering energy losses or thermal costs of distribution, exchange and storage system, they do not consider the operation and maintenance costs during the facility useful life and finally, they consider that the industrial process use all the annual thermal energy produced by the solar facility.
As is already known, Spain was one of the pioneering countries in the development and implementation of solar energy as source of energy supply, in electrical or thermal energy form. The developments that were initially carried out focused on the photovoltaic solar energy, low-temperature solar thermal energy and solar thermal energy sectors aimed primarily at generating electricity. Proofs of this golden age are the huge number of photovoltaic parks and solar thermal power plants that are currently working in Spain. In the specific case of solar thermal energy, it should be noted that there are three central receiver plants, two linear Fresnel plants and forty-five parabolic trough plants. Among them, they add up to a total of 2300 MW of installed power [31]. In the specific case of solar energy applied to the industrial sector, there have been several initiatives that, although they have not had the expected success, were useful to establish the bases on which work is currently being done. In recent years, the industrial sector has shown great interest in potential applications of solar energy for different industrial processes. Proof of this is that there are many companies that have focused their activities on obtaining new developments to take advantage of the solar sector in different industrial processes.
The objective of this paper is to highlight the benefits of the use of solar thermal energy of medium temperature solar concentration technologies as thermal energy source of industrial processes. In addition to summarizing the potential industrial processes that can be used as thermal energy, all the necessary information about the most appropriate solar technologies is collected. For the specific case of Spain, the potential of thermal energy production for different locations, solar concentration technologies, plant sizes, thermal levels and percentages of use of the generated thermal energy is evaluated. After that, the thermal energy generation cost of medium temperature solar concentration technologies is compared, from the economic point of view, to conventional energy sources. Natural gas, electricity, gas oil and fuel oil cases are considered. A time horizon of 20 years and three different scenarios for the evolution of conventional energy source prices are evaluated. Finally, Greenhouse Gas emissions (GHG) avoided by using solar technologies instead of conventional energy sources are quantified.
We have not found studies that analyse the medium temperature solar concentration technologies potential from technical and economic perspective that have into account the parameters included in this paper. This study aims to analyse the influence of the location, the medium temperature solar concentration technologies, the temperature level required by the industrial process, the percentage of used solar energy and the costs in the development of medium temperature solar concentration technologies.

2. Solar Thermal Energy

Solar thermal energy (STE) allows solar radiation to be harnessed to generate thermal energy through the use of a heat transfer fluid. Subsequently, the thermal energy generated can be used in different processes, whether industrial, residential or commercial. One of the main advantages offered by the substitution of conventional energy sources by solar technologies is the contribution to the mitigation of climate change. The most widely used solar technologies are Flat Plate (FP), Compound Parabolic Collectors (CPC), Linear Fresnel Collectors (LFC) and Parabolic Trough Collectors (PTC). CPC, LFC and PTC technologies are the most used in the case of industrial processes.
CPC vacuum tube collector is a system composed of a few rows of transparent glass tubes connected to a head pipe. Each tube contains therein an absorption tube coated with selective paint. Inside this pipe runs the heat transfer fluid. Vacuum is produced to minimize conduction and convection heat losses. Solar radiation passes through the glass over the tube, strikes the absorber tube and finally is transformed into heat. Overall performance of vacuum tube collector is higher than the conventional collector and maintains more constant behaviour. CPC collector includes annular reflectors that allow greater concentration of solar radiation onto the absorber tube.
LFC is based on the idea of simulating a continuous concentrator, in this case a parabolic trough collector, as a set of elements. The costs associated with LFC technology are lower than the typical costs of PTC technology. These systems are composed of long parallel rows of mirrors of relatively small width which can rotate about its longitudinal axis. These mirrors concentrate solar radiation on a fixed central receiver suspended at a certain height. The main element of this technology is the absorber tube, which is similar to the one used in parabolic trough collector systems.
PTC, one of the most mature Concentrated Solar Power (CSP) technologies, consists of a series of parabolic reflectors that concentrate solar radiation on receiving pipes containing the heat transfer fluid that is heated throughout the process. These collectors are placed in parallel rows that make up the solar field aligned in a north-south or east-west axis. Receivers have a special coating to maximize energy absorption, minimize infrared re-irradiation and work in an evacuated glass envelope to avoid convection heat losses. In these cases solar heat is moved by a heat transfer fluid flowing in the receiver tube and transferred to a steam generator to produce the super-heated steam that runs the turbine.
This section focuses on describing the instantaneous thermal efficiency and the cost structures of CPC, LFC and PTC technologies since these are the three alternatives considered in this paper.

2.1. Efficiency Characterization of CPC, LFC and PTC Technologies

To quantify the thermal energy production is required to know the performance behaviour of technologies considered in this paper. The instantaneous thermal efficiency used for each medium temperature solar concentration technologies are described in detail below.

2.1.1. CPC Technology

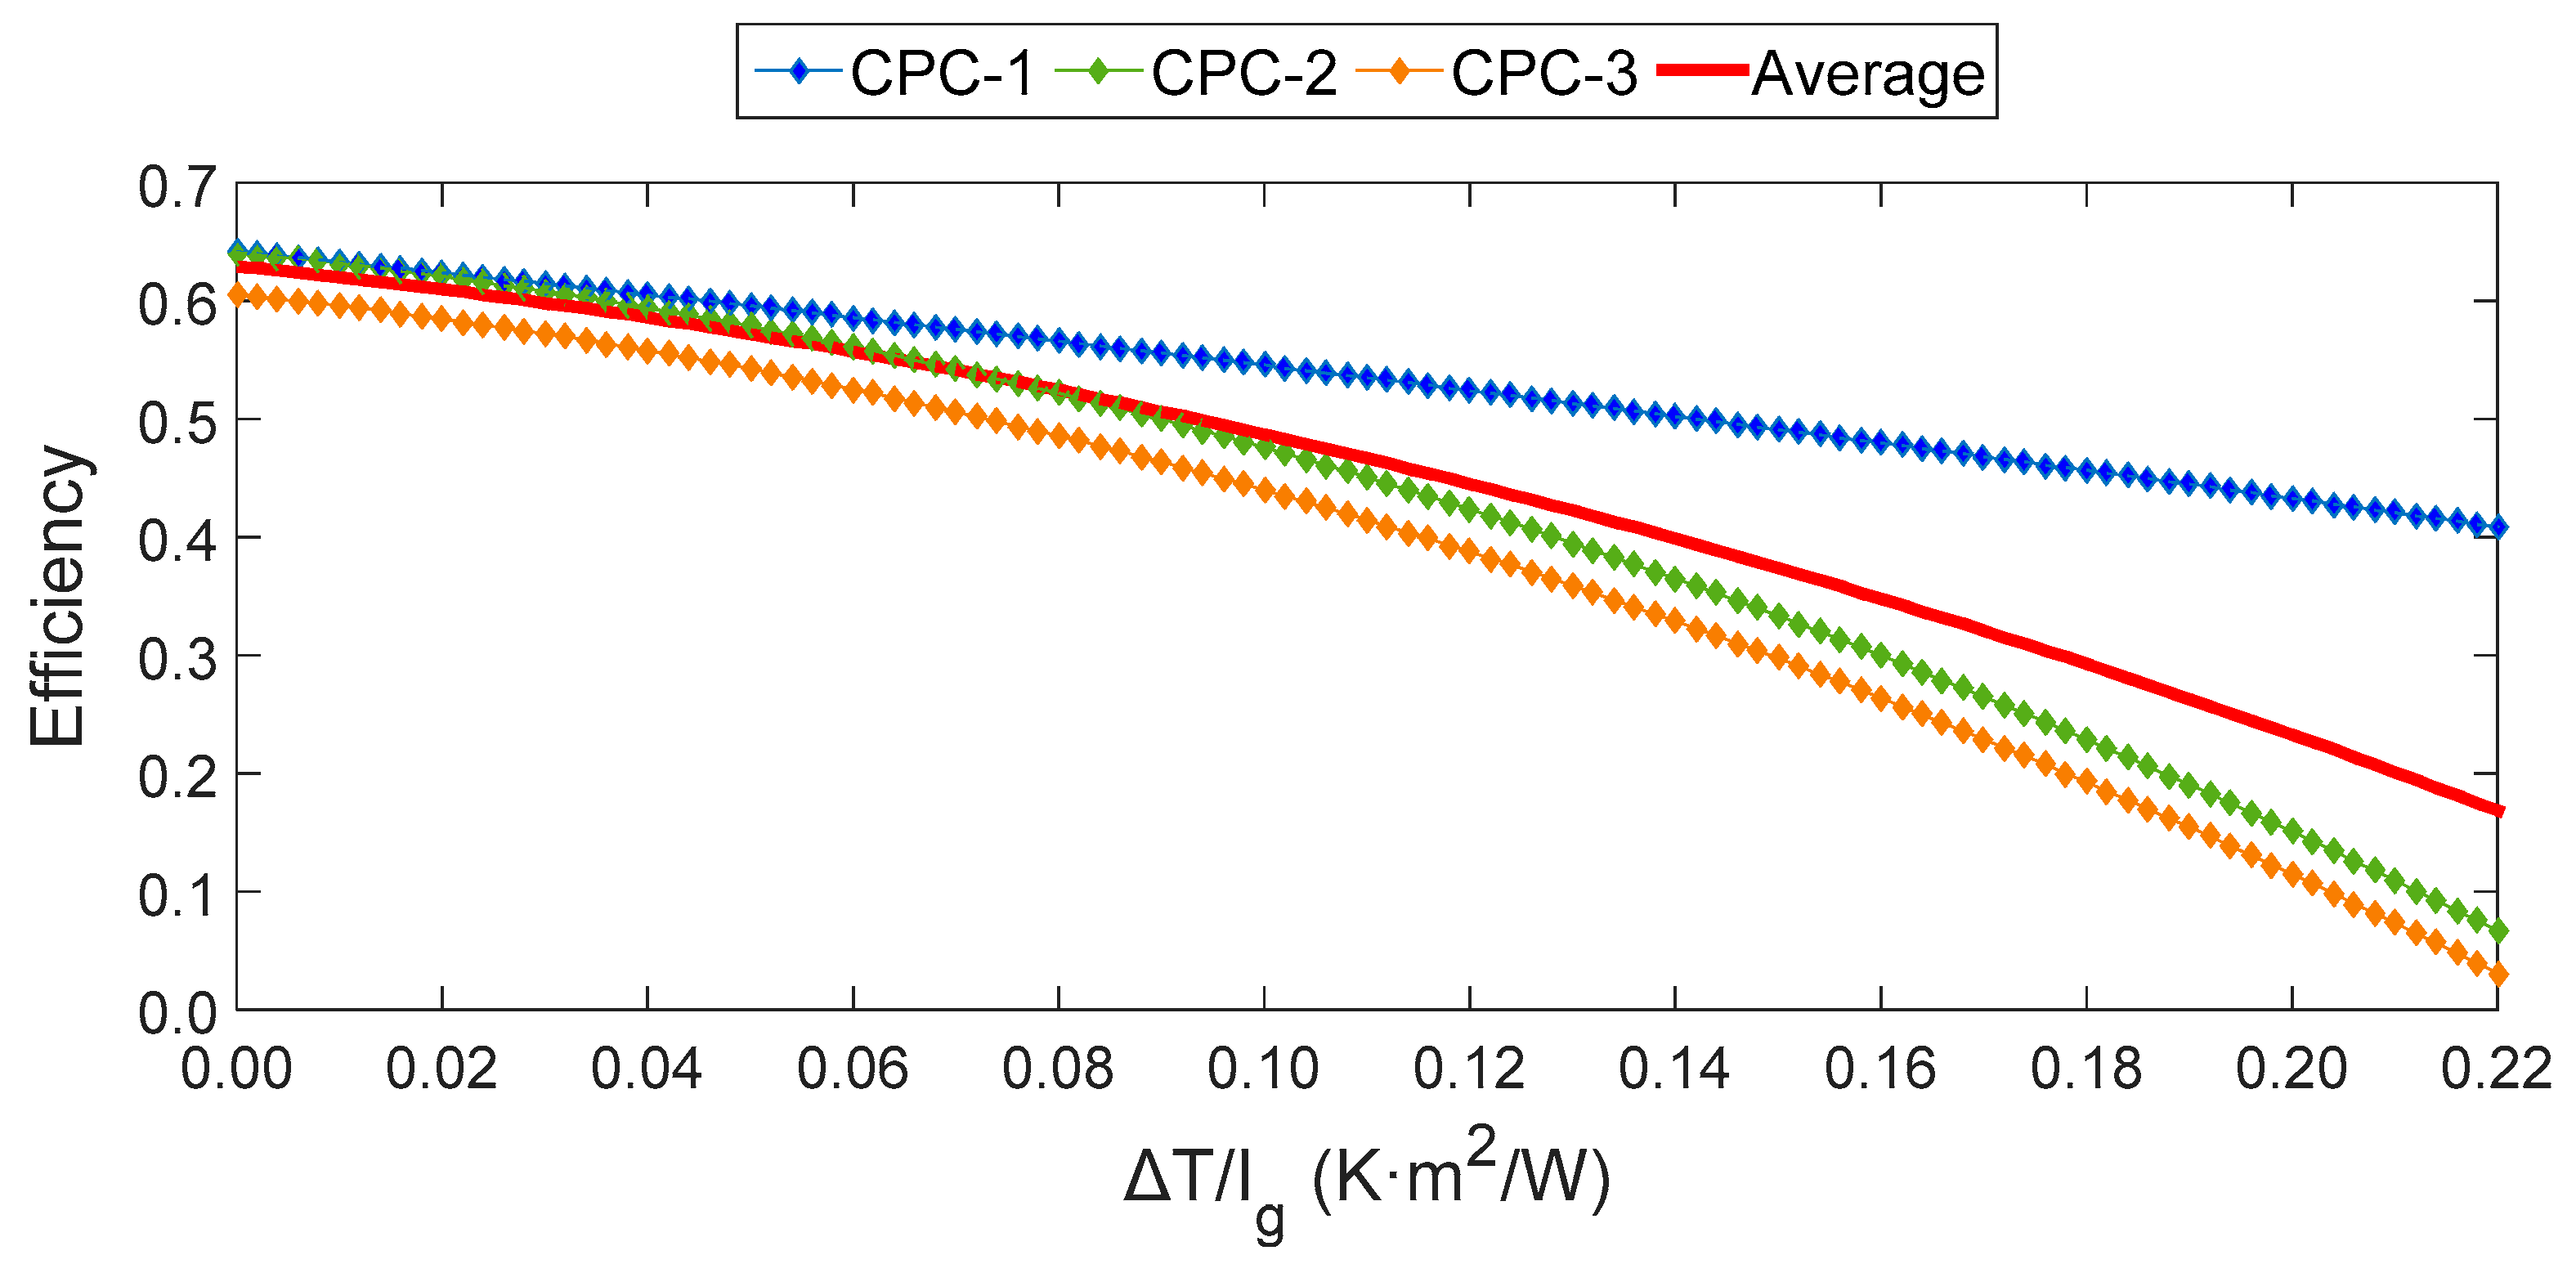
The compound parabolic collector characteristic efficiency equation is as follow:
η s f = k ( θ ) η 0 a 1 Δ T I g a 2 Δ T 2 I g
  • ŋsf: Instantaneous efficiency [°/1].
  • k: Incident angle modifier, where θ is the incident angle.
  • ŋ0: Optical efficiency [°/1].
  • a1: First order heat loss coefficient [W/K·m2].
  • a2: Second order heat loss coefficient [W/K2·m2].
  • ΔT: Difference between the mean fluid collector temperature and the ambient temperature [°C].
  • Ig: Incident global radiation [W/m2].
To obtain the parameters that define the instantaneous efficiency curve described by the equation above, the information provided by several manufacturers is analyzed. Table 2 summarizes the information collected.
Figure 1 shows the efficiency curves obtained using the information previously collected. A new curve named “average” is added; this has been calculated theoretically from values in Table 2.
To take into account the effect of the incident angle modifier, the information provided in Table 3 has been considered. The parameter k(θ) of Equation (1) is obtained as the product of kθb(θT) and kθb(θL).

2.1.2. LFC Technology

The CPC technological maturity and its market penetration are quite higher from the situation in which LFC technology is located; as consequence the LFC technology available information is much scarcer. The instantaneous efficiency of Fresnel technology is as follow [36]:
η s f = η 0 [ c 1 + c 2 · Δ T ] · Δ T I b c ( θ )
  • ŋsf: Instantaneous efficiency [°/1].
  • ŋ0: Optical efficiency [°/1].
  • c1: Lineal heat loss coefficient [W/K·m2].
  • c2: Quadratic heat loss coefficient [W/K2·m2].
  • ΔT: Difference between the mean fluid temperature (Tm) and the ambient temperature (Ta) [K].
  • Ibc(θ): Incident direct normal radiation on the collector, where θ is the incident angle [W/m2].
The incident direct normal radiation on the collector (Ibc) used in the efficiency expression above is that resulting from the product of direct normal radiation and the incident angle cosine. The incident angle for the case in which the tracking system is North-South is determined according the following expression [37].
θ = a cos [ cos ( d e c l i ) ( cos ( l a t ) cos ( a n g h o r ) + tan ( d e c l i ) sin ( l a t ) ) 2 + sin 2 ( a n g h o r ) ]  
  • decli: Declination [°].
  • lat: Latitude [°].
  • anghor: Hourly angle [°].
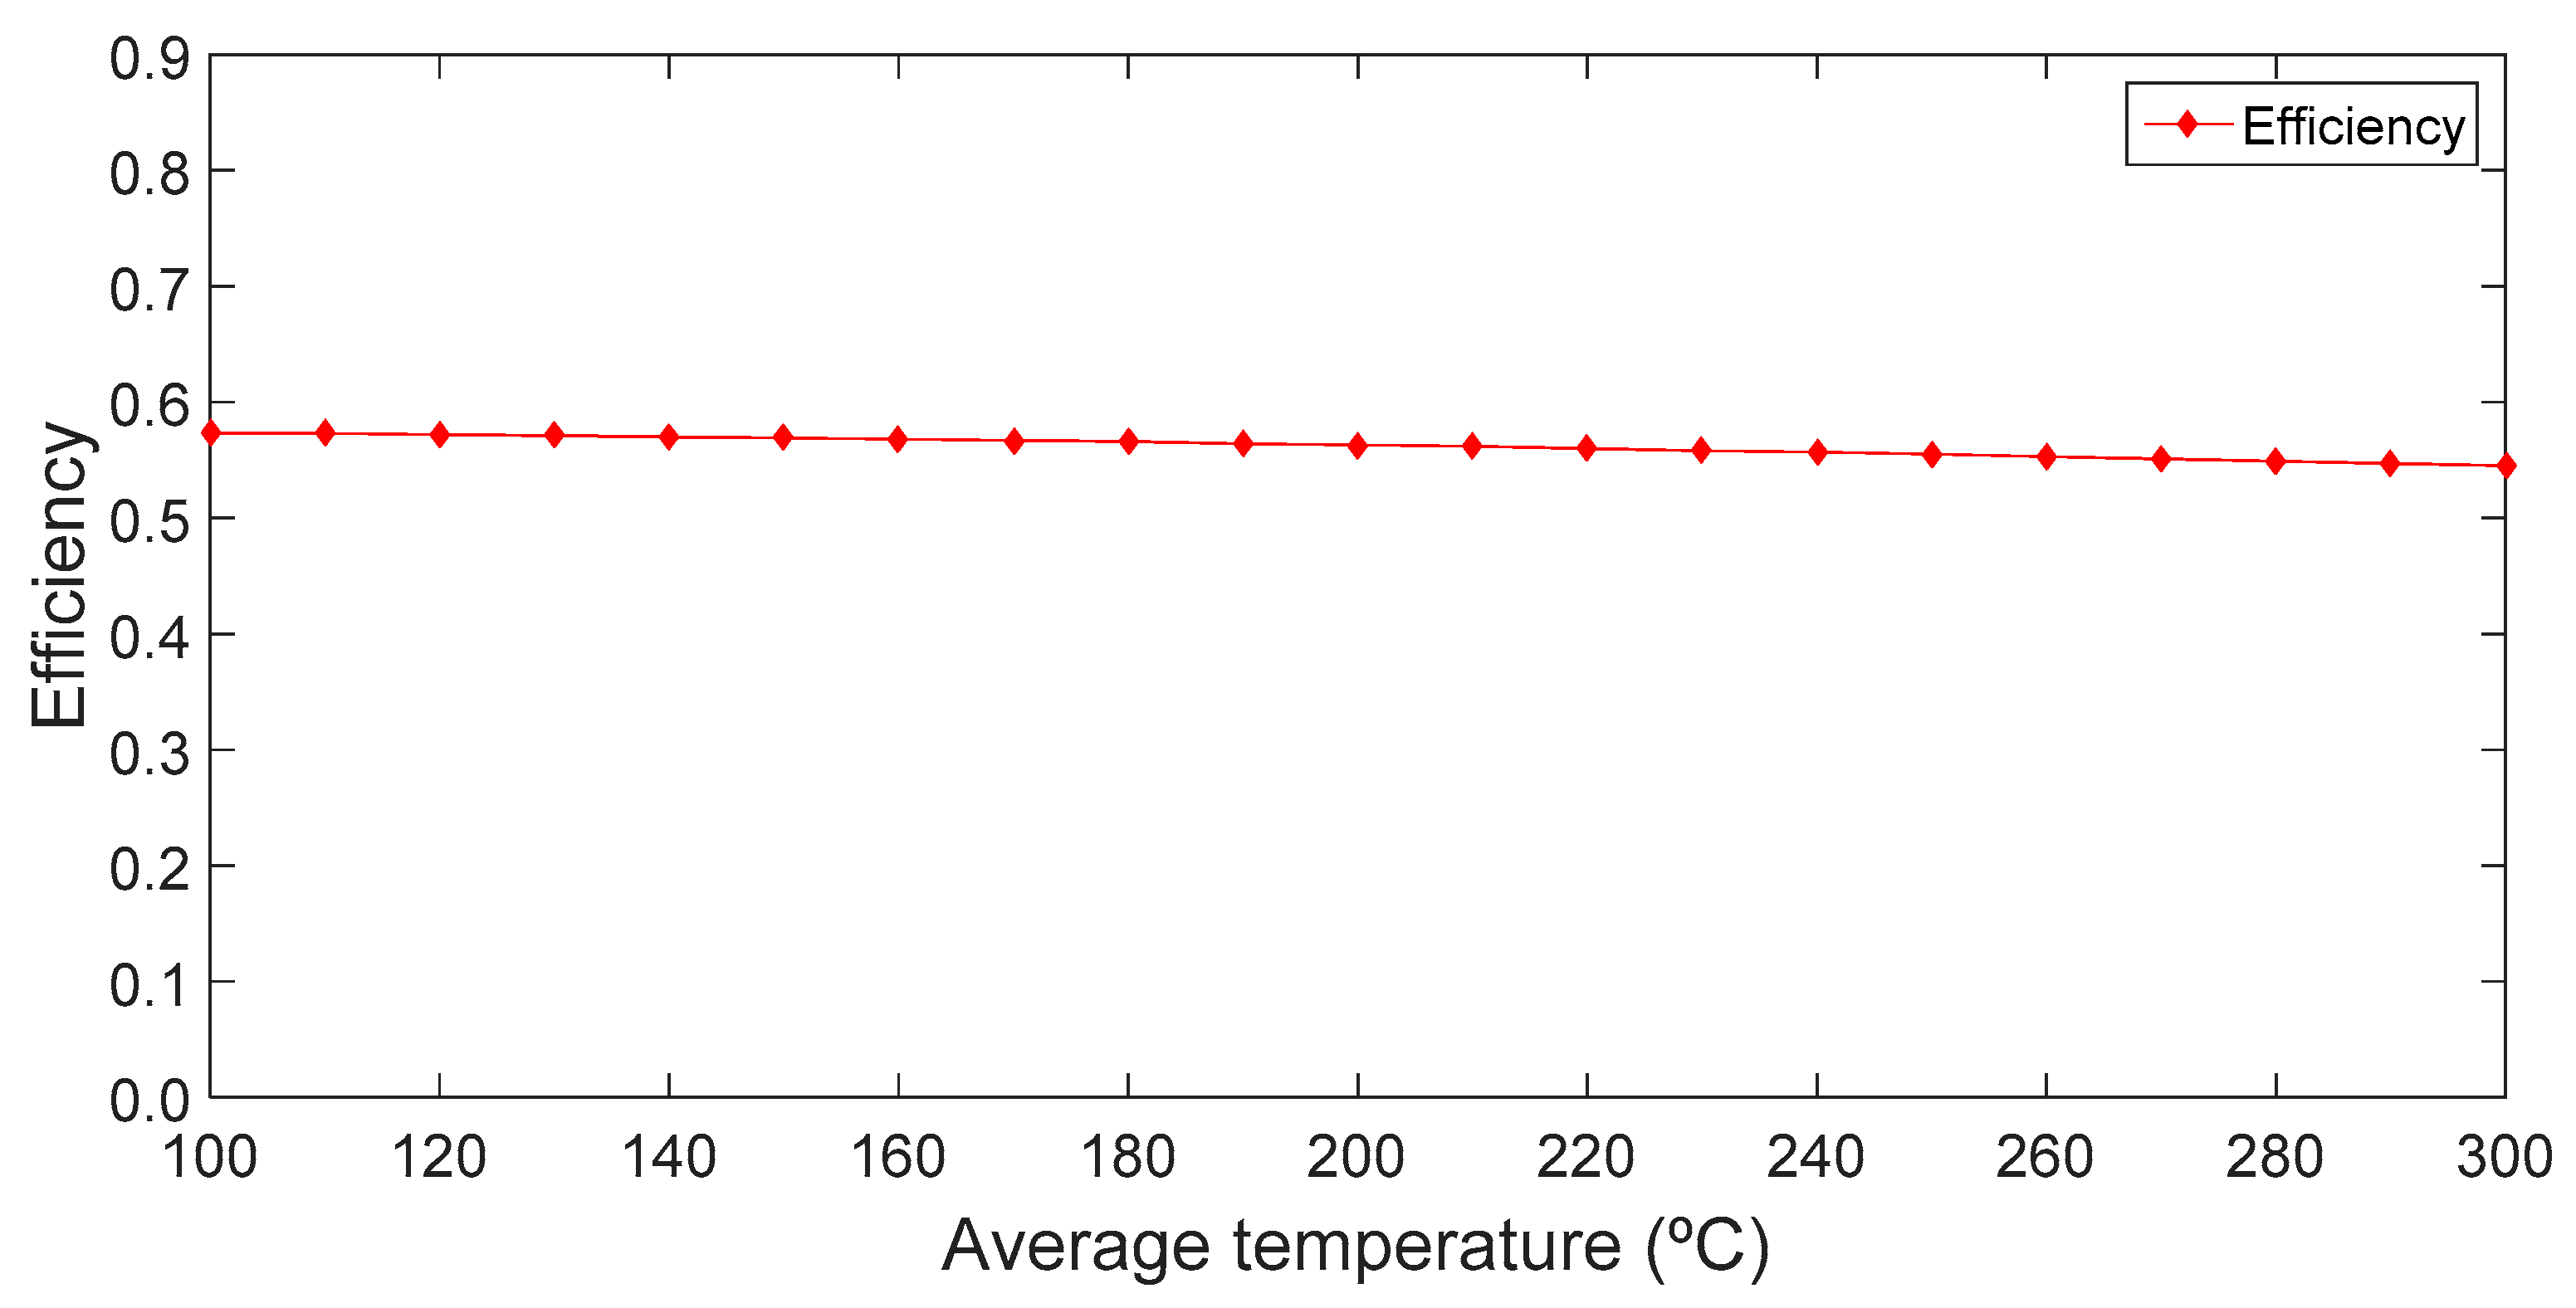
Figure 2 shows the proposed LFC efficiency curve, considering direct steam generation, a 20 °C degrees ambient temperature (Ta) and 1000 W/m2 incident radiation on the collector. The parameters of the equation above η0, c1 and c2 are 0.576, 0.000 y 0.0004 respectively.
The LFC technology efficiency curve shape is consistent with the one proposed by Evangelos et al. [30], although it shows slightly lower efficiency values.

2.1.3. PTC Technology

As mentioned above an instantaneous thermal efficiency curve has been defined for CPC and LFC technologies. In the case of PTC technology it is not advisable to use an adjustment like that due to this is a significantly more complex technology. On this occasion, an energy balance which aim is to know the thermal energy production by the solar installation from the incident solar radiation is made. The losses involved in the process of transforming solar radiation into thermal energy are divided into geometric, optical and thermal [38]. Currently there is quite reliable information of PTC technology used for electrical generation using thermal fluid temperatures around 400 °C. As the thermal analysis level chosen for this study is 350 °C, it has been decided to use the available data from PTC technology for electrical production. The expression to calculate the thermal energy production by the solar installation is as follow:
E s o l a r _ f i e l d _ o u t p u t = E i n c i d e n t _ s o l a r F s h a d o w F s o i l i n g k mod η p e a k _ o p t i c a l η t h e r m a l Δ t  
E i n c i d e n t _ s o l a r = S c I b n cos ϕ  
F s h a d o w = | sin ( π 2 t e t a t r a c k ) | L e c a p e r c c p  
η p e a k _ o p t i c a l = ρ α τ γ  
k mod = [ 1 2.23073 × 10 4 ϕ 1.1 × 10 4 ϕ 2 + 3.18596 × 10 6 ϕ 3 4.8509 × 10 8 ϕ 4 ]  
  • Esolar_field_output: Energy at the output of the solar field [Wh].
  • Eincident_solar: Energy solar radiation [W].
  • Fshadow: Shadow factor [°/1].
  • Fsoiling: Soiling factor [°/1].
  • kmod: Incidence angle modifier [°/1].
  • ηpeak_optical: Peak optical efficiency [%].
  • ηthermal: Thermal efficiency [%].
  • Δt: Time interval [h].
  • Sc: Reflective surface opening area [m2].
  • Ibn: Direct normal radiation [W/m2].
  • Φ: Incidence angle [°].
  • tetatrack: Parabolic trough collector track angle [°].
  • Lec: Distance between rows of collectors from center to center [m].
  • aperCCP: Opening width of the collectors [m].
  • ρ: Reflectance [°/1].
  • α: Interception factor [°/1].
  • τ: Transmittance [°/1].
  • γ: Absorption [°/1].
To advance in the analysis that is intended to be carried out in the framework of this study, a 0.93 thermal efficiency and the approximate values of the following variables are considered:
  • Mirrors reflectance: 0.92 [°/1].
  • Cover transmittance: 0.965 [°/1].
  • Receiver absorption: 0.96 [°/1].
  • Interception factor: 0.95 [°/1].
The tracking system considered in this case, as above, is North-South.
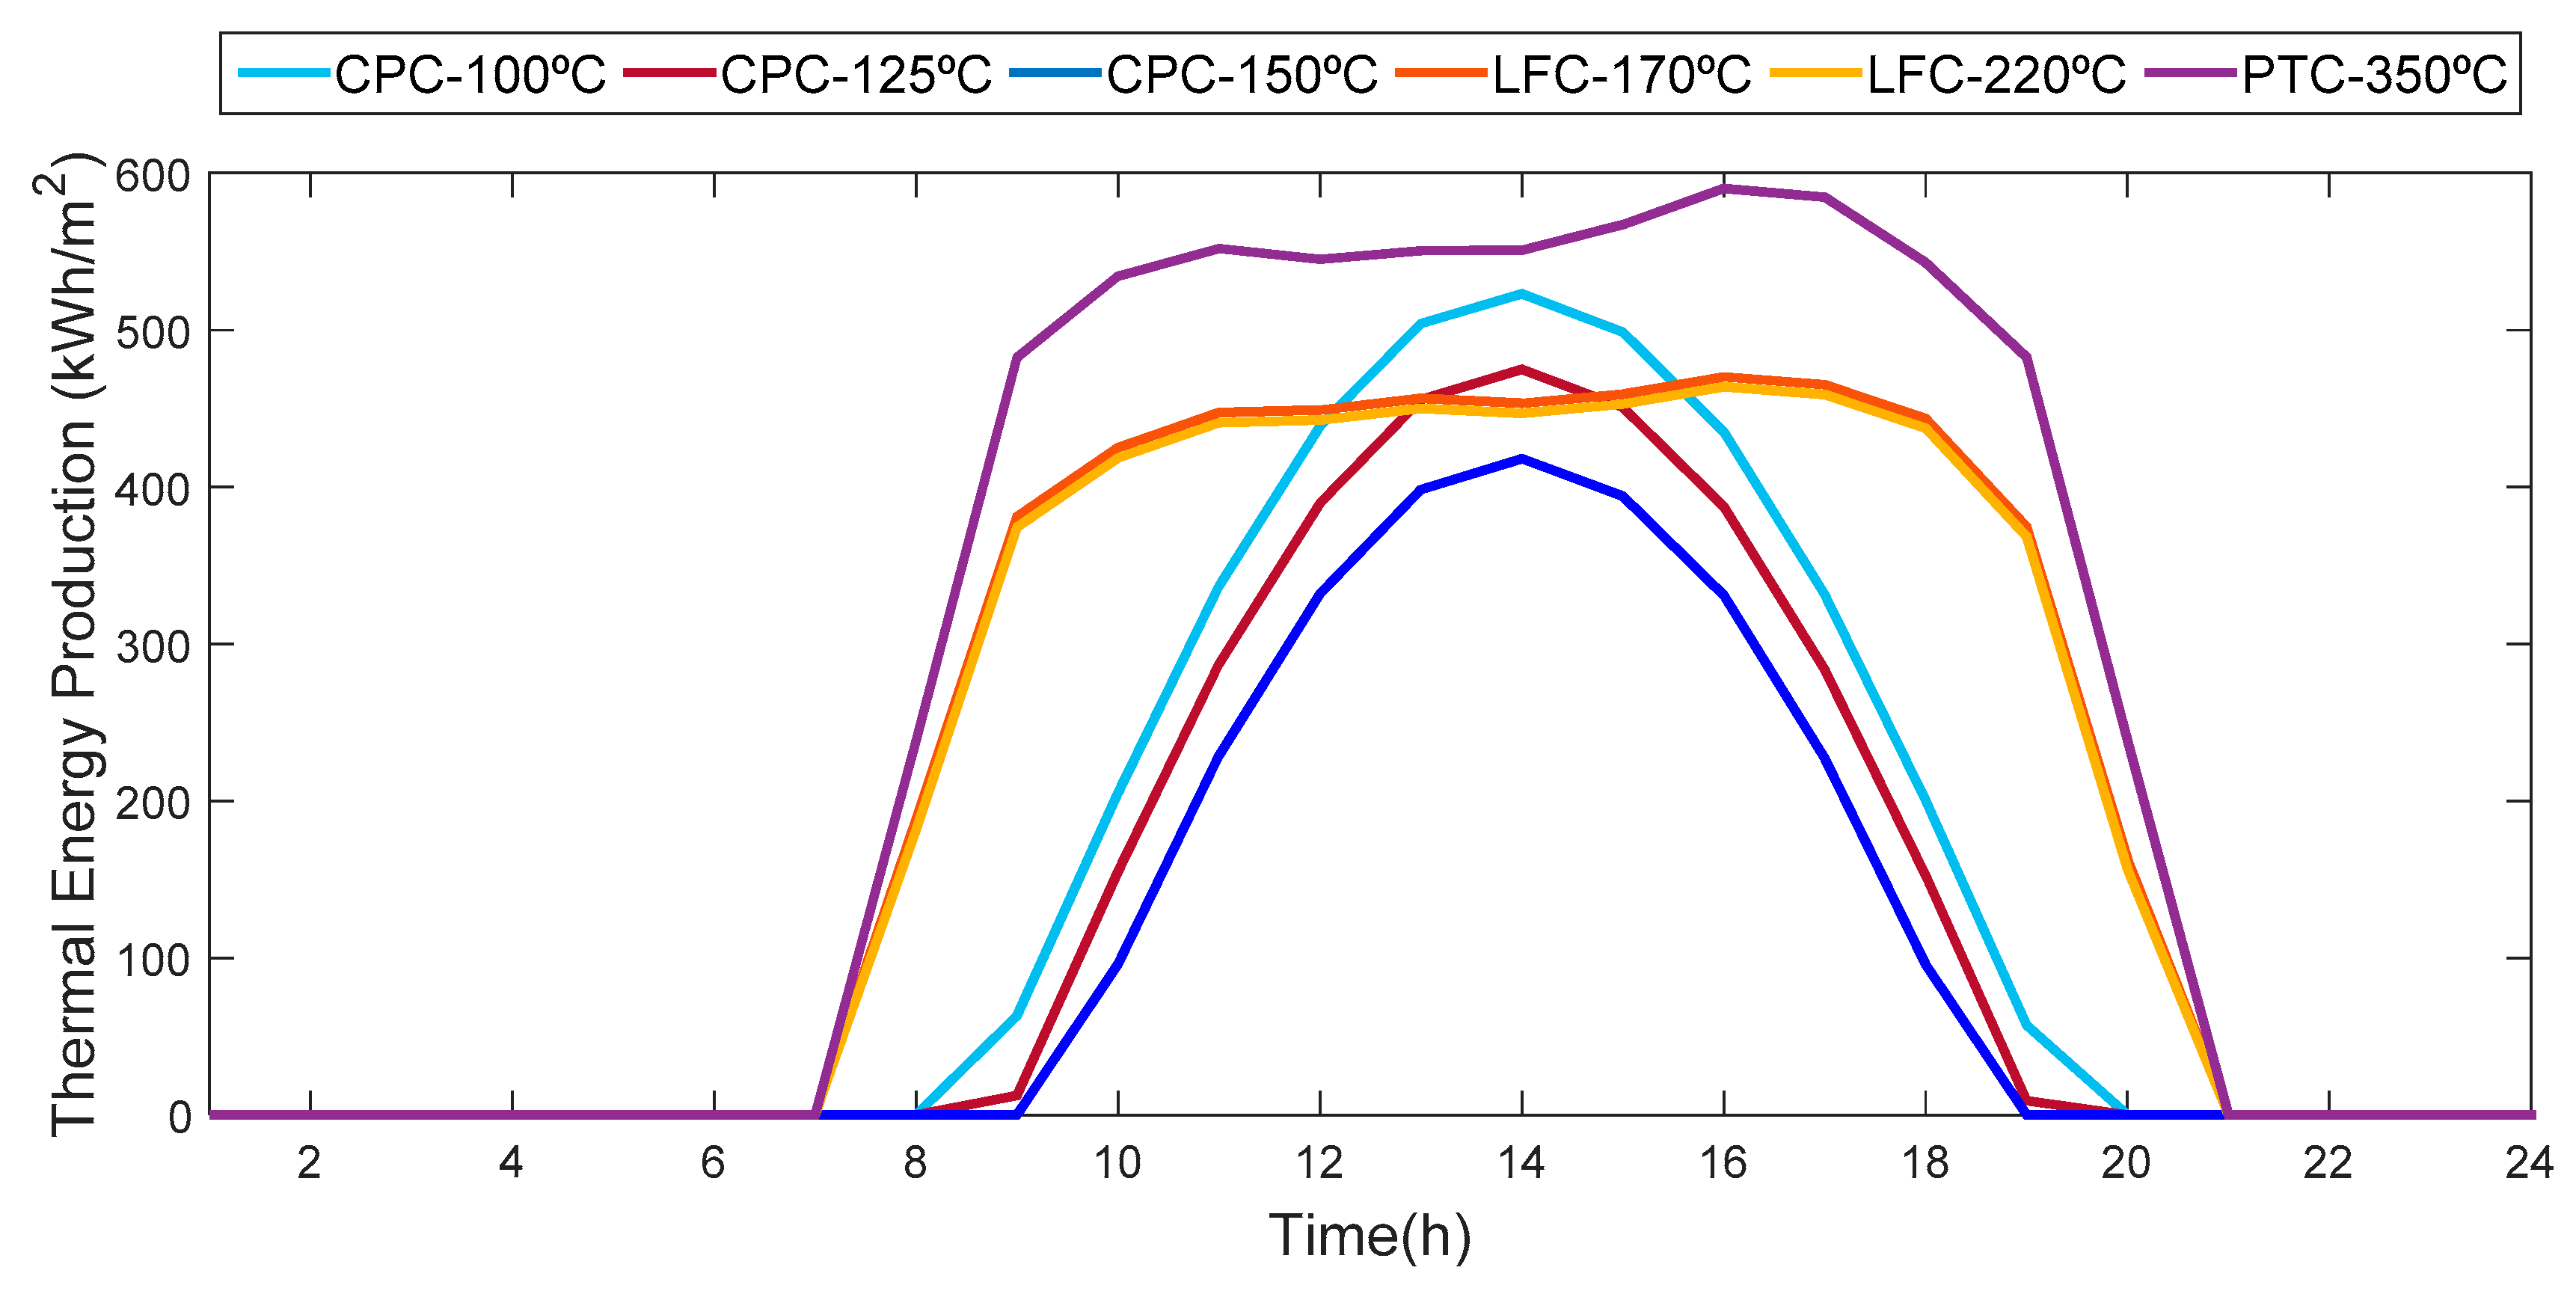
Figure 3 shows as example the hourly performance curve in terms of thermal energy production for the three technologies and thermal levels considered in this paper for the particular case of Seville and the 20 June. The radiation data used are those corresponding to the representative solar year extracted from Meteonorm.

2.2. CPC, LFC and PTC Economic Parameters

The purpose of this subsection is to determine the cost structure of solar installations in which CPC, LFC and PTC technologies are employed. This is a complex task since this kind of economic information is not usually available, its reliability is not assured and it is not certainly known if this information is properly updated. This difficulty increases even more when trying to obtain these costs depending on the size of the solar installation. Table 4, Table 5 and Table 6 summarise investment costs (CI), annual operation and maintenance costs (COM) and replacement costs (CR) for all technologies. CI is expressed as a function of the solar field area, COM and CR are expressed as a percentage of the CI. Costs described in this section do not include auxiliary energy or industrial processes costs.

2.2.1. CPC Technology

Several studies provide information about CPC technology costs [5,36]. The first study indicates that CPC technology costs ranges from 400 €/m2 to 800 €/m2. This is an average value for the entire European market. The second study indicates that the complete installation cost varies from 857 €/m2 to 730 €/m2 if the solar field area ranges from 50 m2 to 5000 m2. In addition to the information provided by these studies sector experts have been consulted. They indicate that in both cases these cost reflect specific situations and that in a market with a representative demand, for sizes over 50 m2 and for updated prices, costs are significantly lower. Based on the gathered information, it has been estimated that the investment cost ranges between 325 €/m2 and 225 €/m2 if the solar field area varies from 50 m2 to 2000 m2. Once this size has been reached, the investment cost per solar field area unit remains constant. These figures include investments relating to the storage system.

2.2.2. LFC Technology

To determine the LFC technology installation cost two studies are considered [36,39]. Although these studies aim to determine the installation cost of facilities in which electricity is generated, solar field area costs are used as reference. The first study estimates that the solar field area cost is about 156 €/m2, in the second one this parameter is about 217 €/m2. This paper considers the information provided by the first study since it focuses on the Spanish market. Since there is no economical information about the storage system, exchanger, control system and other elements included in the solar installation group, this cost is estimated about 100 €/m2. Table 4 shows the costs associated with a small and a large size solar field area. This paper considers that a LFC technology installation is large if its solar field area is equal or greater than 15,000 m2. This is not comparable with those installations whose objective is the generation of electrical energy.

2.2.3. PTC Technology

To assess the PTC technology installation costs, the information contain within three studies is analysed [36,40,41]. The data collected from the first study shows that the solar field cost per unit area including all the elements of the solar installation group, is around 330 €/m2. In the second case, the estimate of this cost is 512 €/m2. Taking into account this information, the costs per unit area of solar field for small and large installations considered for this paper are included in the table below.
Costs considered in this paper are consistent with the information provided by the last study analysed [40], in which it is indicated that the cost per unit area of a large PTC technology installation ranges between 190 €/m2 and 440 €/m2.
The costs taken into account in this paper are slightly higher than those considered by Evangelos et al. [30] since also storage system, exchanger, auxiliary elements, operation and maintenance and financial costs are included. Moreover, the economic results are also slightly higher taking into account the shorter useful life of the installation considered (20 years) and the additional costs taken into account.

3. Conventional Energy Sources

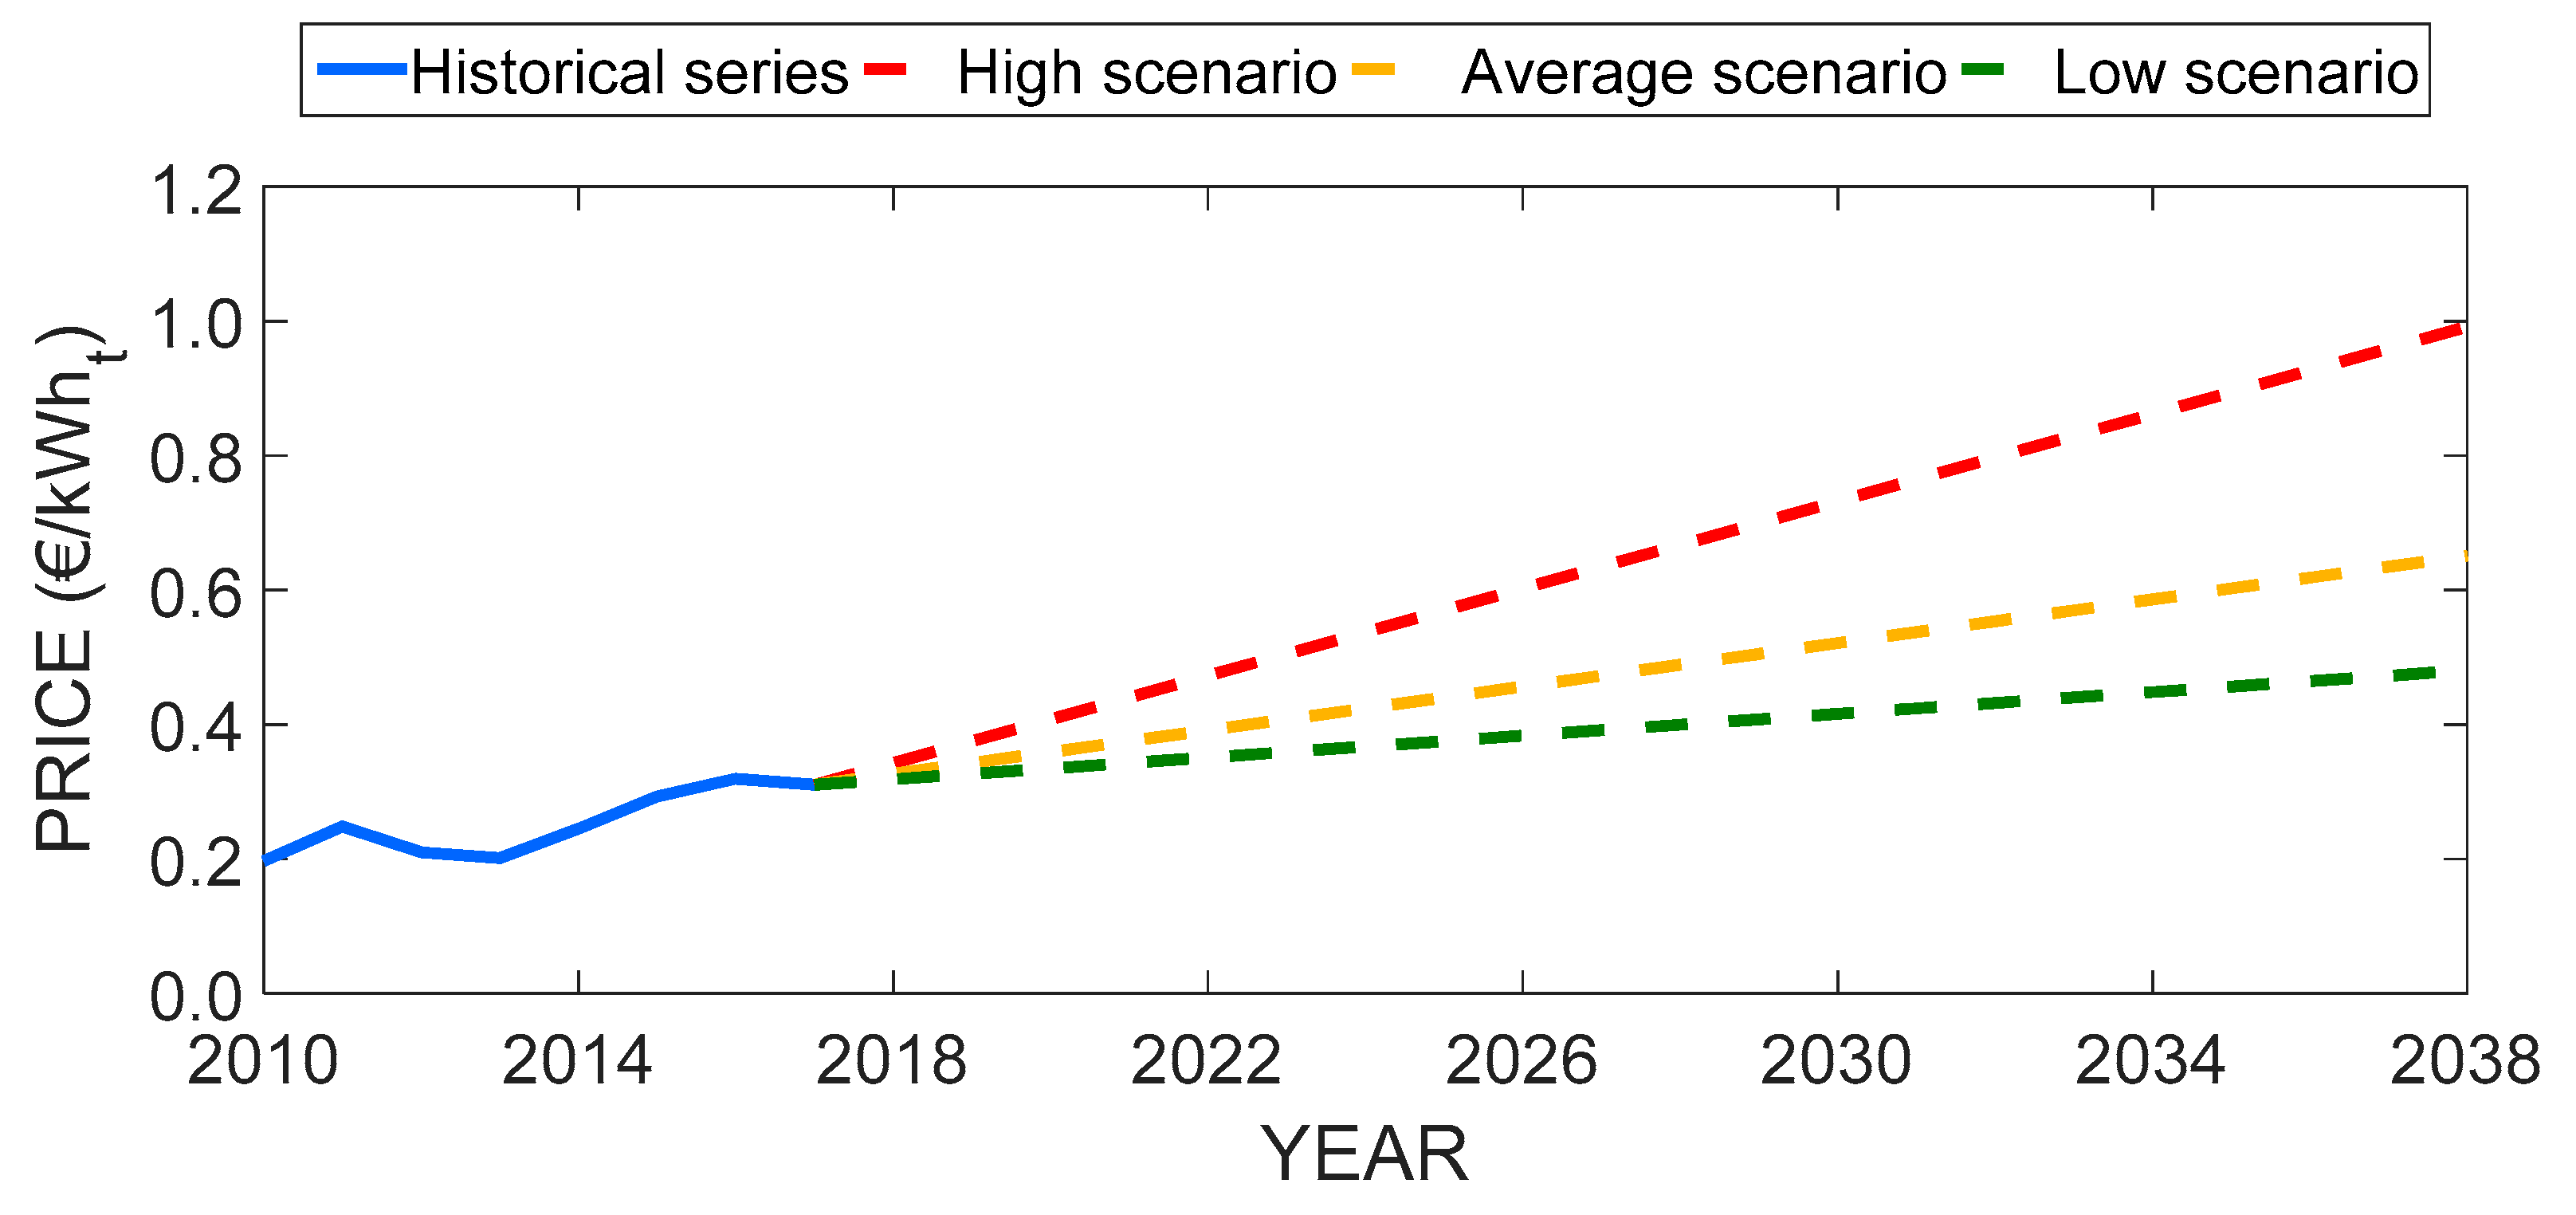
As already mentioned in the introduction one of the purposes of this paper is to contrast the cost of generating thermal energy from installations where medium temperature solar concentration technologies are used with thermal energy obtained from conventional energy sources. It is not easy to characterise these generating costs mainly due to the great variability of rates and changes over time. A review of rates related to energy sources traditionally used in industrial processes is carried out throughout this section, including in this group natural gas, electricity, diesel and fuel oil. Coal is not included in this paper since this is in a progressive state of abandonment. The price evolution of natural gas, electricity, diesel and fuel oil during the last years is analysed and a forecast is made for the next twenty years, establishing three possible scenarios:
  • Average scenario: The prices evolution maintains the slope of recent years.
  • Low scenario: The prices evolution slope is half than the average scenario slope.
  • High scenario: The price evolution slope is double the average scenario slope.
To evaluate these scenarios, the information provided by Eurostat [42] and the Oil Bulletin of the European Commission [43] has been used.
Natural Gas: Eurostat classifies industrial consumers of natural gas into six groups depending on their annual consumption. The groups that are established are shown in Table 7:
Considering the three scenarios described at the beginning of this section, the kWht price is estimated for each of the six segments of industrial consumers.
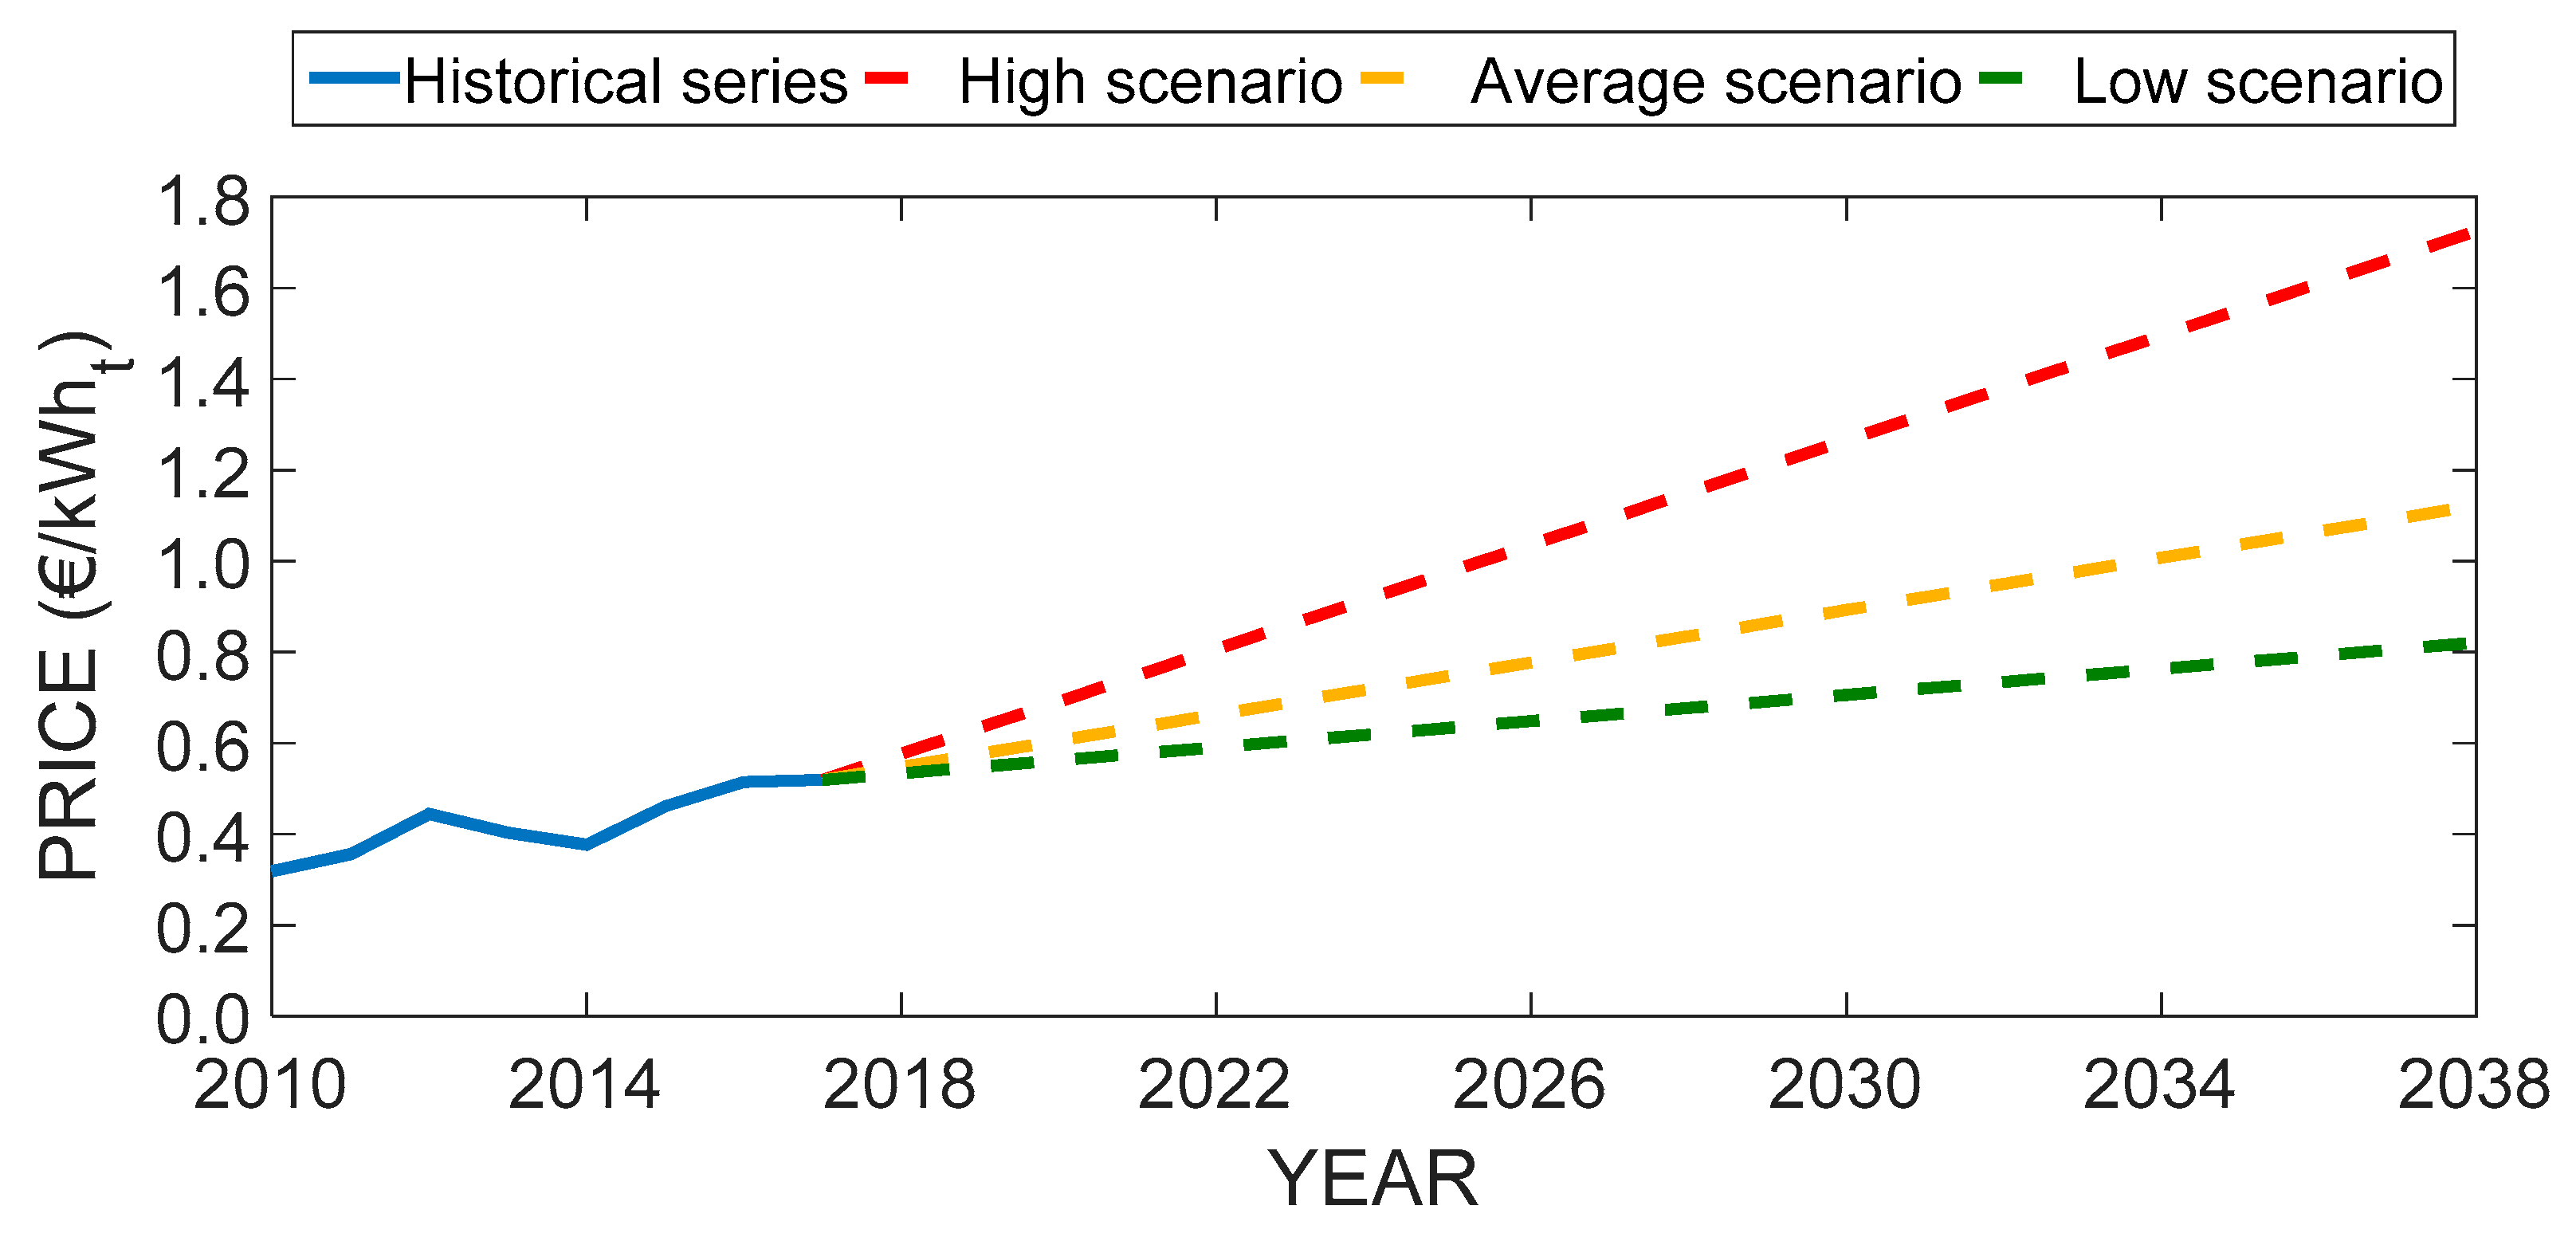
 Figure 4 and Figure 5 show I1 and I6 group estimation as example; the rest of the groups show a similar behaviour.
The first part of the data of Figure 4 and Figure 5 (blue), up to the year 2017, collects the information provided by Eurostat [42]. The second part of the figure shows the three possible estimations made by the authors.
Table 8 shows the natural gas price forecast without VAT and reimbursable rates with a time horizon of twenty years.
Electricity: Rates applied to users are defined by the contracted power. Since it is again difficult to have this information for the particular case of industrial consumers, data from Eurostat is used again. Electricity industrial consumer classification is shown in Table 9.
As in the previous case, the kWht price is estimated for the three scenarios, each type of industrial consumer and considering a time horizon of 20 years, results are shown in Table 10.
Petroleum Products: The oil price depends on multiple factors, among which highlight political decisions, market strategies or supply and demand interactions. This means that the oil price and thereby their products present a great variability over time. Fuel oil and diesel oil are considered in this paper. To obtain the historical series of fuel oil prices, the information provided by the Oil Bulletin is used, where prices can be found from January 2005 to present for all member countries of the European Union. Based on the information collected, the fuel oil price forecast expected over the next 20 years is made. The three scenarios already described have been considered again. Table 11 shows the fuel oil prices estimation.
To obtain the diesel oil price estimation the procedure is similar as above, that is, using the information provided by [43]. Based on the information collected, the price evolution over the next 20 years according to the three scenarios already referenced is obtained, results are shown in Table 12.

4. Methodology

This section focuses on describing the methodology employed to achieve the objective proposed at the beginning of this paper, to evaluate the cost of the thermal energy generated from a solar installation in which medium temperature solar concentration technologies are used. Below, the steps of this methodology are described in detail.

4.1. Site Selection

This study evaluates the thermal energy production potential from different medium temperature solar concentration technologies throughout the Spanish territory. Since it is not feasible to analyse the territory in its entirety, it is recommendable to select sites that provide representative results. In this context, and since these sites cannot be chosen randomly, the information provided by the Código Técnico de la Edificación is employed [44]. According to this information the Spanish territory is divided into five climatic zones based on the range of the average daily global horizontal radiation. Figure 6 shows the Spanish climatic zones.

4.2. Solar Resource Evaluation

For this study, it is necessary to have a large enough database or, failing that, a representative solar year that includes the essential radiometric and meteorological variables that allow to climatologically characterize the selected sites. The essential variables for this study are global horizontal radiation, direct normal radiation and ambient temperature. Regarding the temporal resolution of this database, it must be, at least, hourly. Since it is difficult to obtain this radiation information the software Meteonorm (Version V.7.1.4) has been employed to obtain the representative solar year in hourly frequency for all selected sites.

4.3. Selected Plant Configuration

The plant studied in this paper work together with an existing industrial process. The solar system provides most of the energy required by the industrial process. When these requirements cannot be met with the solar installation, the auxiliary system is used, which is the source of energy traditionally used by the industrial process. The plant that is analyzed in this paper is composed of a solar field, a heat exchanger and a thermal energy storage system. Figure 7 shows, as example, the scheme of the analyzed configuration when CPC technology is used. This configuration corresponds to the scheme of a series connection of an external heat exchanger [45]. This scheme can be applied to any of the categories of heat consumers, preheating, heating or maintaining fluids temperature. It could even be used for cooling by using a heat pump. According to this scheme two assumptions are considered, the industrial process uses a single thermal level and there is no heat recovery from other processes.
The solar field function is the use of the incident solar radiation to increase the thermal energy of the heat transfer fluid. Solar technologies considered in this paper and their main characteristics are shown in the Table 13:

4.4. Estimation of Thermal Energy Available at the Solar Installation Output for Each Site, Technology and Thermal Level Analysed in This Paper

The purpose of this step is to quantify the thermal energy generated by the solar field for each option considered in this paper.
The way used in this paper to obtain the thermal energy production varies slightly depending on the technology. In the case of CPC and LFC technologies the thermal energy generated by the solar field is quantified according to the expression above:
E s f = t = i i i f I t η s f  
  • Esf: Thermal energy generated by the solar field [W/m2].
  • It: Hourly incident solar radiation on the collector [W/m2].
  • ηsf: Instantaneous solar field efficiency [°/1].
  • ii: First record.
  • if: Last record.
The incident solar radiation on the collector is global radiation in the case of CPC technology and direct radiation when LFC is considered.
In the case of PTC technology the energy balance showed in Section 2 already provides the thermal energy at the solar field output. The thermal energy generated per unit area over a full year is quantified by the expression below:
E s f = t = i i i f E s o l a r _ f i e l d _ o u t p u t t  
The usable energy by the industrial process (EIP) is not the same as the generated by the solar field due to solar installation thermal losses. Heat exchanger (ŋhe) and energy storage systems (ŋSAT) efficiencies considered are 90% [46,47]. EIP is quantified according to the following expression:
E I P = t = i i i f E s f t · η h e η S A T  

4.5. Thermal Energy Unit Cost (€/kWht)

The purpose of this step is to obtain the thermal energy cost of medium temperature solar concentration technologies. To reach this aim the accumulated thermal energy used by the industrial process and the lifespan costs over the analysed interval time are required. The accumulated thermal energy (ATE) used by the industrial process is calculated as the product of the useful energy for the industrial process (EIP) obtained in the previous step, the percentage of solar use (PSU) and the considered number of years (NY).
A T E = E I P P S U N Y
The PSU parameter of the expression above is defined as the percentage of energy used by the industrial process over the total energy generated by the solar system.
To obtain the lifespan cost (Clifespan) it is necessary to take into account the investment, operation and maintenance and replacement costs, information provided in Section 2, the consumer price index (r) and the solar installation useful life (n), 20 years in this paper.
C l i f e s p a n = C I + i = 1 20 C O M + C R ( 1 + r ) n  
The thermal energy unit cost (Cthermal_emergy_unit) is obtained according to the following expression:
C t h e r m a l _ e n e r g y _ u n i t = C l i f e s p a n A T E  

4.6. Analysis of Environmental Advantages

The last stage of the proposed methodology quantifies the GHG emission avoided by the use of solar concentration technologies instead of conventional sources of energy. For this purpose it is essential to obtain the quantity of conventional source of energy that produce an equivalent amount of thermal energy to the one generated by the medium temperature solar concentration technology installation.
To evaluate the equivalent amount of electricity (Ee) is considered Joule effect. The GHG emissions avoided by the use of a solar system instead of electricity (GHGe) are calculated using the electricity conversion factor (FPe):
G H G e = E e · F P e  
In the case of natural gas it is considered the use of a boiler. Thermal energy is generated by a combustion process. The natural gas lower heating value (LHV) and the efficiency boiler (ŋb) are 8.18 kWh/m3 and 96% respectively [48]. The volume (V) of natural gas used is calculated according to the following expressions:
V = E I P / ( L H V · η b )  
GHG emissions avoided by the use of a solar system instead of natural gas are obtained as follow, taking into account that FPng represents the natural gas conversion factor:
G H G n g = V · F P n g  
Similar expressions are used for the cases of fuel oil and diesel oil, when LHV values are 11.08 kWh/kg and 10.28 kWh/l respectively [49,50].

5. Application and Results

Throughout this section, the application of the methodology previously described is detailed and the results obtained are shown.

5.1. Site Selection

Table 14 lists the sites selected for this study, these are also shown in Figure 8. Two cities have been chosen for each climatic zone. It is considered that this selection will provide representative results. For each location, the name of the city, the climatic zone, the latitude, the longitude and the height above the sea level have been included.

5.2. Solar Resource Evaluation

Table 15 and Table 16 summarize the accumulated monthly and annual global horizontal radiation (Ig0) and direct normal radiation (Ibn), in both cases for each one of the sites listed in Table 14. Annual global horizontal radiation ranges from 1315 kWh/m2 to 1927 kWh/m2 while annual direct normal radiation ranges from 1220 kWh/m2 to 2329 kWh/m2. Monthly and annual accumulated radiation values shown in tables below have been calculated from hourly values obtained throughout Meteonorm software. Although only a summary of these values have been included in this section, radiometric and meteorological hourly values have been used for all calculations. For instance, all solar collector performance values have been calculated from hourly data.
Among the meteorological variables that the Meteonorm software provides, it stands out by its influence in this analysis the ambient temperature. Table 16 shows the average monthly ambient temperature (Ta). As in tables above, the average monthly ambient temperature values included in Table 17 have been calculated from the hourly values obtained throughout Meteonorm software.

5.3. Estimation of Thermal Energy Available at the Solar Installation Output for Each Site, Technology and Thermal Level Analysed in This Paper

This subsection shows the results of the estimation of thermal energy available at the solar installation output for each option considered in this paper. To achieve this purpose, the associated information to each solar technology efficiency (Section 2), the equations proposed to estimate the generated thermal energy (Section 4.4) and, naturally the radiometric and meteorological information summarized at the beginning of this section are used.
Table 18 summarizes above-mentioned results for the three thermal levels in which it is considered that the use of a CPC technology solar installation can be beneficial, 100 °C, 125 °C and 150 °C. These temperatures refer to the average fluid temperature. This table also summarises the average efficiency for each case.
As the table above, Table 19 shows the results associated with the thermal energy available in the storage system of a Fresnel technology solar installation and the average efficiency. In this case, two thermal levels are considered, 170 °C and 220 °C.
Lastly, Table 20 summarizes the generated thermal energy per unit area in a PTC technology solar installation and the average efficiency.
Tables above show that all technologies show common operation standards for all sites, mainly depending on their characteristic solar resource available. CPC technology shows general downgrade of thermal energy generated by solar systems when working temperature increases, a similar behaviour, although softer, is observed in the case of LFC technology. These results are close to the expected. At low fluid temperatures (around 100 °C) the most recommended technology from the thermal energy generation point of view is CPC, as this temperature increases; it goes to PTC technology, going through LFC technology.
Between sites considered in this paper Sevilla stands out as the site which greater generated thermal energy values. The results of Vitoria place it at the other extreme.

5.4. Thermal Energy Unit Cost (c€/kWht)

Table 21, Table 22 and Table 23 summarize the thermal energy generation cost for the different sites and each of the medium temperature solar concentration technologies analysed in this paper. These tables also differentiate results depending on the percentage of solar use, the average fluid temperature and the solar field area size. The percentage of solar use parameter is related to the coupling in time between the thermal energy generation and the demand by the industrial process. Accordingly, the role of the storage system is essential due to this is the component of the solar installation that allows decoupling supply and demand. The average fluid temperature is defined, as mentioned above, by the industrial process requirements. The last parameter considered in this analysis is the size of the solar field area, it affects mainly from the economic point of view, due to the reduction of costs that usually occurs when the solar field area is increased.
To analyse in a simple way the results shown in the tables above, Figure 9 and Figure 10 have been included. These graphs show the thermal energy generation cost for each medium temperature solar concentration technology depending on the average fluid temperature and the percentage of solar use. The thermal energy generation cost range represented by each bar of these graphs is related to the solar resource variability, which in turn is connected with the sites selected at the beginning of this section. As already stated, the solar field area is a significant parameter from the economic point of view, thus the graphic representation has been broken down into two graphs. Figure 9 represents the thermal energy generation cost for small size solar field areas and Figure 10 for large ones.
The previous graphs show the PSU parameter, fluid temperature and solar field area importance have significant influence on the thermal energy generation cost. As can be observed for all bar groups, the thermal energy generation cost increases proportionally as the PSU decreases. If CPC technology results are analysed, the extreme situation is observed when the average fluid temperature is around 150 °C. The influence of the average fluid temperature is lower in the case of LFC technology. These results show again the importance of the coupling in time between the thermal energy generated by the solar installation and the thermal energy demanded by the industrial process. In general, terms and according to the expressions proposed in Section 4, it can be stated that by reducing the PSU from 100% to 50%, double the thermal energy generation cost.
Moreover, when comparing graphs above, the influence of the solar field area is also evident. As expected by the cost structure shown in Section 2, the costs of thermal energy generation (directly dependent on investment costs) are reduced by increasing the solar field area. This reduction is especiallystrikingin the case of PTC technology.
Regarding the particular case of Spain and conversely of what happened when analyzing the thermal energy generated by the solar installation, higher costs are linked to Vitoria, while lower costs for Seville.
Finally, Table 24 summarizes the thermal energy unit costs of conventional energy sources analysed in this paper considering the three scenarios described in Section 3. Given the wide range of existing electricity and natural gas rates depending the consumers characteristics, the two extreme groups has been included in this table, I1 and I6 Groups and IA and IG Groups respectively. As in the case of medium temperature solar concentration technologies installations the energy costs of this table have been calculated taking into account a time horizon of 20 years.
Finally, Table 25 summarises, as example, the internal rate of return on investment considering the following hypotheses:
  • Site: Seville.
  • Amortization period: 20 years.
  • The initial investment does not require financing.
  • PSU = 100%.
  • Average scenario for conventional energy sources.

5.5. Analysis of Environmental Advantages

To evaluate the environmental advantages, it is necessary to know the conventional energy sources conversion factors; Table 26 shows these parameters for the Spanish case [51].
Lastly GHG emissions avoided by the substitution of conventional sources of energy are summarized in Table 27, Table 28, Table 29 and Table 30.
Kilograms of CO2 reduction, by the use of medium temperature solar concentration technologies instead of electricity, stands out above other options. At the other extreme is natural gas, showing the lowest values. In the middle and showing very similar kilograms of CO2 are fuel oil and diesel oil.
Additional positive factors related to the implementation of solar energy are the achievement of the energy independence, the increase of the local industrial sector and the employment creation.

6. Conclusions

Medium temperature solar concentration technologies become an attractive choice to substitute electricity, natural gas, fuel oil and diesel oil in the Spanish energy market. Results summarize in this paper have been obtained for the particular case of Spain, although they can be extrapolated to other similar sites. This paper analyses the influence of the industrial process temperature and the solar facilities costs to evaluate the possibilities of coupled a solar installation to a specific industrial process. However, when a project is going to be implemented other parameters must be considered, such as the adjustment of supply and demand thermal energy profiles, the solar facilities reliability or the available land without shadows.
Regarding the thermal energy generation point of view, in the case of CPC technology general downgrades of thermal energy generated when working temperature increases have been noted. A similar behaviour, although softer, is observed in the case of LFC technology. These results are consistent with the efficiency curves of CPC and LFC technologies. As the average fluid temperature increases, LFC and PTC technologies become the most recommended instead of the CPC technology.
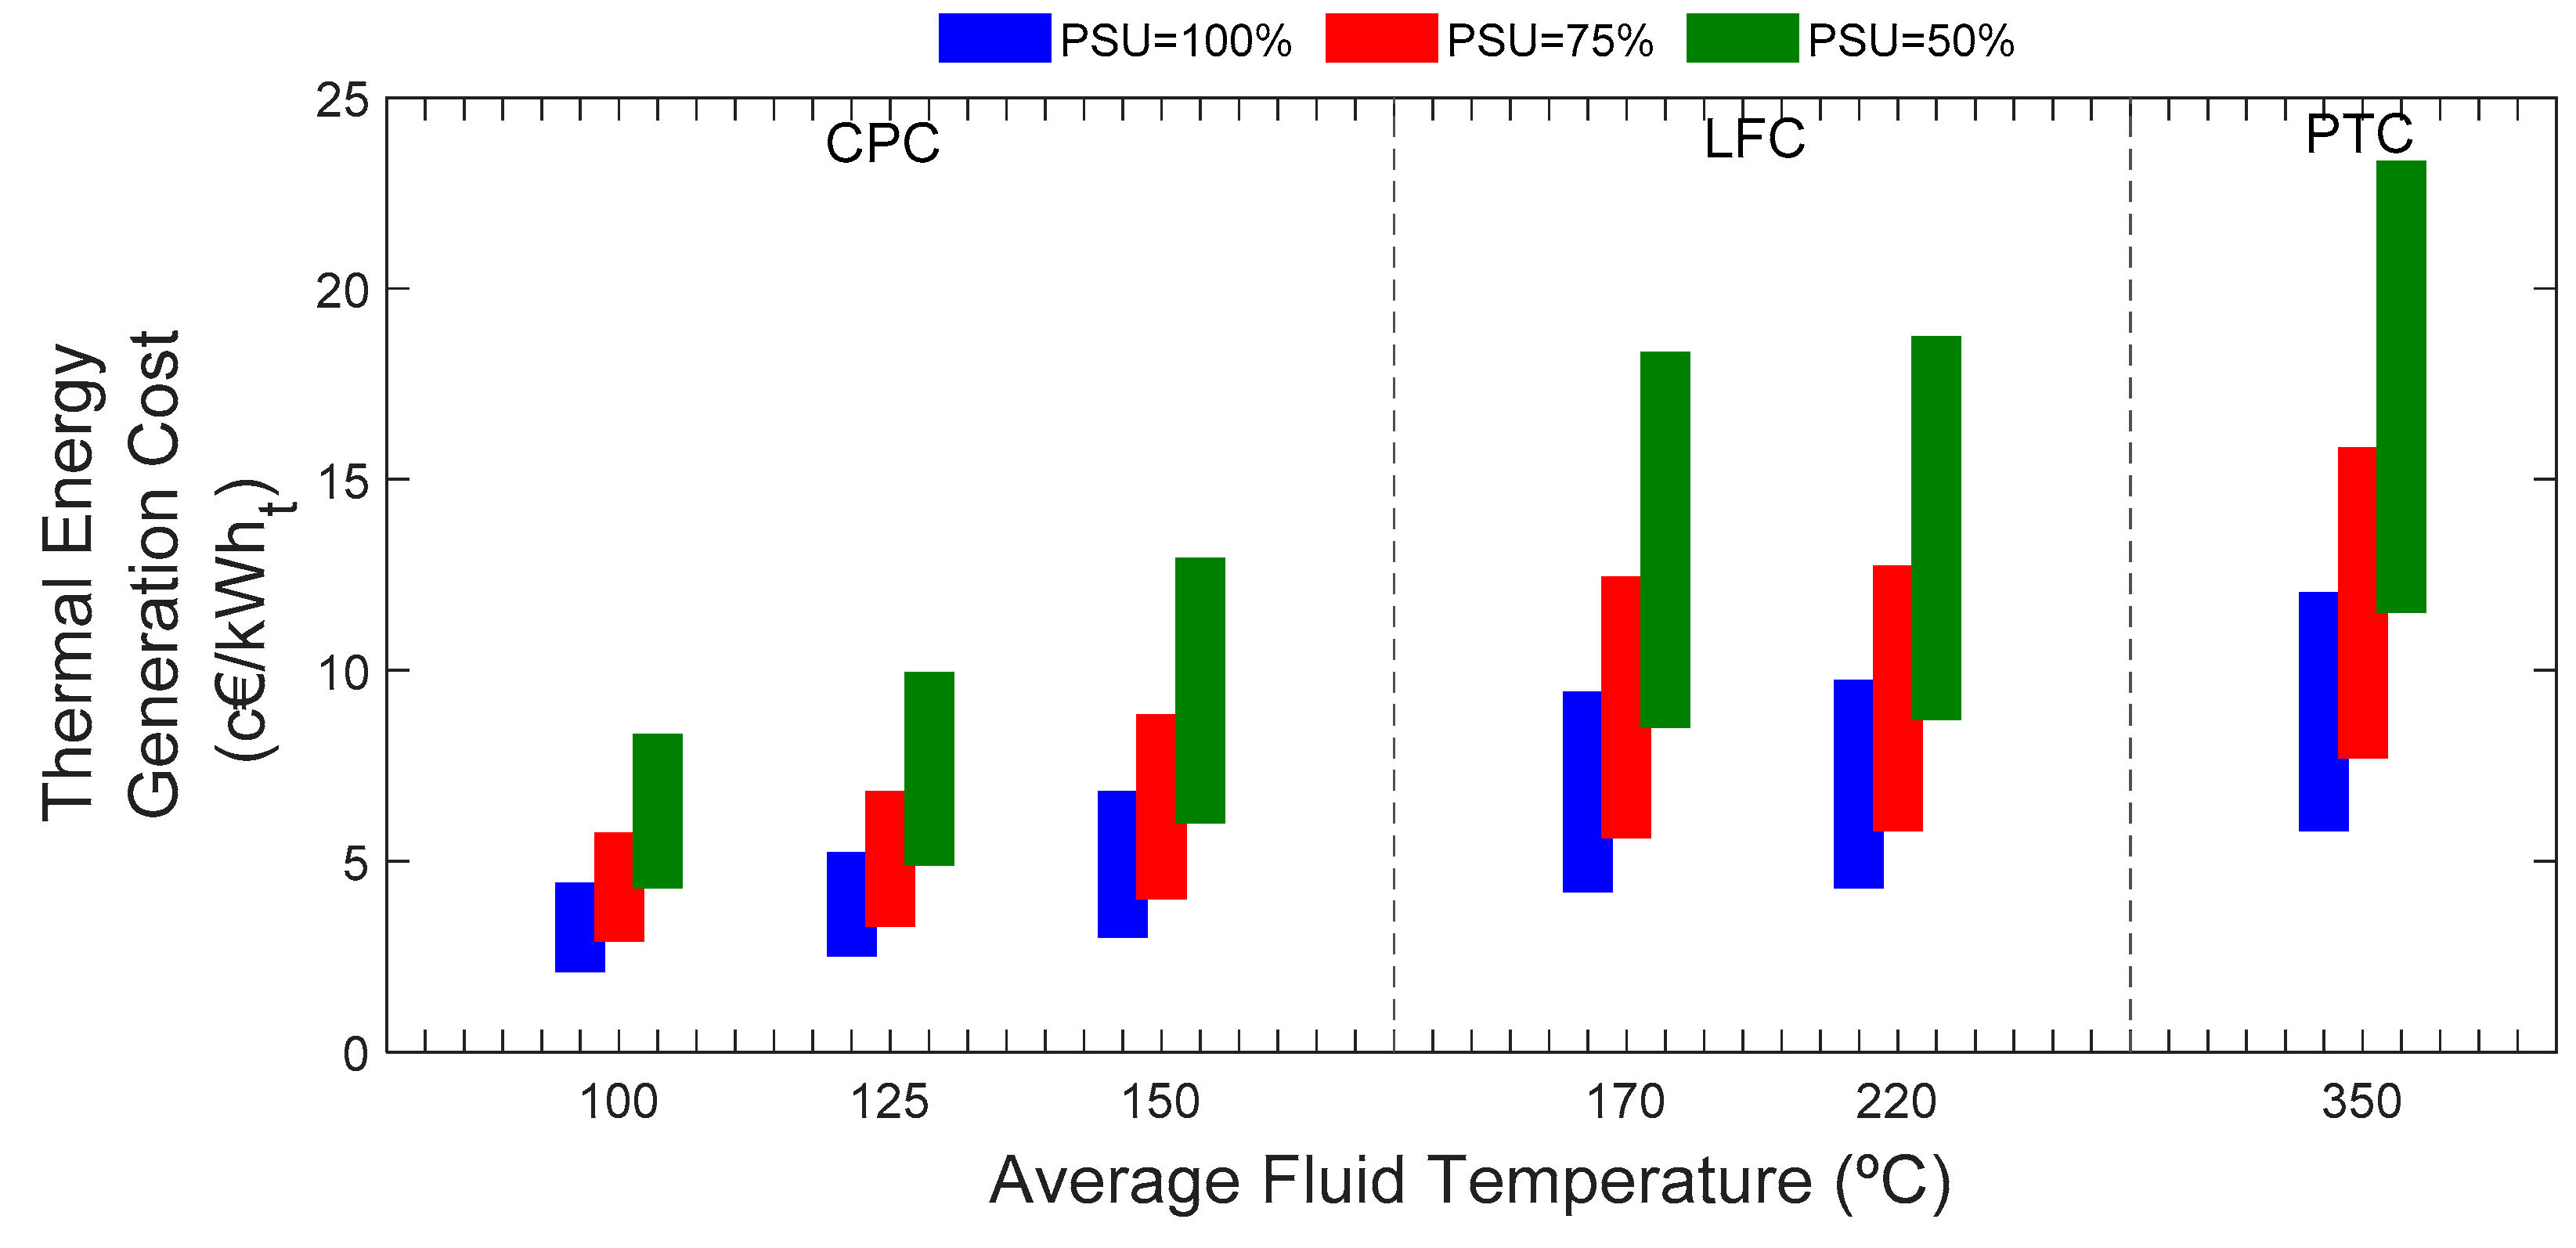
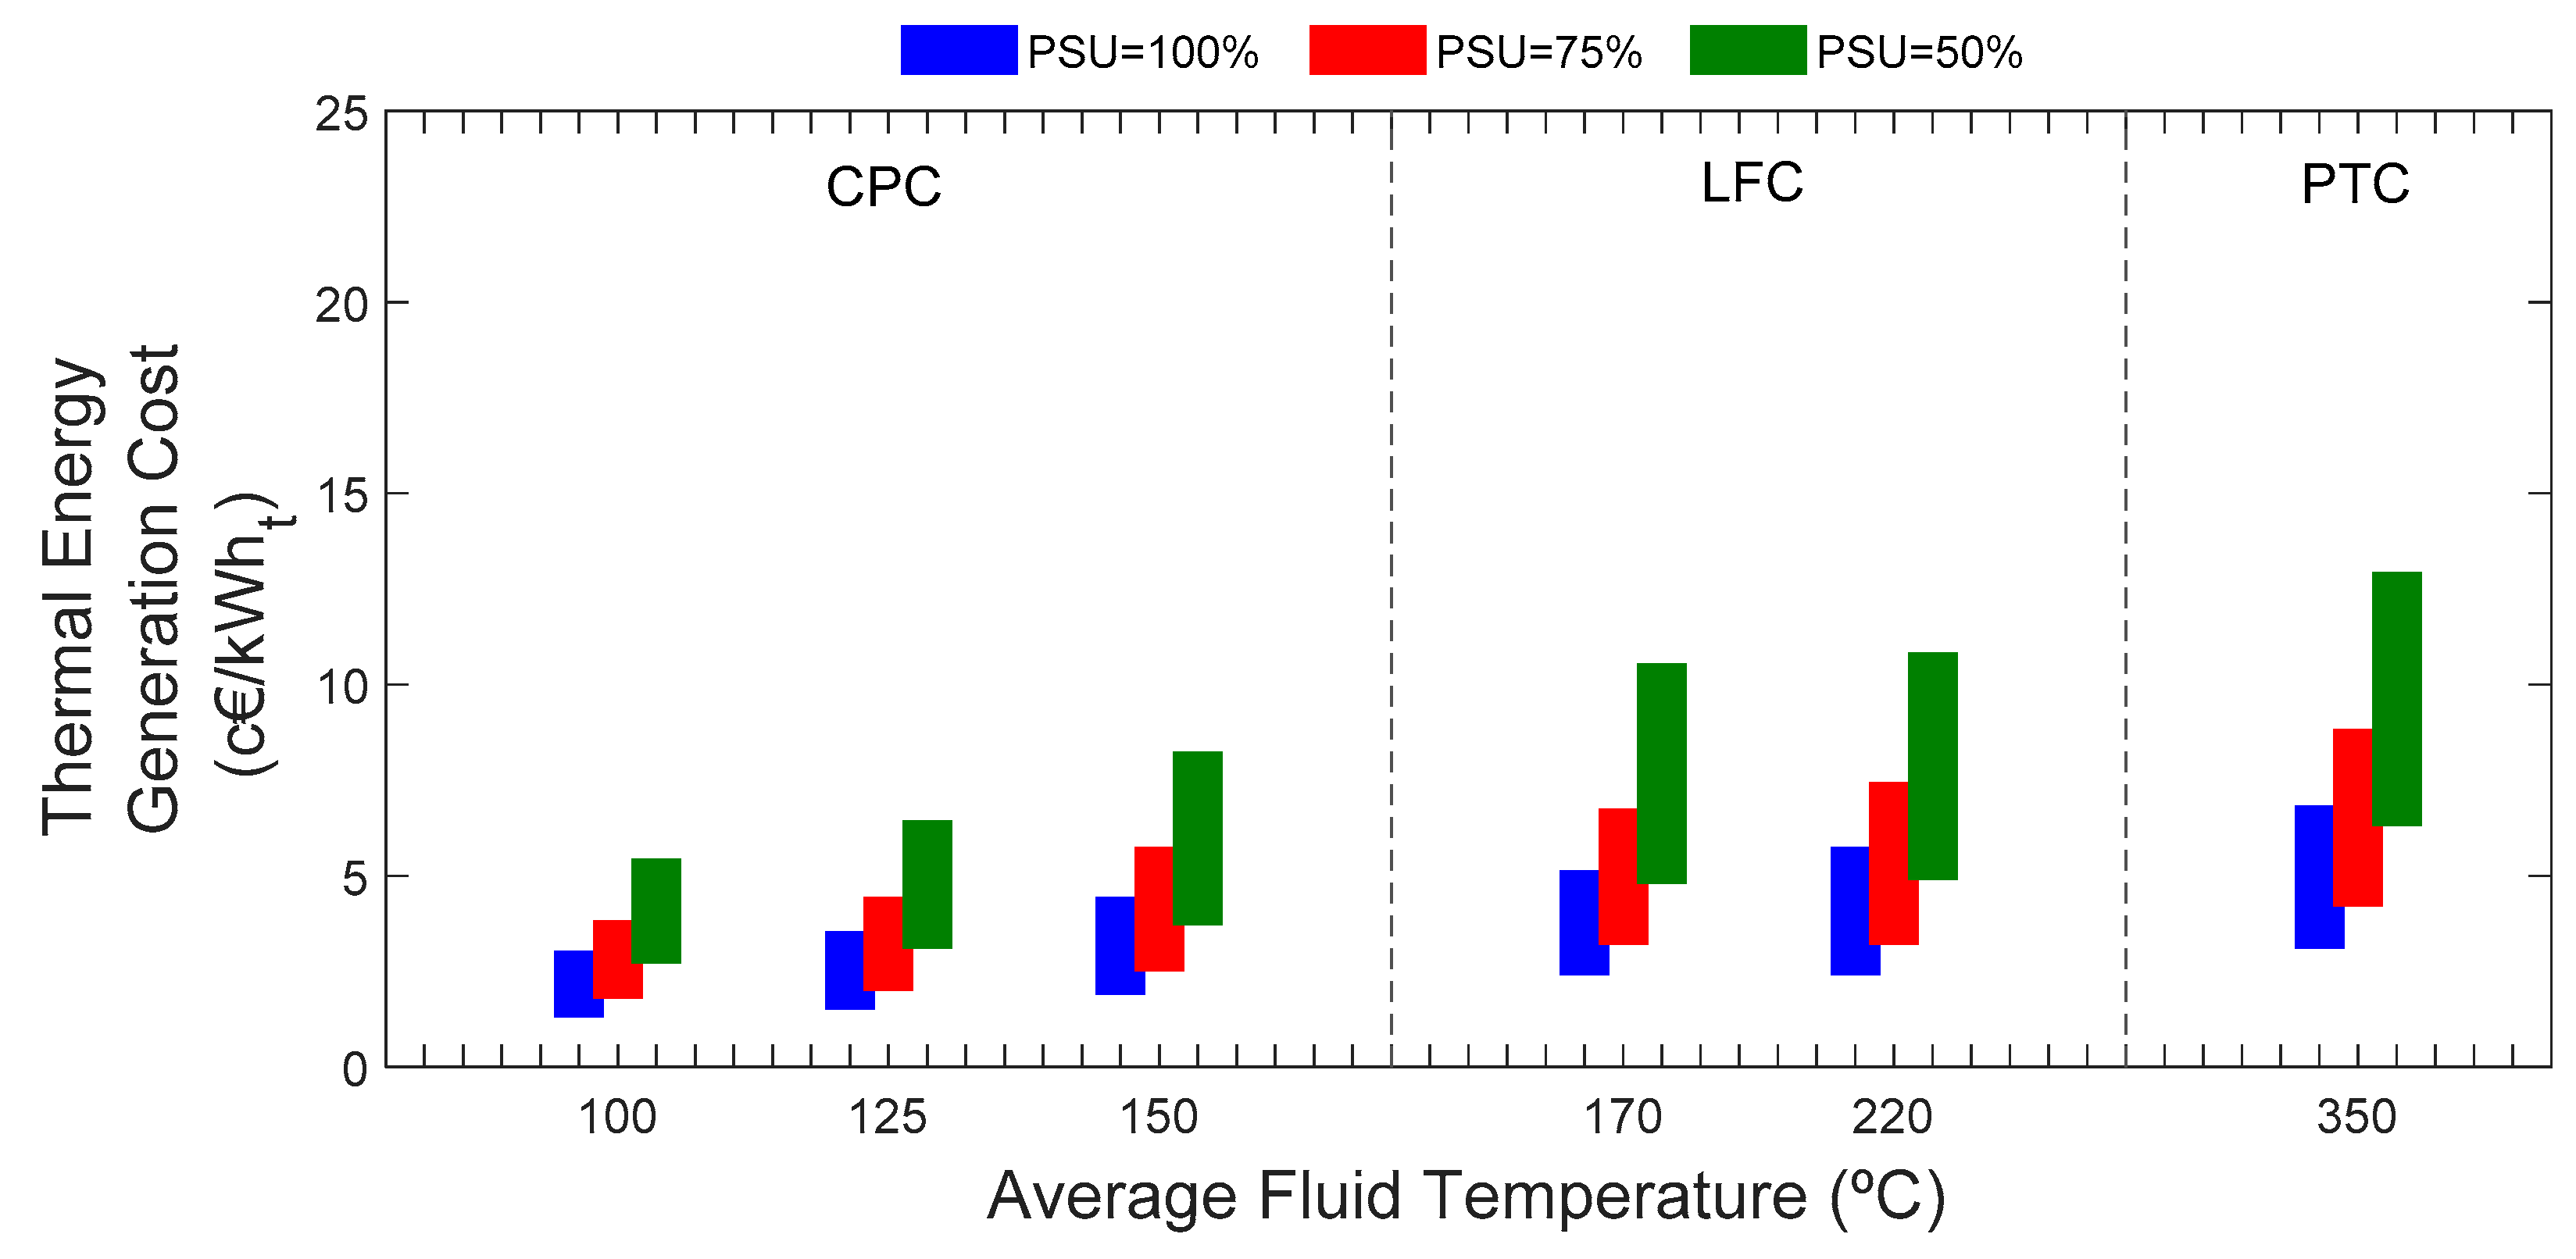
From an economic perspective, this paper summarizes the thermal energy generation cost for the different sites considered and CPC, LFC and PTC medium temperature solar concentration technologies. Results in this paper show that PSU is decisive in determining the true thermal energy generation cost. The other essential parameter is the solar field area due to produce economy of scale that reduces the investment costs. Comparing the conventional energy sources cost with medium temperature solar concentration technologies, the case of IA electricity group is particularly striking for which the thermal energy generation cost skyrocket. In all other cases it is necessary to carry out a specific analysis of each situation.
Finally, the analysis of CO2 emissions avoided when replacing conventional energy sources by medium temperature solar concentration technologies shows that kilograms of CO2 related to the use of electricity are higher than other options considered (natural gas, fuel oil and diesel oil). At the other extreme is natural gas that shows the lowest values. In the middle and showing very similar kilograms of CO2 are fuel oil and diesel oil.

Author Contributions

I.L. and E.P. raised the paper and drafted it, N.S. performed the calculations and M.S. evaluated solar technologies parameters. All authors reviewed the paper.

Funding

This research was funded by Plataforma Tecnológica Solar Concentra grant number ES-1308.

Conflicts of Interest

The funders had no role in the design of the study; in the collection, analyses or interpretation of data; in the writing of the manuscript, and in the decision to publish the results.

Nomenclature

Index
iFirst record [-].
fLast record [-].
Parameters
a1First order heat loss coefficient [W/K·m2].
a2Second order heat loss coefficient [W/K2·m2].
aperCCPOpening width of the collectors [m].
c1Lineal heat loss coefficient [W/K·m2].
c2Quadratic heat loss coefficient [W/K2·m2].
CIInvestment costs [€/m2].
ClifespanLifespan cost [€/m2].
COMOperation and maintenance costs [%CI].
CRReplacement costs [%CI].
ΔTDifference between the mean fluid temperature and the ambient temperature [°C].
ΔtTime interval [h].
Eincident_solarEnergy solar radiation [W].
EIPUseful energy for the industrial process [Wh].
EsfThermal energy generated by the solar field [Wh].
Esolar_field_outputEnergy at the output of the solar field [Wh].
FshadowShadow factor [°/1].
FsoilingSoiling factor [°/1].
IbcIncident direct normal radiation on the collector [W/m2].
IbnDirect normal radiation [W/m2].
IgIncident global radiation [W/m2].
ItHourly incident solar radiation on the collector [W/m2].
kmodIncidence angle modifier [°/1].
LecDistance between rows of collectors from center to center [m].
nUseful life [-].
ŋbBoiler efficiency [%].
ŋheHeat exchanger efficiency [%].
ŋSATEnergy storage system efficiency [%].
ŋsfInstantaneous efficiency [°/1].
ŋ0Optical efficiency [°/1].
ηpeak_opticalPeak optical efficiency [%].
ηthermalThermal efficiency [%].
rConsumer price index [%].
ScReflective surface opening area [m2].
TaAmbient temperature [°C].
τTransmittance [°/1].
tetatrackParabolic trough collector track angle [°].
VVolume [m3].
φIncidence angle [°].
ρReflectance [°/1].
αInterception factor [°/1].
γAbsorption [°/1].
Abbreviations
ATEAccumulated thermal energy [Wh].
CPCCompound Parabolic Collector [-].
CSPConcentrated Solar Power [-].
FPFlat Plate [-].
FPdDiesel oil conversion factor [kgCO2/L].
FPeElectricity conversion factor [kgCO2/kWh].
FPfFuel oil conversion factor [kgCO2/kg].
FPngNatural gas conversion factor [kgCO2/kWh].
GHGGreenhouse Gas emissions [kgCO2/m2].
GHGeGreenhouse Gas emissions avoided by the use of a solar system instead of electricity [kgCO2/m2·year].
GHGngGreenhouse Gas emissions avoided by the use of a solar system instead of natural gas [kgCO2/m2·year].
LFCLinear Fresnel Collector [-].
LHVLower heating value [kWh/m3; kWh/kg; kWh/L].
NYNumber of years [-].
PSUPercentage of solar use [%].
PTCParabolic Trough Collector [-].
STESolar Thermal Energy [-].

References

  1. BP Statistical Review of World Energy; British Petroleum Company: London, UK, 2017.
  2. International Energy Agency. Key World Energy Statistics 2017; International Energy Agency: Paris, France, 2017. [Google Scholar]
  3. European Commission. Heating and Cooling in the European Energy Transition. Challenges and Facts; European Commission: Brussels, Belgium, 2015. [Google Scholar]
  4. Serrano, M.I.R. Diseño y Análisis Térmico de un Sistema Receptor Volumétrico Para un Horno Solar de Alta Temperatura; CIEMAT: Madrid, Spain, 2013. [Google Scholar]
  5. International Renewable Energy Agency. Solar Heat for Industrial Processes; Technology Brief; International Renewable Energy Agency: Abu Dhabi, United Arab Emirates, 2015. [Google Scholar]
  6. Lillo, I.; Pérez, E.; Moreno, S.; Silva, M. Proces Heat Generation Potential from Solar Concentration Technologies in Latin America. Application for Argentina. Energies 2017, 10, 383. [Google Scholar] [CrossRef]
  7. Aidonis, A.; Drosou, V.; Mueller, T.; Staudacher, L.; Fernandez-Llebrez, F.; Oikonomou, A.; Spencer, S. PROCESOL II. Solar Thermal Plants in Industrial Processes. Design and Maintenance Guidelines; Center for Renewable Energy Sources: Pikermi, Greece, 2002. [Google Scholar]
  8. Krummenacher, P.; Muster, B. Methodologies and Software Tools for Integrating Solar Heat into Industrial Processes; International Energy Agency: Paris, France, 2015. [Google Scholar]
  9. Cottret, N.; Menichetti, E. Technical Study Report on SOLAR HEAT FOR INDUSTRIAL PROCESSES (SHIP) State of the Art in the Mediterranean Region; Observatoire Méditerranéen de l’Energie: Nanterre, France, 2010. [Google Scholar]
  10. European Solar Thermal Industry Federation. Solar Industrial Process Heat. State of the Art; European Solar Thermal Industry Federation: Brussels, Belgium, 2006. [Google Scholar]
  11. Larcher, M.; Rommel, M.; Bohren, A.; Frank, E.; Minder, S. Characterization of a parabolic trough collector for process heat applications. Energy Procedia 2014, 57, 2804–2811. [Google Scholar] [CrossRef]
  12. Hafner, B.; Stoppok, O.; Zahler, C.; Berger, M.; Hennecke, K.; Krüger, D. Development of an integrated solar-fossil powered steam generation system for industrial applications. Energy Procedia 2014, 48, 1164–1172. [Google Scholar] [CrossRef] [Green Version]
  13. Askari, I.B.; Ameri, M. The application of Linear Fresnel and Parabolic Trough solar field as thermal source to produce electricity and fresh water. Desalination 2017, 415, 90–103. [Google Scholar] [CrossRef]
  14. Sharma, V.; Nayak, J.K.; Kedare, S.B. Comparison of line focusing solar concentrator fields considering shading and blocking. Solar Energy 2015, 122, 924–939. [Google Scholar] [CrossRef]
  15. Rovira, A.; Barbero, R.; Montes, M.J.; Abbas, R.; Varela, F. Analysis and comparison of Integrated Solar Combined Cycles using parabolic troughs and linear Fresnel reflectors as concentrating systems. Appl. Energy 2016, 162, 990–1000. [Google Scholar] [CrossRef]
  16. Cocco, D.; Tola, V.; Petroselle, M. Application of concentrating solar technologies in the dairy sector for the combined production of heat and power. Energy Procedia 2016, 101, 1159–1166. [Google Scholar] [CrossRef]
  17. Fuller, R.J. Solar industrial process heating in Australia—Past and current status. Renew. Energy 2011, 36, 216–221. [Google Scholar] [CrossRef]
  18. Beath, A.C. Industrial energy usage in Australia and the potential for implementation of solar thermal heat and power. Energy 2012, 43, 261–272. [Google Scholar] [CrossRef]
  19. Lauterbach, C.; Schmitt, B.; Jordan, U.; Vajen, K. The potential of solar heat for industrial processes in Germany. Renew. Sustain. Energy Rev. 2012, 16, 5121–5130. [Google Scholar] [CrossRef]
  20. Calderoni, M.; Aprile, M.; Moretta, S.; Aidonis, A.; Motta, M. Solar thermal plants for industrial process heat in Tunisia: Economic feasibility analysis and ideas for a new policy. Energy Procedia 2012, 30, 1390–1400. [Google Scholar] [CrossRef]
  21. Ramos, C.; Ramirez, R.; Beltran, J. Potential assessment in Mexico for solar process heat applications in food and textile industries. Energy Procedia 2014, 49, 1879–1884. [Google Scholar] [CrossRef]
  22. INTEC, A. Database for Applications of Solar Heat Integration in Industrial Processes. 2016. Available online: http://ship-plants.info/ (accessed on 15 June 2018).
  23. Halabi, M.A.; Al-Qattan, A.; Al-Otaibi, A. Application of solar energy in the oil industry—Current status and future prospects. Renew. Sustain. Energy Rev. 2015, 43, 296–314. [Google Scholar] [CrossRef]
  24. Hassine, I.B.; Sehgelmeble, M.C.; Söll, R.; Pietruschka, D. Control Optimization through Simulations of Large Scale Solar Plants for Industrial Heat Applications. Energy Procedia 2015, 70, 595–604. [Google Scholar] [CrossRef] [Green Version]
  25. Quijera, J.A.; Alriols, M.G.; Labidi, J. Integration of a solar thermal system in canned fish factory. Appl. Therm. Eng. 2014, 70, 1062–1072. [Google Scholar] [CrossRef]
  26. Frey, P.; Fischer, S.; Drück, H.; Jakob, K. Monitoring Results of a Solar Process Heat System Installed at a Textile Company in Southern Germany. Energy Procedia 2015, 70, 615–620. [Google Scholar] [CrossRef]
  27. Sharma, A.K.; Sharma, C.; Mullick, S.C.; Kandpal, T.C. Potential of Solar Energy Utilization for Process Heating in Paper Industry in India: A Preliminary Assessment. Energy Procedia 2015, 79, 284–289. [Google Scholar] [CrossRef]
  28. Silva, R.; Cabrera, F.J.; Pérez-García, M. Process heat generation with parabolic trough collectors for a vegetables preservation industry in Southern Spain. Energy Procedia 2014, 48, 1210–1216. [Google Scholar] [CrossRef]
  29. Haagen, M.; Zahler, C.; Zimmermann, E.; Al-Najami, M.M. Solar process steam for pharmaceutical industry in Jordan. Energy Procedia 2015, 70, 621–625. [Google Scholar] [CrossRef]
  30. Bellos, E.; Tzivanidis, C. Assessment of linear solar concentrating technologies for Greek climate. Energy Convers. Manag. 2018, 171, 1502–1513. [Google Scholar] [CrossRef]
  31. Protermosolar. Available online: https://www.protermosolar.com (accessed on 15 June 2018).
  32. Vaillant. Available online: https://www.vaillant.es/ (accessed on 15 June 2018).
  33. Estec Solar. Available online: https://www.estecsolar.es/ (accessed on 15 June 2018).
  34. Ferroli. Available online: http://www.ferroli.com/es/products/solar-termico/ (accessed on 15 June 2018).
  35. Konstruir. Available online: http://konstruir.com/C.T.E/HE-4-Contribucion-solar-minima-de-agua-caliente-sanitaria/placas/konstruir.com%20-%20TECNOTOOLING%20150%20L.pdf (accessed on 15 June 2018).
  36. Schweiger, H.; Vannoni, C.; Pinedo Páscua, I.; Facci, E.; Baehrens, D.; Koch, M. Evaluación del Potencial de la Energía Solar Térmica en el Sector Industrial; Estudio Técnico PER; Institute for Energy Diversification and Saving: Madrid, Spain, 2011. [Google Scholar]
  37. Duffie, J.A.; Beckman, W.A. Solar Engineering of Thermal Processes; John Wiley & Sons: New York, NY, USA, 2013; ISBN 0-417-22371-9. [Google Scholar]
  38. Ruiz, V.; Silva, M.; Lillo, I. La Electricidad Solar Térmica, Tan Lejos, Tan Cerca; Junta de Andalucía y Gas Natural: Seville, Spain, 2009. [Google Scholar]
  39. Zhu, G.; Wendelin, T.; Wagner, M.J.; Kutscher, C. History, current state, and future of linear Fresnel concentrating solar collectors. Sol. Energy 2014, 103, 639–652. [Google Scholar] [CrossRef]
  40. Kutscher, C.; Mehos, M.; Turchi, C.; Glatzmaier, G. Line-Focus Solar Power Plant Cost Reduction Plan (Milestone Report); National Renewable Energy Lab. (NREL): Golden, CO, USA, 2010. [Google Scholar]
  41. Silva, R.; Berenguel, M.; Pérez, M.; Fernández-Garcia, A. Thermo-economic design optimization of parabolic trough solar plants for industrial process heat applications with memetic algorithms. Appl. Energy 2014, 113, 603–614. [Google Scholar] [CrossRef]
  42. Eurostat. Available online: http://ec.europa.eu/eurostat (accessed on 15 June 2018).
  43. Oil Bulletin. Available online: https://ec.europa.eu/energy/en/statistics/weekly-oil-bulletin (accessed on 15 June 2018).
  44. Ministerio de Fomento. Sección HE 4 Contribución Solar Mínima de Agua Caliente Sanitaria; Ministerio de Fomento: Madrid, Spain, 2009; pp. 1–29. [Google Scholar]
  45. Muster, B.; Hassine, I.B.; Helmke, A.; Heß, S.; Krummenacher, P.; Schmitt, B.; Schnitzer, H. Solar process heat for production and advanced applications. In Integration Guideline; IEA SHC Task 49. Anex IV; IEA: Paris, France, 2015. [Google Scholar]
  46. Ma, Z.; Glatzmaier, G.; Turchi, C.; Wagner, M. Thermal Energy Storage Performance Metrics and Use in Thermal Energy Storage Design; ASES World Renewable Energy Forum Denver: Denver, CO, USA, 2012; p. 6. [Google Scholar]
  47. Pintaldi, S.; Sethuvenkatraman, S.; White, S.; Rosengarten, G. Energetic evaluation of thermal energy storage options for high efficiency solar cooling systems. Appl. Energy 2017, 188, 160–177. [Google Scholar] [CrossRef]
  48. Petromercado. Available online: http://petromercado.com/ (accessed on 15 June 2018).
  49. IDAE. Available online: http://www.idae.es/ (accessed on 15 June 2018).
  50. Ministerio de Industria, Turismo y Comercio. Gobierno de España. Instituto para la Diversificación y Ahorro de la Energía. In Dieseño de Centrales de Calor Eficientes; Guía Técnica; Ministerio de Industria, Turismo y Comercio: Madrid, Spain, 2010. [Google Scholar]
  51. Ministerio de Agricultura y Pesca, Alimentación y Medio Ambiente. Gobierno de España. In Factores de Emisión. Registro de Huellas de Carbono, Compensación y Proyectos de Absorción de Dióxido de Carbono; Versión 10; Ministerio de Agricultura y Pesca, Alimentación y Medio Ambiente: Madrid, Spain, 2018. [Google Scholar]
Figure 1. CPC efficiency curves.
Energies 11 02950 g001aEnergies 11 02950 g001b
Figure 2. LFC efficiency curve, Ta = 20 °C, Ibc = 1000 W/m2.
Energies 11 02950 g002
Figure 3. Thermal energy production hourly curves.
Energies 11 02950 g003
Figure 4. Natural gas price evolution and estimation from 2010 to 2038, Group I1.
Energies 11 02950 g004
Figure 5. Natural gas price evolution and estimation from 2010 to 2038, Group I6.
Energies 11 02950 g005
Figure 6. Spanish solar radiation climatic zones.Source: Código Técnico de la Edificación [44].
Energies 11 02950 g006
Figure 7. Configuration of the analyzed plant.
Energies 11 02950 g007
Figure 8. Selected sites. Source: Google Earth.
Energies 11 02950 g008
Figure 9. Thermal energy generation cost—Small size solar field area.
Energies 11 02950 g009
Figure 10. Thermal energy generation cost—Large size solar field area.
Energies 11 02950 g010
Table 1. Industrial processes temperature range [4,5].
IndustryProcessTemperature Range (°C)
DairySterilization100–120
Drying120–180
Canned foodSterilization110–120
Agricultural productsDrying80–200
TextileDrying100–130
Degreasing160–180
PaperBleach130–150
ChemistrySoaps200–260
Synthetic rubber150–200
Process heat120–180
Petroleum100–150
Wood productsPulp preparation120–170
DesalinizationHeat transfer fluid100–250
MiningDrying100–400
Concentrate smelting
Heating solutions
Washing
PlasticsPreparation120–140
Distillation140–150
Separation200–220
Extension140–160
Drying180–200
Mixing120–140
Thermal treatmentMedium tempering350–450
RefrigerationDouble effect solar chiller120–190
Table 2. CPC efficiency equation parameters.
Technology η0 a 1   a 2  
CPC-1 [32]0.6420.8850.001
CPC-2 [33]0.6410.8500.010
CPC-3 [34]0.6050.8500.010
Table 3. Incident angle modifier [35].
θ (°)01020304050607090
kθb(θT)1.001.051.081.201.361.531.812.030.00
kθb(θL)1.001.000.990.990.980.960.920.840.00
Table 4. CPC technology costs.
Solar Field Area Size-Solar Field Area [m2]CI [€/m2]COM [%CI]CR [%CI]
Small 503252.5%10%
Large 20002251.5%10%
Table 5. LFC technology costs.
Solar Field Area Size-Solar Field Area [m2]CI [€/m2]COM [%CI]CR [%CI]
Small 1004255%10%
Large 15,0002604%10%
Table 6. PTC technology costs.
-Solar Field Area SizeSolar Field Area [m2]CI [€/m2]COM [%CI]CR [%CI]
Small 1005605.5%10%
Large 15,0003304.5%10%
Table 7. Classification of industrial consumers, natural gas. Source: Eurostat.
GroupAnnual Consumption
I1 GroupLower than 1000 GJ
I2 GroupBetween 1000 GJ and 10,000 GJ
I3 GroupBetween 10,000 GJ and 100,000 GJ
I4 GroupBetween 100,000 GJ and 1,000,000 GJ
I5 GroupBetween 1,000,000 GJ and 4,000,000 GJ
I6 GroupHigher than 4000,000 GJ
Table 8. Natural gas price forecast, 2018–2038.
Industrial ConsumerScenario Price (€/kWht)
20182038
I1 GroupHigh0.05760.1725
Average0.05480.1122
Low0.05330.0821
I2 GroupHigh0.05040.1576
Average0.04770.1013
Low0.04640.0732
I3 GroupHigh0.04010.1050
Average0.03850.0709
Low0.03770.0539
I4 GroupHigh0.03640.0910
Average0.03500.0623
Low0.03430.0480
I5 GroupHigh0.03520.1032
Average0.03350.0675
Low0.03270.0497
I6 GroupHigh0.03430.0992
Average0.03270.0651
Low0.03190.0481
Table 9. Classification of industrial consumers, electricity. Source: Eurostat.
GroupAnnual Consumption
IA GroupLower than 20 MWh
IB GroupBetween 20 MWh and 500 MWh
IC GroupBetween 500 MWh and 2000 MWh
ID GroupBetween 2000 MWh and 20,000 MWh
IE GroupBetween 20,000 MWh and 70,000 MWh
IF GroupBetween 70,000 MWh and 150,000 MWh
IG GroupHigher than 150,000 MWh
Table 10. Electricity price forecast, 2018–2038.
Industrial ConsumerScenario Price (€/kWht)
20182038
IA GroupHigh0.30340.9792
Average 0.28650.6244
Low0.27810.4470
IB GroupHigh0.16140.3877
Average 0.15580.2689
Low0.15290.2095
IC GroupHigh0.12150.2561
Average 0.11810.1854
Low0.11640.1501
ID GroupHigh0.10380.2121
Average 0.10110.1552
Low0.09970.1268
IE GroupHigh0.08010.1418
Average 0.07850.1094
Low0.07780.0932
IF GroupHigh0.07600.1792
Average 0.07340.1250
Low0.07210.0979
IG GroupHigh0.06330.1702
Average 0.06070.1141
Low0.05930.0861
Table 11. Fuel oil price forecast, 2018–2038.
Petroleum Product-ScenarioPrice (€/kWht)
20182038
Fuel oilHigh0.0370.132
Average0.084
Low0.060
Table 12. Diesel oil price forecast, 2018–2038.
Petroleum Product-Scenario Price (€/kWht)
20182038
Fuel oilHigh0.0770.215
Average0.146
Low0.111
Table 13. Temperature ranges and characteristics of each solar technology.
TechnologyTemperature RangeOther Characteristics
Vacuum tube collector100–150 °CParabolic Concentrator
Fresnel150–300 °CSingle receiver
Direct steam generation
Parabolic trough100–400 °CDirect steam generation
Thermal oil as heat transfer fluid
Table 14. Selected sites geographical data.
SiteClimatic ZoneLatitude (°)Longitude (°)Height (m)
La CoruñaI43.367−8.41767
Vitoria42.850−2.670550
BarcelonaII41.2832.0676
Valladolid41.650−4.767739
SalamancaIII40.970−5.670823
Teruel40.260−1.105954
JaénIV37.7703.800697
Valencia39.480−0.38013
CáceresV39.467−6.333405
Sevilla37.410−6.0107
Table 15. Global Horizontal Radiation.
SiteMonthly Global Horizontal Radiation (kWh/m2)Annual Accumulated (kWh/m2)
123456789101112
La Coruña43681091381681851911721308348381373
Vitoria43621051271631781871571258347381315
Barcelona648313116219420221718413910467561603
Valladolid51801281581822232292001469757441595
Salamanca608113216319922223920515510265531676
Teruel678413316420122024921115811676591738
Jaén848314318021224026122916612193761888
Valencia679113516718820320917913711072601618
Cáceres689114217320522524021115411074541747
Sevilla859515118222224025722717012795761927
Table 16. Direct Normal Radiation.
SiteMonthly Direct Normal Radiation (kWh/m2)Annual Accumulated (kWh/m2)
123456789101112
La Coruña61801011151371611731571329161511320
Vitoria4863931091411541531441279448461220
Barcelona10410814115718017421316614612494881695
Valladolid7810814615716723924722116611575581777
Salamanca10311115617818523427023419112091831956
Teruel1011111521651992292922371971561191042062
Jaén1421241561872112653102801991471621322315
Valencia9712614415317017819515213913494921674
Cáceres101132170183200225261239185135110722013
Sevilla1461221741922242502982761961581591342329
Table 17. Ambient temperature.
SiteAverage Monthly Ambient Temperature (°C)
123456789101112
La Coruña10.810.912.312.514.917.418.919.318.116.212.811.0
Vitoria5.25.98.610.114.017.919.319.416.313.38.25.3
Barcelona9.09.912.214.017.521.524.224.521.318.112.69.5
Valladolid3.85.38.710.514.820.222.021.617.612.97.04.2
Salamanca3.55.08.310.014.819.721.220.816.712.86.74.1
Teruel4.05.69.111.115.921.924.623.819.013.77.44.3
Jaén5.98.511.613.518.223.926.325.620.816.29.76.8
Valencia9.911.113.815.519.123.326.026.122.619.213.610.9
Cáceres7.89.612.714.018.924.726.926.922.717.411.28.3
Sevilla11.313.216.117.822.126.528.828.724.820.914.912.0
Table 18. Thermal energy available per solar field area and average efficiency for each site and thermal level, CPC technology.
SiteThermal Energy Available in the Storage System by Solar Field Area [kWht/m2]Average Efficiency
100 °C125 °C150 °C100 °C125 °C150 °C
La Coruña6725574240.430.360.28
Vitoria6135063820.420.340.26
Barcelona8637315780.460.390.31
Valladolid8166915460.450.380.30
Salamanca8957626090.460.390.31
Teruel9237886310.460.390.31
Jaén10589167510.480.420.34
Valencia8737435920.470.400.32
Cáceres9378026450.470.400.32
Sevilla10959517830.490.420.35
Table 19. Thermal energy available per solar field area and average efficiency for each site and thermal level, LFC technology.
SiteThermal Energy Available in the Storage System by Solar Field Area [kWht/m2]Average Efficiency
170 °C220 °C170 °C220 °C
La Coruña4784650.360.35
Vitoria4374260.360.35
Barcelona6236070.370.36
Valladolid6766600.380.37
Salamanca7447280.380.37
Teruel7977800.390.38
Jaén8968770.390.38
Valencia6226060.370.36
Cáceres7797620.390.38
Sevilla9138930.390.38
Table 20. Thermal energy available per solar field area and average efficiency for each site, PTC technology.
SiteThermal Energy Available in the Storage System by Solar Field Area [kWht/m2]Average Efficiency
350 °C
La Coruña4960.38
Vitoria4660.38
Barcelona6320.37
Valladolid6960.39
Salamanca7570.39
Teruel7930.38
Jaén8690.37
Valencia6280.38
Cáceres7940.39
Sevilla9180.39
Table 21. Thermal energy unit cost, CPC technology.
SiteAnnual Global Horizontal Radiation (kWh/m2)Average Ambient Temperature (°C)PSU (%)Thermal Energy Unit Cost (c€/kWht)
Solar Field Area (m2)
502000
Average Fluid Temperature (°C)
100125150100125150
La Coruña1372.514.61003.54.25.52.22.63.4
754.75.67.42.93.54.6
507.08.411.14.35.26.9
Vitoria1315.512.01003.84.66.22.42.93.8
755.16.28.23.23.85.1
507.79.312.34.85.87.6
Barcelona1600.516.21002.73.24.11.72.02.5
753.64.35.42.32.73.4
505.46.48.13.44.05.1
Valladolid1594.012.41002.93.44.31.82.12.7
753.84.55.72.42.83.6
505.86.88.63.64.25.3
Salamanca1674.212.01002.63.13.91.61.92.4
753.54.15.12.22.63.2
505.36.27.73.33.84.8
Teruel1738.013.41002.53.03.71.61.92.3
753.44.05.02.12.53.1
505.16.07.43.23.74.6
Jaén1897.615.61002.22.63.11.41.61.9
753.03.44.21.82.12.6
504.45.16.32.83.23.9
Valencia1616.617.61002.73.24.01.72.02.5
753.64.25.32.22.63.3
505.46.37.93.33.94.9
Cáceres1742.216.81002.52.93.61.61.82.3
753.33.94.92.12.43.0
505.05.97.33.13.64.5
Sevilla1926.119.81002.12.53.01.31.51.9
752.93.34.01.82.02.5
504.34.96.02.73.13.7
Table 22. Thermal energy unit cost, LFC technology.
SiteAnnual Direct Normal Radiation (kWh/m2)Average Ambient Temperature (°C)PSU (%)Thermal Energy Unit Cost (c€/kWht)
Solar Field Area (m2)
10015,000
Average Fluid Temperature (°C)
170220170220
La Coruña1320.114.61008.18.34.54.7
7510.811.16.16.2
5016.216.69.19.3
Vitoria1219.712.01008.89.15.05.1
7511.812.16.66.8
5017.718.19.910.2
Barcelona1694.116.21006.26.43.53.6
758.38.54.64.8
5012.412.77.07.2
Valladolid1777.917.61005.75.93.23.3
757.67.84.34.4
5011.411.76.46.6
Salamanca1955.212.01005.25.32.93.0
756.97.13.94.0
5010.410.65.86.0
Teruel2061.016.81004.85.02.72.8
756.56.63.63.7
509.79.95.45.6
Jaén2314.615.61004.34.42.42.5
755.75.93.23.3
508.68.84.84.9
Valencia1674.512.41006.26.43.53.6
758.38.54.74.8
5012.412.87.07.2
Cáceres2012.413.41005.05.12.82.8
756.66.83.73.8
509.910.15.65.7
Sevilla2328.319.81004.24.32.42.4
755.65.83.23.2
508.58.74.84.9
Table 23. Thermal energy unit cost, PTC technology.
SiteAnnual Direct Normal Radiation (kWh/m2)Average Ambient Temperature (°C)PSU (%)Thermal Energy Unit Cost (c€/kWht)
Solar Field Area (m2)
10015,000
Average Fluid Temperature (°C)
350
La Coruña1320.114.610010.75.8
7514.27.7
5021.411.6
Vitoria1219.712.010011.46.2
7515.28.2
5022.712.3
Barcelona1694.116.21008.44.6
7511.26.1
5016.89.1
Valladolid1777.917.61007.64.1
7510.25.5
5015.28.3
Salamanca1955.212.01007.03.8
759.35.1
5014.07.6
Teruel2061.016.81006.73.6
758.94.8
5013.47.3
Jaén2314.615.61006.13.3
758.14.4
5012.26.6
Valencia1674.512.41008.44.6
7511.36.1
5016.99.2
Cáceres2012.413.41006.73.6
758.94.8
5013.37.2
Sevilla2328.319.81005.83.1
757.74.2
5011.56.3
Table 24. Thermal energy unit costs, conventional energy sources (c€/kWht).
Conventional Energy SourceScenario
AverageLowHigh
Natural gasI1 Group6.15.08.4
I6 Group3.62.94.8
ElectricityIA Group33.326.746.5
IG Group6.45.48.5
Fuel oil4.43.66.1
Diesel oil8.16.910.6
Table 25. Internal Rate of Return.
TechnologySolar Field Surface (m2)Average Fluid Temperature (°C)Conventional Energy Source
Natural Gas I1 GroupNatural Gas I6 GroupElectricity IA GroupElectricity IG GroupFuel oilDiesel oil
CPC501001467816920
1251136512616
1507-497211
20001002313>100241631
125191094201325
1501367114819
LFC1001709-6610415
2209-6410314
15,0001702010>100211328
220199>100211227
PTC1003504-505-9
15,0001458516821
Table 26. Conventional energy sources conversion factors.
Conversion Factor
ElectricityFPe0.392 kgCO2/kWh
Natural GasFPng0.203 kgCO2/kWh
Fuel oilFPf3.127 kgCO2/kg
Diesel oilFPd2.868 kgCO2/L
Table 27. GHG emissions annually avoided by the use of solar technologies instead of electricity.
SiteGHG Emissions Avoided [kgCO2/(m2·year)]
CPCLFCPTC
Thermal Level (°C)Thermal Level (°C)Thermal Level (°C)
100125150170220350
La Coruña263218166187182194
Vitoria240198150171167183
Barcelona338287227244238248
Valladolid320271214265259273
Salamanca351299239292285297
Teruel362309247312306311
Jaén415359294351344341
Valencia342291232244238246
Cáceres367314253305299311
Sevilla429373307358350360
Table 28. GHG emissions annually avoided by the use of solar technologies instead of natural gas.
SiteGHG Emissions Avoided [kgCO2/(m2·year)]
CPCLFCPTC
Thermal Level (°C)Thermal Level (°C)Thermal Level (°C)
100125150170220350
La Coruña136113869794101
Vitoria12410378898695
Barcelona175148117126123128
Valladolid166140111137134141
Salamanca182155124151148154
Teruel187160128162158161
Jaén215186152182178176
Valencia177151120126123127
Cáceres190163131158155161
Sevilla222193159185181186
Table 29. GHG emissions annually avoided by the use of solar technologies instead of fuel oil.
SiteGHG Emissions Avoided [kgCO2/(m2·year)]
CPCLFCPTC
Thermal Level (°C)Thermal Level (°C)Thermal Level (°C)
100125150170220350
La Coruña198164125141137146
Vitoria180149112128125137
Barcelona254215170183178186
Valladolid240203161199194205
Salamanca263224179219214223
Teruel271232186234229233
Jaén311269221263258255
Valencia257218174183178185
Cáceres275236190229224233
Sevilla322280230268263270
Table 30. GHG emissions annually avoided by the use of solar technologies instead of diesel oil.
SiteGHG Emissions Avoided [kgCO2/(m2·year)]
CPCLFCPTC
Thermal Level (°C)Thermal Level (°C)Thermal Level (°C)
100125150170220350
La Coruña195162123139135144
Vitoria178147111127124135
Barcelona251212168181176184
Valladolid237201159196192202
Salamanca260221177216212220
Teruel268229183232227230
Jaén307266218260255253
Valencia254216172181176183
Cáceres272233187226221231
Sevilla318276228265260267

