1. Introduction
The problem of reactive power compensation has always played an important role in the overall complex of issues of increasing the efficiency of transmission, distribution and consumption of electric energy. The correct solution of such tasks largely predetermines the economy of monetary and material resources, as well as the improvement of the quality of the electricity supply [
1].
In addition to the delivery of electricity, the task of the power lines is also the connection of power plants and load centers in order to minimize the total generated power and the cost of fuel. Without careful analysis and calculation, it is impossible to define the optimal balance between the production and transmission of electricity in each particular case. The costs related to the maintenance of the power lines and losses in them, as well as the difficulties associated with the construction of new transmission lines, often limit the available opportunities for energy transmission.
There are many examples of when the joint use of the available power reserves was limited by the bandwidth of transmission lines and there is no steady trend of improving this situation. On the other hand, when the transmitted capacity increases, the grid becomes much more difficult to service and may become less reliable and vulnerable to major accidents. This can lead to large uncontrolled overflows of power exceeding the balance of reactive power in various parts of the power system, large losses of electrical power and, consequently, not all the potential of the power system can be used. The solution of this problem can be the use of techniques for optimizing the energy sector as well as the use of modern technologies for controlled transmission lines (Flexible AC Transmission Systems—FACTS), where it is necessary. Optimal Power Flow (OPF) [
2] is one of the main tasks for normal and optimum function of modern power systems. OPF’s main goal is to describe and define the best parameters for power system operation. OPF is able to provide the minimization of power losses in case of control the reactive power using FACTS devices to meet the grid operating voltage and thermal limitations. The definition OPF is using for large scale of network optimization tasks.
The OPF task is presented like a minimization of the general target function F(x, u) ≤ 0, meets limitations where g(x, u) and h(x, u) ≤ 0, where g(x, u) shows equality constraints (equations that define power flows), h(x, u) u represents limitations in the form of inequality. It also contains fixed parameters such as the angular value for the reference angle; the active and reactive power values of the non-directing generators and the loads at given voltages, the line parameters, and so on. The vector u consists of controlled variables such as values of active and reactive power generators, transformer branch settings, etc. [
3]. In the case when the main goal is the reducing power losses, the usual control variables are:
Out of these, a great deal of control can be achieved by using generator bus voltages and transformer tap ratios as a control variable. Phase-shifter angles are normally used to alleviate line overloads. Since loss minimization indirectly takes care of line flows via the objective, line overloads are expected to be at a minimum. Active power generations are usually not employed as control variables in order to minimize changes to the economic dispatch solution for an integrated implementation. For the loss minimization definition, we used voltages of generator and transformer tap ratios as a control variable. The coefficients of the transformer tap were indicated as continuous variables during optimization, after which they were corrected to the nearest physical tap location and reconfirmed that the valves had adjusted values.
A wide variety of optimization algorithms with many techniques are being developed because different types of problems require specific approaches. It is important to recognize the optimization task characteristics to determine the appropriate method of solution. In each class of tasks, there are different search methods for extremes that differ in computational capacity and convergence requirements. Optimization tasks are defined consequently to the mathematical characteristics of the target function, the restrictions and the control variables.
Particle Swarm Optimization (PSO) [
4] is a numerical optimization method, for the use of which we do not need to know the exact gradient of the optimized function. The method simulates a multi-agent system, where particle agents move to optimal solutions while exchanging information with neighbors. In the swarm method, each potential solution is represented by a point in the search space called the particle [
5]. The algorithm of the particle swarm method represents an iterative process, which continues until the stopping criterion is satisfied. Such criteria, for example, can be the achievement of the limiting number of iterations, the achievement of a certain value of the objective function, the convergence of the algorithm. The PSO service is used to solve many tasks in the field of power engineering for very simple implementation and very good convergence. In our article, we use the PSO algorithm to search the optimal placement of the STATCOM to minimize active power losses in a power transmission system.
FACTS equipment opens up new capabilities for power flow management and increasing the transmission capability of current lines [
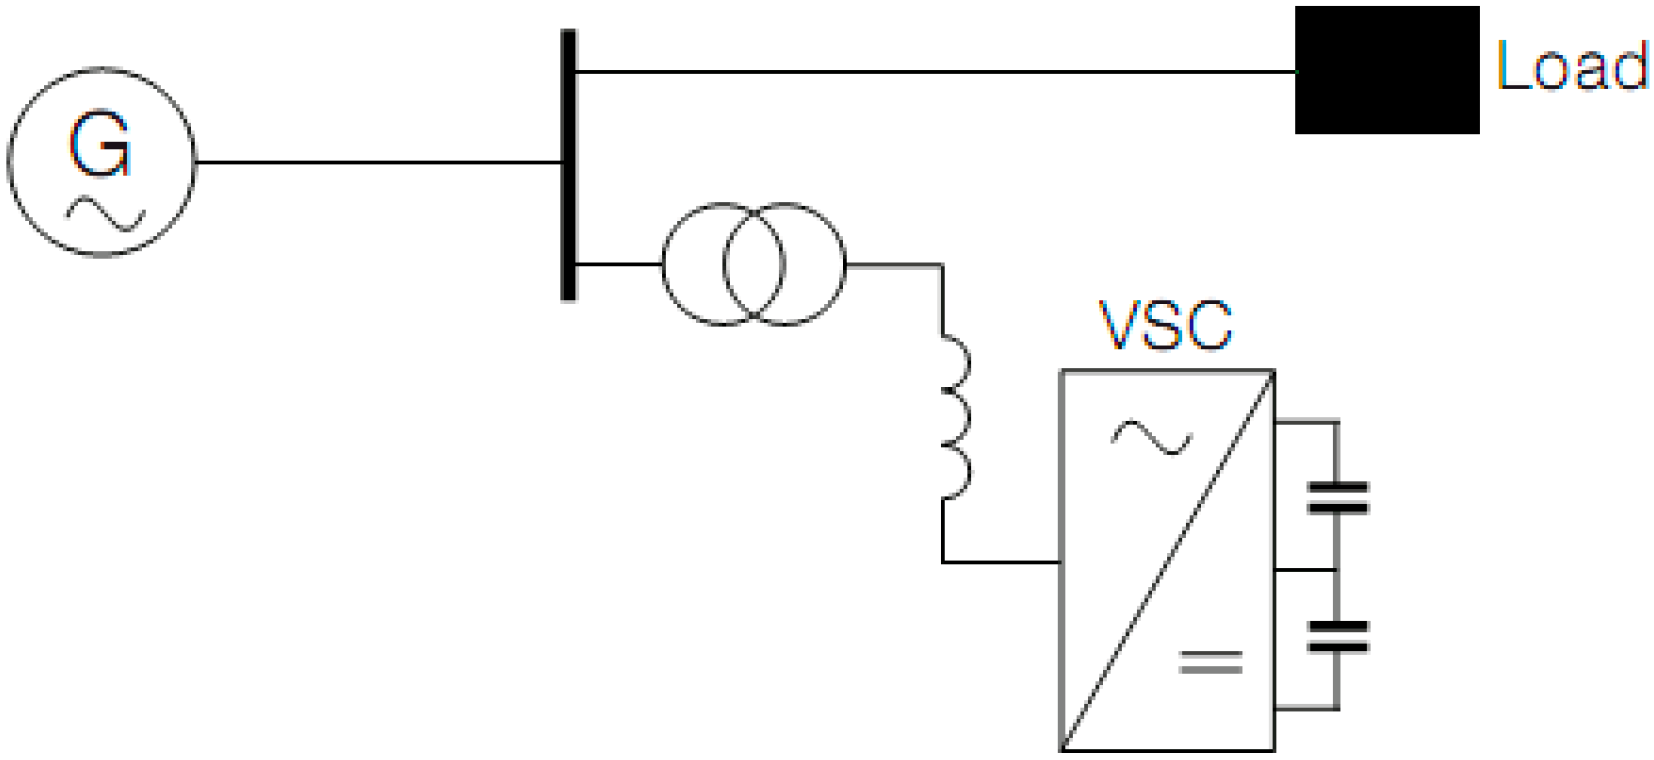
6]. FACTS technology not just high-performance controller, but rather a group of regulators that can be applied either individually or in coordination with others in order to control one or more interconnected system parameters. A properly selected FACTS devices can surmount specific restrictions resulting from the design of the transmission line or corridor. To provide reactive power compensation simulation, we use a Static Synchronous Compensator (STATCOM) model, shown in
Figure 1 [
7].
Static Synchronous Compensator or STATCOM is a control device used in alternating transmission systems to control reactive power and stabilize voltage. Compared to a similar Static VAR compensation (SVC) control device, it has a faster response time (<10 ms) and better operational characteristics. For this reason, it can work efficiently in real time.
The STATCOM device may supply or consume reactive power to the network. The amount of power delivered or absorbed depends on the amplitude of the voltage supplied by the inverter and the voltage amplitude of the power system. If the voltage amplitude from invertor is bigger than the voltage of the system, this device delivers reactive power to the power system. If the voltage amplitude of the system is greater than the inverter voltage, reactive power is taken from the system. STATCOM is often the solution for unbalanced networks, which helps to regulate voltage in nodes [
6].
The STATCOM configuration consists of a three-phase Voltage Source Converter (VSC) powered by a DC source, usually realized by a capacitor. Filters are not needed due to low harmonic values. An important part of this system is the VSC, which consists of reliable high-speed Insulated Gate Bipolar Transistor (IGBT) switching components and capacitors. The control is realized by pulse width modulation (PWM). The advantage of this device is the ability to control the frequency, amplitude and phase of the output voltage. In practice, it is possible to use a combination of SVC and STATCOM, where SVC delivers reactive power with low dynamics character, and STATCOM gradually adjusts power to the desired value. In the different sources of literature, there are many publications of optimal allocation of STATCOM with different objective function [
8,
9].
STATCOM provides improvement of power quality, which enables the operation of load with a low power factor without the violation of the power quality requirements. STATCOM also increases voltage stability in the grid. This increases system availability as well as the line’s power transmission capability. Power losses that are caused by reactive power in a transmission lines can be minimized and power factor in the grid can be maximized with the dynamic balancing of the reactive power [
8].
The main goal of this research is an optimal placement of STATCOM using modern optimization techniques to ensure the reliability and stability, providing power loss minimization in the energy system.
Section 2 describes process for finding the solution for optimization problem, where we propose novel method for the Power losses reduction. We provided two case studies using a 14 nodes network and a 30 nodes network to perform power network analysis and use the proposed method for power losses minimization.
Section 3 shows the results obtained during our simulation, presented as graphs and tables, where voltage and power regulation are shown. The article presents a novel method of using a particle swarm optimization algorithm in combination with modern FACTS devices, in order to minimize power losses and provide reactive power compensation.
2. Problem Formulation
As seen in the previous section FACTS devices are able to influence the network parameters (line impedance, the voltage in the nodes, etc.). These properties are used for different purposes (e.g., management of power flow in the ES, increasing the voltage stability of the system, damping oscillation). One option is to use them to reduce the total active losses in the ES. It is important to remark that it is not used just for reducing losses—it is their additional function. In practice it is not typical to encounter cases where the FACTS devices are used only to reduce the active losses. This is almost always achieved in conjunction with another factor (e.g., increasing the voltage stability, increased load ability of the ES).
To solve the optimization problem, in the beginning it is necessary to indicate the conditions on which the procedure of further solutions will depend. In regards of the determination of what should be fixed and what is already predetermined and therefore unchangeable [
10]. At the beginning of the optimization process, the following tasks can be formulated:
The intended type of FACTS devices, their number and location in the ES. Searching of variables that are specifying those (optimal) parameters.
The intended type of FACTS devices and their number. Searching by variables the point of connection to ES and the parameters of FACTS devices.
Only the type of FACTS devices is intended. Their number, point of connection to ES and parameters that should be identified.
There is nothing intended, it is necessary to determine the type, number, location and parameters of the FACTS devices.
Any combination of variables is intended that define the type, number, location and parameters of the FACTS devices and unknowns should be determined.
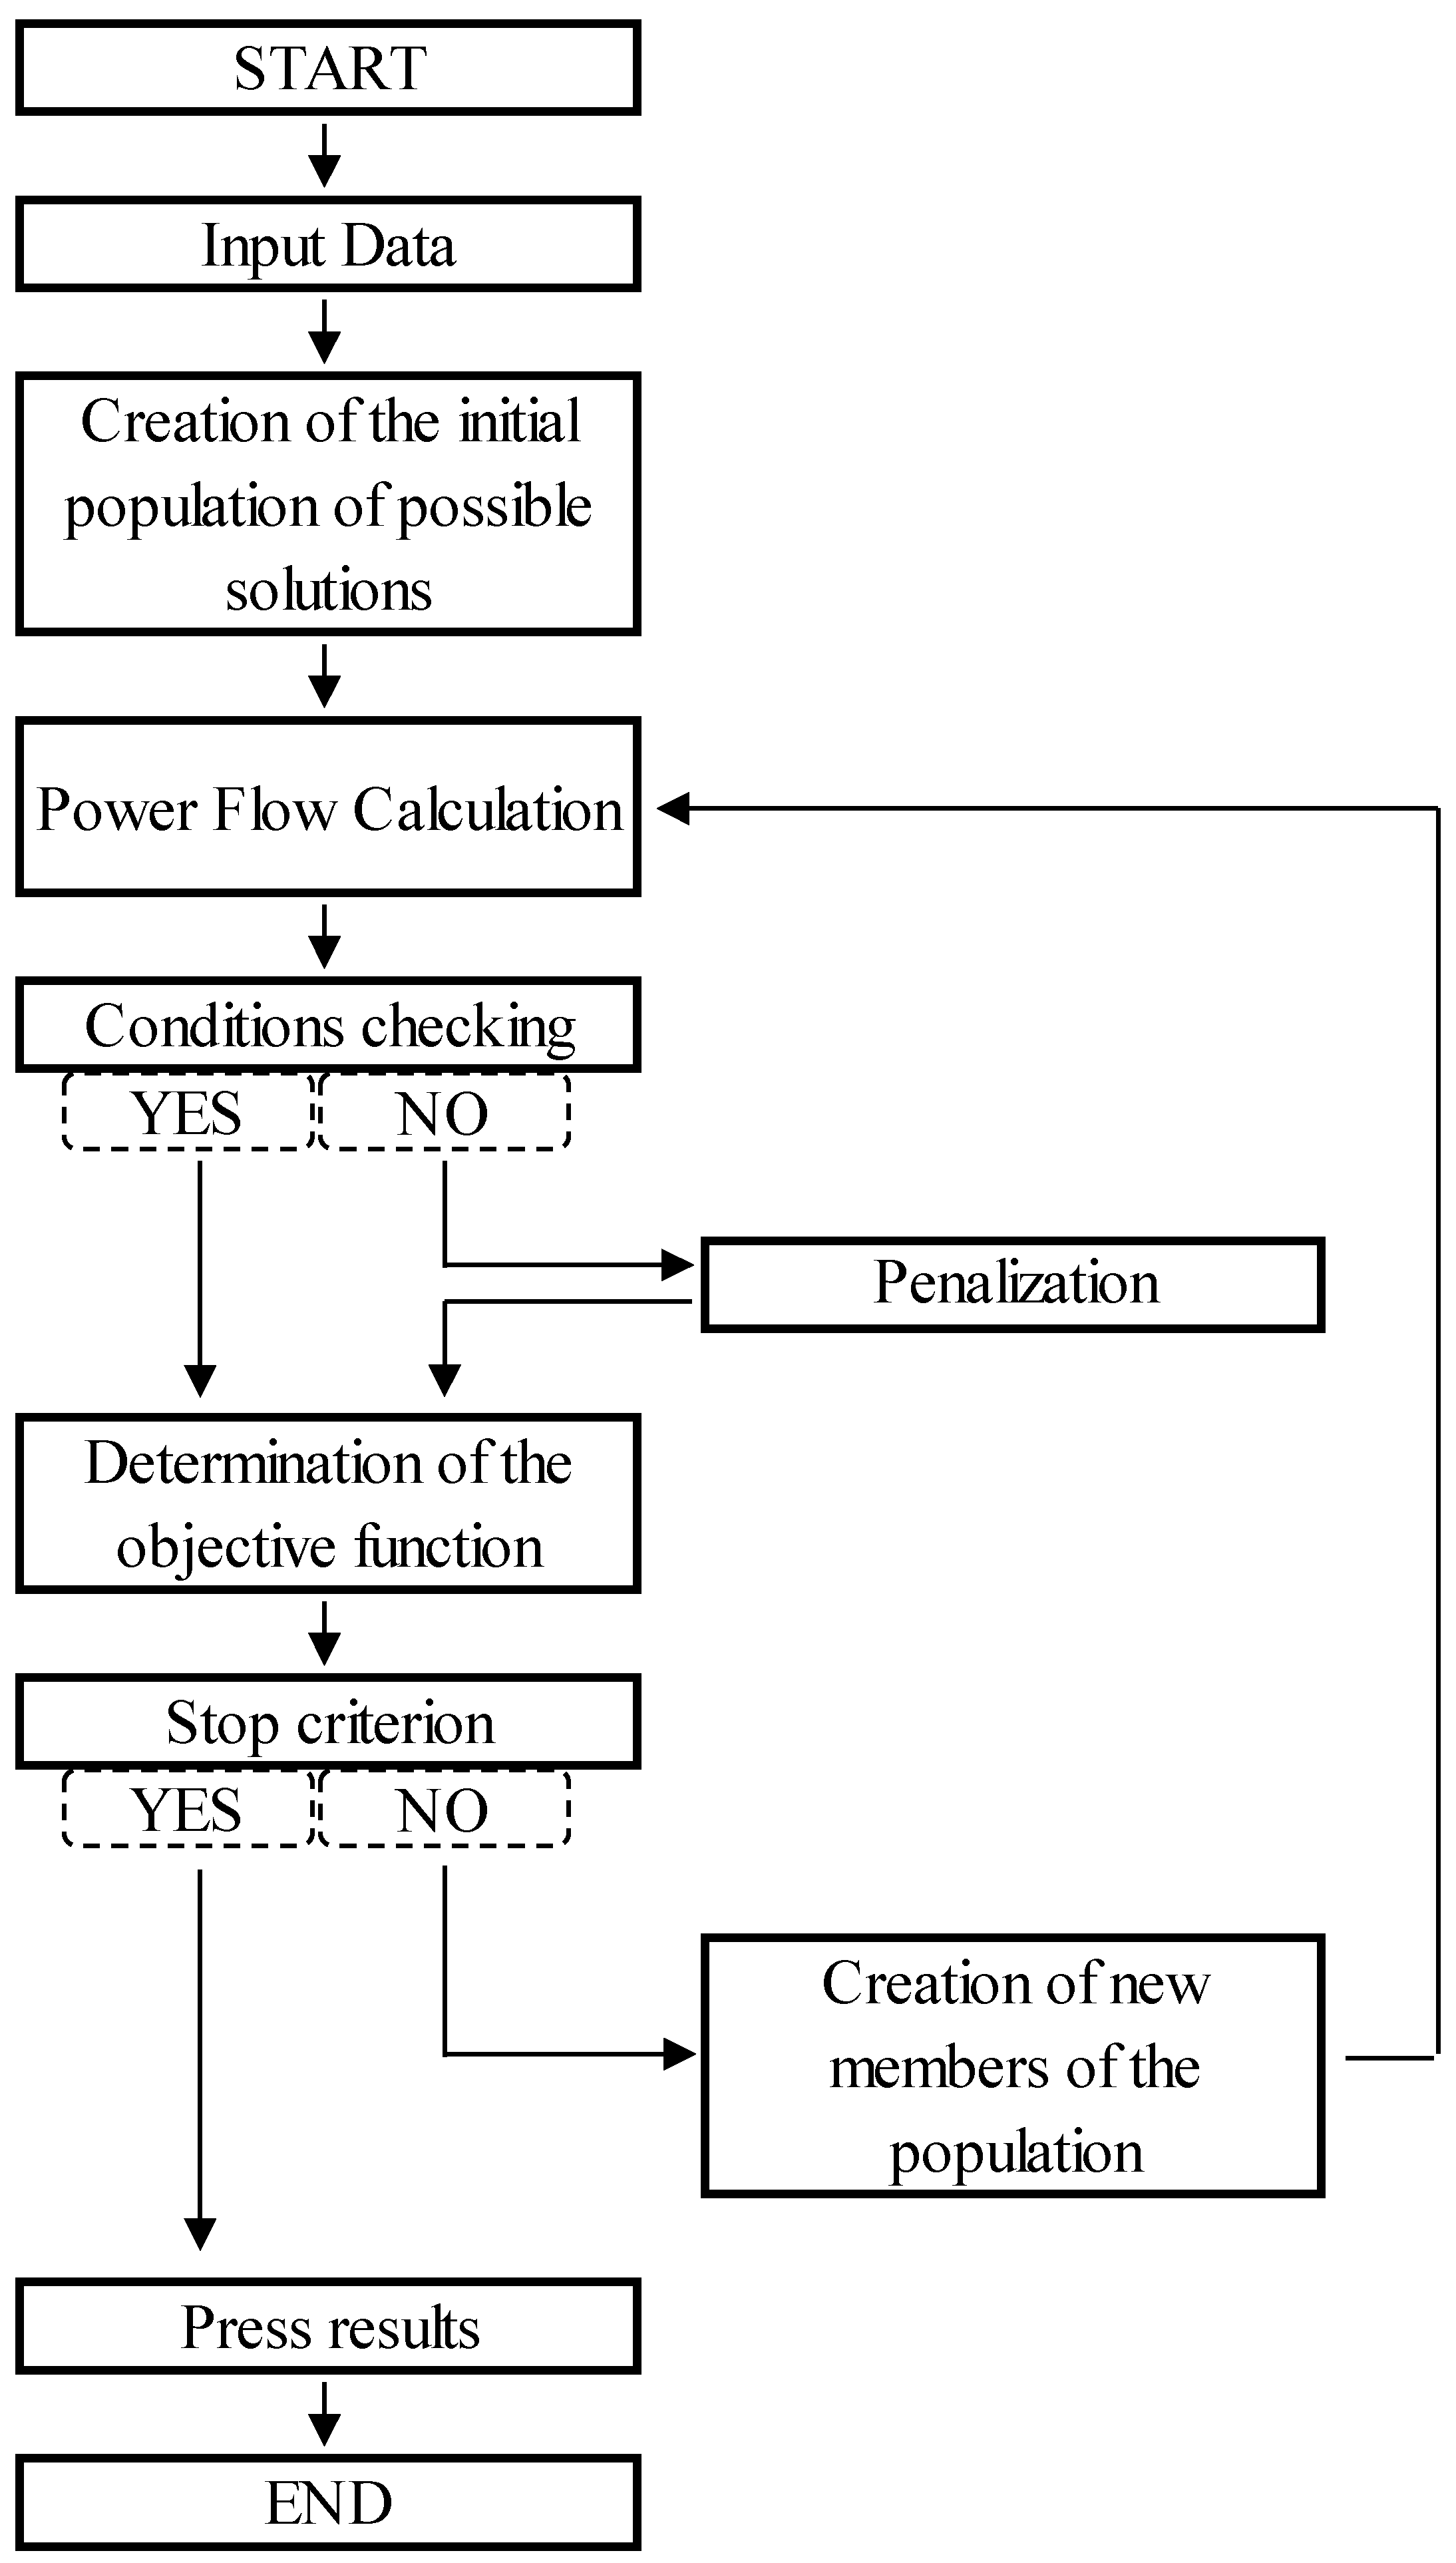
In addition, the abovementioned combinations of options defined to complete optimization problems are quite often used as a combination of several types of the FACTS devices as their properties are very complementary. In this case, it is possible to determine the numbers of the species of FACTS devices, the parameters and the places of the network connection separately. More adjustable variables that define the size of the supplied reactive power of the generator, transformer tap settings and the usage of existing compensation devices are added for these searching variables. The flowchart of the proposal during the optimization process is shown in
Figure 2.
At the beginning of the process there is entering input data, which is represented by the network parameters, and other data that will not change the optimization process.
As the considering use of the evolutionary computing techniques, at the beginning of optimization process will create an initial population of possible solutions, which represents searched variables. Using this data (input data and data from the initial population solutions), we will be able to calculate the steady-state mode of the network. After its calculation, there are controlled operating restrictions such as magnitude of the voltage at nodes, the maximum permissible current flow in lines, taps of transformers settings etc. If all this data will be between the permissible boundaries the target (purpose) function will be determined. If not, before the determination of the target functions it will also add penalization, which represents the infringement of any of the restrictions, and therefore there is an increase of its value. The objective function selection is controlled by stop criterion, which can be represented as a variety of the maximum number of generation solutions, the maximum computation time, the completion of the optimization process by unimproved objective function for a certain period and under [
11,
12]. Finally, the results will be printed, i.e., displays the searched variables. They will represent all searching data which would result from a given task. FACTS devices are able to influence the operating parameters in the ES and therefore reduce operating losses in the line.
The Power losses in distribution systems varies depending on a number of factors, depending on the configuration of the system, the level of transmission and distribution losses, active parts as a transformer, cables, capacitors [
1]. Power losses represents as a real power loss and reactive power loss. Line resistance causes real power losses and reactive power losses occur due to reactive elements. Typically, real power losses attract more attention for utilities, as this reduces the efficiency of energy transfer to customers. In any case, it is also very important to follow reactive power losses. This is because the flow of reactive power in the system must be maintained to a certain extent at a sufficient voltage level. Therefore, reactive power allows the transfer of real power through transmission and distribution lines to consumers. We can calculate real and reactive power losses in the distribution system using Equations (1) and (2):
In these equations, n
br is the sum of the number of branches in the system, │I
i│is the current flow magnitude in branch I, r
i and x
i—resistance and reactance of branch i. The level of power losses is also affected by different types of loads that are connected to distribution feeders. The problem of power losses affects both sides—utilities and consumers. One problem is the question of the voltage drop, which should be controlled to keep the voltages at load points within standard limitations. This problem may occur in lateral radial feeders with long distance or when feeding large loads. A possible solution of this problem is to control the voltage at different nodes of the power system. The voltage control means reactive power control. Consequently, controlling the reactive power and regulating the node voltages result in a reduction of power loss, which is a great concern to the utilities [
13,
14]. For finding a solution to this problem in the present research we perform simulations using a particle swarm optimization algorithm and a STATCOM operation device to minimize power losses and control voltage in the nodes.
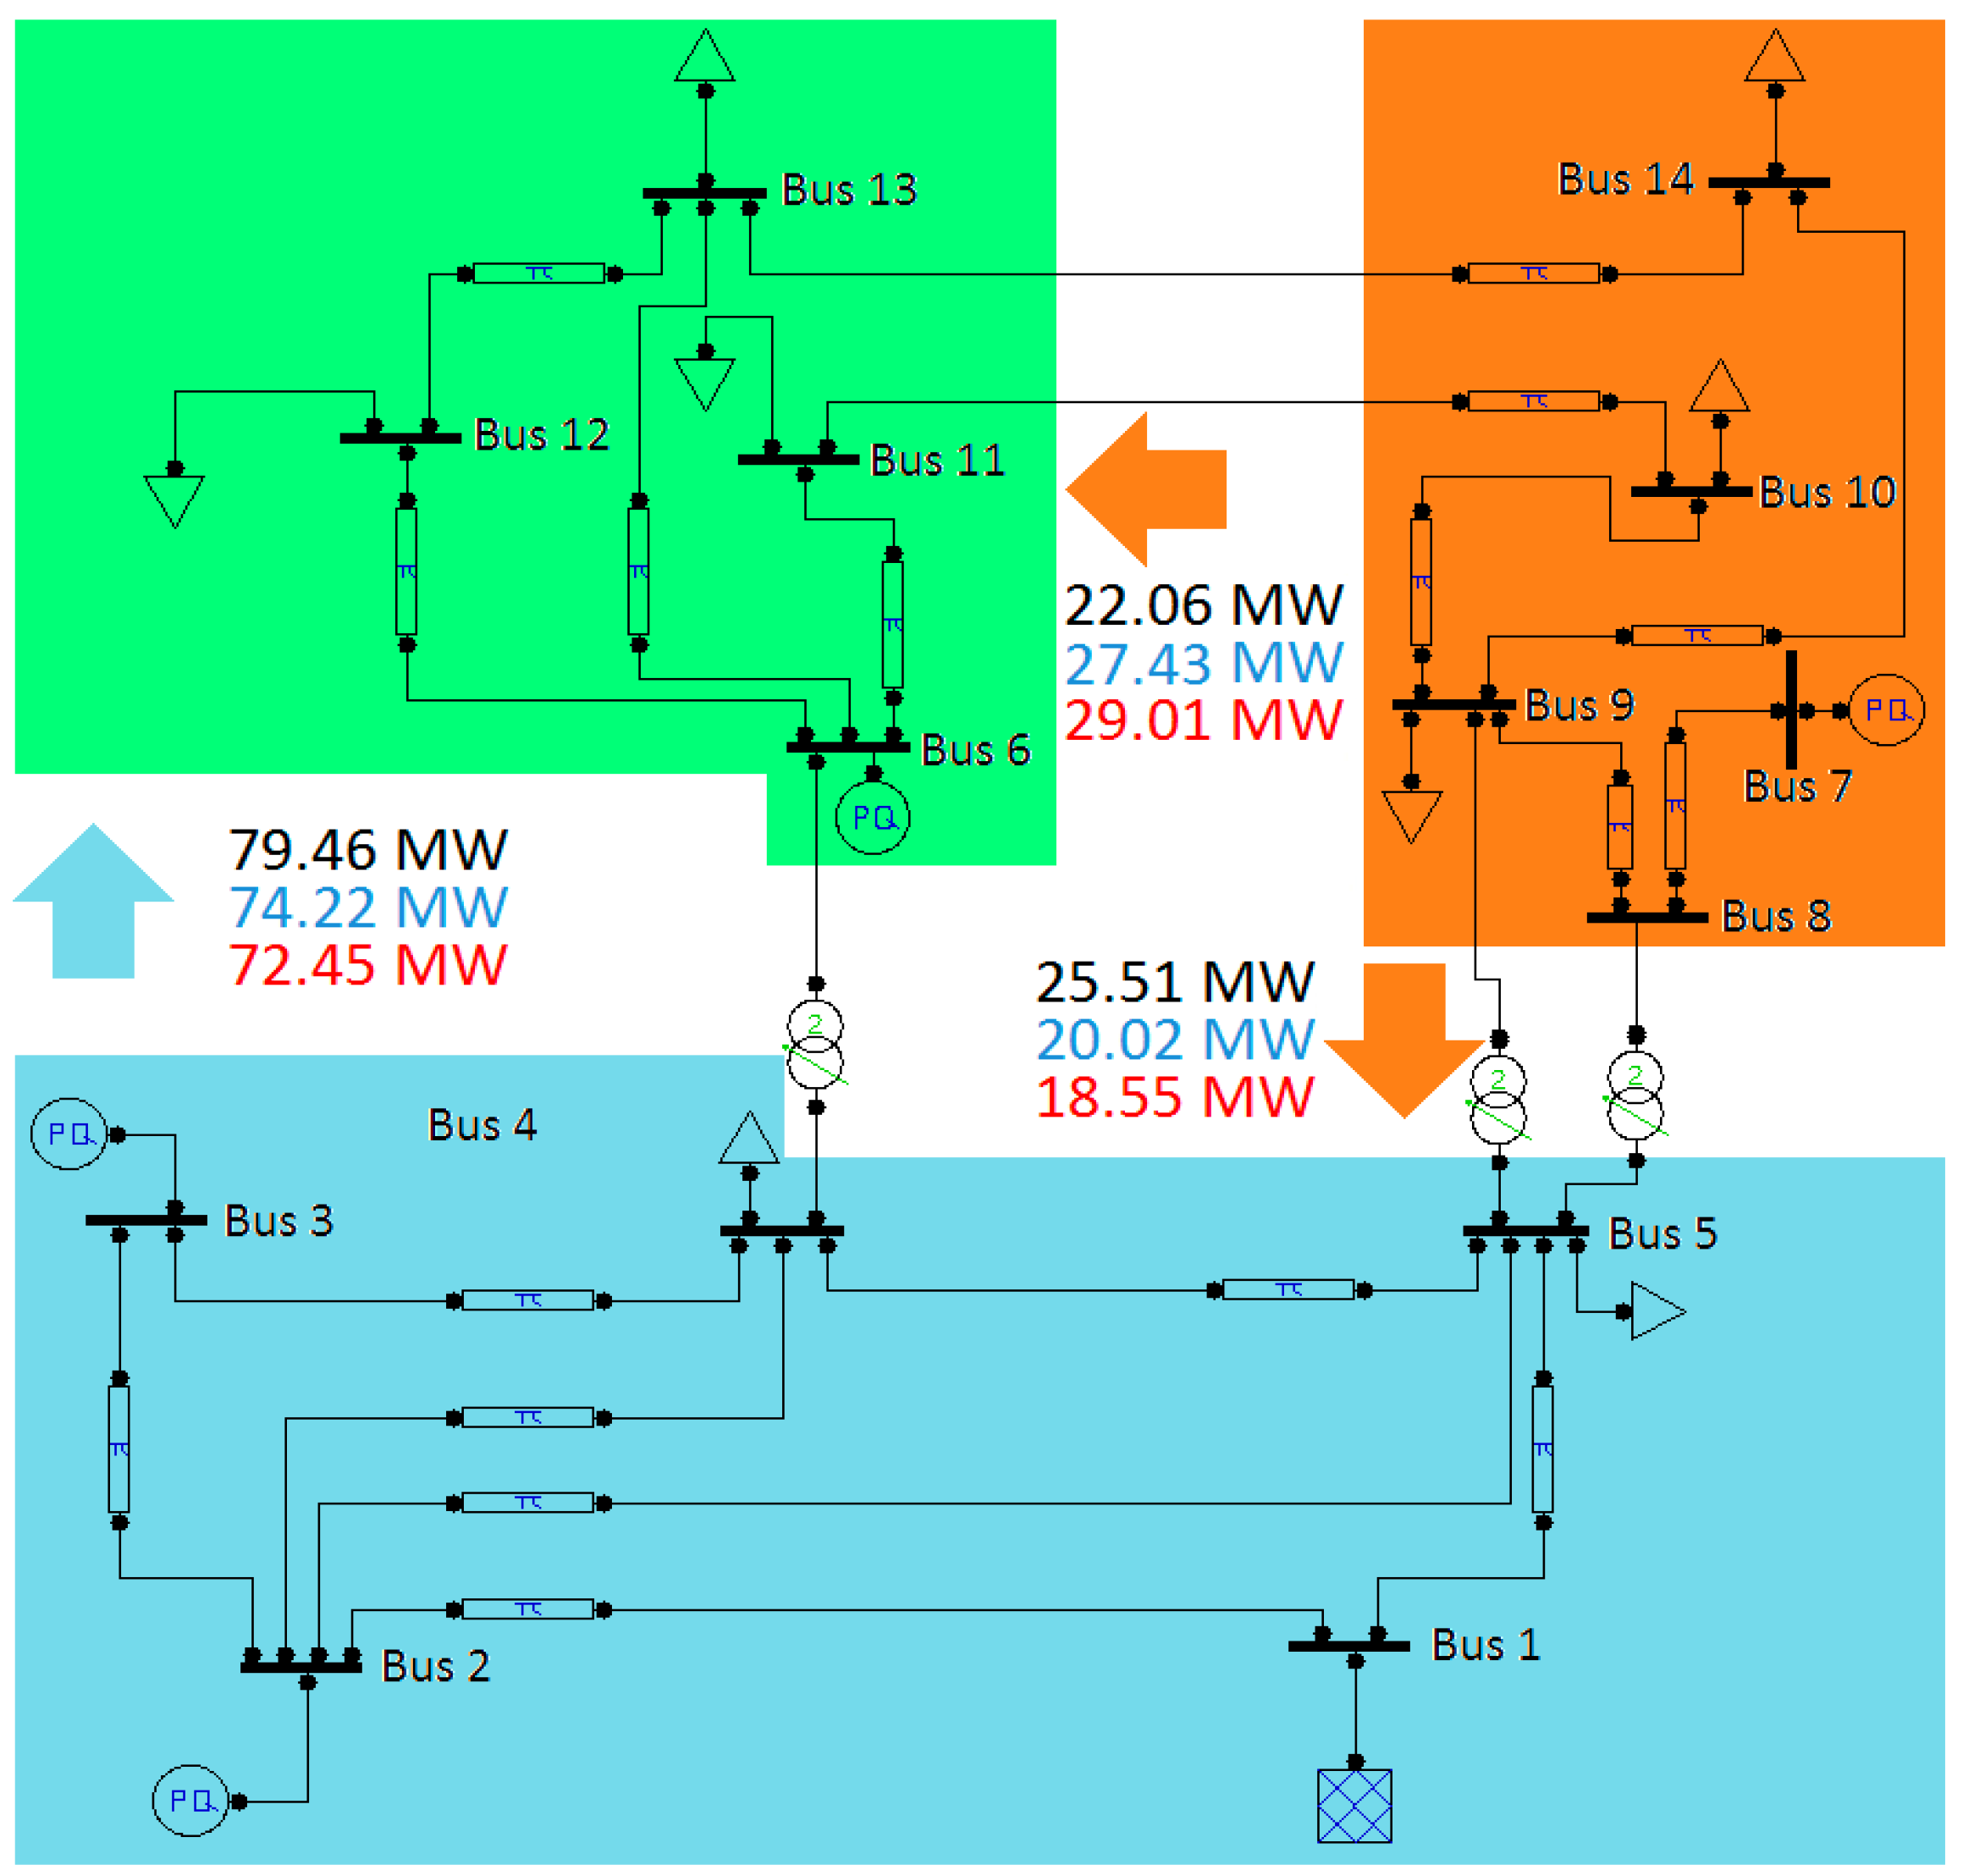
In
Figure 3 we consider a 14 nodes system with 400–220 kV voltage levels. The first five nodes are nodes on 400 kV, and others are on 220 kV. Node 1 is a bus node. We also use three phase 400/231 kV power transformers with a ±11x + 1.13% regulating tap on the secondary side.
In the present paper, we formulate four experiments:
- (1)
Grid operating parameters calculation.
- (2)
Grid operation parameters calculation using optimization techniques—optimization was performed without and with using a STATCOM device to reduce total active power losses in the power system.
- (3)
Generating source outages—gradually calculated tasks with and without using a STATCOM device in which source outages were simulated, and in each case it was assumed that the outage only occurs on one source. The outage in node 1 was not considered because this node is a balance node. In all cases, the optimization was performed in order to keep all operational restrictions under permitted deviations while reducing the total active losses in the network.
- (4)
Line disconnections between nodes 8 and 9 were considered. The 8–9 line is the second most overloaded line for the 220 kV voltage level (most overloaded line for 220 kV level is the line between nodes 7–8, but disconnection of that line caused a similar state as it was mentioned in case 3, i.e., disconnecting the source at node 7), while the objective was to keep any operational limitations under permitted deviations while reducing the total active losses in the grid.
3. Simulation Results
The optimized values consist of generator reactive power and tapchanger state of regulationg transformer in cases when we do not consider STATCOM installation. In case of a STATCOM device in operation, the optimized value is the reactive power. The particle swarm optimization method was used in all simulations, and the boundary conditions considered in all calculations were as follows:
Max. voltage deviations 5% of base voltage
Max. generated reactive power ±50 MVAr (related to data in
Table 1)
Tapchanger settings ±10%.
Max. current 2000 A for 400 kV lines, max. current 860 A for 220 kV lines.
Max. STATCOM reactive power ±100 MVAr.
Positive values in
Table 1 represent the generation of active/reactive power; negative values represent the consumption of active/reactive power.
The model grid (see
Figure 3) consists of three color marked areas—400 kV grid (blue), 220 kV grid (orange) and industrial area (green). Experimental conditions are as follows:
Exp. 1—base case with no optimization and no STATCOM present. For results see black color bars in
Figure 4 and
Figure 5.
Exp. 2—optimization on min. active power losses in case of no STATCOM used (blue bars in
Figure 4 and
Figure 5) and with STATCOM (red bars in
Figure 4 and
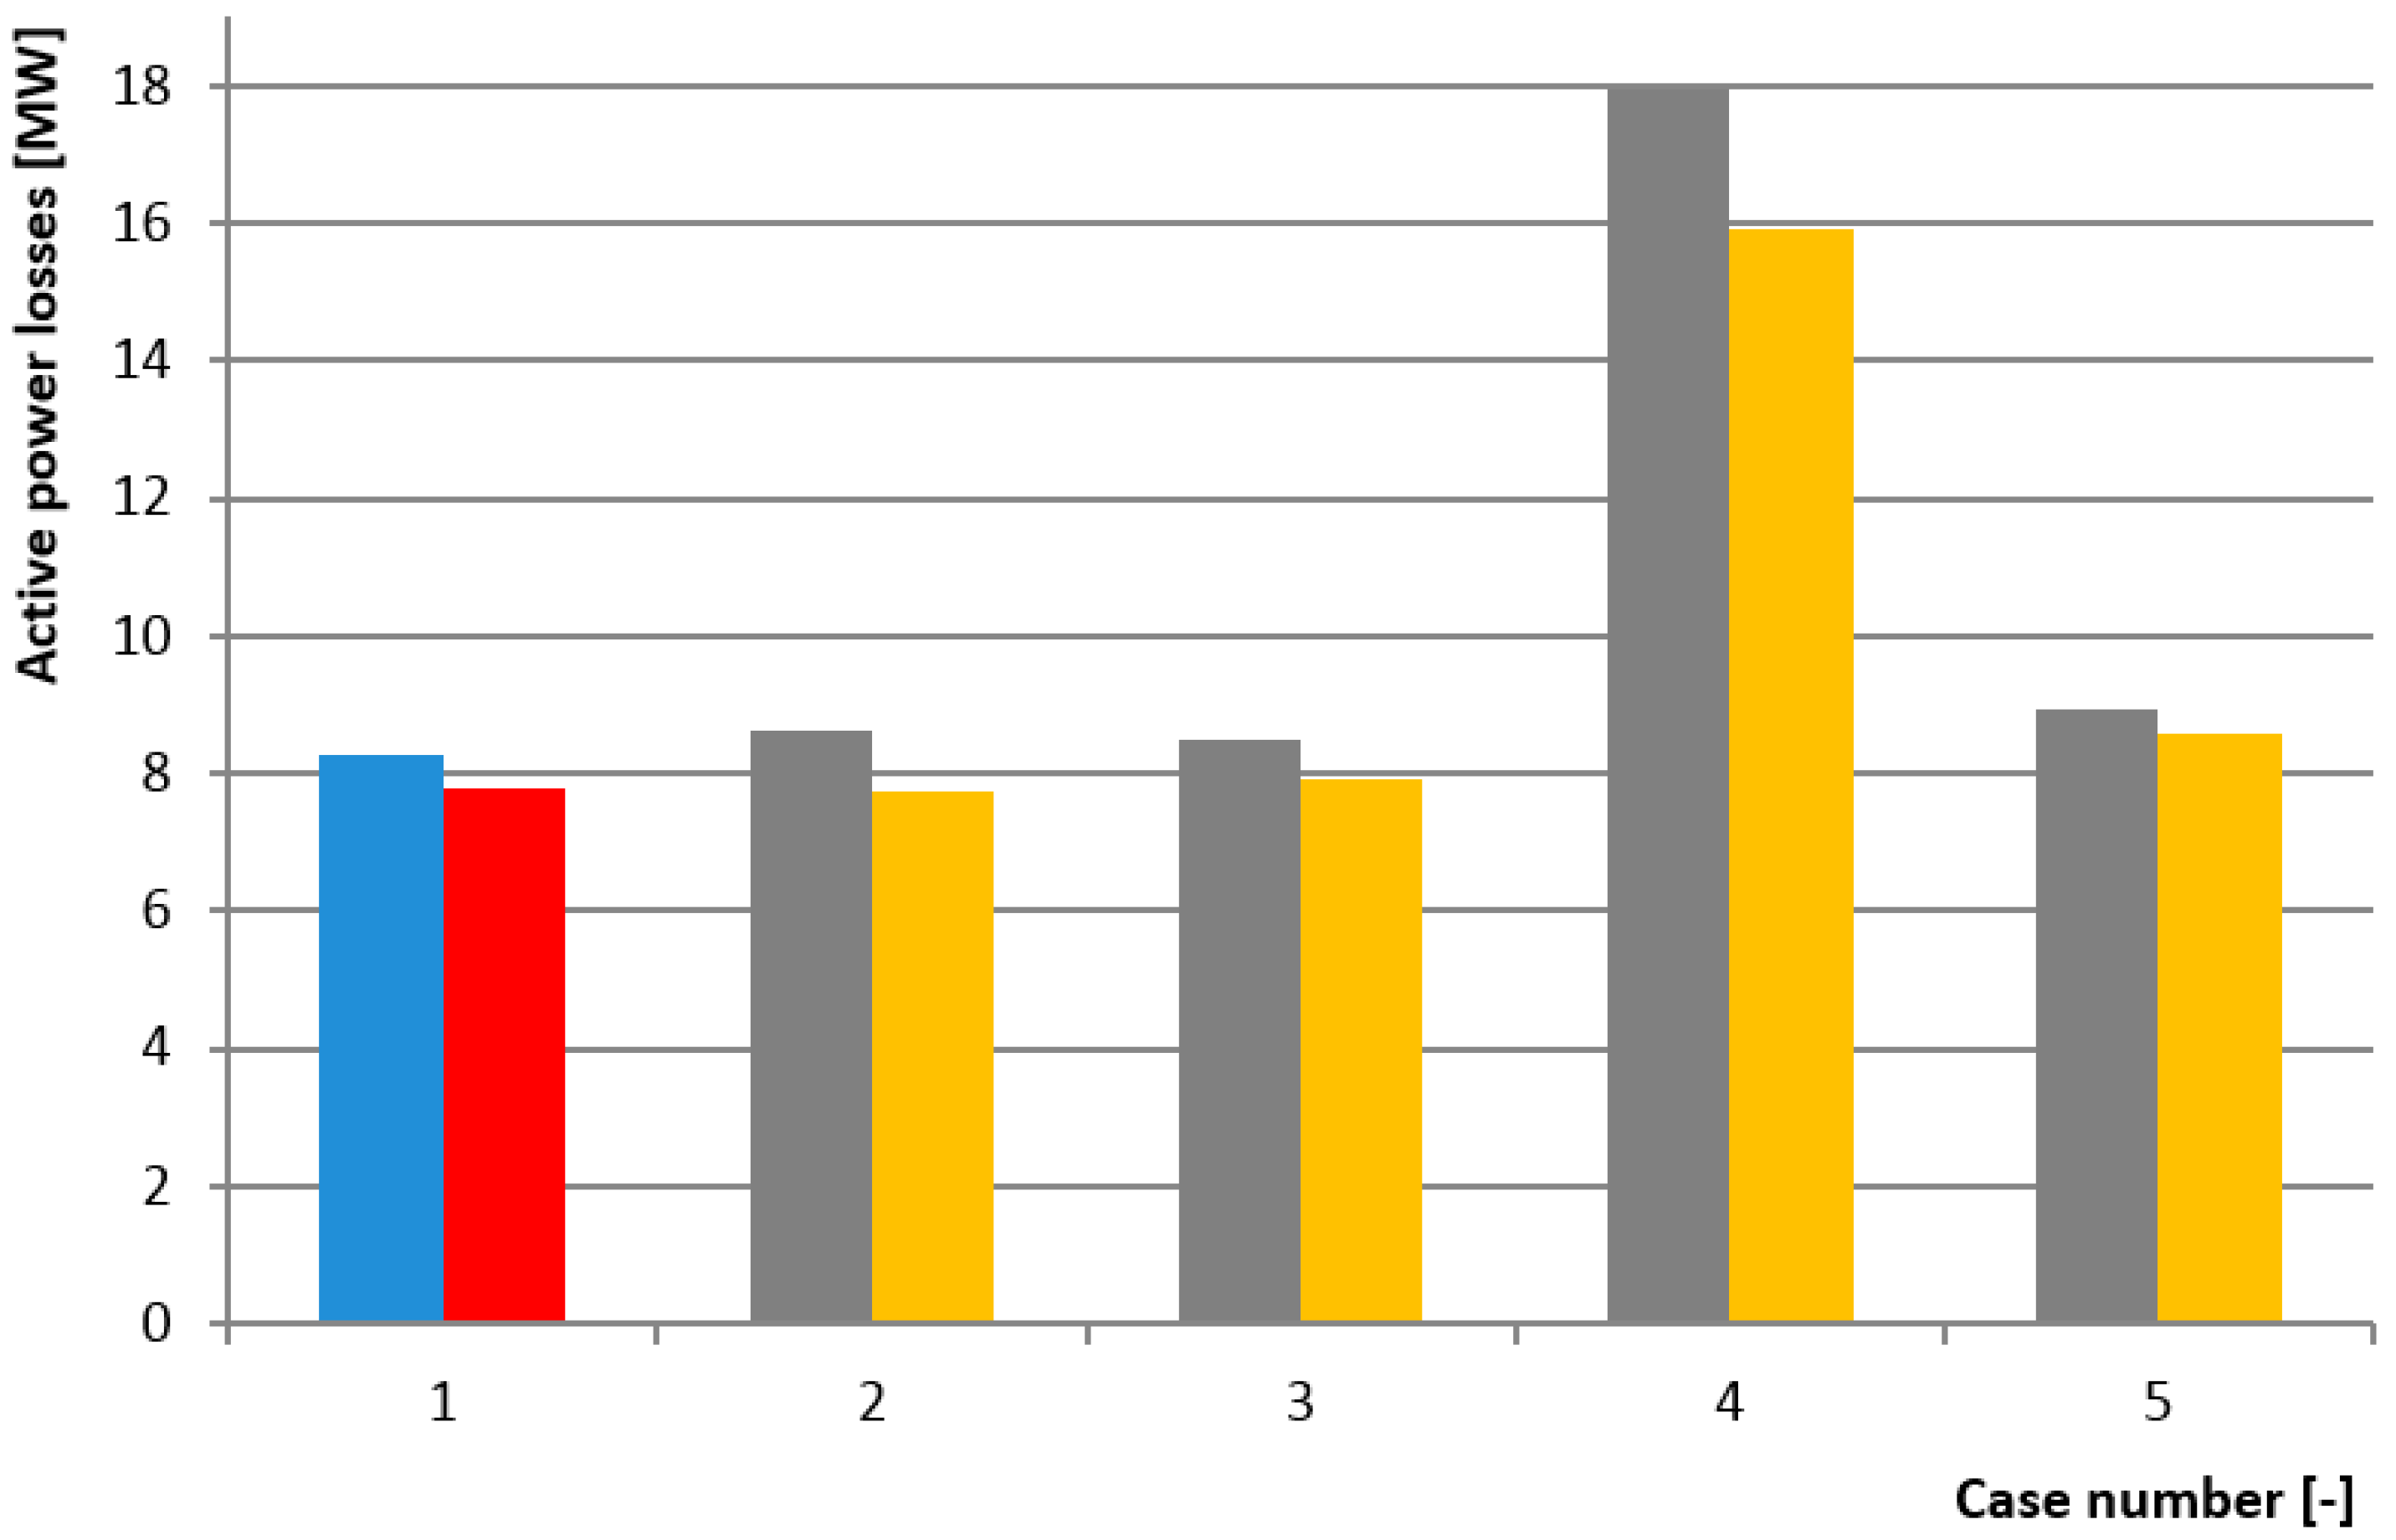
Figure 5). The total active power losses were 8.51 MW in case no STATCOM is used and 7.81 for the STATCOM in operation.
Exp. 3—In this task we considered generating source outages (from task 2 to task 5).
System outages were tested in this experiment. Each case was optimized using PSO:
Task 1: Optimization (total without switching)—this case represents the simulation results captured in experiment 2.
Task 2: Particle Swarm Optimization (outage of generator 2)
Task 3: Particle Swarm Optimization (outage of generator 3)
Task 4: Particle Swarm Optimization (outage of generator 6)
Task 5: Particle Swarm Optimization (outage of generator 7)
Table 2 shows results of the mentioned tasks, for the states with and without using STATCOM, the amount of reactive power that STATCOM supplied/absorbed from network and the bus number where was STATCOM connected.
Figure 6 shows experiments results for active power losses for all five tasks with using and without using STATCOM device.
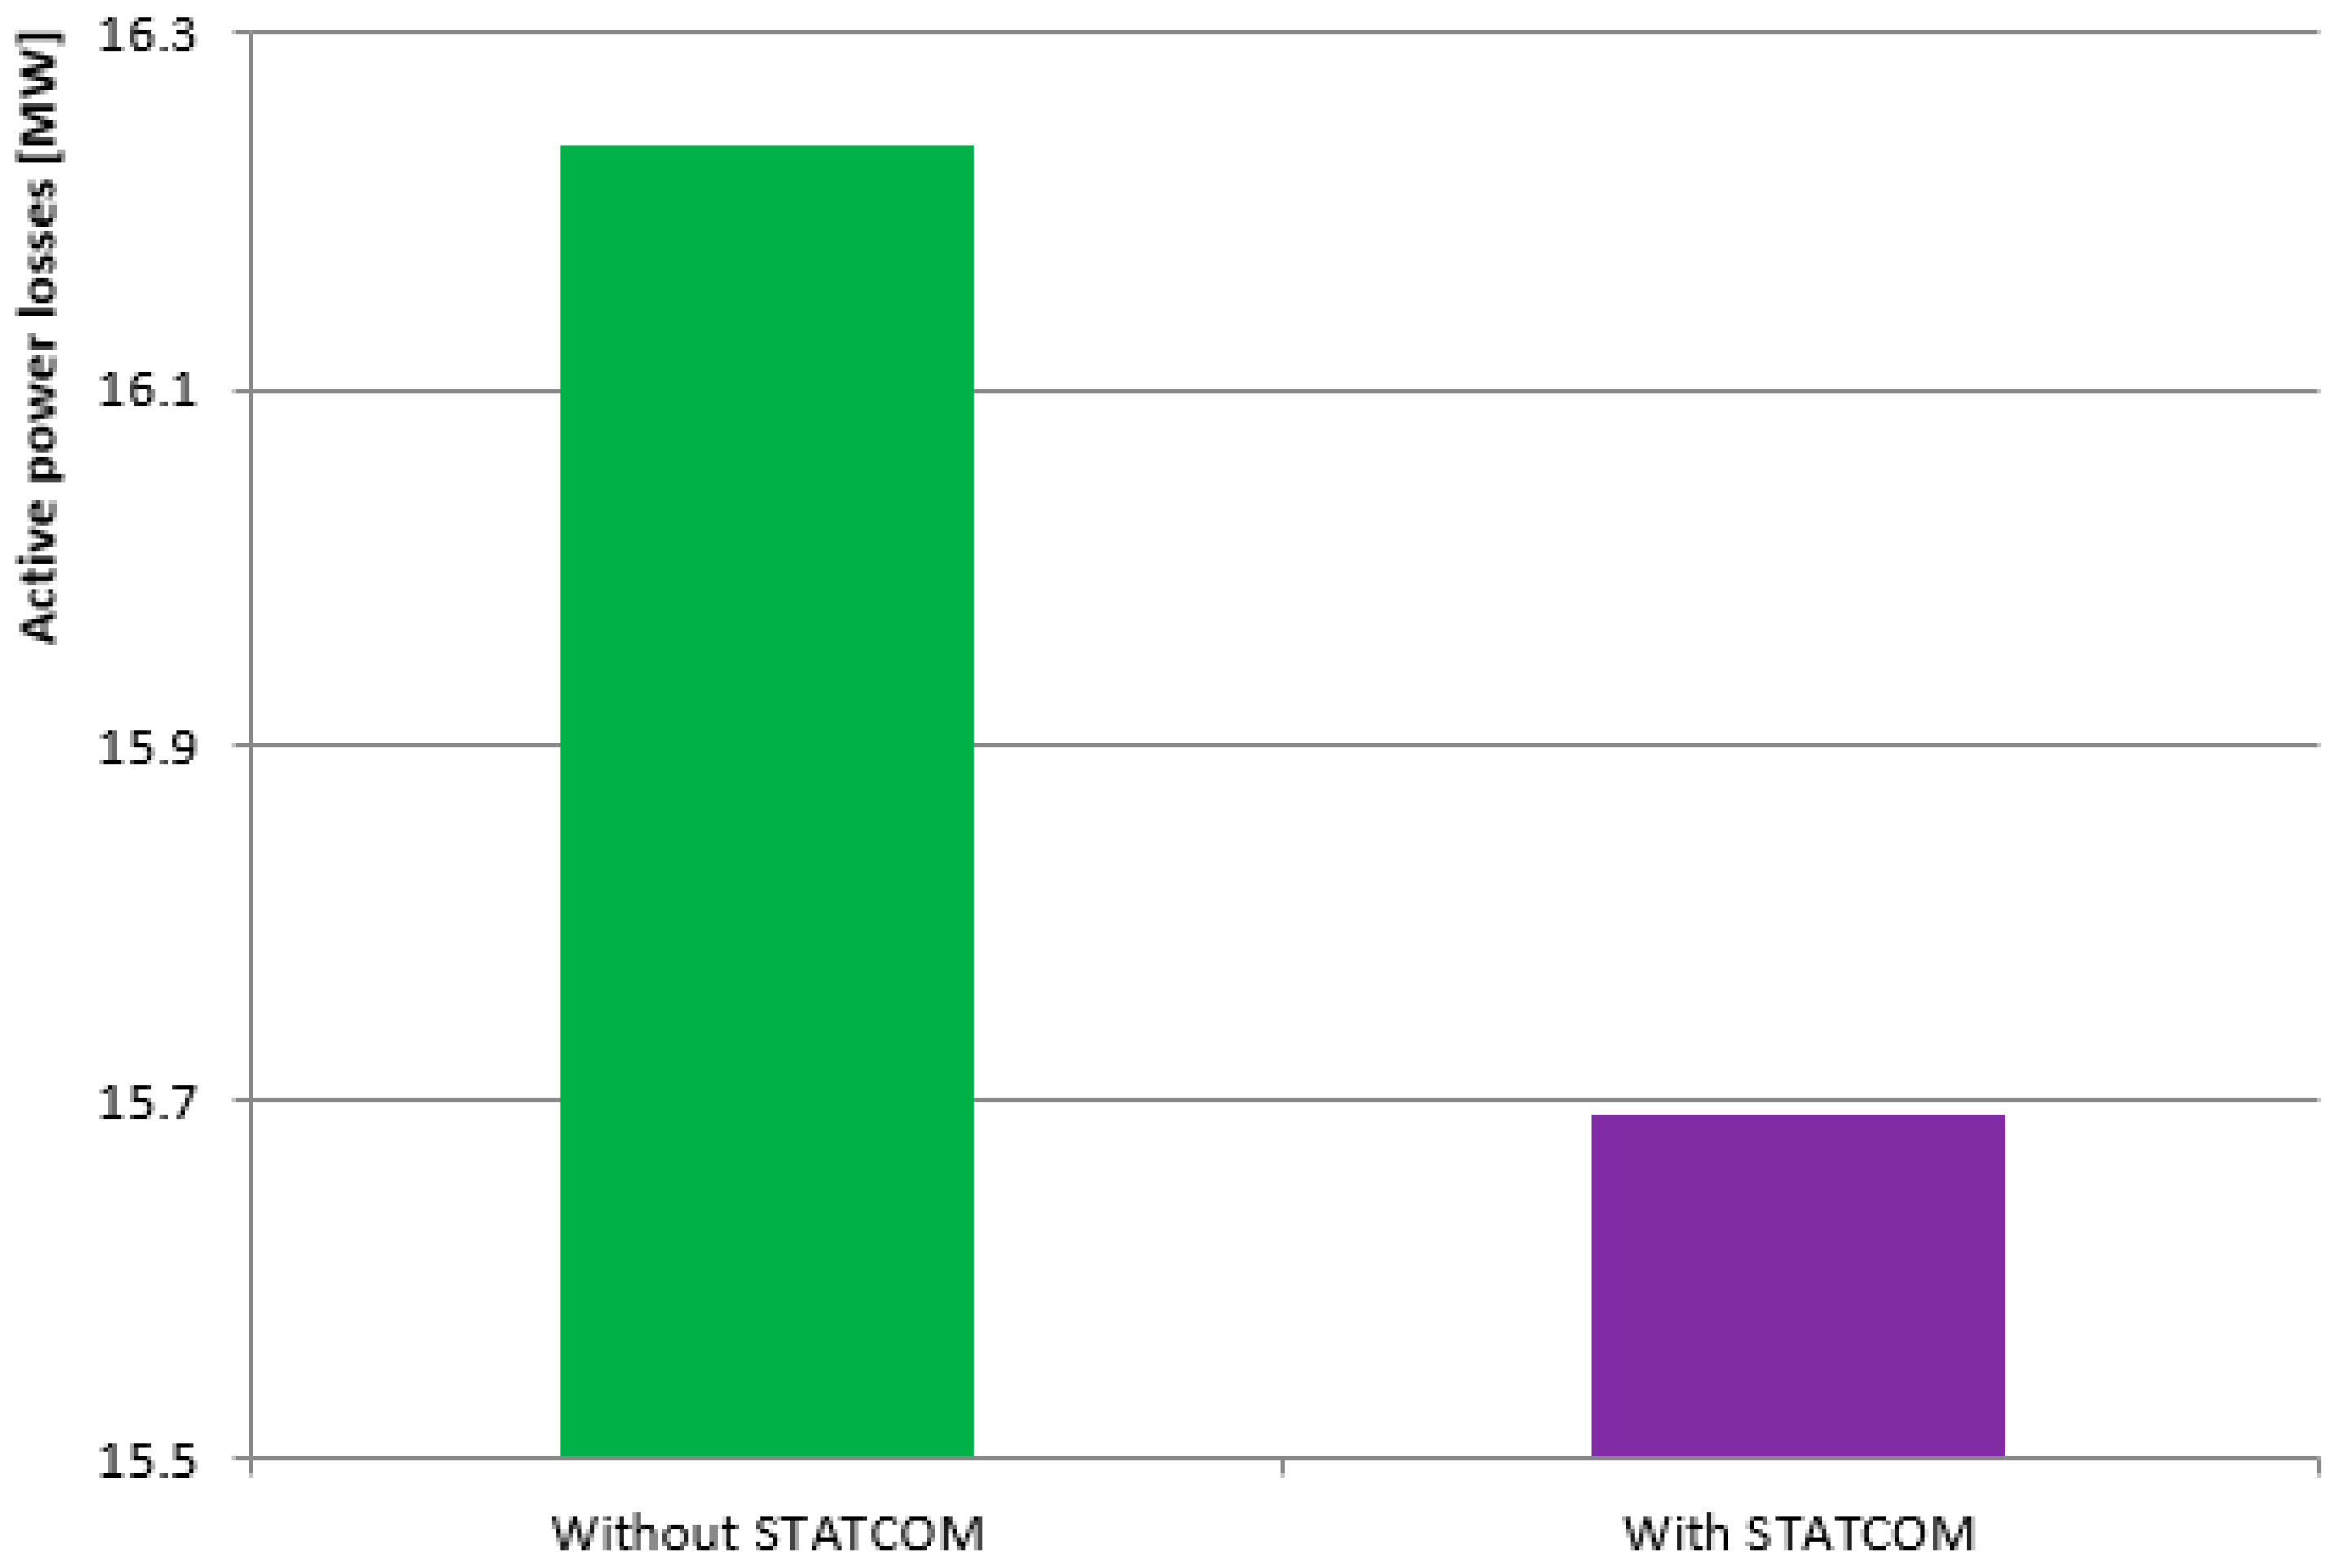
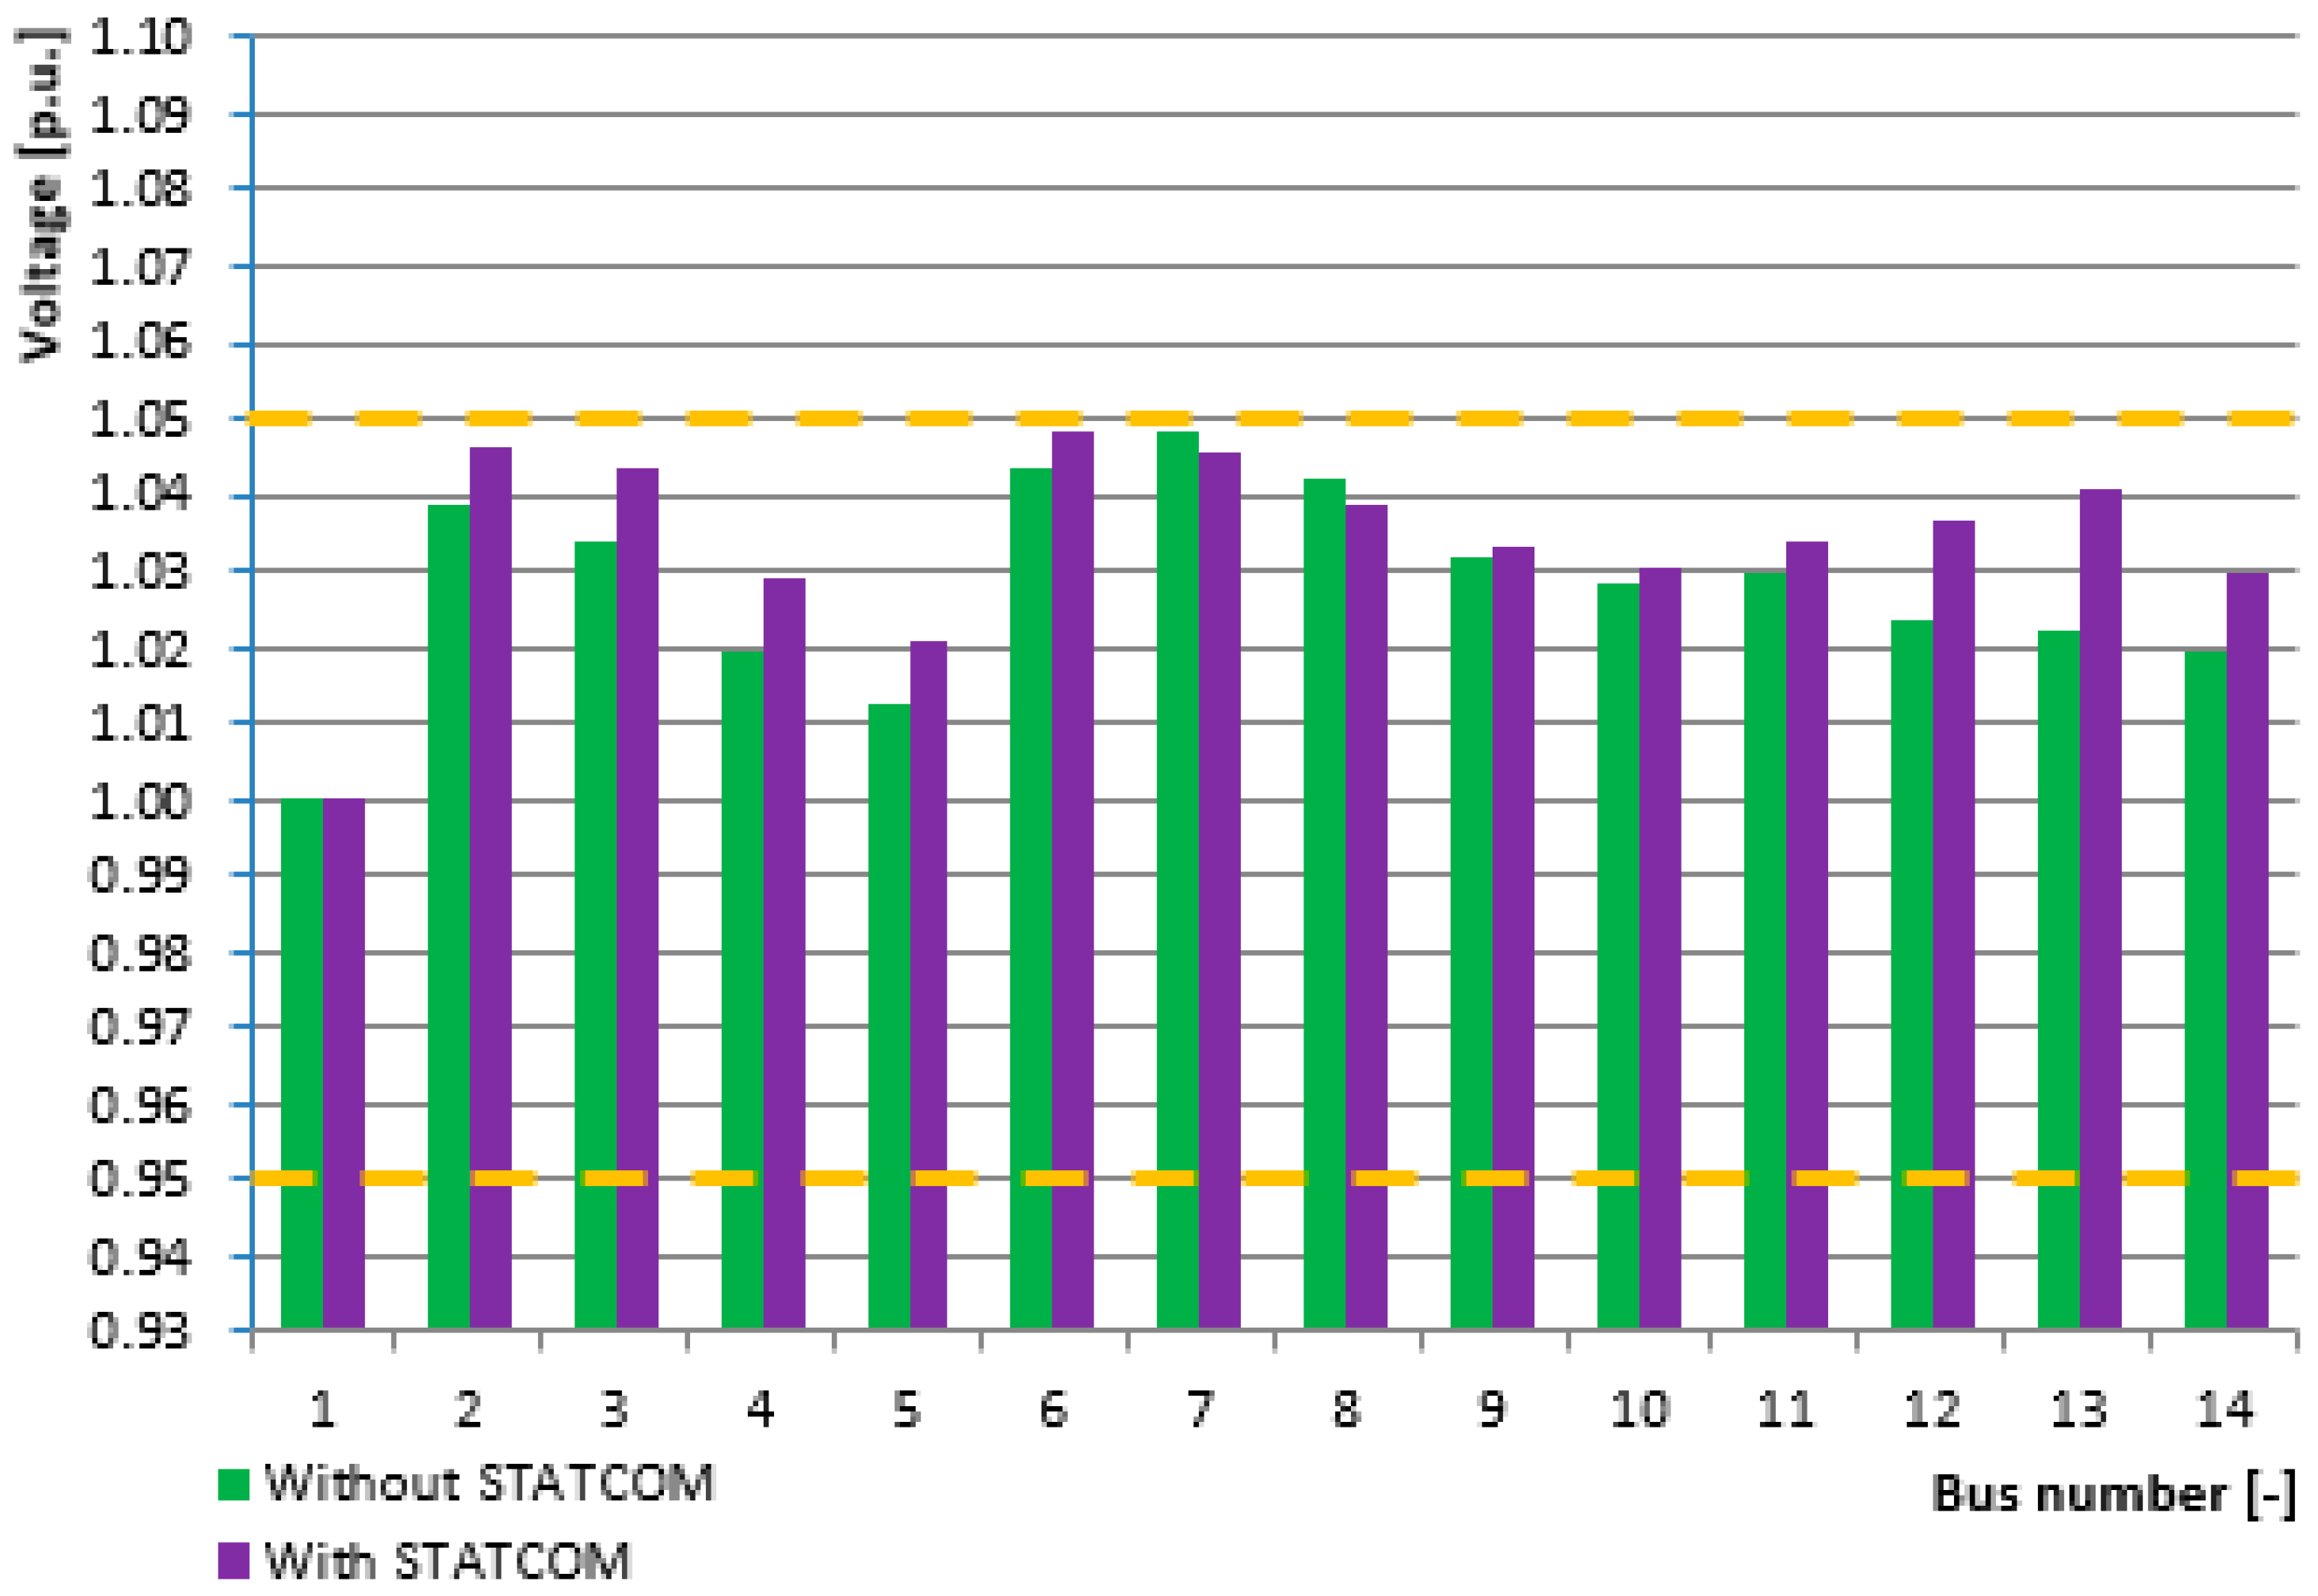
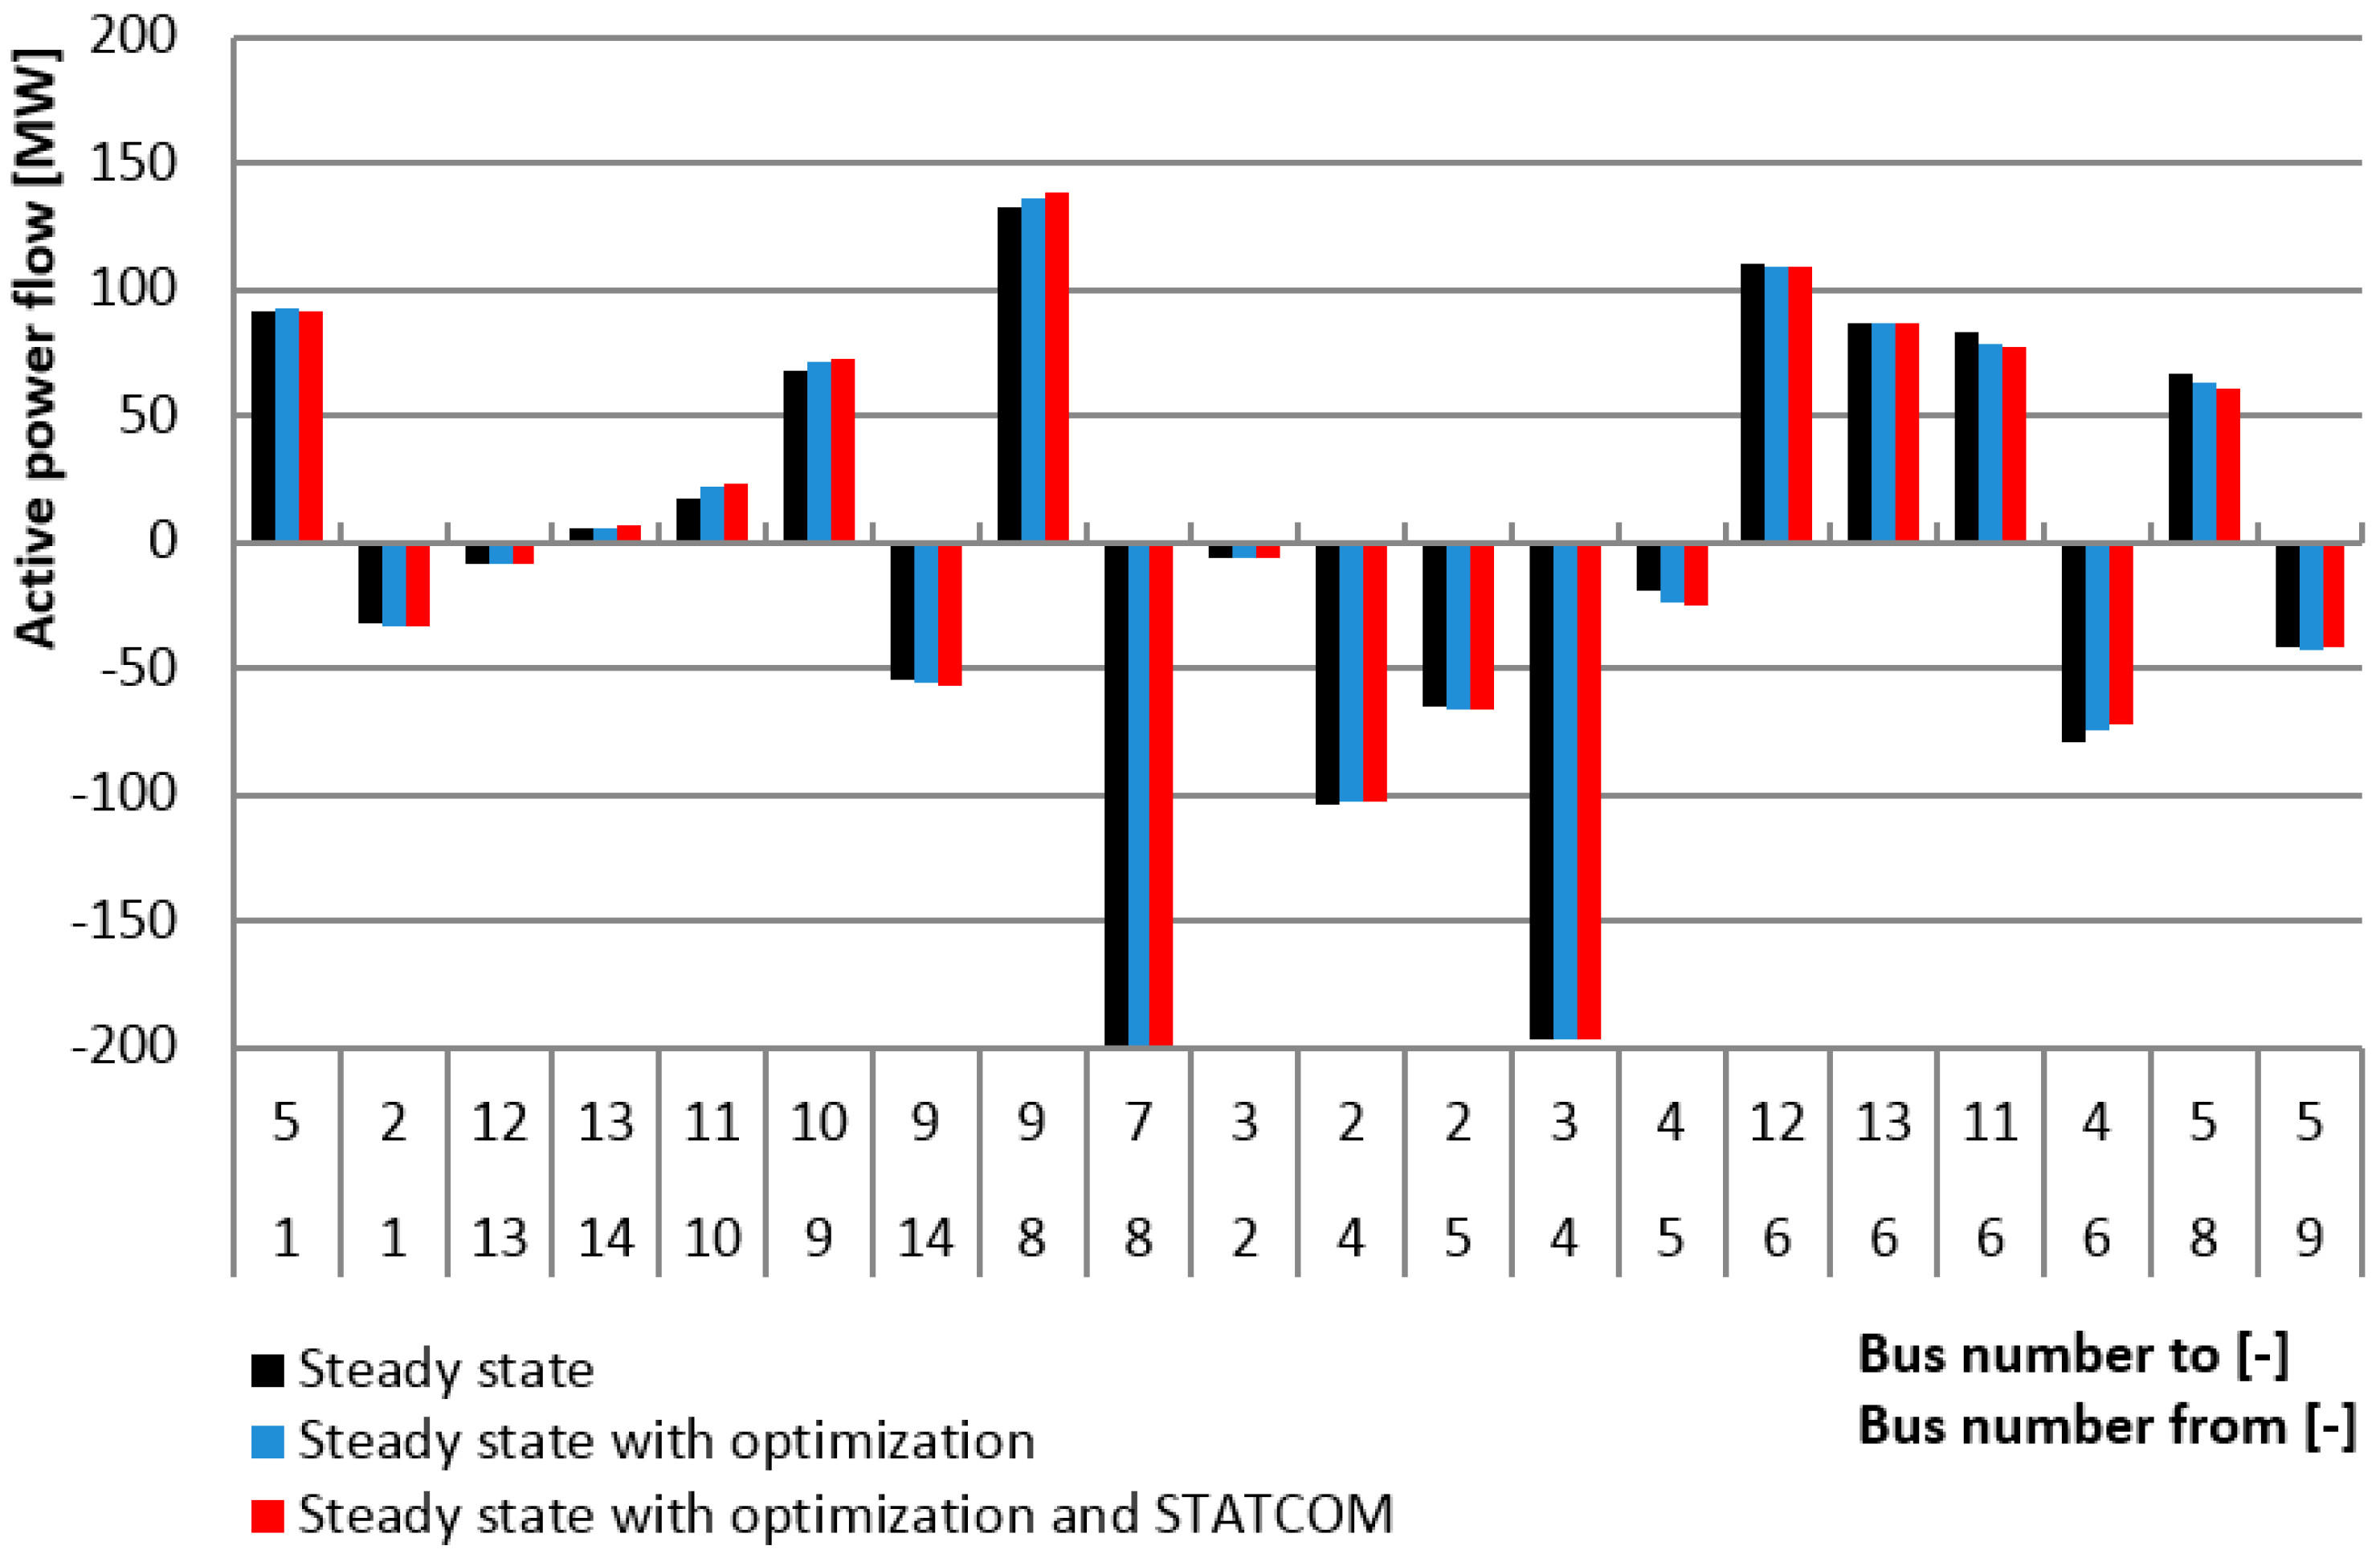
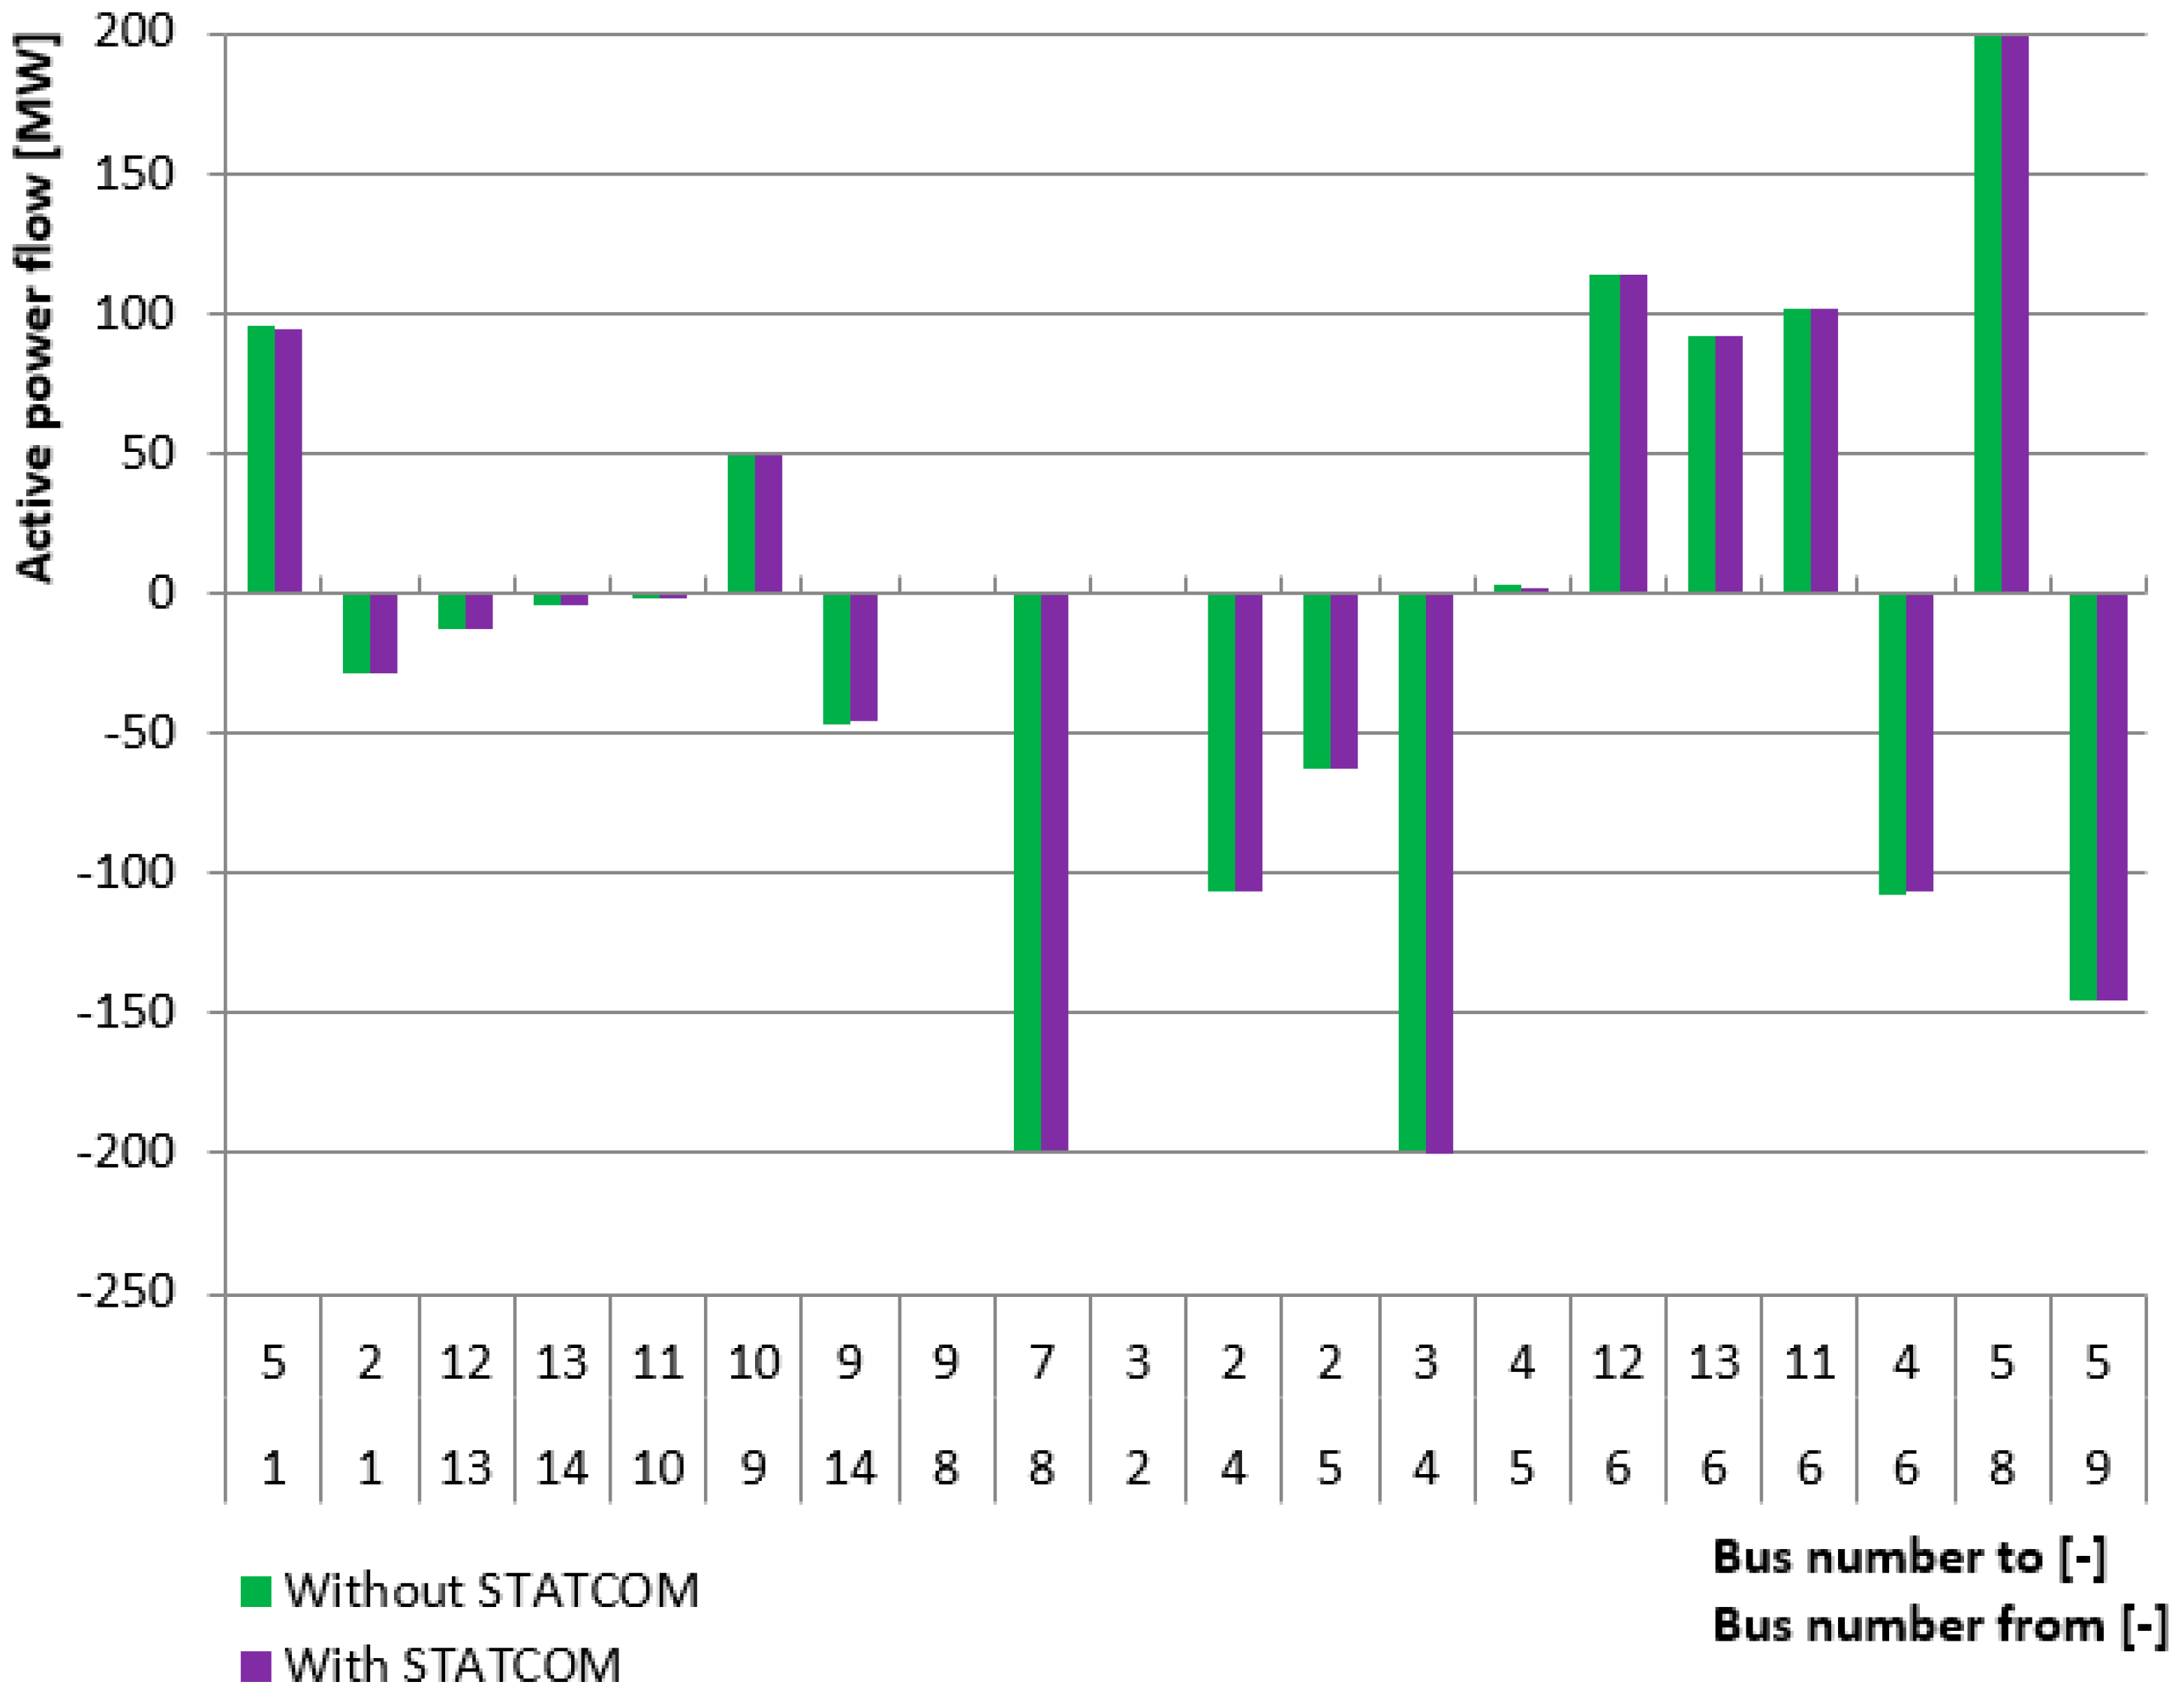
Exp. 4—line outage was tested. The line connecting nodes 8 and 9 was shut down. The grid was optimized using PSO when STATCOM was not used (green bar in
Figure 7) and when STACOM was used (purple bar in
Figure 7). The STATCOM device was installed in node 13 and supplied 87,589 MVAr. Voltage levels are presented in
Figure 8 and power flows in
Figure 9.
As shown in this research with the use of new technologies like the STATCOM device, we are able to reduce active power losses and also control voltage levels at the node to which the STATCOM is connected. In addition, the optimization of network parameters was performed due to which we get permissible values for voltage and power as shown in
Figure 3. FACTS devices are able to achieve the following advantages:
To improve the loading capability of lines to their thermal capabilities, including short term and seasonal adjustments.
The control of voltage level on the node and power flow control.
Providing secure line connections to neighboring utilities and regions thereby decreasing overall generation reserve requirements on both sides.
Improving better flexibility in siting new generation.
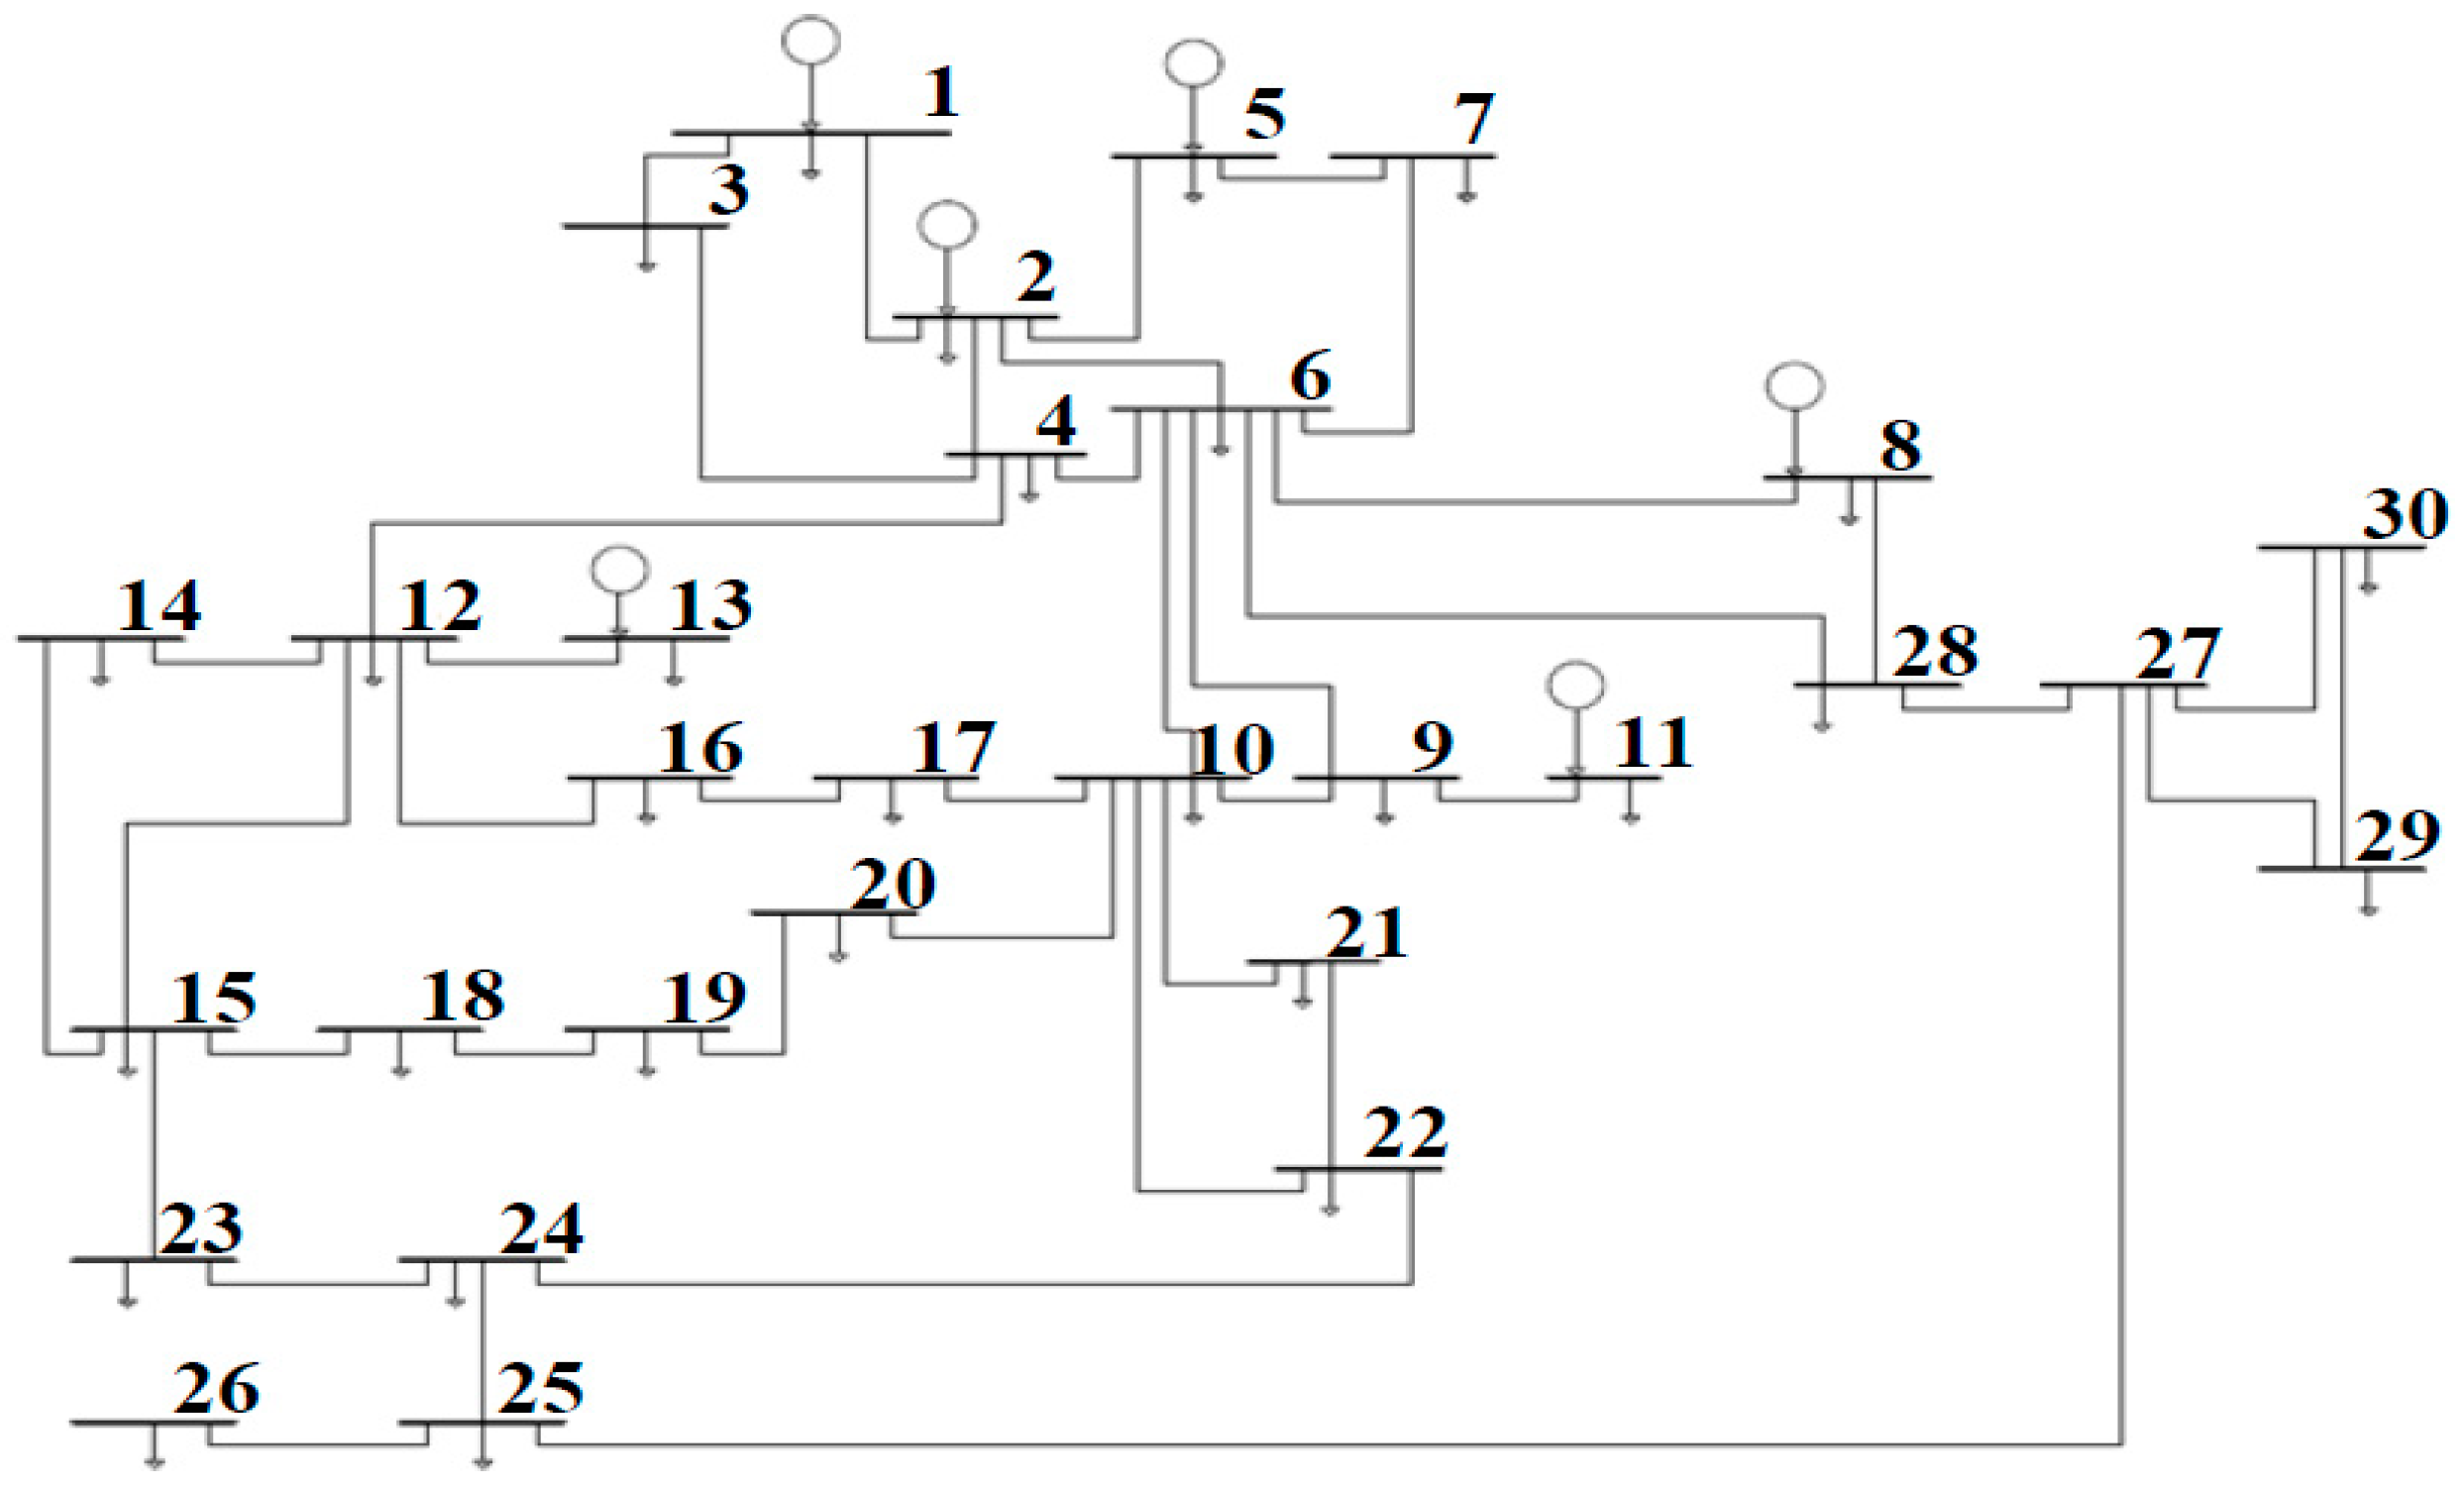
We performed the same optimization algorithm for a standard Institute of Electric and Electronic Engineers (IEEE) 30-node scheme, shown in
Figure 10. In the present system, there are six (generation nodes) thermal power plants (TPP)—nodes 1,2,5,8,11,13 and 24 are load stations. Node 1 is a slack bus node.
As presented in
Figure 10, the power system has different topology as the presented grid with the same voltage level and we will not use transformers taps. The character of the load is sufficient in the residential and commercial area. We formulate the same goals, as in previous case study using the particle swarm optimization method:
Grid operating parameters calculation.
Grid operation parameters calculation using optimization techniques—optimization was performed to reduce the total power losses in the system.
The calculation of the grid operating parameters using optimization techniques—optimization was performed in order to reduce total active power losses in the system with the use of FACTS devices (STATCOM).
The calculation in an emergency situation, to check if the system will still be stable and if any overloads will occur in the system. Output of all generators.
The optimized values consist of generator reactive power and tapchanger state of the regulating transformer in cases when we do not consider STATCOM installation. In the case a STATCOM device is in operation the optimized value is the reactive power. The particle swarm optimization method was used in all simulations. Boundary conditions were considered in all calculations were as follows:
Max. voltage deviations 5% of base voltage
Max. generated reactive power ±50 MVAr (related to data in
Table 1)
Tapchanger settings ±10%.
Max. current 2000 A for 400 kV lines.
Max. STATCOM reactive power ±100 MVAr.
The positive values in
Table 3 represent the generation of active/reactive power, the negative values represent the consumption of active/reactive power.
Simulation Results for 30 Nodes Power System
Experimental conditions are as follows:
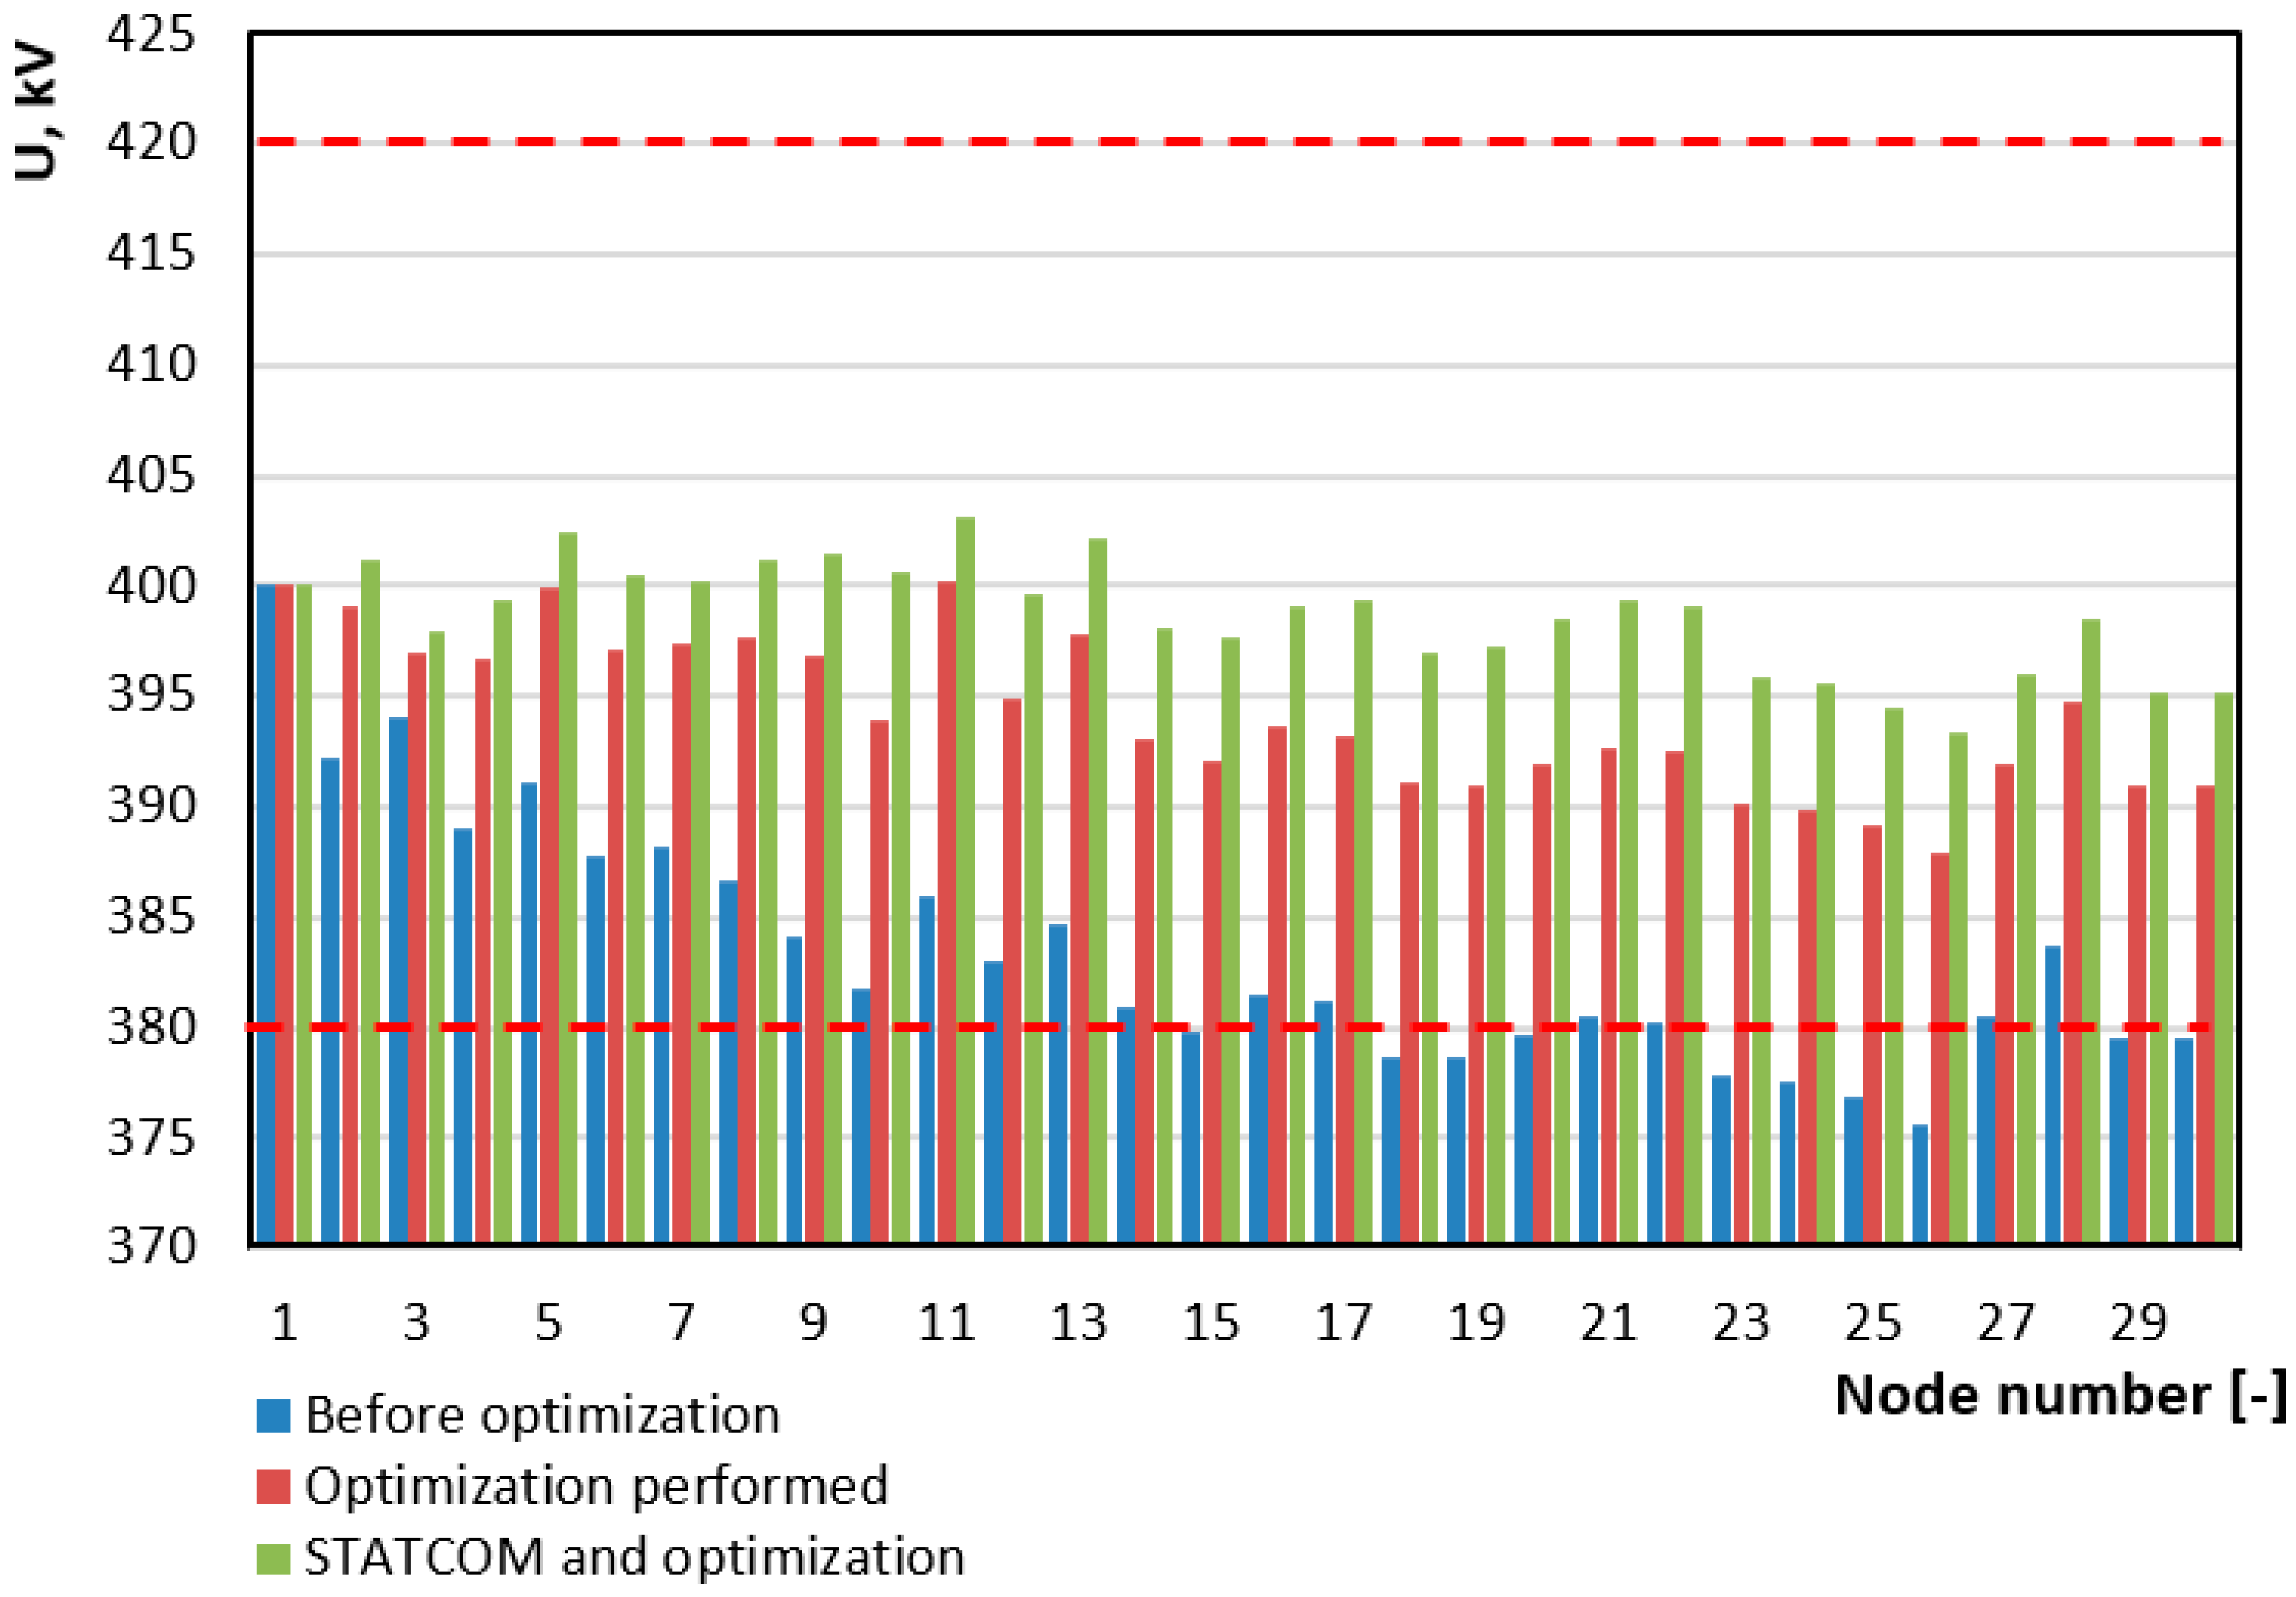
Exp. 1—base case with no optimization and no STATCOM present. For results see blue color bars in
Figure 11 and
Figure 12. Total active power losses were 35,778 MW. Voltage levels are out of allowed range.
Exp. 2—optimization on min. active power losses in case of no STATCOM used (red bars in
Figure 11 and
Figure 12). Total active power losses were 33,897 MW
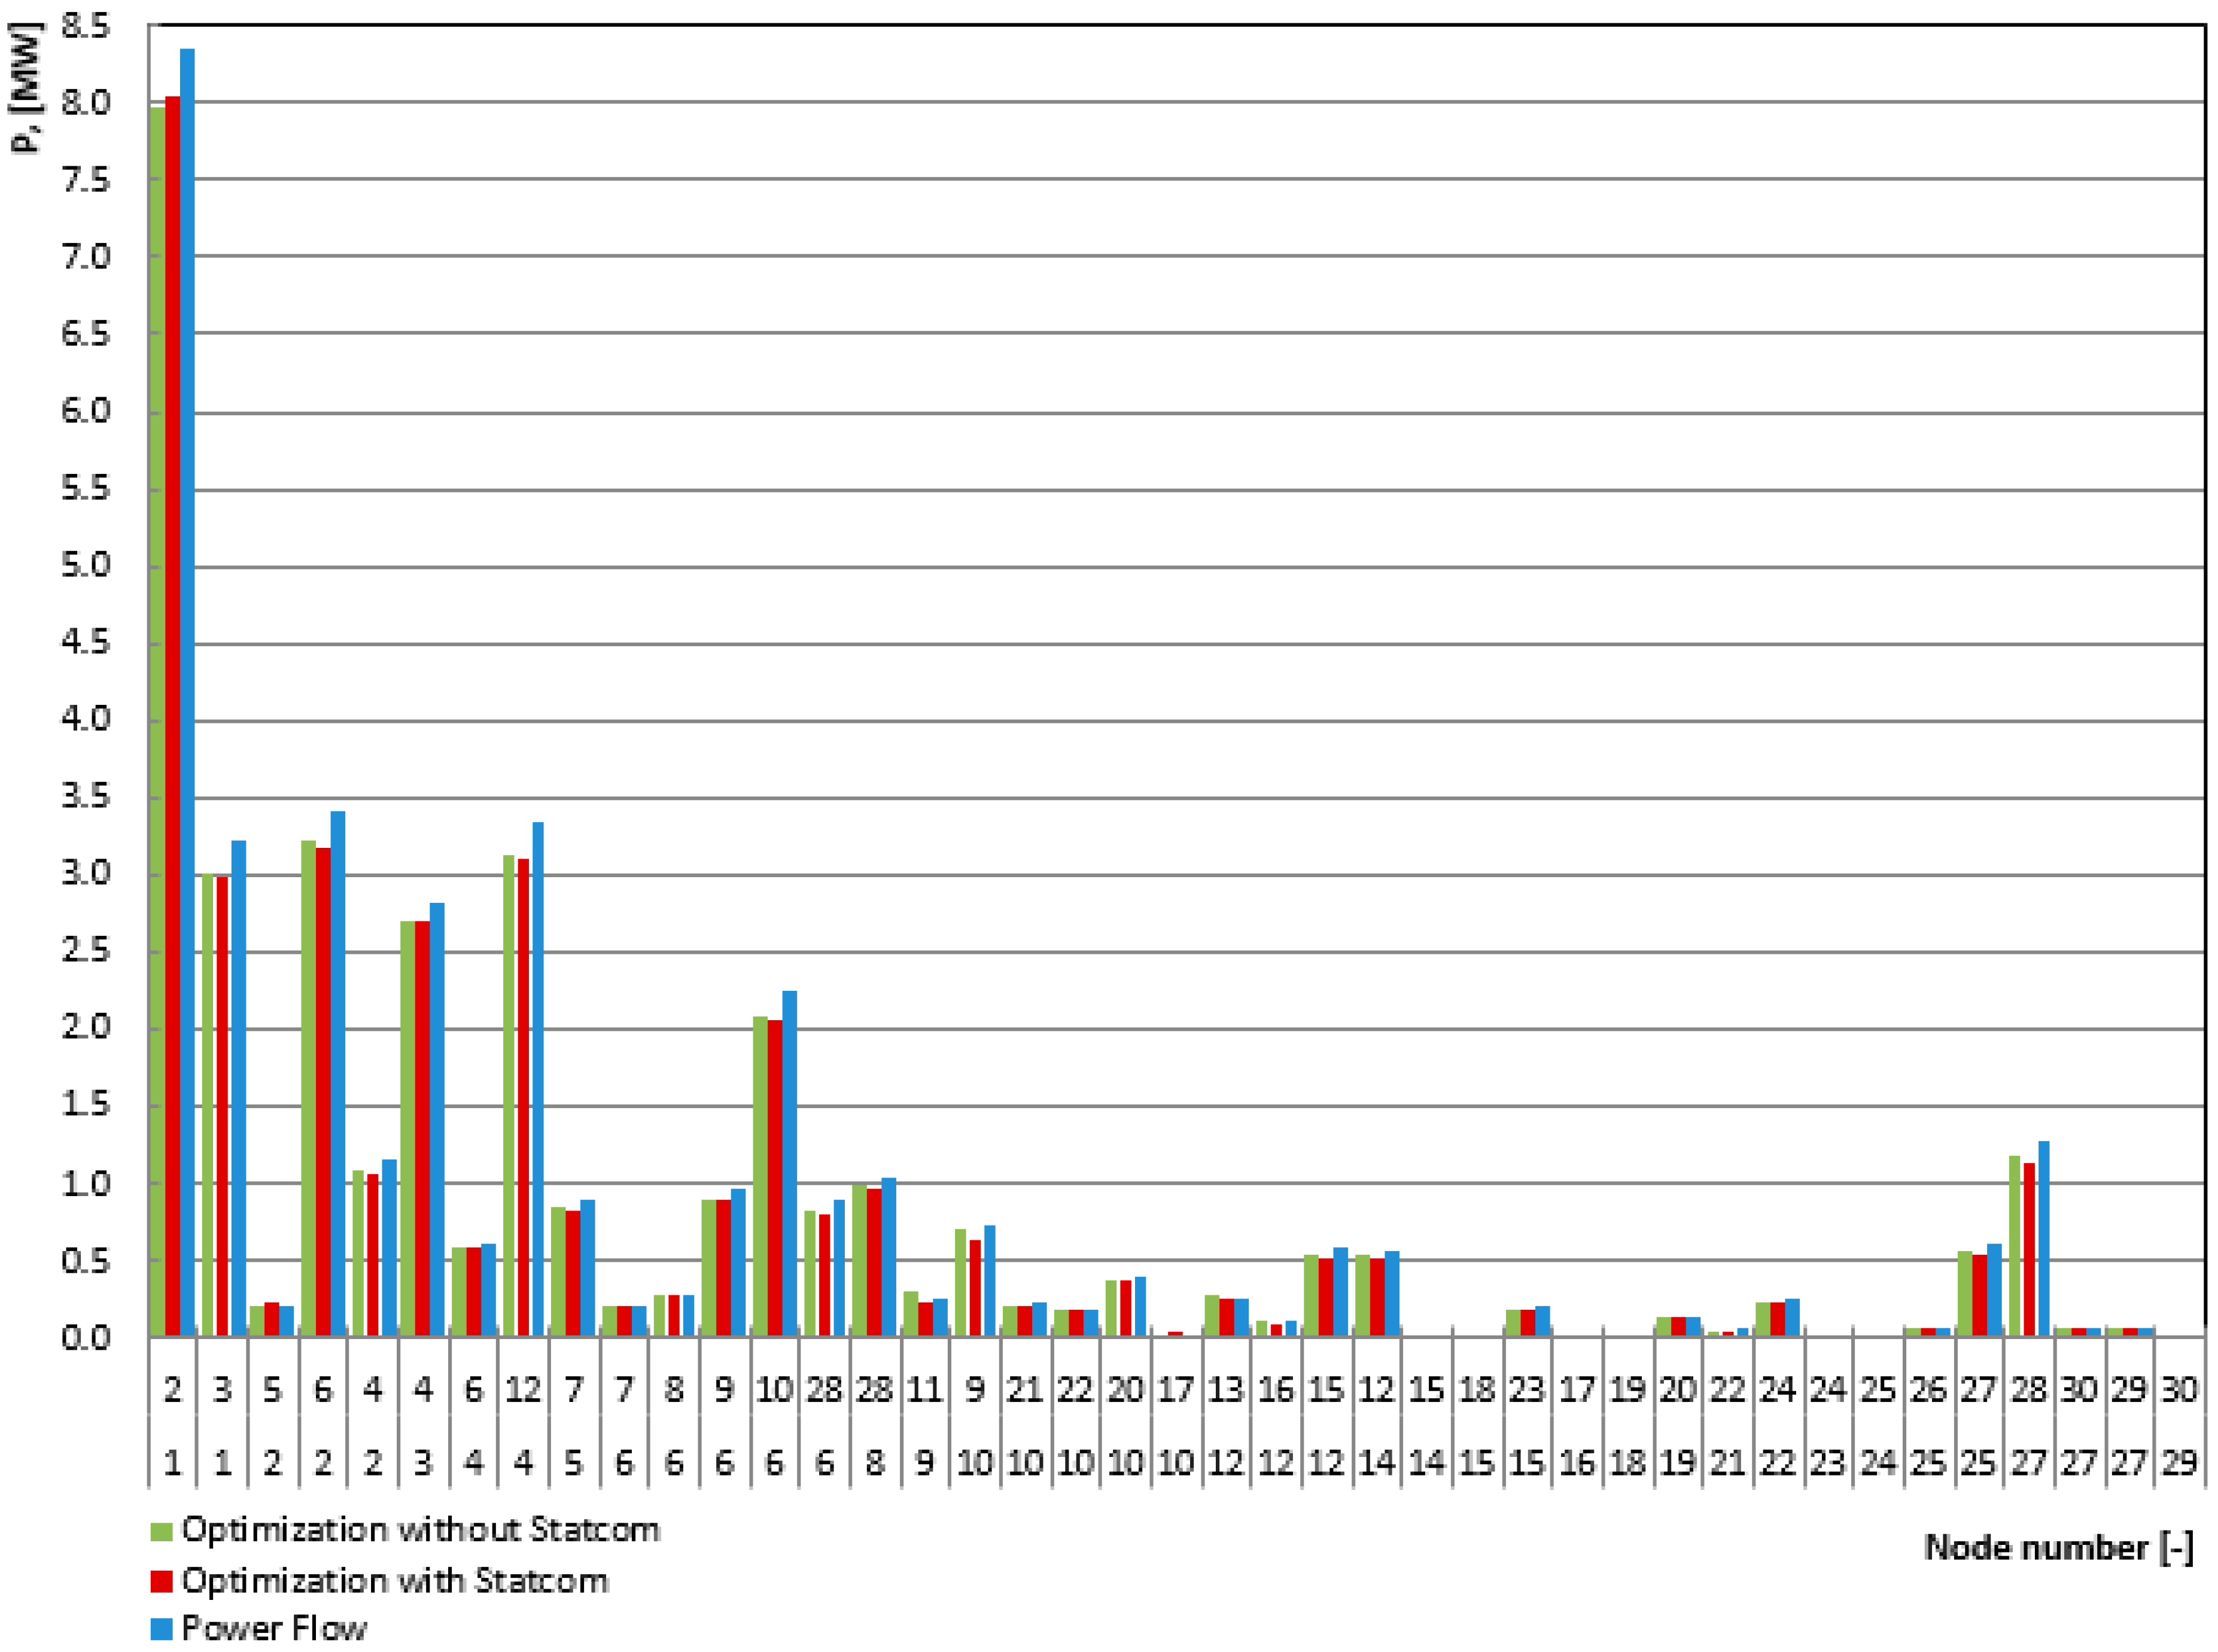
Exp. 3—optimization on min. active power losses in case of STATCOM in operation (green bars in
Figure 11 and
Figure 12). The total active power losses were 33,491 MW. Thе mаximum compеnsаtеd rеаctivе powеr in this nodе 10 is 19,138 MVАr. The use of the STATCOM device helps us manage the voltage level in nodes (as seen in
Figure 11), perform reactive power compensation and also reduce power losses in the system. Data are summarized in
Table 4.
The simulation results summary is shown in
Table 5.
4. Conclusions/Discussion
We have developed a new method based on the particle swarm optimization algorithm for reducing power losses and voltage control in nodes. Using this method, utilities can follow and predict power system conditions. Using the combination of a mathematical algorithm with a static device such as a STATCOM, we are able to provide the control of the voltage at the node to which the device is connected and also it is possible to reduce active power losses. This method can be used as the solution for optimal power flow tasks for distribution companies. In future research, we plan to research an algorithm that can provide these calculations in a real time. Analysis of the transient processes of the simplest power system equipped with FACTS devices, allow us to assess the reliability of the developed methods. The transient graphs presented in the work prove not only a significant improvement in the mode of operation of the system with compensating devices, but also the correctness of the simulation, developed in the thesis.
The present research shows the use of a STATCOM device in normal and emergency modes, while also displaying successful solution of problems of voltage regulation and system stability. Studies have confirmed the high performance of the STATCOM with the designed control system that allows it to work in emergency and post-emergency modes. Using particle swarm optimization, we can see the potential of using this method in power grids to improve their operation and selected criteria. The case study takes in consideration extraordinary states including n-1 criteria for generator operation.
Each author [
6,
8,
9] using STATCOM devises with different optimization techniques is trying to achieve different goals: using the STATCOM for unbalanced network, optimal allocation of STATCOMs using empirical data, placement of STATCOMs for the voltage stability. All researches show us great application in wide range of power system tasks. Our research is also one of the possibilities to provide solution for power losses minimization in OPF tasks and achieve the safe and stable operation of power networks.


