Article

Schedule Modeling to Estimate Typical Construction Durations and Areas of Risk for 1000 MW Ultra-Critical Coal-Fired Power Plants

1
Korea East-West Power Agency Company, Ulsan 44543, Korea
2
Graduate Institute of Ferrous Technology & Graduate School of Engineering Mastership, Pohang University of Science and Technology (POSTECH), Pohang 37673, Korea
3
Construction Engineering and Management, Department of Civil, Environmental and Architectural Engineering, University of Colorado, Boulder, CO 80309-0428, USA
*
Author to whom correspondence should be addressed.
Energies 2018, 11(10), 2850; https://doi.org/10.3390/en11102850
Submission received: 3 October 2018 / Revised: 18 October 2018 / Accepted: 19 October 2018 / Published: 22 October 2018
(This article belongs to the Special Issue Energy Policy in South Korea)

Abstract

:
To date, Korea has built four 1000 MW gross-power ultra-critical coal-fired power plants. With the introduction of this new power plant type, there is a need for the development of best practices and lessons learned associated with its construction. One such need identified as a gap in literature is the early project planning estimation of project duration. To fill this research gap, this study utilized the Program Evaluation and Review Technique/Critical Path Method (PERT/CPM) and Monte Carlo simulations for estimating the appropriate construction duration at the planning stage of a new 1000 MW class coal-fired power plant project. Through the case study of the four Korean ultra-critical coal-fired power plants in operation, there was found an 85% likelihood of construction duration to be between 64 and 68 months. From interviews with subject matter experts, the most significant risk factors were found to be labor strikes and construction safety incidents. The findings within aid early planning decision makers by providing a replicable and accurate schedule estimation process. While the findings are based on Korean power plants, the results of this research can be used as a tool for coal-fired power plant construction schedule estimation worldwide.

1. Introduction

South Korea is facing major difficulties in meeting the ever-growing electricity needs of their population [1]. While worldwide increases in environmental regulations have led nations to consider nuclear and alternative power generation sources, these energy sources have not yet gained the necessary efficiencies to be a country’s sole-source supply of energy [1]. Therefore, nations are looking to traditional electrical power plants with increased efficiencies to meet their electricity demands [1]. In fulfilment of this need, construction on ultra-critical 1000 MW coal-fired electrical power plants have begun worldwide throughout the last decade [2]. A power plant is considered ultra-critical when it operates at a minimum pressure of 30 MPA and temperature 610 °C [3]. Increasing the temperature and pressure of these systems improves efficiency of the power plants, equating to a reduction in the emission of carbon dioxide, a greenhouse gas. Thus, ultra-critical power plants are both more efficient and eco-friendlier than the more traditional subcritical or supercritical power plants [3].
As the next evolution of coal-fired power plants, ultra-critical power generation has been a focus of multiple research endeavors. Existing literature has focused on the material engineering challenges [4,5], operational efficiencies [5,6,7,8,9], financial assessments [10,11,12,13], and environmental efficiencies [14,15,16] of ultra-critical power plants. A majority of these publications have covered the engineering, design, and operational portions of a power plant’s life-cycle, but often neglect the construction phase (discussed in greater detail in Section 1.1). This represents a significant literature gap as the construction phase of ultra-critical power plants can be upwards of $3B USD [13]. This study aimed to fill this research gap by investigating the construction duration of ultra-critical power plants; collecting data from four ultra-critical and five super-critical coal-fired power plants, and ten subject matter experts concerning major schedule and risk factors. The Program Evaluation Review Technique/Critical Path Method (PERT/CPM) and Monte Carlo simulation were used to analyze the data in an attempt to incorporate activity duration uncertainty. A discussion of the existing literature within the field of ultra-critical power plants and PERT/CPM analyses are summarized below.

1.1. Coal-Fired Power Generation Existing Literature

Running ultra-critical power plants at such extreme pressures and temperatures for long durations places significant strain on the equipment materials, specifically the boiler and turbines, and requires specialized operational procedures [4]. As such, the design, material, fuel consumption, and overall operability of ultra-critical power plants have been a common focus within existing literature [3,5,6,7,8,9]. Tumanovskii et al. [3] outlines an overview of the energy solutions that have developed to allow the existence of ultra-critical power plants, focusing on the extreme steam conditions’ correlation to increased efficiency and the need for more resilient machinery materials. Di Gianfrancesco [5] and Zhang [6] went a step further in their books, focusing on the engineering, operation, materials, and performance of ultra-critical coal power plants. These publications contain no research methods, but present design and operational procedures and best practices for industry [5,6].
Starkloff et al. [7] investigated how coal-fired systems will handle malfunction cases, simulating a plant blackout. Through the developed model, they were able to create an optimized master fuel trip scenario which minimizes any impact a blackout scenario may have on the operational processes. Hou et al. [2] went beyond identifying operational practices, presenting a model with the capability of optimization. The model presented more accurately predicts the multi-variable coordinated control system (CCS) of an ultra-critical coal-fired power plant, which control the boiler and turbine operations. Hou et al.’s nonlinear model was found to have a great approximation capability to represent the CCS, with the future potential to optimize the overall ultra-critical power plant control and operations [2].
Stępczyńska et al. [8] discussed design solutions to improve the overall efficiency of an ultra-critical coal-fired power plant. They proposed the application of a double steam reheat, finding an improvement to power unit efficiency of 1.1% [8]. Bugge et al. [9] presented the potential futures of coal-fired power plants, discussing steam conditions with temperatures upwards of 700 °C. They theorized that a 700 °C steam power plant, in combination with biomass, could reduce greenhouse gas emissions by as much as 40% [9]. Concerning this benefit of decreased greenhouse gas emissions, Lim et al. [14] found that coal generates two times more carbon dioxide than natural guess. From a survey of South Korean homeowners, they found that the general populous would support the associated increase in cost to change from coal-fired to natural gas power production [14]. While this is an interesting study proposing the decrease in coal-fired power generation in the future, it does not consider political or economic factors promoting the private and public industries in pursuing coal-fired power plants. In contrast to Lim et al.’s [14] findings, Yan et al. [15] and Fan et al. [16] discussed the energy-related carbon dioxide emission driving factors and presented ultra-critical coal-fired power generation as “the most convenient solution to address carbon dioxide mitigation”.
Although the above operational and environmental advantages of ultra-critical power plants have been cited, there is still an enormous cost to build and operate such a plant [13]. As such, there has also been literature dedicated to financial viability assessments of ultra-critical power plant investments [10,11,12,13]. Hong and Lee [10] presented a flexible design methodology that aids decision makers to maximize their life-cycle profitability. By integrating equipment costs into early design decision making, they estimated a potential life-cycle savings of $1.24M USD, net present value. Alternatively, Phillips and Wheeldon [11] compared the life-cycle costs of subcritical, super critical, and ultra-critical power plants, finding the ultra-critical power plant to be a slightly more expensive option if greenhouse gas emission charges were ignored. However, with the inclusion of carbon taxes, the ultra-critical power plants become economically viable [11].
The above represents all literature concerning ultra-critical power plants found by the authors through an extensive literature review. As can be seen, there are no academic publications that discuss the construction process, equating to a significant gap in the existing body of knowledge. There does exist at least two reports developed by private entities concerning the ultra-critical coal-fired power plant construction process. Hasler et al. [13] developed a report for the US Environmental Protection Agency, providing a comprehensive explanation of the performance and cost estimations of new coal-fired power plants, including ultra-critical power plants. While the document provides decision-makers with early planning cost estimates, it lacks any detailed discussion on project scheduling. All discussions of scheduling within the document are limited to overall project duration [13]. The second private report was performed by Kyushu Electric Power Co. (Fukuoka Prefecture, Japan) [12]. They performed a case study on the construction of an ultra-critical coal-fired power plant built in Bac Lieu, Vietnam. Their findings included an evaluation of the environmental, social, economic, and scheduling impacts of the construction process. While informative, much of the information was at a high-level, not meant to provide aid to power plant decision makers. The scheduling section was especially brief, with the construction and installation work being reduced to a single line item [12].
As shown above, even when considering non-academic, publicly-available documents, there is a gap in the general body of knowledge concerning ultra-critical coal-fired power plant scheduling. This gap is of importance, as studies have found that planning and schedule deficiencies have the highest impact on cost performance [17] and are one of the most significant factors impacting delays [18,19]. This paper, therefore, seeks to fill this gap by investigating the schedule duration of ultra-critical power plants at an activity-level, including an assessment of areas of risks and their priorities. To attain this goal, the authors chose the PERT/CPM scheduling technique as a means to assess the acquired scheduling data, defended and described within the next section.

1.2. The Use of PERT/CPM and Uncertainty in Construction Literature

Based on a 2006 survey of US constructors and owners, nearly all contractors believed that there was an economic benefit to using the CPM method to calculate and monitor their schedules. They cited improved planning prior to work beginning and improved scheduling as the top advantage of CPM [20]. In an international study, contractor respondents cited CPM scheduling as a method of improving project performance monitoring and control [21]. As this study aimed to provide contractors and owners with a better understanding of the ultra-critical power plant duration, CPM scheduling is an apt tool for data analysis. Including the PERT analysis allows for the inclusion of uncertainty and risk analysis, another goal of this research [22]. Furthermore, the PERT/CPM scheduling method has been previously used within literature to perform tasks similar to those performed for this paper’s research: estimate project duration uncertainty for three-span bridge projects [23], perform risk assessment in construction schedules [24], calculate footbridge construction project duration [25], and calculate fast/accurate risk evaluations for scheduling of large-scale construction projects [26]. PERT analysis’ main limitation cited within literature is that it focuses on the critical path, potentially ignoring schedule-impacting uncertainties and risks in the non-critical path [27].

1.3. Point of Departure

As described and defended above, existing literature has not presented a schedule for the ultra-critical power plant construction process representing a gap within the existing body of knowledge. This research builds off of Kyushu Electric Power Co. [12] and Hasler et al. [13] reports on the construction processes of ultra-critical power plants. While they present thorough examples of ultra-critical power plant expected construction cost, they lack detailed discussions on construction scheduling. Creating a 1000 MW ultra-critical coal-fired power plant’s schedule is a challenge as there are very few ultra-critical coal-fired power plants worldwide [28]. As such, to fill this gap, the authors collected construction scheduling data from all four of Korea’s ultra-critical coal-fired power plants, five of the most recent super-critical coal-fired power plants [28], and ten subject matter experts to develop a construction schedule using the PERT/CPM method.

2. Materials and Methods

2.1. Data Collection

To develop the baseline construction schedule of coal-fired power plants, the authors performed case studies on four 1000 MW ultra-critical coal-fired power plants executed in Korea. Data collected from these projects included scheduling and risk factors. The four plants used for this study, their capacity, and planned versus actual construction durations are shown in Table 1.
The above case studies are apt means of providing scheduling data for the schedule and risk factors of a 1000 MW coal-fired power plant, the focus of this study. However, their construction was not performed by Korean contractors and available data are limited to the owner’s perspective. To supplement these limitations, the authors also reached out to Korean “Company A” to collect data on 500 MW and 800 MW thermal power plants they constructed in Korea. These are outlined in Table 2.
From the above nine projects, the authors reached out to ten experts in the construction of 1000 MW coal-fired power plants. The experts were limited to those currently constructing a 1000 MW coal-fired thermal power plant, seven of ten having over ten years of experience. The contents of the question on construction duration were divided according to the three stages of construction: general information related to the construction industry, predicted construction durations, and investigation of the risk factors affecting the duration. Where necessary, follow up interviews were also performed to supplement and/or clarify survey findings [29].

2.2. Research Methodology

For this study, the development of the 1000 MW schedule and related risk factors included the following research steps:
RS.1 Identify schedule activities: From case studies, the various process data of 1000 MW coal-fired power plant construction were analyzed, and a basic process model was derived. In assessing the schedules of the nine case studies, the authors identified 21 high-level activities that encompassed the entire construction process. These were used to calculate the project duration and are shown in Table 3.
RS.2 Define three points of activity durations: From the project case studies, the most likely durations are identified, as shown in the Appendix (Table A1). From the survey responses, optimistic and pessimistic durations are identified, as shown in the Appendix (Table A2 and Table A3). The optimistic estimate is the shortest expected duration to complete the task. The most likely estimate is the duration over which the task can be completed considering the availability of the given resources, its productivity, and realistic resources. Finally, the pessimistic estimate is the expected longest duration within which the task can be completed. This process is as dictated by the PERT estimation method [30].
RS.3 Calculate three-point weighted average activity durations: Using the three points of activity duration identified above, the expected duration is calculated. This was calculated using Equation (1), as dictated by the PERT estimation method [30].
t e = t o + 4 t m + t p 6 ,
where te denotes the weighted average of expected activity durations (in months); to denotes the optimistic activity duration (in months); tm denotes the most likely activity duration (in months); and tp denotes the pessimistic activity duration (in months).
RS.4 Identify critical path: From the expected activity durations, and in using MS Project scheduling software, the critical activities were identified.
RS.5 Calculate schedule durations using PERT Method: Using the PERT method, a simulation was performed on the estimated working durations using the estimated activity duration and standard deviation. The statistical formula of the PERT method follows a beta distribution or a bell curve. The area under the distribution curve refers to the probabilities, which were calculated according to the range of the sample. The probability that the sample is distributed in the range ±1σ (standard deviation) is 68%, the probability that the sample is distributed in the range ±2σ is 95%, and the probability that the sample is distributed in the range ±3σ is 99%. The standard deviation is calculated using Equation (2) [30].
σ = t p t o 6 ,
where σ denotes the standard deviation (in months); to denotes the optimistic activity duration (in months); and tp denotes the pessimistic activity duration (in months).
To calculate probabilities for the total project, the standard deviation for the entire project duration is required. The calculation uses all activities which fall within the critical path and is executed as shown in Equation (3) [30].
σ c p = σ 1 2 + σ 2 2 + σ 3 2 + + σ n 2 ,
where σcp denotes the standard deviation of critical path (in months) and σ1,2,3…n denotes the standard deviation of activity 1, 2, 3… n (in months).
The weighted average expected activity durations obtained in Equation (1) are 50% of the actual mean value on the distribution curve, which means that the probability of completion of the task within the estimated work time by PERT is 50%. With the standard deviation of the critical path calculated, it is possible to estimate the duration through a normal distribution curve or a beta distribution curve in a stochastic manner. If the entire operation needs to be completed with a 98% completion probability, the estimated duration is calculated as Equation (5). To increase the accuracy of the outputs to 98%, Equation (1) is increased by +2σ. Standard deviation is calculated as Equation (4) [30].
T c p = t c p + 2 σ c p ,
where Tcp denotes the 98% likelihood of expected activity duration of the critical path (in months); tp denotes the pessimistic activity duration (in months); and σcp denotes the standard deviation of critical path (in months).
RS.6 Simulate schedule durations: Using the @Risk Microsoft Excel Add-On, the authors performed a Monte Carlo simulation. The program uses a triangular distribution, as defined by the PERT estimation method [30], assuming a 25%, 50%, and 25% chance of the optimistic, most likely, and pessimistic durations (RS.3) occurring, respectively. From these parameters, the project duration is calculated from the summation of critical activity durations 1000 times producing a curve of potential project durations. From this analysis, the activities that have the greatest impact on project schedule are also identified.
RS.7 Identify risk factors and influence: Finally, from the survey and interview results, risks and their impact, influence, and priorities were identified. The expert survey responders were asked to identify and list the probability (importance) and magnitude of impact (influence) risks potentially experienced during construction. To quantify the risks for comparison, the authors multiplied the probability by the rated impact, both scored from 0 to 1 [31]. This formula can be seen below in Equation (5).
R i s k   I m p a c t = I m p o r t a n c e × I n f l u e n c e
The associated scoring was then graphed onto an importance-influence matrix, as seen in Figure 1, below, modified from the Project Management Body of Knowledge [21] As can be seen, if the importance of a risk and the influence on the project are both low, the risk is regarded as a low risk, and the opposite case will be a high risk. The vertical axis indicates the probability of occurrence (importance) and the horizontal axis represents the impact of the risk (influence) on the project. The intersection of possibilities and influences is calculated by multiplying the numerical values of the two criteria called the risk score. The score ranges are as follows: from 0.01 to 0.07 for Low Risk, from 0.09 to 0.35 for Moderate Risk, and from 0.45 to 0.81 for High Risk.

3. Results

Using the three-point weighted average formula (Equation (1)) and the average optimistic, most likely, and pessimistic values in Table A1, Table A2 and Table A3, the estimated average expected durations (te) are calculated. The results are shown in Table 4. These values are used as an input to schedule software to calculate the overall project duration and critical path and the PERT/CPM duration calculation, both shown below.
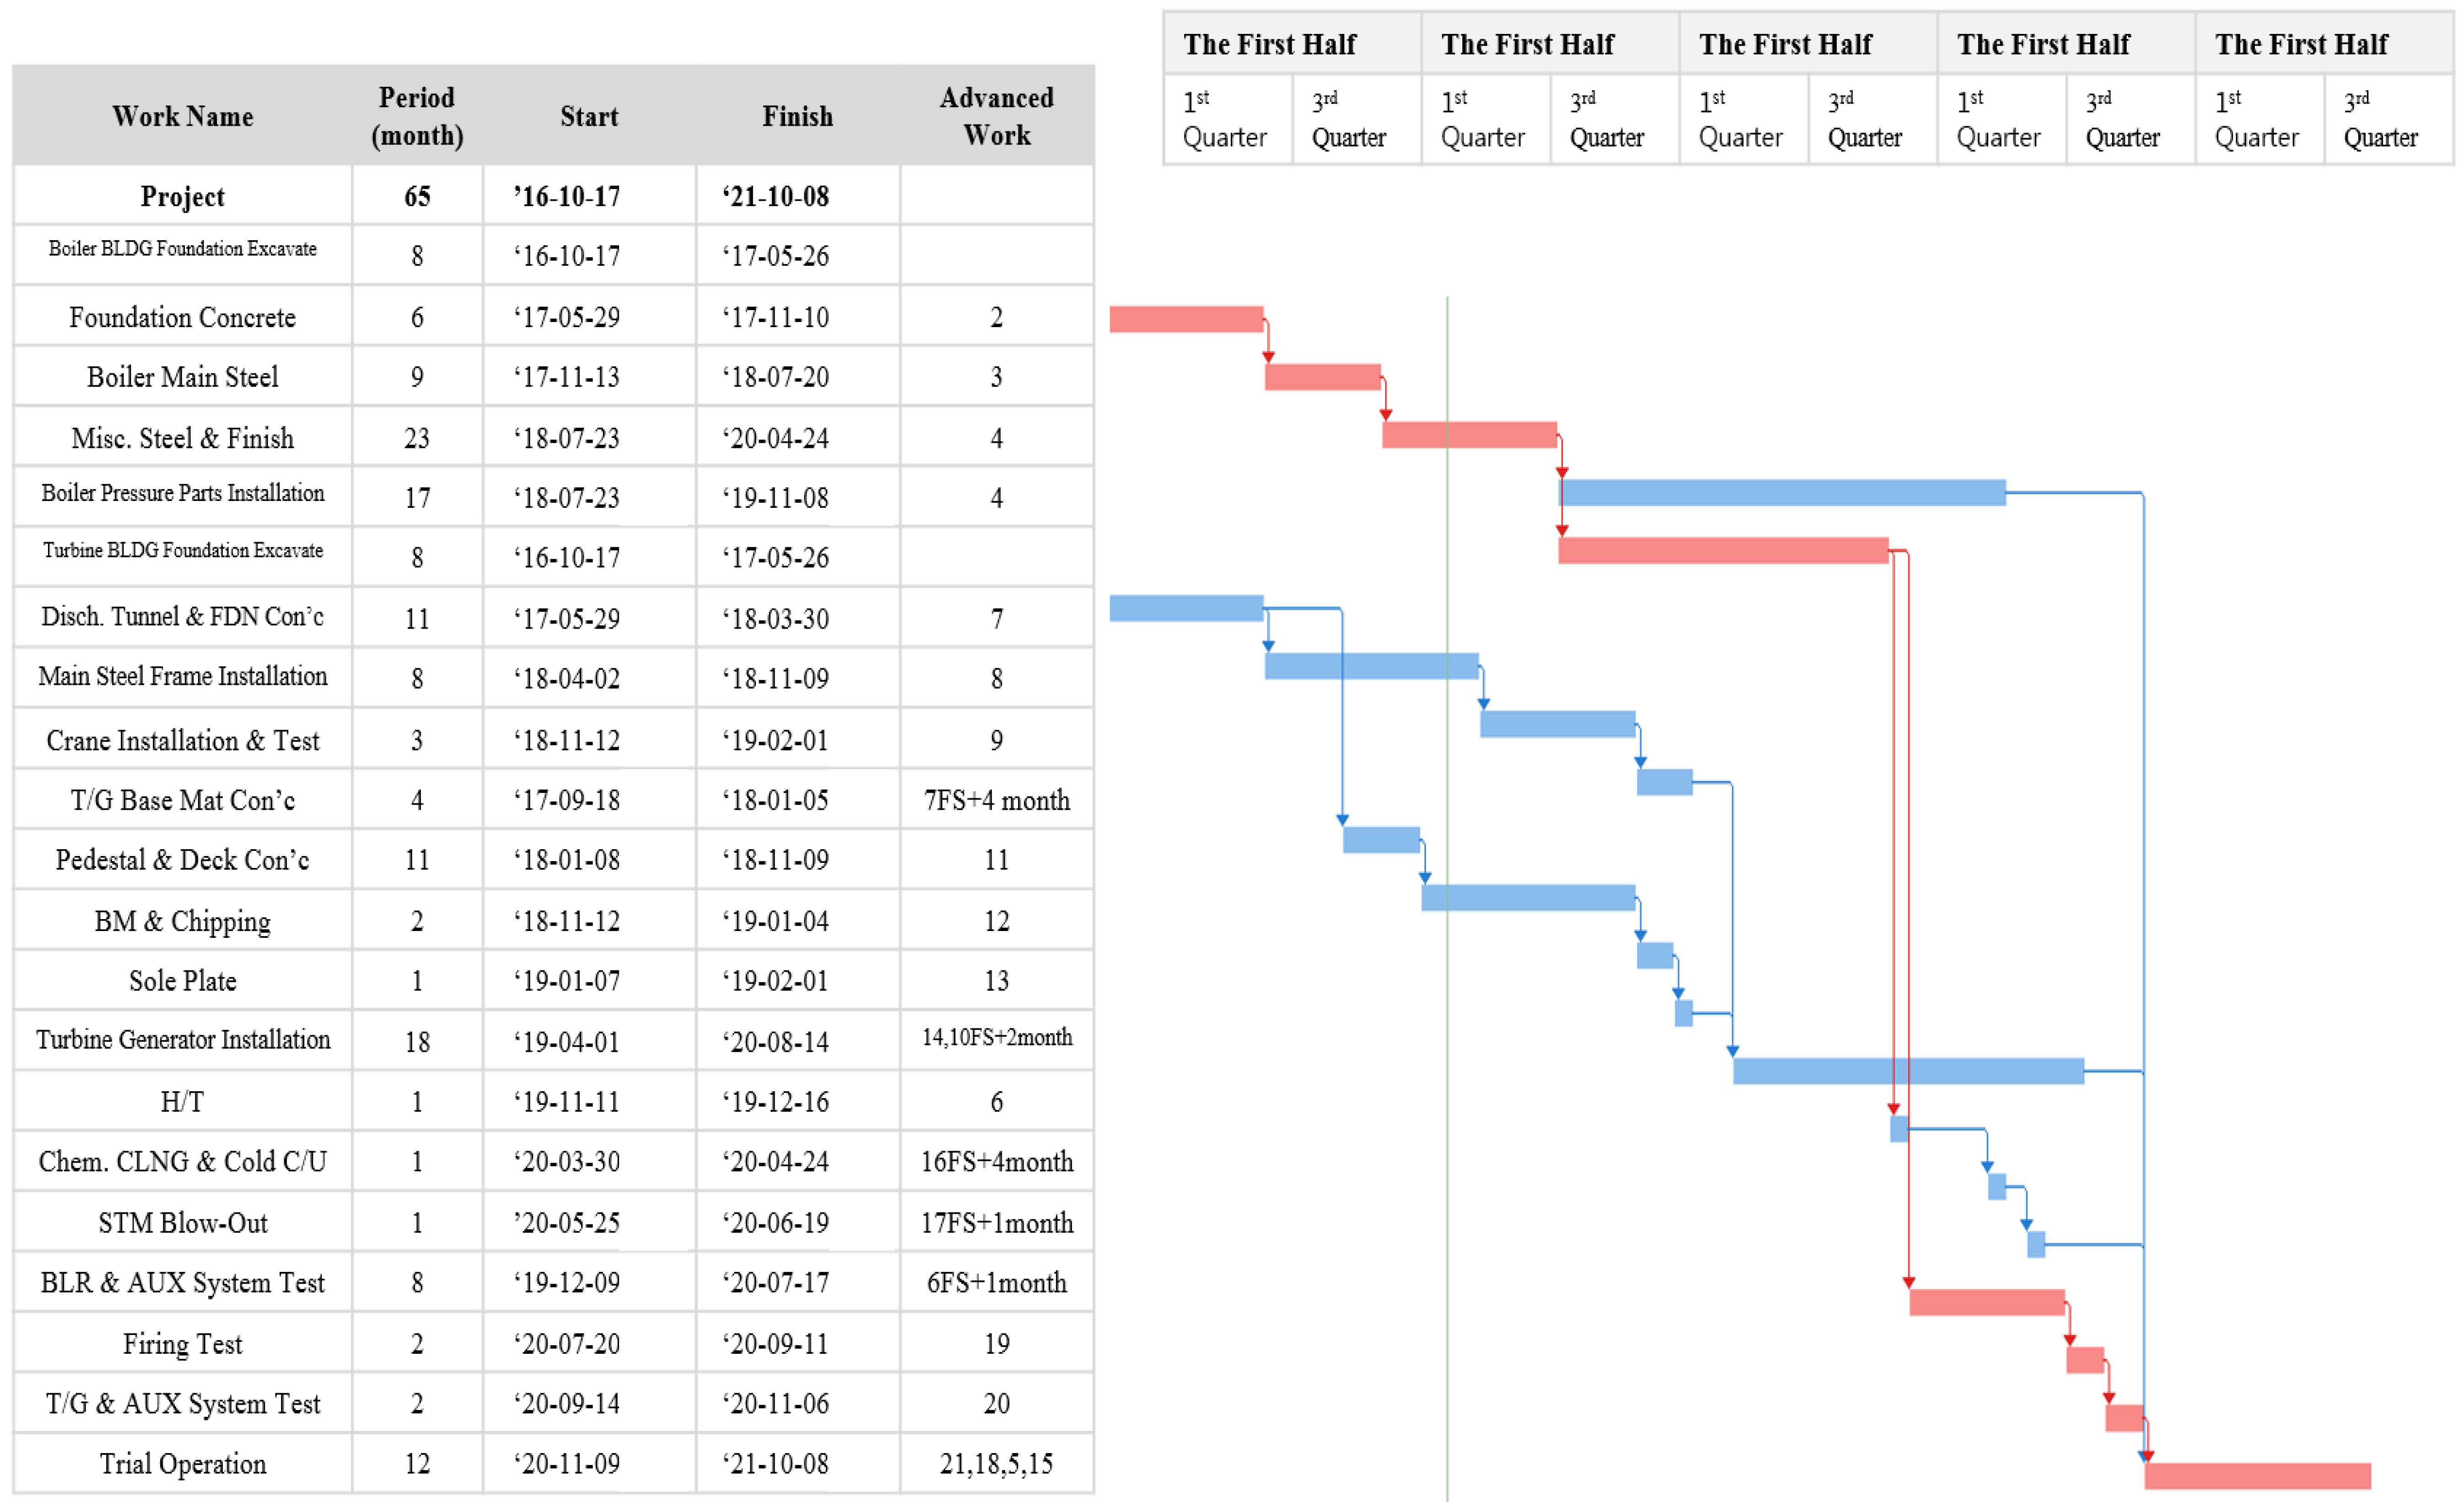
To estimate the schedule using the PERT/CPM method, it is necessary to calculate the critical path. The critical path is the activities which constitute the longest work path for project completion. The activity relations were based on survey responses. The activities and their relations were input into MS Project software, using the most likely durations. Figure 2 shows the MS Project output and critical path activities (bar chart durations shown in red).
The critical path using the most likely activity durations with a total of 0 float, is 65 months. This estimation has a probability of 50% on the PERT beta distribution curve, as stated above. Using the PERT method of duration estimation (Equations (3) and (4)), the duration with a 98% likelihood is 67.4 months. Table 5 shows the variables used to achieve this value.
Using the @Risk Monte Carlo software (Microsoft Excel 2016), the authors simulated 1000 projects based on the software’s value at risk assessment [32]. Figure 3 depicts the results of this simulation and depicts the minimum project duration of 62.6 months, maximum 70.7 months, and average 66.1 months. However, with this type of analysis, often the project duration range that is 85% likely is of interest. In observing Figure 3, it is seen that that the shortest project is about 64 months (64.05) with 85% completion probability, and the longest process is about 68 months (68.3). This is to be expected given the duration ranges of executed projects shown in Table 1.
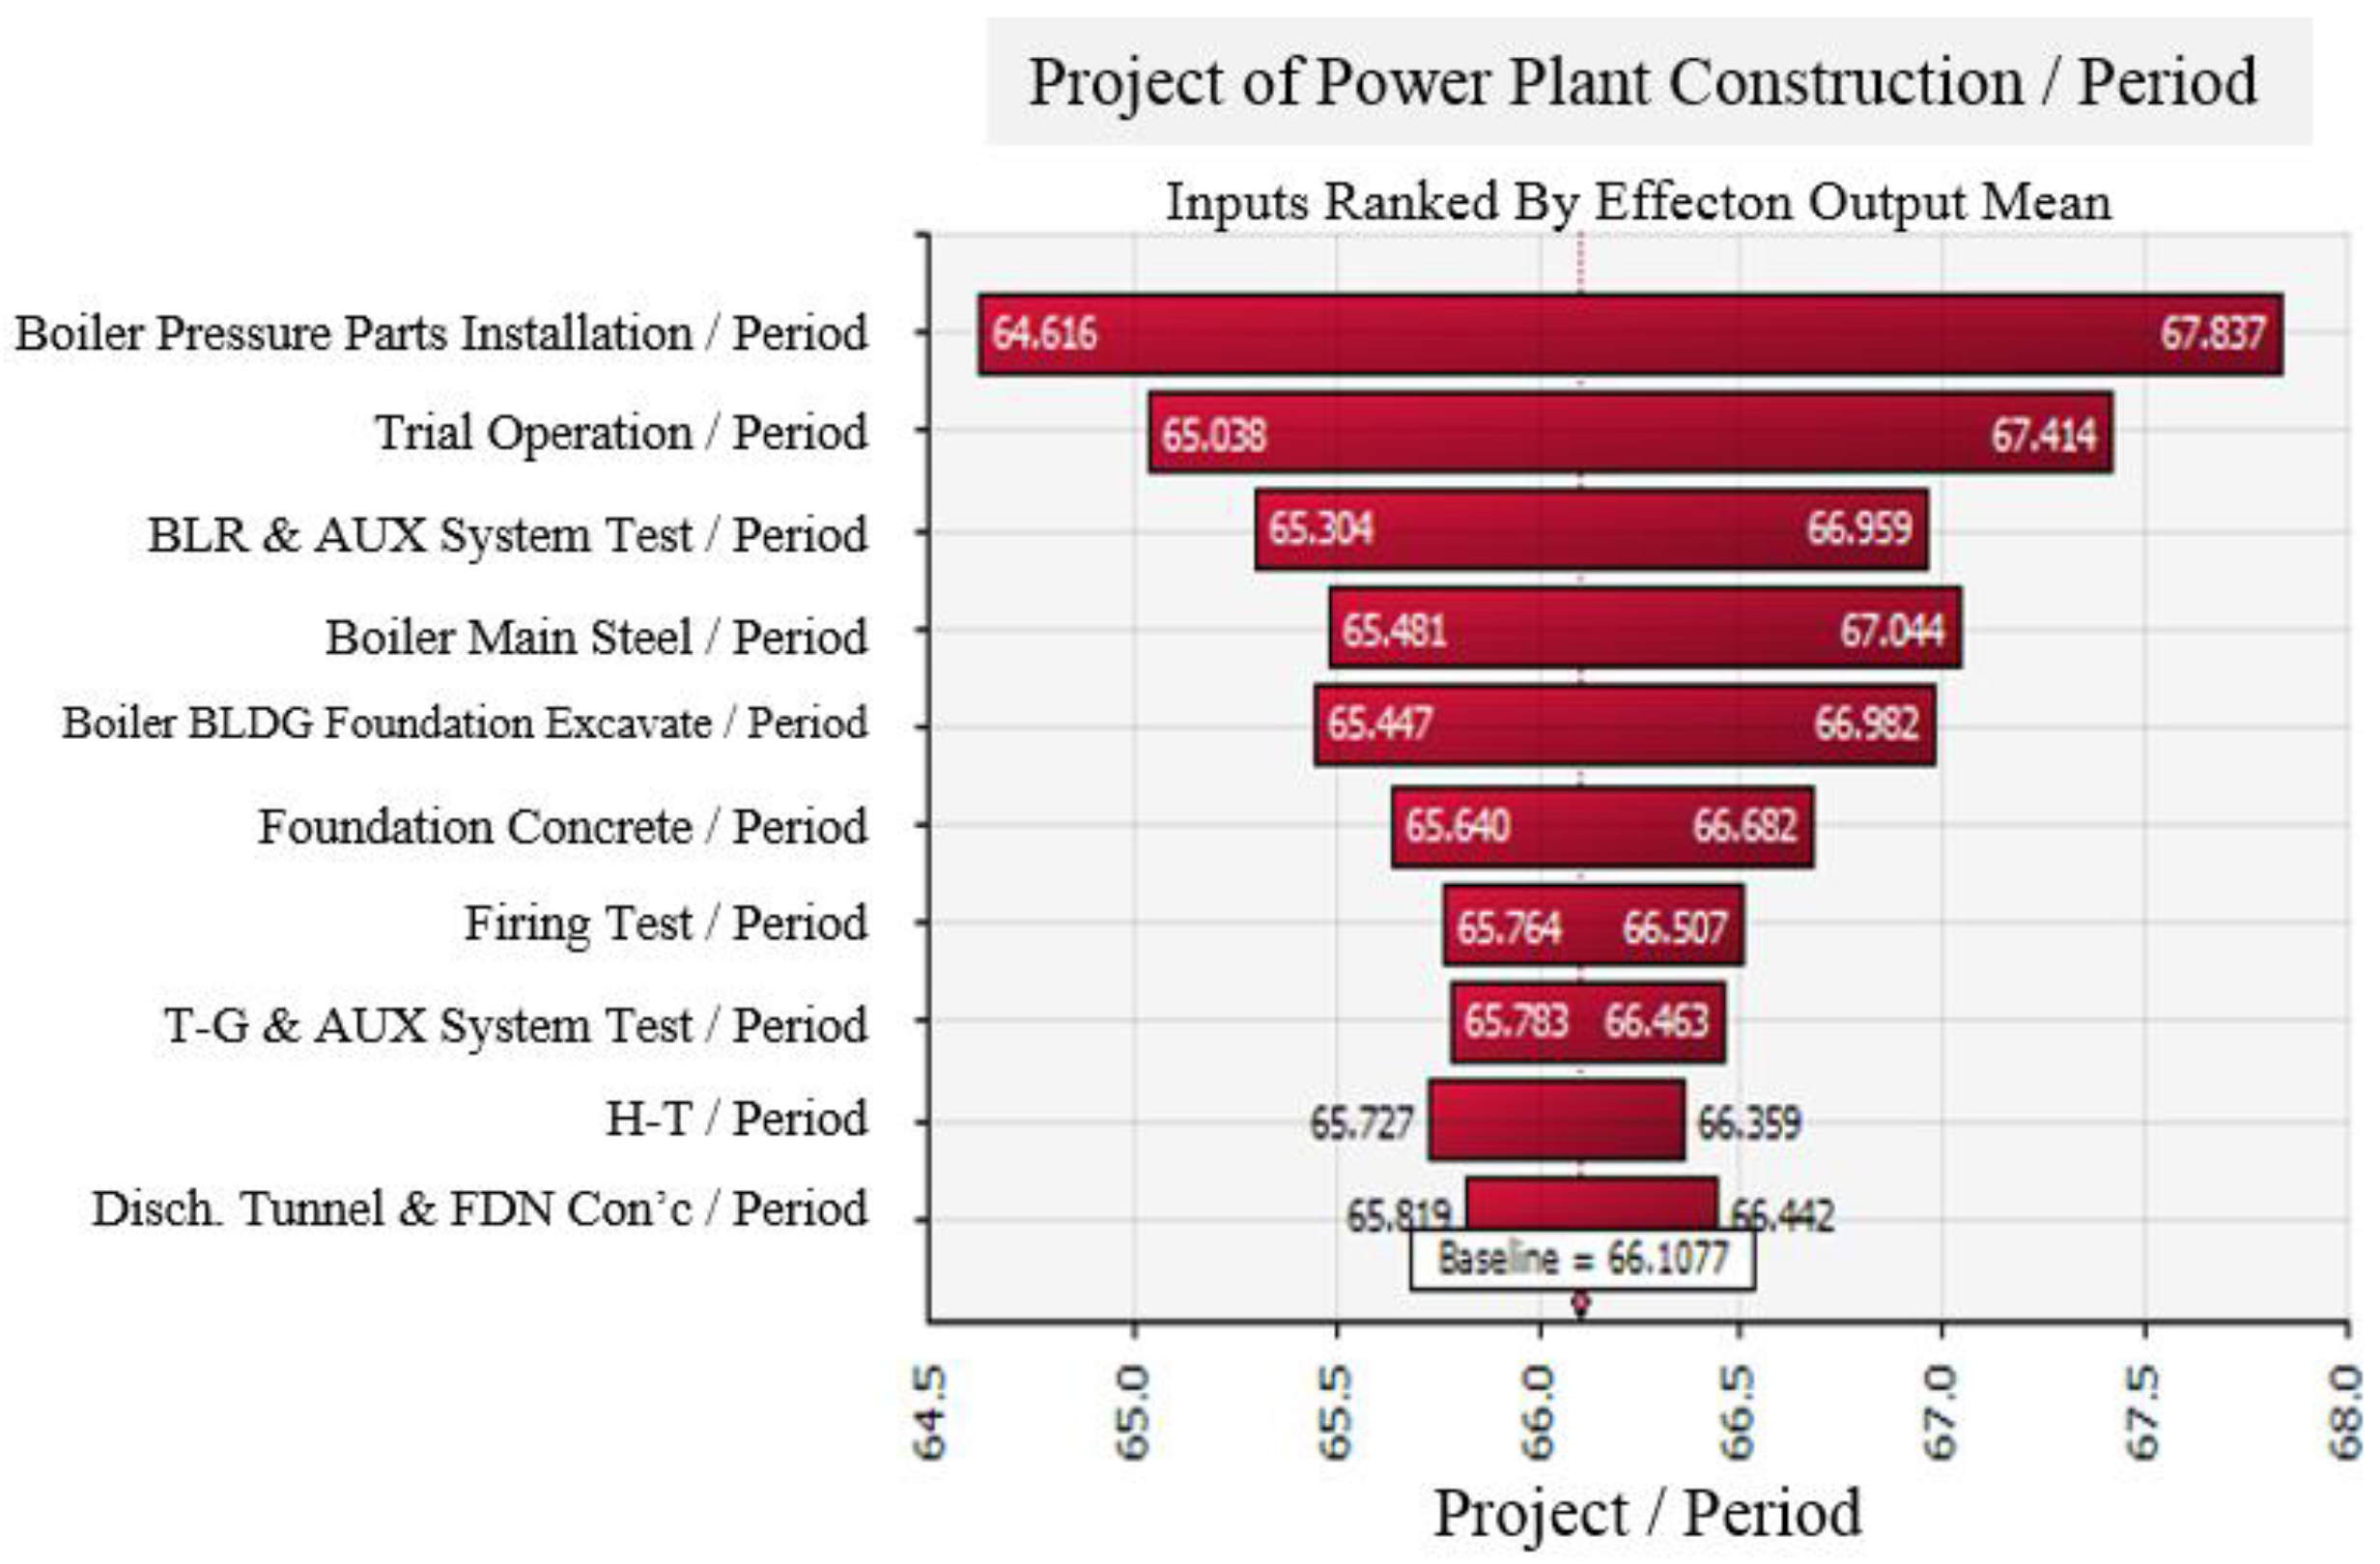
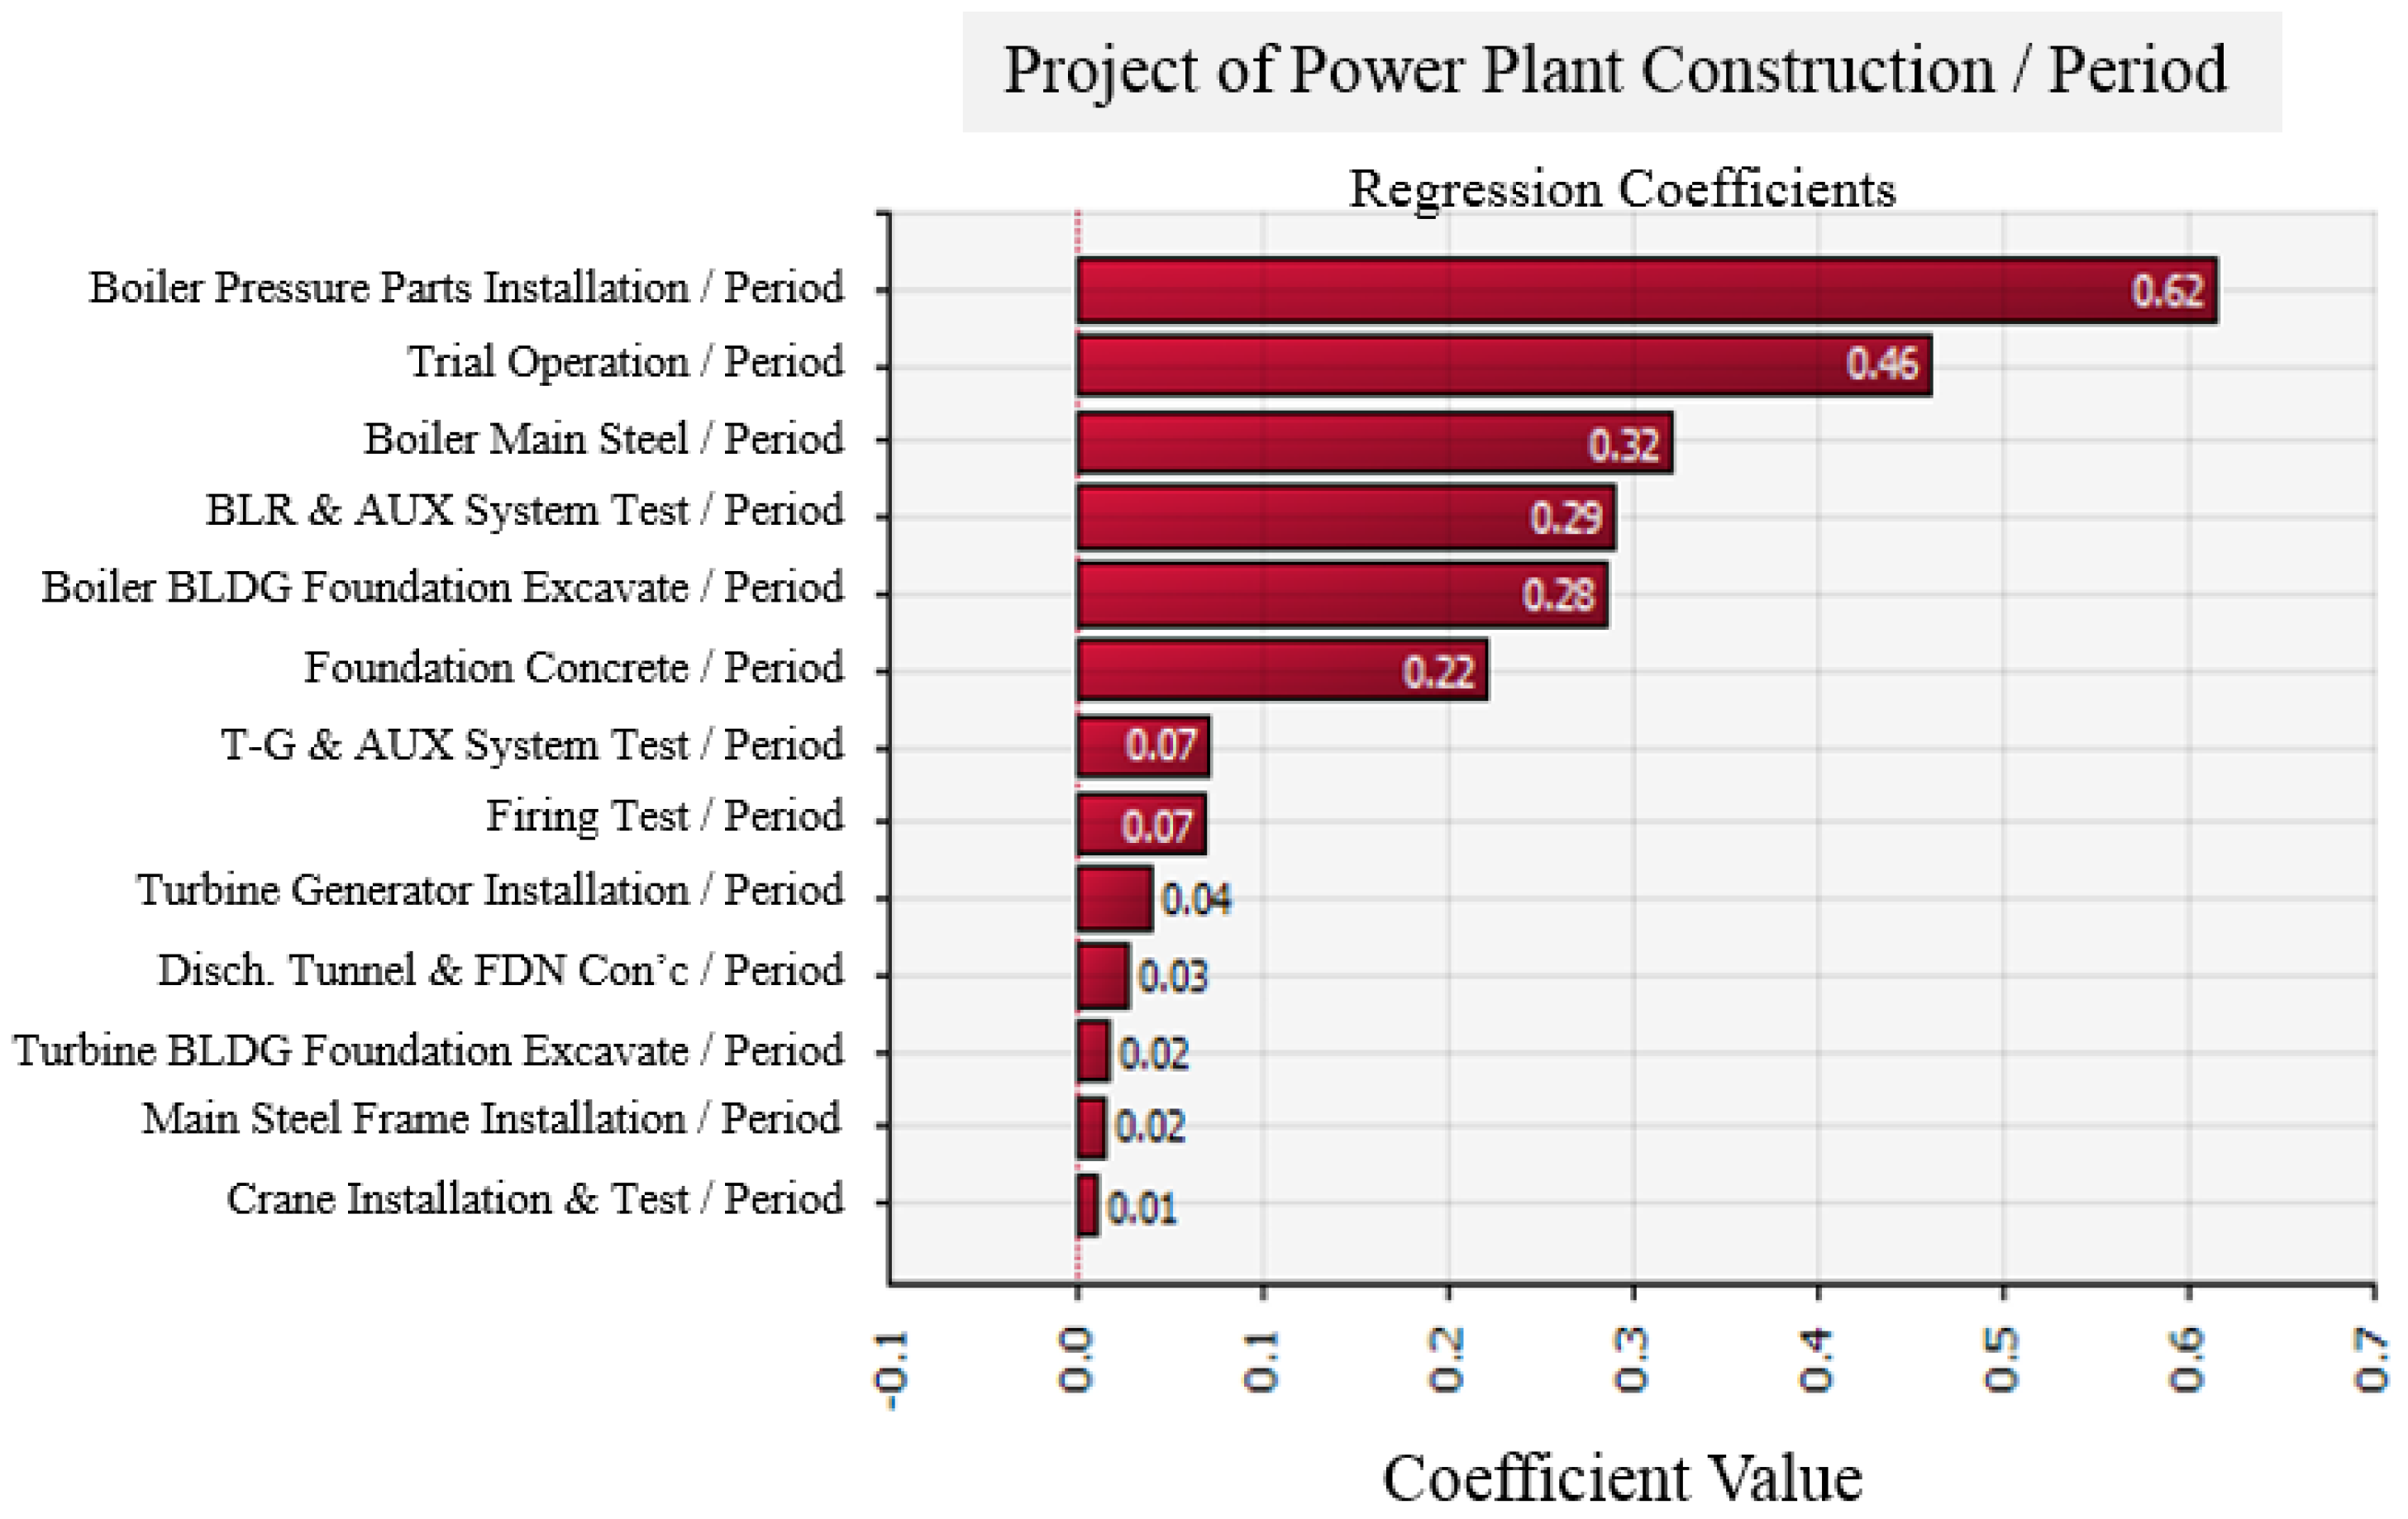
The simulation software also calculates a sensitivity analysis, which depicts the activities which have the greatest influence on the duration on the construction project. The results are shown in Figure 4 and Figure 5. As can be seen, the boiler pressure installation and trial operation have the greatest impacts on project schedule. Figure 4 depicts the range of impact the activity has on project durations and Figure 5 shows the correlation strength between the activity and overall duration.
The second research goal is to identify and quantify the potential risk factors existent in ultra-critical coal-fired power plant construction. The associated scores for the risk factors based on the surveys can be seen in Table 6.
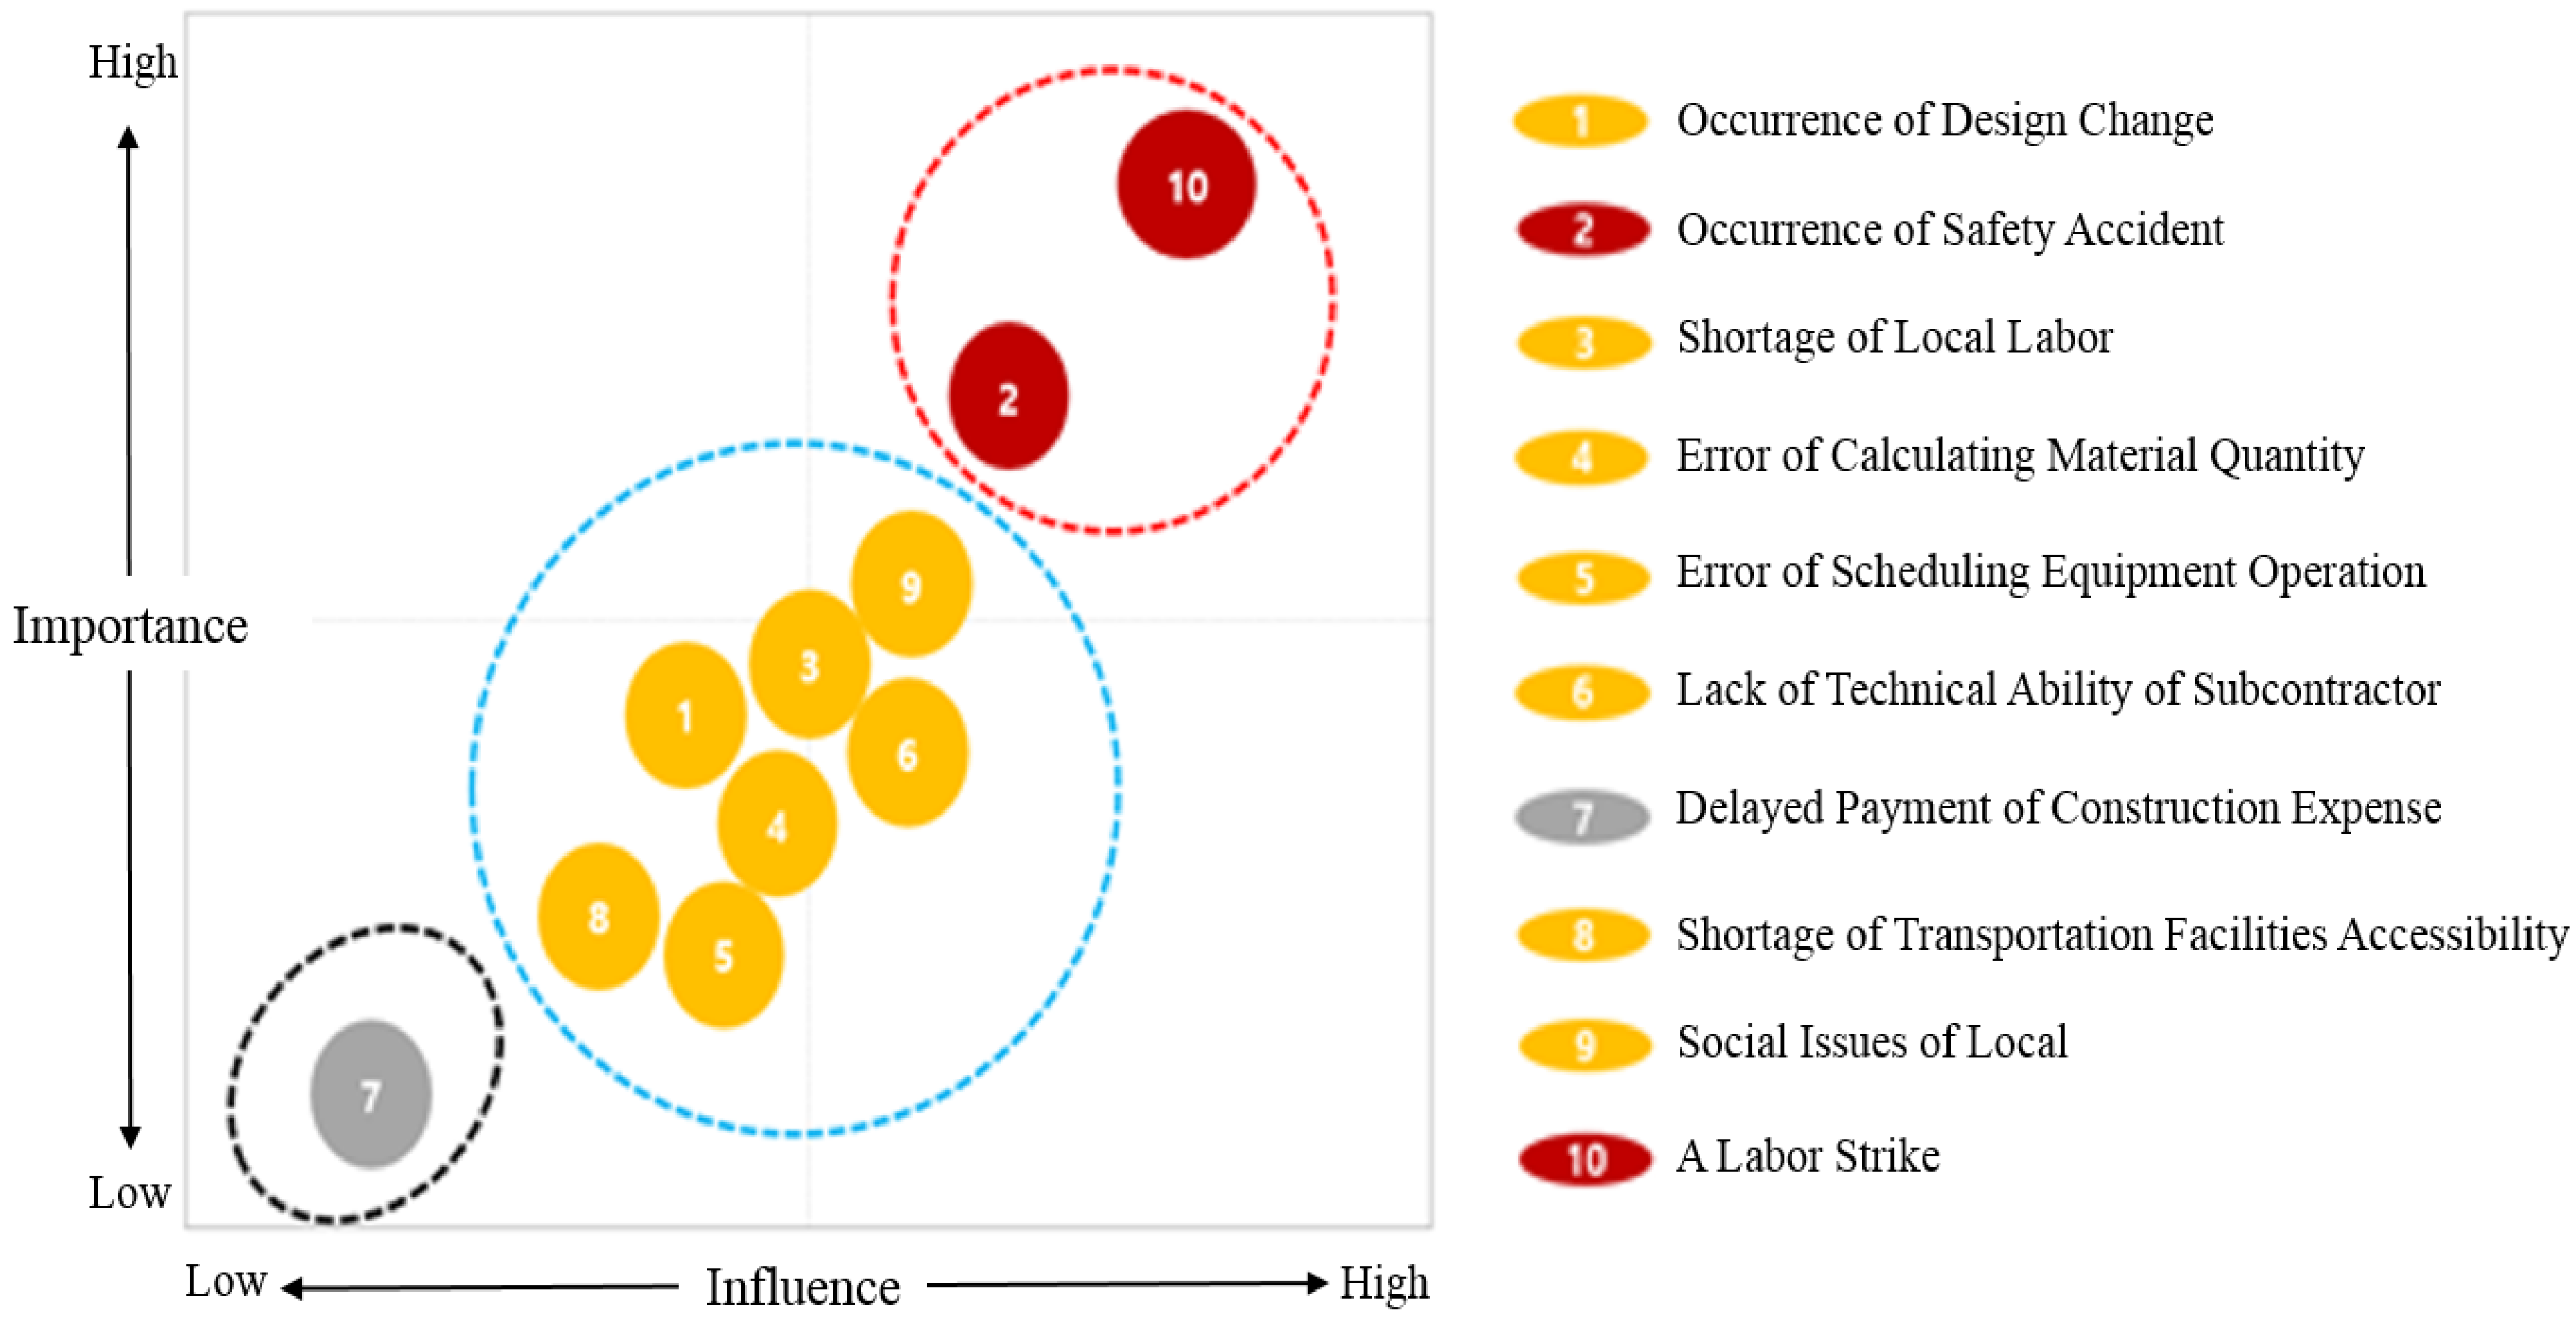
The results in Table 6 are also shown graphically in Figure 6. It can be seen that the risk caused by a labor strike and safety accidents are major factors affecting the construction duration.

4. Discussion

In performing a PERT/CPM analysis on the collected duration data, this research uncovered the critical path construction activities of an ultra-critical power plant. The sensitivity analyses of the Monte Carlo analysis provided greater insight into the most impactful activities of the schedule. This information will aid project owner decision-makers in understanding areas of opportunity for accelerating the schedule, activity-level risk mitigation strategies, and resource (oversite) management. For example, knowing that the boiler pressure parts installation is on the critical path and the most impactful to project duration may result in project sponsors attempting to mitigate any boiler pressure material delays such as executing early work procurement packages.
The identified risk factors, and their priority, will aid project owner decision-makers in their development of their risk register, a best practice per the PMI. Table 6 displays a very basic, high-level risk register. It provides owners an idea of where they should focus their energies and which risks are most important to mitigate or retire if possible. From the findings in Table 6 and Figure 6, an ultra-critical power plant project owner has an idea of where they should invest. To mitigate safety accidents, the owner may choose to invest in safety improvement measures such as multiple qualified safety managers, require contractor to have robust safety program, require robust onsite safety training, etc. To mitigate labor strikes, the owner should ensure that laborers receive fair pay and work in a safe environment. Alternatively, the identified risks need to be considered when estimating the construction cost (contingency) and duration (float) of an ultra-critical coal-fired power plant.

5. Conclusions and Limitations

Creating a 1000 MW ultra-critical coal-fired power plant’s schedule early in the planning process is a challenging yet important task, supporting many early decisions. This challenge is compounded by the fact that there are very few ultra-critical coal-fired power plants worldwide, equating to only a handful of knowledgeable people and minimal supporting documents. To aid those in this position, both owners and contractors, an activity-level project schedule was estimated for an ultra-critical coal-fired power plant. Data were collected from nine operational power plants and ten subject matter experts. To obtain the optimal confidence level, uncertainty was introduced through the PERT/CPM analysis and the most impactful risk factors were identified.
Results show that project owners should expect the construction of a 1000 MW ultra-critical power plant in Korea to take between 64 and 68 months with boiler pressure parts installation and trial operation having the greatest impact on meeting the project schedule. Furthermore, owners should take measures to mitigate the most impactful risk factors, identified as labor strikes and safety incidents. The findings of the above are based on data collected within Korea. It is likely that the findings could be applied to ultra-critical power plants executed in countries with similar economic, legislative, and labor availability as Korea. Alternatively, the process shown above can be applied to any construction process worldwide with few modifications required.
One limitation of the PERT/CPM process, and therefore a limitation of this study, is that the analysis focused on the critical path. Furthermore, only the schedule was considered, construction cost was not considered. In addition, in estimating the appropriate construction duration, individual variation may occur due to the application of a limited number of survey data (10 persons) rather than large numbers in the required sample calculation. As the risk factors affecting the construction process could result in a longer estimated construction duration, a further study covering all disciplines needs to be performed in the future.

Author Contributions

H.-C.L. developed the concept based on the analysis and drafted the manuscript. D.A. provided academic feedback on the study and revised the manuscript. E.-B.L. directed the research process and supervised the overall work. All authors read and approved the final manuscript.

Funding

The authors acknowledge that this research was sponsored by the Ministry of Trade Industry and Energy (MOTIE/KEIT) Korea through the Technology Innovation Program funding (Developing Intelligent Project Management Information Systems (i-PMIS) for Engineering Projects; Grant number = 10077606).

Acknowledgments

The authors would like to thank Korea East-West Power Agency Company for providing the data and information used for this study along with their funding support. The authors would like to thank I.H. Jung, H.M. Cho and J.W. Choi (graduate students in POSTECH) for their support on the manuscript preparation.

Conflicts of Interest

The authors declare no conflict of interest.

Appendix A

Table A1. Most likely construction durations.
ActivityMost Likely Duration (tm)
Boiler excavating to foundations8
Foundations and concrete work6
Boiler main steel9
Miscellaneous steel and finish23
Boiler pressure parts installation17
Turbine building excavating to foundations8
Discharge tunnel and foundation concrete11
Main steel frame installation8
Crane installation and testing3
T/G base mat concrete4
Pedestal and deck concrete11
BM and chipping2
Sole Plate1
Turbine generator installation18
Electrical System1
Chemical cleaning and cold clean up1
Steam blow-out8
Boiler and auxiliary system test8
Firing test2
T/G and auxiliary system test2
Trial Operation12
Table A2. Optimistic construction durations.
ActivitySurvey Responses (Months)Mean
12345678910
Boiler excavating to foundations57887785787
Foundations and concrete work46665556555
Boiler main steel58999899988
Miscellaneous steel and finish1822232320212221202021
Boiler pressure parts installation1216171717171715161716
Turbine building excavating to foundations47888785787
Discharge tunnel and foundation concrete71011111010116101010
Main steel frame installation48887787667
Crane installation and testing23333233233
T/G base mat concrete34443344434
Pedestal and deck concrete8101111101011710910
BM and chipping12222222222
Sole Plate11111111111
Turbine generator installation1617181818171815151717
Electrical System11111111111
Chemical cleaning and cold clean up11111111111
Steam blow-out18888762686
Boiler and auxiliary system test68887788878
Firing test22221122222
T/G and auxiliary system test12221122222
Trial Operation101212121011121291011
Table A3. Pessimistic construction durations.
ActivitySurvey Responses (Months)Mean
12345678910
Boiler excavating to foundations12121091299891010
Foundations and concrete work107779777778
Boiler main steel121212119111010111011
Miscellaneous steel and finish3025242425242524242325
Boiler pressure parts installation2021201920201820201820
Turbine building excavating to foundations1212109999810910
Discharge tunnel and foundation concrete1512111212121211111212
Main steel frame installation1291099998989
Crane installation and testing53343444334
T/G base mat concrete65455556555
Pedestal and deck concrete1512111312121211131212
BM and chipping32243332223
Sole Plate23321211112
Turbine generator installation2420202023201920181920
Electrical System211211.522111
Chemical cleaning and cold clean up21121222112
Steam blow-out38810121083998
Boiler and auxiliary system test98810109981089
Firing test33434333423
T/G and auxiliary system test33333332323
Trial Operation1418181514131318131215

References

  1. Sieminski, A. International Energy Outlook 2014. Available online: https://www.eia.gov/pressroom/presentations/sieminski_09222014_columbia.pdf (accessed on 18 October 2018).
  2. Hou, G.; Yang, Y.; Jiang, Z.; Li, Q.; Zhang, J. A new approach of modeling an ultra-super-critical power plant for performance improvement. Energies 2016, 9, 310. [Google Scholar] [CrossRef]
  3. Tumanovskii, A.G.; Shvarts, A.L.; Somova, E.V.; Verbovetskii, E.K.; Avrutskii, G.D.; Ermakova, S.V.; Kalugin, R.N.; Lazarev, M.V. Review of the coal-fired, over-supercritical and ultra-supercritical steam power plants. Therm. Eng. 2017, 64, 83–96. [Google Scholar] [CrossRef]
  4. National Energy Technology Laboratory. High Performance Materials. Available online: https://www.netl.doe.gov/research/coal/crosscutting/high-performance-materials/Ultrasupercritical (accessed on 10 October 2018).
  5. Gianfrancesco, A. Materials for Ultra-Supercritical and Advanced Ultra-Supercritical Power Plants; Woodhead Publishing: Cambridge, UK, 2016. [Google Scholar]
  6. Zhang, D.K. Ultra-supercritical Coal Power Plant: Materials, Technologies and Optimisation; Woodhead Publishing: Cambridge, UK, 2013. [Google Scholar]
  7. Starkloff, R.; Postler, R.; Al-Maliki, W.A.; Alobaid, F.; Epple, B. Investigation into gas dynamics in an oxyfuel coal fired boiler during master fuel trip and blackout. J. Process Control 2016, 41, 67–75. [Google Scholar] [CrossRef]
  8. Stępczyńska, K.; Kowalczyk, Ł.; Dykas, S.; Elsner, W. Calculation of a 900 MW conceptual 700/720 °C coal-fired power unit with an auxiliary extraction-backpressure turbine. J. Power Technol. 2012, 92, 266–273. [Google Scholar]
  9. Bugge, J.; Kjaer, S.; Blum, R. High-efficiency coal-fired power plants development and perspectives. Energy 2006, 31, 1437–1445. [Google Scholar] [CrossRef]
  10. Hong, C.S.; Lee, E.B. Power Plant Economic Analysis: Maximizing Lifecycle Profitability by Simulating Preliminary Design Solutions of Steam-Cycle Conditions. Energies 2018, 11, 2245. [Google Scholar] [CrossRef]
  11. Phillips, J.N.; Wheeldon, J.M. Economic analysis of advanced ultra-supercritical pulverized coal power plants: A cost-effective CO2 emission reduction option. In Proceedings of the 6th International Conference on Advances in Materials Technology for Fossil Power Plants, Santa Fe, NM, USA, 31 August 2010; pp. 53–64. [Google Scholar]
  12. Kyushu Electric Power Co., Inc. Study on the Ultra Super Critical Coal-Fired Power Plants in Bac Lieu, the Socialist Republic of Vietnam. 2015. Available online: http://www.meti.go.jp/meti_lib/report/2015fy/000265.pdf (accessed on 10 October 2018).
  13. Hasler, D.; Rosenquist, W.; Gaikwad, R. New Coal-Fired Power Plant Performance and Cost Estimates. Available online: https://www.epa.gov/sites/production/files/2015-08/documents/coalperform.pdf (accessed on 18 October 2018).
  14. Lim, S.Y.; Kim, H.J.; Yoo, S.H. South Korean Household’s Willingness to Pay for Replacing Coal with Natural Gas? A View from CO2 Emissions Reduction. Energies 2017, 10, 2031. [Google Scholar] [CrossRef]
  15. Yan, Q.; Wang, Y.; Baležentis, T.; Sun, Y.; Streimikiene, D. Energy-Related CO2 Emission in China’s Provincial Thermal Electricity Generation: Driving Factors and Possibilities for Abatement. Energies 2018, 11, 1096. [Google Scholar] [CrossRef]
  16. Fan, H.; Zhang, Z.; Dong, J.; Xu, W. China’s R&D of advanced ultra-supercritical coal-fired power generation for addressing climate change. Therm. Sci. Eng. Prog. 2018, 5, 364–371. [Google Scholar] [CrossRef]
  17. Doloi, H. Cost overruns and failure in project management: Understanding the roles of key stakeholders in construction projects. J. Constr. Eng. Manag. 2012, 139, 267–279. [Google Scholar] [CrossRef]
  18. Assaf, S.A.; Al-Hejji, S. Causes of delay in large construction projects. Inter. J. Proj. Manag. 2006, 24, 349–357. [Google Scholar] [CrossRef]
  19. Odeh, A.M.; Battaineh, H.T. Causes of construction delay: Traditional contracts. Int. J. Proj. Manag. 2002, 20, 67–73. [Google Scholar] [CrossRef]
  20. Galloway, P.D. Survey of the construction industry relative to the use of CPM scheduling for construction projects. J. Constr. Eng. Manag. 2006, 132, 697–711. [Google Scholar] [CrossRef]
  21. Abdul-Rahman, H.; Berawi, M.A.; Berawi, A.R.; Mohamed, O.; Othman, M.; Yahya, I.A. Delay mitigation in the Malaysian construction industry. J. Constr. Eng. Manag. 2006, 132, 125–133. [Google Scholar] [CrossRef]
  22. Lu, M.; AbouRizk, S.M. Simplified CPM/PERT simulation model. J. Constr. Eng. Manag. 2000, 126, 219–226. [Google Scholar] [CrossRef]
  23. Barraza, G.A. Probabilistic estimation and allocation of project time contingency. J. Constr. Eng. Manag. 2010, 137, 259–265. [Google Scholar] [CrossRef]
  24. Mulholland, B.; Christian, J. Risk assessment in construction schedules. J. Constr. Eng. Manag. 1999, 125, 8–15. [Google Scholar] [CrossRef]
  25. Lu, M.; Li, H. Resource-activity critical-path method for construction planning. J. Constr. Eng. Manag. 2003, 129, 412–420. [Google Scholar] [CrossRef]
  26. Jun, D.H.; El-Rayes, K. Fast and accurate risk evaluation for scheduling large-scale construction projects. J. Comput. Civ. Eng. 2011, 25, 407–417. [Google Scholar] [CrossRef]
  27. Lu, M. Enhancing project evaluation and review technique simulation through artificial neural network-based input modeling. J. Constr. Eng. Manag. 2002, 128, 438–445. [Google Scholar] [CrossRef]
  28. Mapped: The World’s Coal Power Plants. CarbonBrief. 2018. Available online: https://www.carbonbrief.org/mapped-worlds-coal-power-plants (accessed on 10 October 2018).
  29. Choi, K.S. A Study on the Improvement of Calculation Method for the Proper Construction Period of Public Construction in Seoul; Yonsei University: Seoul, Korea, 2009. [Google Scholar]
  30. Cottrell, W.D. Simplified program evaluation and review technique (PERT). J. Constr. Eng. Manag. 1999, 125, 16–22. [Google Scholar] [CrossRef]
  31. Project Management Institute. A Guide to the Project Management Body of Knowledge, 6th ed.; Project Management Institute: Newtown Square, PA, USA, 2017. [Google Scholar]
  32. Maverick, J.B. What Is the Minimum Number of Simulations that Should Be Run in Monte Carlo Value at Risk (VaR)? Available online: https://www.investopedia.com/ask/answers/061515/what-minimum-number-simulations-should-be-run-monte-carlo-value-risk-var.asp (accessed on 10 October 2018).
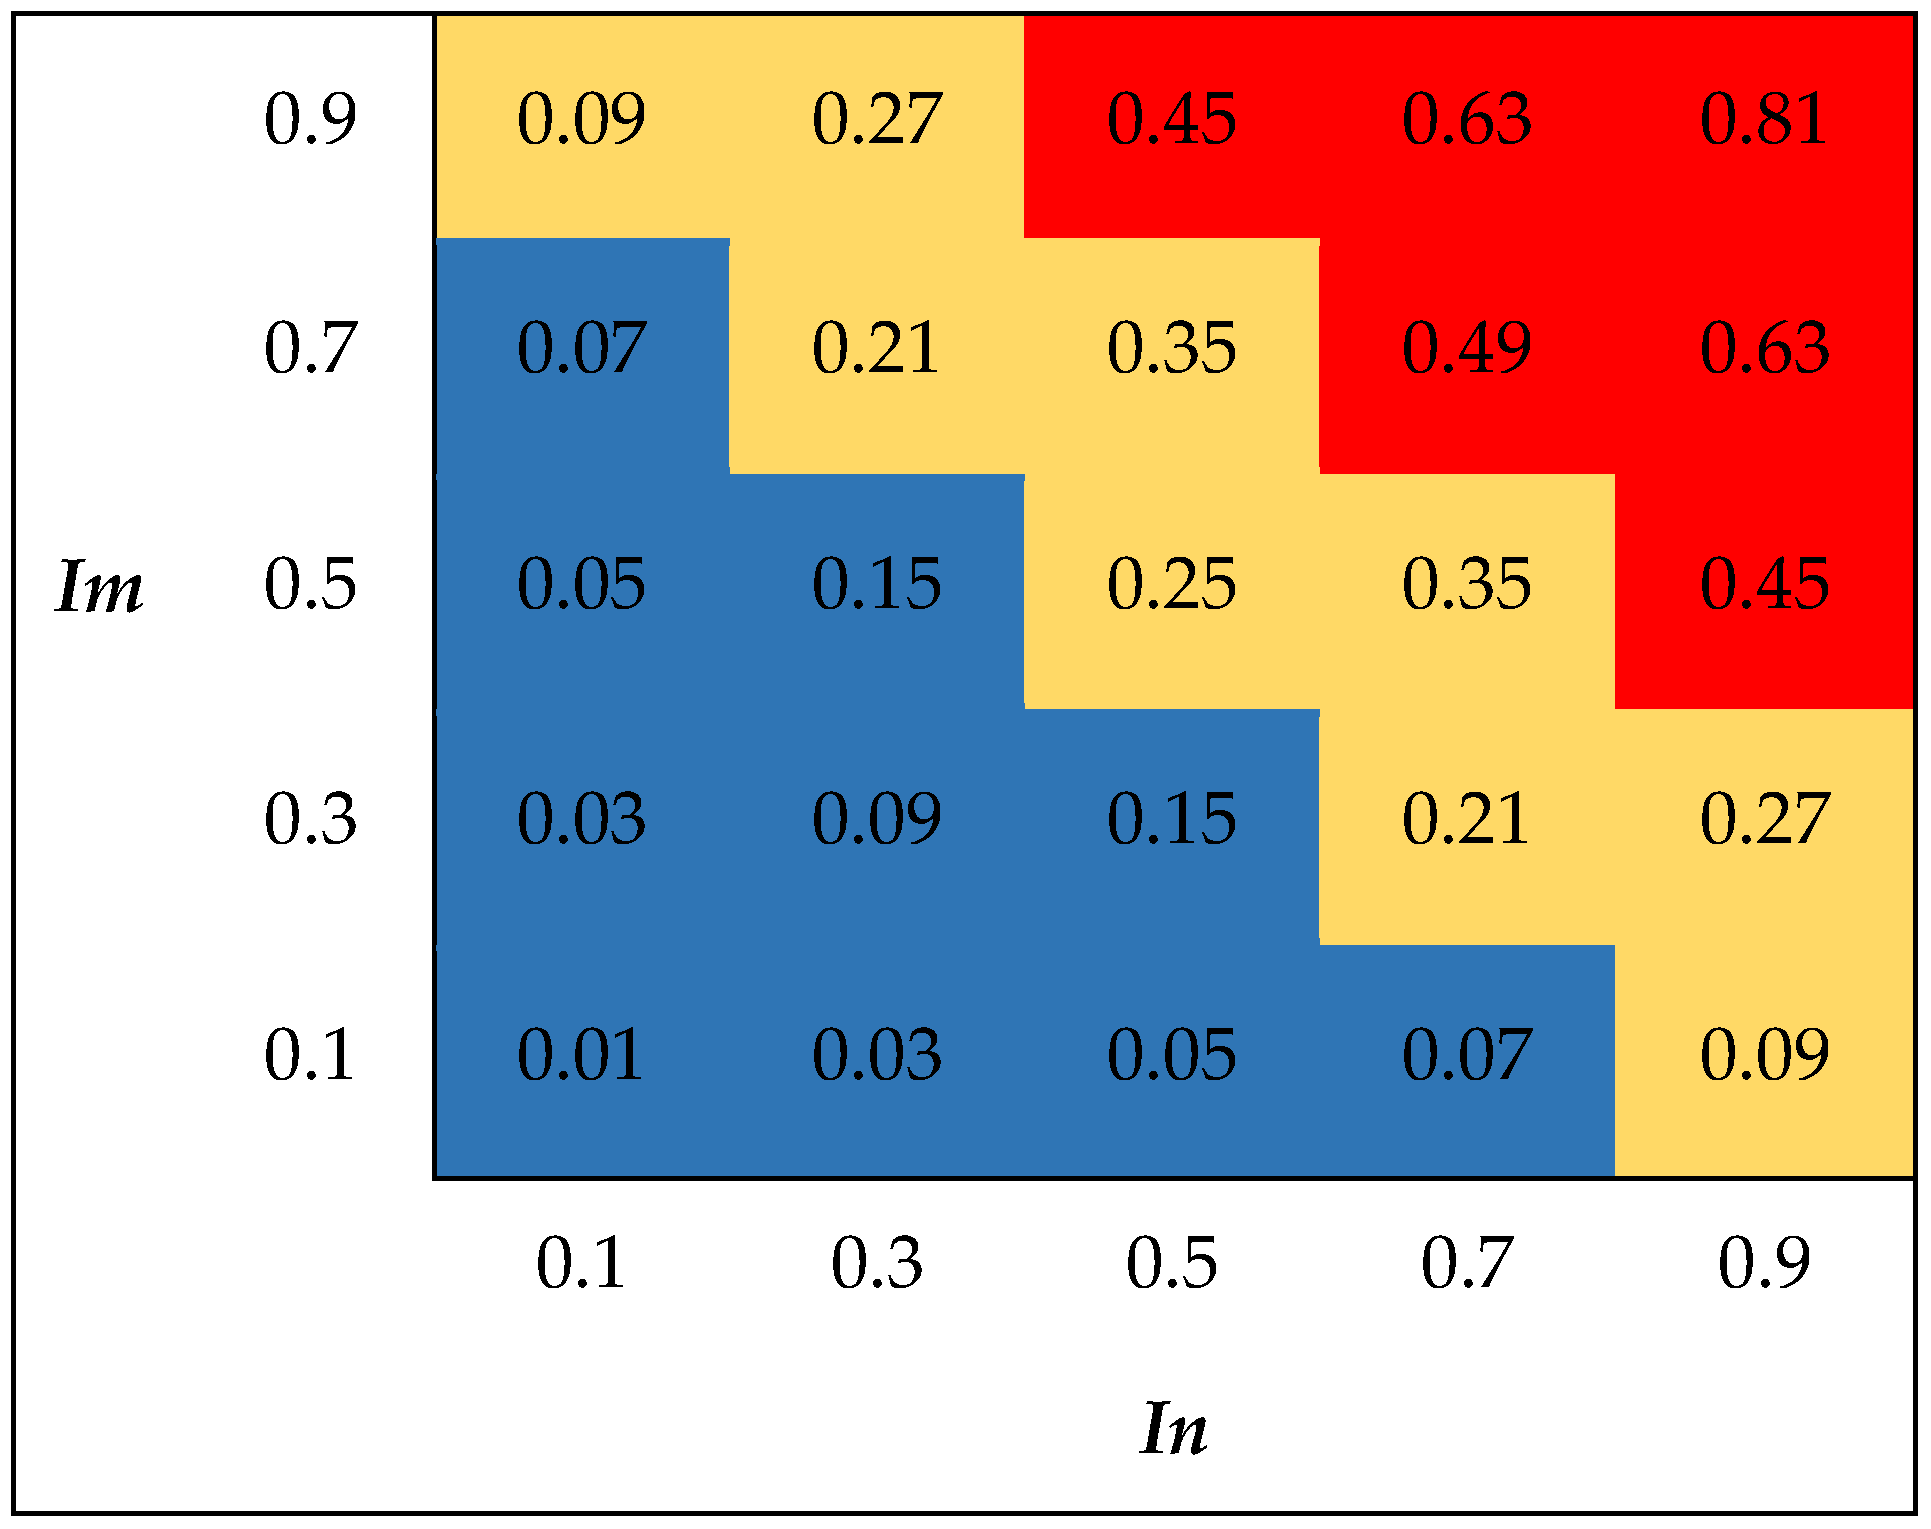
Figure 1. Importance-Influence Matrix to Determine Level of Risk. Im = Importance or Probability of Occurrence; In = Influence or Impact; Red-color = High Risk; Yellow-color = Moderate Risk; Blue-color = Low Risk.
Energies 11 02850 g001
Figure 2. Project duration using most likely values.
Energies 11 02850 g002
Figure 3. Monte Carlo simulation results showing project duration and their frequencies.
Energies 11 02850 g003
Figure 4. Activities’ impact range on the project duration.
Energies 11 02850 g004
Figure 5. Activities’ duration correlation to project duration (regression coefficients).
Energies 11 02850 g005
Figure 6. Identified risk factor’s priority as a function of importance and effect.
Energies 11 02850 g006
Table 1. Korean-owned thermal power plant case study project characteristics.
Thermal Power PlantCapacity (MW per Unit)Construction
PlanActual
Dangjin Unit 9, 10102011 June to 16 June
61 months
11 June to 16 October
65 months
Taean Unit 9, 10102212 December to 16 December
51 months
12 December to 17 April
55 months
Shin Boryung Unit 1, 2105011 November to 17 June
68 months
11 November to 17 June
68 months
Shamcheok Unit 1, 2100012 June to 16 June
49 months
12 June to 17 June
61 months
Table 2. Korean-constructed domestic thermal power plant case study project characteristics.
Thermal Power PlantCapacity (MW per Unit)Construction
Hadong Unit 3, 450094 May to 99 March
41 months
Taean Unit 3, 450012 June to 97 August
39 months
Danghin Unit 5, 650002 November to 06 March
40 months
Youngheung Unit 1, 280000 July to 04 November
52 months
Youngheung Unit 3, 487004 August to 08 December
52 months
Table 3. Selection of high-level project activities.
Activity
Boiler excavating to foundations
Foundations and concrete work
Boiler main steel
Miscellaneous steel and finish
Boiler pressure parts installation
Turbine building excavating to foundations
Discharge tunnel and foundation concrete
Main steel frame installation
Crane installation and testing
T/G base mat concrete
Pedestal and deck concrete
Bench mark and chipping
Sole Plate
Turbine generator installation
Electrical System
Chemical cleaning and cold clean up
Steam blow-out
Boiler and auxiliary system test
Firing test
T/G and auxiliary system test
Trial Operation
Table 4. Estimated activity durations using three-point projection.
Activityto (Months)tm (Months)tp (Months)te (Months)
Boiler excavating to foundations78108
Foundations and concrete work5686
Boiler main steel89119
Miscellaneous steel and finish21232523
Boiler pressure parts installation16172017
Turbine building excavating to foundations78108
Discharge tunnel and foundation concrete10111211
Main steel frame installation7898
Crane installation and testing3343
T/G base mat concrete4454
Pedestal and deck concrete10111211
Bench mark and chipping2232
Sole Plate1121
Turbine generator installation17182018
Electrical System1111
Chemical cleaning and cold clean up1121
Steam blow-out6888
Boiler and auxiliary system test8898
Firing test2232
T/G and auxiliary system test2232
Trial Operation11121512
te = weighted average of expected activity duration; to = optimistic activity duration; tm = most likely activity duration; tp = pessimistic activity duration.
Table 5. Critical path variables and PERT duration at a 98% likelihood.
Activityto (months)tm (months)tp (months)te (months)σ (months)σ2 (months)
Boiler building excavating to foundations781080.500.25
Foundations and concrete work56860.370.13
Boiler main steel891190.420.17
Boiler pressure parts installation161720170.580.34
Boiler and auxiliary system test88980.230.05
Firing test22320.230.05
T/G and auxiliary system test22320.180.03
Trial Operation111215120.630.40
Total duration (te) 65
Critical path standard deviation (σcp) 1.2
te = weighted average of expected activity duration; to = optimistic activity duration; tm = most likely activity duration; tp = pessimistic activity duration; σ = standard deviation; σcp = standard deviation of critical path.
Table 6. Identified risk factor’s priority as a function of importance and effect.
Risk FactorsImportanceInfluenceRisk ImpactDegree of RiskPriority
A labor strike0.880.90.79High1
Occurrence of safety accident0.760.70.53High2
Social issues of local0.580.540.31Moderate3
Shortage of local labor0.540.520.28Moderate4
Lack of technical ability of subcontractor0.520.460.24Moderate5
Occurrence of design change0.440.480.21Moderate6
Error of scheduling equipment operation0.420.340.14Moderate7
Error of calculating material quantity0.380.340.13Moderate8
Shortage of transportation facilities accessibility0.380.320.12Moderate9
Delayed payment of construction expense0.30.30.09Low10