1. Introduction
Crude oil is a complex chemical mixture used to produce fuels, derivatives and chemicals. As a result of the complexity, analytical techniques with high resolving power are necessary to characterize and understand its chemical composition, which may include paraffinic chains, naphthenic and aromatic structures [
1].
The quality of crude oils in primary processing is evaluated by physical properties such as American Petroleum Institute (API) gravity [
2]. The API gravity has an important impact on field development decisions and the economic value of crude oils. It strongly affects the economic viability of producing fields, since, in addition to oil value, it aids in the design of the equipment used in exploration and field productivity [
2,
3].
Different fractionation methods have been developed and used to characterize crude oils in the form of specific fractions [
4]. A simple scheme which has been used for decades to separate crude oil components into fractions of saturates, aromatics, resins and asphaltenes depending on their solubilities, is called SARA fractionation [
5]. In SARA fractionation the initial step is the removal of asphaltenes using a nonpolar solvent, while the remaining fraction, named maltenes, is further separated into saturates, aromatics and resins [
6]. Resin and asphaltene fractions constitute the most complex part because of a high abundance of heteroatoms (N, O and S). The resin fraction represents the most polar compounds in crude oils which may include both hydrogen-rich and hydrogen-deficient molecules, i.e., a mixture of saturated and aromatic compounds [
7]. Meanwhile, asphaltenes comprise hydrocarbons and components with high numbers of heteroatoms, which contain highly condensed aromatic rings substituted with aliphatic chains [
6]. The asphaltenes are reported to be maturation products of the resins. If this is the case, it indicates that one of the maturation processes involves aromatization of the nonaromatic portions of the resin [
8]. Additionally, it should be expected that the transition from resin to asphaltene is fluid and that a continuum of compounds is to be found. The chemical constituents of asphaltenes and resins are quite important to determine the probability of solid-phase deposition, a major problem in the production, refining and transportation of oil [
9].
The SARA fractionation of crude oils has been described in the literature in conjunction with different analytical techniques, such as thin-layer chromatography with flame-ionization detection (TLC-FID) [
10], high-performance liquid chromatography (HPLC) [
11], gel permeation chromatography (GPC) [
12], gas chromatography mass spectrometry (GC/MS) [
13] and Fourier transform ion cyclotron resonance mass spectrometry (FT-ICR MS) [
14,
15,
16]. FT-ICR MS has shown to be an appropriate tool to provide sufficient information about the individual elemental composition (C
cH
hN
nO
oS
s) of species present in complex samples, because it allows differentiating between thousands of species within a single mass spectrum [
17,
18,
19]. Recently, a review article about crude oil analysis and MS techniques has shown that the SARA fractionation reduces matrix effects and ionic suppression for the analysis with FT-ICR MS, allowing a comprehensive characterization of the constituents present in the fractions in comparison with the corresponding crude oil [
20]. Hence, the SARA fractionation can be used as a sample simplification step to reduce the complexity of crude oils, which results in a higher yield of assigned signals [
15,
18,
21].
Shi and co-workers [
22] have reported an investigation of neutral nitrogen and oxygen compounds in crude oil and its SARA fractions using electrospray ionization (ESI) FT-ICR MS. Besides, atmospheric pressure laser ionization (APLI) in conjunction with FT-ICR MS has been applied to show the potential of SARA fractionation method as a sample-simplification tool that allows a reduction of components present during the measurement [
15]. An oil spill site has been studied at different weathering stages and compared to in vitro photo-degradation experiments by SARA fractionation and FT-ICR MS for a more detailed comparison on the molecular level [
23].
In the first part of this work [
24] we have performed a detailed characterization of crude oils with different API gravities (API30, API23 and API16) on a molecular level from FT-ICR MS data using different ionization techniques. Herein, for the first time the FT-ICR MS data obtained using the perhaps two most complementary atmospheric pressure ionization techniques ESI(±) and APPI(+) were processed in terms of class, double bond equivalents (DBE) and carbon number to try to find parameters that can indicate tendencies for the FT-ICR MS data of the resin and asphaltene fractions obtained from these three crude oils. We also have investigated an adaptation on the SARA fractionation to obtain a second resin fraction unprecedented in the literature.
2. Results and Discussion
2.1. Crude Oil Properties, SARA Fractionation and Elemental Analysis
In
Table 1 the major physical and chemical properties are summarized including the classification and the elemental analysis ratio for the three crude oil samples used for this study. According to their API gravity the samples were classified as light (API30), medium (API23) and heavy (API16) crude oils [
25]. Note that, as expected [
1], density inversely correlates to the API gravities. In addition,
Table 1 indicates a trend between API gravity and H/C ratios. Lower H/C ratios show higher aromaticity levels for crude oils. The same is true for direct tendency between the N/C ratios and API gravities, whereas no tendency was found for the O/C and S/C ratios.
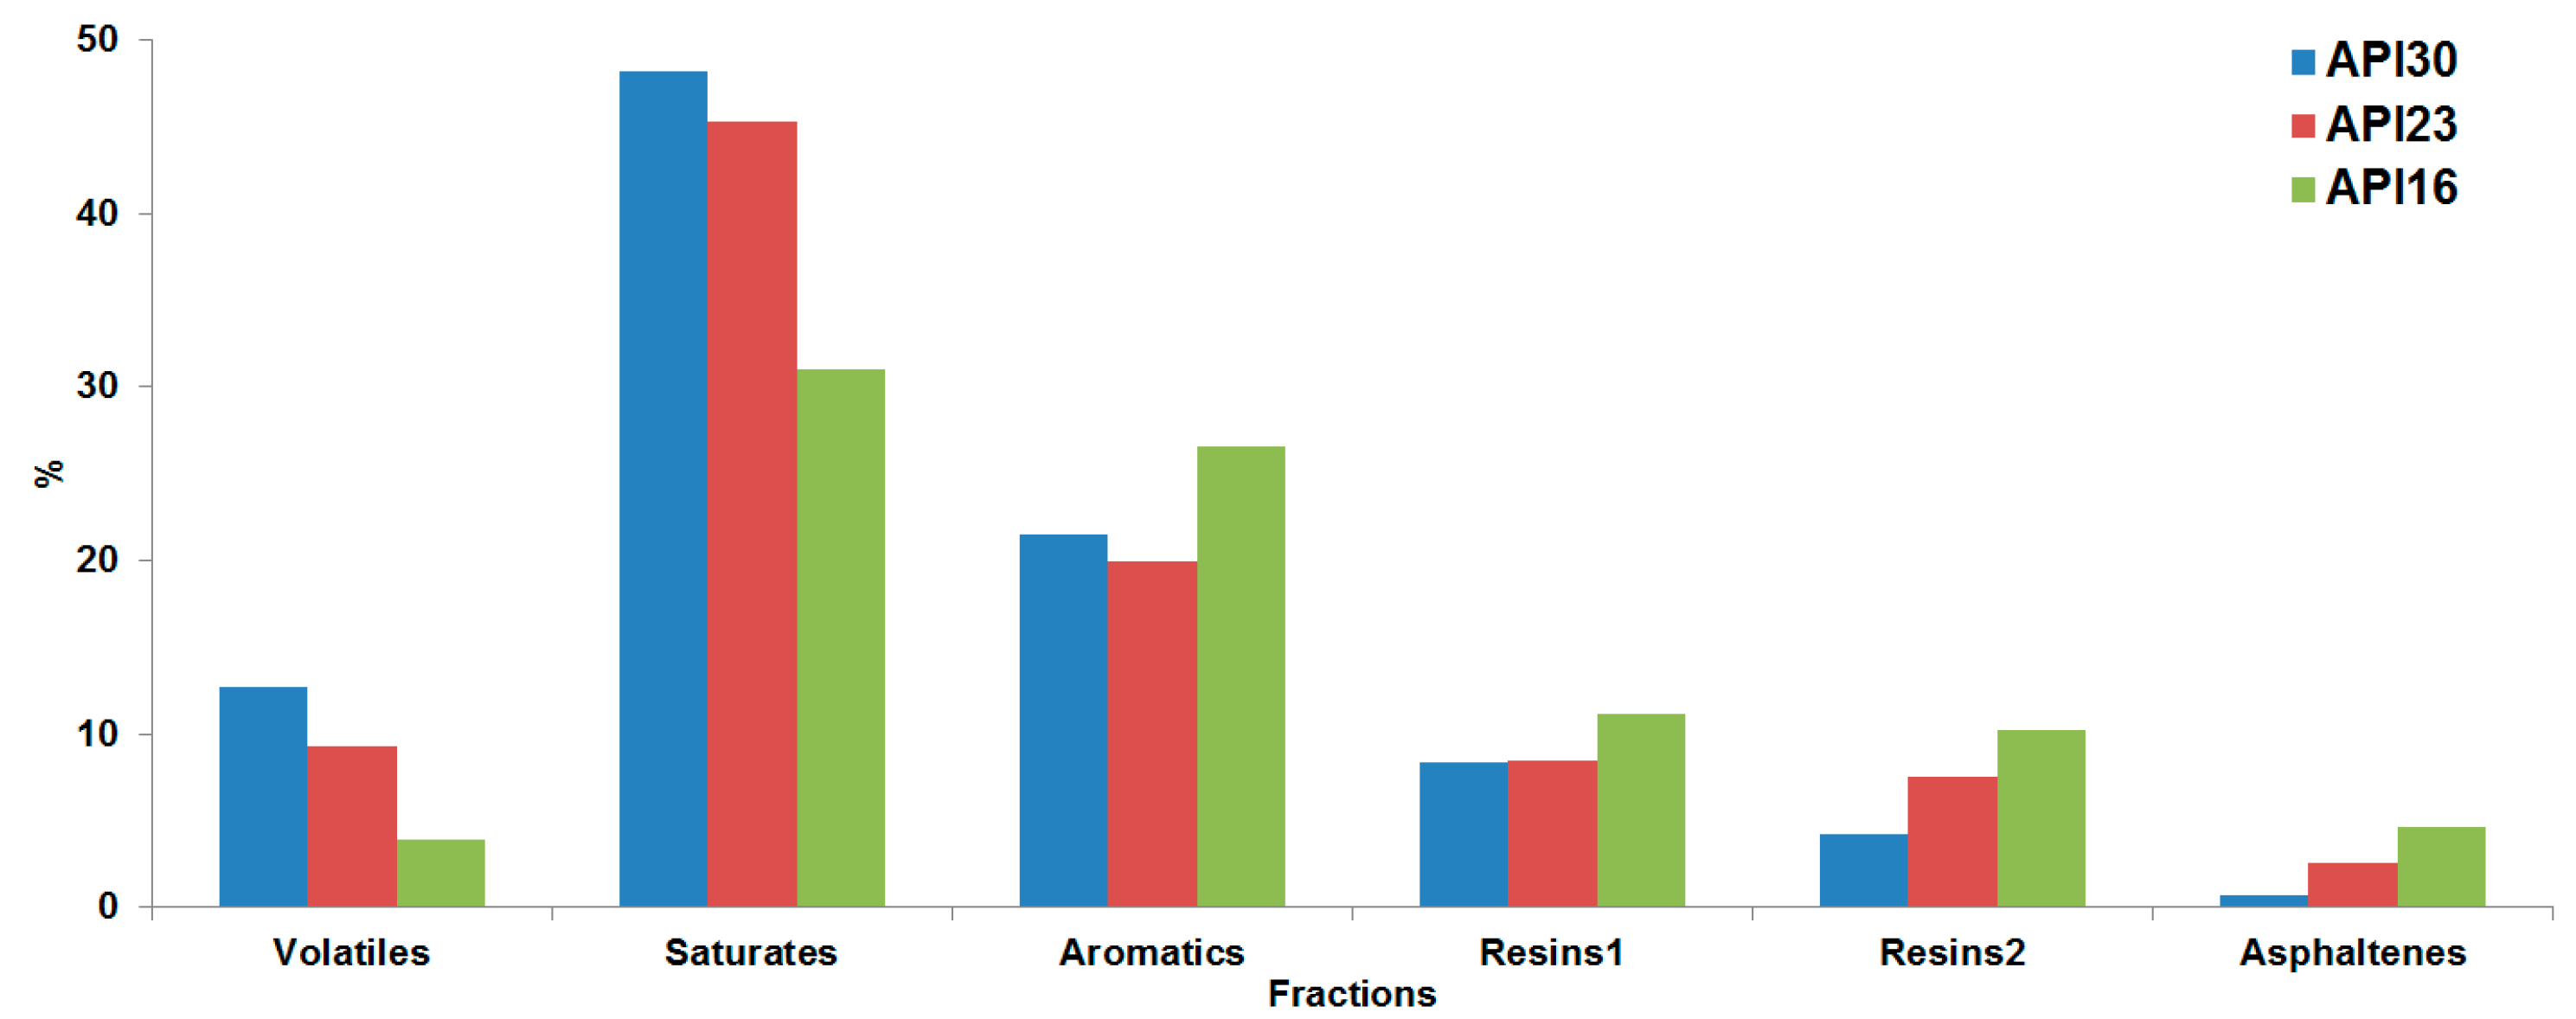
These three crude oils were then fractionated using a modified SARA fractionation scheme. The first step was the removal of the volatile compounds followed by the usual SARA fractionation. Additionally, it was found that at the end of the SARA fractionation, especially for heavy crude oils, still quite a lot of material was remaining on the alumina column which was not eluting using methanol as mobile phase. Therefore, we have added an additional step by using ethyl acetate as mobile phase to remove this material from the column. This fraction was analyzed and studied here in detail as resin2 fraction. In
Figure 1 the mass balance of the SARA fractions from the three crude oils with different API gravities is illustrated. We have obtained a final recovery of 95% (
w/
w), 93% (
w/
w) and 87% (
w/
w) respectively for the API30, API23 and API16 oils, and some tendencies between SARA fraction with API gravity were observed. Note that the volatile and saturate fraction abundances are directly proportional with API gravity, because these fractions are constituted mostly by light compounds. For the resin1, resin2 and asphaltene fractions, which represent the fraction with higher polar/aromatic content, the tendency was inversely proportional.
Table 2 lists the major physical and chemical properties, classification and element ratios for the resin1, resin2 and asphaltene fractions obtained from the three crude oils. The elemental analysis for the same fraction among the samples gives some trends towards API gravity. The H/C and N/C ratios directly correlate with API gravity for the resin1 and asphaltene fractions, and an inverse tendency was found for the resin2 fraction, whereas no trends were obtained for the O/C and S/C ratio. Considering different fractions of the same crude oil, we have found the lower H/C ratio for asphaltenes, which shows that these exhibits the highest aromaticity among the fractions studied. Also the S/C ratio is higher in asphaltene fractions.
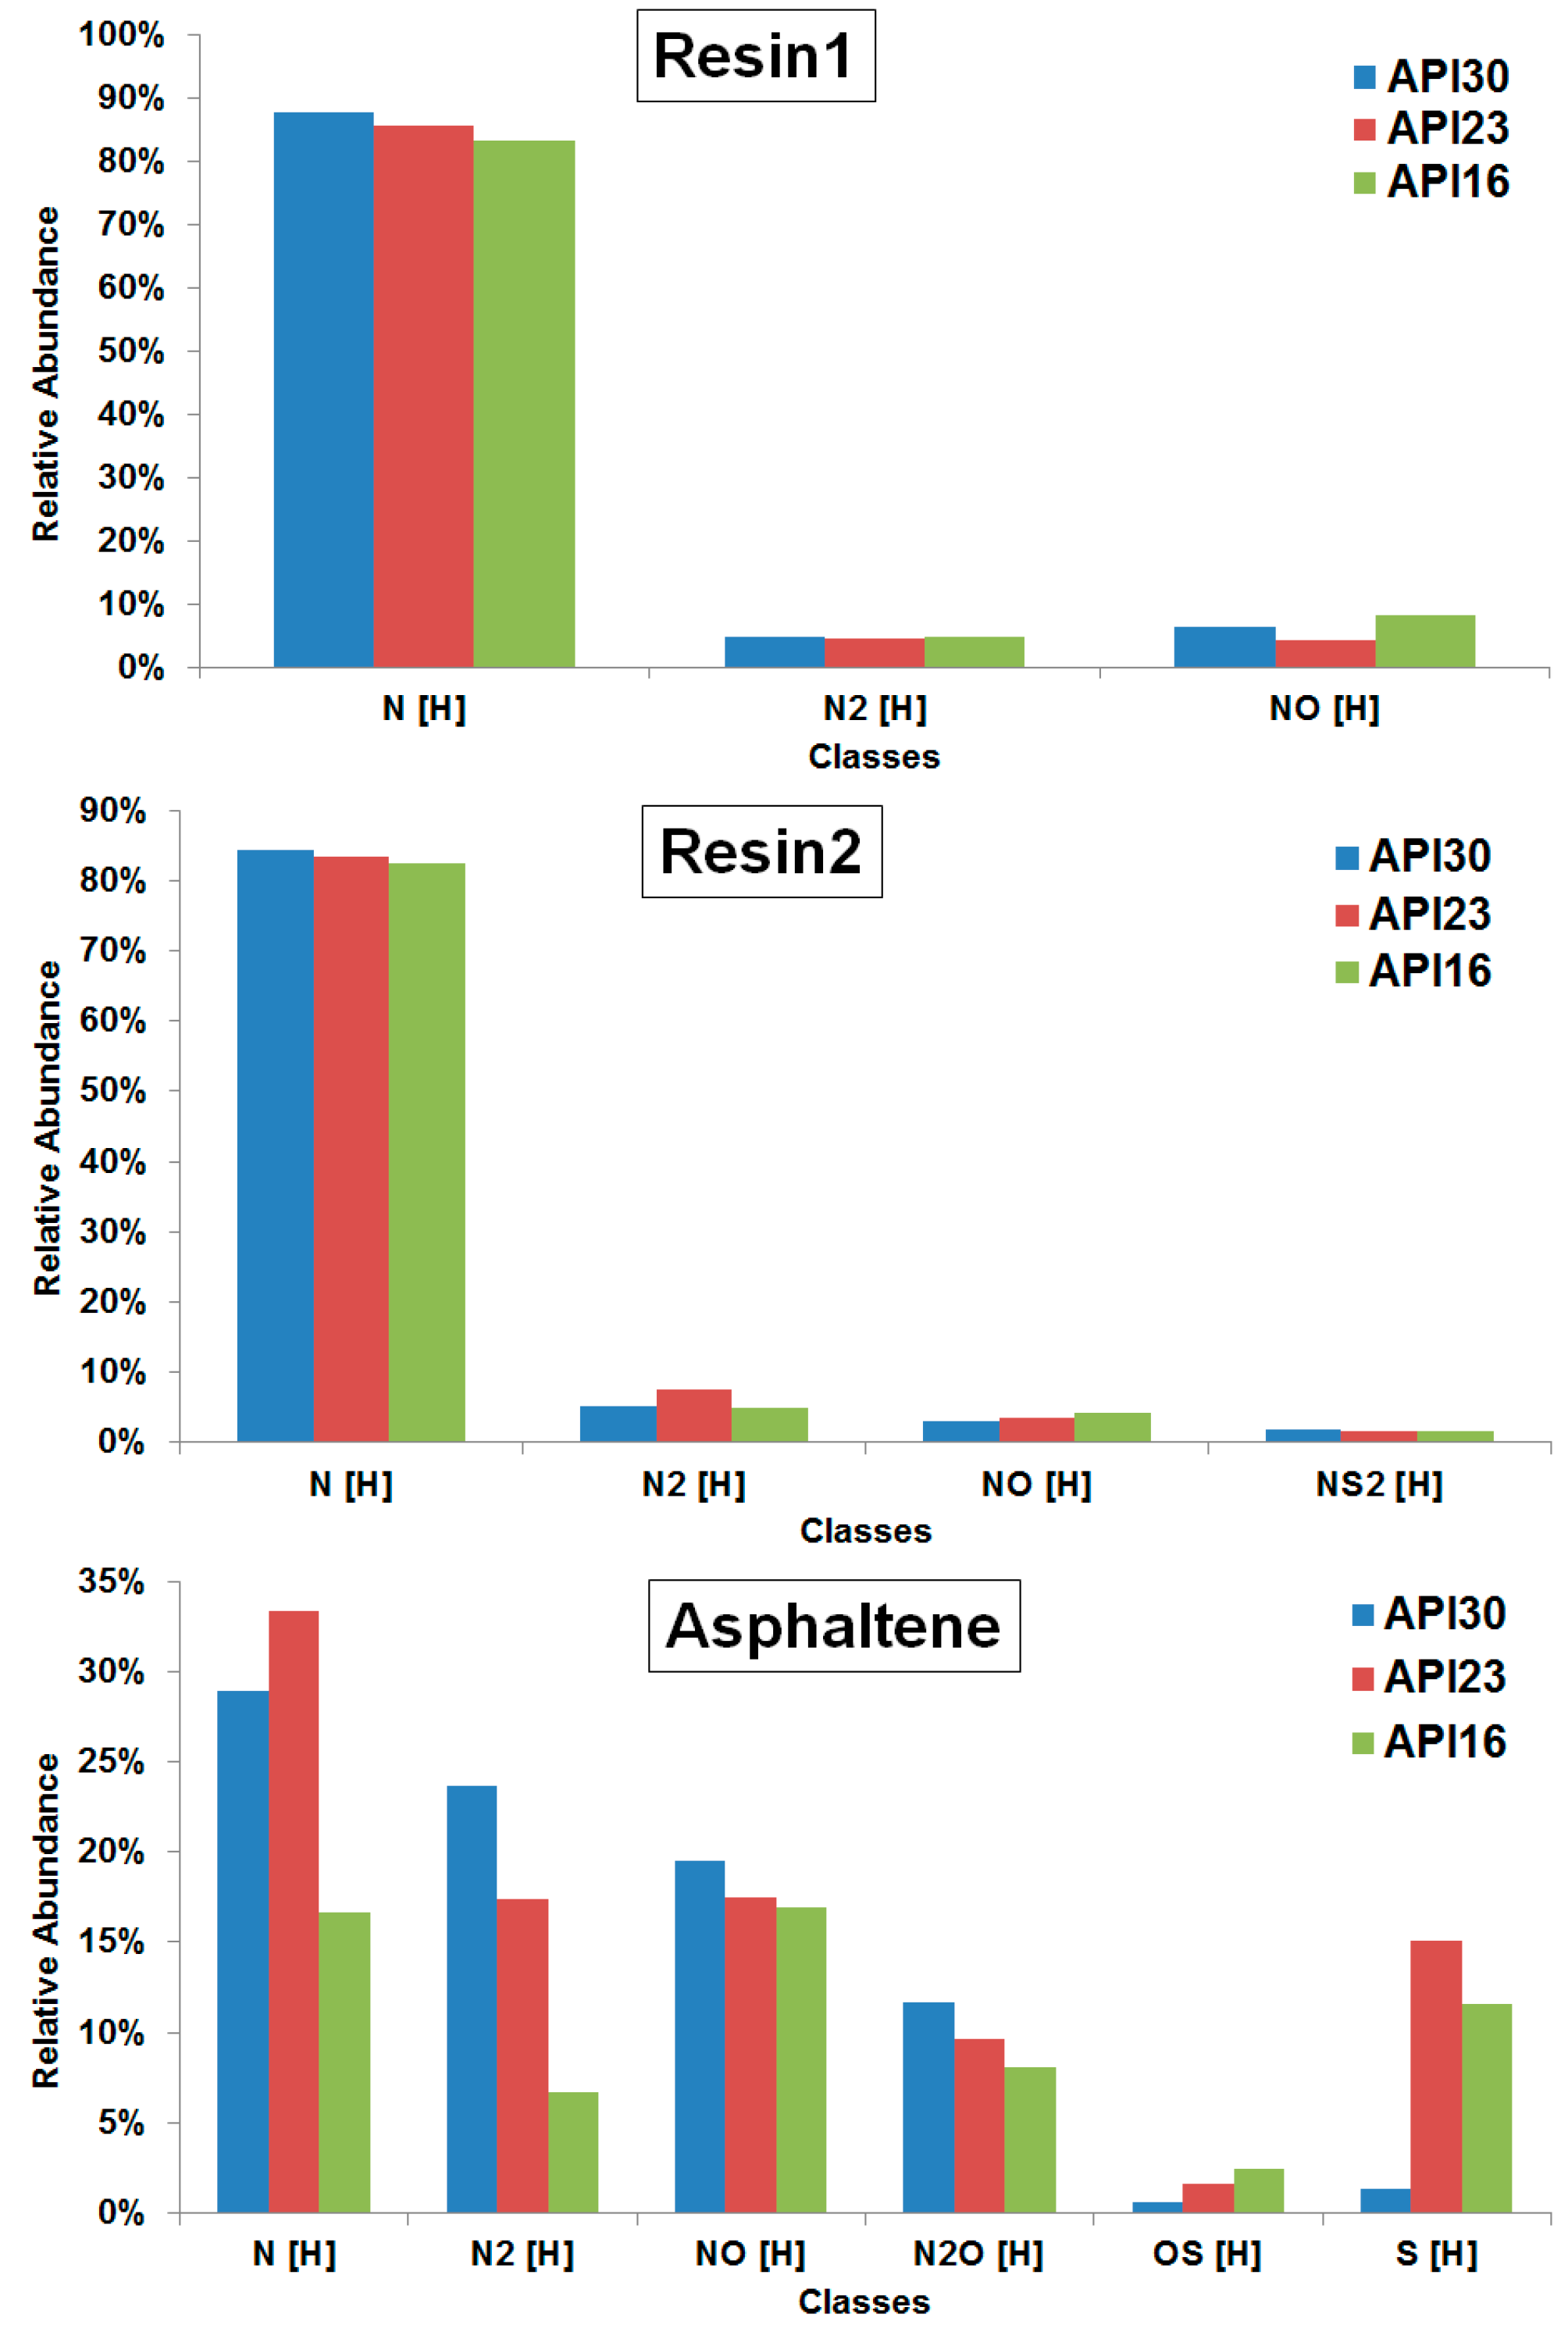
2.2. ESI(+) FT-ICR MS
The class distribution as determined from assigned elemental compositions detected by positive mode electrospray ionization (ESI(+)) FT-ICR MS for resin1, resin2 and asphaltene fractions (for the full spectra see
Figures S1–S3) obtained from the different crude oils are illustrated in
Figure 2.
Being the most basic components, easily detected via ESI(+), the most abundant heteroatom class for resin1, resin2 and asphaltene fractions in all crude oils was N[H]. A tendency of the N[H]-class abundance with API gravity was determined for the resin1 and resin2 fractions of the three crude oils, whereas for the asphaltene fractions the N2[H], NO[H] and N2O[H] directly correlate and OS[H] inversely correlates with API gravity, respectively.
To further investigate trends of FT-ICR MS data with API gravity, we calculated the average DBE values (DBE
avg) for the most abundant N[H]-class in resin1, resin2 and asphaltene fractions, as listed in
Table 3. The DBE
avg indicates the aromaticity level for a specific class from the DBE distribution data obtained by FT-ICR MS analysis [
7]. The data show that the DBE
avg inversely correlates with API gravity for all fractions. We have previously studied the whole crude oils [
24] and the same tendencies were obtained, which suggests that the resin1, resin2 and asphaltene fractions are mainly responsible for the characteristics of the crude oil in regard to the API gravity value.
The concept of planar limit was applied on the data of the different classes of both resin and asphaltene fractions [
26]. The planar limit equation is calculated from the DBE versus carbon count plot by linear regression of the data points given by the highest DBE values observed for each carbon number. A higher slope indicates a higher aromaticity with an increasingly condensed π-system. In
Table 3 the slope (
sl) of the planar limit equation for the N[H]-class found in resin1, resin2 and asphaltene fractions is summarized. The slope value inversely correlates with the API gravity for all fractions, as does the average DBE. The DBE
avg and the slope show an aromaticity tendency order independent of the fraction, in the following order: API16 > API23 > API30.
Regarding the N[H]-class within the fractions of the same crude oil, DBEavg and slope increase from resin1 to asphaltene, which shows that the asphaltene fraction contains the highest aromatic compounds in crude oil. The aromaticity distribution of the resin2 fraction falls between the resin1 and asphaltene fractions rounding out the continuum of compounds in the carbon space.
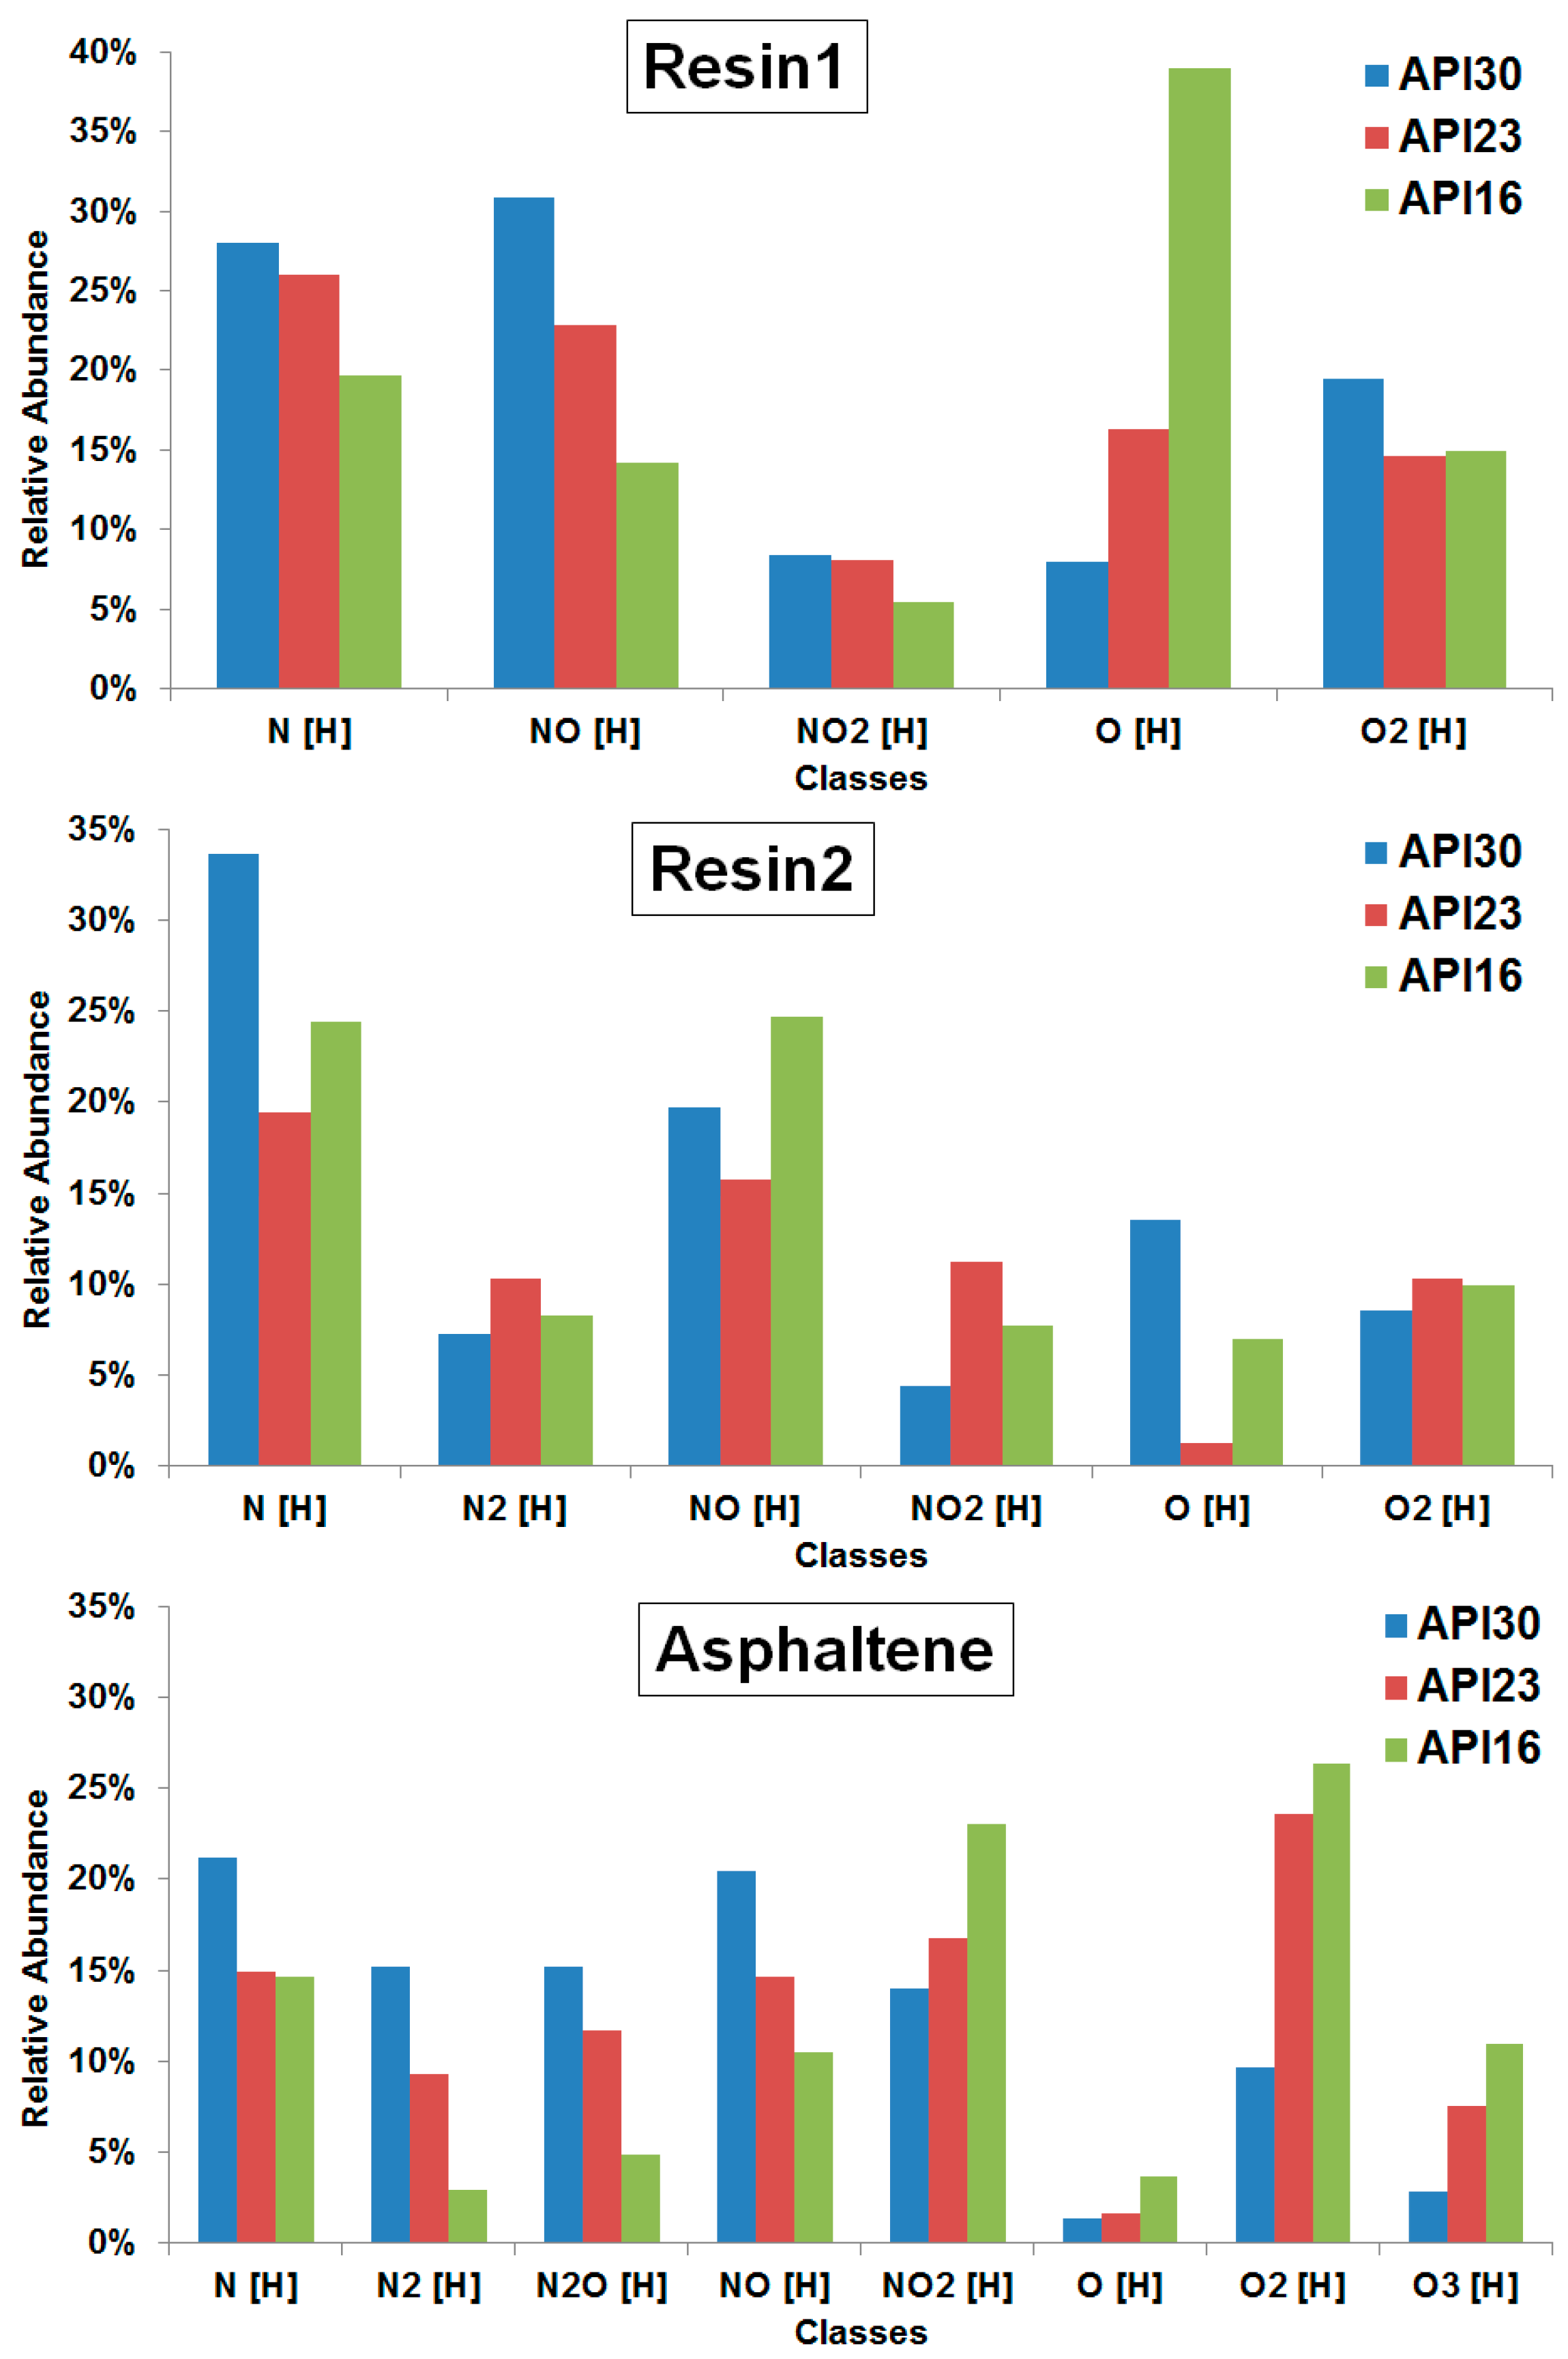
2.3. ESI(−) FT-ICR MS
Figure 3 illustrates the class distribution as determined from assigned elemental compositions as detected by ESI(−) FT-ICR MS for resin1, resin2 and asphaltene fractions (the full spectra are shown in
Figures S4–S6) obtained from crude oils with different API gravities. For the resin1 fraction the most abundant classes in the three crude oils (API30, API23 and API16) were NO[H], N[H] and O[H], respectively. The abundances of classes containing nitrogen (N[H], NO[H] and NO
2[H] classes) directly correlates with API gravity, whereas an inverse tendency of O[H]-class with API gravity was found. For the resin2 fraction the most abundant class found in the API30 and API23 crudes was again N[H], whereas the NO[H]-class was dominant in the API16 crude, indicating no direct trend of class abundance with API gravity.
For the asphaltene fraction N[H] was found to be most abundant in the API30 crude, whereas the O
2[H]-class dominates in the API23 and API16 crudes. The nitrogen dominated classes (N[H], N
2[H], N
2O[H] and NO[H]) directly correlate with API gravity, whereas the classes exceeding oxygen (O[H], O
2[H], O
3[H] and NO
2[H]) inversely correlate. These trends can be due to the oxygenation of compounds during the thermal evolution into heavy crude oils, which are associated with the presence of oxygenated compounds that are present in high abundance and due to high acidic characteristic given by the oxygen compounds [
27]. For instance, compounds of NO[H]-class with higher intensities in the asphaltenes of light crude oil (API30) may undergo oxygenation reactions and form compounds of NO
2[H]-class with higher intensity in heavy crude oils (API16).
We also have found trends between DBE
avg and API gravity. In
Table 4 DBE
avg for the most abundant class of resin1, resin2 and asphaltene fractions obtained from ESI(−) FT-ICR MS data is listed. The DBE
avg inversely correlates with the API gravity for all fractions, as observed for N[H] from ESI(+) data.
We also applied the planar limit concept to the data from the most abundant classes present in resin1, resin2 and asphaltene fractions obtained from ESI(−) FT-ICR MS data (
Table 3). The slope also inversely correlates with API gravity for all fractions.
Then, for DBEavg and slope we have obtained the same aromaticity tendency shown for the ESI(+) data independent of the fractions analyzed, in the following order: API16 > API23 > API30, which suggests that the compounds present in resin1, resin2 and asphaltene fractions seem to be mainly responsible for the API gravity of the crude oils, as shown via ESI(+) data.
2.4. APPI(+) FT-ICR MS
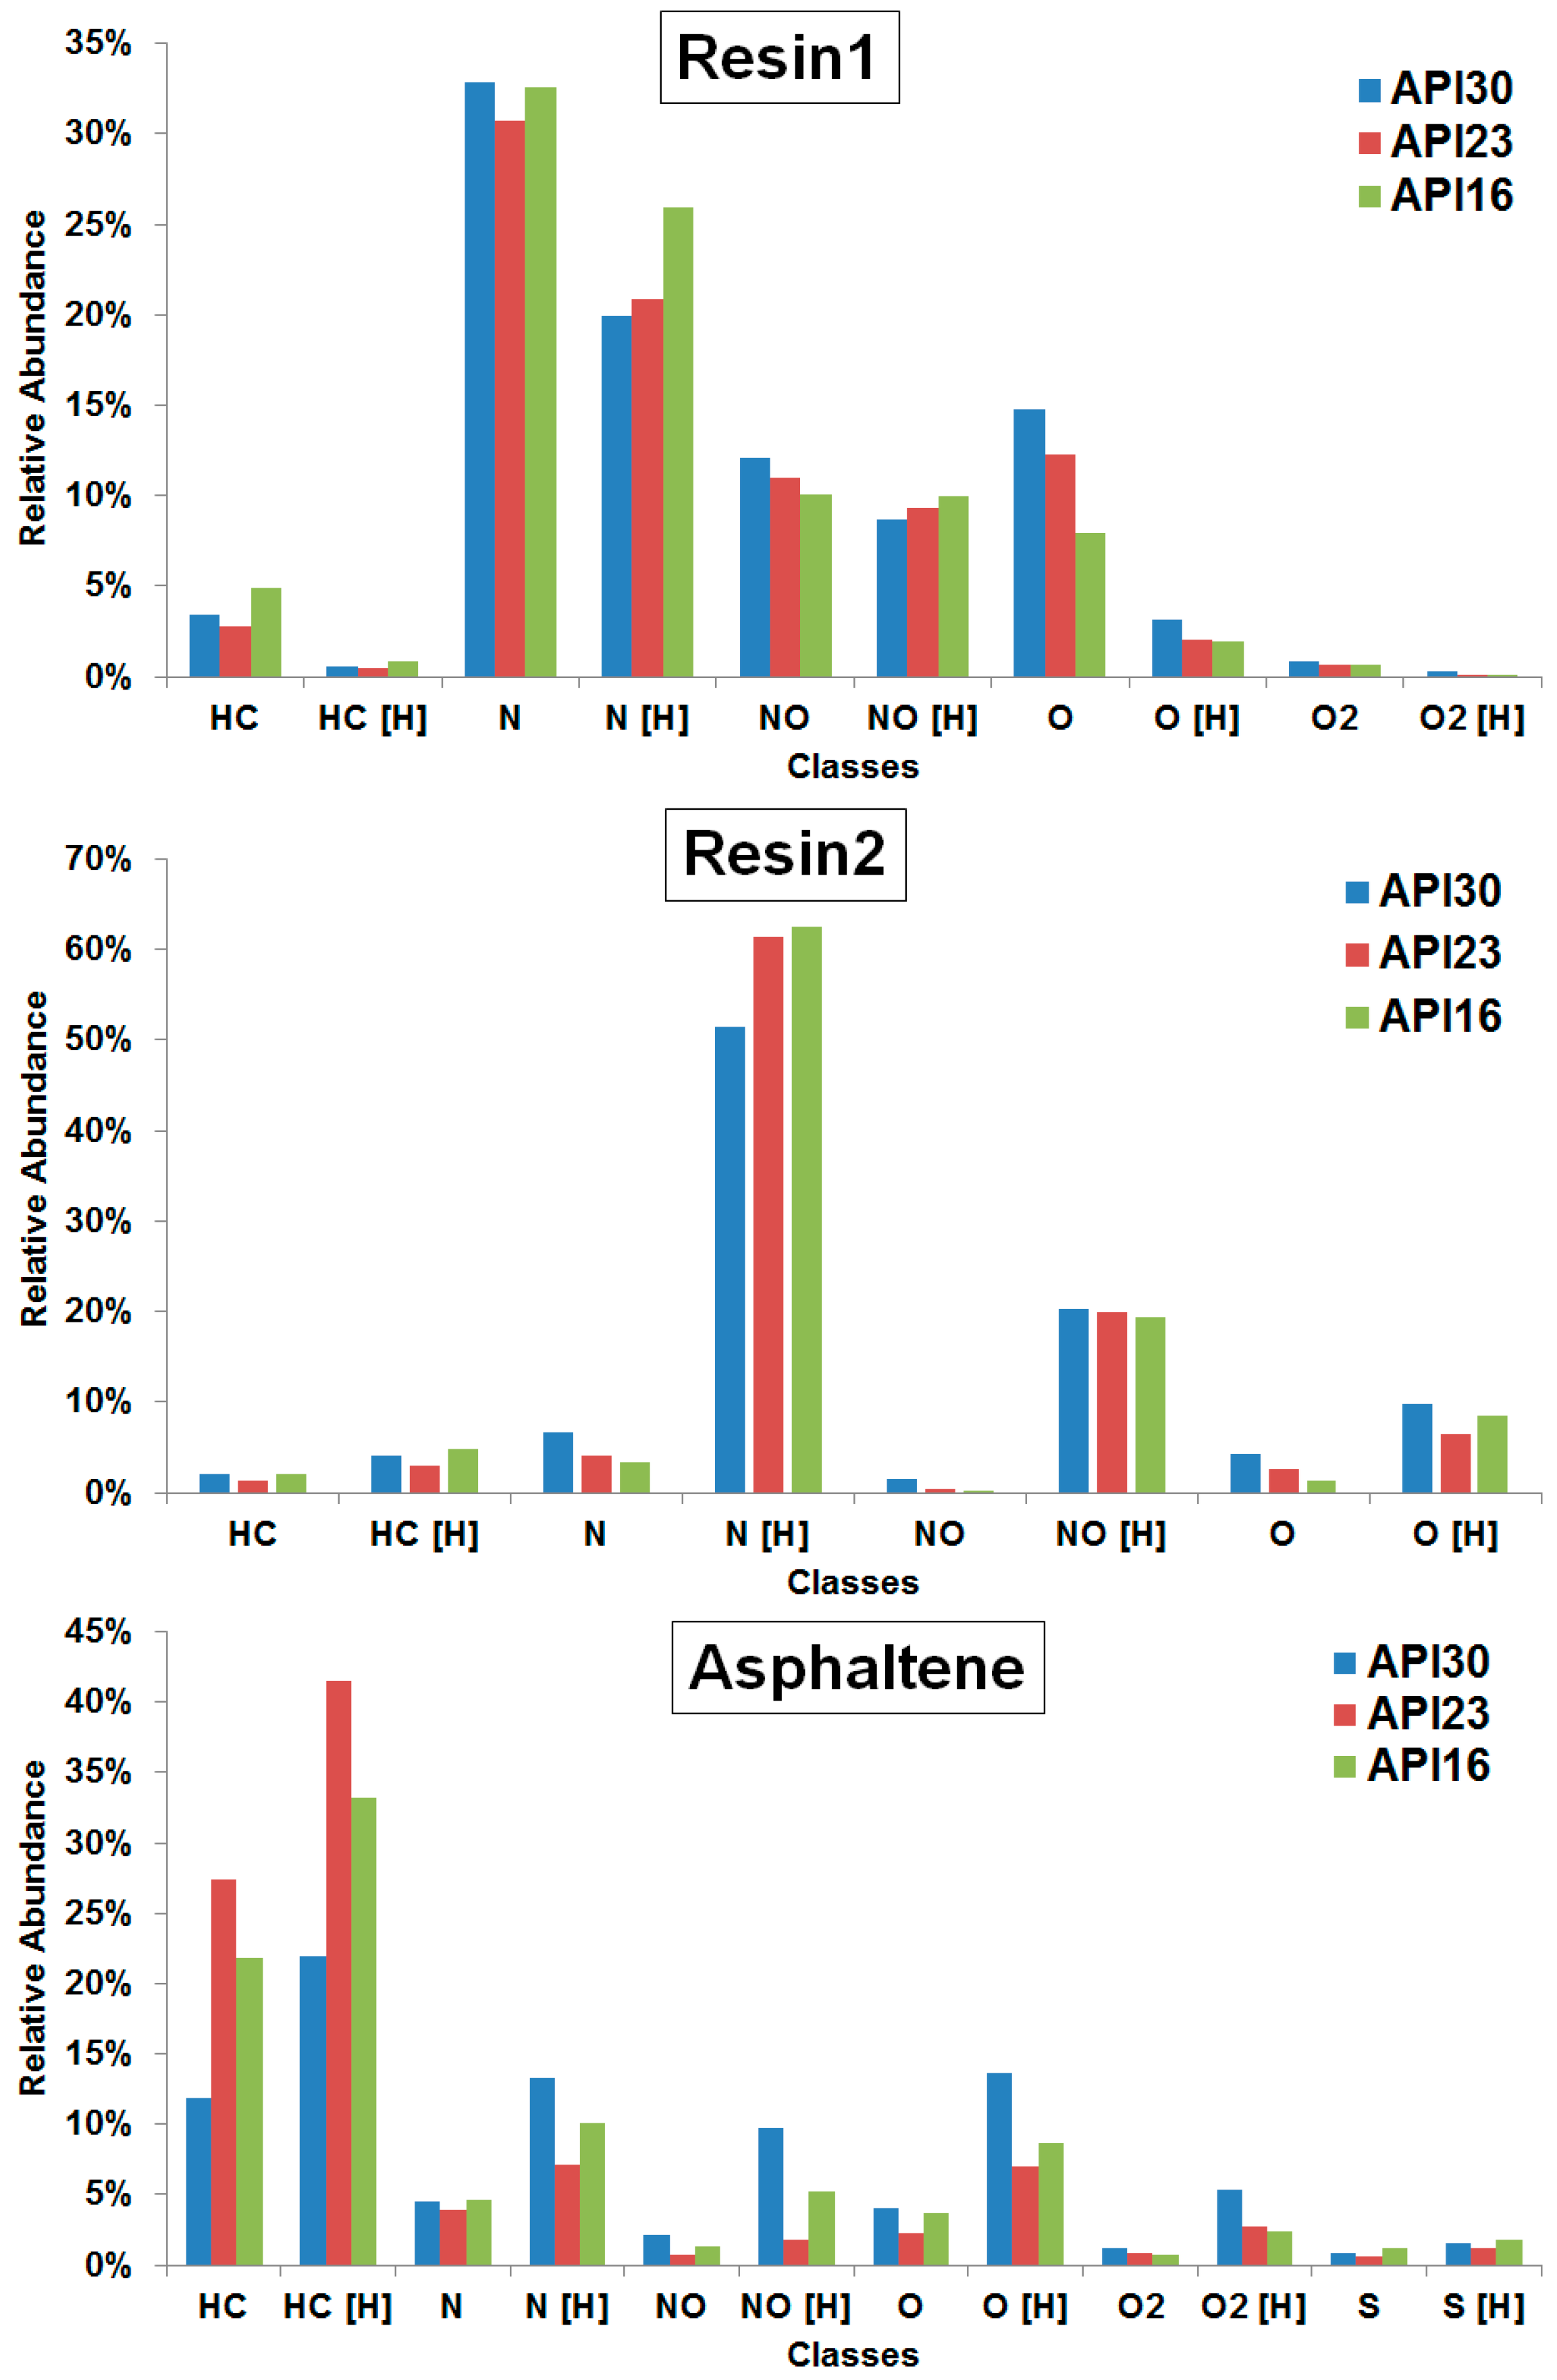
Figure 4 shows the class distribution determined from assigned elemental compositions as detected by APPI(+) FT-ICR MS for resin1, resin2 and asphaltene fractions (the full spectra are displayed in
Figures S7–S9) obtained from crude oils with different API gravities.
The plots reveal the N[H] (and N) class to be most abundant in the resin1 and resin2 fractions, whereas the HC[H] (and HC) class is the most abundant in the asphaltene fraction. In the first part of this study, the APPI(+) FT-ICR MS data of the whole crude oil are dominated by the HC[H] (and HC) class [
24]. The resin1 and resin2 fractions represent the most polar compounds present in crude oils, thus being relatively enriched in N-containing species, whereas the APPI(+) data of the whole crude oil emphasizes the main portion of mainly aromatic hydrocarbons. The SARA fractionation in combination with FT-ICR MS for the characterization of its individual fractions thus allows the reduction of the complexity and a more complete chemical characterization of the components of crude oils.
For the resin1 fraction we have found a direct tendency of NO, O, O[H], O
2 and O
2[H] classes with API gravity, whereas the N[H]-class inversely correlates with API gravity. For resin2 the N[H]-class also inversely correlates, whereas N, NO, NO[H] and O classes directly correlate with API gravity. For the asphaltene fraction, no trends were found as also shown by Pereira and co-workers [
28].
Table 5 summarizes the DBE
avg for the most abundant classes for resin1, resin2 and asphaltene fractions obtained from APPI(+) FT-ICR MS data. For all fractions DBE
avg inversely correlates with API gravity, as was also shown for the ESI(+) and ESI(−) data.
Table 5 also shows the slope of the planar limit equation, which also inversely correlates with the API gravity. Then, from the average DBE and slope obtained by APPI(+) FT-ICR MS data of resin1, resin2 and asphaltene fractions we have found again the aromaticity tendency in the following order: API16 > API23 > API30.
2.5. Combining ESI(±) Plus APPI(+) to SARA Fraction Analysis
For a good representation of all the different data sets a number of different ways can be used. Here, the studies show that the combination of ESI(±) plus APPI(+) FT-ICR MS data is capable of capturing the broadest composition profile of the compounds present in crude oil SARA fractions.
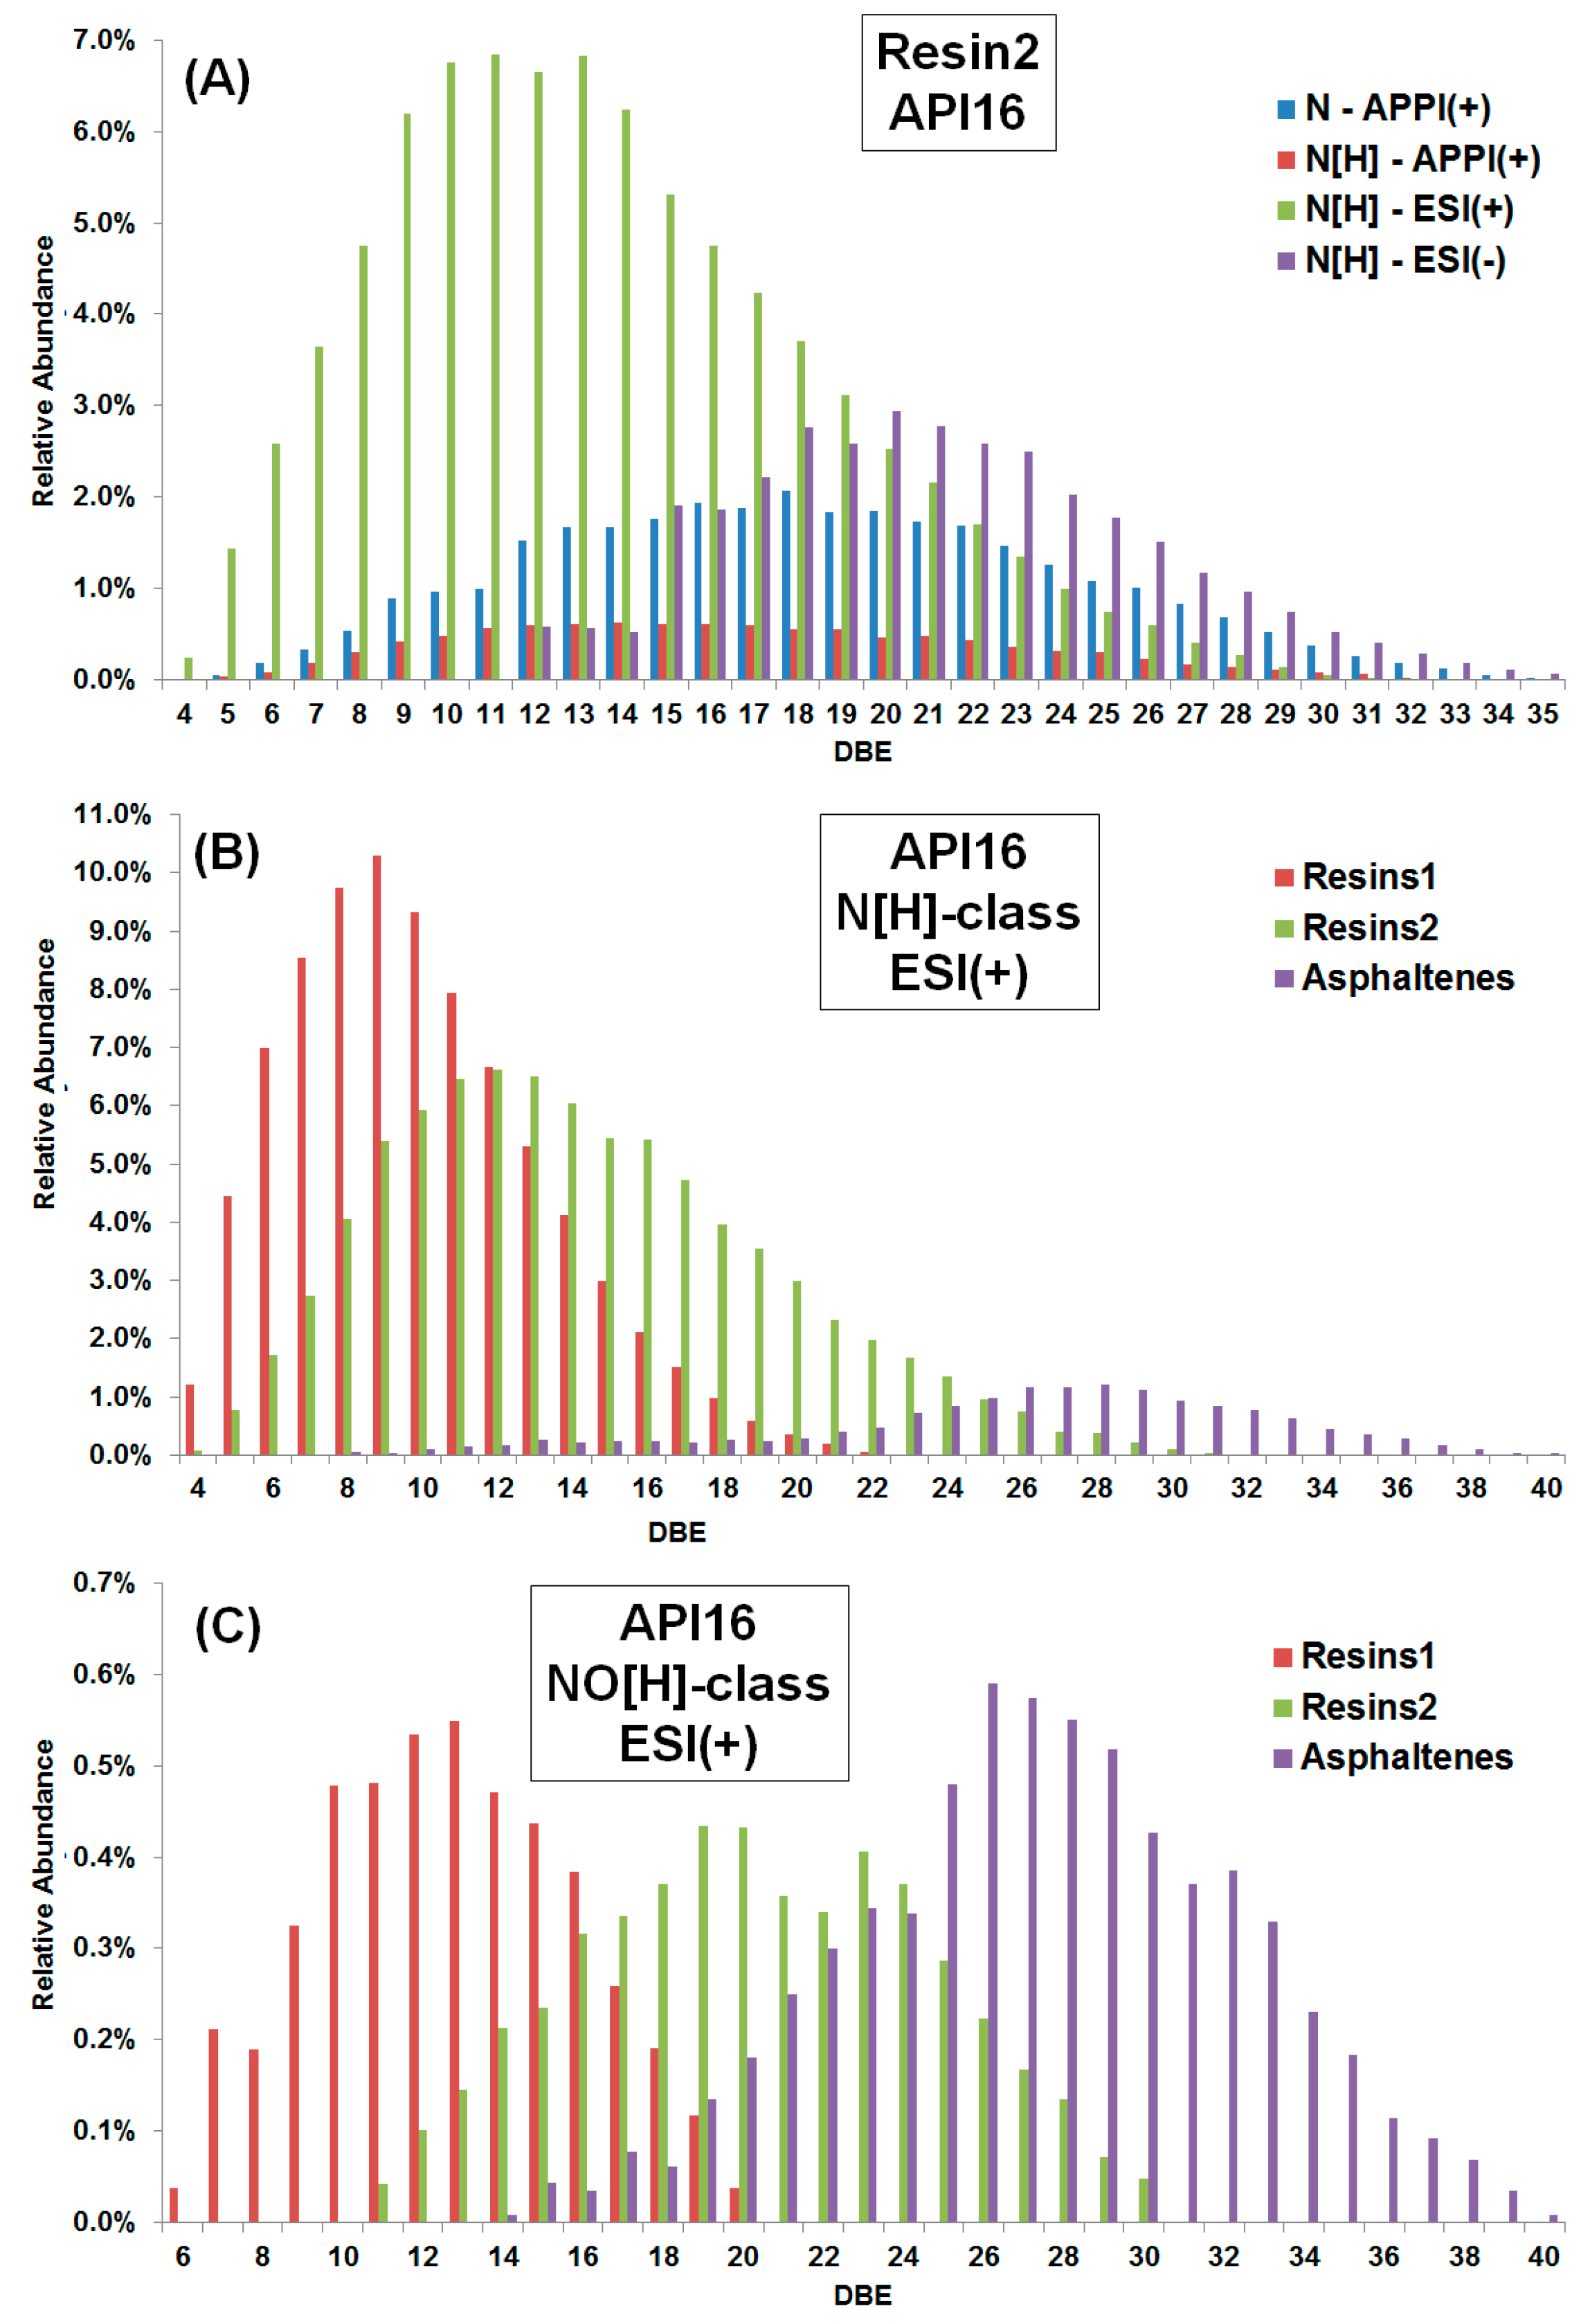
Figure 5A shows a comparison between ESI(±) and APPI(+) FT-ICR MS data for the N and N[H] classes of the resin2 fraction obtained from the API16 oil as an example. The ESI(+) data display by far the best sensitivity for the N[H]-class whereas the broadest DBE distribution from DBE 5 to 35 was found when using APPI(+). ESI(−) shows the highest abundances at higher DBE, which reinforces that the different ionization methods offer complementary data and together yield a more comprehensive molecular analysis of crude oils from SARA fractions [
29,
30].
Another interesting comparison is illustrated for the same classes throughout the SARA fractions.
Figure 5B shows the DBE distributions of the N[H]-class for resin1, resin2 and asphaltene fractions obtained from the API16 crude oil using ESI(+) FT-ICR MS. Note that the DBE distributions are clearly different among the fractions. The resin1 fraction displays by far the highest intensity for the N[H]-class, which is centered around DBE 9, whereas the resin2 and asphaltene fractions present the highest intensity centered around DBE 12 and 26, respectively.
Figure 5C shows a comparison of DBE distribution plots for the NO[H]-class among the different fractions. For the resin1 fraction the DBE distribution is centered around 13, and around 19 and 26 for the resin2 and asphaltene fractions, respectively. We can conclude that the distinct DBE distributions for the N[H] and NO[H] classes show an order of aromaticity among the fractions, in the following order: asphaltene > resin2 > resin1.
The SARA methodology described herein to obtain the second resin fraction (resin2) shows that the resin2 fraction presents a characteristic compound distribution with an intermediate aromaticity level between that found in the resin1 and asphaltene fractions. This finding favors the expectation stated above, that a gradual trend exists between the classically reported resin fraction and asphaltenes.
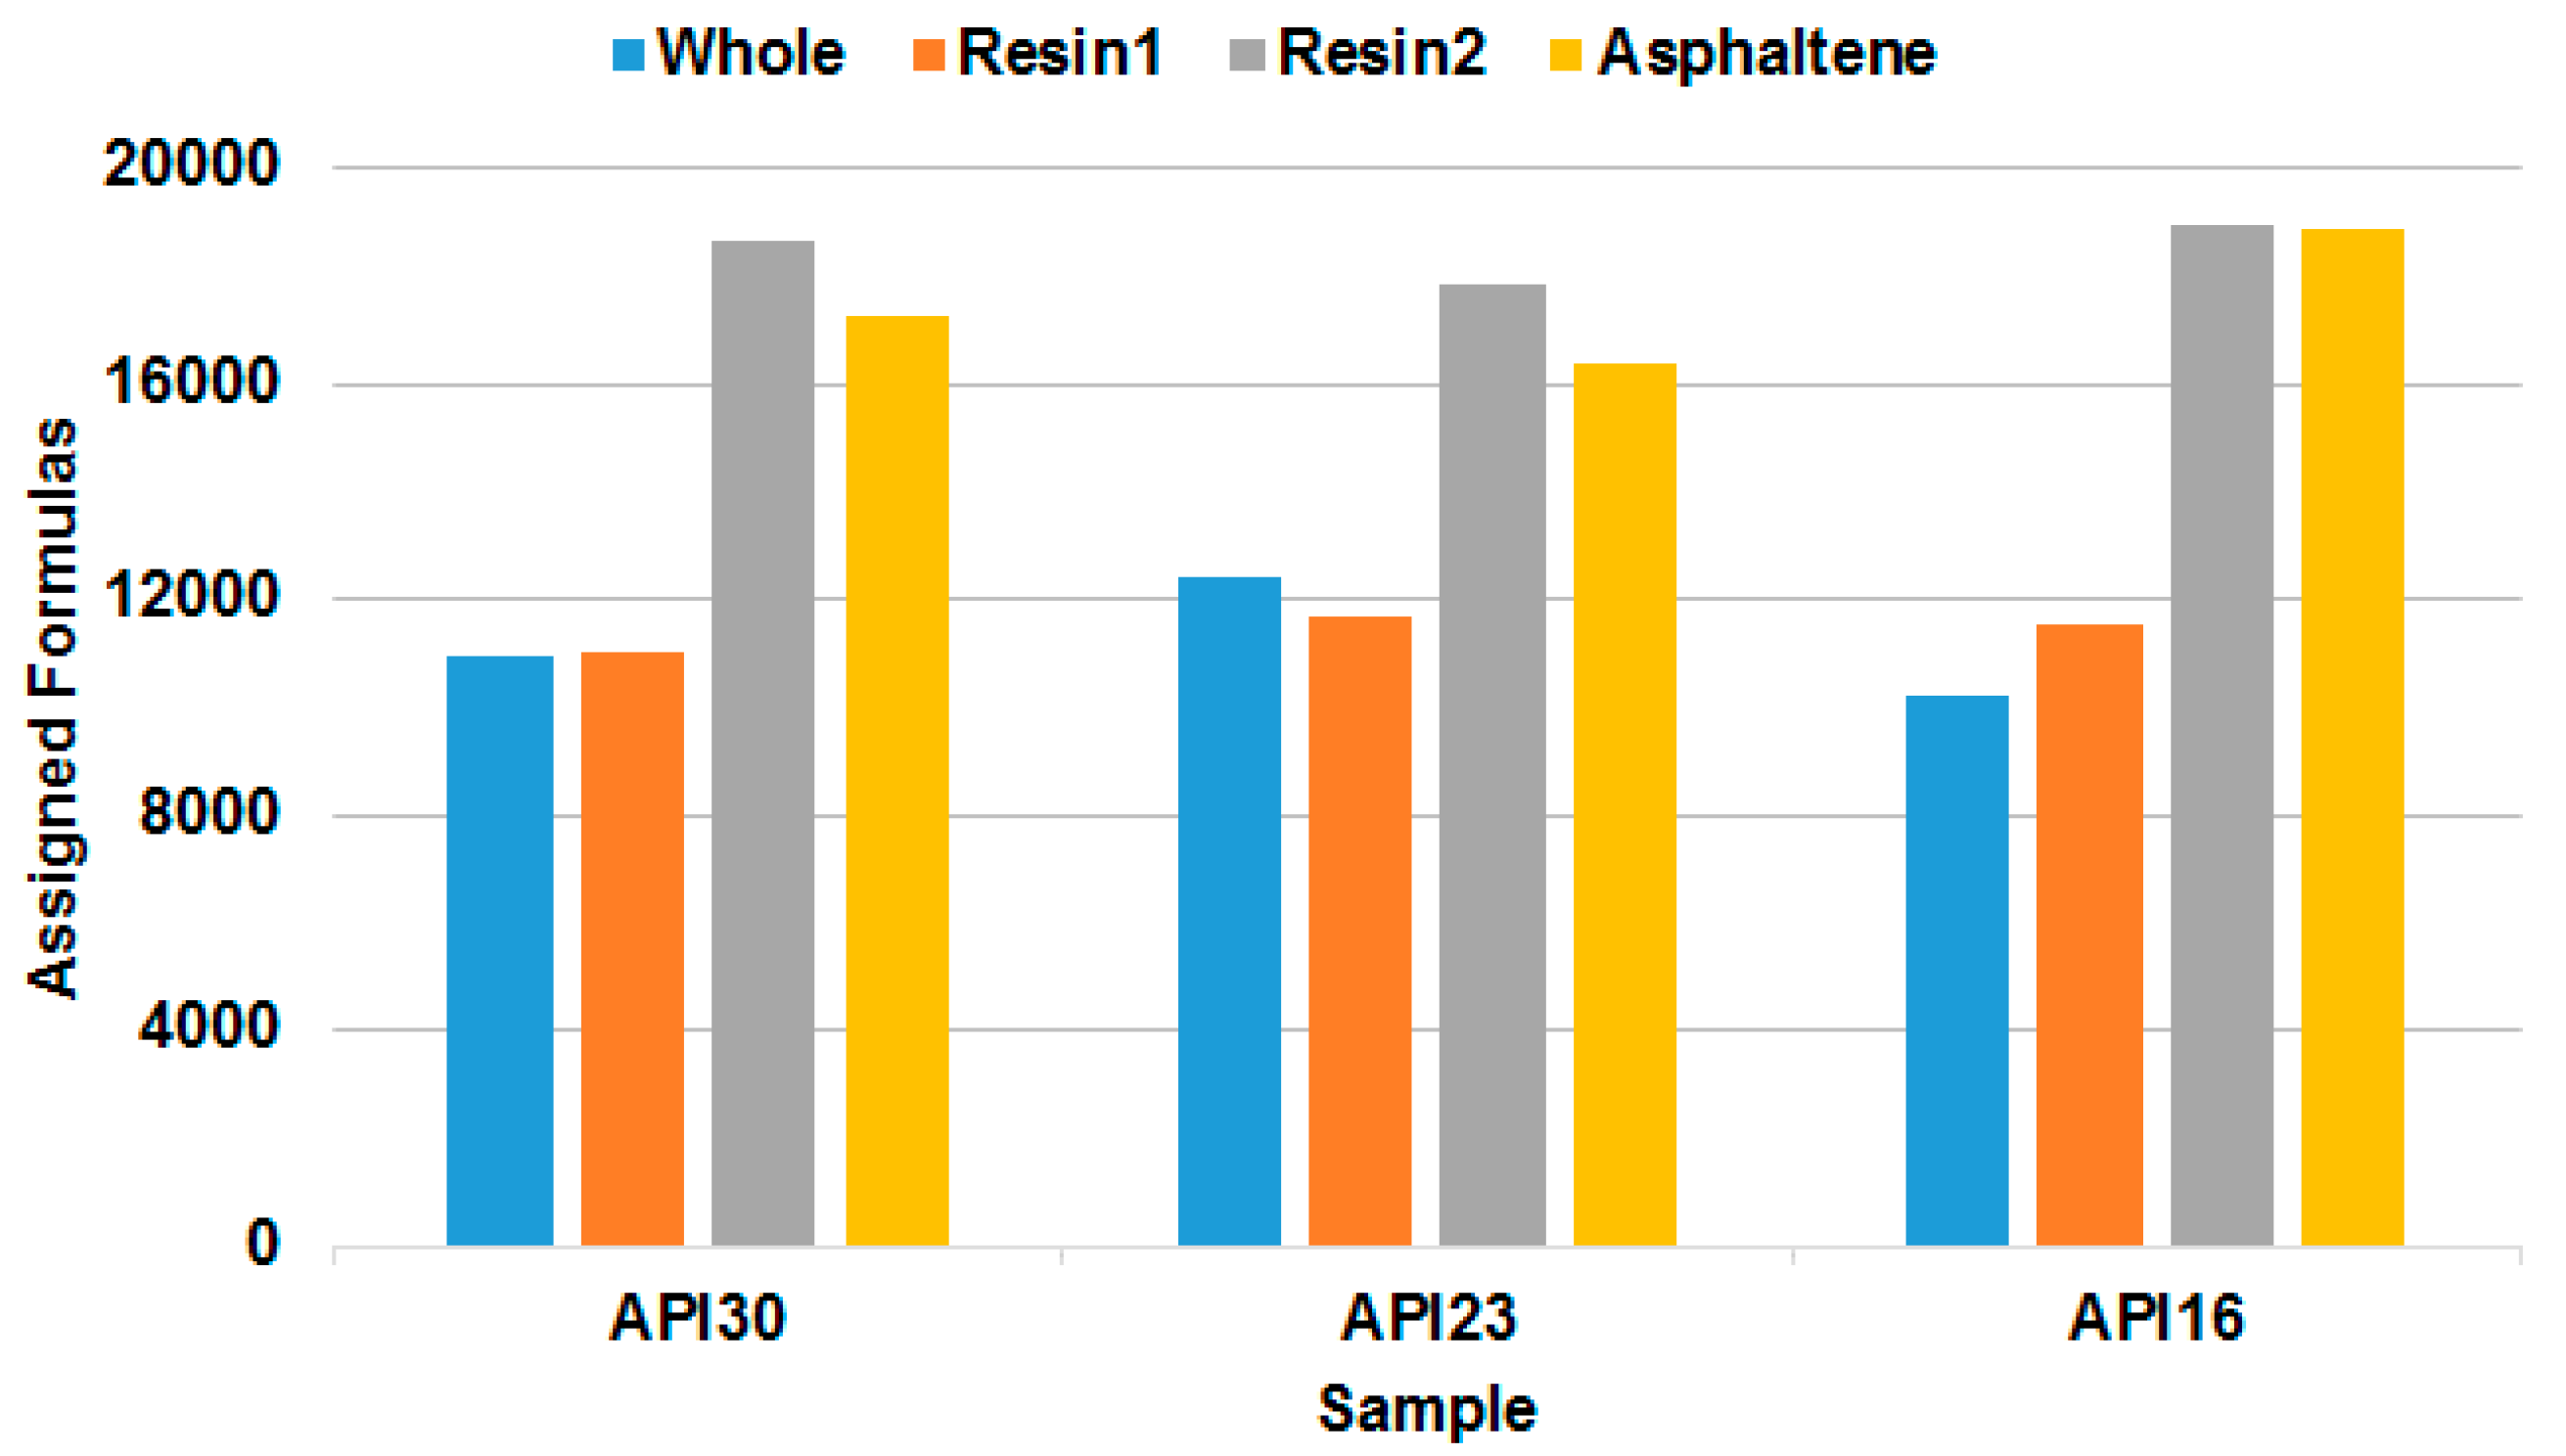
The potential of the SARA fractionation in conjunction with multiple ionization techniques and FT-ICR MS is shown in
Figure 6 from the number of assigned elemental compositions. Summed over the API16, API23 and API30 oils and all ionization techniques we have obtained a total of 46,899, 45,945 and 49,326 assignments for the resin1, resin2 and asphaltene fractions, respectively. This is approximately 4 times higher than compared to the number of formula assignments found for the whole crude oil, as shown in the first part of this work [
24]. The number of assigned elemental compositions in the resin2 and asphaltene fractions is higher than compared to the resin1 fraction or the whole crude oil, which shows that the second resin fraction is an important innovation into the SARA procedure, especially for heavy crude oils.
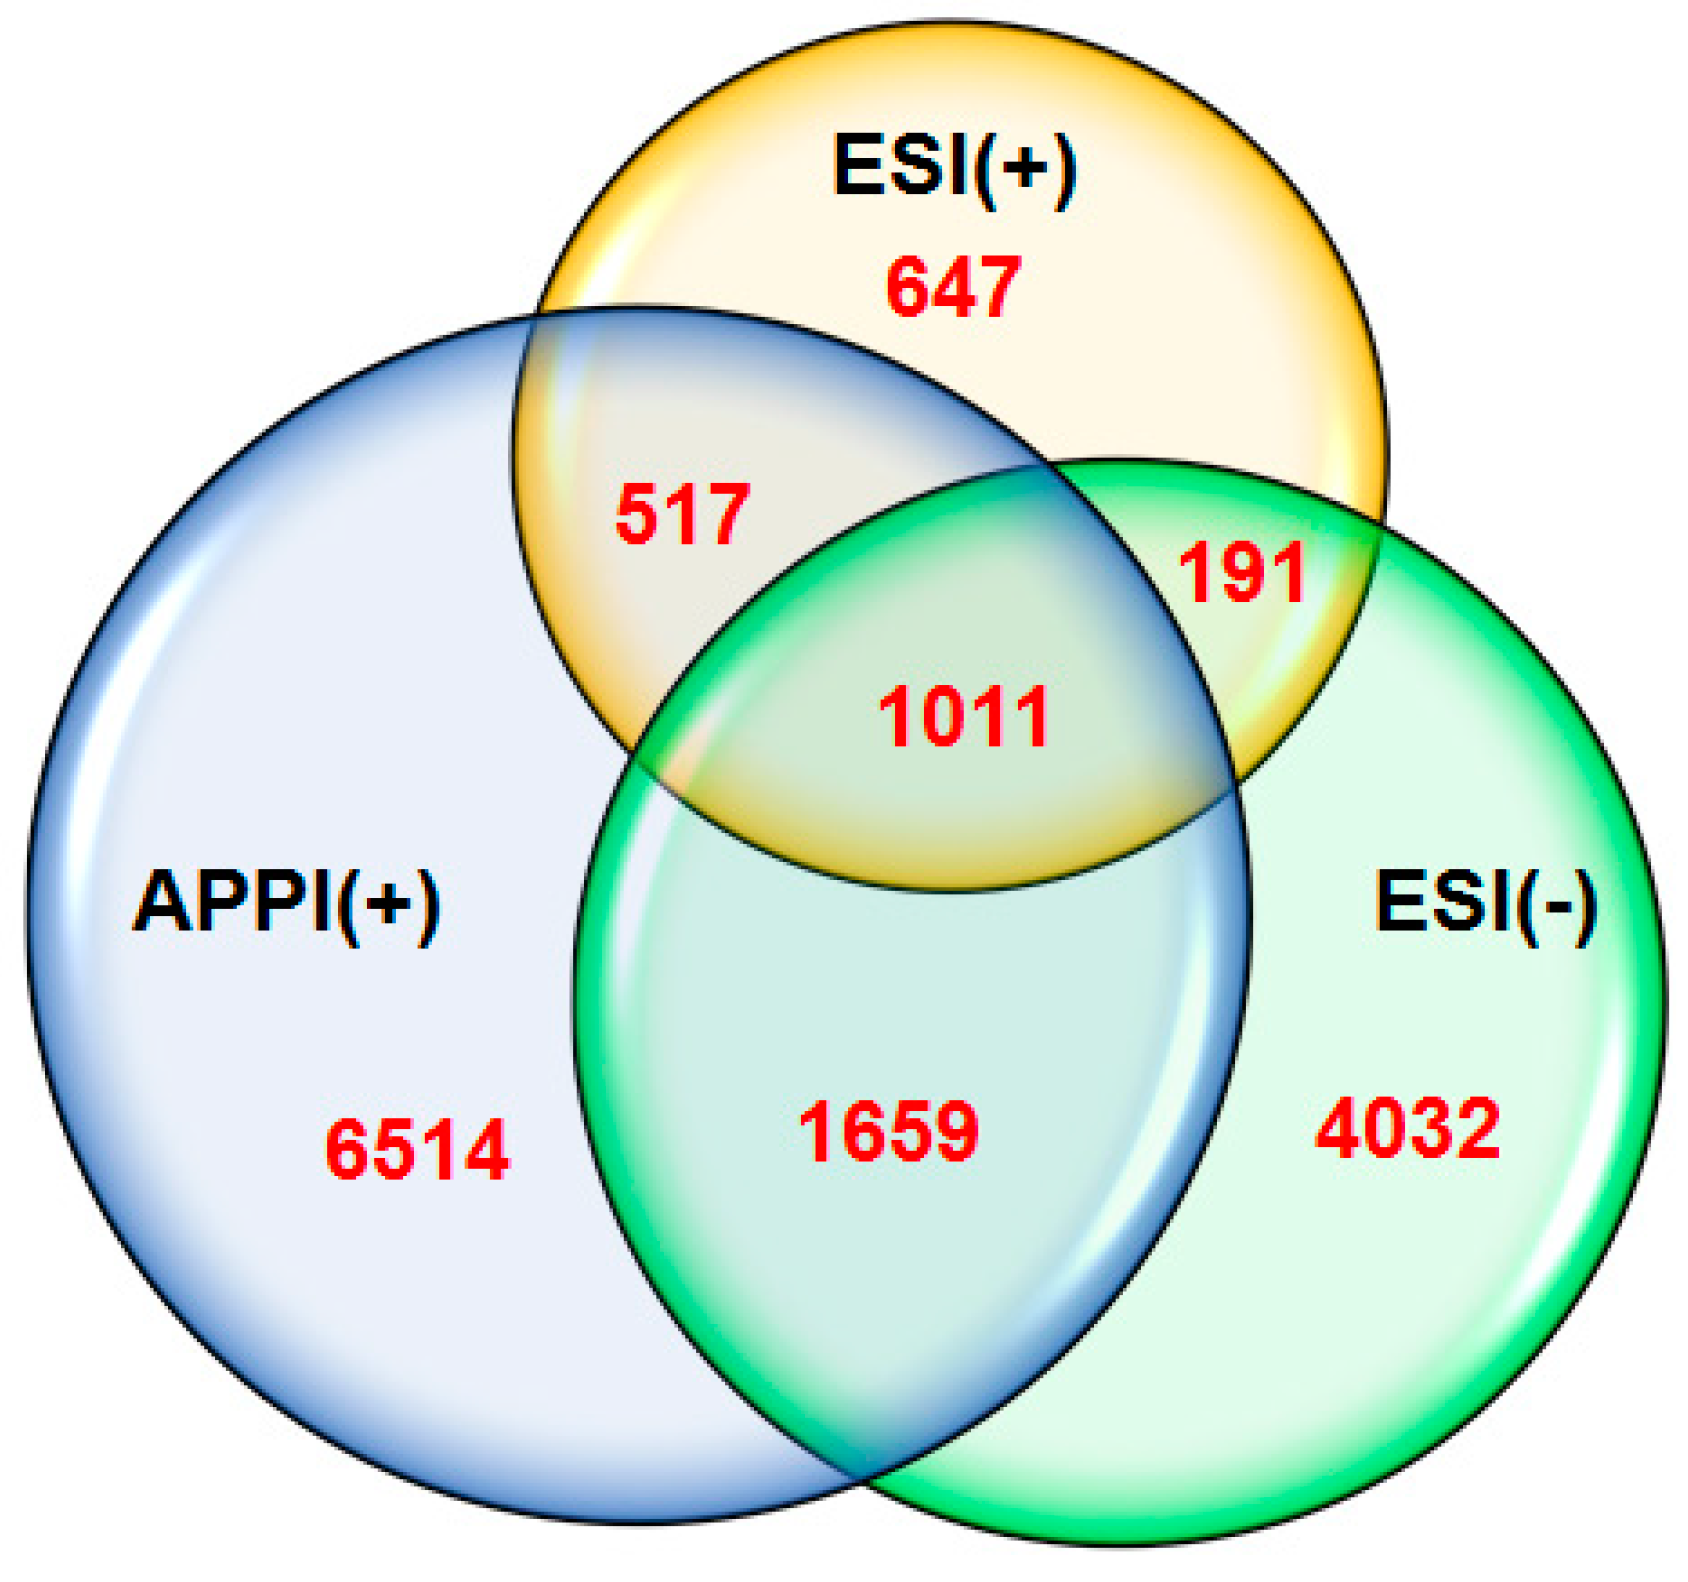
We have constructed Venn diagrams, as illustrated in
Figure 7 for resin2 as a representative fraction obtained from the heavy crude oil sample (API16) to show the complementarity of ESI(±) plus APPI(+) FT-ICR MS data (for a full spectrum see
Figure S10). The number within each circle represents the amount of elemental compositions assigned uniquely for each technique whereas the number within the overlap regions represents the amount of compositions that have been co-assigned from the corresponding ionization techniques. Note that the majority of assigned compositions (11,193, 77%) have been found exclusively by one ionization technique and just a small fraction (3378, 23%) of signals were co-assigned. The number of compositions obtained from APPI(+) greatly surpasses both ESI(+) and ESI(−). The similar amount of elemental compositions in the Venn diagram unique for each technique were also obtained for the samples API30 and API23. The Venn diagram shows that indeed the combination of ESI(±) plus APPI(+) in conjunction with FT-ICR MS and individual SARA fractions analysis provides a quite broad coverage of the overall composition of crude oils.
3. Materials and Methods
3.1. Samples and SARA Fractionation
The properties of crude oil samples used in this work were described previously [
24]. Methanol was purchased from (J.T. Baker, Deventer, Netherlands),
n-heptane and toluene were purchased from Merck KgaA (Darmstadt, Germany), cyclohexane from Acros (Geel, Belgium), dichloromethane and ethyl acetate were from Sigma-Aldrich (Steinheim, Germany).
For the SARA fractionation we adapted the procedure described elsewhere [
15,
17]. Briefly
n-heptane (30 mL of per g of crude oil) was added and the mixture was refluxed for 1 h. Subsequently the mixture was cooled down and stored in the dark overnight. Then, the precipitated portion (the asphaltenes) was filtered off (Whatman, type 589.3 blue ribbon filter). The asphaltene loaded filter was placed into a Soxhlet extractor and refluxed with
n-heptane for 2 h to wash off remaining maltenes. The solvent was then replaced with fresh toluene (150 mL) and the extraction proceeded until asphaltenes had been dissolved from the filter paper (24 h). The re-dissolved asphaltene fraction was rotary evaporated and afterwards dried under a continuous stream of nitrogen. The combined maltene portions were adsorbed onto activated neutral alumina (80–200 mesh, Brockmann I, Sigma-Aldrich, Steinheim, Germany) and subjected to open column chromatography (activated neutral alumina, 3 × 40 cm). Cyclohexane, cyclohexane:dichloromethane (1:1,
v/
v), methanol and ethyl acetate were used consecutively to elute saturates, aromatics, and two resin fractions (resin1 and resin2), respectively. The separation was monitored by UV absorbance of the effluent. For mass balance volatile compounds were determined by evaporation at 50 mbar and 40 °C.
Measurements of the first and second resin and the asphaltene fractions were performed using stock solutions in toluene of 1 mg·mL−1. These were further diluted in methanol to obtain a final solution of 0.3 mg·mL−1 in toluene:methanol. For ESI(+), formic acid was added to favor [M + H]+ ions, and for ESI(−) methanolic ammonium hydroxide was added to favor [M − H]− ions. For APPI(+) no additives were added as the solvent toluene can act as a dopant for dopant assisted APPI.
3.2. Elemental Analysis
The measurements of C, H, N, and S contents of the resin1, resin2 and asphaltene fractions were obtained from a Vario Elementar CHN-Analyzer (Elementar Analysensysteme GmbH, Hanau, Germany). The O content was calculated as the difference to 100%.
3.3. FT-ICR MS Analysis
FT-ICR MS analyses were performed using a 7 T linear trap quadrupole (LTQ) FT-ICR mass spectrometer (LTQ FT Ultra, Thermo Fisher, Bremen, Germany) equipped with an ESI or APPI source. For ESI(±) a capillary voltage of +4.0 or −3.4 kV, tube lens voltage of +100 or −120 V and a capillary voltage of +35 or −40 V, respectively and a capillary temperature of 275 °C were used. Nitrogen was used as nebulization gas with a sheath gas flow of 5–10, auxiliary and sweep gas flow of 1 (arbitrary units). The sample solutions were directly infused at a flow rate of 5 μL·min−1. For APPI(+) the vaporizer temperature was set to 350 °C, with a capillary temperature of 275 °C. Tube lens voltage was +75 V. Nitrogen was used as nebulization gas with a sheath gas flow of 10–20 and auxiliary and sweep gas flow of 5 (arbitrary units). A flow rate of 20 μL·min−1 was used for direct infusion. Ionization was performed using a Kr-VUV lamp with photon emission at 10.0 and 10.6 eV (Syagen Technology, Santa Ana, CA, USA). All analyses were performed using a transient of 3 s resulting in a mass resolving power of m/∆m50% = 400,000 (FWHM at m/z 400), collecting 100 scans for each run. The data acquisition was performed in the mass range of m/z 200–1400.
3.4. Data Analysis
The FT-ICR MS data obtained were averaged by Xcalibur 2.2 software (Thermo Fischer Scientific, Bremen, Germany) and then imported to Composer software (v1.5.0, Sierra Analytics, Modesto, CA, USA) for peak assignment. Constraints for the assignment of elemental compositions were: 0 ≤ H ≤ 1000, 0 ≤ C ≤ 200, 0 ≤ N ≤ 3, 0 ≤ O ≤3, 0 ≤ S ≤3 and 0 ≤ DBE ≤ 40 with a maximum mass error of 1 ppm. (De-)protonated molecules and radical ions were distinguished and assigned separately. Then, the assignment data were transferred into sorted Excel workbooks by an in-house written algorithm for further evaluation.

 ,
, 
