1. Introduction
In recent years, a great deal of research regarding the problem of how to reduce energy consumption in buildings has been carried out [
1,
2,
3], incorporating new materials [
4,
5,
6] and facilities related to daylighting analysis [
7], natural ventilation [
8], energy usage behavior [
9] and photovoltaics facilities [
10]. It should be noted that the building sector is currently responsible for at least 40% of the total energy consumption in the European Union (EU), which makes it a strategic goal for the reduction of greenhouse gas (GHG) emissions, responsible for the Earth global warming.
The majority of these studies have focused on analyzing the problem in cold climates from a generic point of view [
11,
12], from a construction materials perspective [
13,
14,
15], or focusing on the typology [
16], usually residential [
17,
18,
19]. This has generated a set of solutions that are not directly applicable in other climates. The solutions provided by traditional passive strategies in cold climates become more complex in subtropical climates. This is mainly because the direction of heat flow through the envelope reverses. During much of the year, it is a question of preventing heat not from escaping the building but from entering the building. In this case, the internal charges produced by solar radiation, artificial lighting, occupation, and others depending on its use (cooking, cooling, etc.) only aggravate the problem instead of contributing to its solution.
Another important characteristic of the subtropical climate is that, depending on the latitude, altitude, or even proximity to the coast, in a certain number of months of the year, the climate pattern is comparable to cold climate. This explains the complexity of building operations in subtropical climates, since it is not possible to meet the comfort needs of a dwelling place following the same strategy all the year around.
Among those few studies that analyze the behavior of buildings in subtropical climates, most methodologies are based on energy simulations carried out with computer applications [
20,
21,
22,
23], sometimes including specific aspects such as heritage [
24], retrofitting [
25,
26], economy [
27], windows shading [
28], facilities [
29,
30], and architectonical solutions for roofs [
31]. The problem of drawing definitive conclusions based on data produced by computer applications is that their scientific validity is conditioned by various factors such as the internal calculation algorithm used, the quality of the actual building model, and the availability of climate data at the specific location. Thus, although the energetic simulation of the building can be considered a preliminary phase of interest, the achievement of conclusive results requires applying a method of study based on the analysis and interpretation of actual physical variables, obtained by an instrumentation/control system (ICS) under actual operating conditions of the building. The ICS can work independently of the home automation system, complementary to it or as part of it.
The traditional computer-aided design (CAD) model has been overcome today by building information modeling (BIM). This new software standard oriented to architecture and engineering is a powerful tool for decision-making in all phases of the project, including construction work and building operation [
32,
33,
34,
35,
36,
37,
38,
39,
40,
41]. It consists of a complex database of graphical and numerical data of the building with multiple inputs and outputs of information that are updated in teamwork, always maintaining the coherence of the model and resulting in a deliverable in itself (not only conditioned to the production of printed documents in traditional support).
Very few studies analyze the problem of energy saving in buildings in subtropical climates based on real measured data [
42,
43,
44], focused in the constructed enveloped [
45,
46,
47], the analysis of day lighting [
48], and air conditioning [
49,
50]. Others propose a new methodology [
51], and some have focused on the operation and maintenance phase [
52], but none of them (as far as is known by the authors) have proposed a method of design, construction and operation of buildings that integrates passive, active, constructive, and maintenance strategies in a single, coherent, and orderly methodology. Therefore, this work can be considered a novelty in this field.
Regarding new buildings in the EU, Directives 2018/844/EU and 2012/27/EU establish a specific mandatory for member states to draw up national plans to increase the number of nearly zero energy buildings (nZEB). According to both directives, the member states national plans must include the detailed definition of the nZEB concept in such a way that their national, regional, or local conditions are reflected, and a numerical indicator of the primary energy use must be included and expressed in kWh/m2 per year.
While we wait for these national plans to be put into effect, more ambitious concepts, such as zero energy buildings (ZEB), where demanded energy = generated energy (attending only to energy consumption, but this definition is stated in different ways depending on the bibliography in use [
53]) and buildings that produce more energy than they consume (+ZEB), where demanded energy < generated energy, are far from being considered in a timely manner in the mandatory state regulations. However, the current state of science and technology allows for designing and constructing nZEB, but also ZEB and even +ZEB.
With that in mind and adhering to the strict meaning, a building could be nZEB, ZEB, and even +ZEB, and not be energy-optimized. It would be enough if the building were able to produce energy in a renewable way to achieve the previous energy balances. In order to avoid such perplexity, the authors of this paper propose the concept of a minimum energy building (MEB). MEB defines an energy-optimized building based on the strict compliance of some energy parameters that are specified herein for subtropical climates. As explained below, the operation of the building is more complex than in cold or tropical weather. The MEB concept can be transferred to any climate.
The MEB concept described in this work requires that the transition from nZEB to +ZEB via ZEB is made exclusively through renewable energy facilities. Based on the above, an MEB can be nZEB, ZEB or +ZEB, nZEB being the initial stage. With the proposed methodology, an MEB is rated at least nZEB from the start. It is a way of prioritizing that the first target to meet is maximum energy optimization (i.e., MEB); thereafter, the second target would be that of remaining nZEB or raising it to ZEB or +ZEB. This implies that in an MEB, the energy waste is not allowed, even if it has been produced in a renewable way. Besides being an undesirable environmental practice, energy waste not only increases the complexity of the building’s facilities but also its budget and management costs.
The depicted methodology for the design, construction, and operation of MEB in subtropical climates is called the University of Huelva minimum energy building (uhuMEB). It is based on a sequential model of orderly and hierarchical strategies applicable to both current professional practices as well as to the didactics of the project and its construction management. The project and construction of an MEB in subtropical climates entails a compromise between architecture and engineering with a global conception of the process: a holistic strategy that seeks the greatest synergy among all the elements involved (building envelope, facilities, ICS, data analysis, etc.) in the search for the MEB objective.
It is important to bear in mind that this paper focuses on the methodology, criteria, and requirements that must be met by an MEB in subtropical climates, and not by the specific way of achieving it. This achievement is not part of the aim of this paper, which will require work that is different for each building, since it is conditioned by its casuistry (location, aesthetics, morphology, distribution, capacity to host facilities, use, budget, etc.). Consequently, the uhuMEB refers exclusively to the criteria to be met from the point of view of energy efficiency. Therefore, nothing or very little will be said regarding the other architectural and engineering variables to be considered in the design, construction, and operation of a building.
Notwithstanding the foregoing, in the case study illustrated herein, constructive and facilitative solutions are proposed. Furthermore, they only referred to a specific building and may not hold for other. The depicted methodology can be implemented both for professionals and professors. It includes the whole process (from design to construction and operation phases of the building), was conceived step by step (from nZEB to ZEB and +ZEB), works properly in subtropical climates, and is based on the real behavior of the building (instead of just on software simulations).
This article is structured as follows. In
Section 2, the set of materials and methods used in the research is introduced. Some are commercial while others are specific and are not part of the subject of this paper.
Section 3 explains the development of the proposed uhuMEB methodology, describing all stages step by step. The implementation of the methodology by a case study is carried out in
Section 4. In it, the proposed methodology is applied to a new single-family house in a subtropical climate. The results of this section are discussed in
Section 5. The paper ends with the main conclusions that are drawn from the research carried out.
2. Materials and Methods
This section contains all the hardware and software used in this research. Some of them are commercial, but others have been developed specifically by the authors and their research team. In any case, they are all tools for this work, but none of them belong to the goals of the research, which are developed from the following section.
The BIM software used for the architectural design and energy simulations of the building that constitutes the practical case is ArchicadTM (version 17.0) from the GraphisoftTM Company. The project building information protocol used is based on the model of the American Institute of Architects (AIATM).
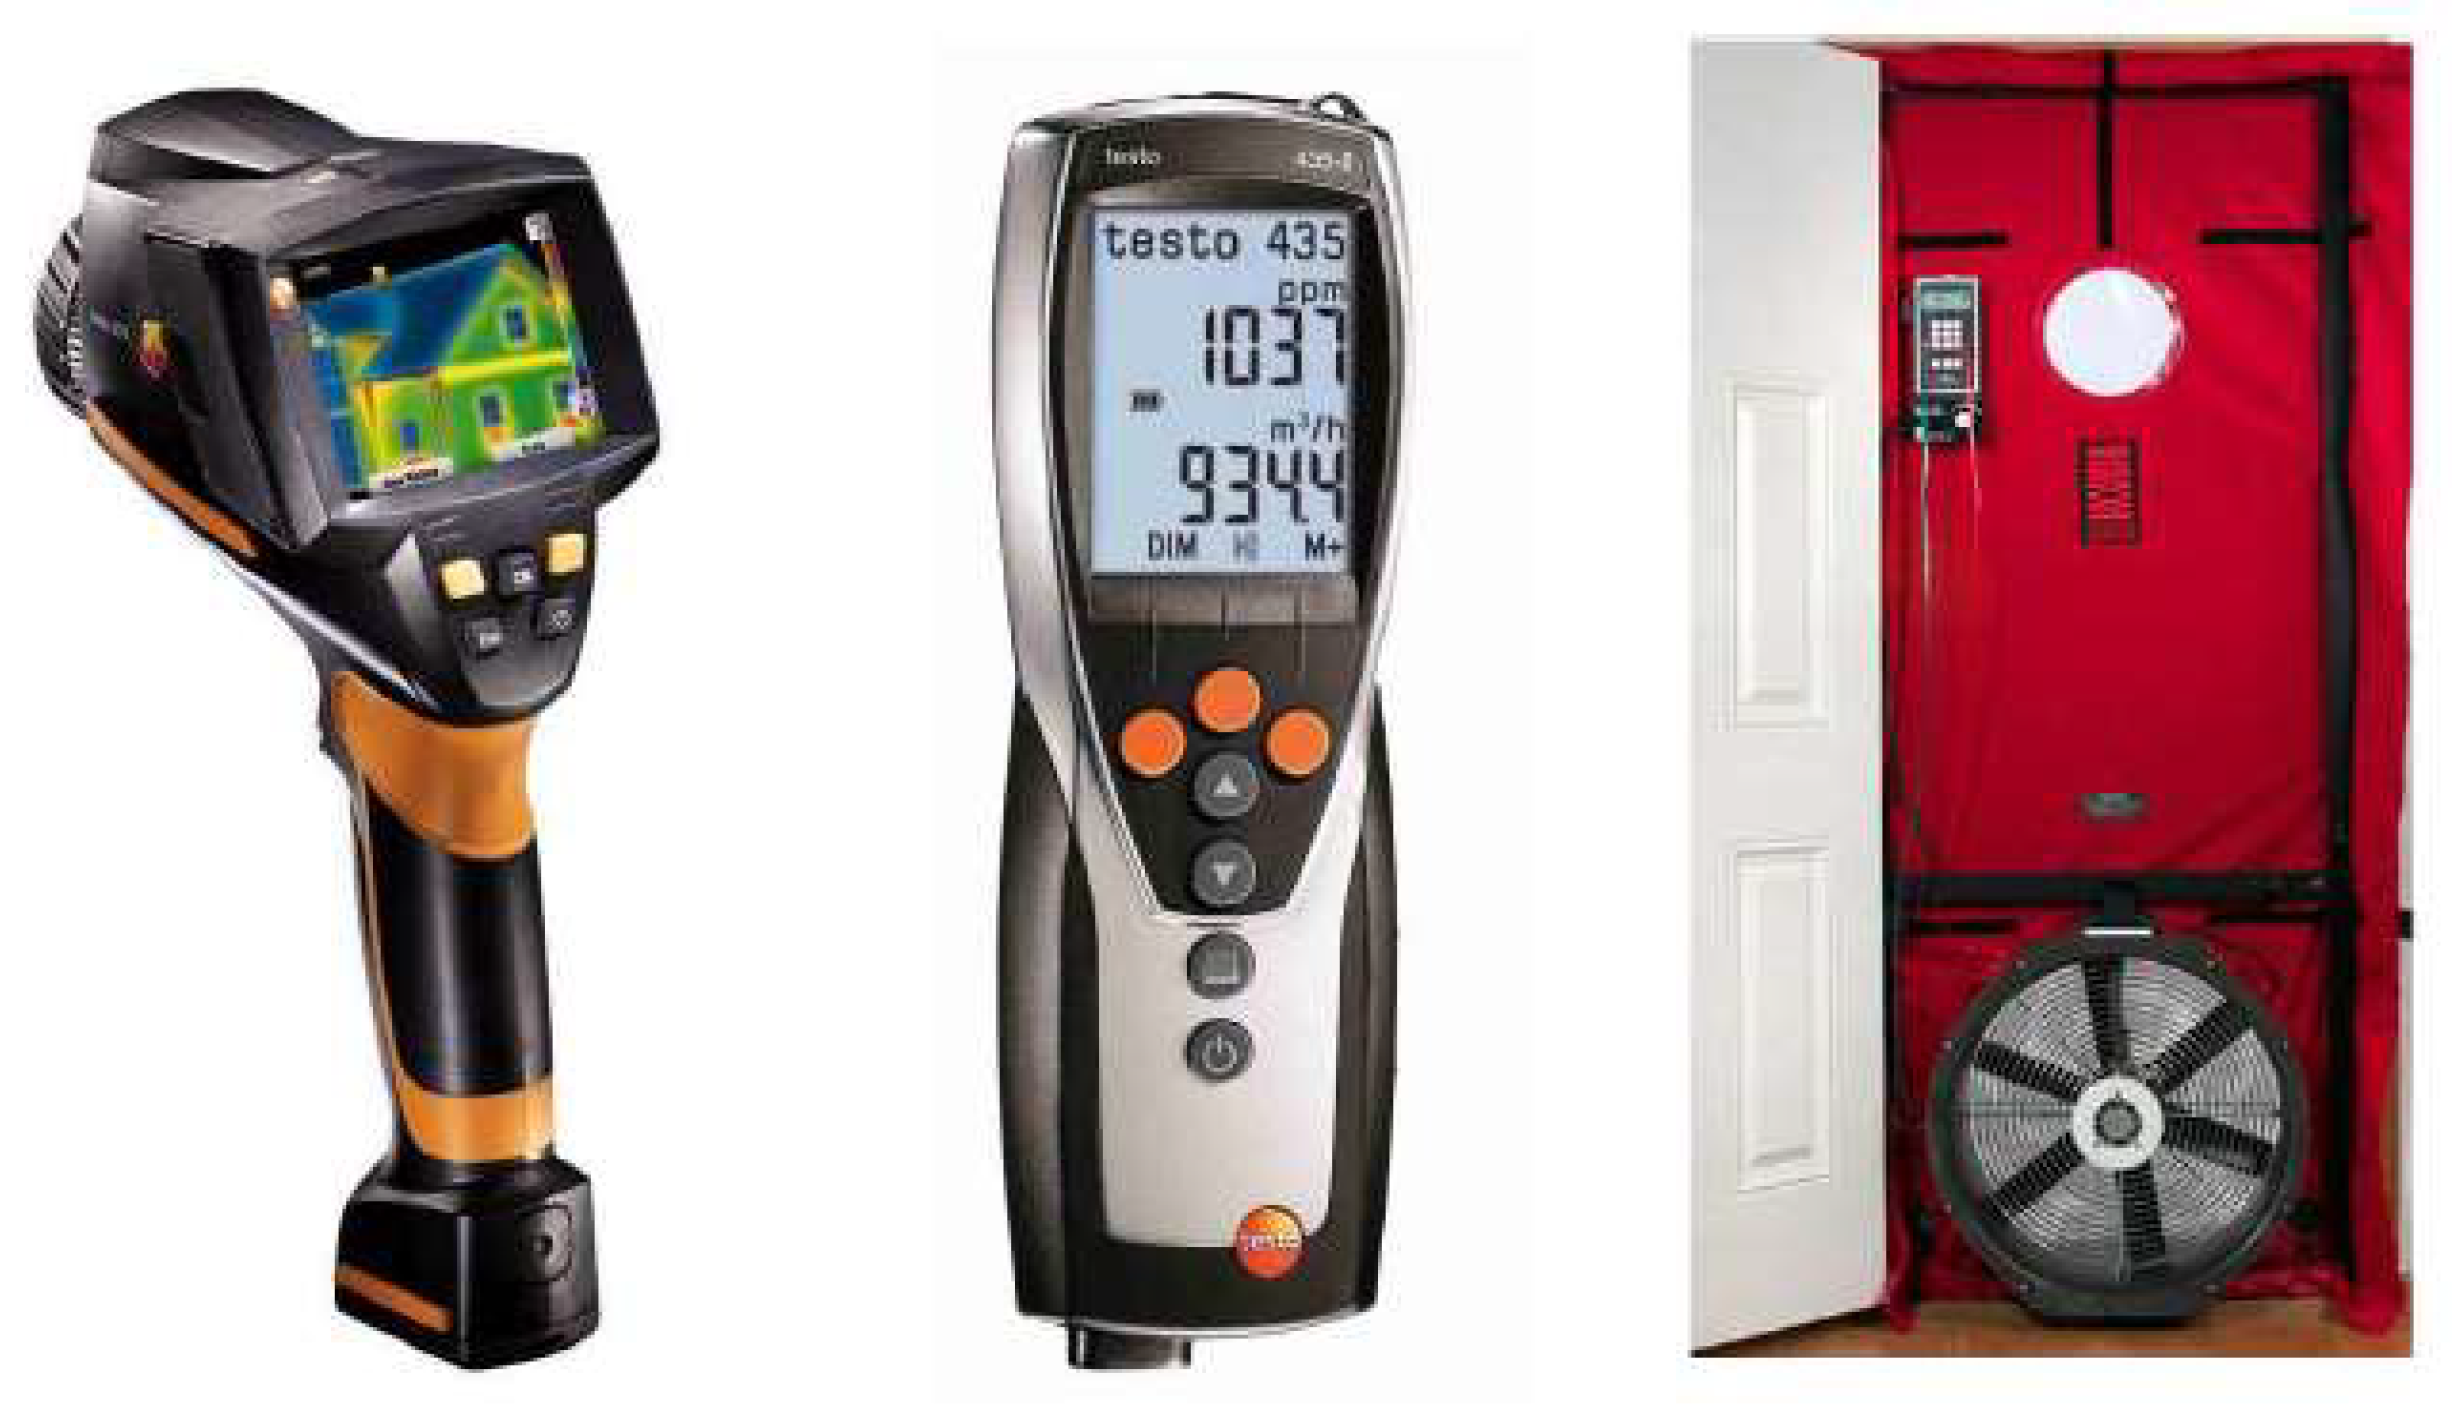
The thermographic measures that verify the correct execution of the insulation during the construction works and the continuity of the envelope of the finished building have been taken with a TESTOTM 875-1i camera, with a matrix of 120 × 160 sensors and a thermal resolution (noise equivalent temperature difference, NETD) < 50 mK. Temperature ranged from -20 to +350 °C. TESTOTM processing software (IRSoftTM) was used.
The device for measuring the thermal transmittance or U-value of the building envelope (rate of heat transfer—in Watts—through one square meter of a structure, divided by the difference in temperature across the structure) was the TESTOTM 435-2 multifunction instrument with 2 channels for measuring temperature (negative temperature coefficient or NTC and K thermocouple sensors), relative humidity, air speed, flow rate, absolute pressure, light intensity, turbulence, and CO2. The processing software is also from TESTOTM.
The standard procedure EN 13829 (the blower door test (BDT)) was followed to check the building envelope airtightness [
54,
55,
56]. For this, the Minneapolis Blower Door TM System (with DG-700) has been used. The total volume of air to be insufflated/extracted in the dwelling varies with the difference of pressure between the indoor and the outdoor (50 Pa), resulting in the value of the test expressed in renewals per hour (volume of air blown in an hour by internal air volume of the dwelling).
All devices used in the case study are shown in
Figure 1. The ICS for obtaining building data has been developed specifically for this research. Although it is not the subject of this article, it is explained briefly below so as to ensure that the work is self-contained.
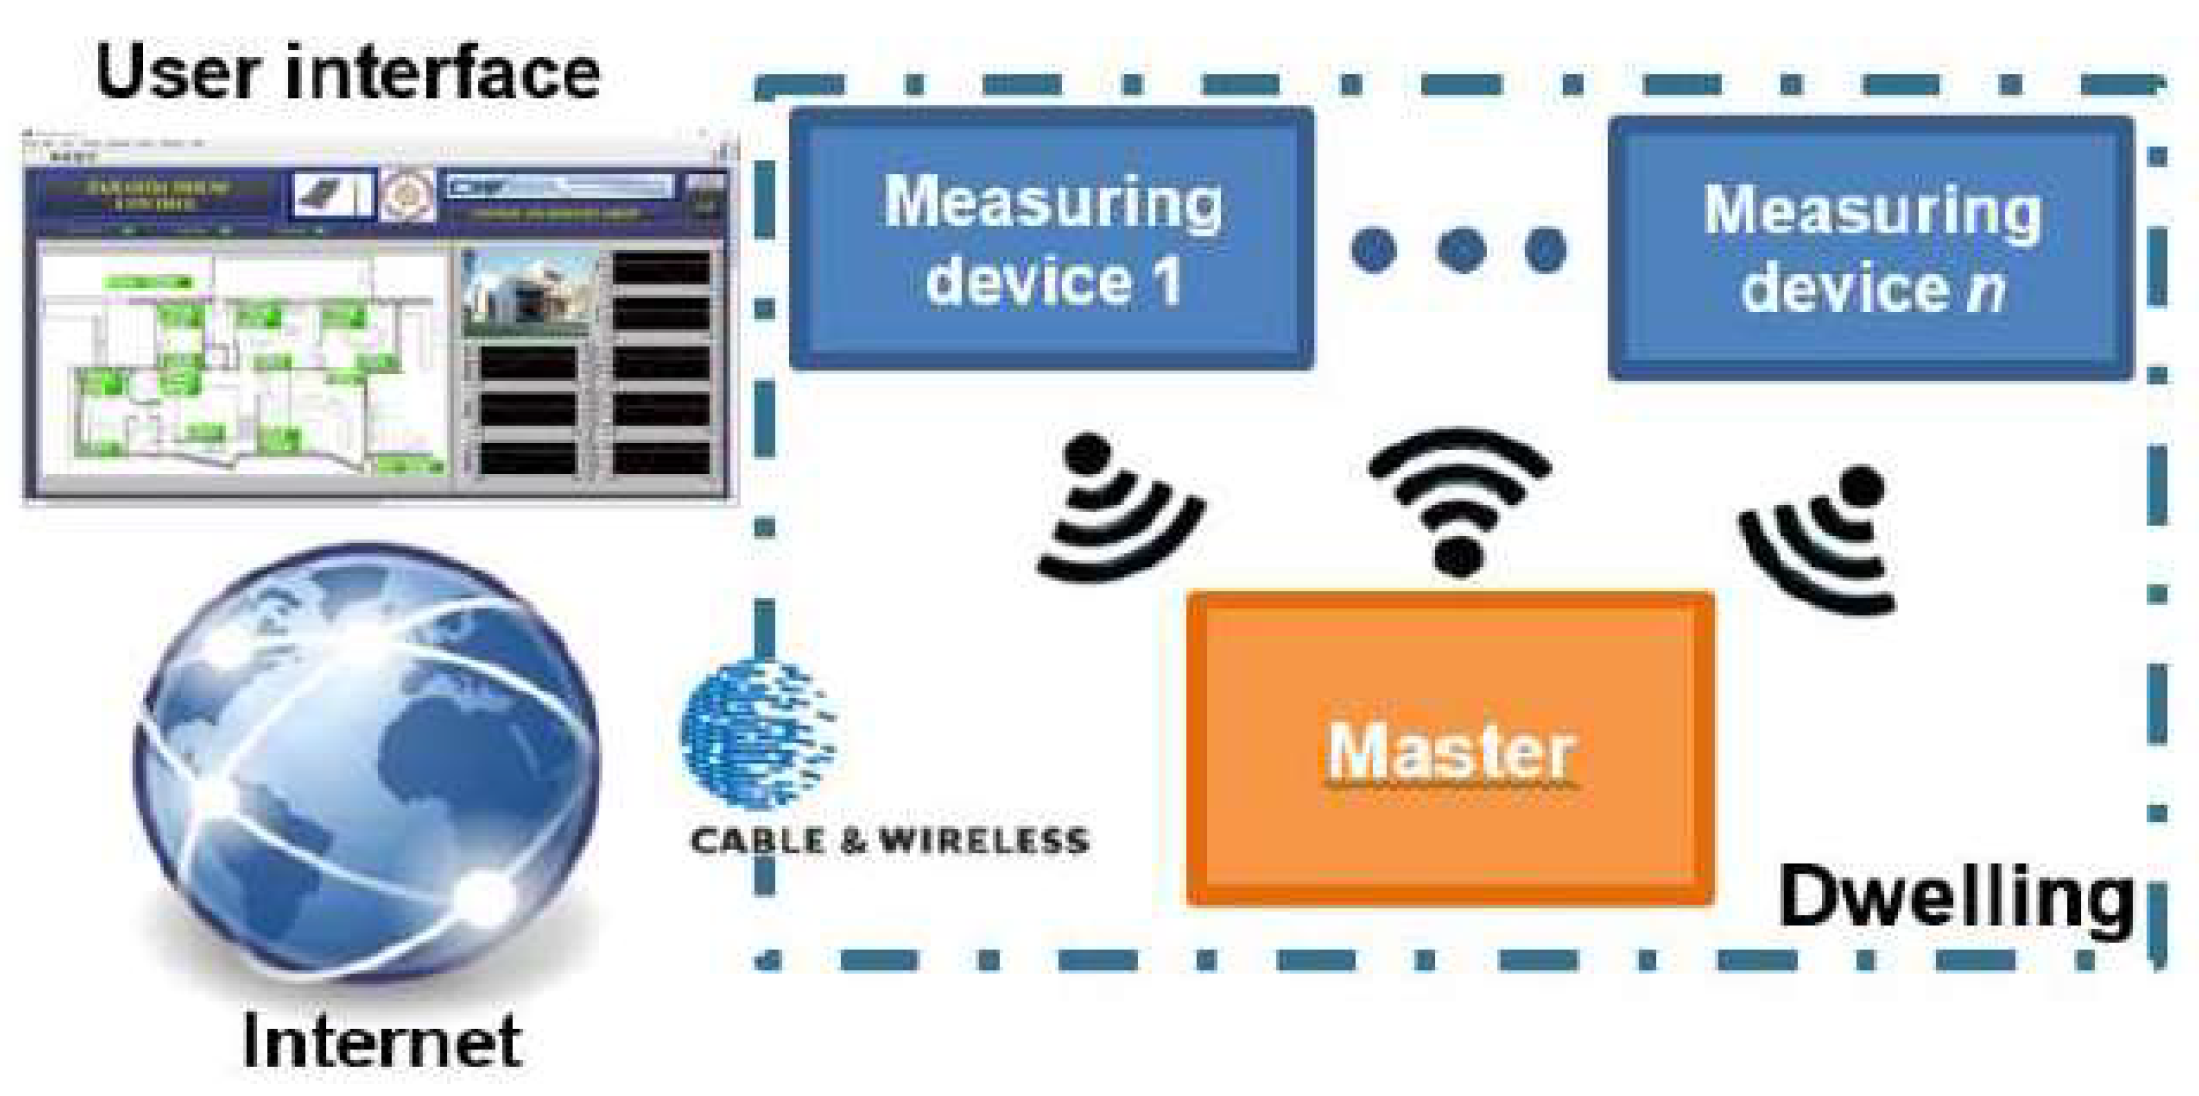
The developed ICS is shown at a block diagram level in
Figure 2. It is fully modular and is made up of different modules that the user can set up accordingly. The measuring devices and master module are physically separated but connected wirelessly. All modules function as Xbee devices using the Zigbee protocol [
57]. Xbee is a small (about 2 cm
2), low-power (tens of mW) digital radio; through it, any small single-board computer can be integrated in specific purpose wireless networks. Regarding ZigBee, it is an IEEE 802.15.4-based specification [
58] used to create personal area networks. The technology defined by the ZigBee specification is intended to be simpler and less expensive than other wireless personal area networks such as Bluetooth or Wi-Fi. The combination XBee + ZigBee provides a communication range of more than 100 m in closed spaces and 1 km in open spaces.
Each device measures room temperature and relative humidity (RH). Any dwelling can have as many measuring devices as needed. The master module collects all the data and then processes and saves them in an internal memory. At the same time, all the data can be transmitted to the Internet in real time via cable, via Wi-Fi, or wirelessly (using, for example, mobile phone networks or modem radios). Thus, any authorized user can receive all the real time data from any dwelling and from any part of the world. In order to do so, a user interface (by a virtual instrument, VI) has been developed as part of the conceived ICS.
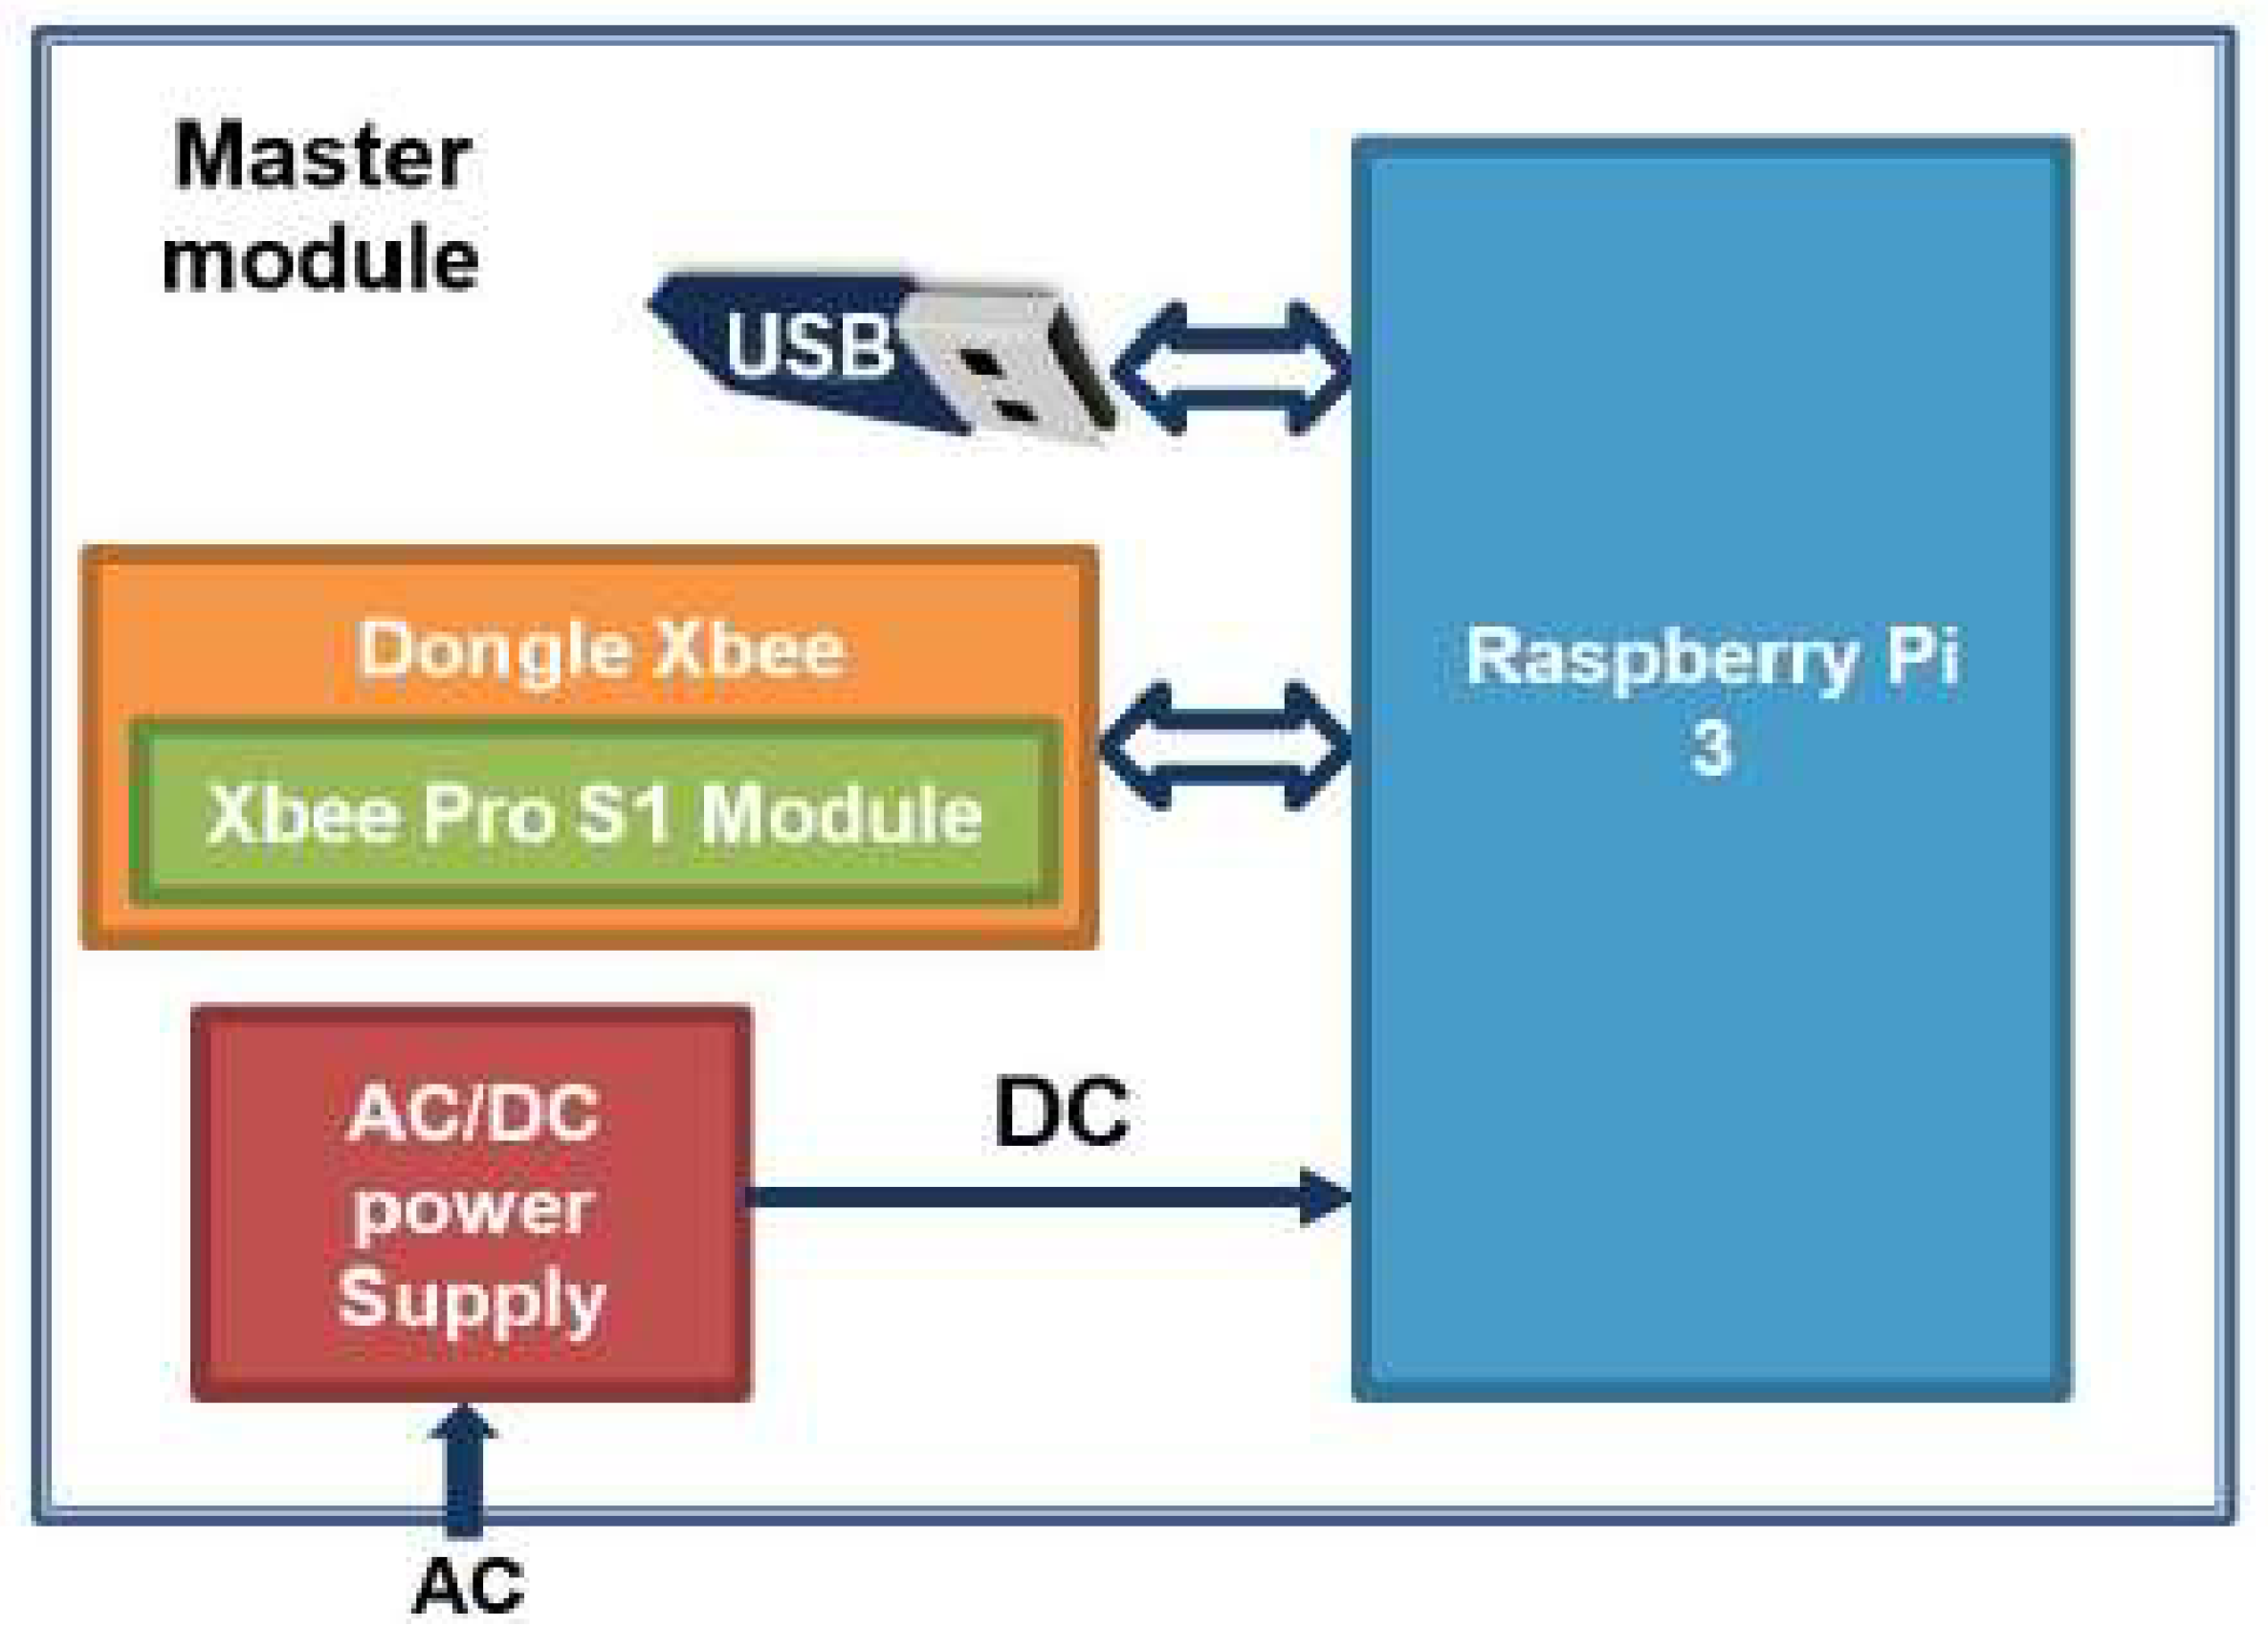
Figure 3 shows the master module diagram. It is based on a small single-board computer Raspberry Pi 3. The master module has a built-in Dongle Xbee + XBee device (Xbee S1 Pro), an AC/DC power supply, and an external USB memory device. The latter serves as a backup element for recovering measurements if a communication failure occurs.
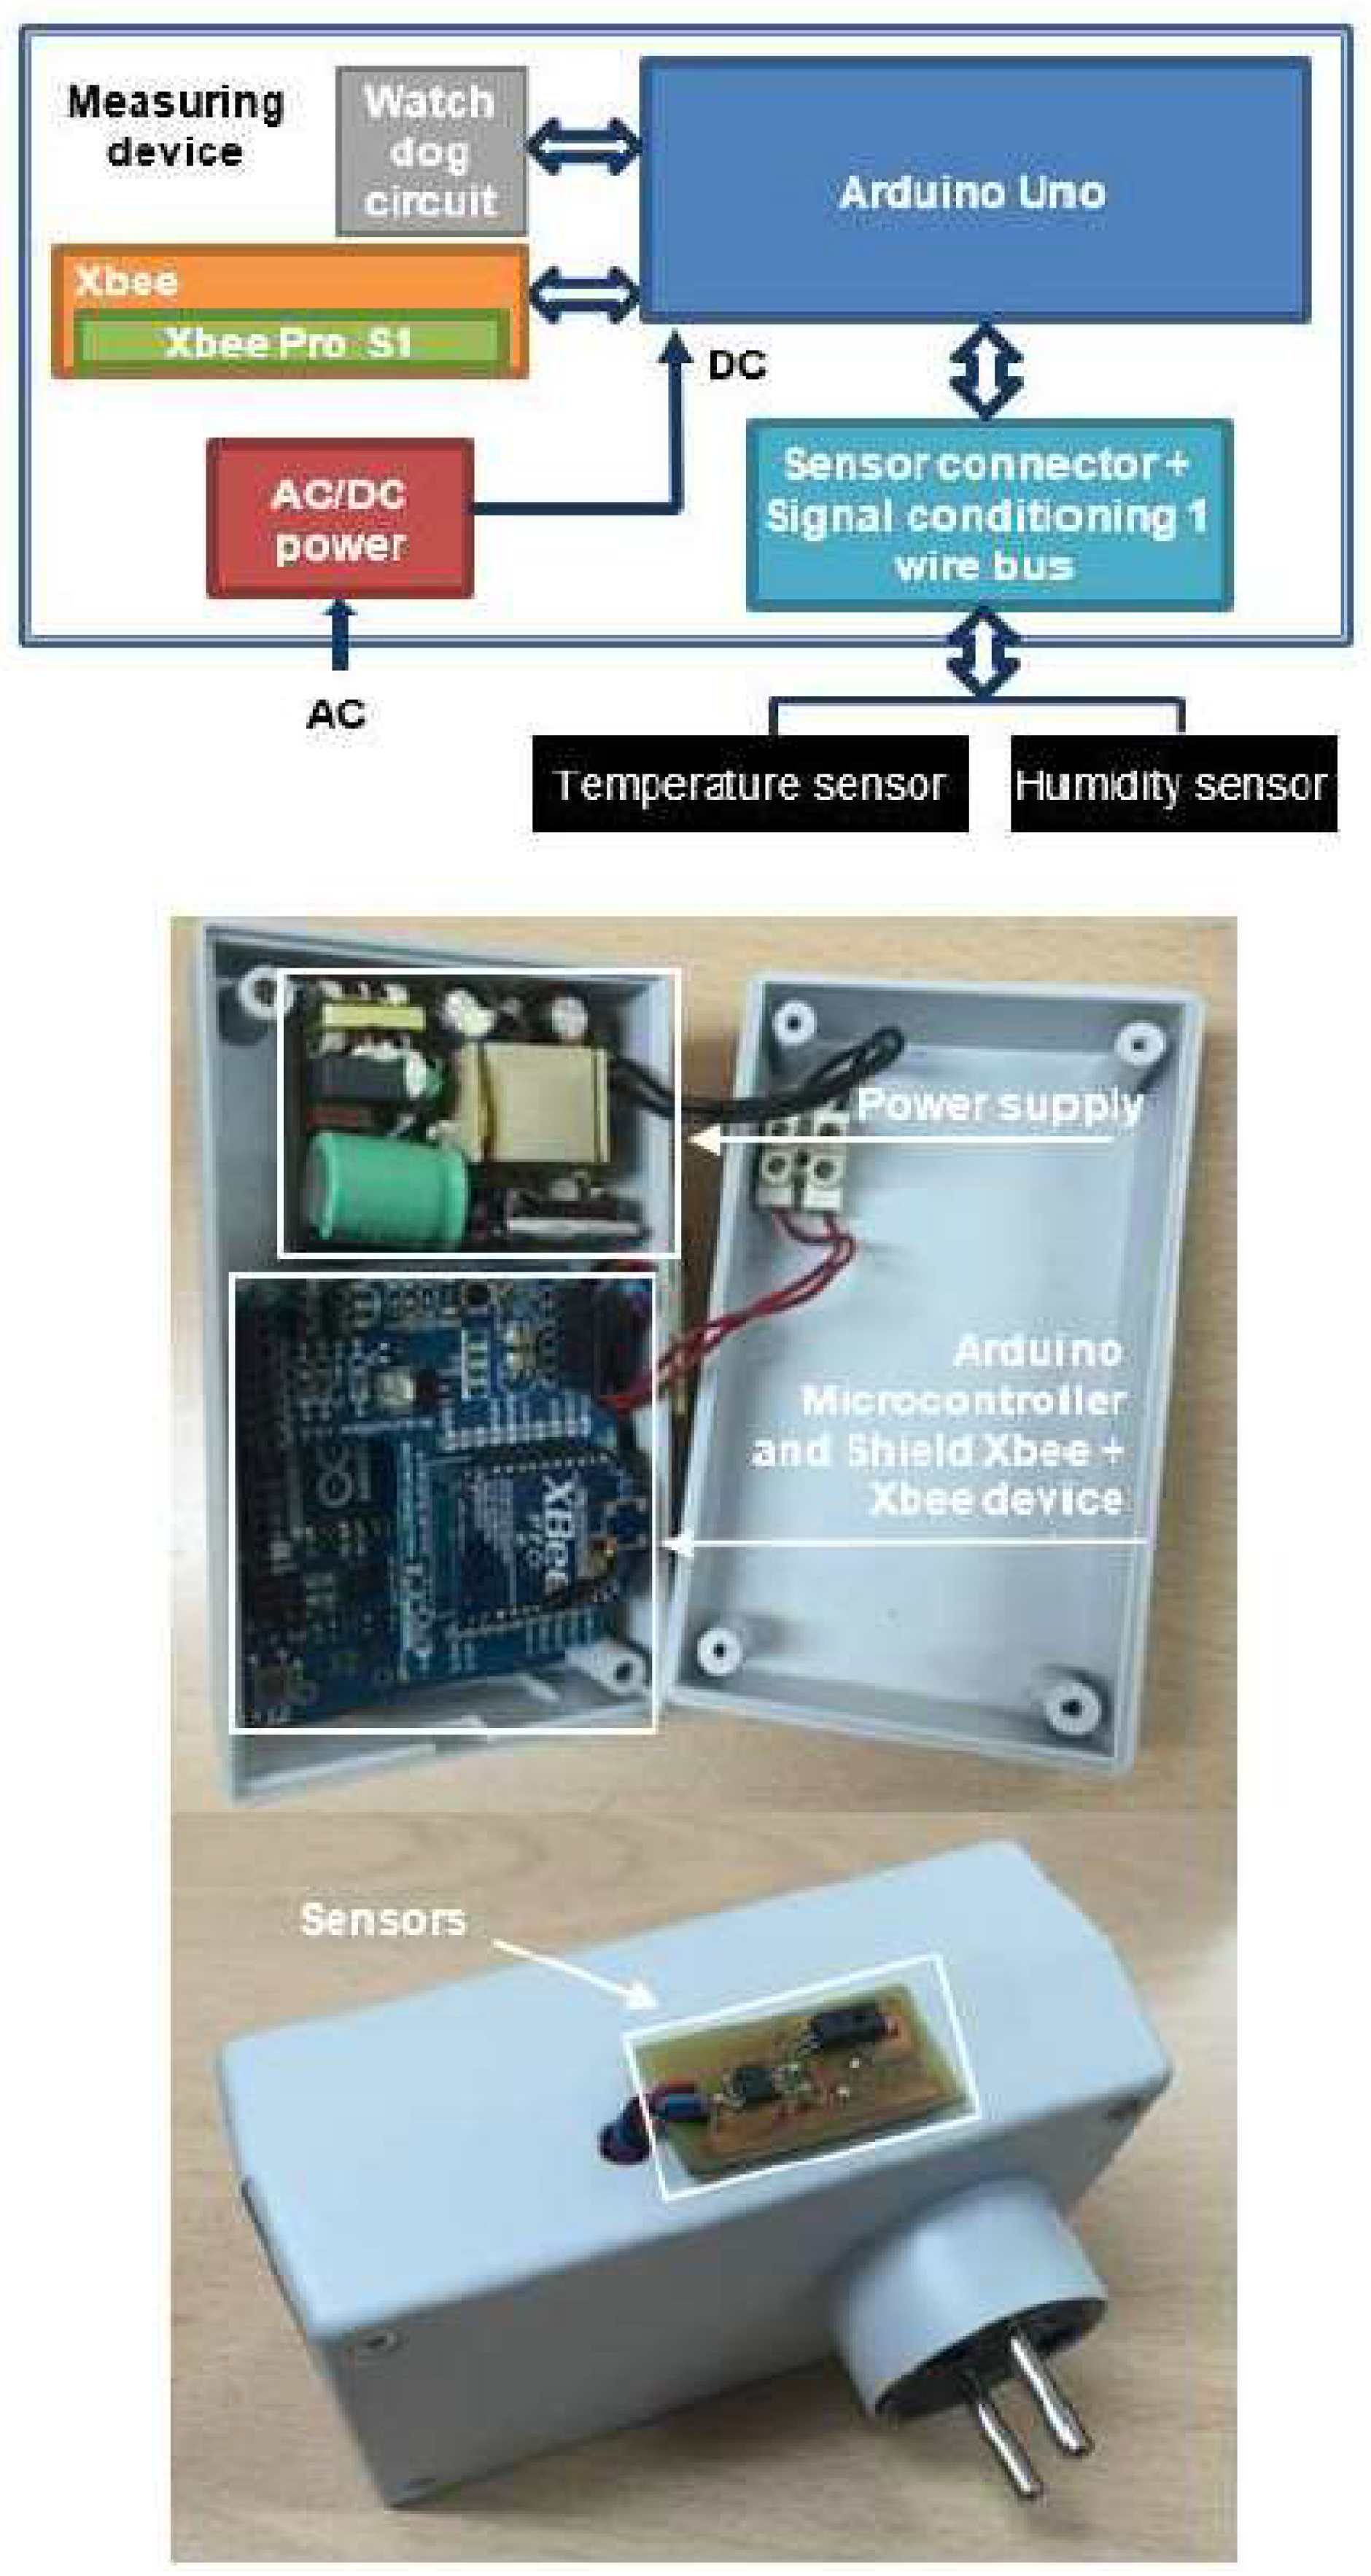
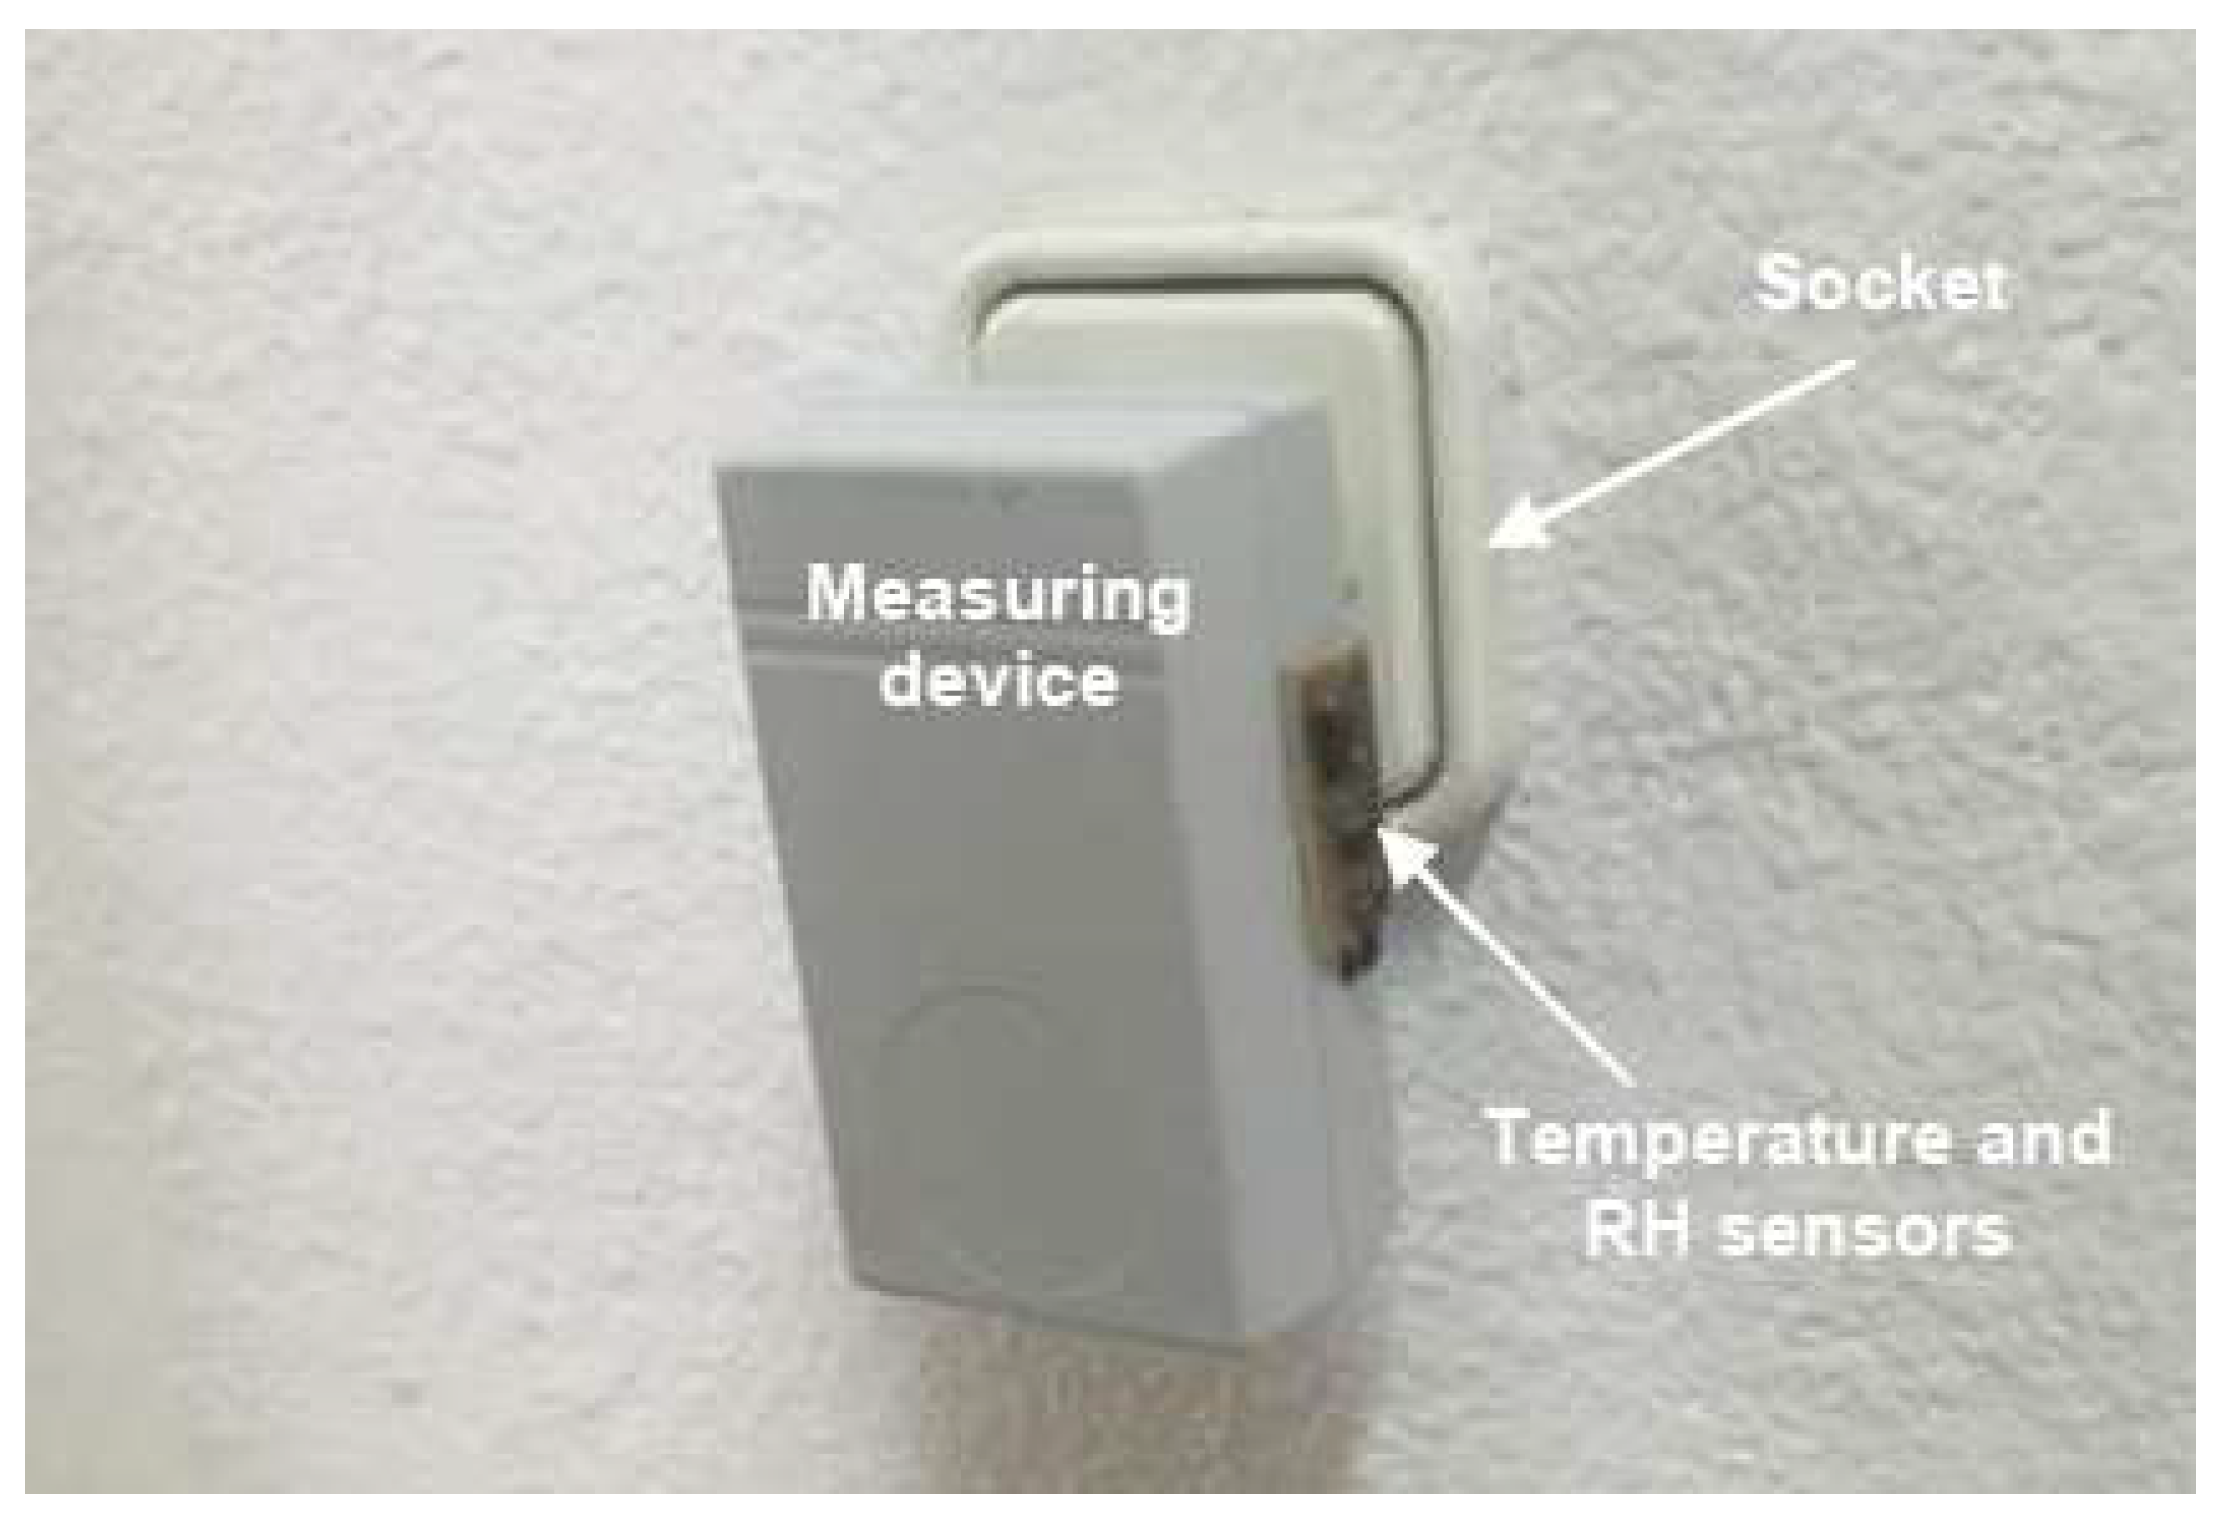
Figure 4 shows the block diagram and the actual appearance of the developed measuring device (each blue block of
Figure 2). It is based on a microcontroller board Arduino Uno. In addition to the Arduino Uno, the developed measuring device includes a built-in Shield Xbee + XBee device (Xbee S1 Pro), a watch-dog circuit (which automatically resets the module in the event of communication blocking, which may occur occasionally in this kind of devices), an AC/DC power supply, and a board where the RH and temperature sensors are connected. Additionally, an air quality sensor can be also incorporated. For the case study and at four measurement points, the MQ-135 sensor was used. It is suitable for measuring NH
3, NO
x, alcohol, benzene, smoke, CO
2, etc. The RH sensor used was the HIH-4000-001, whose performance specifications are an operating RH from 0 to 100%, an accuracy of 3.5%, and an analog output voltage. The temperature sensor was the DS2438, which can measure temperature over a range of −55 to +125 °C in 0.03125 °C jumps. However, this integrated circuit is not only used to measure temperature; it is also used to convert the HIH-4000-001 output to 1 wire format.
Each measuring device sends temperature and RH data, referenced in time, to the master module that stores them (in its internal memory). This means that the measurements can be recovered if the wireless communications link fails.
Measuring devices were installed in all the rooms of the building that constitutes the practical case of this research. In four selected rooms, an air quality sensor was included in the developed device.
In this way, temperature, RH, and air quality measures are available throughout the house. The wireless functionality of the measuring devices facilitates the monitorization of the dwelling without the need of utilizing internal wiring. Consequently, the installation of the device is instantaneous, requires no further work of any sort, and leaves no trace when the devices are changed or removed.
The measuring device (see
Figure 5) has a small size, like that of a socket outlet where it can be directly connected to receive power. The developed measurement device operates in plug and play mode, i.e., once it is plugged into the electric socket, it automatically starts measuring and sends the data to the master module (see
Figure 2). Each measuring device has its own signature, so that, when communicating to or from the master module, its identification is unique.
The ICS user interface is a VI developed in LabVIEWTM (2016 version). This VI receives the real time data and then processes and stores them. The developed VI allows communication errors and failures to be detected in sensors and warns of anomalies. Through the VI, the user can generate graphs and reports. It is hosted on a PC.
3. The Proposed Methodology
The authors of this research work are experienced in the field of MEB in subtropical climates both in research projects [
59] and in projects for public organisms, private companies, and individual customers. The systematic execution of this kind of project, using a methodology derived from research, has favored the accumulation of years of knowhow regarding the need to propose a scientific-technical methodology to overcome the challenge of design, construction, and operation of MEB in subtropical climates.
In latitudes near the tropics, there is plenty of heat inside dwellings most of the time and it has to be removed somehow, but sometimes inner heat must be conserved and even increased. Of course, this reasoning is not only correlated with latitude, since other conditioning factors such as altitude, closeness to the sea, and mountains must be also considered.
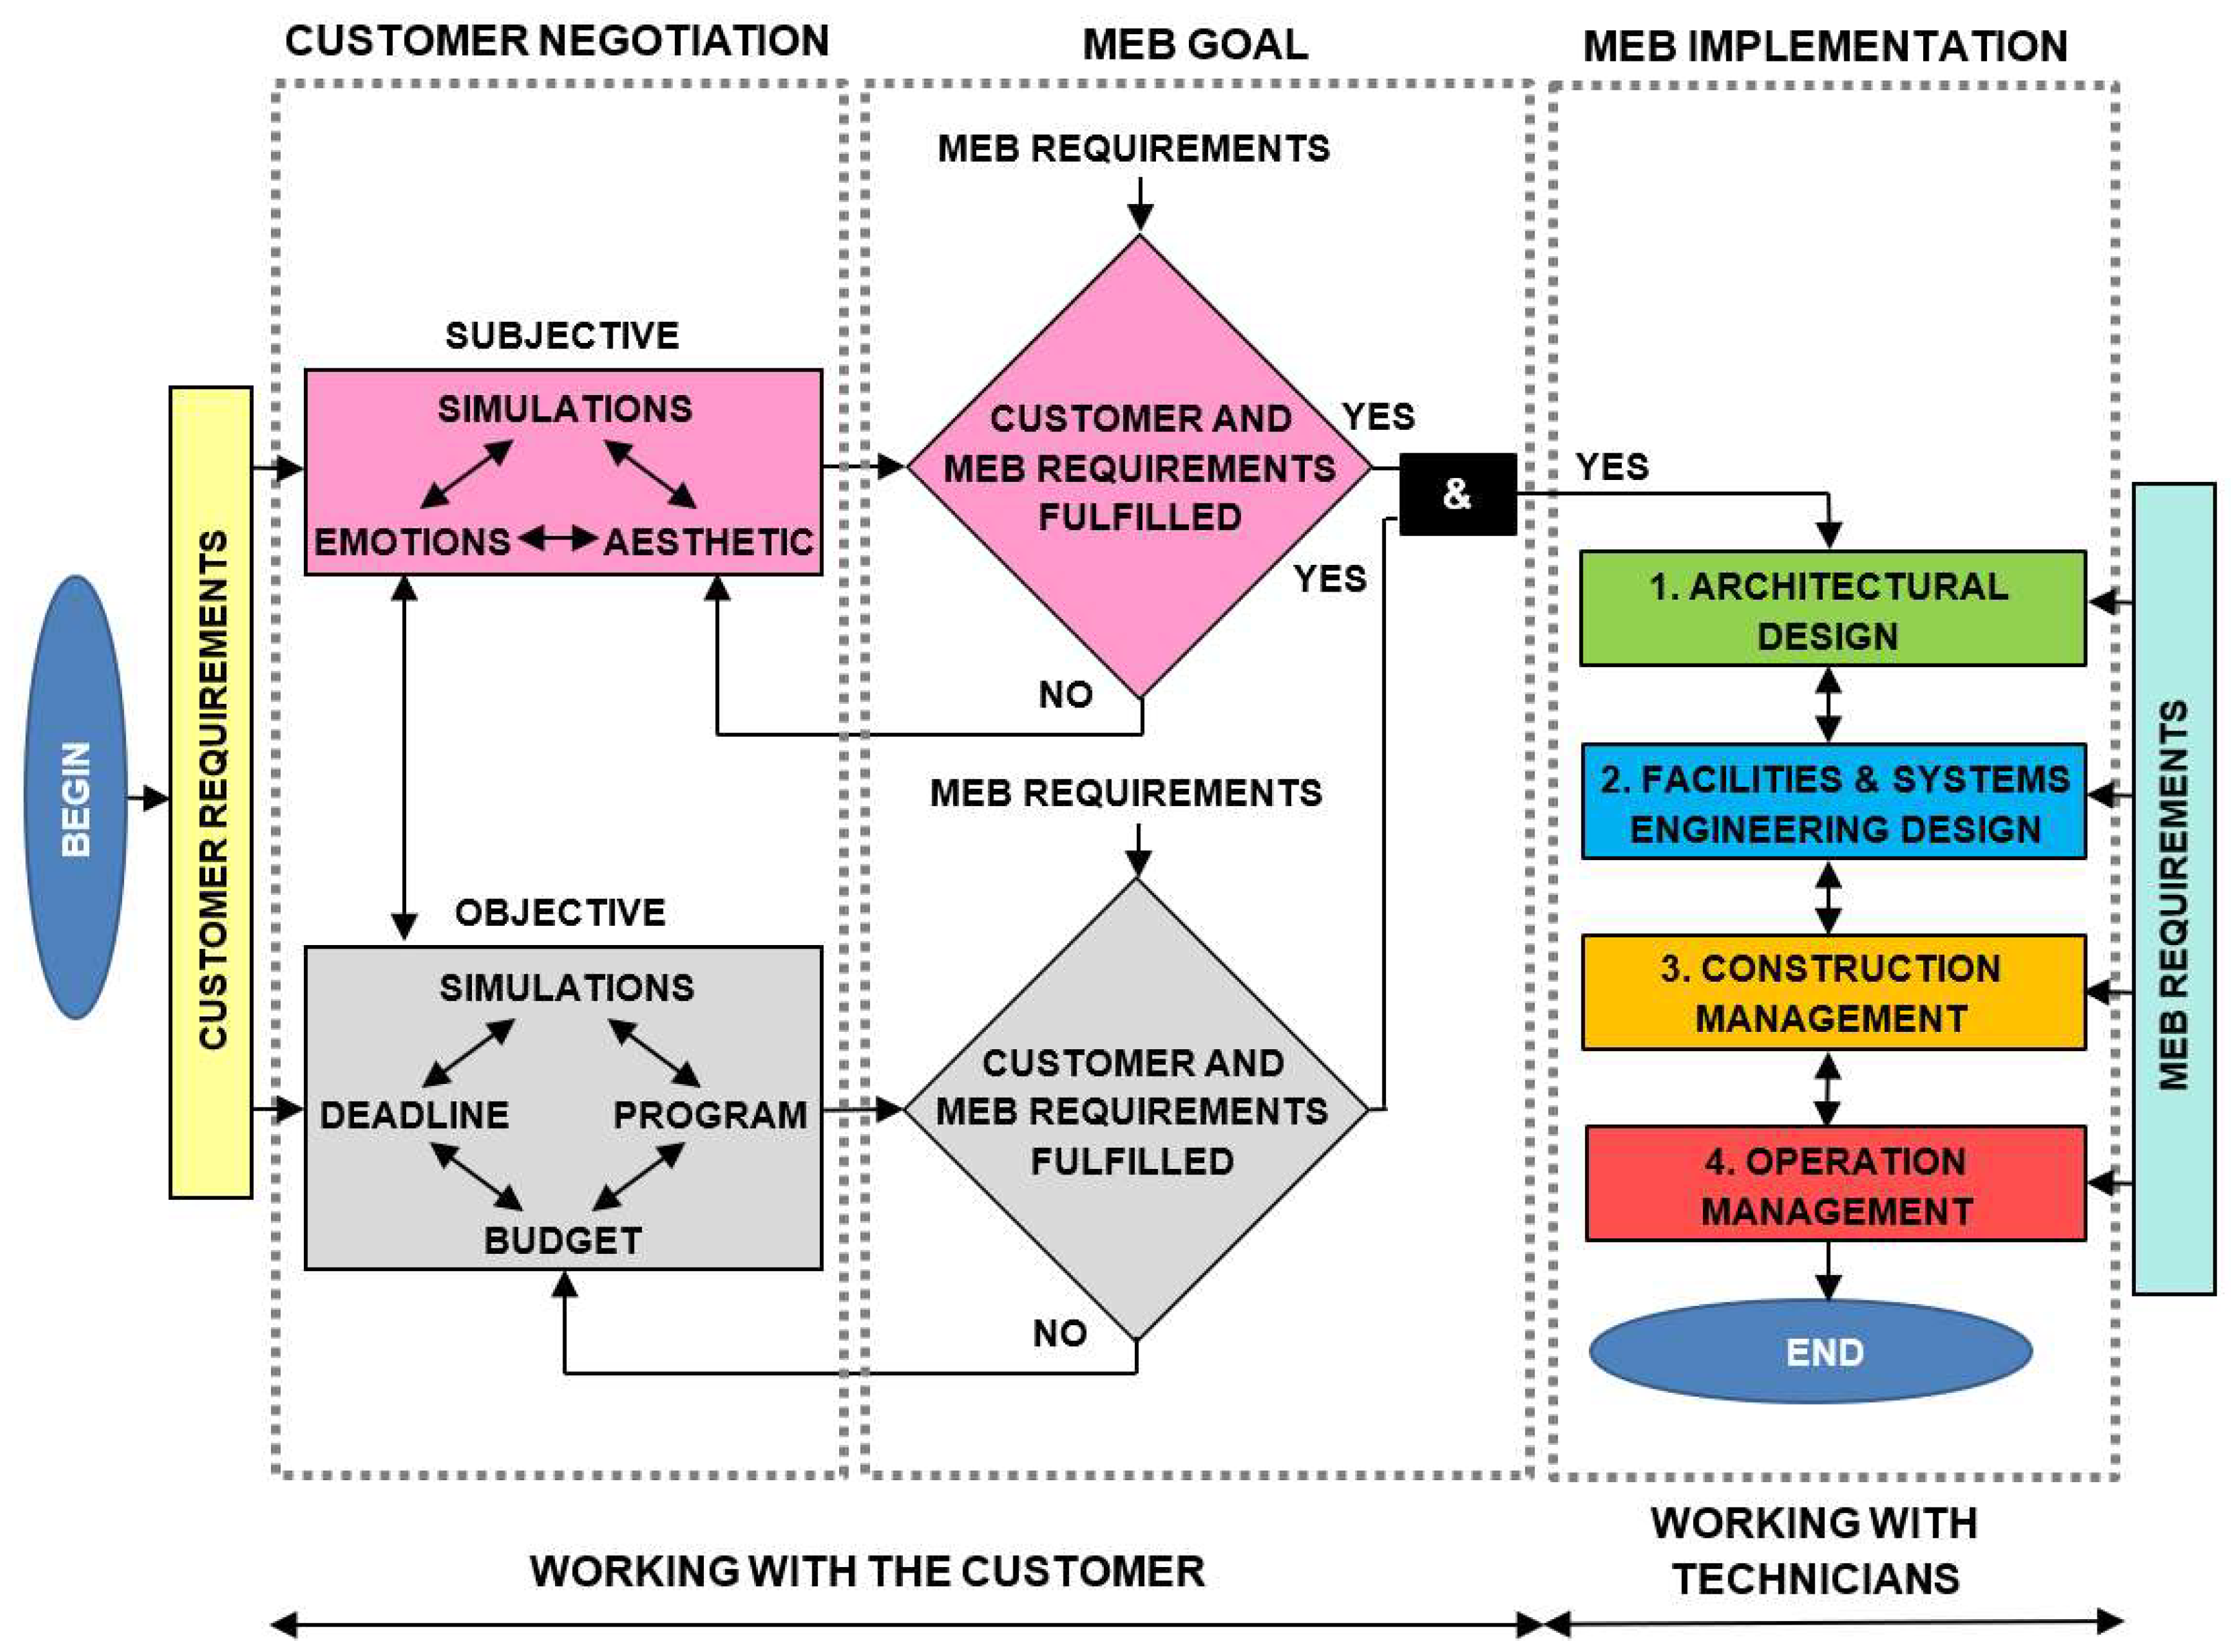
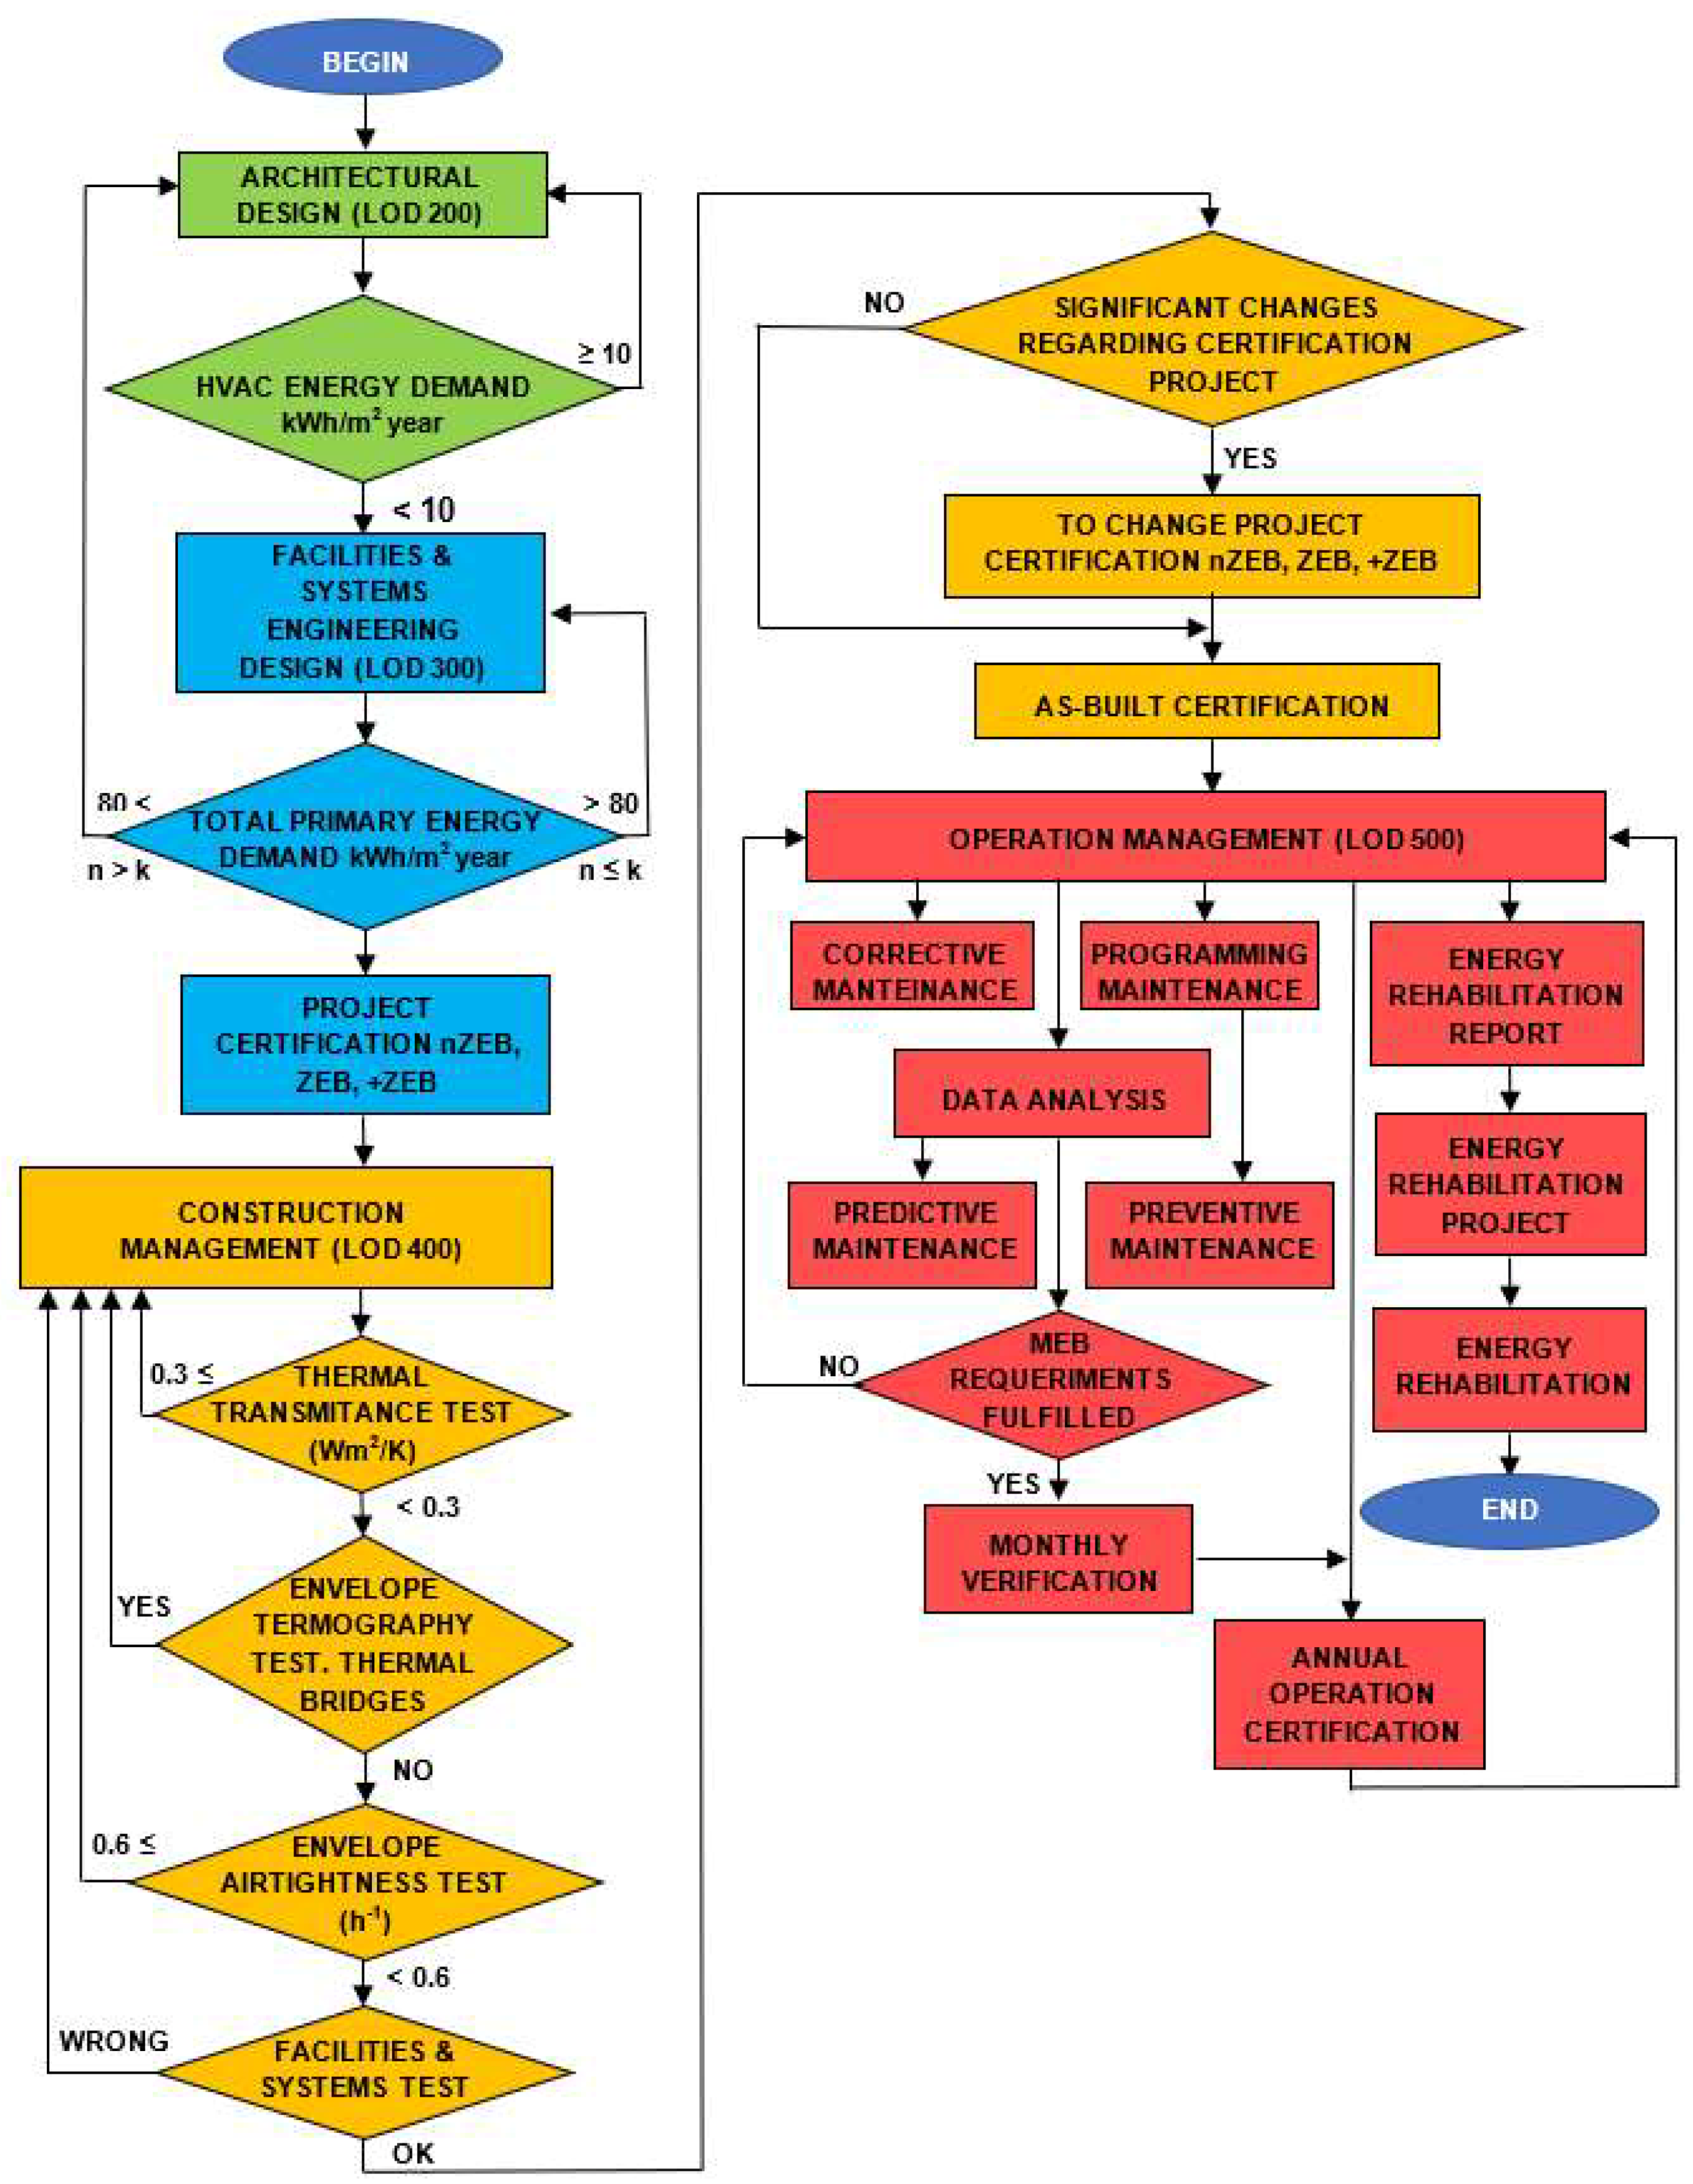
Figure 6 shows the general algorithm that allows for carrying out the proposed uhuMEB methodology in subtropical climates (it probably also applies to any climate for that matter). This covers the complete process of design, development, construction, and operation of an MEB in subtropical climates, i.e., from the conception of the building to the end of its life cycle.
Starting from the basis that the customer wants an MEB (nZEB, ZEB, or +ZEB), the first stage of the proposed methodology deals with the negotiation with the customer. It is here where the basic features of the building are agreed upon and assessed; some are objective (program, budget, and deadline), while others are not (aesthetics and sensations).
Once the initial stage is completed in a first iteration of the algorithm, the MEB requirements are added. From here, the two feedback loops between the first and second stages can undergo numerous iterations, depending on the MEB requirements (nZEB, ZEB, or +ZEB), the complexity of the building, and the requirements of the customer. Both loops, for each proposal or modification, will require computer simulations that, through a process of successive approximations, must lead to the fulfillment of all the requisites subjective and objective together with the MEB requirements. Unless the agreement with the customer is not part of the MEB requirements, it is not possible to proceed to the last stage of the algorithm, the purely technical part, which leads to the construction of the building and its subsequent use.
Solving the MEB goal stage of the algorithm presents a problem. How does one quantitatively (also qualitatively) define the parameters that the building must comply with? The problem arises from the fact that, in the lowest MEB goal (nZEB), the technical definition (specific values of parameters) is not yet developed in all member states, and even less so in the compulsory regulations for the construction of buildings. Therefore, the question arises almost immediately: how are MEB parameters set?
The proposed methodology is based on the quantification of Directive 2010/31/EU that establishes the following qualitative requirements for an nZEB building:
- (1)
a very high energy efficiency level;
- (2)
almost zero or a very low amount of energy required, i.e., zero or very low energy demands;
- (3)
demand covered, to a very large extent, by energy from renewable sources;
- (4)
renewable energy produced on site or around the environment of the building.
From these qualitative descriptors and based on the authors’ experience, the following list of quantitative and qualitative mandatory parameters to meet the MEB classification are proposed:
- (1)
The energy demand for heating, ventilating and air conditioning (HVAC) of the building must be less than 10 kWh/m2 year;
- (2)
the total primary energy demand of the building must be less than 80 kWh/m2 year;
- (3)
the indoor air quality level in the building must maintain a CO2 concentration below 1.000 ppm;
- (4)
the annual percentage of hours of thermal discomfort (heat or cold) inside the building, expressed in terms of equivalent temperature, must be less than 10%;
- (5)
the building envelope airtightness test (air changes rate per hour at a differential pressure of 50 Pa, n50-value) should be greater than 0.6 h−1;
- (6)
the thermographic study of the complete building envelope must confirm that there are no significant thermal bridges;
- (7)
the building must have a proper ICS, at least to measure electrical consumption per circuit, temperature and RH in each room and outside, as well as the air quality of the dwelling;
- (8)
the analysis of the ICS data on electric consumption, RH, temperature, and air quality in the operative phase of the building must validate points 1, 2, 3, and 4 annually;
- (9)
at least 90% of the domestic hot water (DHW) needs must be covered by renewable energy;
- (10)
the average daily occupancy of the building must be greater than 10-2 people/m2;
- (11)
the building must be operated and maintained by MEB qualified technicians.
Compliance with the previous list of mandatory items (already present in the negotiation with the customer, Stage 2 of
Figure 6) allows one to rate a building as MEB (nZEB) in the proposed uhuMEB methodology. From here, achieving higher ratings requires a smaller normative effort, since the ZEB or +ZEB classification can be reached with an increase in the contribution of renewable energy (facilities) to the limits of the building or its environment.
To carry out the last stage (MEB implementation) of the uhuMEB methodology (
Figure 6), which is purely technical and is the work of the architecture and engineering team, the MEB requirements listed above need to be specified.
Table 1 summarizes all the involved elements and tasks. Most MEB requirements (parameter values) of the last column are based on the authors’ background. Of course, other values could be used, but the former guarantee the fulfillment of the total energy goal at the end of each stage. This one acts as a binding filter, i.e., it is not possible to advance to the next stage until the total energy goal set in the previous one has been fulfilled.
The whole process of the MEB implementation stage is coordinated through a BIM deliverable; each of the four stages corresponds to a different level of development (LOD) of the elements incorporated in the BIM.
The practical development of the MEB implementation stage is embodied in the algorithm and illustrated in
Figure 7, which works together with
Table 1.
Each of the steps of the algorithm in
Figure 7 will be explained below.
3.1. Architectural Design
Step 1 of the MEB implementation algorithm (see
Figure 6 and
Figure 7, and the first column of
Table 1), architectural design, corresponds to the passive design of the building, and its responsible professional is the design architect. The required LOD in this phase is LOD200, which means that it is graphically represented within the BIM as a generic system, object, or assembly with approximate quantities, size, shape, location, and orientation.
The building parameters that must be optimized in this phase, together with their MEB values, are shown in Columns 1 and 5 of
Table 1, respectively. These parameters and values are as follows: sunshading (which should prevent heat gains by incoming direct solar radiation inside the building through gaps during hot months but do just the opposite in cold months) an envelope thermal transmittance
Ue (combined U-Value of the opaque and opening building envelope) of less than 0.3 W/m
2·K; a form factor F (ratio between outer envelope surface and inner volume enclosed) of less than 0.8 m
2/m
3; an envelope airtightness without infiltration points for an n
50-value < 0.6 h
−1; a natural ventilation, measured as the ratio between practicable and constructed surfaces (
Sof), greater than 0.05 m
2/m
2; and natural lighting, measured as the ratio between glazed and constructed surfaces (
Sgf), greater than 0.1 m
2/m
2.
The total energy goal that allows one to successfully overcome the requirements set for this phase (see
Table 1) is the HVAC energy demand, whose maximum value must be less than 10 kWh/m
2 year. This criterion is more restrictive than, for example, that accepted by the classic passivhaus certification [
60].
Until the goal of total primary energy demand by design is reached, the process remains in the architectural design step of the algorithm.
3.2. Facilities & Systems Engineering Design
Step 2 of the MEB implementation algorithm (see
Figure 6 and
Figure 7, and the second column of
Table 1), facilities & systems engineering design, corresponds to the design of the building’s active systems, and its responsible professional is the detail engineer. The required LOD in this phase is LOD300, which means that it is graphically represented within the BIM as a specific system, object, or assembly in terms of quantity, size, shape, location, and orientation.
The building facilities & systems that must be designed optimally (or directly acquired in the case of appliances for example) in this phase together, with their MEB values, are shown in Columns 2 and 5 of
Table 1, respectively.
Regarding HVAC systems, the market offers many varied solutions that, depending on the project, can be chosen. However, whatever the solution chosen may be, it must meet the total energy goal of less than 10 kWh/m2 year.
If the MEB pursues to overcome the nZEB rating to reach ZEB or +ZEB, it is worth exploring renewable solutions or solutions mixed (renewable + non-renewable) for HVAC systems. This is the case for example of a heat recovery ventilation (HRV) system (HRV introduces fresh air to the building and improves climate control, whilst promoting efficient energy use) working together with a low enthalpy geothermal energy (LEGE) system (air-to-ground exchanger at a low depth for air conditioning; the carrying heat fluid can be air or other) for generating air conditioning. Moreover, ventilation and air conditioning can be combined using only a circuit. This is the case for example when pre-connecting the LEGE system to the ventilation system. Again, there are several solutions and the one chosen will depend on the specific project.
Wherever possible its installation, air-conditioning systems based on LEGE are specially interesting in subtropical climates. It is because the annual average temperature of the site can be reached (over the year) using the surface energy of the soil (see Subsection 4.3.6) by a well-designed LEGE facility [
48]. Therefore, if the site has an average annual temperature of, say, 18 °C, the energy required to raise such temperature inside the building to the comfortable one is minimal. Moreover, the efficiency of the necessary geothermal heat pump is extremely high (A+++), which is because they do not produce heat but transport it.
Regarding domestic hot water (DHW), in the proposed methodology, it is compulsory to guarantee at least the 90% of the demand in a renewable way. Usually, the best solution for this is the use of thermal solar panels. This solution can be complemented or substituted (think, for example, of a building where there is not enough roof) by other systems. Perhaps the ones that have the best efficiency regarding space needed are those based on aerothermal energy, which consists of using the compression-expansion of a gas for heat or cool water. According to the European Union directive 2009/28/EC of April 2009, the aerothermal energy is considered a renewable energy source. If the building has a LEGE facility, it can be used to support the DHW facility, carrying out a pre-heating with it.
The above aims to show that it is feasible to solve most of the building facilities in a renewable way, and that the solutions are also varied.
Appliances and lighting are inside the facility engineering design phase, but generally do not require design—no more than is necessary for the best service to the building or its aesthetic. Therefore, their required efficiency fulfillment depends above all on a purchase with criteria.
Continuing with
Figure 7 and
Table 1 working together, the ICS must provide at least the measurement of electrical consumption (independent for each circuit), temperature, and RH in all rooms of the building as well as outside the building. The quality of the air inside the building must also be measured.
The amount and size of the renewable energy system (RES), those mentioned above and others, depend on the MEB rating pursued. Thus, the MEB can be equipped with a photovoltaic, wind, and/or geothermal RES, among other types.
The total energy goal that allows one to successfully overcome the requirements set for this phase (see
Table 1) is the total primary energy demand (HVAC, DHW, appliances, and lighting), whose value must be less than 80 kWh/m
2 year.
Note in
Figure 7 the feedback between Steps 1 (green) and 2 (blue). If the number n of iterations is greater than a k value (to define in each project according to its complexity and technical staff), it is not possible to leave Phase 2 and it is necessary to return to Step 1 to reevaluate the architectural design. Consider as an example where more surface roofs are needed for renewable facilities than is available.
Once Steps 1 and 2 of
Figure 7 have been overcome, the building project obtains project certification (nZEB, ZEB, or +ZEB), which guarantees the MEB rating of the building in the project phase.
3.3. Construction Management
Step 3 of the MEB implementation algorithm (see
Figure 6 and
Figure 7, and the third and fifth columns of
Table 1), construction management, corresponds to the material execution of the building, and its responsible professional is the project manager. The required LOD in this step is LOD400, which means that it is graphically represented within the BIM as a specific system, object, or assembly in terms of size, shape, location, quantity, and orientation with detailing, fabrication, assembly, and installation information.
The initial test to carry out is the one corresponding to determine the actual U-Value of the building’s combined envelope (Ue), which should be at most the one set in the project certification and, in any, case smaller than 0.3 Wm2/K.
Thenceforth, the thermographic study of the thermal envelope must justify the absence of thermal bridges. The overcoming of these two tests guarantees a proper thermal behavior of the building’s actual envelope.
Following this, the envelope airtightness test on the finished building is carried out, which should yield an n50-value <0.6 h
−1. This is a common accepted value, which is used for example in passivhaus certification [
60]. The success of this test guarantees a proper level of actual airtightness of the building envelope.
Finally, the project manager, coordinator of the construction management stage, must certify that all the facilities and systems installed in the building have been executed in agreement with the project certification and they work according to MEB parameters. This is paramount, because the MEB has undergone modifications in the constructive stage, which could have affected the certified project. In fact, if the modifications are significant, they must be reflected in the project and a new certification must be obtained (
Figure 7).
Although in
Figure 7 the tests are represented sequentially, they could be developed in parallel; however, it is advisable to use a certain order, simply for the rationalization of work.
Once Step 3 of the MEB implementation algorithm has been completed (see
Figure 7), the constructed building obtains the as-built certification, which guarantees the MEB level (nZEB, ZEB, or +ZEB) of the erected building.
The goal that allows one to successfully overcome this phase of the methodology is the fulfillment of the tests requirements (see the last column of
Table 1).
3.4. Operation Management
An important aspect of the proposed uhuMEB methodology is that it does not end with the constructed building in itself, but rather that its energy classification must be maintained over time, during its operation phase (building use). For this reason, one more step is included in the process: operation management (see the step in red in
Figure 7).
Once the MEB is finished, it is submitted to continuous monitoring and control throughout its useful lifespan. The goal is guaranteeing forever the behavior of the building within MEB requirements. This continuous monitoring will depend largely on the use to which the building is intended (it will not be the same in an airport or a hospital as in a single-family home), but in one way or another it is essential to have accurate information about how the building works over time. This is a paramount issue, not only from the point of view of its day-to-day maintenance (corrective and programmed) but also for the predictive maintenance based on the result of measurements and their analysis. In general, the building may require during its useful lifespan of successive energy rehabilitations, which may be of greater or lesser depth depending on the requirements (some may be new and not expected during its construction).
The person responsible in this step of the proposed uhuMEB methodology is the operation manager. The LOD required in this phase is LOD500, which means that it is a field-verified representation in terms of size, shape, location, quantity, and orientation.
The MEB operation management practical process corresponds to Step 4 of the MEB implementation algorithm (see
Figure 6 and
Figure 7, and Columns 4 and 5 of
Table 1). It reflects the three most common types of maintenance: corrective, preventive, and predictive. Corrective corrects the built defects to be found by the users and which are communicated to the maintenance department. Preventive carries out the programming maintenance tasks (
Figure 7). It used to be of a systematic character; that is, the facility/system/part of the building was inspected even if it had not shown any signs of a problem. Here, the periodic maintenance tasks are included; for example, the joints revision is done before the infiltration points appear.
The most sophisticated maintenance included in the proposed uhuMEB methodology is the predictive one. It involves constantly monitoring and reporting the status and operational capacity of the building by determining the values of certain variables that represent it. To apply this maintenance, it is essential that physical variables (as a minimum, electrical consumption (independent for each circuit), temperature, and RH in all rooms of the building as well as outside the building, and the quality of the indoor air), whose variation is indicative of problems that may appear on the building and its facilities & systems, be identified. This is one of the tasks of the ICS system. This maintenance is the most technical, since it requires advanced technical resources (for data analysis, see
Figure 7) as well as mathematical algorithms running on computers. Using the appropriate decision-making software, it is possible to save energy and costs by intervening before the affected element fails, or even increase its lifetime.
Obviously, the three mentioned maintenance types are not the same for all buildings and use. Therefore, each building must have its own maintenance program, which, in the proposed uhuMEB methodology, must be included in the as-built certification documentation. Of course, the maintenance types included in the proposed methodology are from the point of view of energy efficiency. Thus, these can be part of the general maintenance of the building. That is, it is not considering painting a railing to avoid rust, for example.
The fulfillment of the MEB requirements each month leads to monthly verification, which, over a year, leads to the annual operation certification.
This step and the methodology end with energy rehabilitation, which will be a consequence of the normal building use, of the deterioration of materials, facilities, and systems over time, and perhaps of the change in how the building is used. In any of these cases and based on the annual operation certification (
Figure 7), energy rehabilitation will require a report from the operation manager and a posterior project.
Finally, it is important to point out that neither the maintenance nor the energetic rehabilitation is the aim of this paper. Each one of these issues requires specific treatments and analyses.
4. Results
The uhuMEB methodology in subtropical climates proposed in this work has been applied to the architecture, engineering, construction, and operation project of an isolated single-family house named Casa Zaranda. This house is part of the set of buildings that our research team uses as an actual research laboratory. Firstly, in the design and construction phases and afterwards in its operation phase, the house supplies a large amount of reliable data, since they are real and not theoretical or from simulations.
Casa Zaranda is located in the Csa climatic zone (temperate and rainy winters, dry and hot summers, and variable springs and autumns, both in temperature and rainfall), according to Köppen–Geiger climate classification [
61]. The annual average temperature is 17.8 °C (monthly average varies from 10.9 °C in January to 25.2 °C in August). The annual average rainfall is 467 mm (monthly average varies from 1 mm in July to 74 mm in November). The annual average humidity is 67%.
The global radiation values (kWh/m2) reach maximum monthly averages of 8.4 (July and August) and a minimum of 2.3 (December and January).
Casa Zaranda is in a residential neighborhood in the metropolitan area of the city of Huelva, in the extreme southwest of Spain, at 37° latitude of the northern hemisphere.
Consequently, following the algorithms of
Figure 6 and
Figure 7 as well as
Table 1, the implementation of the uhuMEB methodology is explained below.
4.1. Customer Negotiation & Meb Goal
As depicted in
Figure 6, the objective requirements received from the Casa Zaranda customer, regarding the program to be developed, involved the residential use on two floors plus a basement for garage and storage. The basement program required parking for two vehicles, workshop and storage space. The program for the ground floor required a kitchen with a laundry room, a separate living and dining room, a guest room with an integrated bathroom, and an outside toilet. The program for the upper floor required a study and two complete rooms with integrated bathrooms in addition to a dressing room in the main room. The building program was completed with a covered inner courtyard that orders the interior circulations connecting all floors together.
The objective requirements regarding the construction budget of the house was limited to 1.000 €/m2 constructed. Needless to say, that any reduction achieved would be welcome.
The objective requirements regarding the deadline of the work were set between 10 and 12 months, depending on the weather and the terms of administrative management for licenses.
The subjective requirements received from the customer, both aesthetic and emotional, were quite open. No aesthetic criteria were defined, beyond that of the ceramic cladding of the facade and actually not due to aesthetics, but to reduce maintenance costs of repainting.
The classification agreed with the customer was nZEB, which implies strict compliance with the MEB requirements of
Table 1. Additionally, the possibility of incorporating improvements during the development of the work to bring the classification of the house, once remodeled, to ZEB, was left open. In fact, the original energy efficiency was improved during the MEB implementation stage, but the ZEB score was not achieved, simply due to budgetary issues (facilities). Three interaction cycles were necessary (
Figure 6) to fit the order requisites of the customer to the MEB requirements of
Table 1.
Once the conditions of the contract with the customer were established, the working with the customer phase (
Figure 6) ended. From here, the MEB implementation began with the work with technicians involved in the architectural design step (
Figure 8).
4.2. Architectural Design
Casa Zaranda responds to a type of massive construction (not prefabricated) with reinforced concrete structure and external masonry envelope. This system and its respective variants represent the predominant construction technology in subtropical countries such as Spain and, in general, Southern Europe.
Complying with the urban regulations, Casa Zaranda has a total constructed area of 645.61 m
2, distributed in two floors above ground (397.39 m
2) and one buried level (248.22 m
2). The ground and first floors contain the residential program in itself, orienting the day rooms towards the garden located on the south side of the plot, and reserving the north for bedrooms. The underground basement level is used as a garage, as facilities, and as a warehouse, being outside the thermal envelope of the building, and functions as a thermal buffer in contact with the ground.
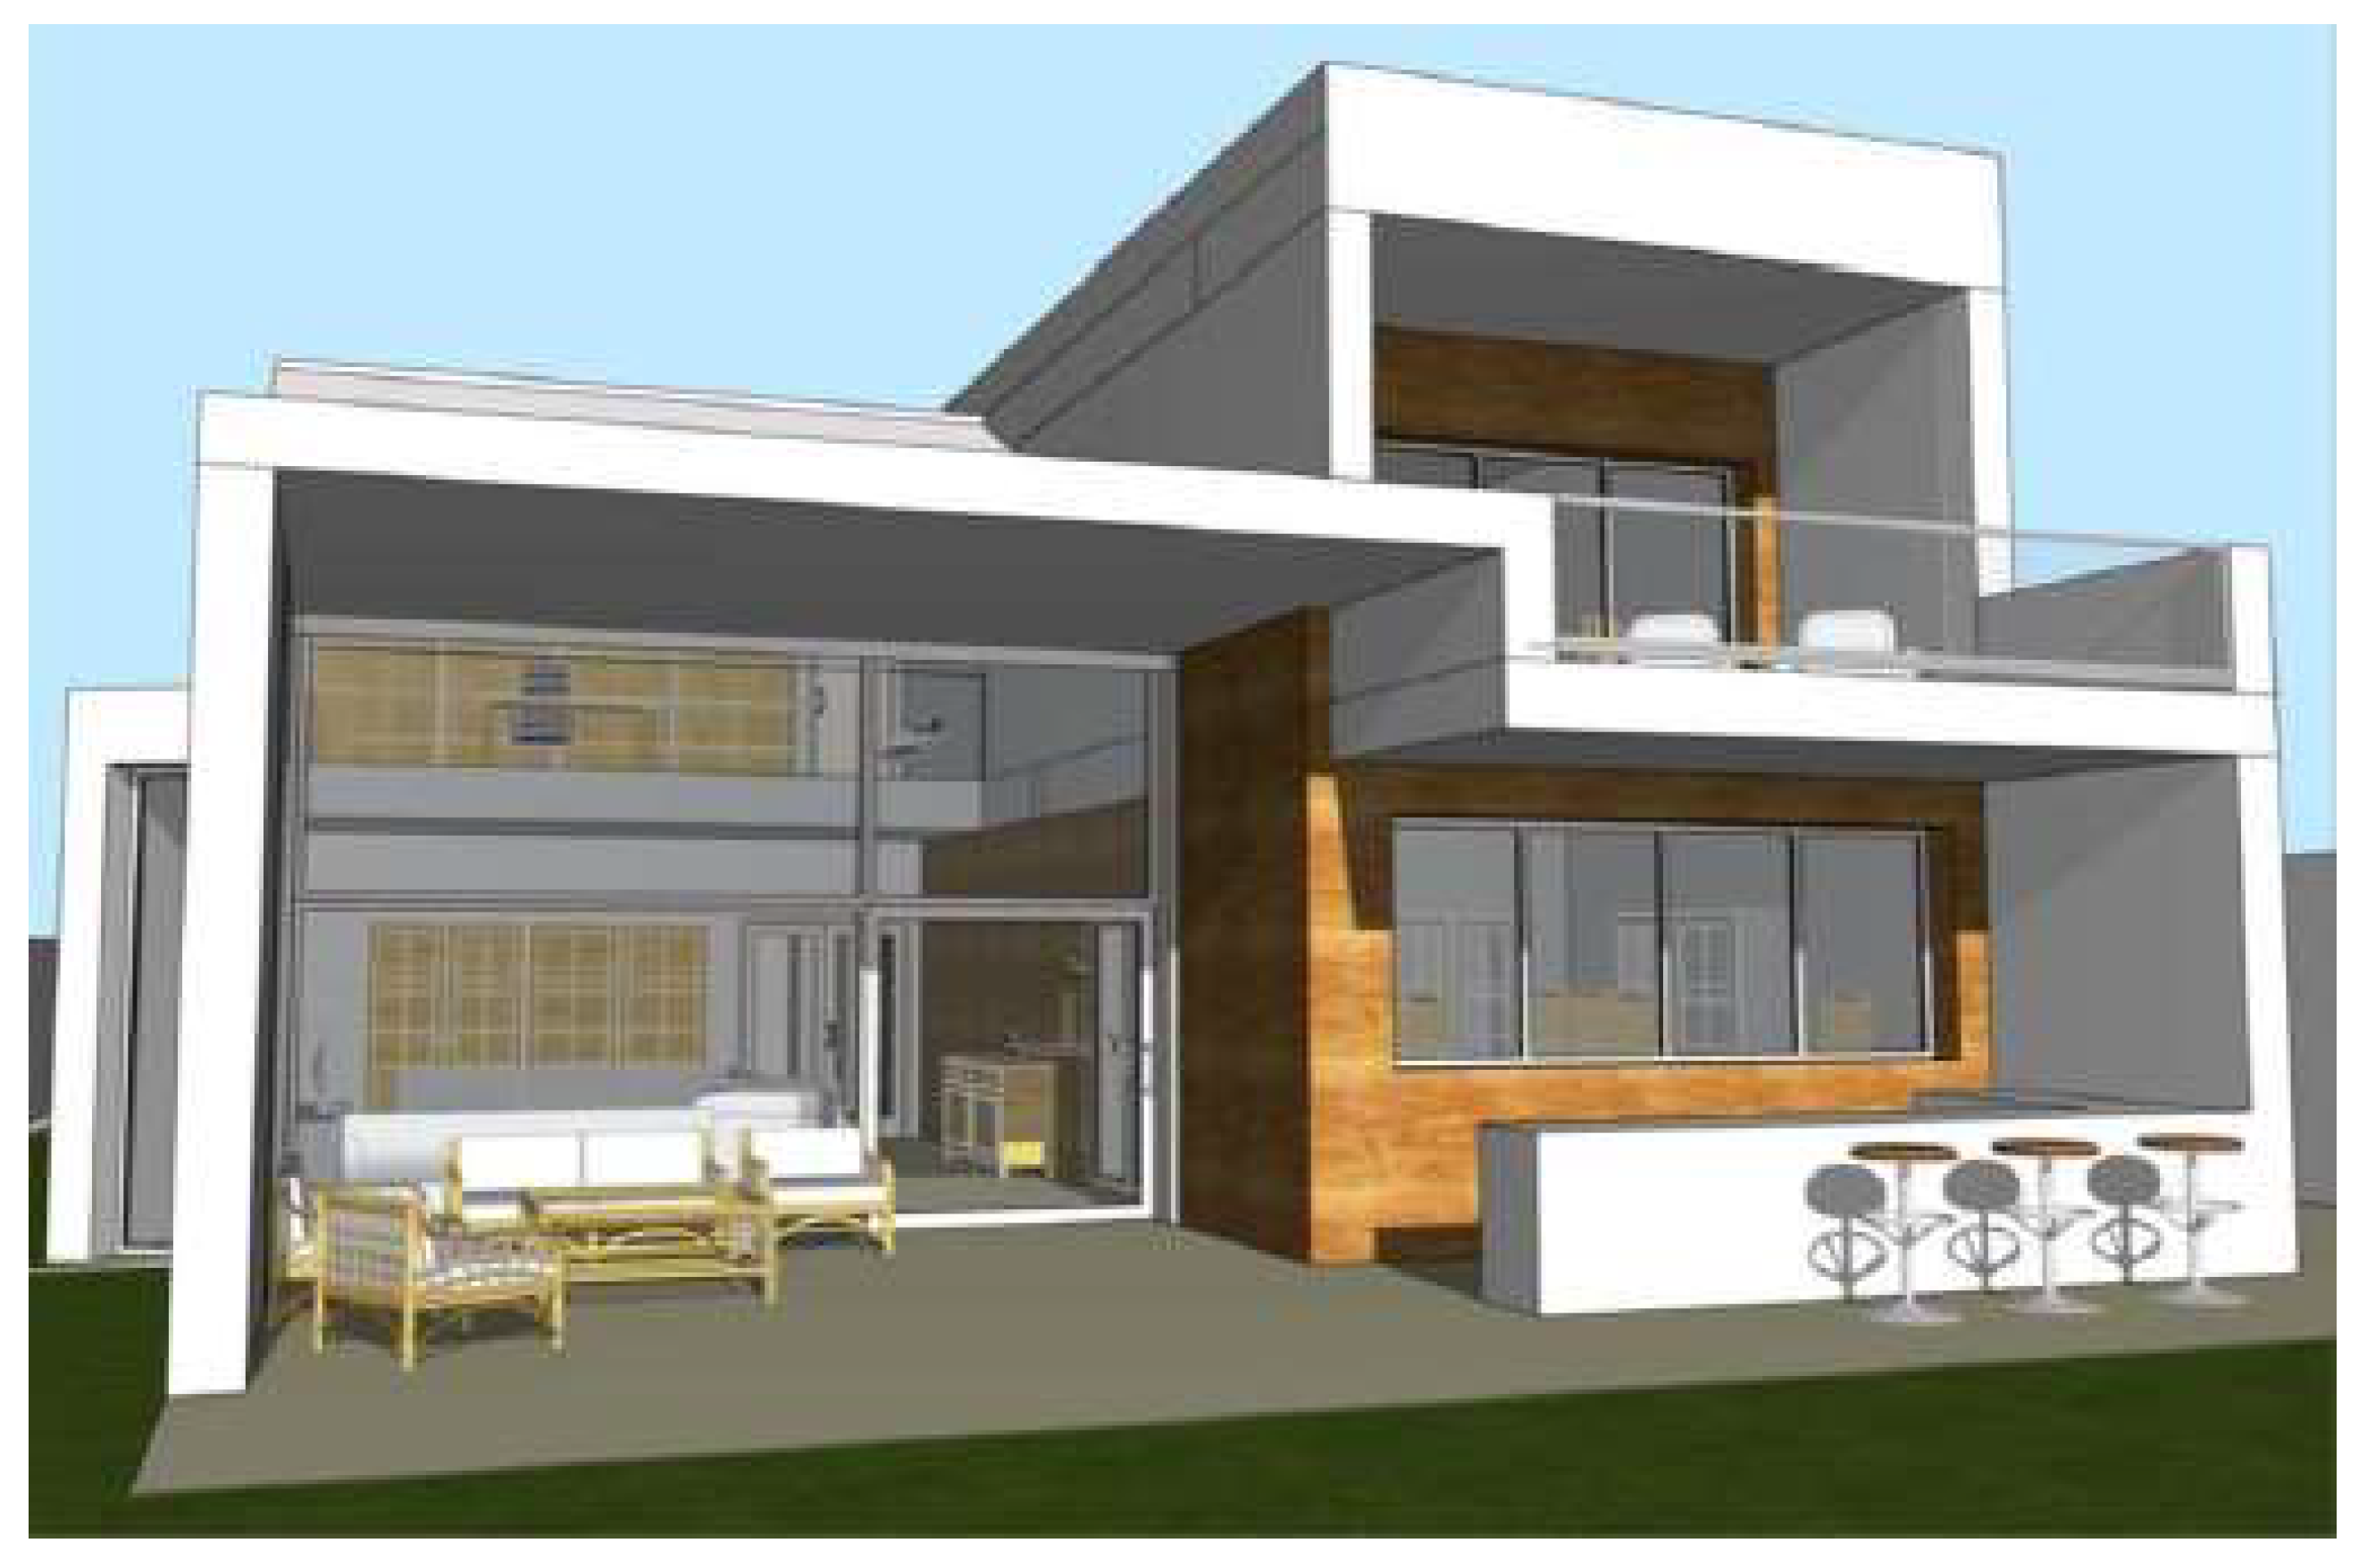
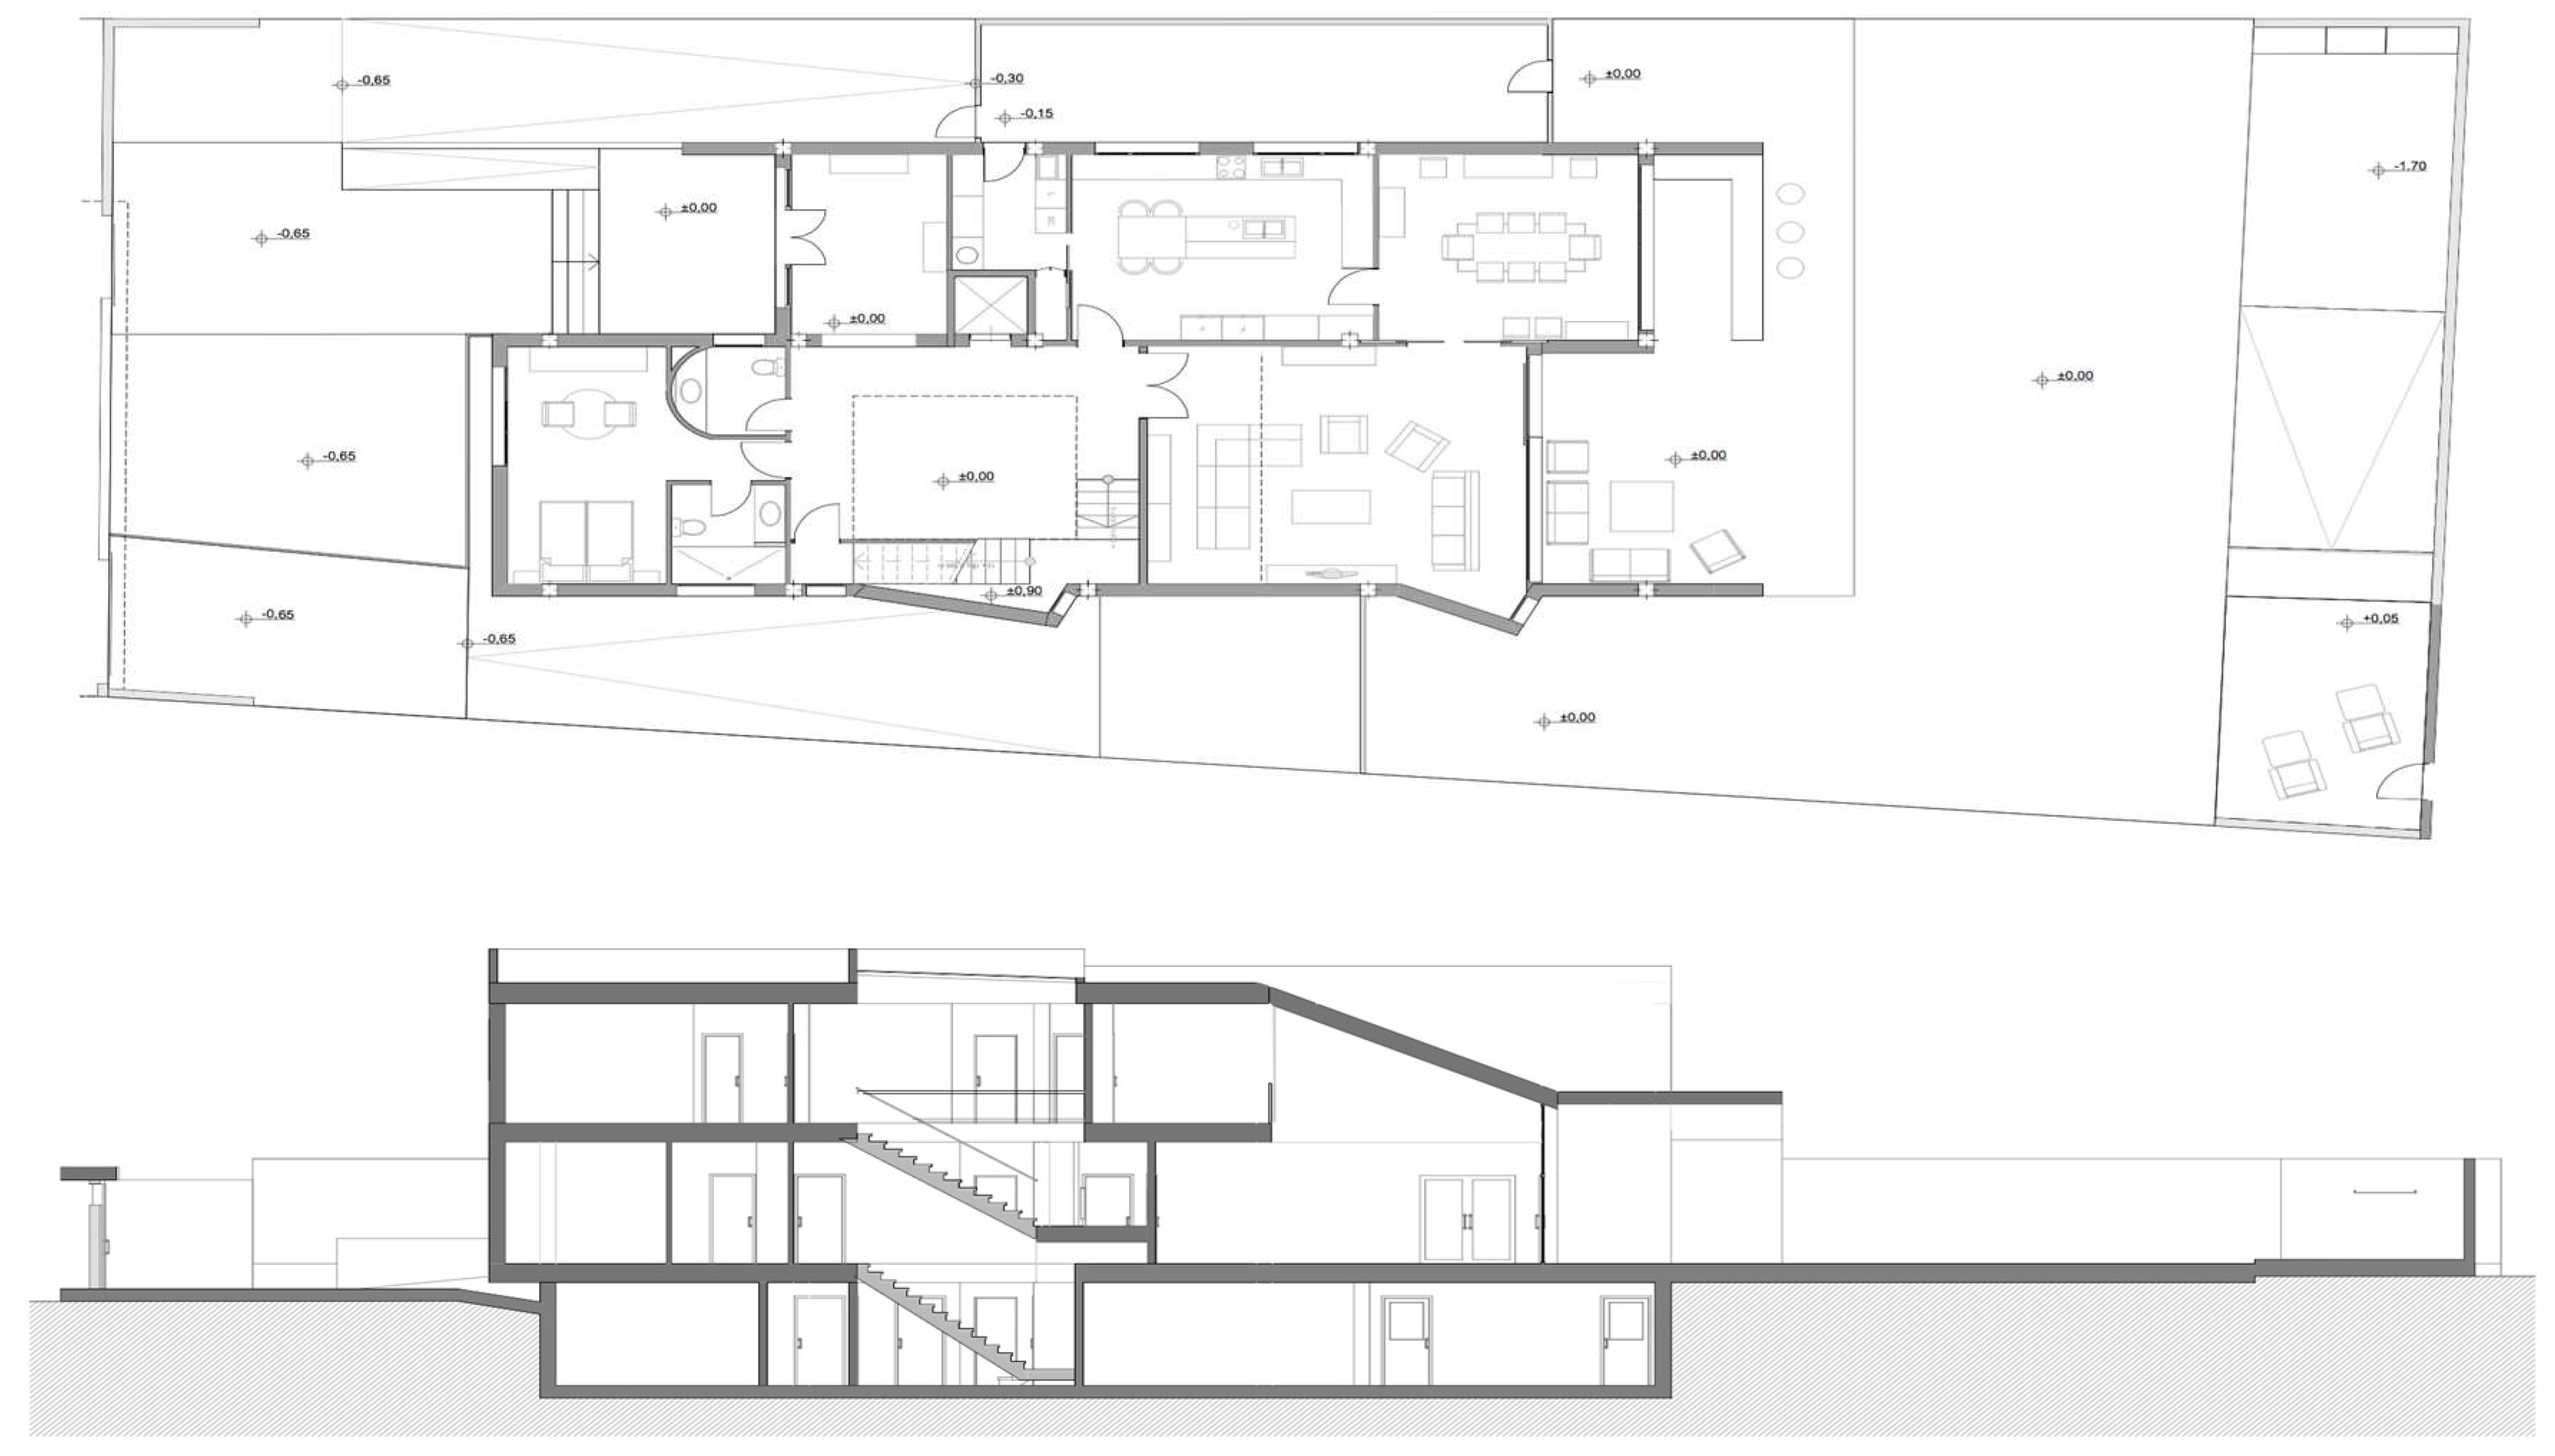
Figure 8 represents the ground floor and a longitudinal section of the house, including the plot.
Several location alternatives were studied in the plot, choosing the one that favored an F as small as possible.
Because of architectural design (see
Figure 7), the HVAC energy demand by design was 9.8 kWh/m
2 year, accomplishing the uhuMEB methodology requirements (see
Table 1). To achieve this HVAC efficiency, the work done with each one of the MEB requirements (see Columns 1 and 5 of
Table 1) is presented below.
4.2.1. Sunshading
Due to its geographical location, almost all the effort at Casa Zaranda has focused on protecting the south and west facades from direct solar radiation in the summer, increasing the albedo of the materials in the exposed facade area and decreasing it in areas only accessible to solar rays in the winter.
Several depth options were studied for the overhangs in the south facade, the most relevant, since it connects the main spaces of the house with the garden. Finally, a depth of 4.25 m was chosen for the overhang over the living room, 2.10 m for the overhang over the dining room, and 2.10 m for the overhang of the main bedroom.
Figure 9 and
Figure 10 illustrate how the control of the overhang dimension in the south façade allows solar ray entry into the dwelling in the winter (beneficial) and prevents it in the summer (harmful). In this way, the objective of receiving solar rays in the cold months and not receiving them in the hot months was achieved.
4.2.2. Envelope Thermal Transmittance
To achieve a 9 cm of mineral wool was prescribed inside the thermal envelope chamber. Of the different alternatives of insulation material on the market, glass wool with 0.034 W/m·K was chosen.
To avoid thermal bridges in the thermal envelope, the continuity of the insulation was assured by the pencil rule, i.e., marking the insulation layer and its encounter with the gaps in the enclosure with a continuous line in each of the sections of the building.
4.2.3. Form Factor
Casa Zaranda presents the maximum compactness compatible with the urban regulations of its plot. The outer envelope surface is 693.21 m
2, and the inner volume enclosed is 1301.40 m
3, so
F = 0.53 m
2/m
3, fulfilling widely the MEB requirement (see
Table 1).
4.2.4. Envelope Airtightness
To obtain the necessary airtightness in Casa Zaranda, several alternatives were studied, discarding the installation of a semipermeable membrane in benefit of the application of a continuous layer of gypsum-cement mortar on the inner side of the external envelope. The steps of the facilities were sealed with the same mortar, applying silicone to the inside of the corrugated tubes and cable grommet. Joints between carpentry and walls were filled with high-durability flexible self-expanding polyurethane foam. The blinds were identified as singular weak points. Therefore, they were treated with sealing joints until a satisfactory airtight behavior of the entire envelope was achieved.
4.2.5. Natural Ventilation
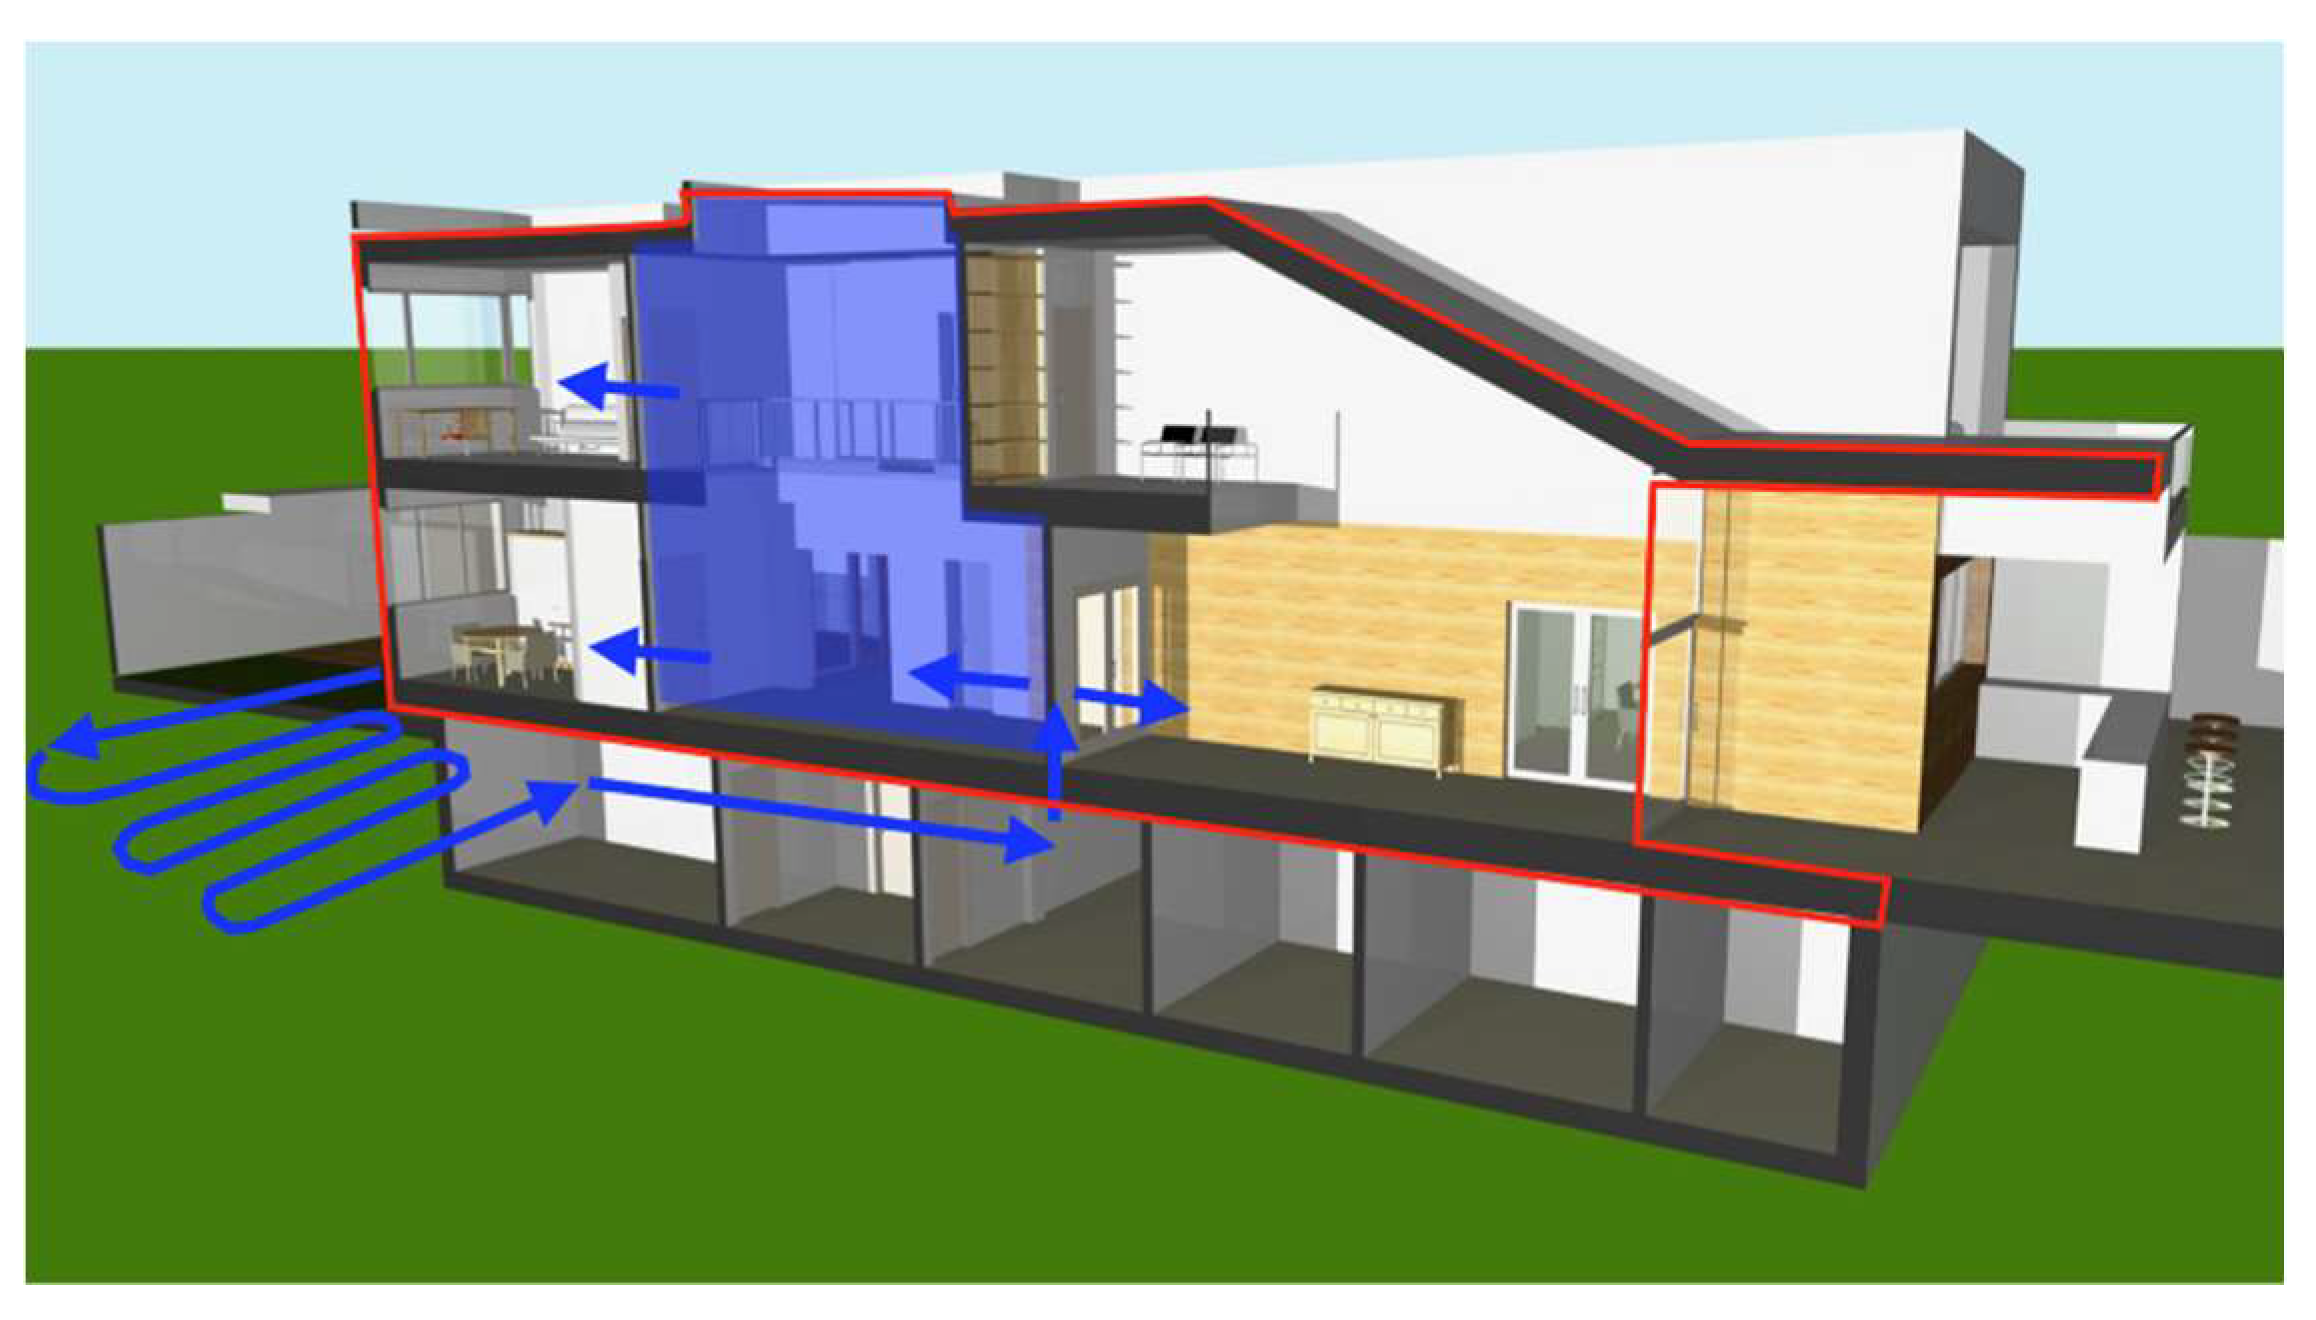
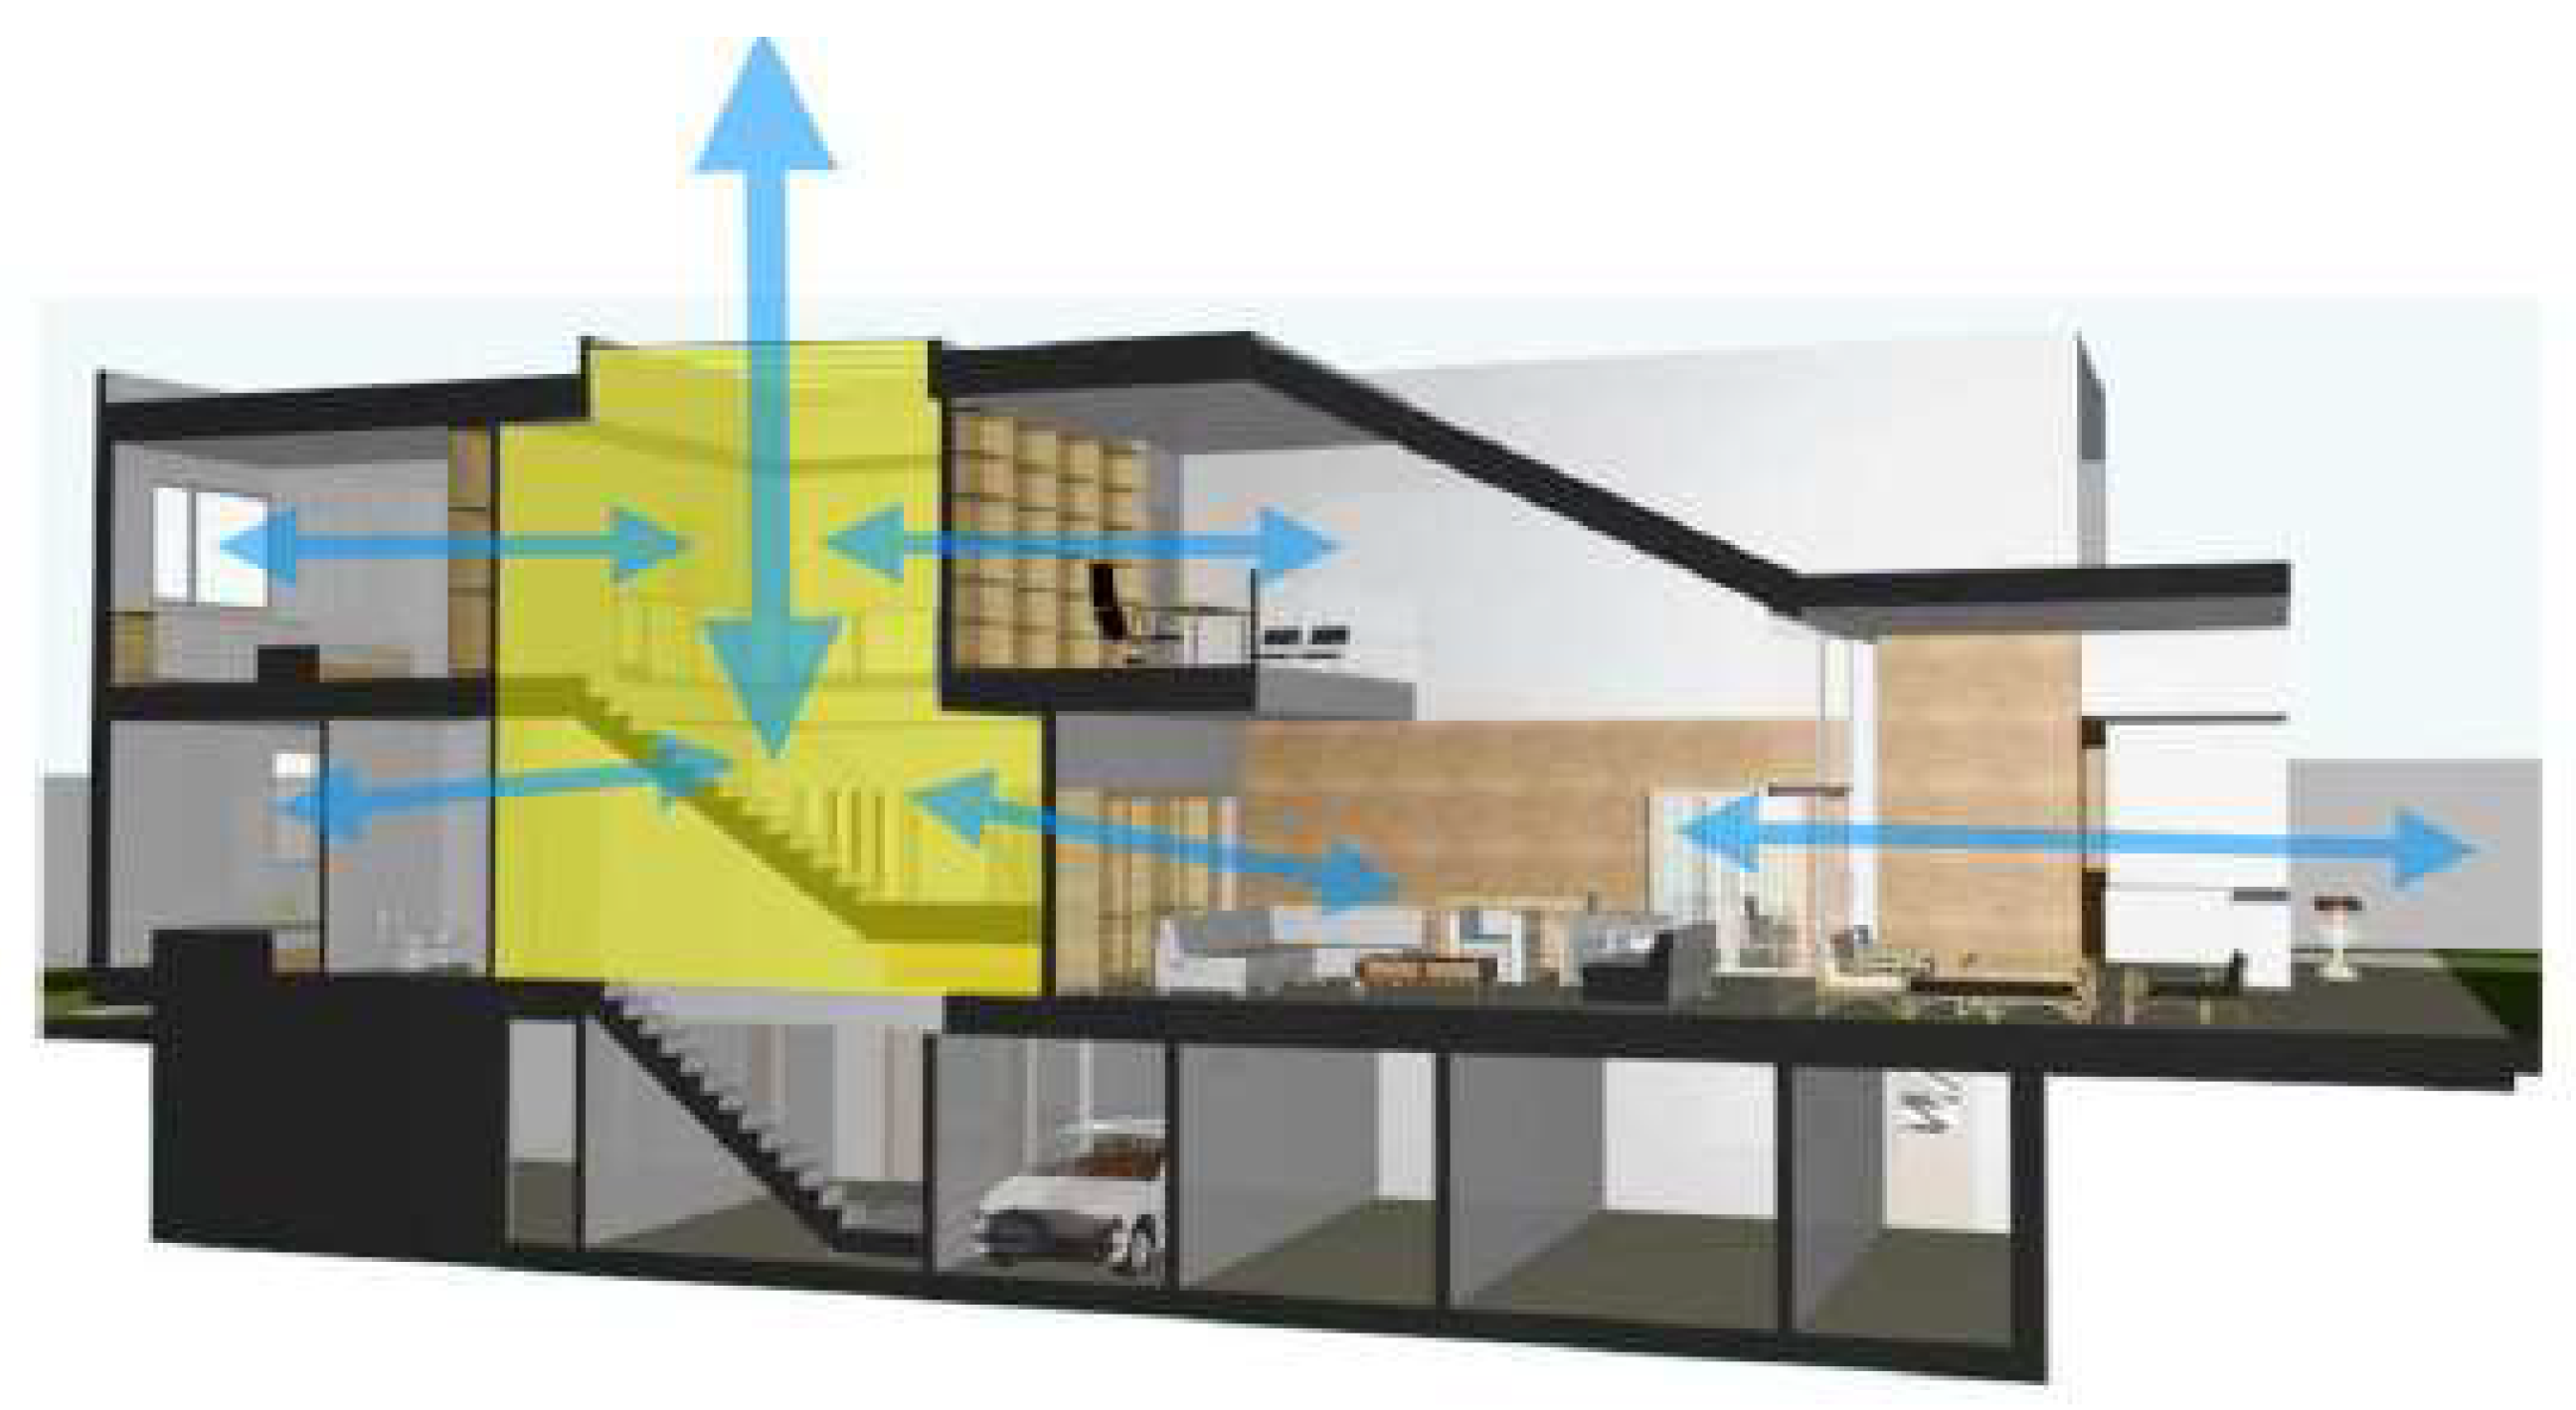
Casa Zaranda provides natural ventilation. To facilitate it, the contribution of the chimney effect of the indoor-covered patio due to the opening of windows in the bedrooms and living room was studied. This allows for a
Sof = 0.0684 m
2/m
2, fulfilling the requirement demanded by the uhuMEB, >0.05 (see
Table 1). The operation scheme is shown in
Figure 11.
As proof of the interaction between architectural and engineering designs (steps green and blue of
Figure 7), natural ventilation and HVAC systems have been designed to function together to achieve the best energy efficiency. This will be depicted in Subsection 4.3.1 (HVAC), but here it is worth mentioning that conductivity was chosen for its added qualities of acoustic absorption, low price, and ease of installation. To this, PVC (poly vinyl chloride) carpentry was added with 1.2 W/m
2·K thermal transmittance and glasses with a 12 mm chamber with 95% Ar gas and 1.0 W/m2K thermal transmittance. In order to achieve the cross-ventilation effect (
Figure 11), the architectural/engineering solution has been to equip the covered patio (skylight) with automatic motorized side windows, governed by the ICS, arranged at a higher level than the windows of the rooms, which are also motorized, so that the flow of hot air finds its way out naturally.
4.2.6. Natural Lighting
Casa Zaranda allows for natural lighting. All the rooms of the house are naturally illuminated to reduce electricity consumption. This also includes those rooms that the regulations of mandatory compliance relating to health and habitability allow to have no windows or exterior spaces, such as bathrooms, hallways, and corridors. Even the garage in the basement takes advantage of the light gaps that allow the layout of the exterior access ramp.
The dwelling meets the requirement of
Sgf >0.1 (see
Table 1). The large window of the living and dining rooms, as well as the covered inner patio, constitute a great source of natural light that minimizes the need for artificial lighting.
Table 2 shows the savings because of natural lighting in Casa Zaranda. The comparison that can be made regards the LED lighting installed in the house. The average annual savings because of natural lighting is around 156.80 kWh/year. Better results are obtained if, instead of using LED lighting, less efficient artificial lighting systems are used.
4.3. Facilities & Systems Engineering Design
Once the passive design of Casa Zaranda has been completed (architectural design, see
Figure 7) with all the MEB requirements satisfied, the Facilities & Systems engineering design stage follows. The result of the work done, which is detailed below, is that the total primary energy demand by design was 74 kWh/m
2 year—below the value of 80 demanded by the uhuMEB methodology (see
Figure 7). To accomplish this efficiency, the work carried out with each one of the facilities & systems regarding their MEB requirements (see Columns 2 and 5 of
Table 1) is described below.
4.3.1. Heating, Ventilating and Air Conditioning
To take advantage of the available room on the plot and the compulsory excavation to locate the basement of the house, a LEGE system has been designed [
62]. This system can replace the conventional external air intake set by the mandatory regulations in Spain (window aerators, wall aerators, etc.) and can work as a preconditioning system to the HVAC. In this way, the renewal air coming from outside the house is previously tempered by exchanging heat with the ground, yielding it in the summer and taking it in the winter (
Figure 12).
To complete the HVAC system, a high efficiency variable refrigerant volume (VRV) heating/cooling system was chosen. Its function is to compensate the thermal gap between the LEGE output and the desired comfort temperature of the Zaranda house inhabitants. The indoor units are split wall mounted. It is a versatile and economical system. VRV technology circulates only the minimum amount of refrigerant needed at any one time and enables individual climate control of air conditioning zones, thus minimizing energy consumptions to deliver energy savings.
To obtain the cross-ventilation effect (
Figure 11), the installed home automation system (not the subject of this paper) can automate the opening and closing of the skylight holes and of the windows that face the indoor yard, depending on whether the heat needs to be dissipated or kept inside. In fact, the skylight with its closed holes is a source of solar radiation for heating the house (greenhouse effect) during the cold season.
Simulations carried out with the designed HVAC system have shown that, in any normal comfort condition (from 20 to 24 °C and RH around 50%), the HVAC system consumption is always under 10 kWh/m2 year.
4.3.2. DHW
To produce DHW, conventional flat solar thermal collectors have been chosen. This is because free space abounds on roofs tops, and it is a cheap, efficient, and substantially tested DHW system. The facility was sized with a total of eight collectors capable of meeting 100% of the housing′s DHW demand. In these latitudes, covering 100% of the ACS demand in the winter results in a surplus of ACS in the summer. This has been solved by including in the design a titanium plate exchanger with a primary that transfers all the excess heat to the pool, which acts as an energy sink.
4.3.3. Appliances
All appliances installed in Casa Zaranda are classified as A++ or A+++ (as per the uhuMEB demand, see
Table 1). The refrigerator was projected on the opposite wall of the kitchen where the induction cooking plate is installed, which prevents heat transfer between them. The washing machine and the dishwasher have cold and hot water intake to better reduce consumption.
4.3.4. Lighting
Among the different luminaire options, it was decided that LED lighting for the entire house, distinguishing ornamental and operative lighting both inside and outside, was chosen to reduce consumption as much as possible. In the design of the lighting system, the energy efficiency label of all the lamps used is A++ (as per the uhuMEB demand, see
Table 1).
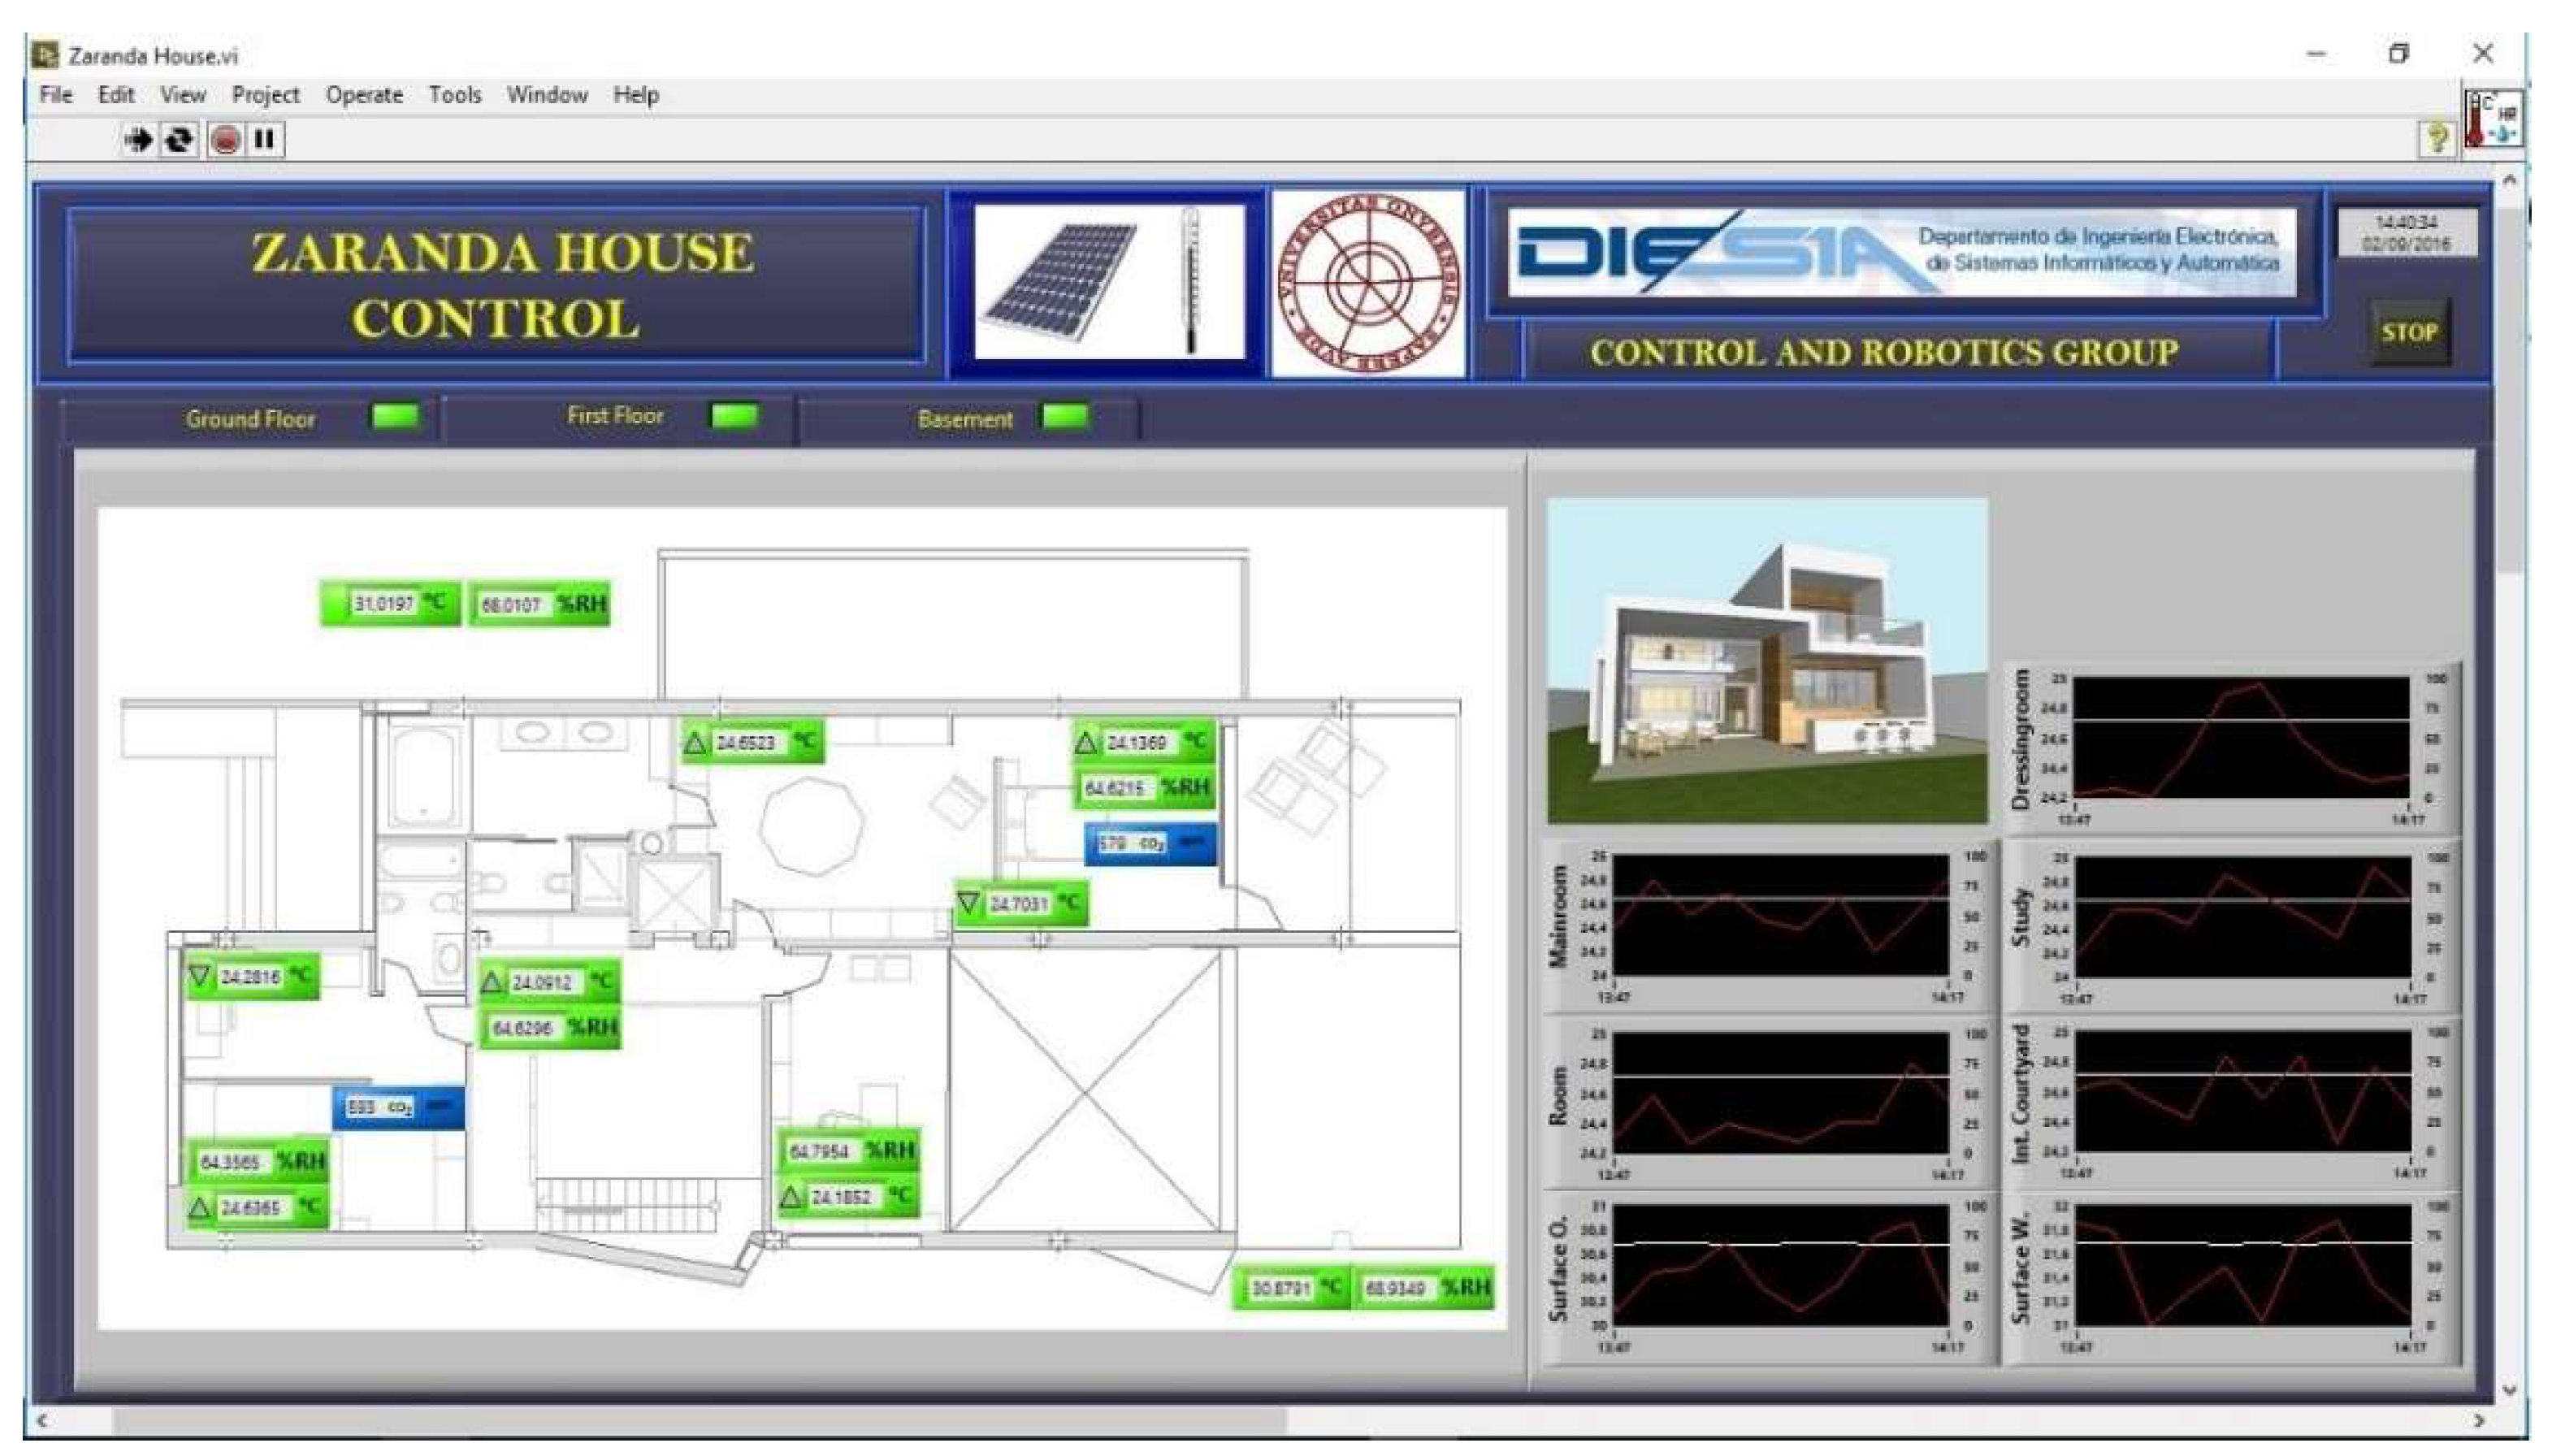
4.3.5. Instrumentation/Control System
Due to the use of the building as an actual research laboratory, the ICS was designed ad hoc and independently of the home automation system that is not the subject of this article. The ICS complies with the requirements of
Table 1 and takes measures from the RES. It uses sensors developed by the authors [
63,
64,
65].
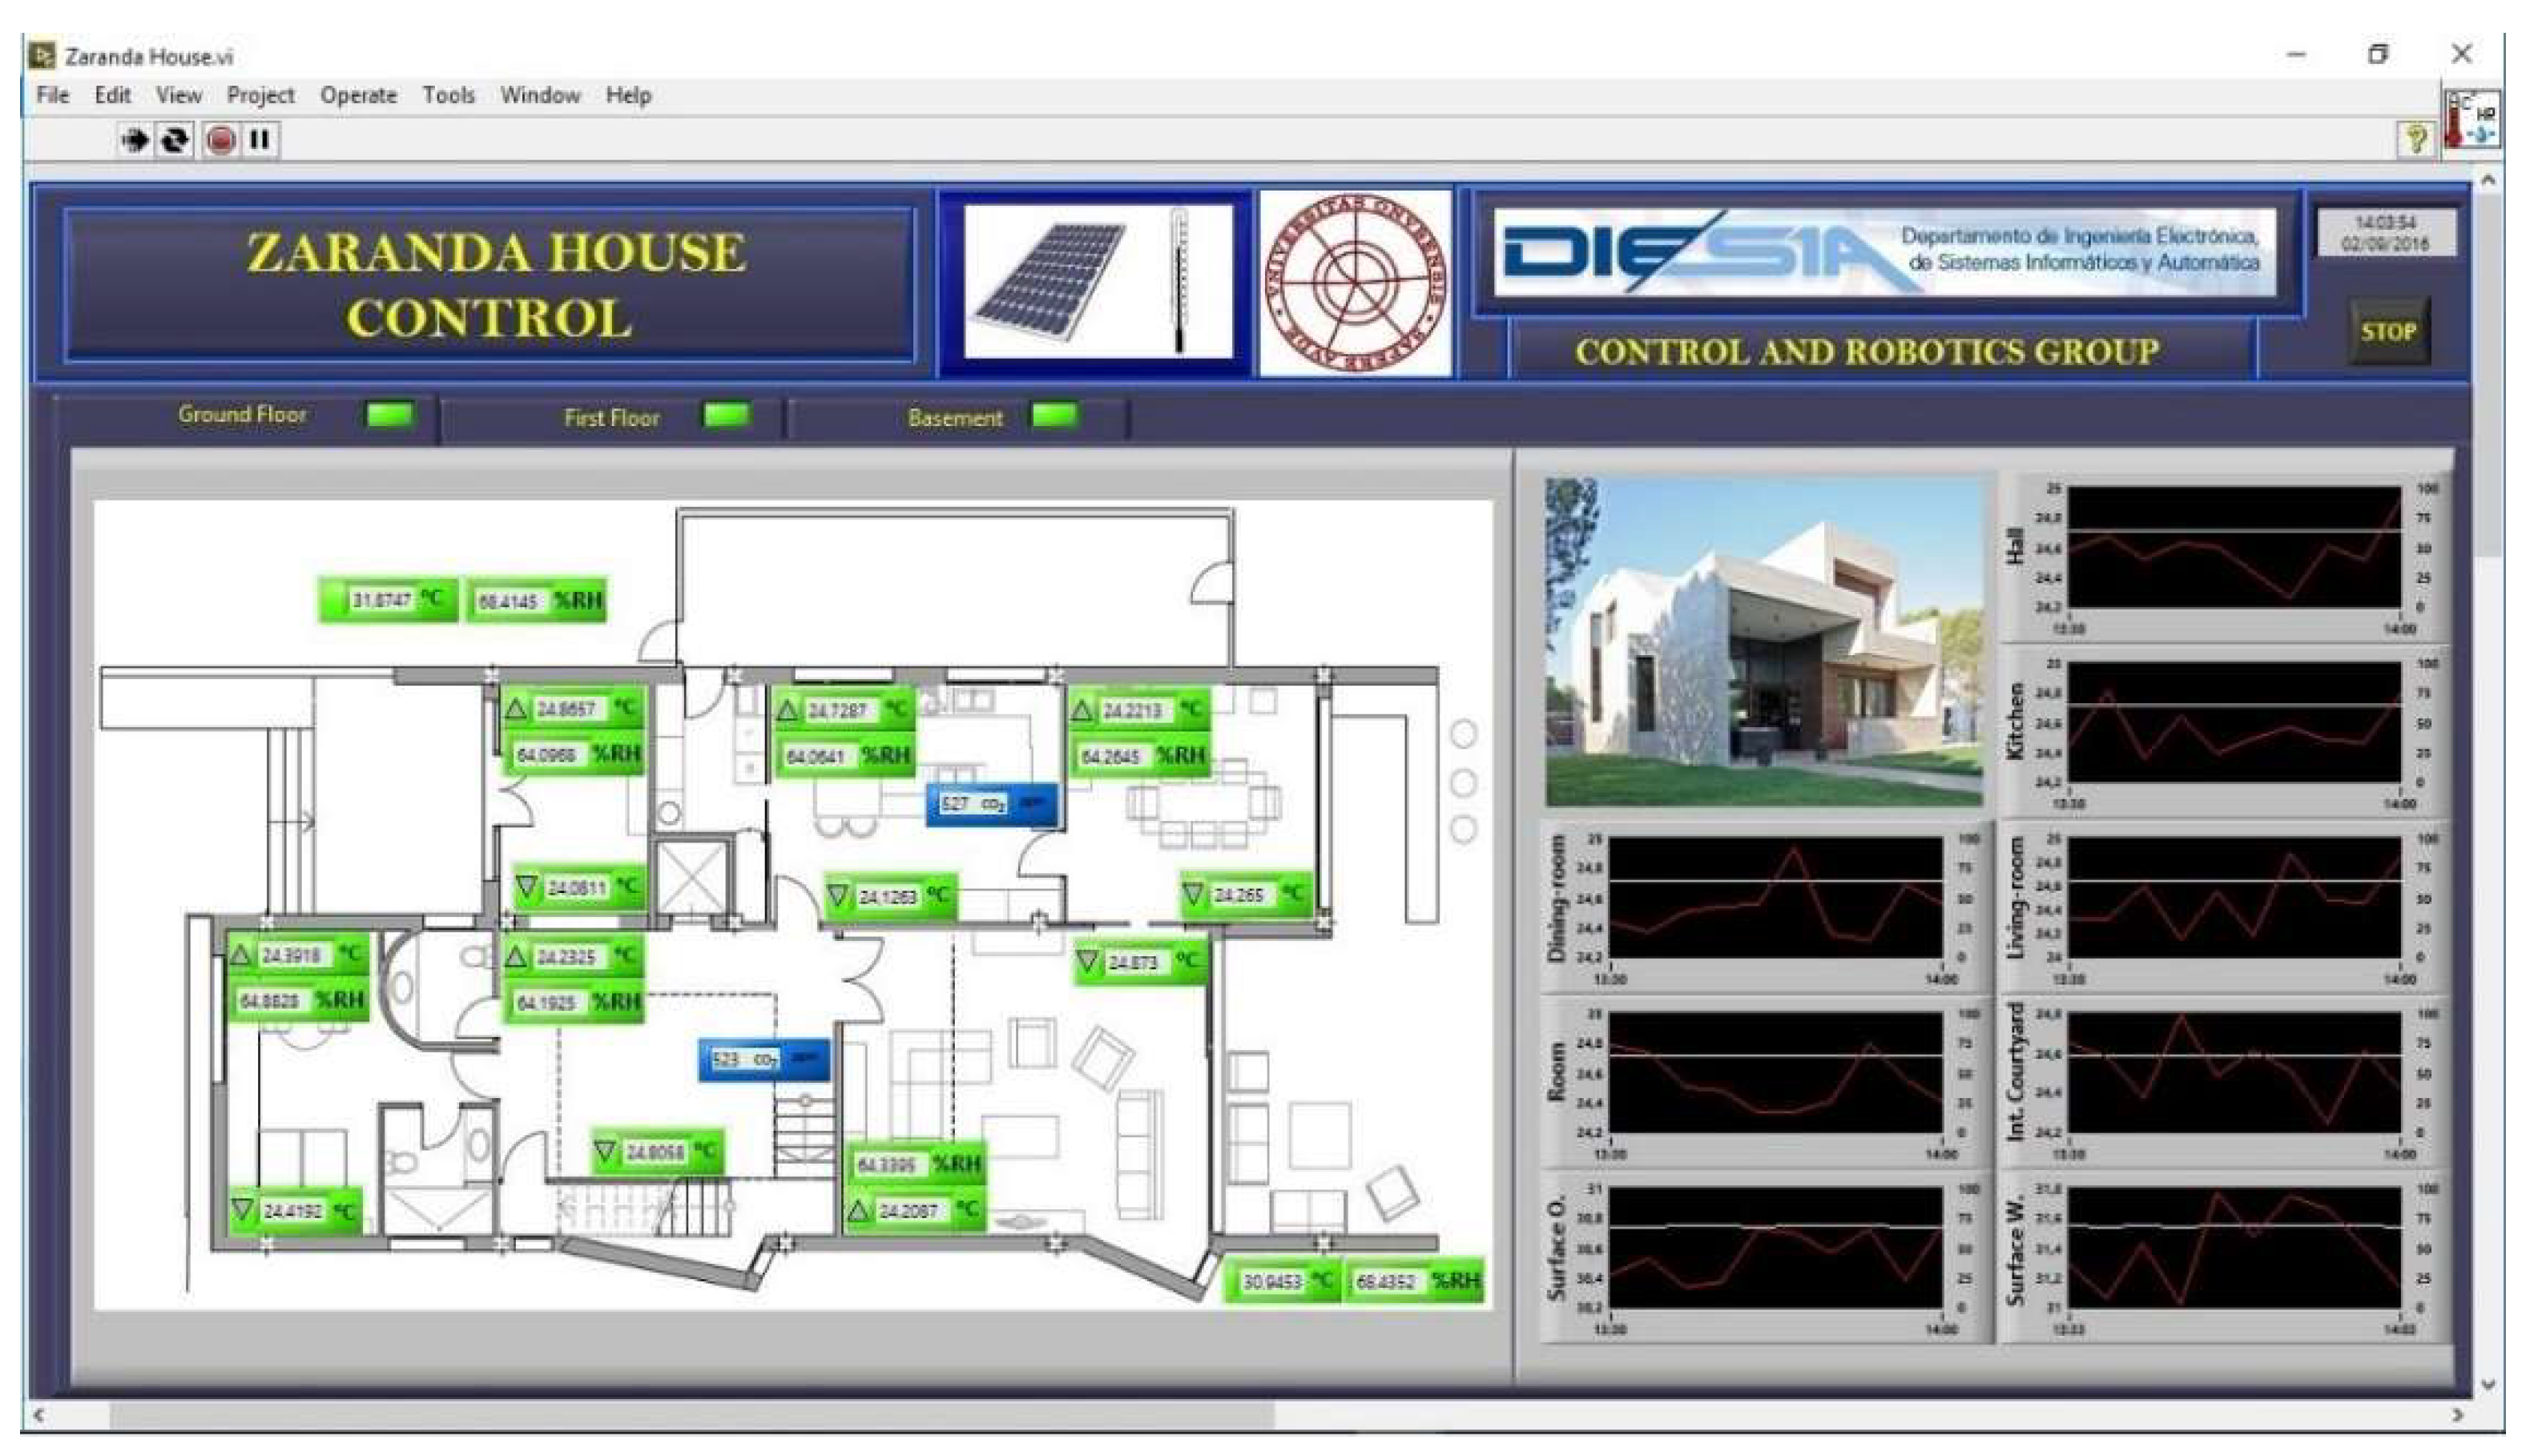
Figure 13,
Figure 14 and
Figure 15 show, as examples, several screens of the developed ICS. It can be consulted, with the access permission, from any device with an Internet connection via mobile phone.
4.3.6. Renewable Energy Systems
Casa Zaranda was designed with three RESs: flat solar thermal collectors (explained in 4.3.2), a LEGE (introduced in 4.3.1) system, and photovoltaic panels.
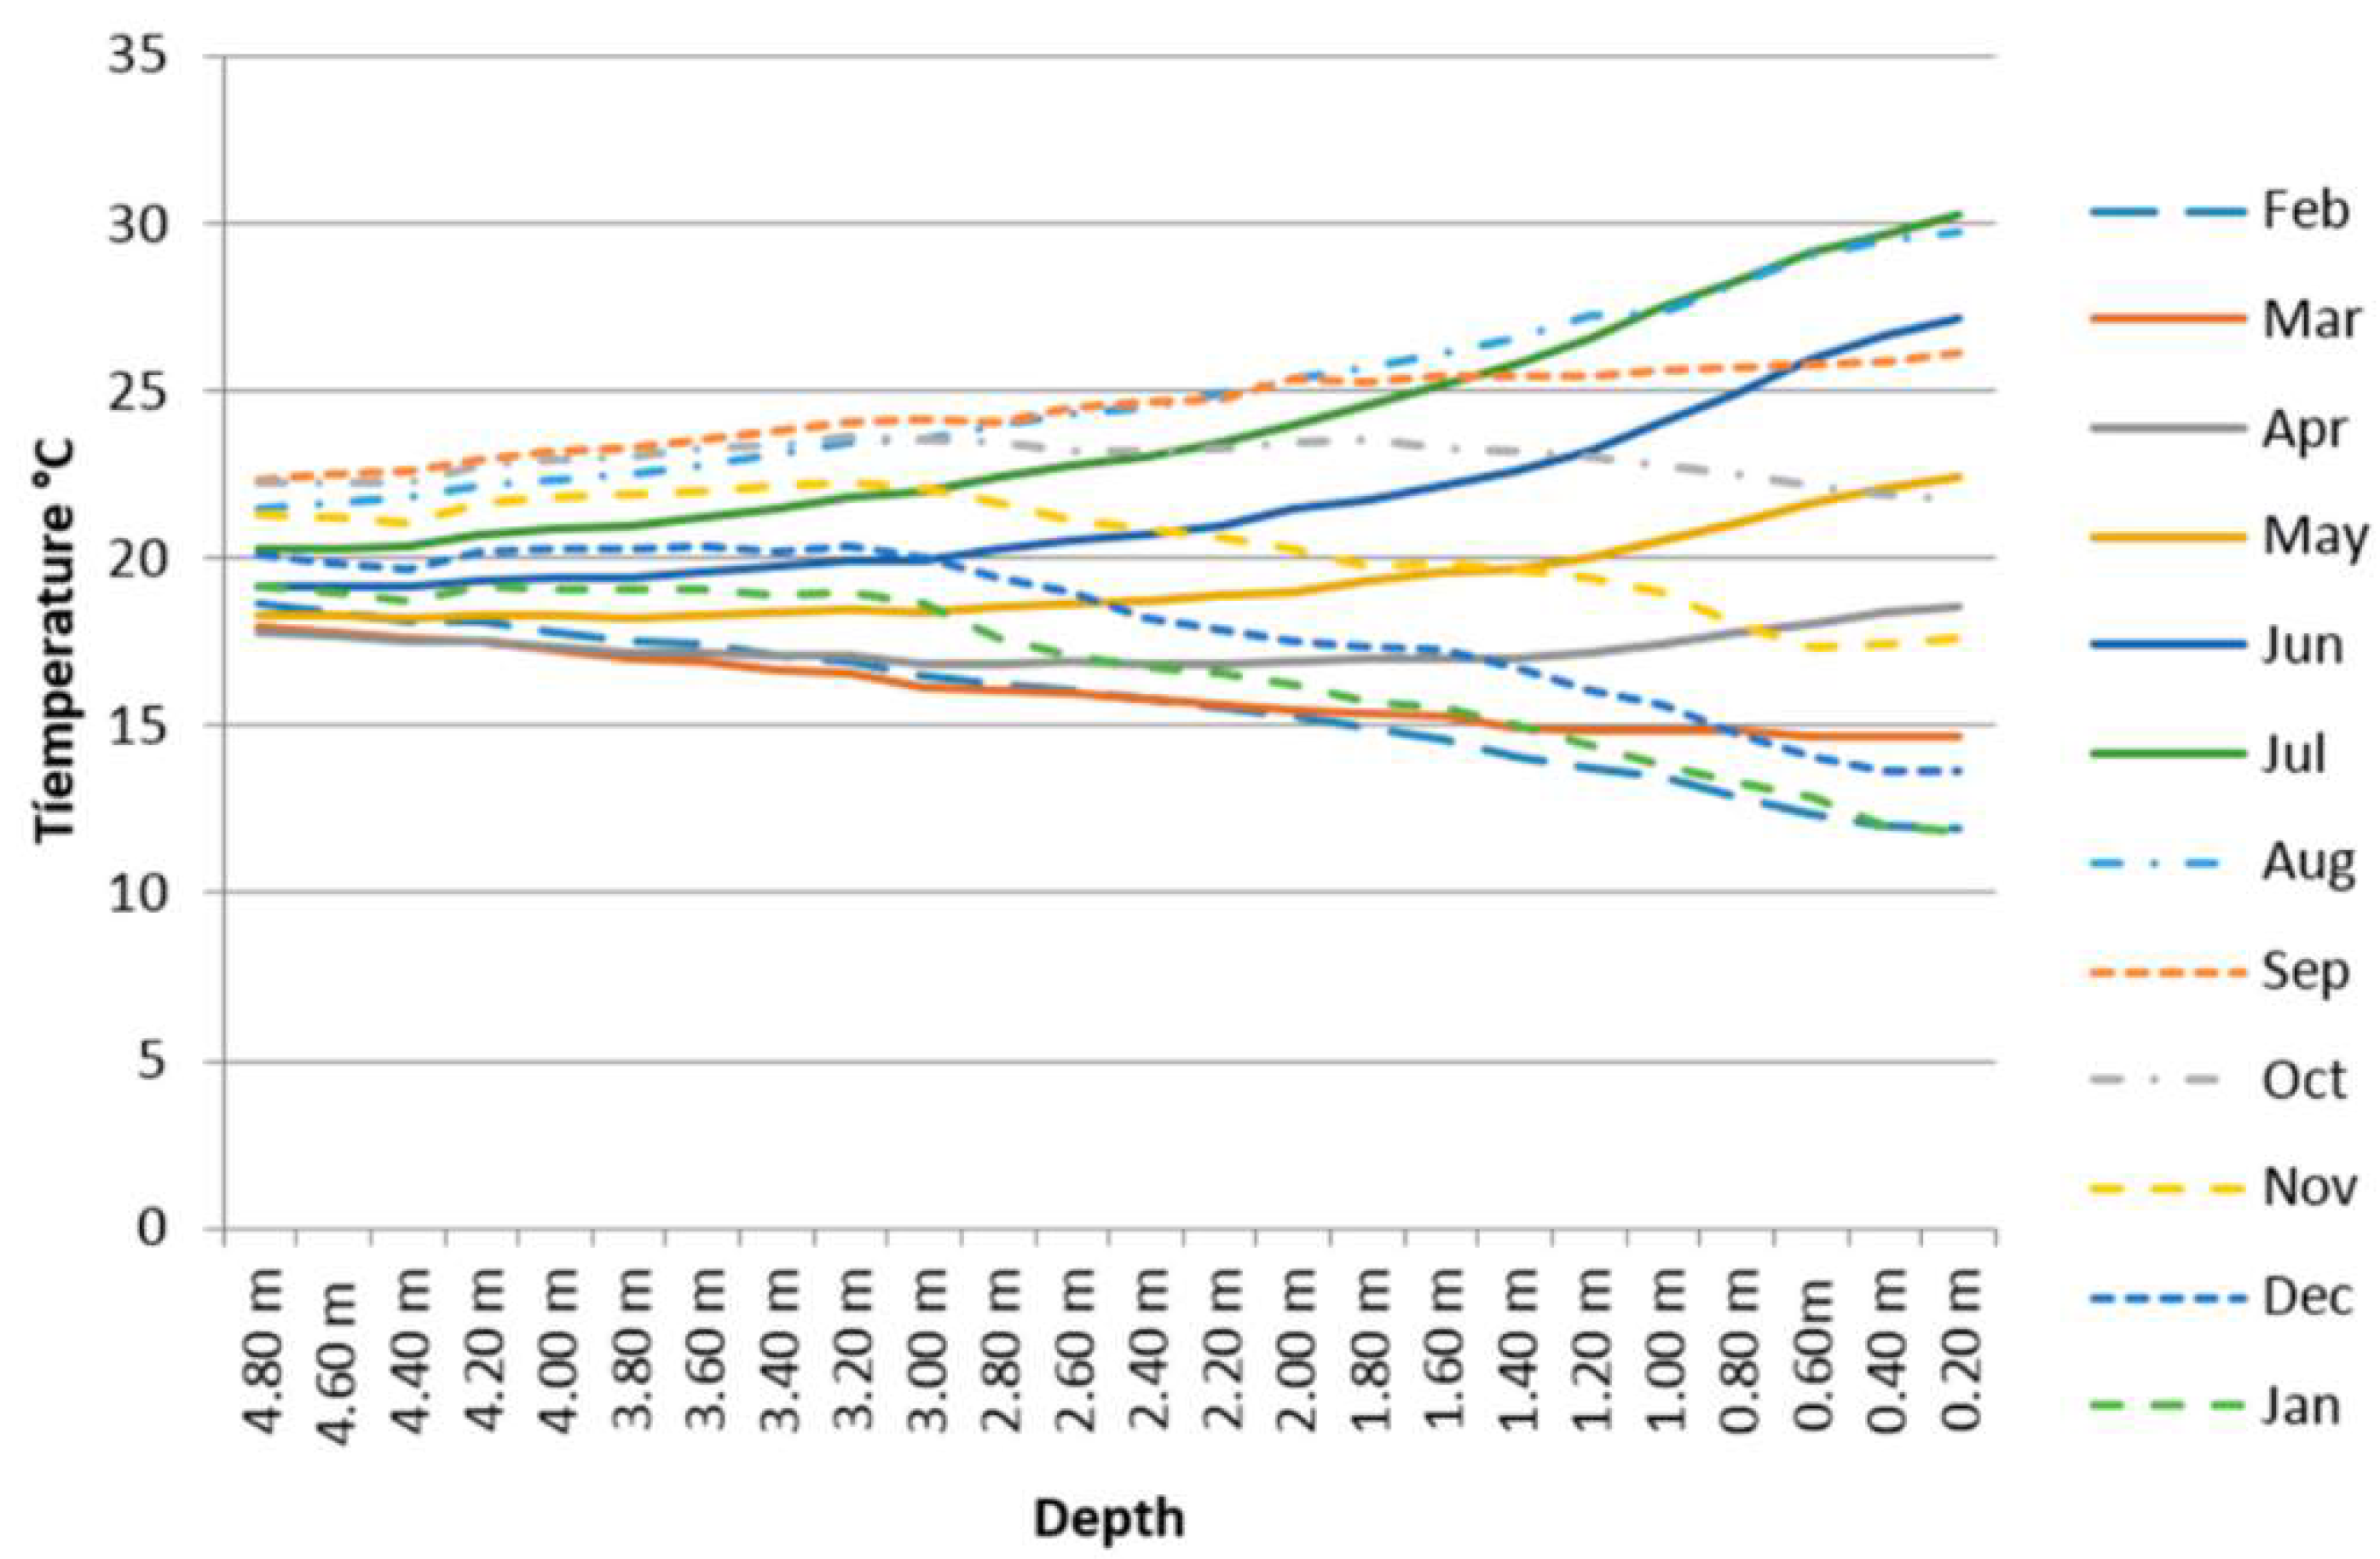
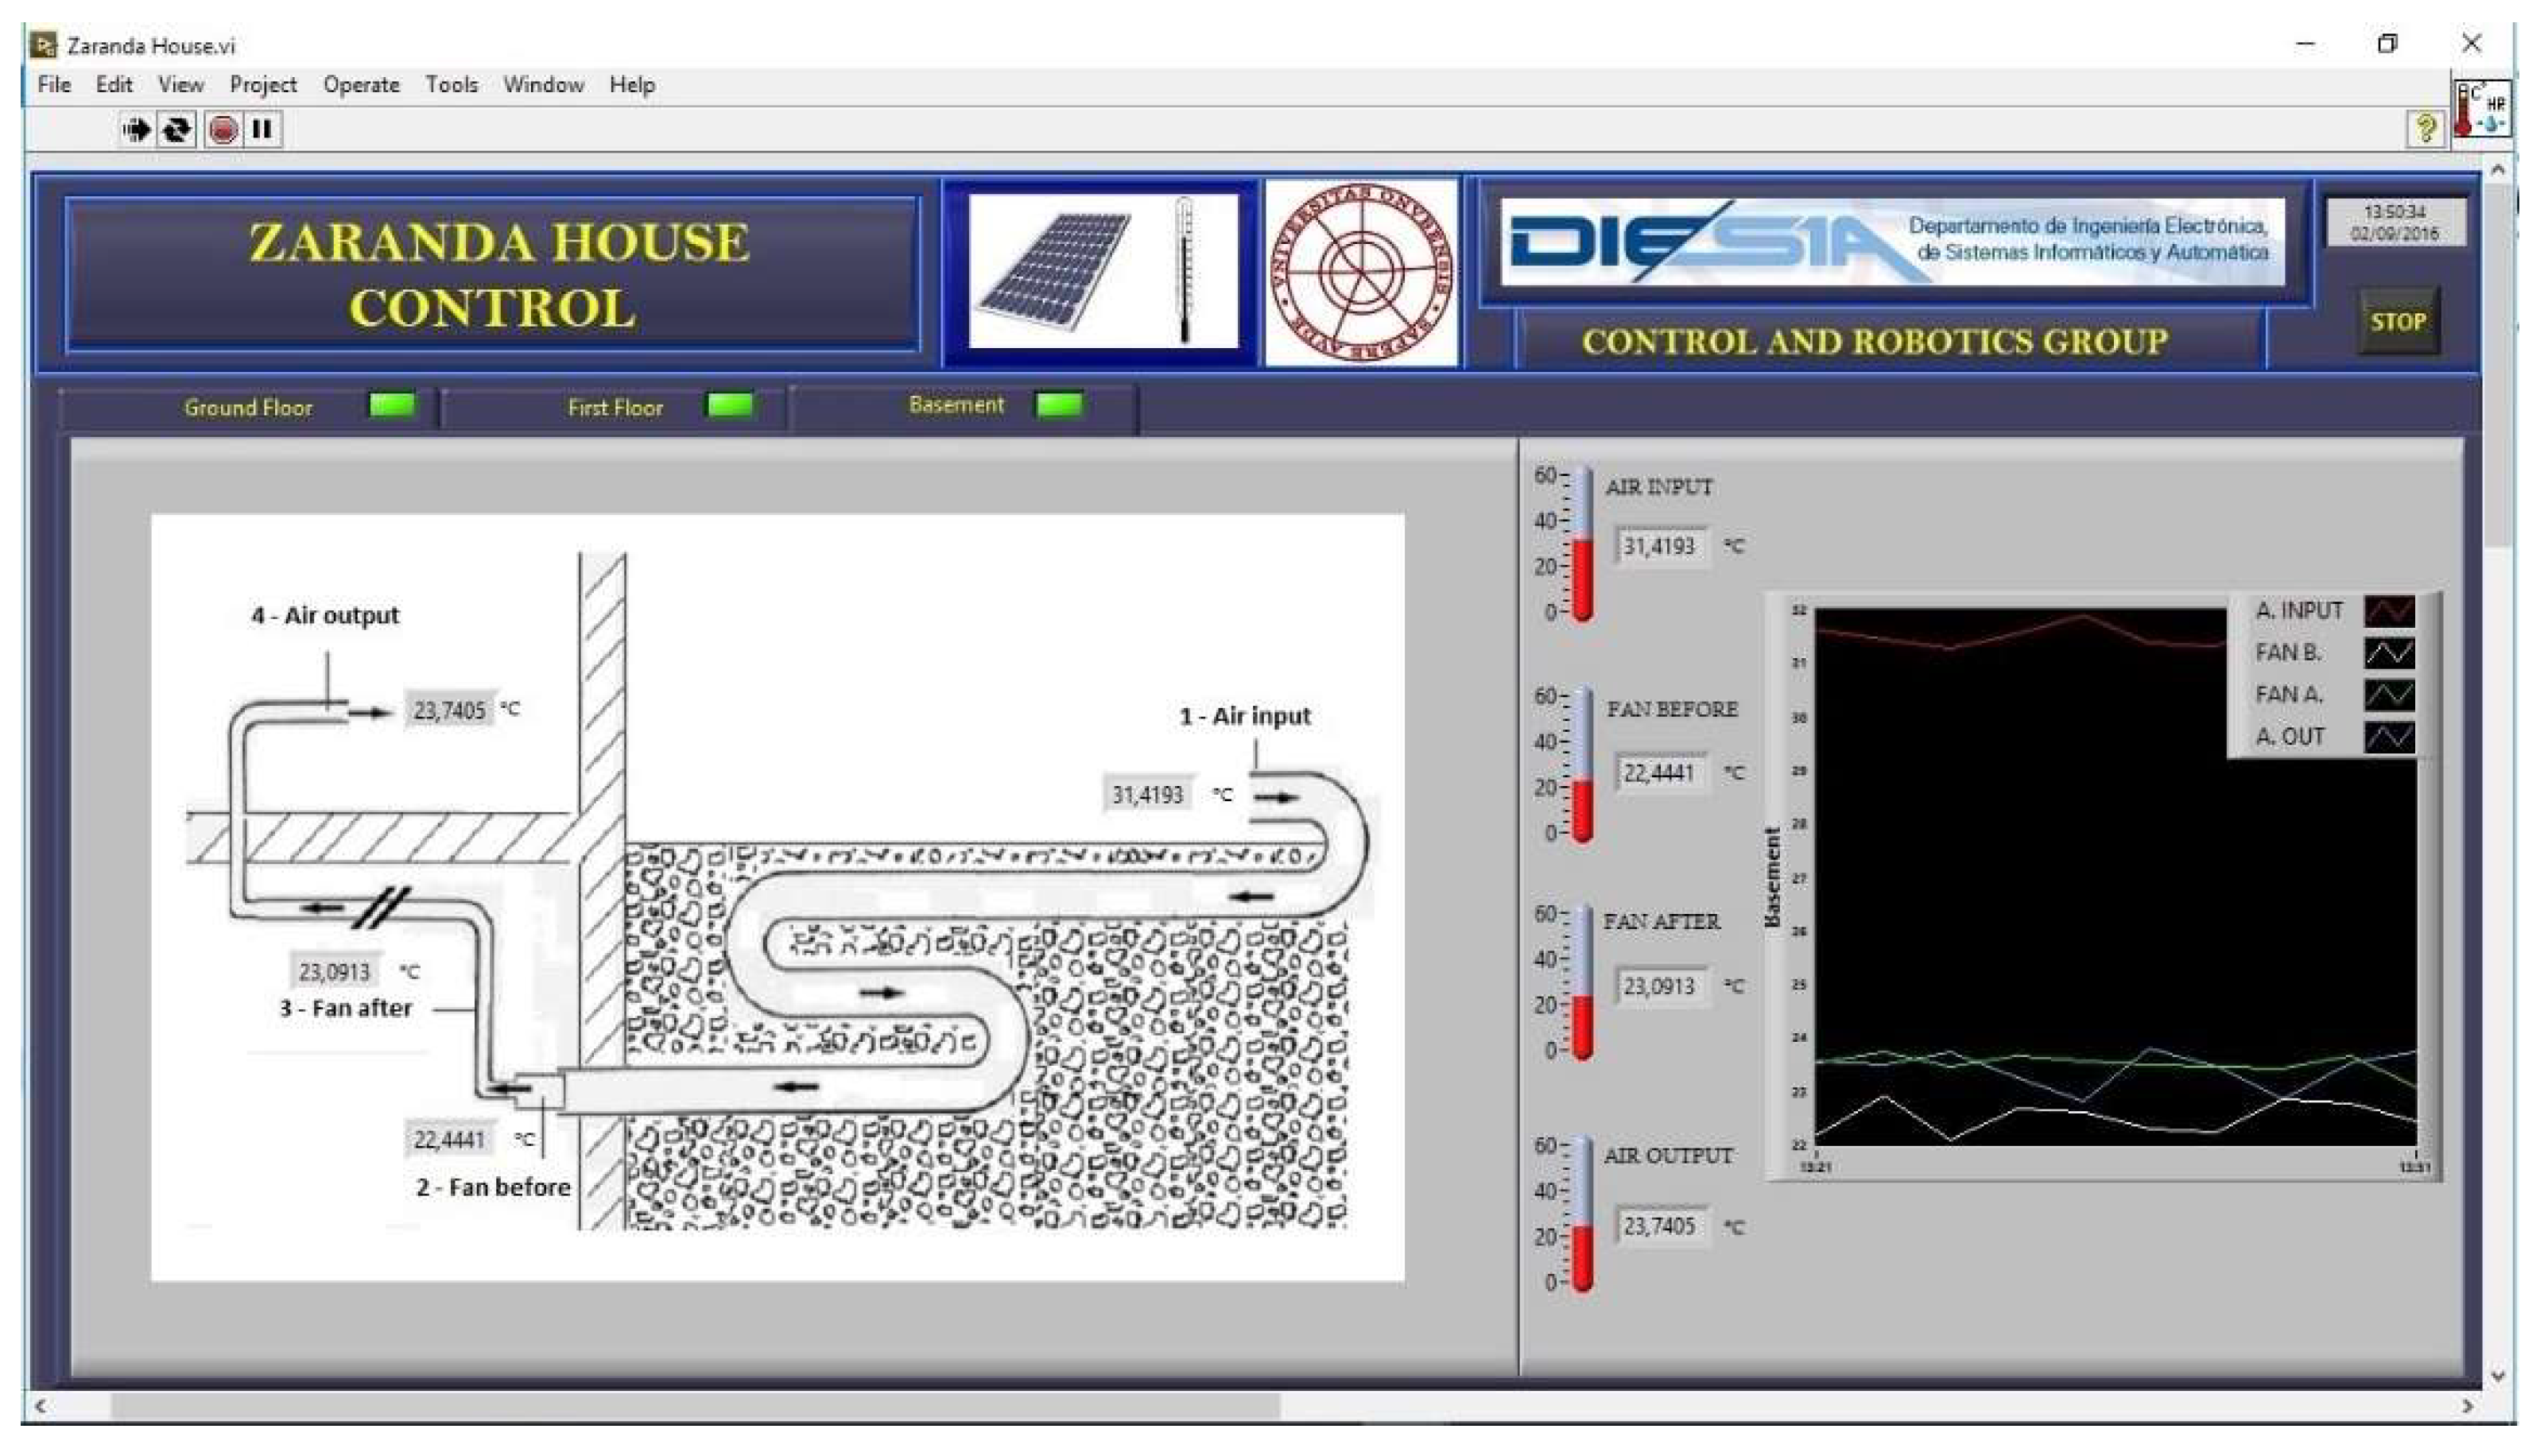
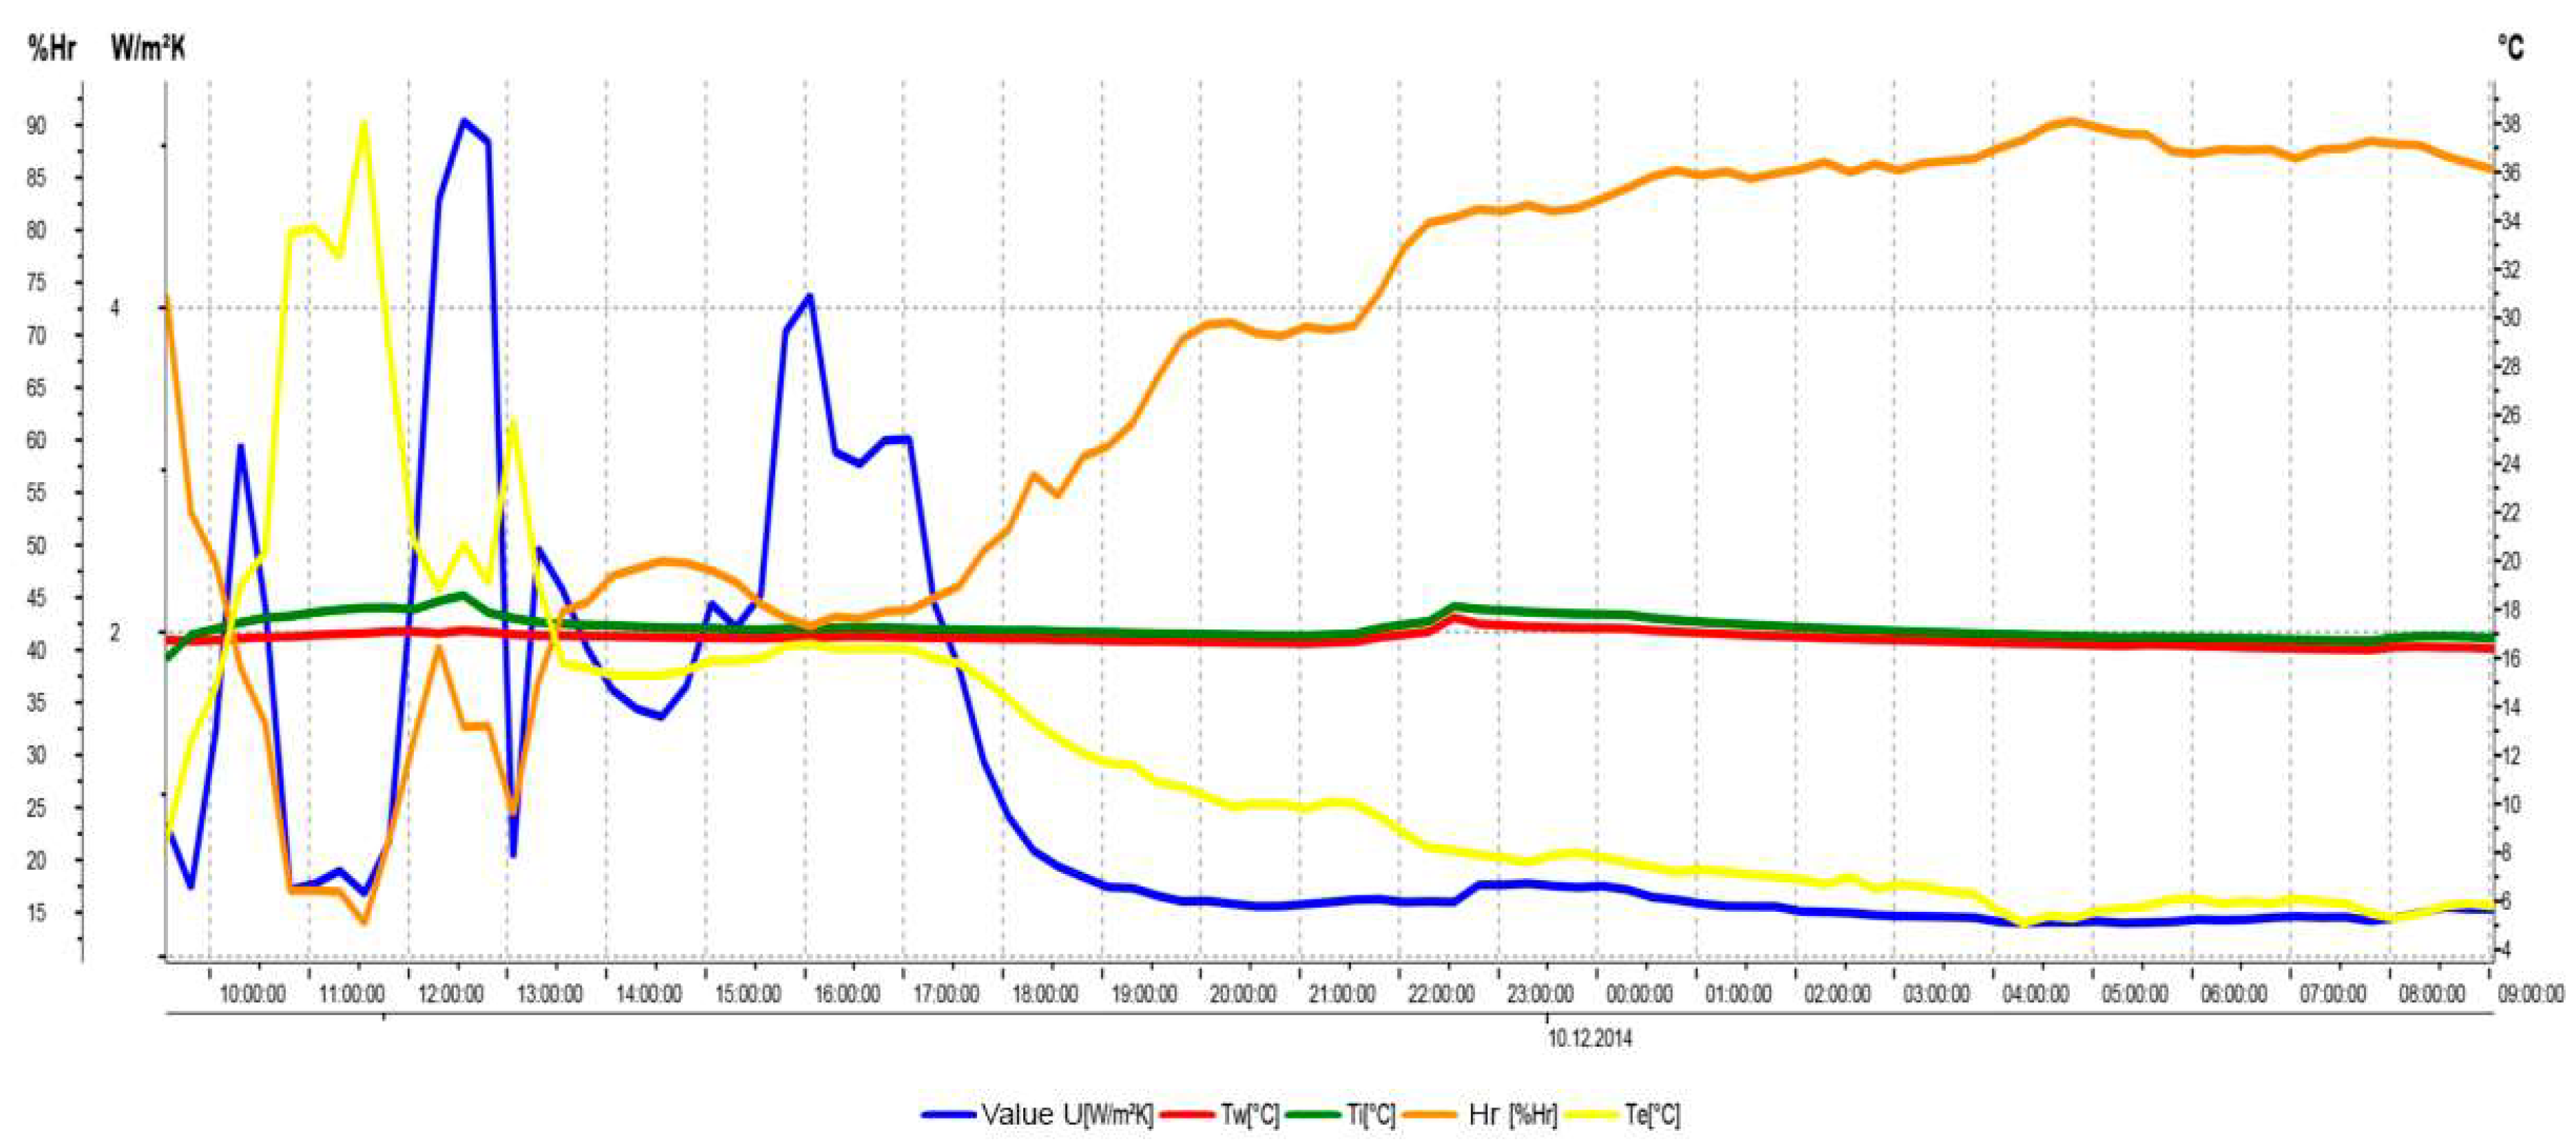
Regarding the LEGE system design,
Figure 16 represents the measures of a temperature probe buried in the ground of the Casa Zaranda plot [
62]. Note that the temperature of the ground tends to remain constant as the depth increases. During the year, the soil temperature at a 4.80 m depth (the necessary excavation to carry out in Casa Zaranda) varies between 18 and 22 °C. This is 2 °C above and below the average annual temperature of the Casa Zaranda location, which is 20 °C. As explained in [
62], if the LEGE facility is located at a depth of approximately 10 m, the soil temperature would be the annual average of the site, that is, 20 °C. Locating the LEGE facility at 4.80 m instead of 10 m as would seem reasonable is solely due to a budget issue. Since the house has a basement, digging up to 4.80 m has not meant an increase in the construction budget.
In the LEGE system (
Figure 12 and
Figure 15), the renewal air is driven from a shed located in the outside garden of the house (which has been built), filtered and passed through a 150 mm circular section PVC-U pipe, and buried at a depth of 4.80 m. It has a length in its stretch of land of 39 m in straight sections plus 13 junctions. As a contribution to the forced circulation of air, a low-profile centrifugal fan attached to the buried pipe has been projected. For budgetary reasons, the extension of underground pipes of the LEGE facility is less than necessary, whereby the heat exchange between the air of the house and the ground does not completely temper the house temperature; however, the design and simulations carried out show that it substantially improved it. This can be seen in detail in
Section 4.5.
Regarding the photovoltaic system, Casa Zaranda has four photovoltaic panels of 250 Wp installed; that is, the total installed power is 1 kWp. This peak power (Wp) can be generated under standard conditions: irradiance = 1000 W/m2; temperature = 25 °C; air mass (measurement of the distance that the solar radiation travels through the atmosphere and that varies according to the angle of incidence) = 1.5. These standard conditions are almost never reached.
Again, as in the case of LEGE system, for budgetary reasons, the total photovoltaic power installed is too low to take the house to ZEB.
Section 4.5 shows the functioning of the photovoltaic system.
Finally, although installed RES cannot lead Casa Zaranda to reach ZEB (the house is suitable to reach this score even to overcome it), undoubtedly its energy efficiency improves.
4.4. Construction Management
When the facilities & systems engineering design step of the uhuMEB methodology (in blue in
Figure 7) is completed and the project certification is obtained, the construction management step follows (in orange). The goal is to build the house according to project specifications. Following the algorithm, items, and data of
Table 1 (third and fifth columns), the work carried out is presented below.
4.4.1. U-Value Test
The measured
Ue in Casa Zaranda was 0.24 W/m
2·K (see
Figure 17), which allowed guaranteeing compliance with the corresponding quantitative indicator in
Table 1. This value has been recently checked and refuted by a new meter developed by the authors of this paper [
66], which is able to measure the flow of energy per unit of surface that passes through an enclosure in a simple, fast, and economic way.
4.4.2. The Envelope Thermography Test
For checking the continuity solutions projected in the thermal envelope, two thermography campaigns were carried out. An example is shown in
Figure 18. The external conditions registered were a 5.4 °C outdoor temperature, a 24.3 °C indoor temperature, and a 67% relative humidity. During the last campaign, no significant thermal bridges were identified. The upper image shows how the exit slot of the blind is a singular point. In the lower image, there is an overlap between the ground floor (living space) and the semi-buried basement (non-habitable space). The difference between the volume of the housing inside and outside the thermal envelope is clearly illustrated.
4.4.3. Envelope Airtightness Test
The standard procedure EN 13829 BDT was followed to check the building envelope airtightness. The first test was not satisfactory, mainly due to multiple air leaks that were in the passage of air conditioning ducts to the roof. They were all sealed. Another problem was the door that gives access to the basement from the indoor covered yard. It was a designed panel integrated in the partition under stairs, which motivated the need to install on-the-spot sealing bands.
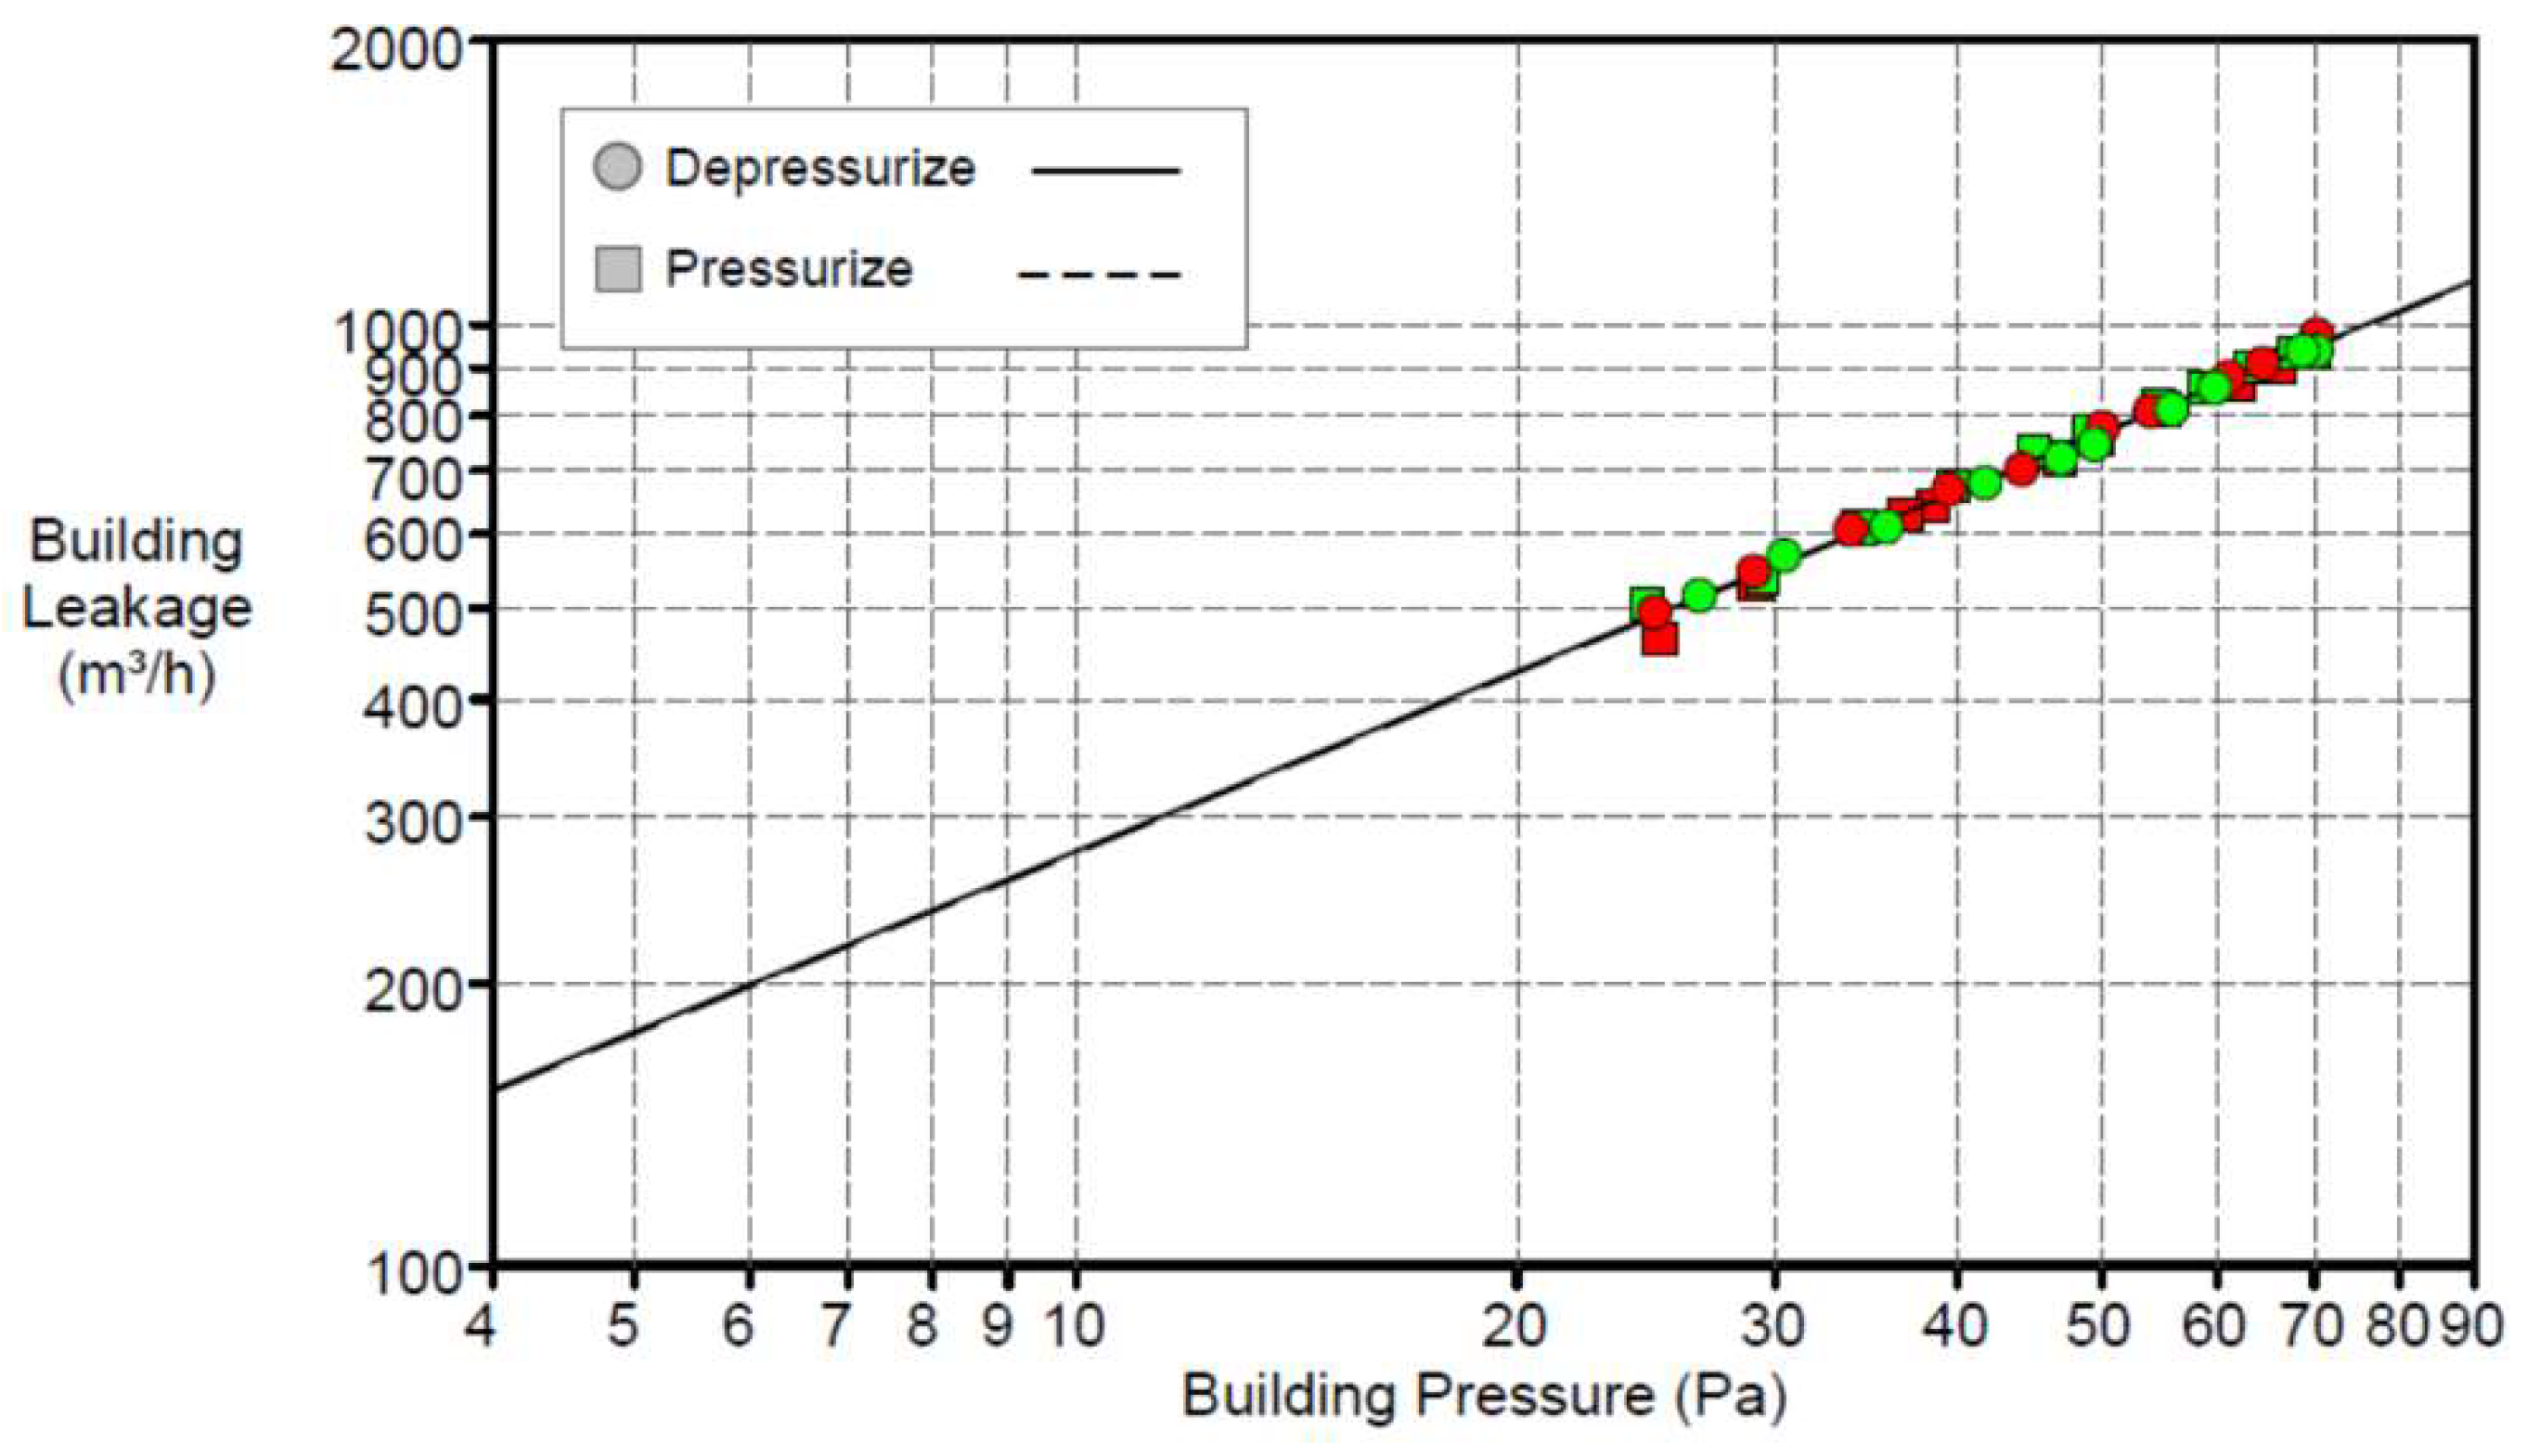
After these operations and other minor ones,
Figure 19 shows the results of the final pressurization and depressurization BDT at Casa Zaranda.
Table 3 displays the main numerical values of the BDT carried out. The result of the test was 0,59 h
−1 in average value, coinciding the depressurization and pressurization values. It is a suitable value, as it is less than 0.60 h
−1, which is the maximum acceptable according to the corresponding MEB requirements in
Table 1.
4.4.4. Facilities & Systems Test
During the construction stage of the building, the construction management (see
Figure 7 and
Table 1) controlled the proper implementation and start-up of all the facilities and systems. There was no interference to highlight between the designed facilities & systems and what was carried out. To end the construction management stage, it was not necessary to make any important modifications to the project, since everything proceeded as foreseen and projected. The as-built certification was approved by the project manager without any technical reservations. With such certification, the house was delivered and inhabited.
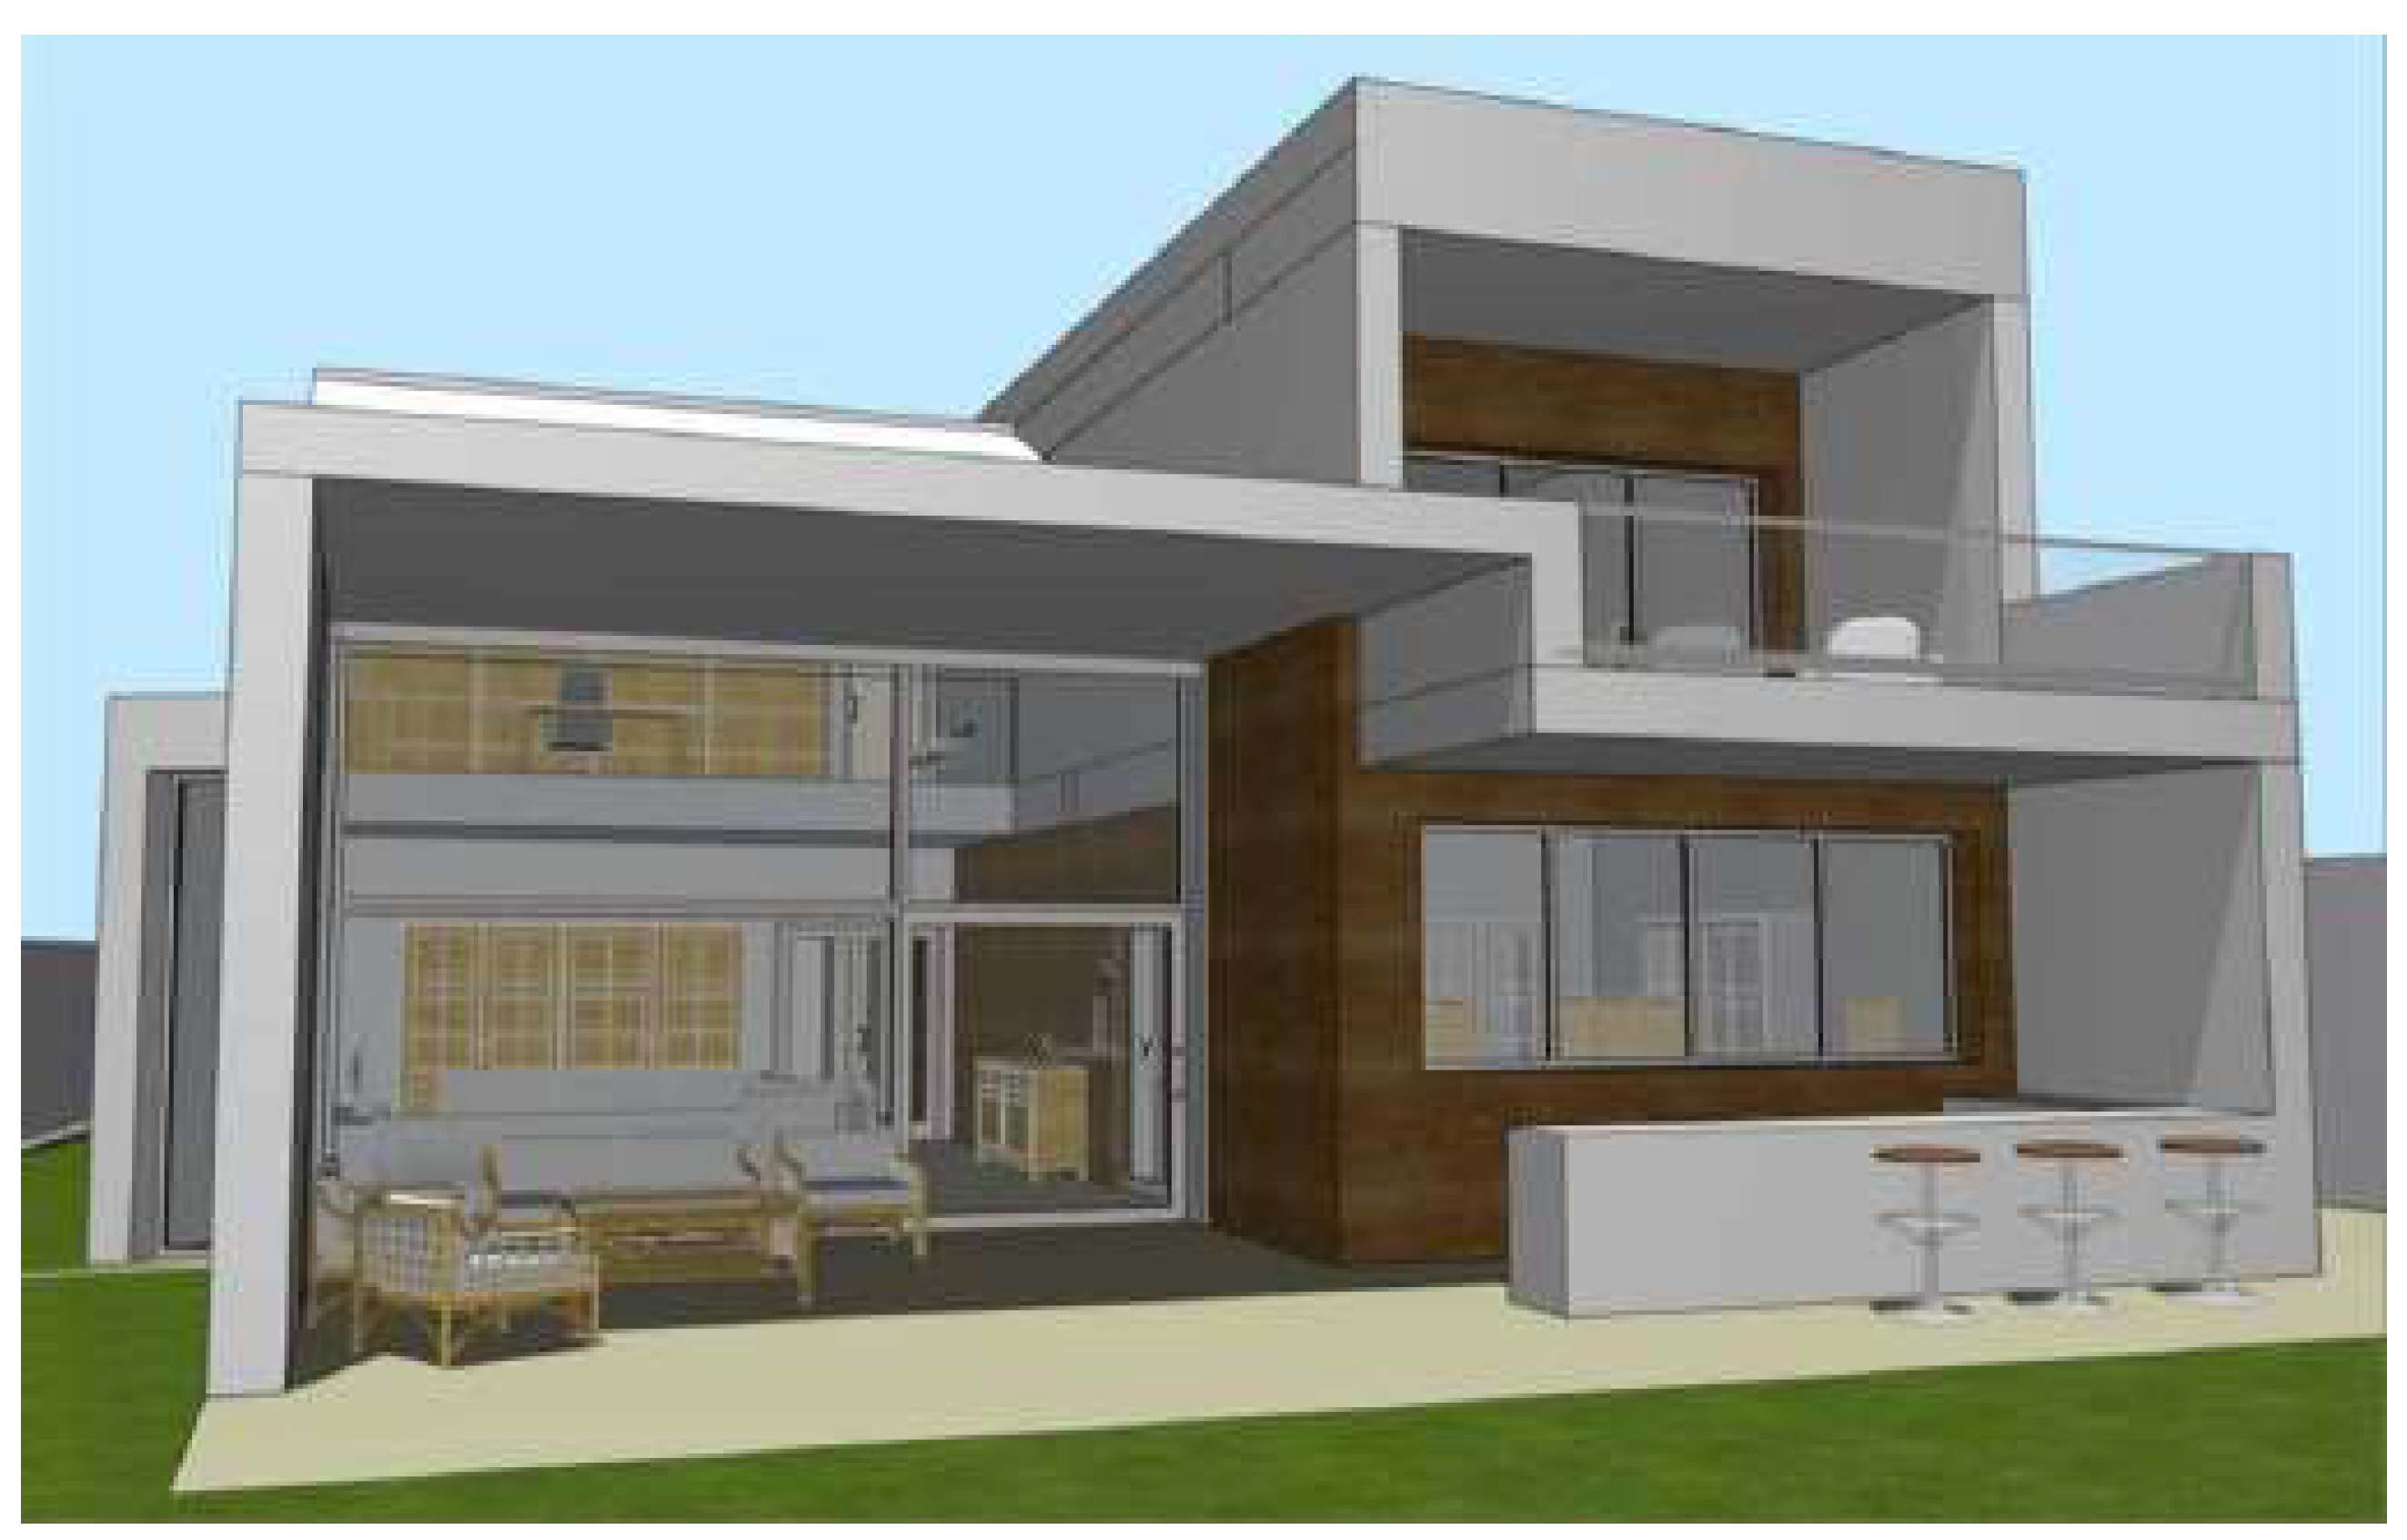
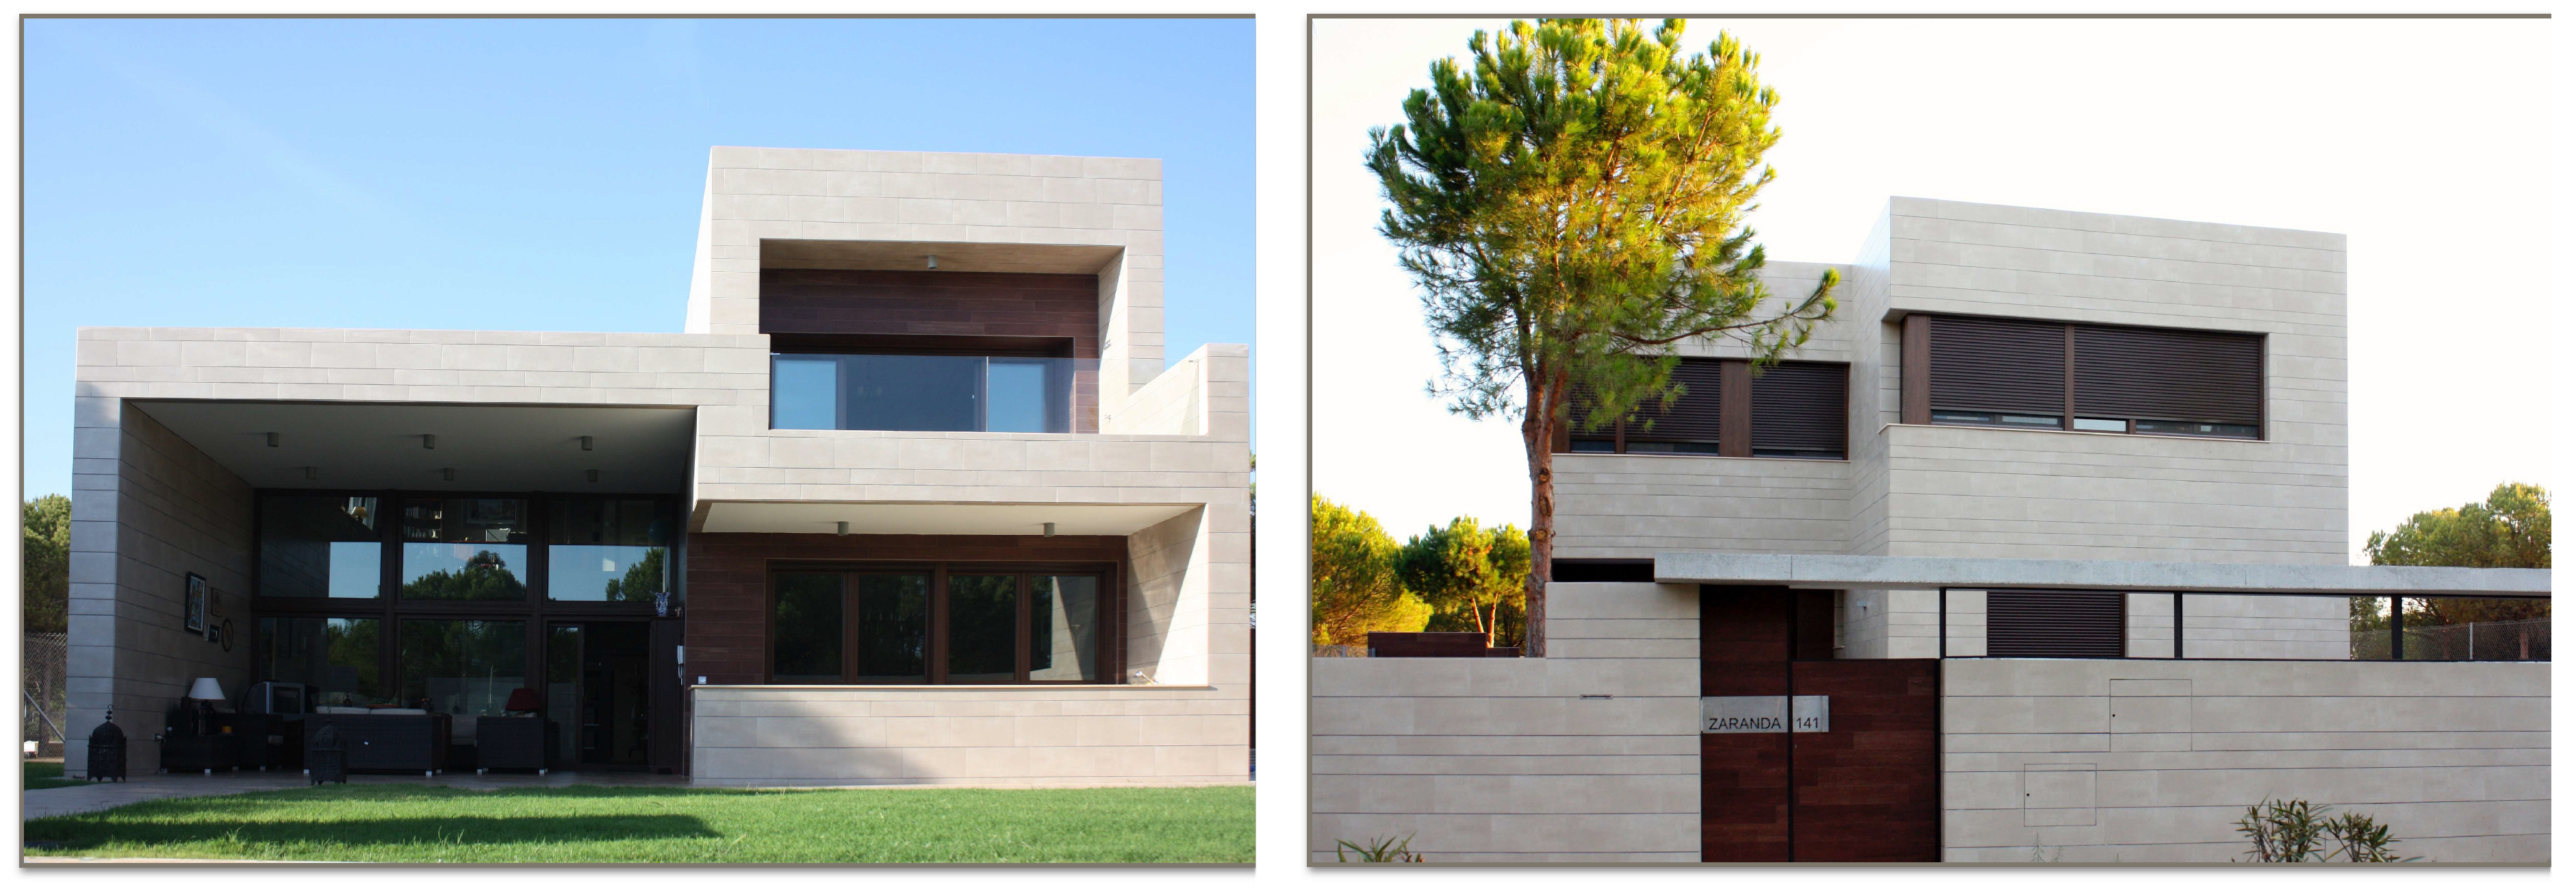
Figure 20 shows the constructed and finished house.
The house had taken advantage of its privileged location, opening large glazed areas to the plot on its south side and protected by large horizontal overhangs. The openings in the west façade were reduced to a minimum to avoid overheating caused by solar radiation in the afternoon.
4.5. Operation Management
This last stage of the proposed methodology (see
Table 1 and
Figure 7) is currently underway. In this case, when it comes to an isolated detached house that does not belong to a housing complex, a specific operation management service is not usually available, so the control and supervision tasks usually fall directly on the homeowners. Though this is not the most desired case, due to the lack of professionalization of the operation management function, it is quite common in this kind of case. Notwithstanding the above, and regarding its energy efficiency, the house has an operation manual, and its owners have been trained for its optimum operation. However, in the specific case of this house, since it serves as support for this research and other, the authors and the research group to which they belong take care of its operation management (see
Figure 7).
4.5.1. Data Analysis
Casa Zaranda has been inhabited for approximately three years now. Thanks to the developed ICS, the behavior of the house (data analysis, see
Figure 7) is being analyzed. To date there is no data worth highlighting, and the result of the operation phase of the building is in accordance with the required annual operation certification (see
Figure 7). Below are some examples of the energy performance of the house, which are in accordance with that projected.
HVAC Systems
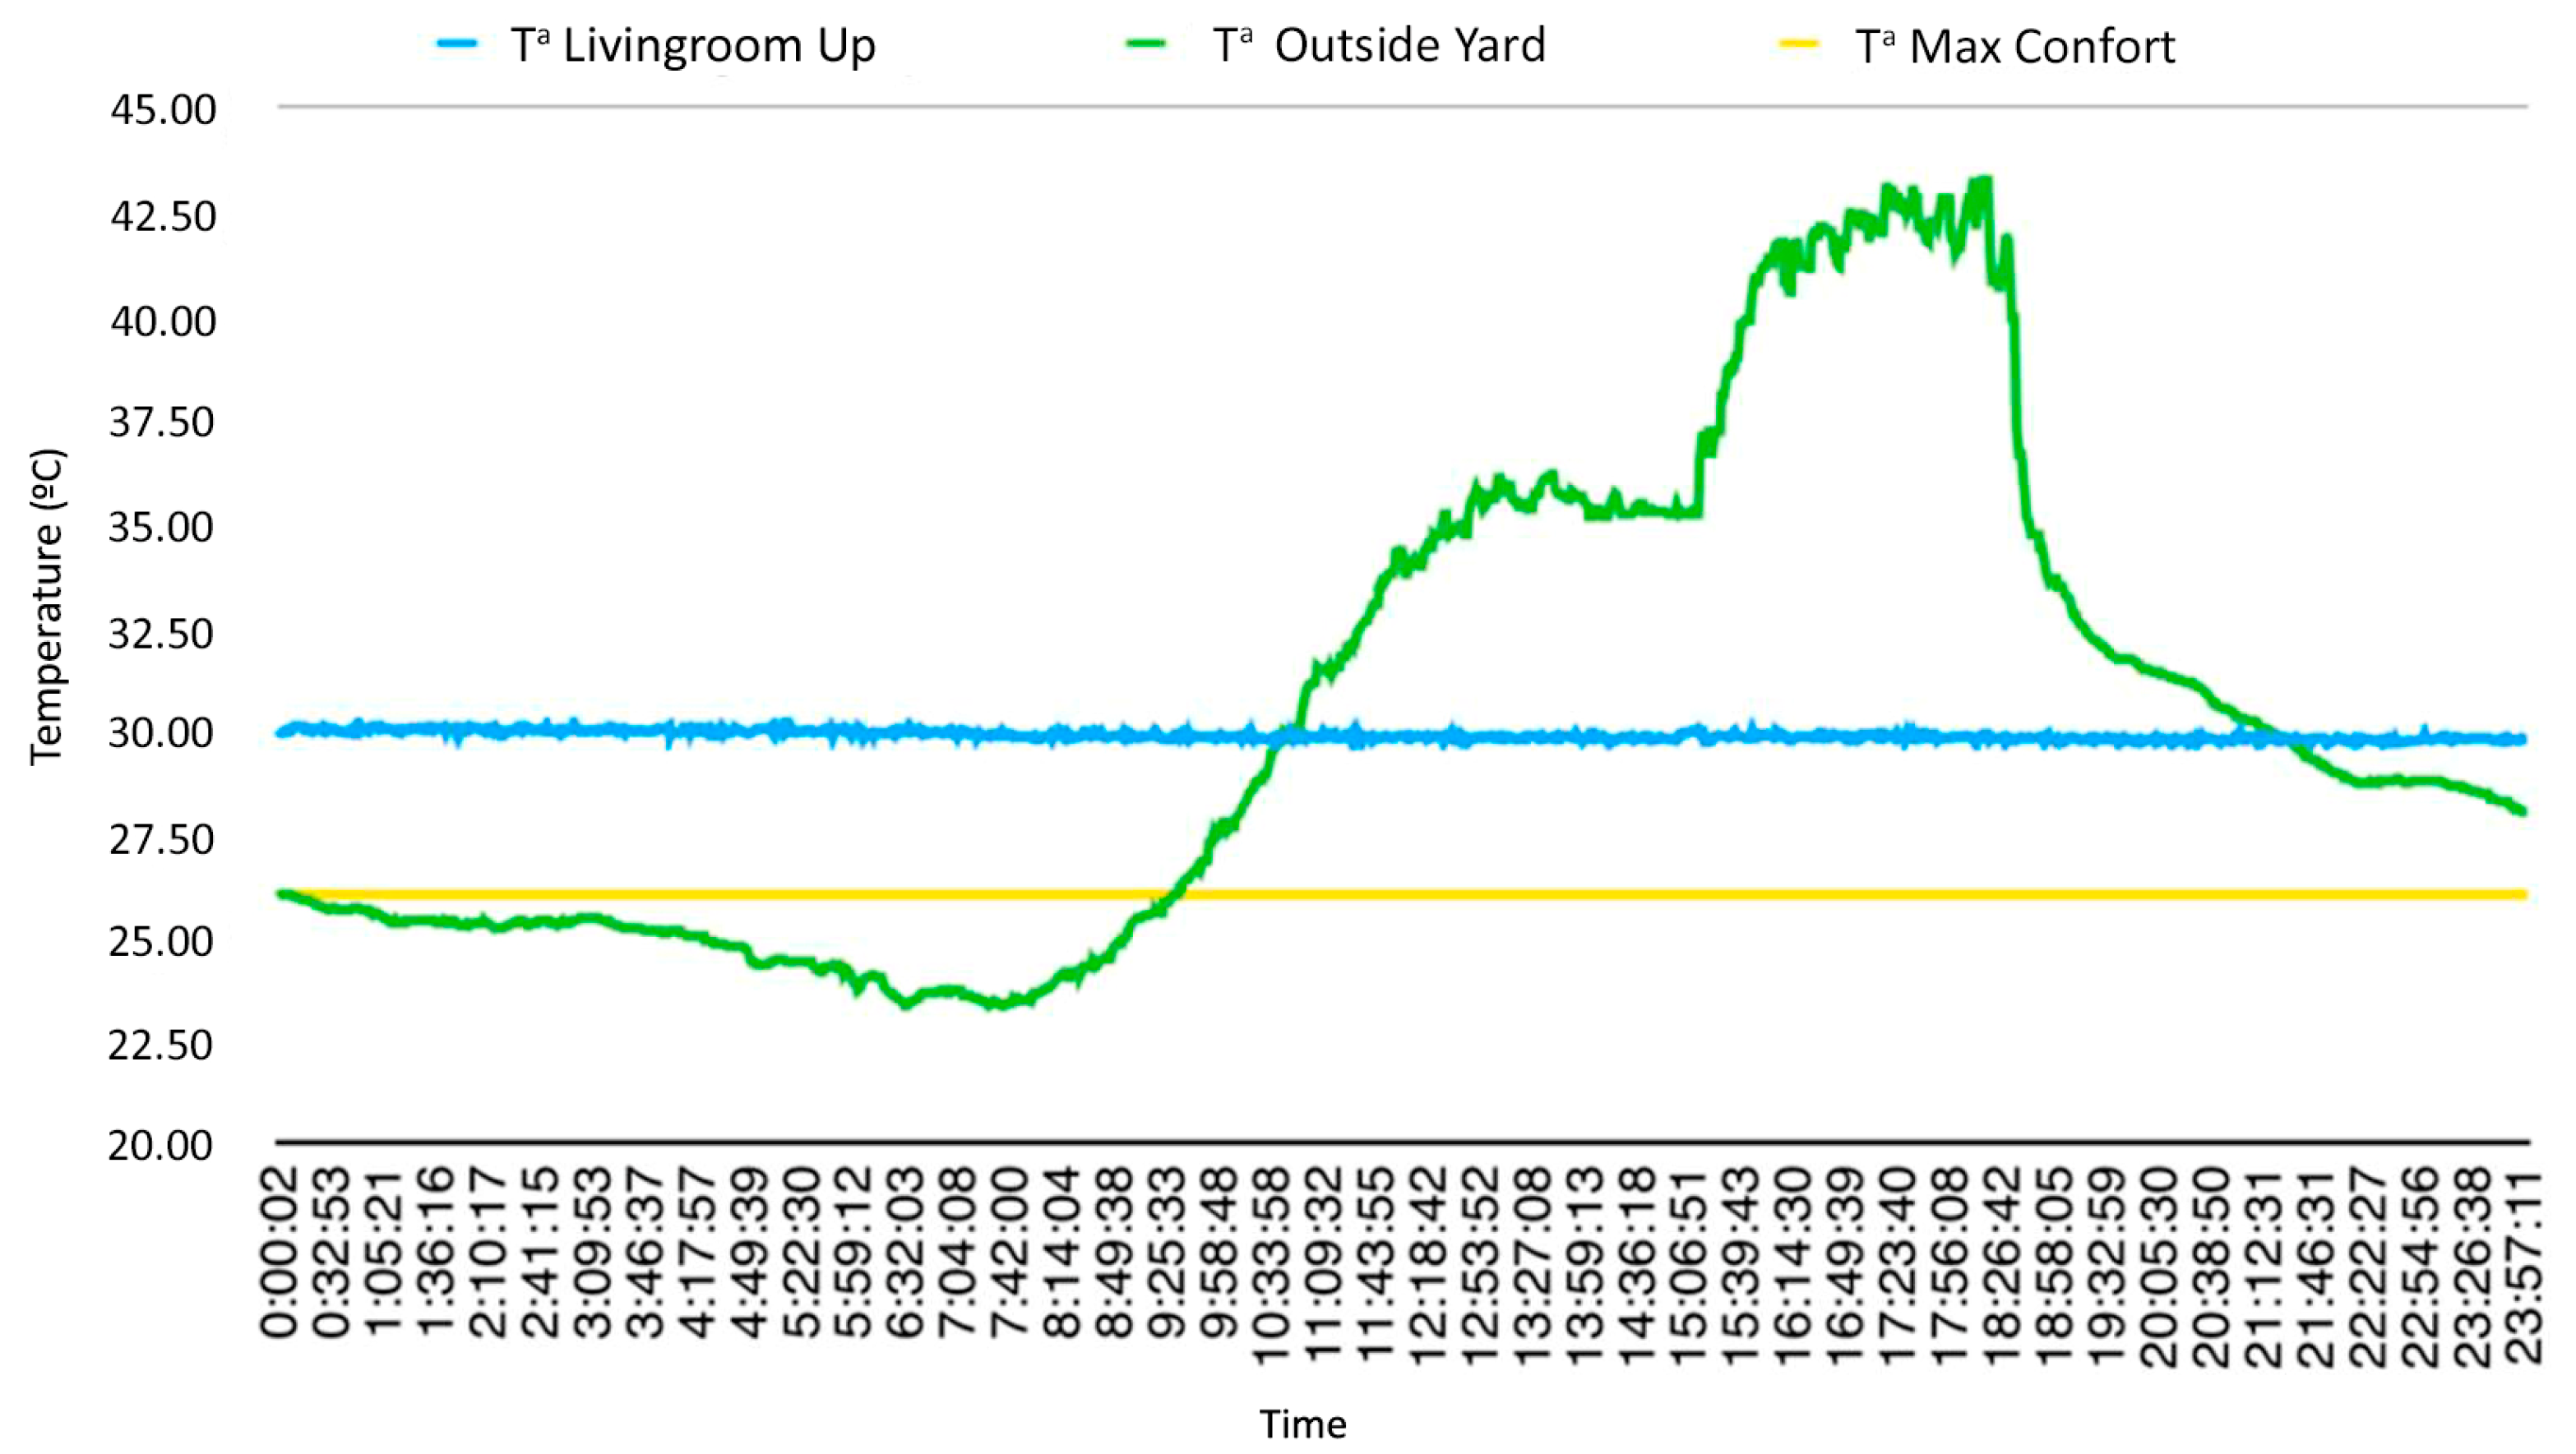
Two different operating conditions have been studied in the practical application of the developed natural ventilation system, which is part of the HVAC system. In the first one (
Figure 21), the motorized window system for skylight and rooms has been disconnected (as has the LEGE system to isolate the effect of the natural ventilation), maintaining the conditions of the sealed building. In the second case (
Figure 22), the motorized window system for skylight and rooms is connected, favoring cross-ventilation inside the house.
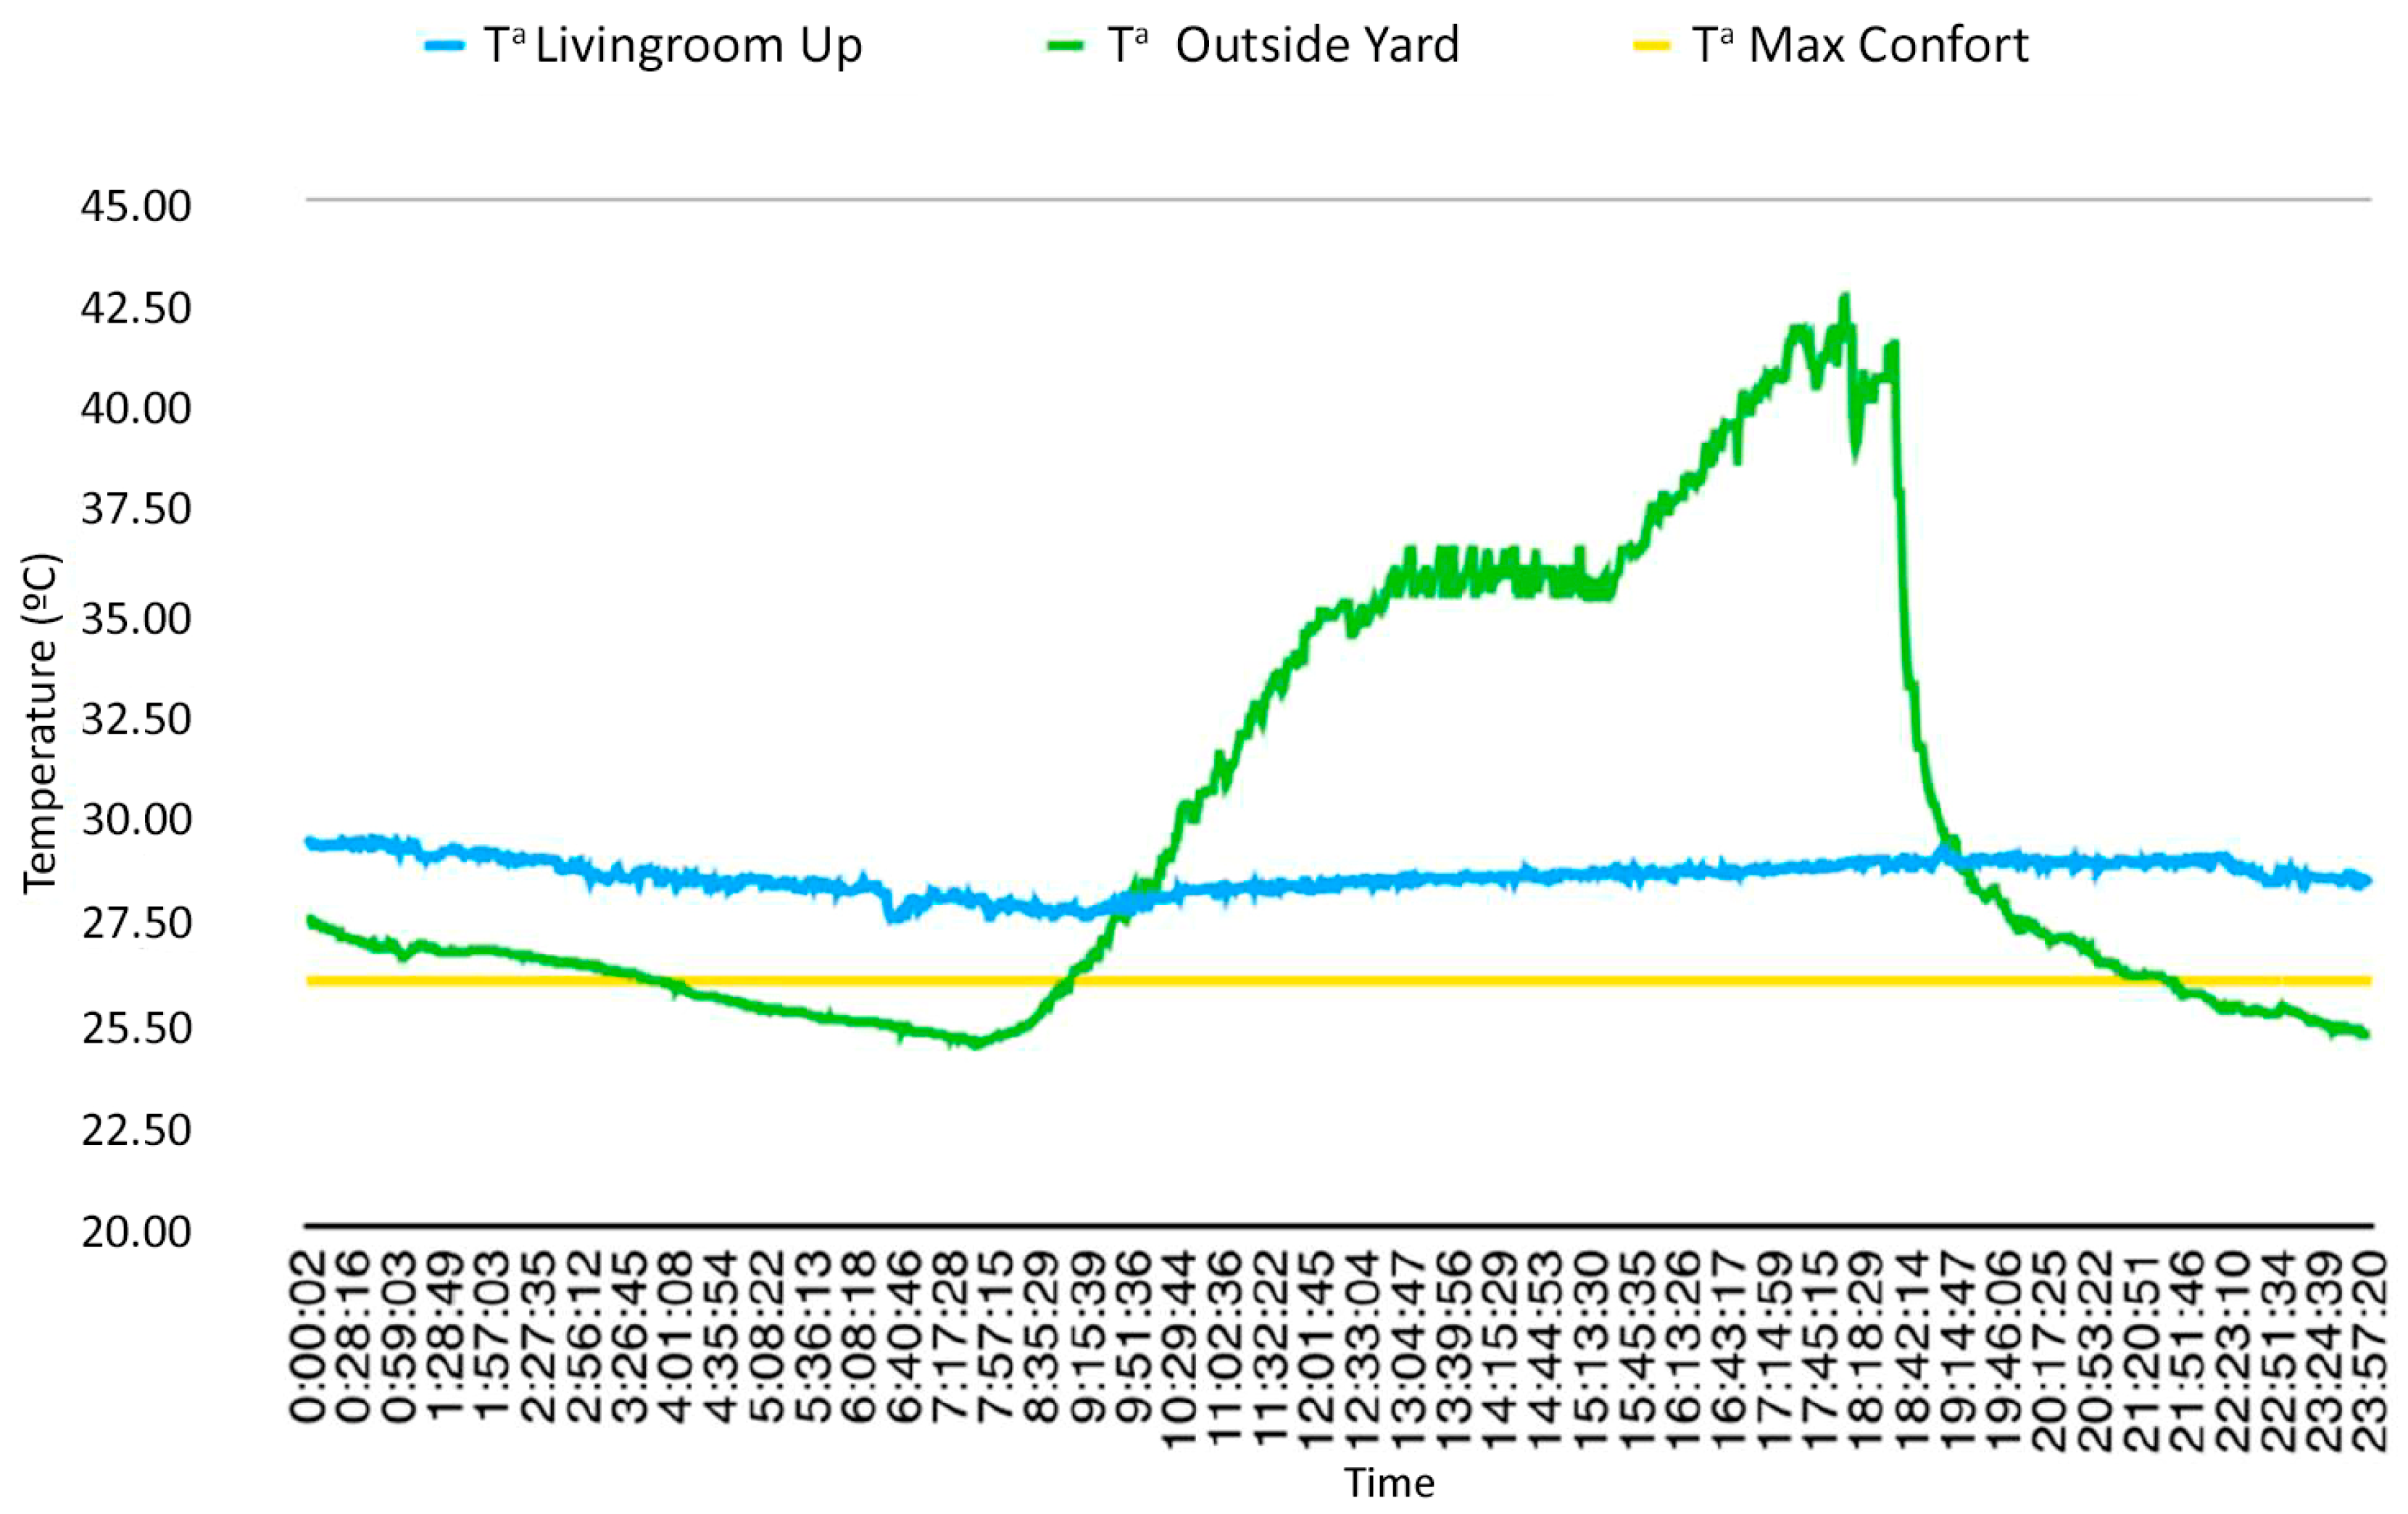
Figure 21 shows the dwelling indoor air temperature change (blue line) and the outdoor one (green line) along a very hot summer day (18 July 2015). The horizontal line at 26 °C (yellow line) indicates a border temperature below which the exchange of indoor air with outdoor air (note that the temperature of the outdoor air -green line- is lower during some hours at dawn) would be suitable to extract from the house the accumulated hot air during the day. This condition of free cooling is fulfilled for this specific day (see
Figure 21) around the time slot from 12:00 to 9:30 a.m. However, as the motorized window system for skylight and rooms is disconnected, the indoor air temperature of the dwelling remains virtually constant around 30 °C (overheating) because of its inability to dissipate the thermal load of the day.
Figure 22 (10 July 2015) shows the behavior of the motorized window system operating for skylight and rooms. For a pattern of external thermal variation even worse than that shown in
Figure 21, the indoor air temperature of the house is significantly reduced thanks to the free refreshing night. The free refreshing time slot in this case is different, and it extends to beyond dawn, around from 4:00 to 9:00 a.m., and at night, from 9:30 p.m.
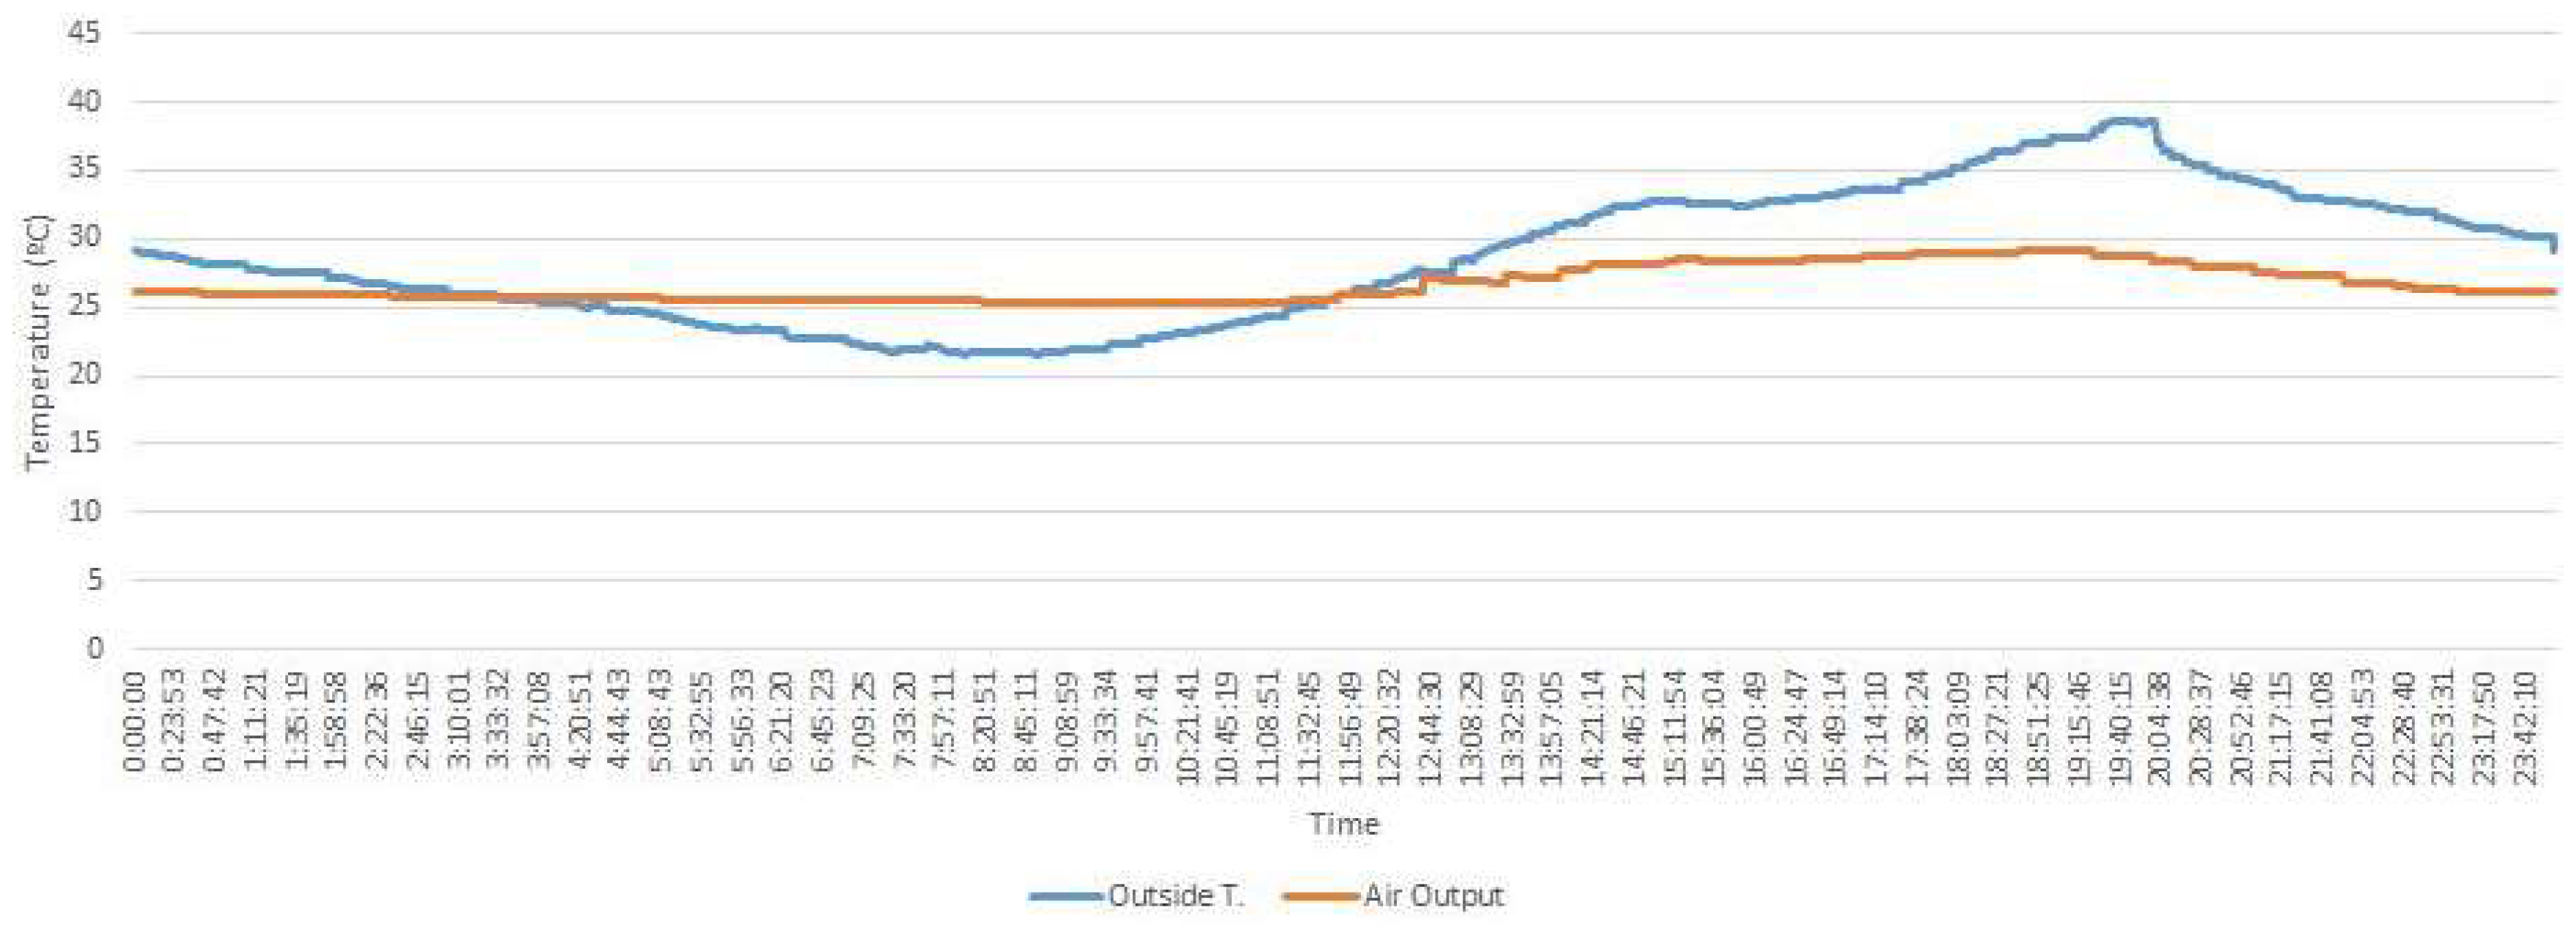
As for the LEGE system,
Figure 23 shows, with the blue line, the outside temperature on a summer day (4 August 4 2015). Throughout the day, there is a thermal jump on the outside of the house of 17 °C, from 22 to 39 °C. With the ocher line, the behavior of the temperature of the air leaving the LEGE facility, after the heat is exchanged with the ground, is shown. Note that the thermal jump is reduced to 3 °C, between 26 and 29 °C.
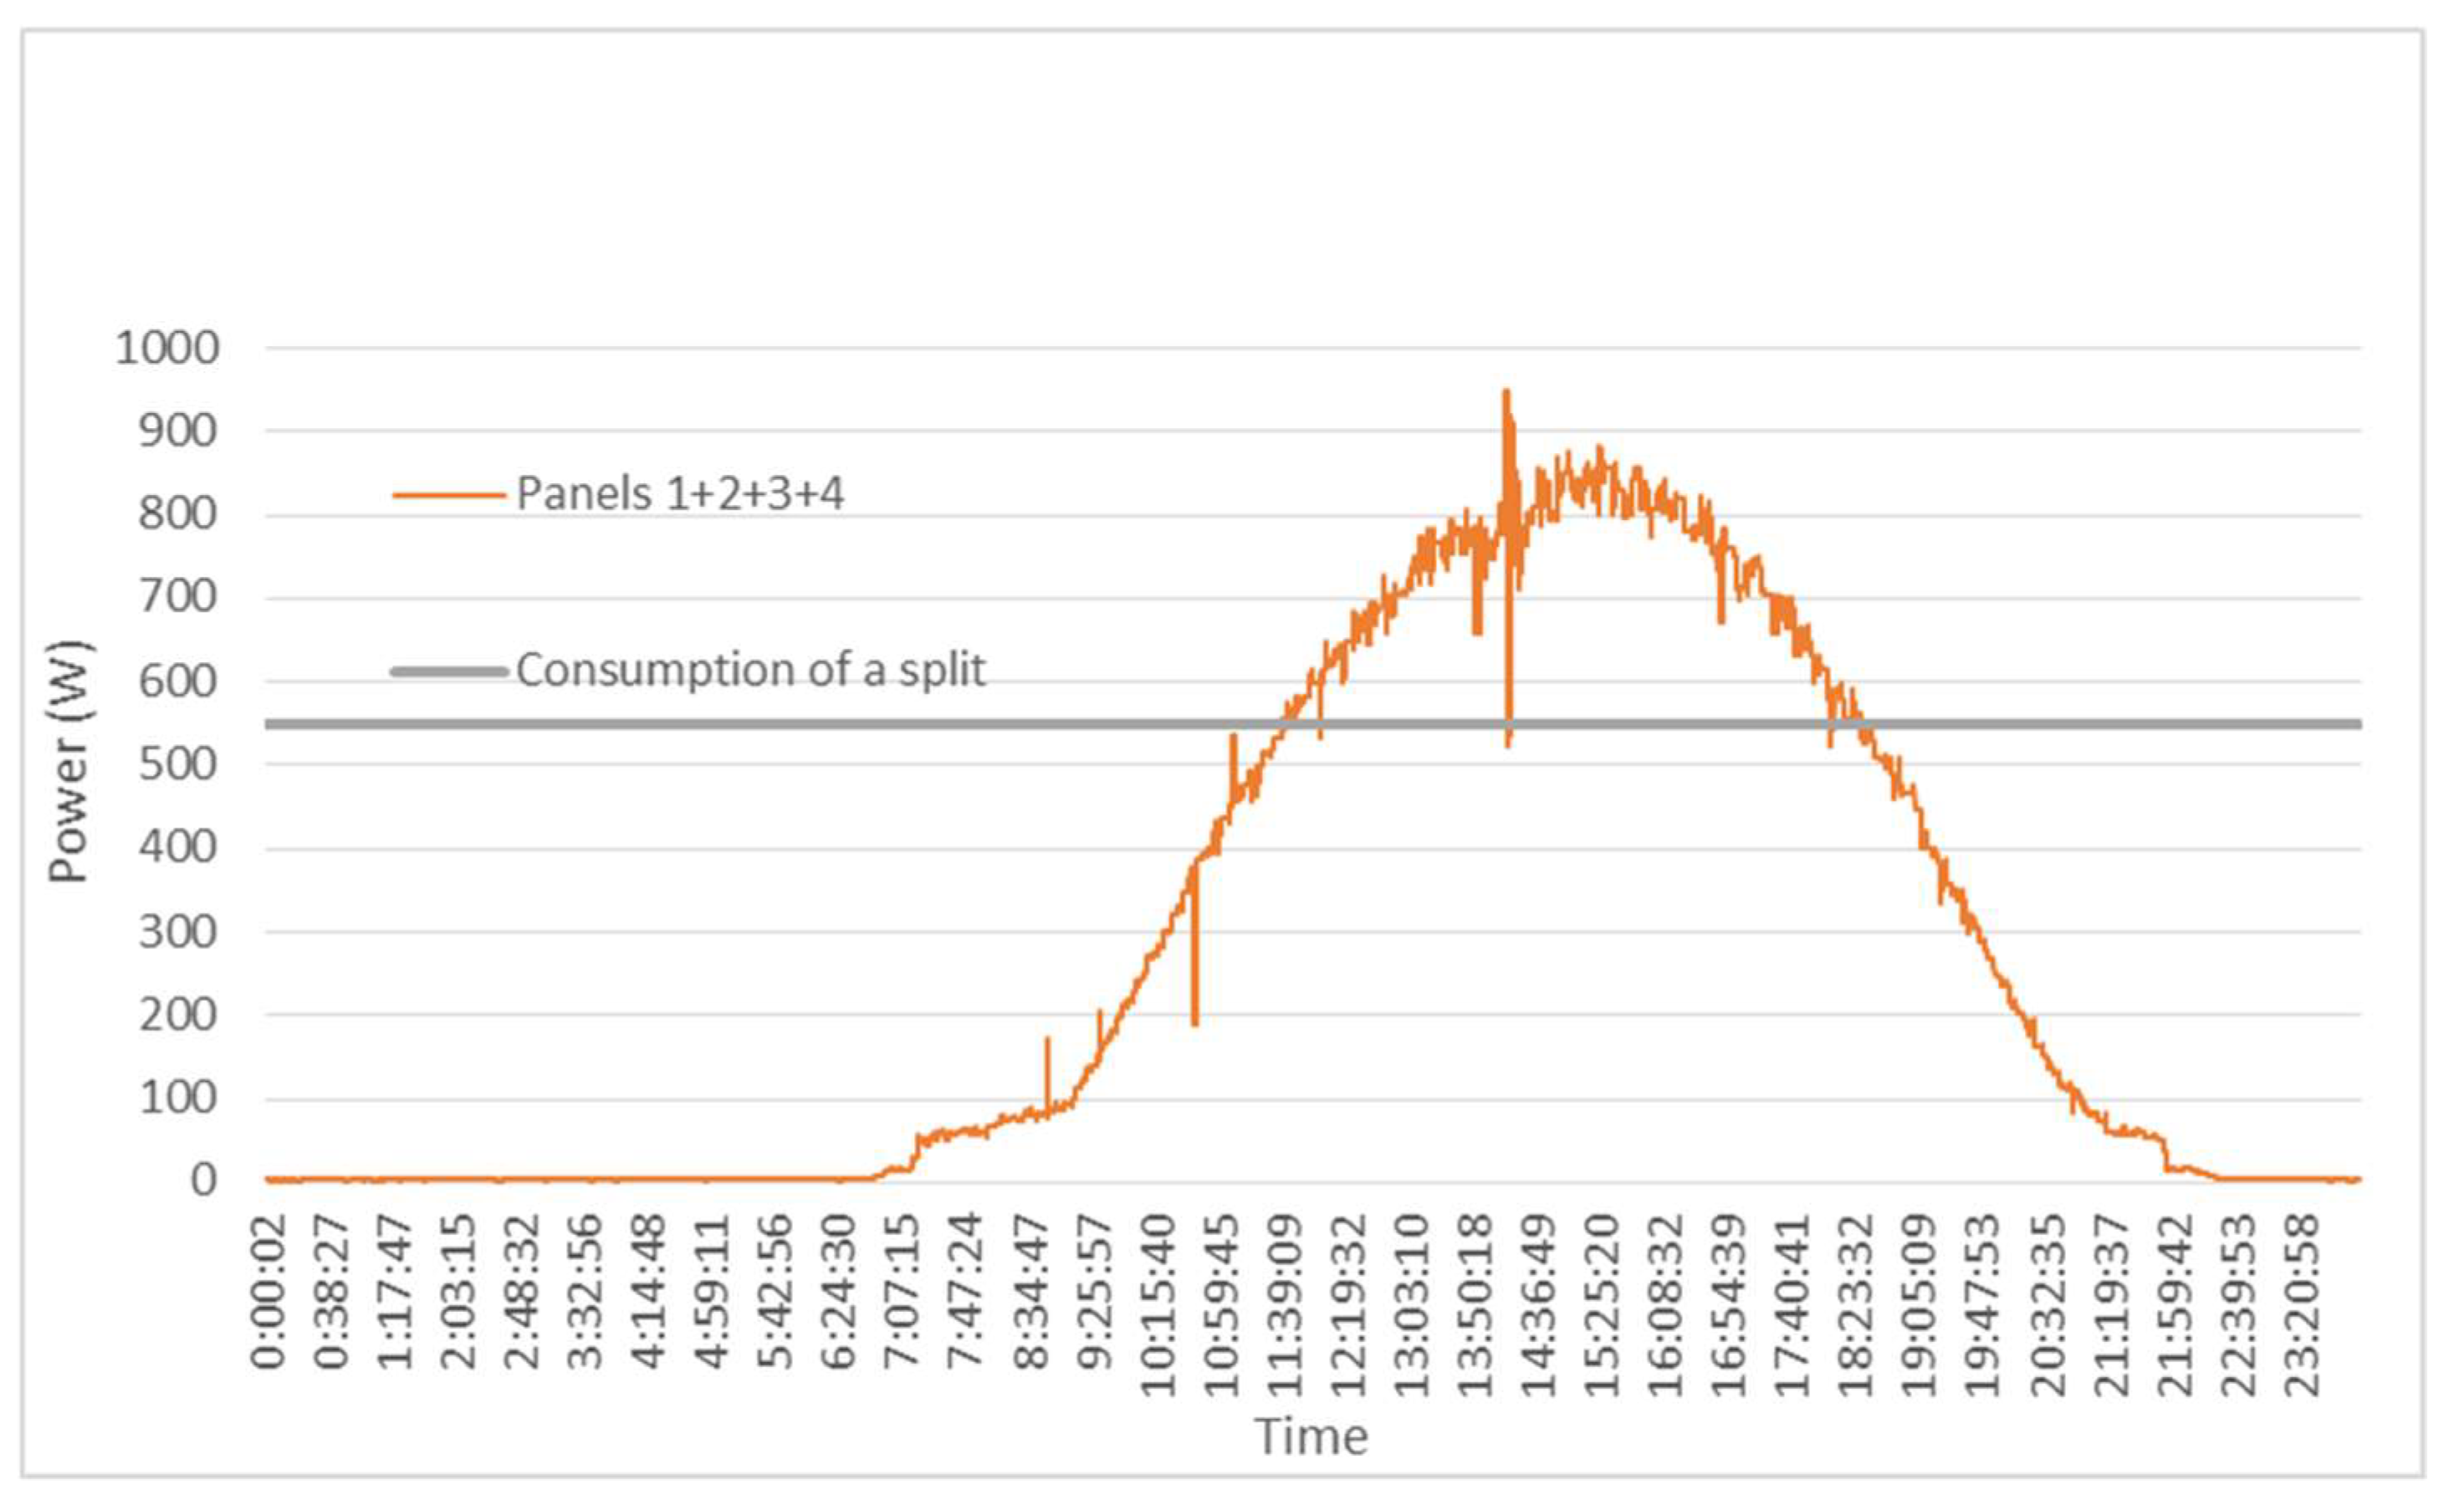
Renewable Electric Energy Production
Figure 24 shows the electric production curve of the photovoltaic facility (the ocher line) on 10 July 2015. Since it is a summer month, air conditioning in the home is active. The gray line represents the value of 575 W, corresponding to the approximate consumption of one of the split-type air conditioning units assembled as part of the HVAC system. Note that, in the hours of more solar radiation (when cooling is required), the small photovoltaic facility can amply cover the energy consumption of a split.
4.5.2. Maintenance
The maintenance of the building, see
Figure 7, is carried out periodically (following the programming maintenance) and according to its operation book. Due to the youth of the building, corrective maintenance has been practically non-existent. Preventive maintenance is carried out with a tool still under development. However, this is not the subject of this paper. As demonstrated in
Section 4.5.1, the data analysis offered by the ICS provides valuable information on the actual functioning of the building.
To date and after each monthly verification, the building has obtained three annual operating certifications (see
Figure 7).
4.5.3. Energy Retrofitting
From the analysis of the results obtained to date, it can be deduced that for the moment there is no need for any energy rehabilitation action for the dwelling—neither in its envelope nor in its facilities and systems. This is completely normal, since it is a very recently constructed house and was erected fulfilling the MEB requirements.
5. Discussion
Following the results obtained in the experimental case of Casa Zaranda that have been exposed in the previous section, the proposed uhuMEB methodology summarized in
Figure 6 and
Figure 7 and
Table 1 is discussed below.
Starting for the customer negotiation phase (
Figure 6), it is not easy to convince a customer to fit his/her home to the uhuMEB requirements unless he/she has the idea of residing in an efficient building. The customer almost immediately tends to believe that many controls can slow the project, generate cost overruns, and complicate the construction.
That is why it is so important that countries clearly define the compulsory characteristics that an nZEB building must have (it is predictable that the final mandatory norm will be more lenient than the ones reflected in the MEB requirements of
Table 1), since the duty to comply with the norm will bring the customer closer to convincing him/herself to go one step further, to even consider, following the uhuMEB methodology, to reach ZEB or +ZEB ratings.
The argument to involve the customer in the energy efficiency of his/her building not only is a matter of cost savings by consuming less energy but also raises awareness of a global problem, namely the reduction of GHG emissions, responsible for the global warming of our planet, which the customer can help to solve without increasing building costs.
With respect to what is already the technical phase of the uhuMEB methodology and starting with the architectural design (
Figure 6 and
Figure 7), except for transferable exceptions from one building to another, each building requires a different study to reach MEB requirements. Moreover, these can be reached from different paths. Choosing the most suitable one depends on the technical team that is working on the project. In the specific case of Casa Zaranda, the solar protection of the south facade achieved the objective of avoiding the entry of direct solar radiation in the warm period of the year. However, in this case, the goal went further. Being a house on an isolated plot, the design of the main overhang on the living room was modified by increasing its length, so that the attached outdoor terrace would be equally protected, encouraging its use as an extension of the interior living space (see
Figure 18 below). In this case, having a large concrete overhang and the elimination of thermal bridges in the envelope remarkably increased the impact of the insulation material in the house. To maximally reduce its economic impact, the entire area below the ground level was removed from the thermal envelope because it is a space for a garage and for storage (see
Figure 18 below). However, the beneficial effects of being half-buried compensated this solution, resulting in spaces that function as a thermal mattress on the ground floor of the house.
The aesthetic conditioning imposed by the customer regarding the ceramic material for the completion of the façade led to modifications of the final constructive solution of the external envelope. The solution to incorporate the insulation material in the enclosure chamber made it difficult to avoid thermal bridges.
The urban regulations related to separation for lateral boundaries (minimum 3 m) has greatly conditioned the form factor of the house. The decision to protect the yard with a motorized skylight windows improved the compactness of the house because it enclosed more air volume with less external envelope surface.
The interaction between architectural design and facility engineering (
Figure 7) is an increasingly pressing need. Buildings require more facilities and systems, but the available space is limited. Therefore, engineers and architects must work together to find the best solution in each case. There is always some space that can be used, but this implies that the architectural design must go hand in hand with the facilities & systems engineering design. In the case of Casa Zaranda, for example, the most suitable ventilation system was extensively discussed. Precisely owing to the interaction engineering and architecture, a solution was found that combined natural ventilation with the HVAC system functioning together. Even the HVAC system was boosted by the LEGE system, which guarantees the continuous supply of renewed air with a comfortable temperature throughout the year, which consisted of a simple low-cost system whose energy consumption is very low. Although the installed facility does not fully cover the needs for maximum comfort (
Figure 23), the necessary contribution of the electrical heating/cooling system to achieve it is minimal. Of course, it is not always possible to install a LEGE system in dwellings simply because the system needs space. However, there are other geothermal solutions that can be considered. One of them is the use of medium energy geothermal enthalpy by means of wells at depths greater than 100 m. In extreme cases where space is a major problem, as in the case of an apartment building, aerothermal energy is a solution. Nowadays, there is compact equipment on the market that can be housed in a terrace, balcony, inner patio, etc.
With respect to the construction management stage and following the order in
Figure 7, the first test is the thermal transmittance. It is relatively easy in new construction to guarantee the projected U-Value. The reason for this is that all the elements that make up its envelope, from the wall to the carpentry, are known. Therefore, if the proper construction procedure has been observed, the results should only corroborate the expected, which has been the case of Casa Zaranda. A very different situation is when energy rehabilitation is carried out, where most of the time, except if invasive (and in some cases destructive) tests are carried out, it is very difficult or practically impossible to know beforehand the U-Value of the building envelope. Consequently, measurements must be taken before and after the rehabilitation in order to reliably know the improvement of the transmittance due to the isolation actions carried out.
An important issue that is worth highlighting is that, in the construction of a building with strict energy efficiency requirements, as is the case of the MEB proposed in this work, the need for attention and control by construction management is much greater than in a building without specific energy efficiency requirements. In Casa Zaranda, the thermographic campaigns conducted were used to verify the correct installation of the insulation in the thermal envelope. The first of these was one at a very early phase of the work, which was to warn operators of the effective control needed and the importance of their work. Only the final thermographic campaign (
Figure 18) carried out under sealed conditions and with an interior-exterior temperature gradient greater than 10 °C took suitable measurements on the continuity of the thermal envelope. This figure shows that the basement of the house is outside the thermal envelope. The change in color of the image reveals a much warmer surface of the outer enclosure, which is a consequence of the thermal mattress effect caused by the buried basement.
Continuing with the importance of carrying out a professional construction, any error with a seal, for example, can ruin the required sealing of the building. In fact, the tightness test can detect bad seals, but it will not always be easy and cheap to solve them afterwards. In the case of Casa Zaranda, it was easy and cheap because of its particular characteristics: an isolated single-family housing. Therefore, it is always better and much cheaper to carefully monitor the construction from the start to avoid mistakes than to have to correct such mistakes later on.
Regarding the facilities and systems (see
Figure 7), it is important that, as was the case in the project, the architecture and engineering works go hand in hand during the construction stage. Normally, masonry and facilities are carried out by workers with different training levels and fields. Therefore, again, the work of coordination and control of construction management is important. The necessary tests to be carried out will provide data that is analogous or very close to those expected, which will prevent having to return to the drawing board, which slows down construction and increases costs.
The ICS integrated or not in the building automation system is important in the operation phase of the building, because it the only way to check whether the building′s energy efficiency complies or not with the built certification. This has been the case with Casa Zaranda to check its correct functioning as an MEB. Thus,
Figure 23 shows that the heat exchange between the air ventilation of the house and the soil prior to its introduction into the dwelling is favorable for warm weather conditions. Its performance was excellent even in the worst case, during the hottest hours of the day. Although the temperature of the air entering in the house ranged between 26 and 29 °C, the tempering could have improved if the facility had been suitably dimensioned. In fact, as
Figure 18 indicates, this tempering could be reached around 20 °C all year. In any case, the LEGE system that was installed remarkably tempered the indoor air of the house, such that, with very little contribution of the heating/cooling system, excellent indoor temperature comfort could be reached. Furthermore, the tempering effect could have been reinforced by night cross-ventilation (see
Figure 4) when the outside air temperature is lower than that of the air introduced into the house by the LEGE system. Finally, regarding the LEGE system, it is important to highlight the need to install air filters and drain the inside of the buried pipe to release the water that accumulates inside due to condensation.
Regarding the DHW, if the needs are covered with the RES in the winter, there is a surplus of heat (energy) most of the year in these latitudes. In Casa Zaranda, the surplus of energy has been used to heat the pool. However, it could have other uses such as solar cold, for example, which generates cold from heat.
As far as the renewable electric energy production is concerned, the facility of Casa Zaranda is very small even without a storage system, but interesting conclusions can be drawn.
Figure 23 shows that, during hours of solar radiation (when cooling is required), the small photovoltaic facility sufficiently covers the energy needed for air conditioning. This small and simple example shows how feasible it would be to take this house to an MEB classification type ZEB or even +ZEB. It would be enough to take advantage of the enormous amount of housing area covered and provide it with an accumulation system (through batteries, for example) so that, both in the winter and in the summer, there is enough renewable electric energy to meet the demand of the house 24 h/day all year.
6. Conclusions
In this work, the concept of a minimum energy building (MEB) proposed by the authors has been explored. This concept suggests putting into practice, through a proposed methodology (referred to as uhuMEB), European Directive 2018/844/EU, which establishes the qualitative requirements for an nZEB building. However, the authors go beyond this by developing a methodology that supports the design and construction of MEB buildings in subtropical climate.
The methodology estates the consumptions in terms of kWh/m2 year, already from the building design stage, which allows easily calculating the total energy needs (kWh/year) of any building (simply multiplying by its m2 of surface). Regarding generators, taking into account the wind average speed in the building site, the production of a wind-power generator can be given in kWh/year per kW installed; similarly, taking into account the average radiation in the building site, the production of a photovoltaic generator can be given in kWh/year per kWp installed, and so on for all generators. We then have an energy balance in kWh/year (consumption in one side and production in the other), which allows one to immediately calculate the energy behavior of the building (nZEB, ZEB, or +ZEB). It is important to note that this analysis should not be done in terms of power, since it changes instantly.
One remaining aspect to reflect upon consists in trying to go further in the search for environmental sustainability. It appears to be possible for buildings to have electric car charging points and still be ZEB or +ZEB.


