1. Introduction
With the increasingly serious environmental pollution, solar energy, a kind of green energy, has been widely using because of its inexhaustible and environmentally friendly advantages [
1,
2]. However, when the PV array of a PV system is completely or partially shielded by passing clouds, adjacent buildings and towering trees, the output power of the system is reduced because of receiving non-uniform irradiation and temperature. Hence, in order to enhance the conversion efficiency of the PV system, MPPT technologies have been employed [
3,
4,
5].
As seen in the literature, various techniques have been put forward to track maximum power and these methods can be categorized into (a) traditional algorithms; (b) artificial intelligence algorithms; (c) swarm optimization algorithms. Traditional algorithms involve perturb & observe (P&O) [
6], incremental conductance (INC) [
7], hill climbing (HC) [
8] and so on. A common feature of these methods is that oscillations occur in the vicinity of the MPP, which results in harvesting lower average power values. Further, it is noteworthy to mention that the traditional tracking algorithms are only suitable for the uniform irradiation conditions of absence shading. Under non-uniform irradiation, the P-V output characteristic of the PV array exhibits multiple peaks. Utilizing these algorithms means failing to select the global maximum peak among the multiple peaks.
Artificial intelligence algorithms for MPPT implementation contain fuzzy logic controller (FLC) [
9,
10], artificial neural network (ANN) [
11] and neural-fuzzy (NF) [
12]. These methods are capable of settling to the global maximum for a PV system under non-uniform irradiation and temperature conditions. However, FLC method demands to establish a complete fuzzy rule table and ANN method requires to train parallel grids in neural network models, and NF method must accurately build a neural-fuzzy model. Therefore, these algorithms need to consume longer computation time and larger memory size in the process of MPPT.
In recent years, swarm optimized algorithms have successfully attracted the attention of scholars. The swarm optimized algorithms include commonly genetic algorithm (GA) [
13], particle swarm optimization (PSO) [
14,
15], cuckoo search (CS) [
16], and firefly algorithm (FA) [
17]. These methods can successfully implement MPPT for the PV array under uneven irradiation and temperature conditions. But GA method has a complicated computation process and requires many parameters such as mutation, selection of chromosome and crossover rate. PSO method involves multiple parameters adjusted, and the particles update speed are too fast to make the particles retaining loss diversity. CS and FA method possess ideal tracking effect and fast convergence speed, but they lack randomness after reaching the MPP region. However, it is also extremely common to integrate traditional algorithms with swarm optimization algorithms to extract the MPP under partial shading. For instance, PSO blends with P&O [
18] and GA integrates with P&O [
19]. Although these algorithms provide the randomness required in the optimization process, the two-stage optimizing designs increase the complexity of MPPT.
Based on the above description, the flower pollination algorithm (FPA) [
20,
21] stands out because it creates requisite randomness of control variables and is provided with dual optimization mode (global and local pollination). In [
22], FPA takes its advantages to the superlative for completing global maximum power point tracking under changing irradiation conditions. However, the effect of temperature change for MPPT realization of the PV system are not considered, and the tracking speed can be further improved.
In the literature, a modified flower pollination algorithm (MFPA) is proposed to extract the global maximum power point for the PV system under inhomogeneous irradiation and temperature conditions. The key factors that the proposed method can commendably use to realize MPPT are as follows: (i) creation sufficient randomness for control variable in the process of dual-mode optimization; (ii) conversion between dual-mode optimization are affected by both switch probability and population fitness values. The related algorithm overcomes the faults that the flower pollination algorithm (FPA) falls easily into the local maximum and the convergence speed is slow in the later stage. The MFPA for MPPT passes through dual-mode optimization process to update the control variable (duty cycle) of DC/DC converter for the PV system. The performance of MFPA is verified by comparing with the P&O and FPA method. As a result, utilizing MFPA for MPPT realization achieves the expected objectives of quick convergence and superior robustness.
The paper is structured as follows.
Section 2 introduces the modeling of the PV module. In
Section 3, PV array and its output characteristics are described.
Section 4 completes the design of the MFPA implementing MPPT for the PV system. Simulation results are explained in
Section 5. Finally the conclusions are presented.
2. Modeling of PV Module
Taking into account the resistance characteristics and loss of solar cell materials, material resistance and contact resistance and recombination of carriers in the junction region of the PN junction are equivalent to the serial internal resistance of the solar cell, and the leakage current at the edge is equivalent to the parallel internal resistance of the solar cell [
23]. The equivalent circuit of the single diode model of the solar cell is shown in
Figure 1.
The equation that mathematically describes the
characteristic of the solar cell using Kirchhoff’s current law (KCL) is given by Villalva et al. [
23]:
where
and
are the output current and voltage of the solar cell, respectively;
is the photocurrent of the solar cell;
is the reverse saturation current of the diode;
is the diode ideality factor, its range is 1–5;
is the electron charge,
;
is the Boltzmann constant,
;
is the solar cell temperature;
and
are series and parallel internal resistance, respectively.
A PV module is composed of solar cells connected by series-parallel connection. From the above equation, the
characteristic equation of a PV module can be given as Villalva et al. [
23]:
where
is the thermal voltage,
;
and
are the number of solar cells connected in series and parallel;
and
are the output current and voltage of the PV module,
and
;
is the photocurrent of the PV module,
;
is the reverse saturation current of the diode,
;
and
are series and parallel equivalent resistance of the PV module,
and
.
3. PV Array and Its Output Characteristics
In the actual PV power generation system, the output power of PV modules are still extremely low. Therefore, PV modules are connected by series-parallel connection to form a PV array according to certain requirements in most PV systems. Under the condition of partial shading, in order to effectively prevent hot spot effect, the PV module is composed of solar cells and a bypass diode connected by parallel [
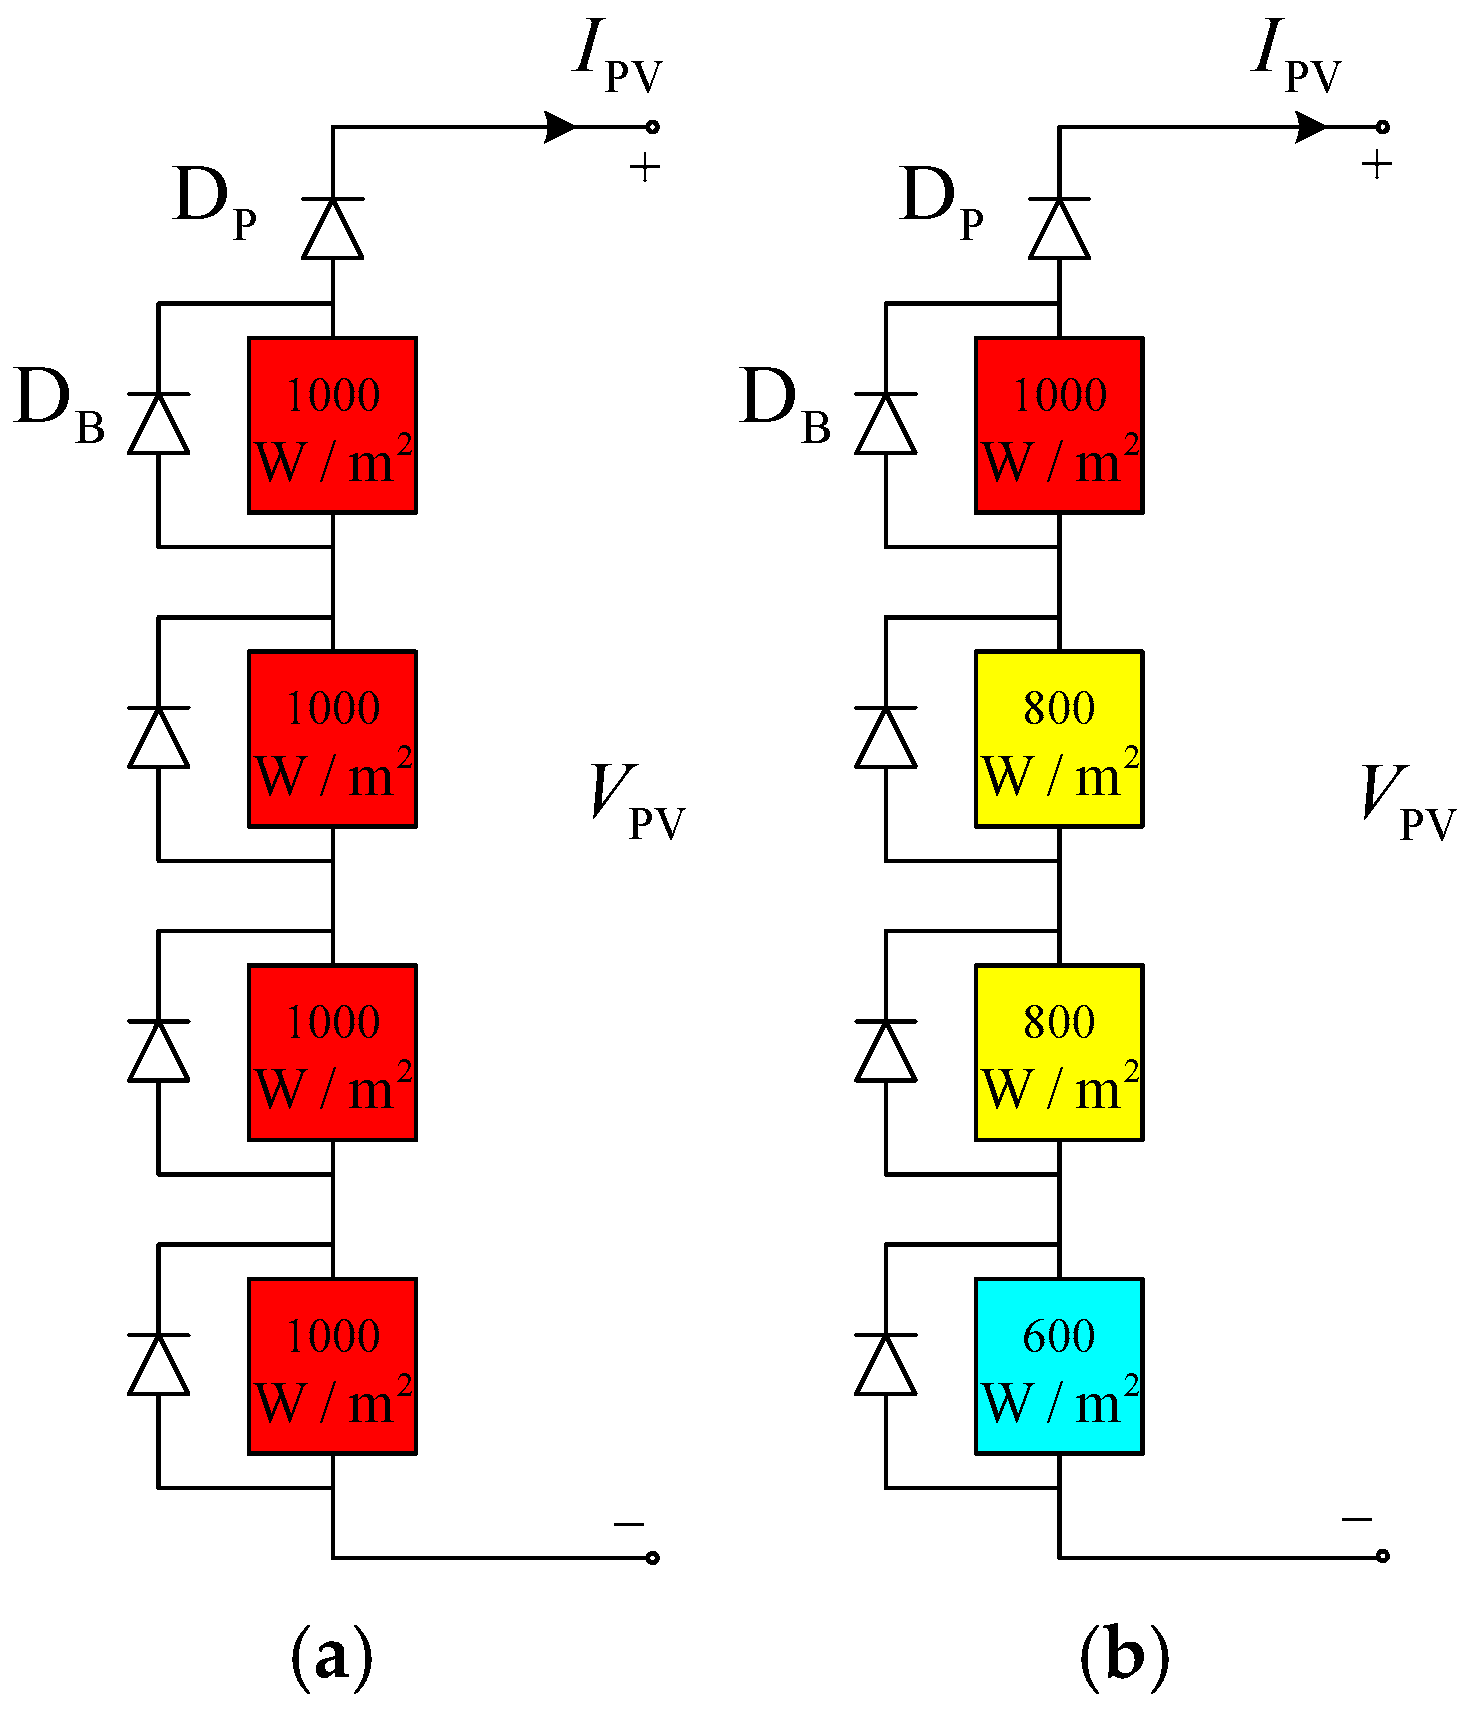
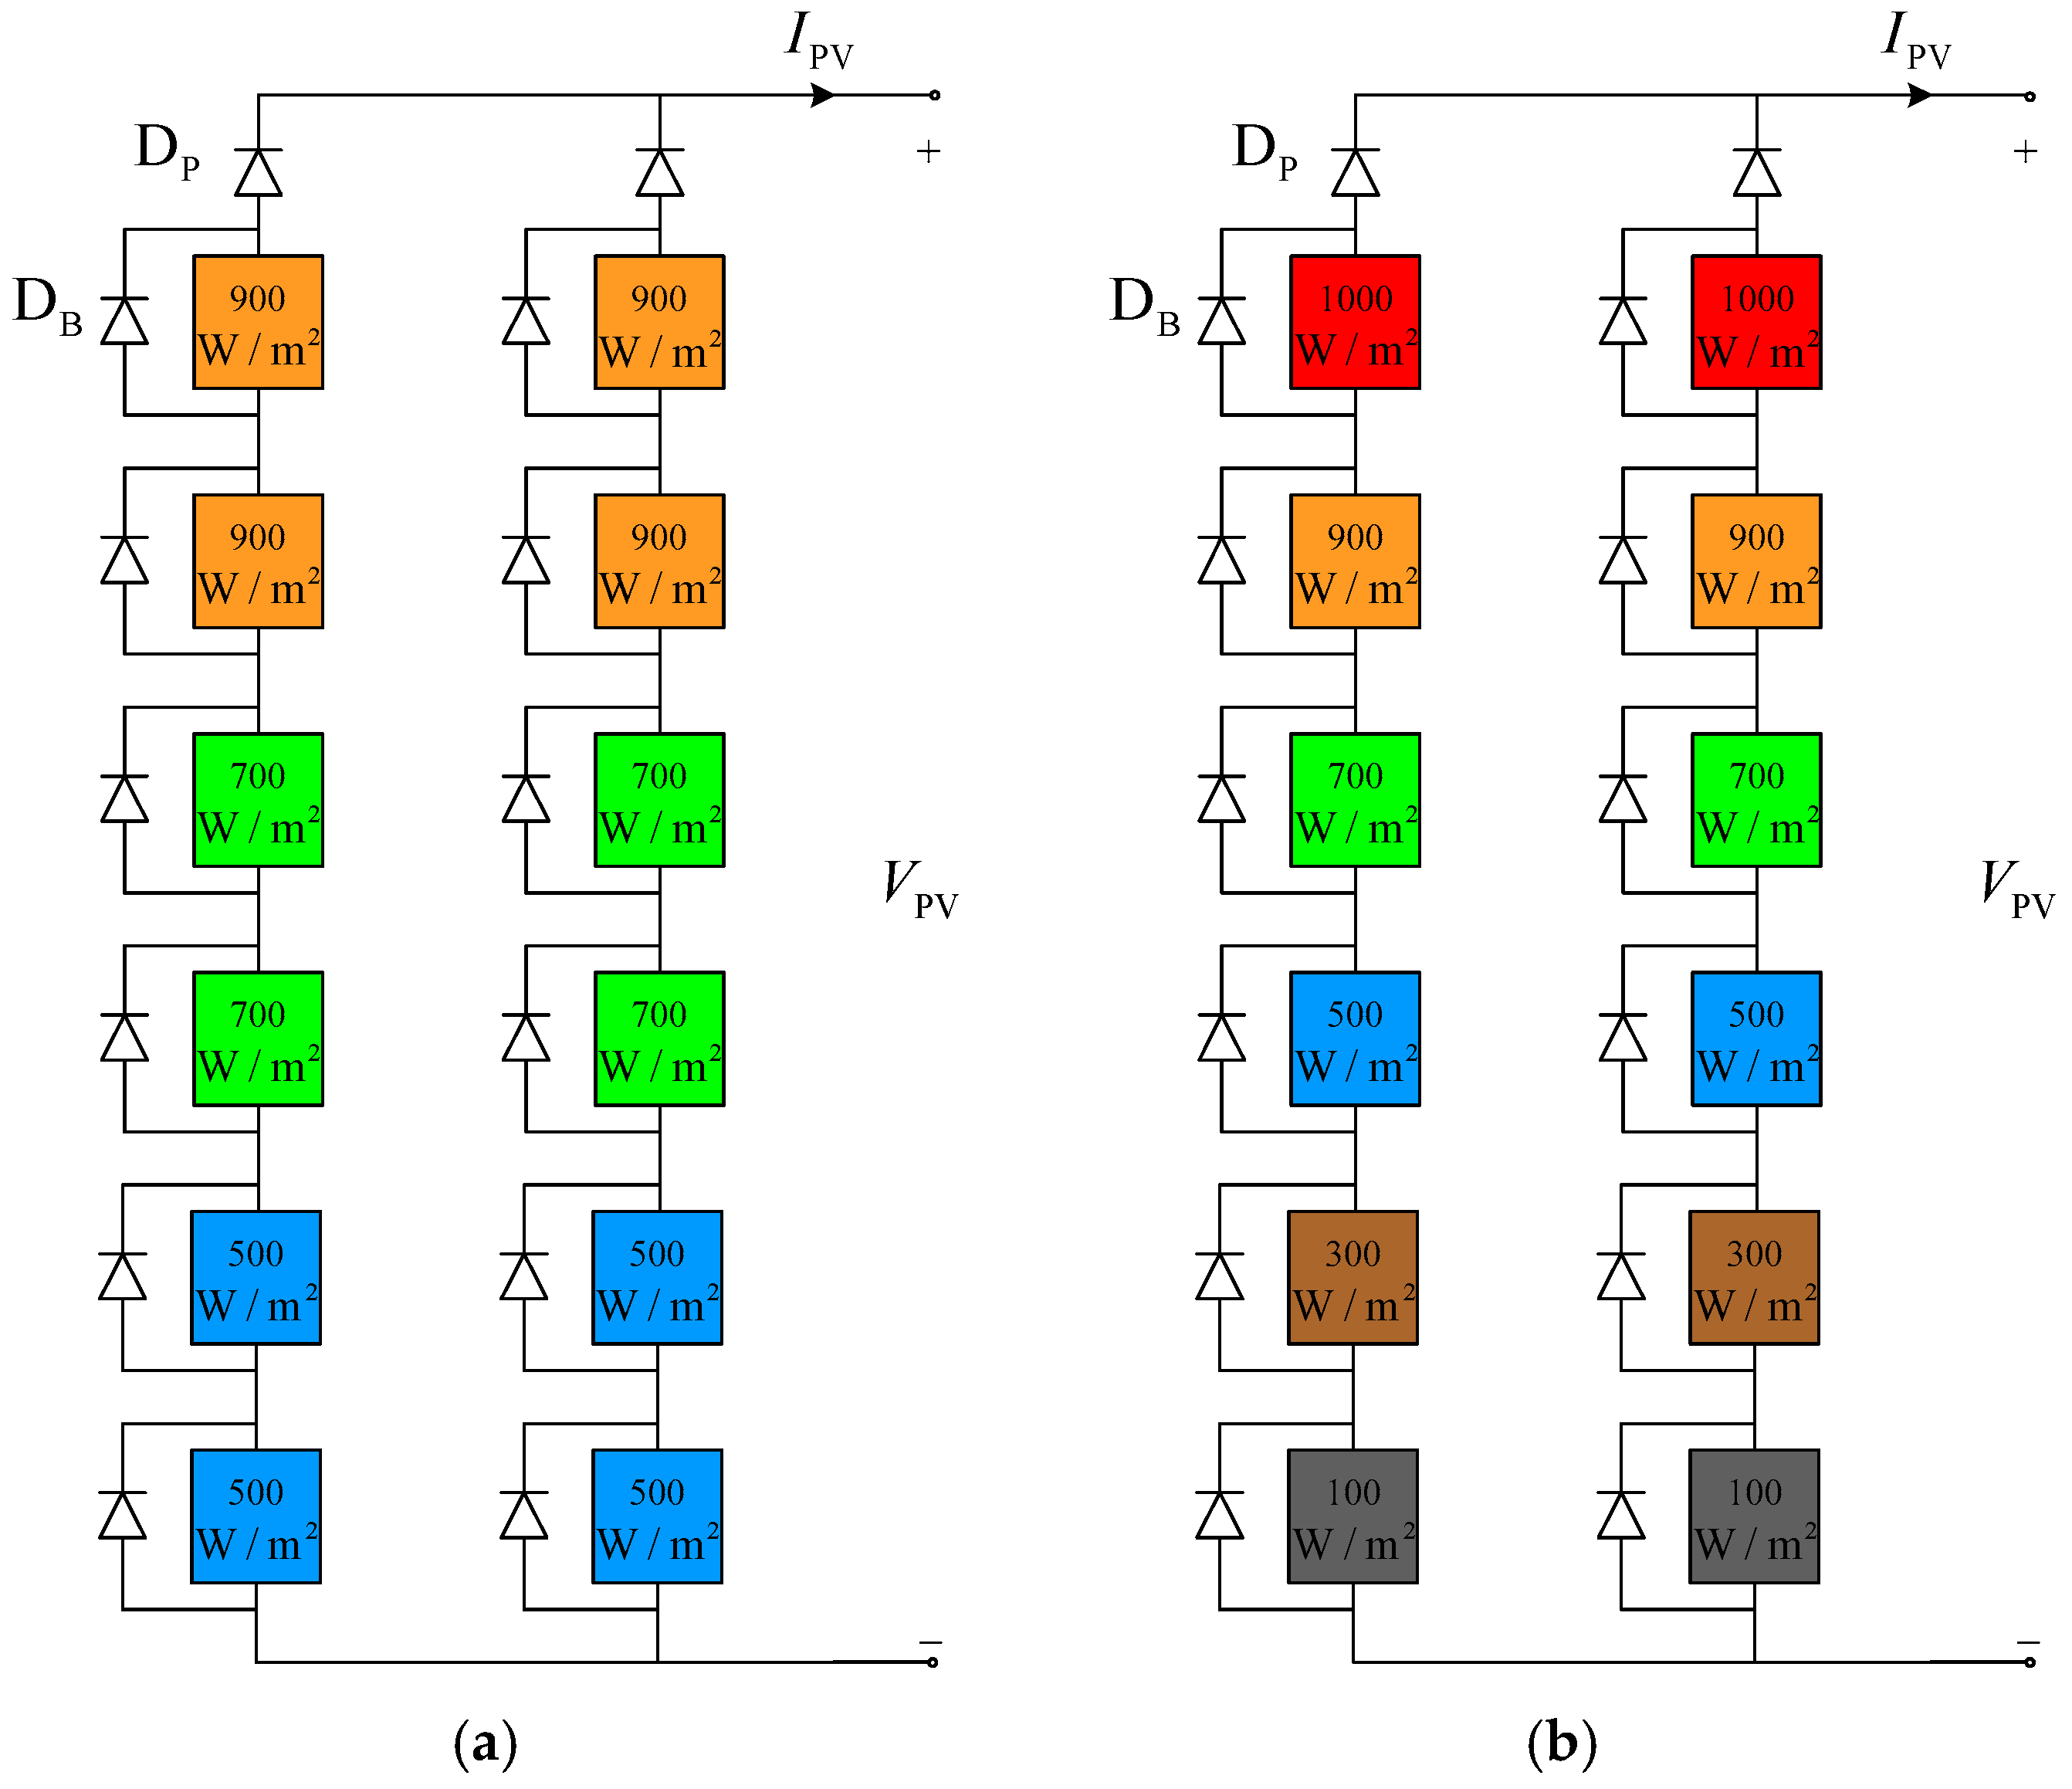
24]. In this paper, the improved PV modules are connected by series to assemble a PV string, then all similar PV strings are connected by parallel to form a PV array. The simple configuration structure of the PV array constituted by four series connection PV modules is shown in
Figure 2. The series diode is named as blocking diode in each PV string, and its role is to prevent reverse current flowing in the PV string. The reverse parallel diode of the PV module is named as a bypass diode, and its main function is to avoid the hot spot effect under partial shading conditions.
Partial shading is the phenomenon that a PV array receives uneven irradiation and temperature caused owing to passing clouds, adjacent buildings and towering trees [
25,
26,
27]. To inspect shading has an effect on a PV array output characteristics, as the PV array are exposed to (a) uniform irradiation and (b) partial shading. A schematic of the PV array with four PV modules under uniform irradiation and partial shading is shown in
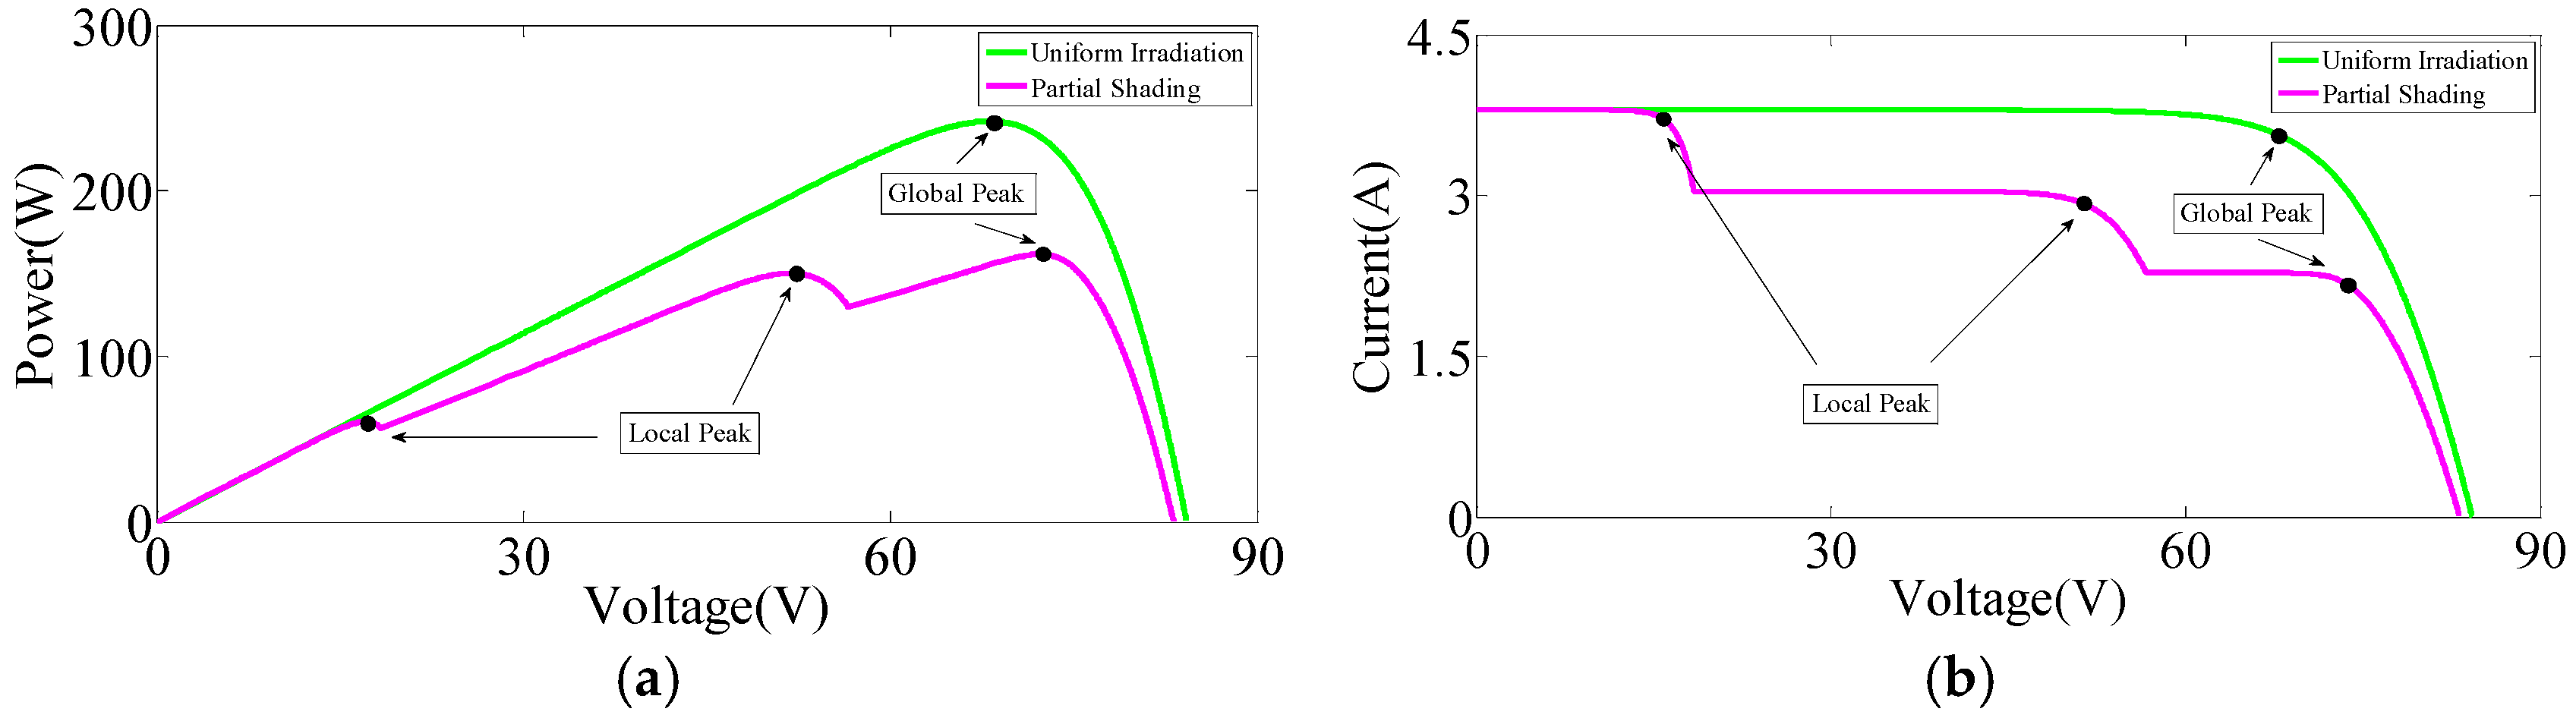
Figure 2. The corresponding output characteristics of the PV array is shown in
Figure 3. Due to the existence of partial shading, the bypass diodes of the PV modules receiving non-uniform irradiation are turned on, which results in multiple peaks in P-V characteristic of the PV array. From the above demonstration a conclusion can be obtained that it is very important to track the maximum power point of the PV array under partial shading conditions. Therefore, in this work the MPPT controller based on the MFPA method is designed and its effectiveness is validated under varying irradiation and temperature levels.
4. MFPA and Its Application in MPPT
4.1. FPA Overview
FPA is a global optimization algorithm that imitates the flower pollination process of flowering plants in nature and was first proposed by Yang. The pollination process of flowering plants can be divided into cross-pollination and self-pollination. Cross-pollination generally requires communicators such as birds, bees and bats whose flight behavior have the characteristic of levy flight [
28]. So cross-pollination can take place at distant random region and it is simulated to achieve global optimization in FPA. In addition, self-pollination is the propagation of the plant’s mature pollens into its own flowers, and its transmission medium is wind. This pollination process is imitated to complete local optimization. In FPA, it is assumed that one solution of the optimization problem corresponds to one pollen gamete and each plant with a flower has only one pollen gamete. To implement FPA, the following rules are adhered to:
Rule 1: Cross-pollination refers to the global pollination process executed through levy flight by communicators which carrying pollens. The characterized equation for global pollination can be given as follows:
where
is the
th solution in the
th iteration;
is global optimal solution;
is the scaling factor of the control step [
20];
is the Levy flight displacement corresponding to the flower individual, it is defined as:
where
is equivalent to 1.5;
is a standard gamma function;
can be defined as:
where
and
obey normal distribution,
and
;
is defined as:
Rule 2: Self-pollination refers to the local pollination process of flower itself. The characterized equation for local pollination is given as follows:
where
is the
th solution in the
th iteration;
represents the pollen of different flowers of the same kind of plant, which is equivalent to two random solutions of the population and can enhance the diversity of the population.
obeys uniformly distributed random numbers,
.
Rule 3: Reproduction probability refers to the flower constancy. The value of reproduction probability is proportional to the similarity of the two flowers treated as the optimization problem solutions.
Rule 4: The conversion of between global pollination and local pollination is controlled by switch probability ().
4.2. MFPA Introduction
Due to the FPA easily falling into the local maximum and the convergence rate being slow in the later period, a modified flower pollination algorithm is proposed. In MFPA, the flower populations are divided into three subgroups according to the individual fitness of populations. In the process of optimization, the better individuals (closed to the global maximum) are locally optimized to complete quick convergence; the poor individuals (deviated from the global maximum) are globally optimized to avoid premature convergence; the individuals in the middle are executed by dual mode optimization and the switch probability
of mode conversion is found to be optimal at 0.8 by Yang and Karamanoglu [
20]. The detailed implementation process is given as follows:
Set n is the size of the population; N is number of iteration; represents the population, ; is the fitness function of the population in the th iteration; is the optimal fitness; is the average fitness; is the average fitness for the populations of .
(1)
These individuals are relatively excellent in populations and are already close to the global maximum. Therefore, local pollination will be implemented to accelerate convergence speed. The updating rule of these individuals is based on Equation (7).
(2)
These individuals are considered as ordinary populations. Similarity to the FPA method, these individuals will be executed with both global and local pollination, whose switch probability is set as 0.8.
(3)
These individuals are relatively poor in populations and deviate from the global maximum. Hence, global pollination will be performed to avoid premature convergence. The updating rule of these individuals is based on Equation (3).
MFPA can provide the required randomness to the control variables, which is very suitable for the study of MPPT problems in the PV system under variable irradiation and temperature conditions. Moreover, according to the value of the population fitness, it is decided to perform local or global pollination, thus accelerating the convergence speed of the algorithm and avoiding the population falling into the local maximum prematurely.
4.3. Application of MFPA in MPPT
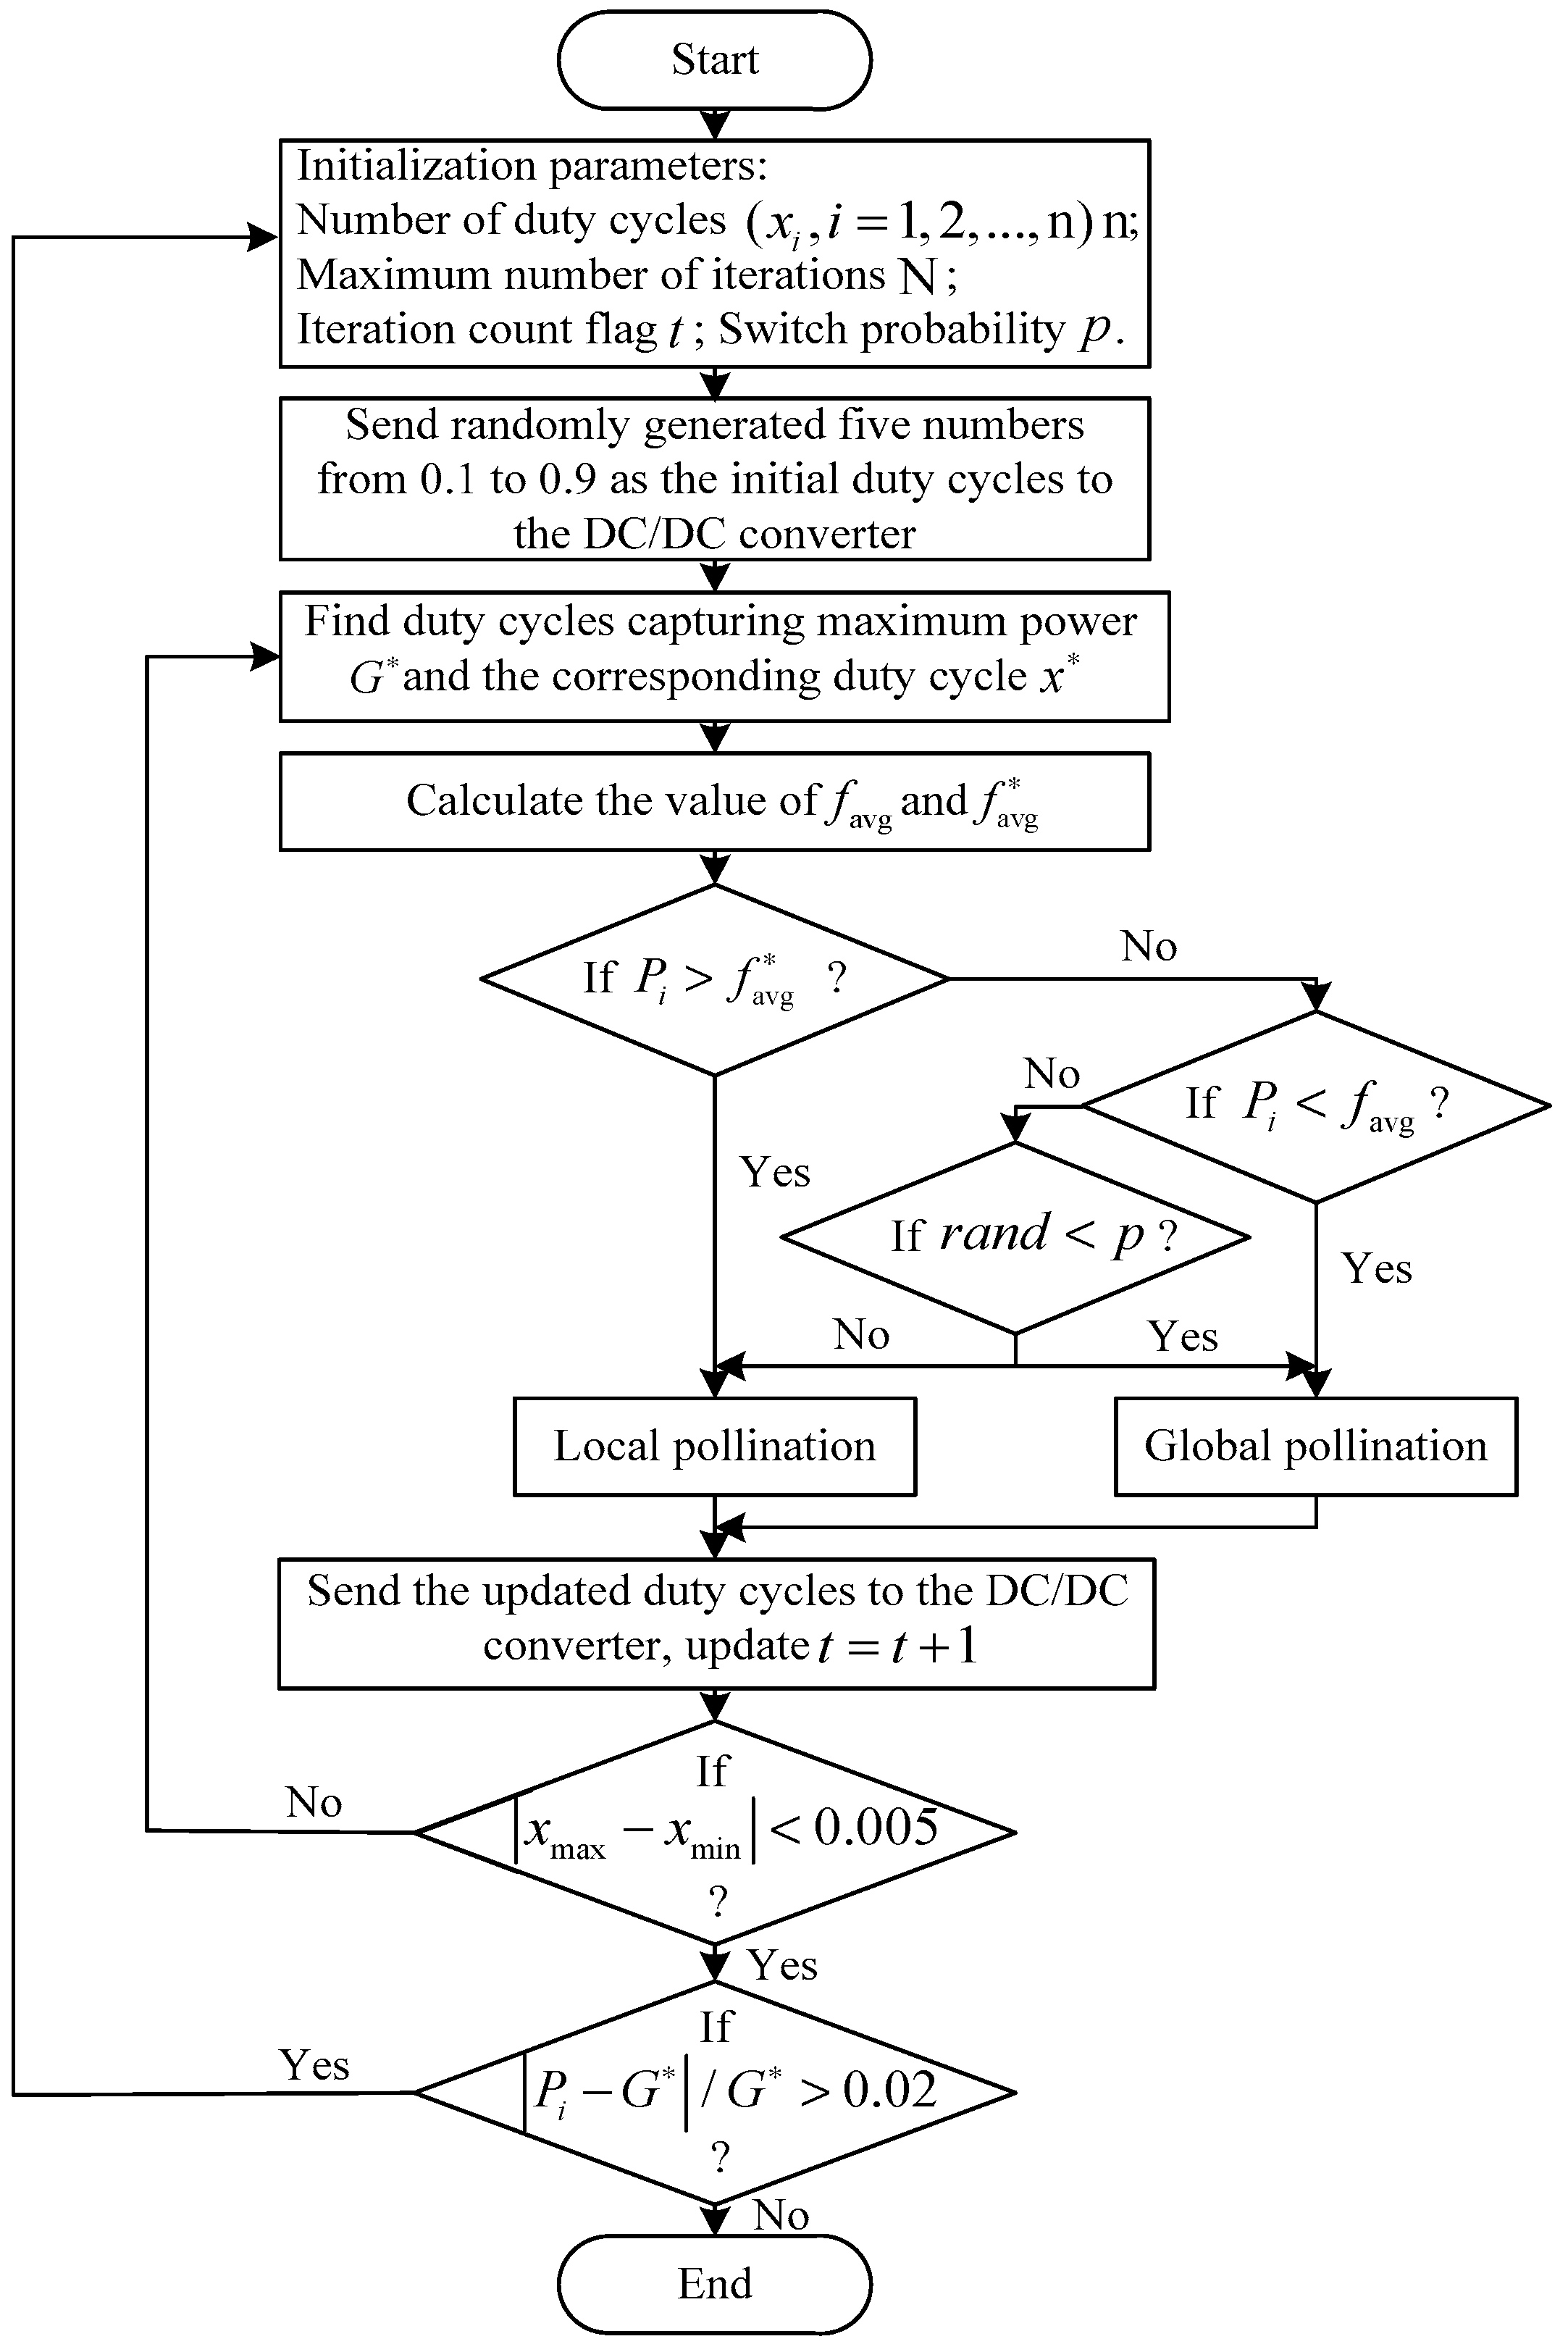
The MPPT is generally realized by controlling a DC/DC converter of the PV system. In the paper, MPPT controller based on MFPA is designed to continuously update the duty cycle until the system output is in the state of the maximum power point. In MFPA method, each population represents one duty cycle used to control the DC/DC converter and the corresponding output power of the duty cycle represents the fitness of the population. Application of MFPA in MPPT is implemented in the following process.
- Step 1
Initialization parameters: Duty cycles (, ) and its number is 5, maximum number of iterations (), iteration count flag (), switch probability ().
- Step 2
Generation the initial duty cycles: Randomly generates five numbers from 0.1 to 0.9 as the initial duty cycles and send to the DC/DC converter.
- Step 3
Identification of the best duty cycle: Find duty cycles capturing maximum power and the corresponding the best duty cycle .
- Step 4
Calculation the value of and : Calculate the average value of duty cycles capturing the output power values and the average value of the output power values greater than .
- Step 5
Update the duty cycle: If corresponding power is greater than , local pollination is carried out to get next duty cycle. If is less than , global pollination is performed to obtain next duty cycle. In addition, global or local pollination is executed by switch probability control. The duty cycle exploits updating rules as follows, (a) global pollination: ; (b) local pollination: .
- Step 6
Termination condition: If the absolute value of the difference between the maximum duty cycle and the minimum duty cycle from the pool of duty cycles is not less than 0.005 (reached the upper bound of the number of iterations), continuously continue step 3 to step 6 until reaching the maximum power point.
- Step 7
Restart conditions: The maximum power point of the PV system will shift to another point due to the changes of irradiation and temperature. It can be detected by recording the threshold change in power values between iterations. If
(
is the current measured power;
is the maximum power) [
29], the duty cycle is re-initialized to find new maximum power point. Flowchart for MPPT based on MPFA is shown in
Figure 4.
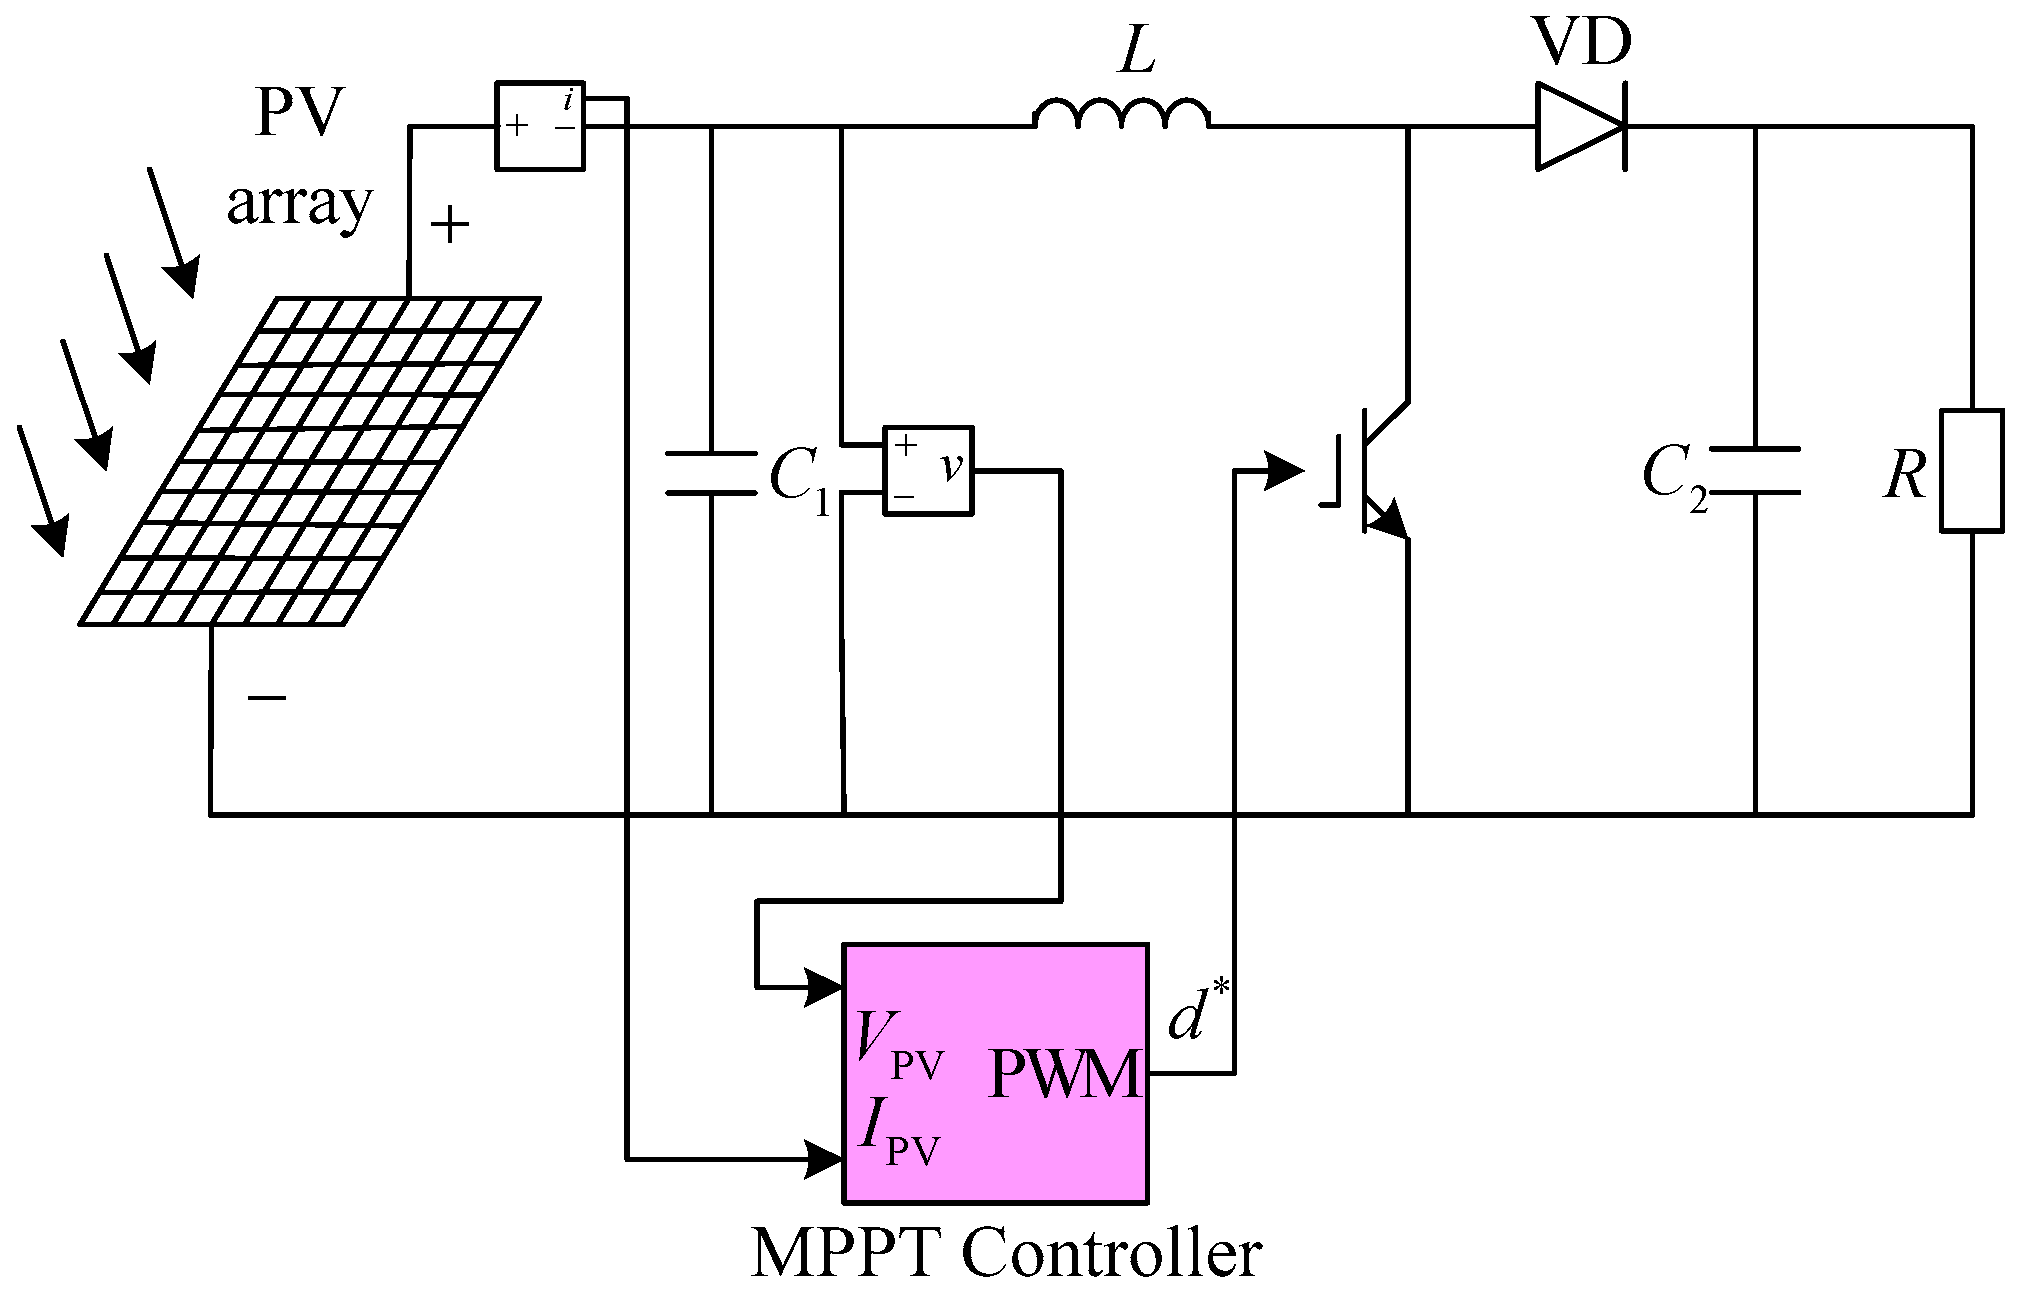
5. Analysis and Discussion of the Simulation Results
In order to inspect the performance of the proposed method for MPPT realization under non-uniform irradiation and temperature conditions, a PV system including a PV array, a DC/DC converter, a MPPT controller and a load is modelled on the MATLAB/Simulink platform. The MPPT controller is consisted of a function module and a comparator unit. The function module realizes MPPT based on MFPA whose input is the real-time voltage and current values of the PV array, and the output is a value between 0.1 and 0.9. The comparison unit completes comparing the value sent to it with a triangular wave of amplitude 1 to obtain duty cycle signal. The DC/DC converter is adjusted by the obtained duty cycle signal until it is finally stabilized at the MPP. After inputting the changed duty cycle, the system output power cannot be stabilized immediately. During the simulation experiment, the voltage and current are collected after a delay of about 0.02 s, and then the input power of the DC/DC converter is calculated. The control scheme for the PV system with MPPT implemented is shown in
Figure 5. The configuration of the PV array is shown in
Figure 6. The PV module key parameters are reported in
Table 1 [
30].
For evaluation of MFPA’s suitability, the proposed method is compared with the prevailing FPA method and conventional P&O method with the parameters of these methods adjusted to exhibit similar properties. Hence, in this paper the FPA and MFPA method include two parameters that switch probability is selected as 0.8 and scaling factor is considered as 0.1. P&O algorithm involves two parameters that initial duty cycle and change in duty cycle is taken as 0.75 and 0.005, respectively. Meanwhile the number of duty cycles (the populations) are found as 5 after plentiful experimentation, the experimental results of all the above algorithms are the most ideal.
5.1. Different Irradiation Levels
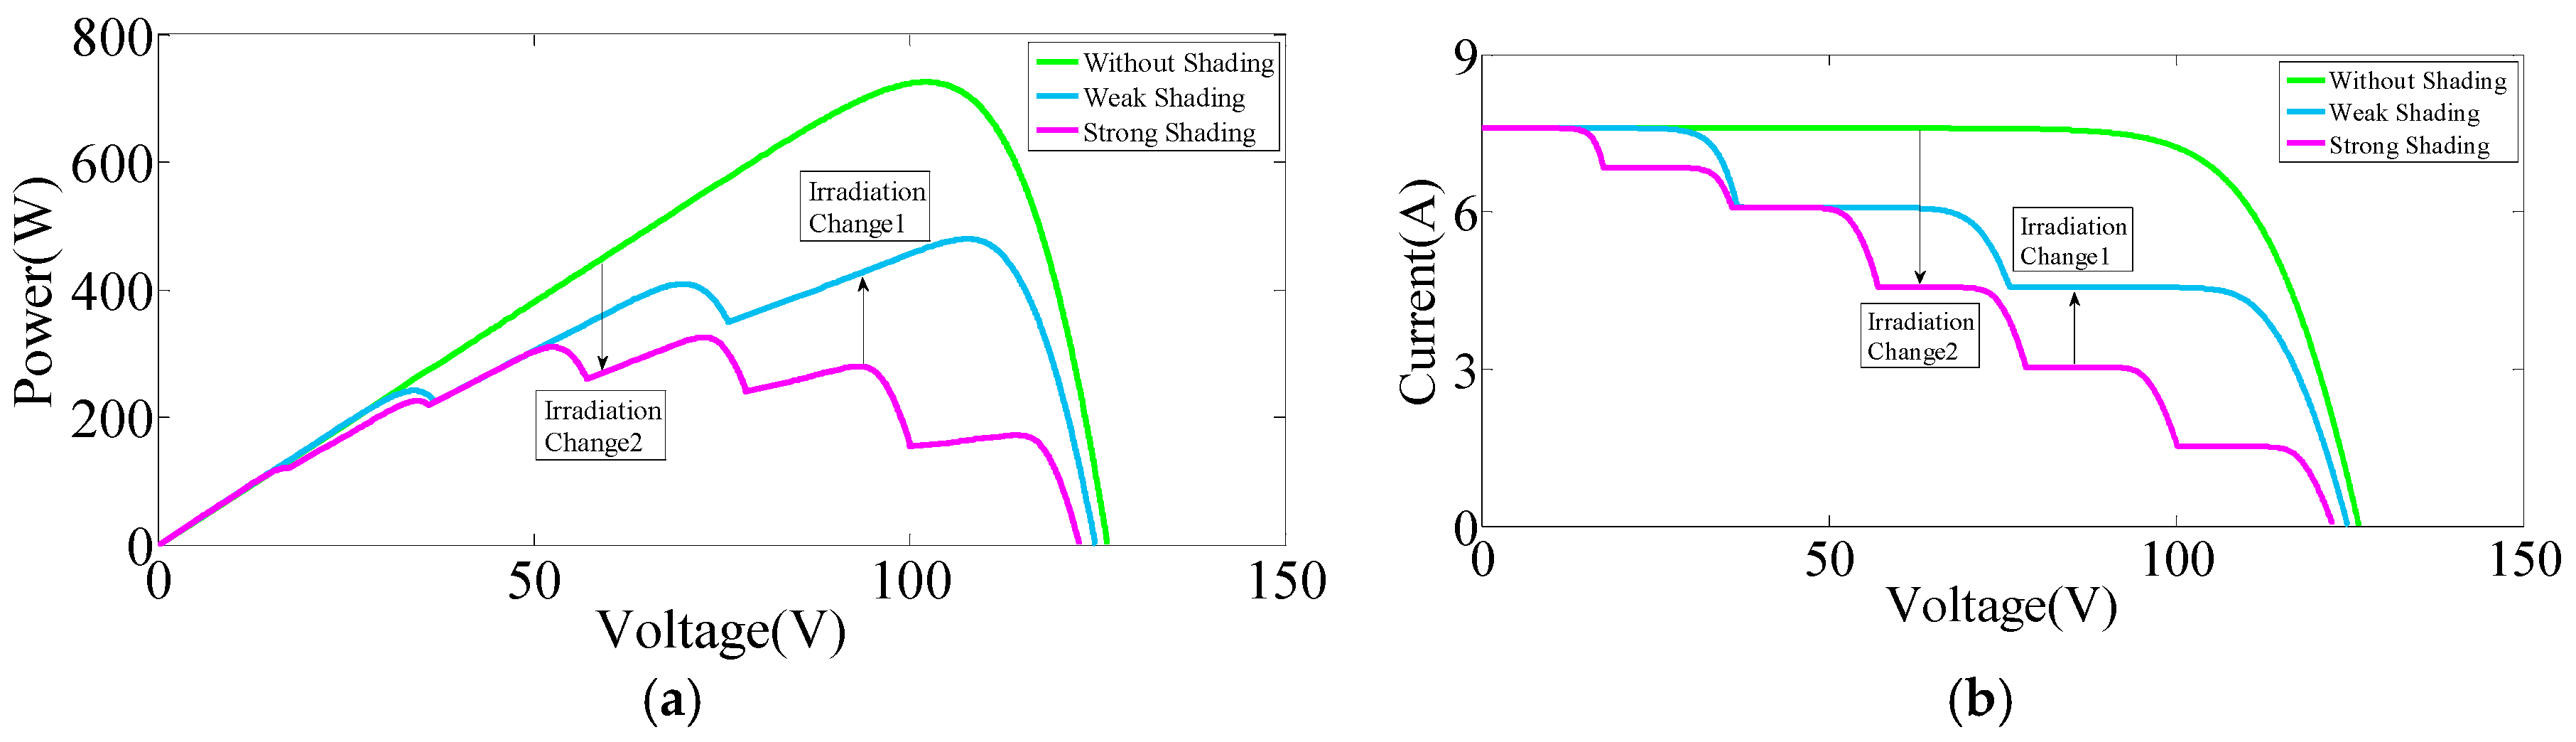
In this paper, PV arrays are subjected to more than three types of irradiation either called strong shading or called weak shading, as shown in
Figure 6. Under a temperature kept at 25 °C, the output characteristics of the PV array for different shading levels are shown in
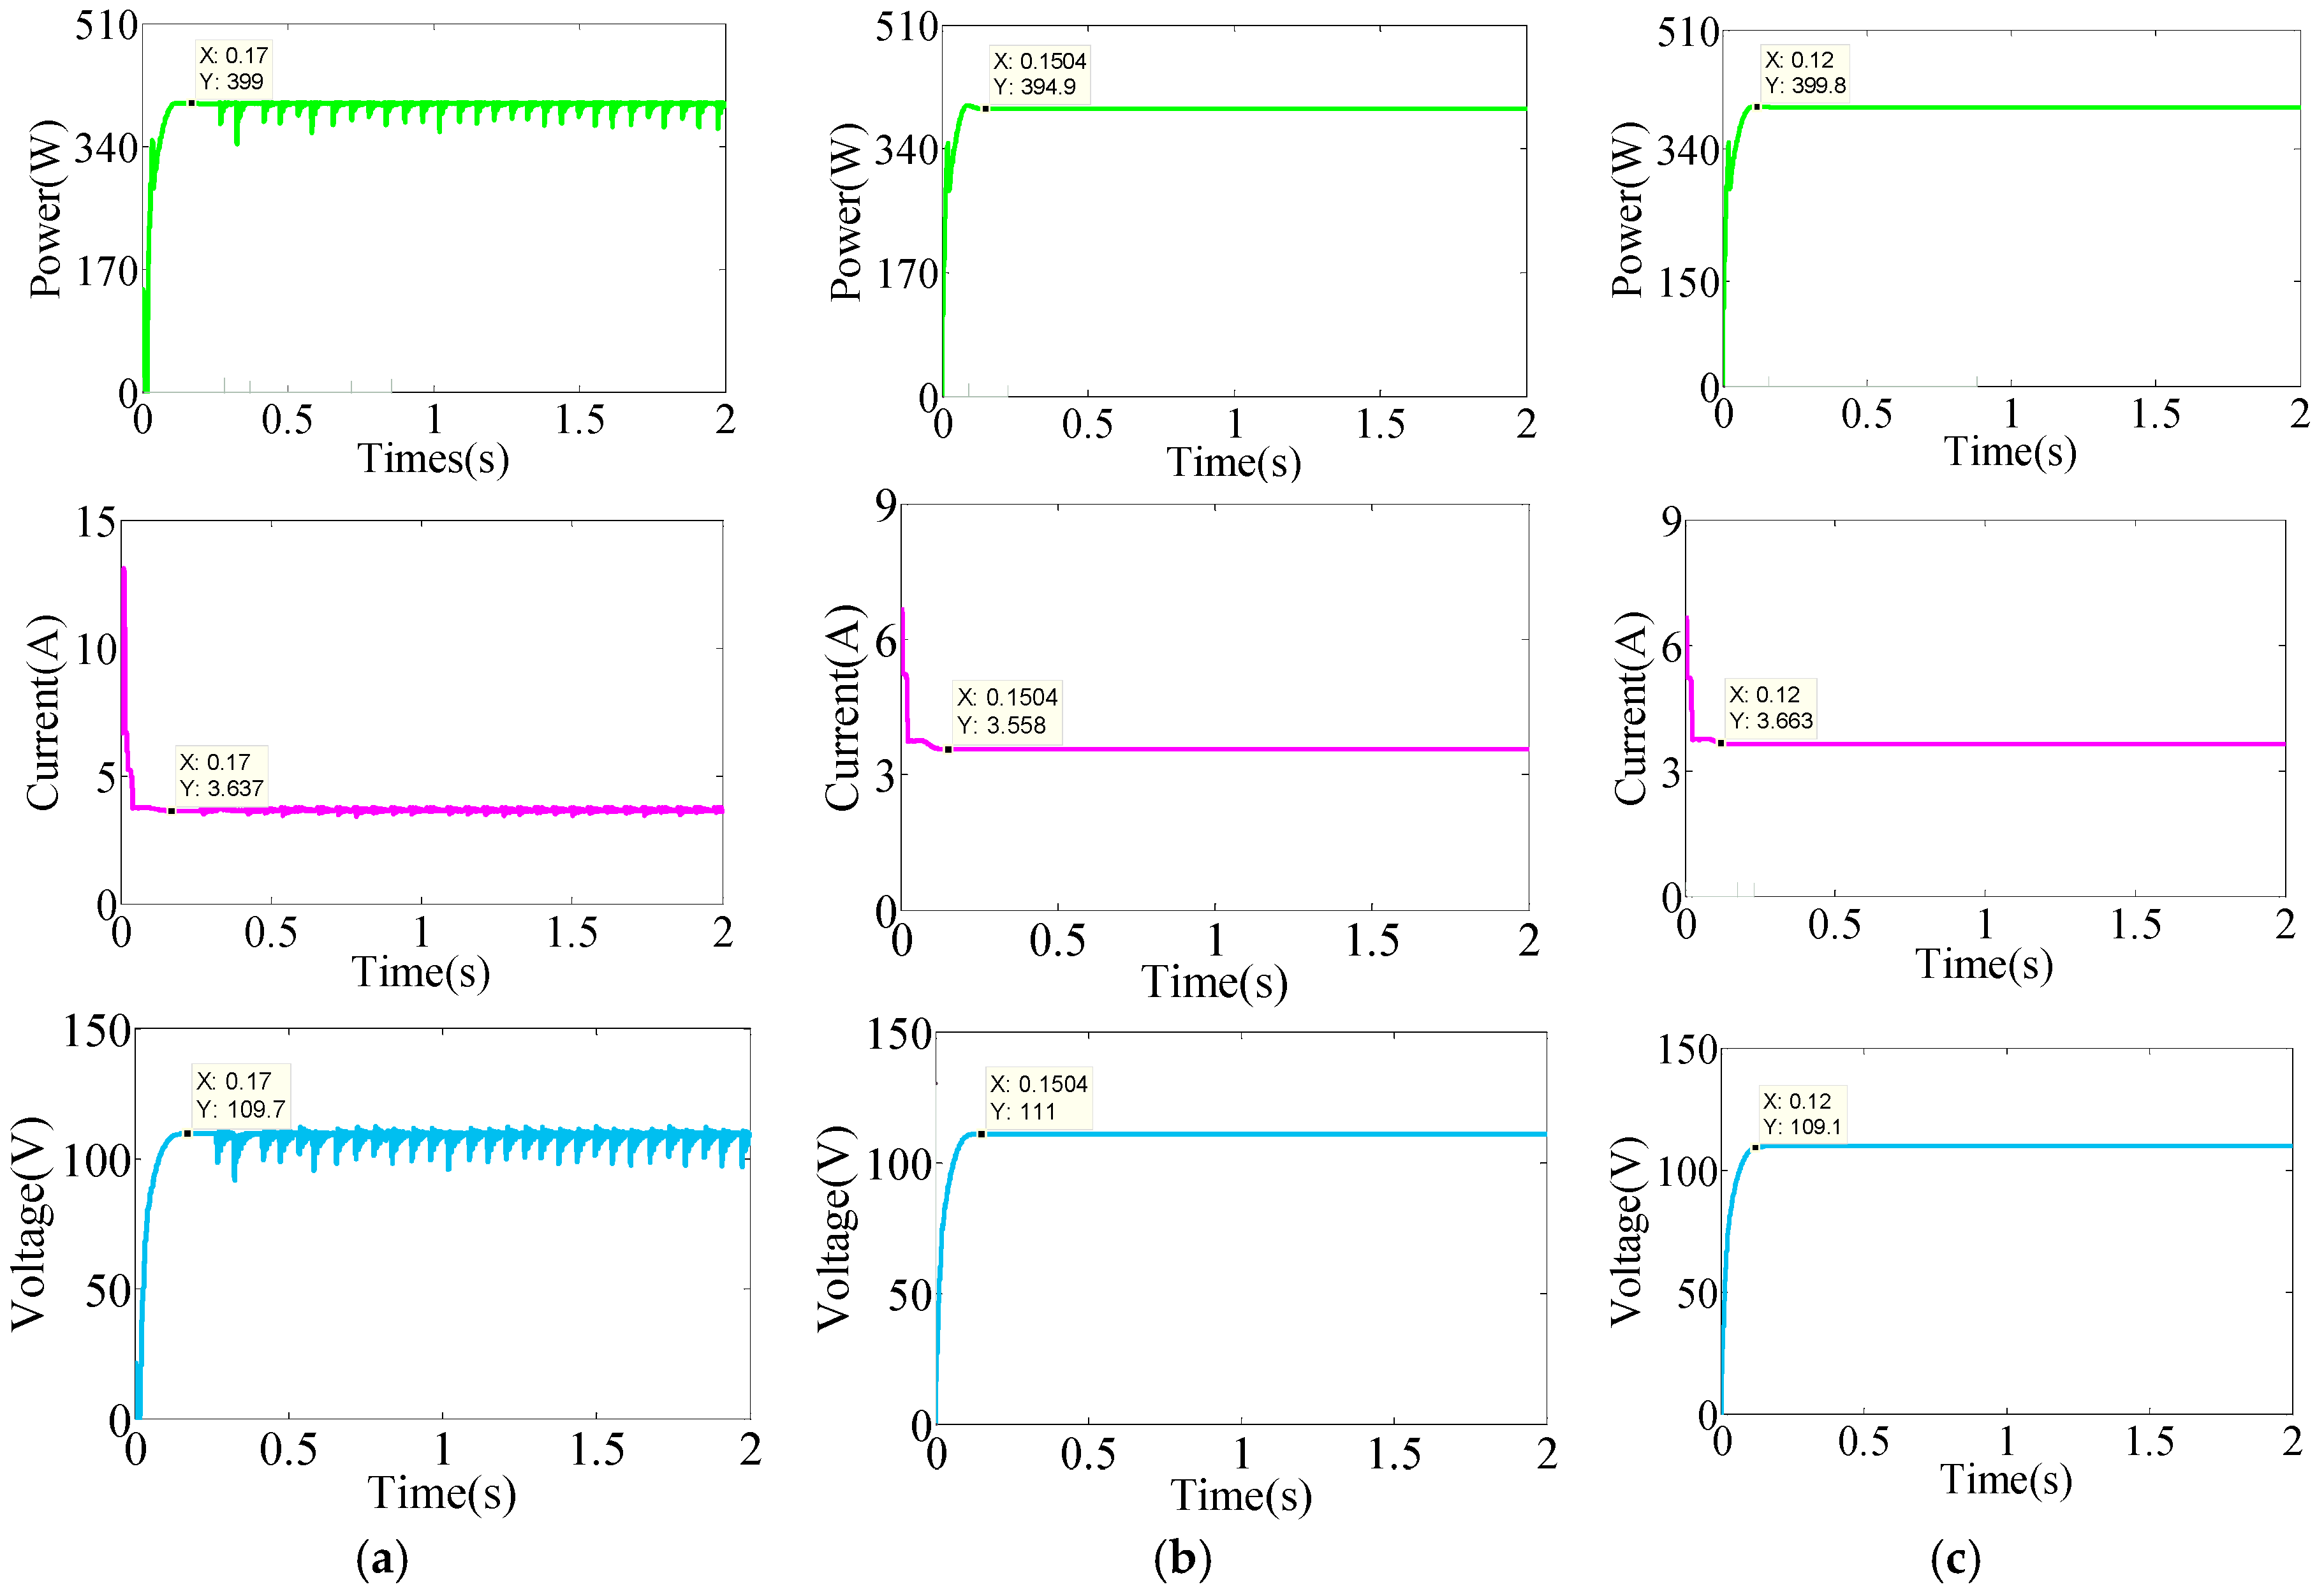
Figure 7. In the weak shading with three peaks, global peak is located at 400.3 W and local peaks are situated at 358.9 W and 218 W. The power difference between global and local peaks are relatively greater corresponding to the weak shading. Hence, the MFPA method tracks to the global peak at 0.12 s and the FPA can obtain the global peak at 0.15 s with obvious power loss. The P&O also acquires the global peak at 0.17 s, but traditional P&O method has a great fluctuation in the early stage and obvious oscillation in the vicinity of MPP. Power, current and voltage tracking curves of P&O, FPA and MFPA for weak shading are shown as
Figure 8.
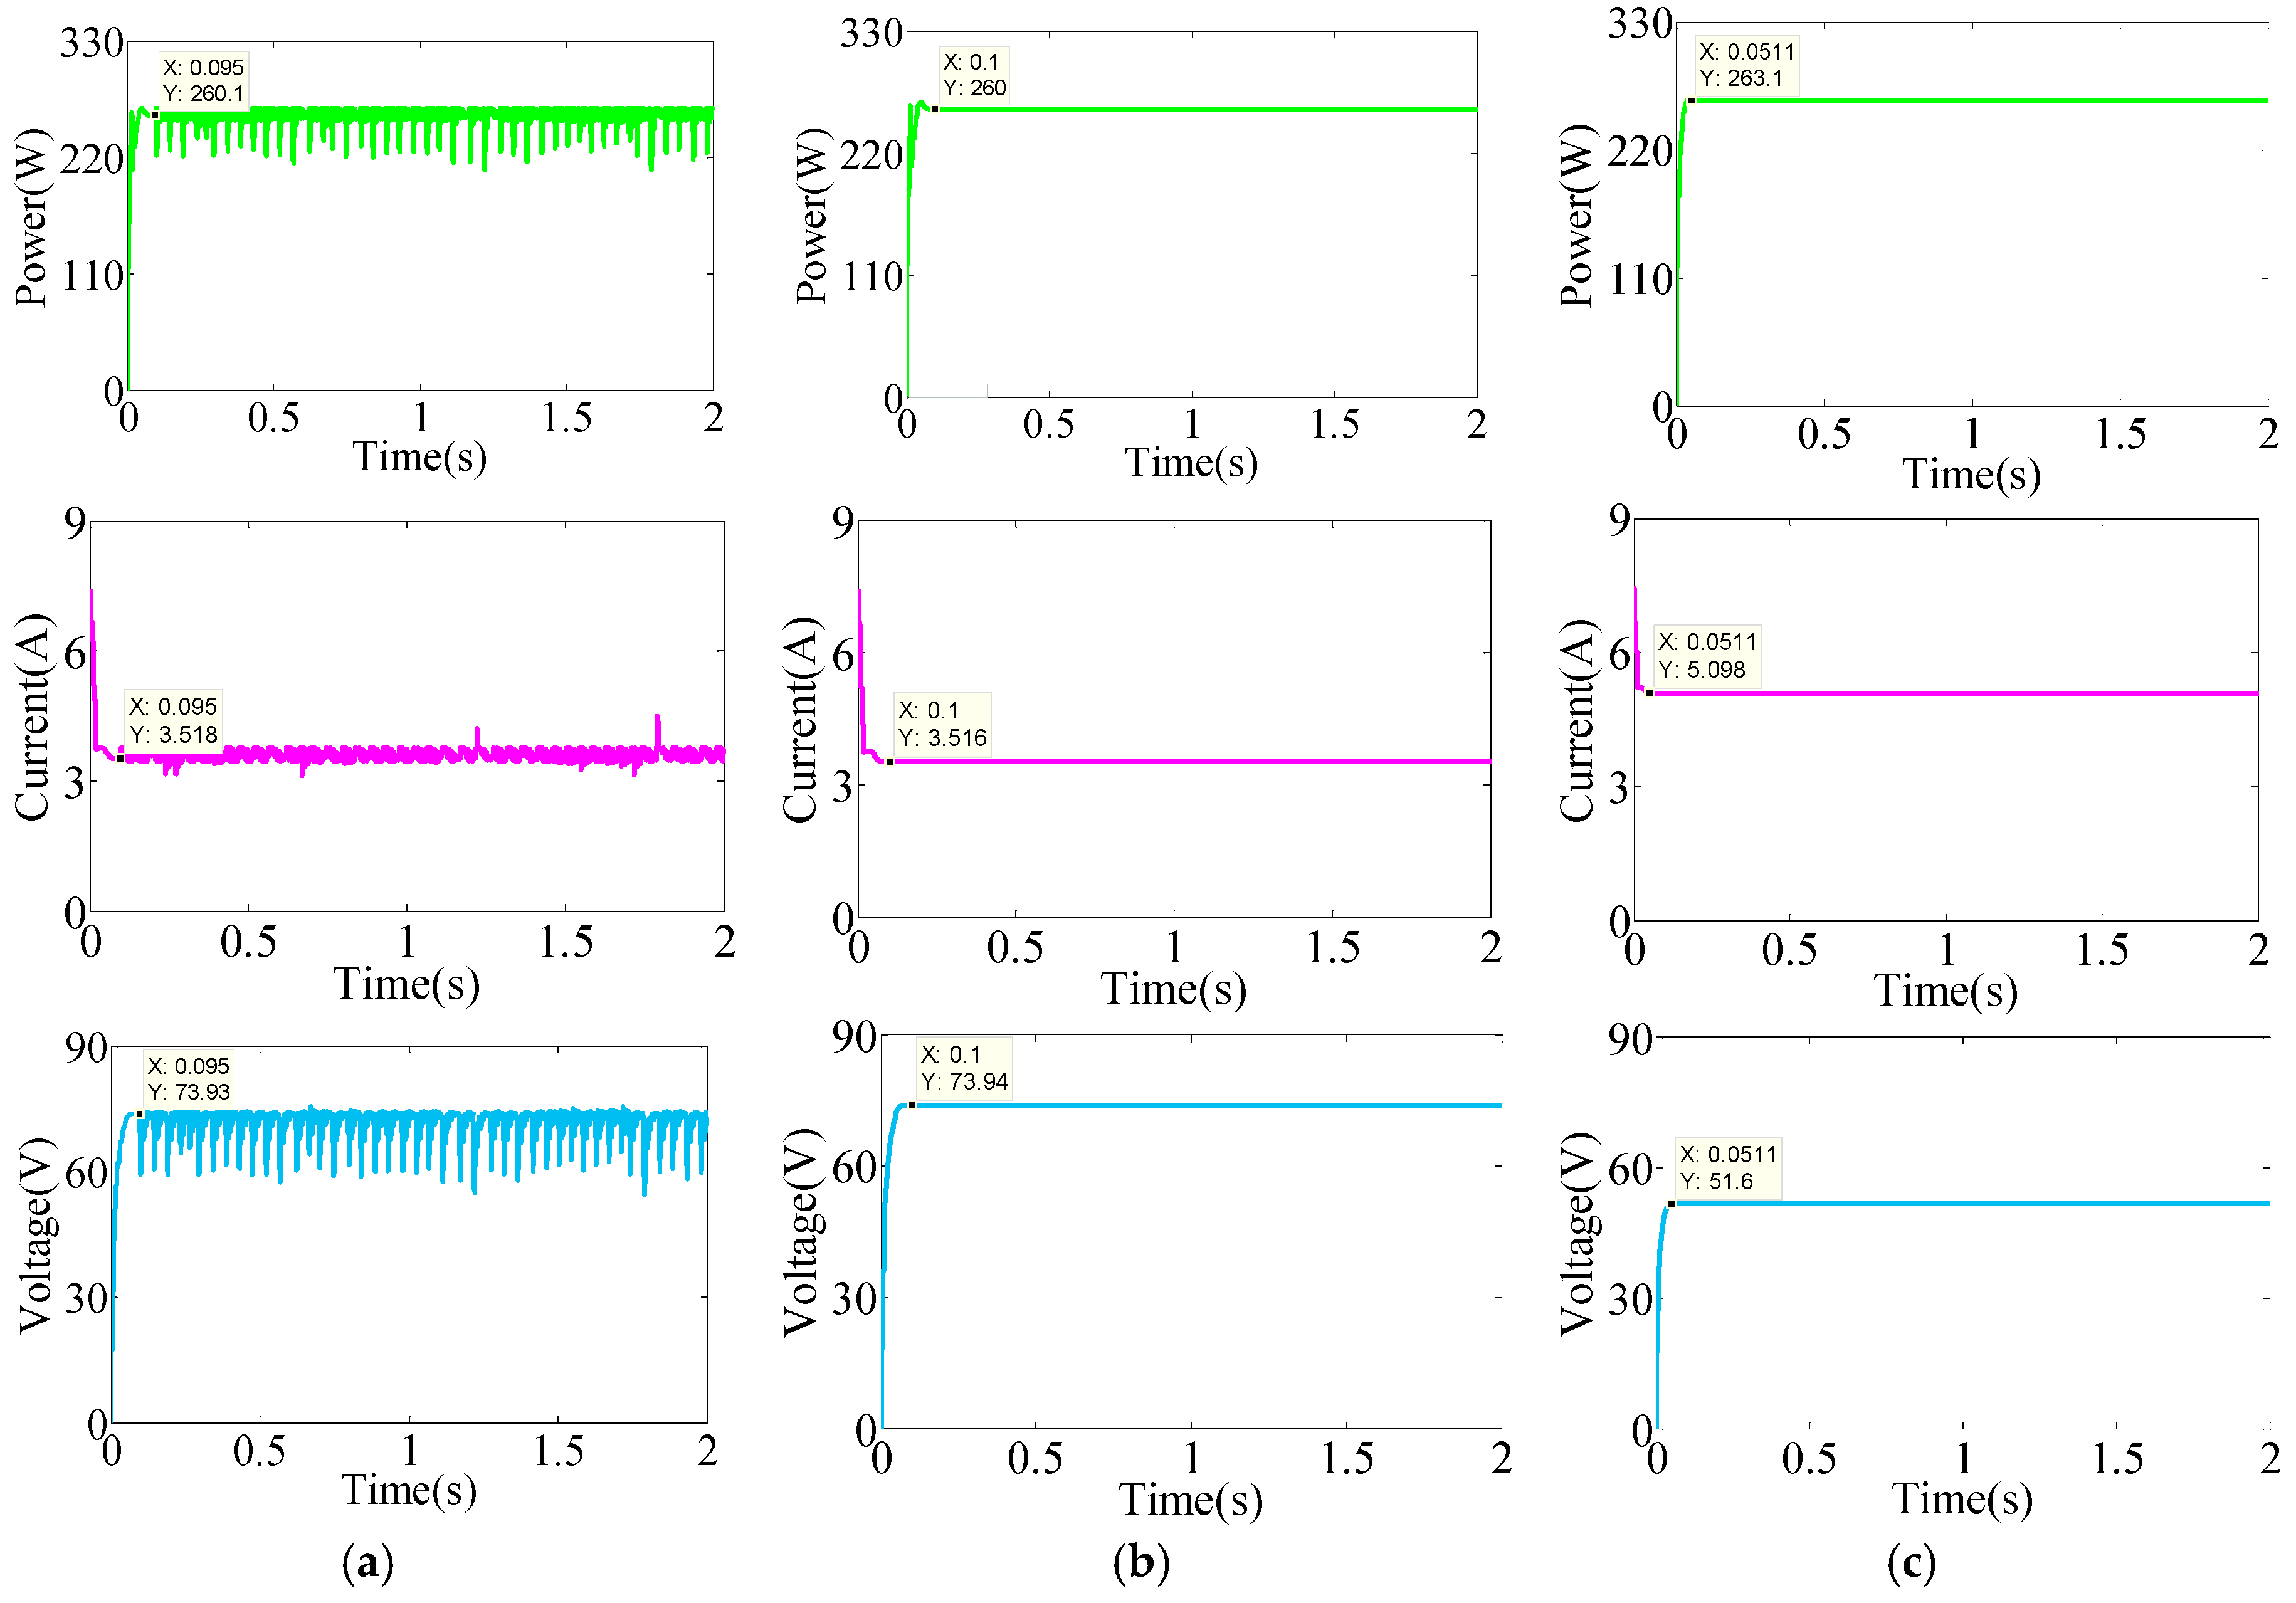
For the strong shading with six peaks, global peak is located at 264 W and local peaks are separately situated at 113.1 W, 211.2 W, 261.2 W, 202.6 W and 83.2 W. The MFPA method still demonstrates remarkable applicability for MPPT under a strong shading condition and it converges more quickly within 0.05 s. Due to the presence of multiple peaks and the global peak being closed to the local maximum, the FPA and P&O have fallen into the local peak. The FPA has founded the local peak of 260 W. The P&O has also acquired the local peak as 260.1 W and the oscillation is significantly obvious around the local peak. This fact has exposed that FPA and P&O failed to recognize the maximum power point corresponding to strong shading. Power, current and voltage tracking curves of P&O, FPA and MFPA for strong shading are shown as
Figure 9. Based on the different irradiation levels, the performance indexes of P&O, FPA and MFPA method for simulation experiment are presented in
Table 2. In
Table 2, tracking efficiency is one of the most important indexes of the MPPT algorithm, and its calculation method is given by,
where
is the efficiency of MPPT method;
is the output power of the PV system using the MPPT method;
is the maximum output power of the PV system.
5.2. Variable Irradiation Conditions
In virtue of the randomness of weather conditions, a PV system generally received dynamic shading so that the operating point of the system must be shifted to ensure working at the MPP. According to the description of as
Section 5.1, the P&O method has intense oscillation near the MPP and traps easily the local maximum under strong shading. Therefore, the MFPA and FPA are only considered to implement MPPT corresponding to variable irradiation conditions. To validate such conditions, the PV array configuration is similar as shown in
Figure 6 and the output characteristics of the PV array are shown in
Figure 10 with temperature kept at 25 °C. For the irradiation change from strong shading to weak shading, six different irradiations under strong shading are originally applied to the PV system, which are set to 1000 W/m
2, 900 W/m
2, 800 W/m
2, 600 W/m
2, 400 W/m
2 and 200 W/m
2. The corresponding global peak is located at 317.4 W and local peaks are respectively situated at 115.7 W, 218.3 W, 301.3 W, 274.1 W and 169 W; Then three different irradiations under weak shading are utilized for the PV system after 1 s, 1000 W/m
2, 800 W/m
2, and 600 W/m
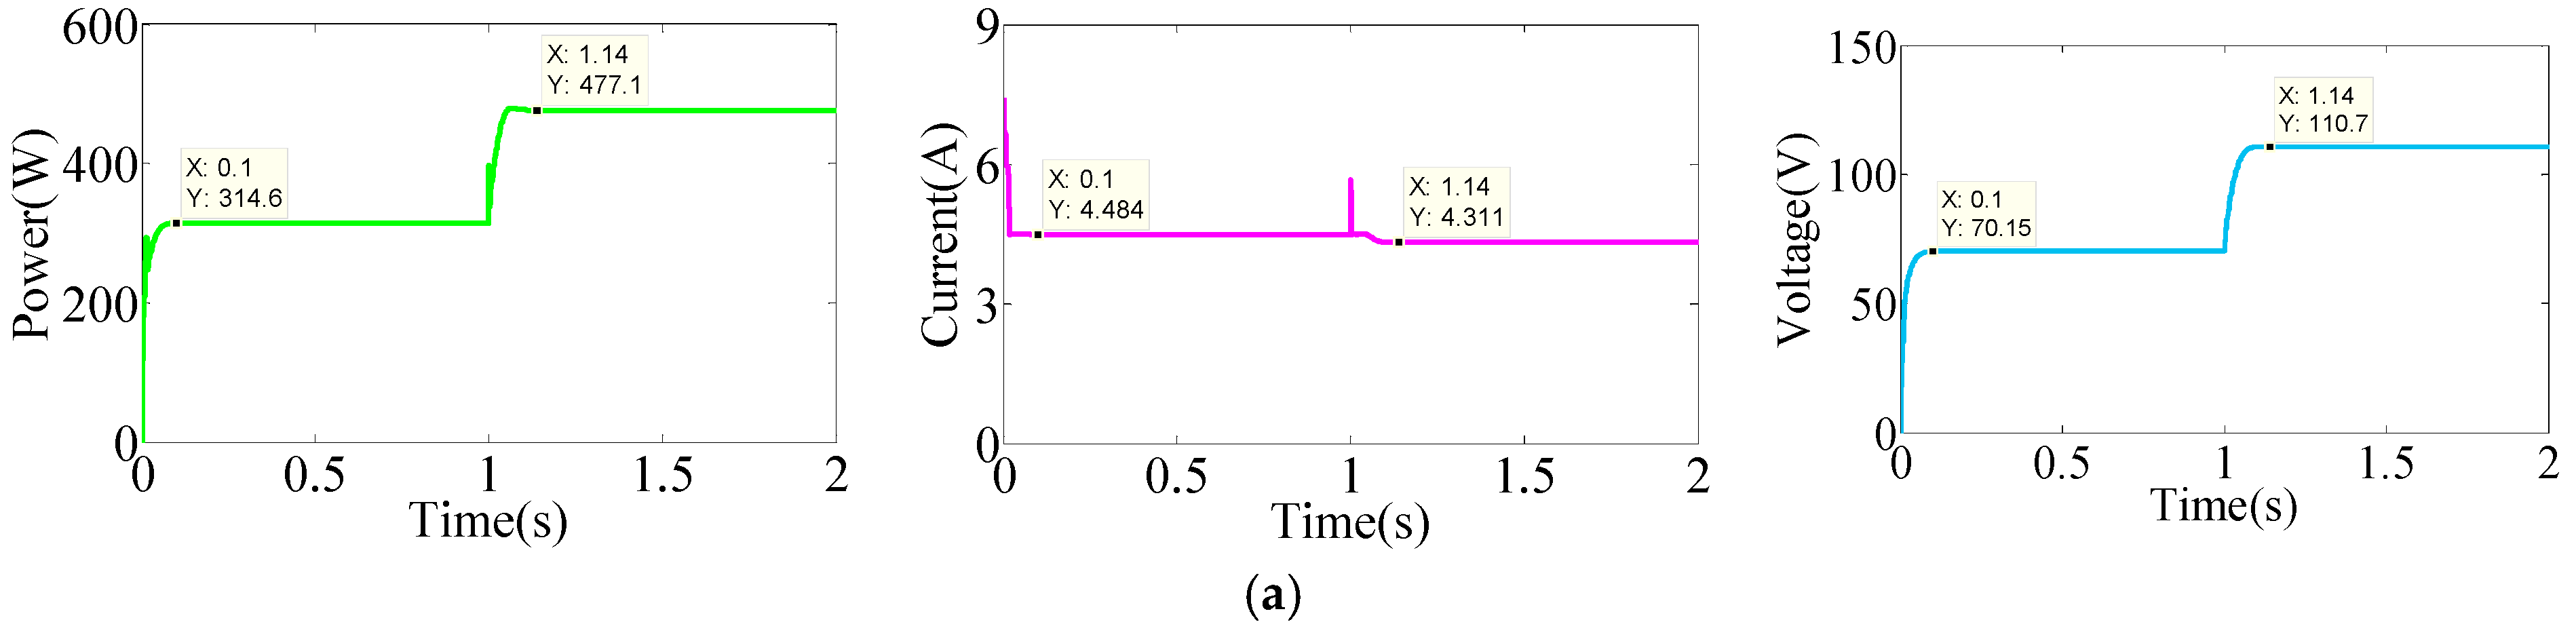
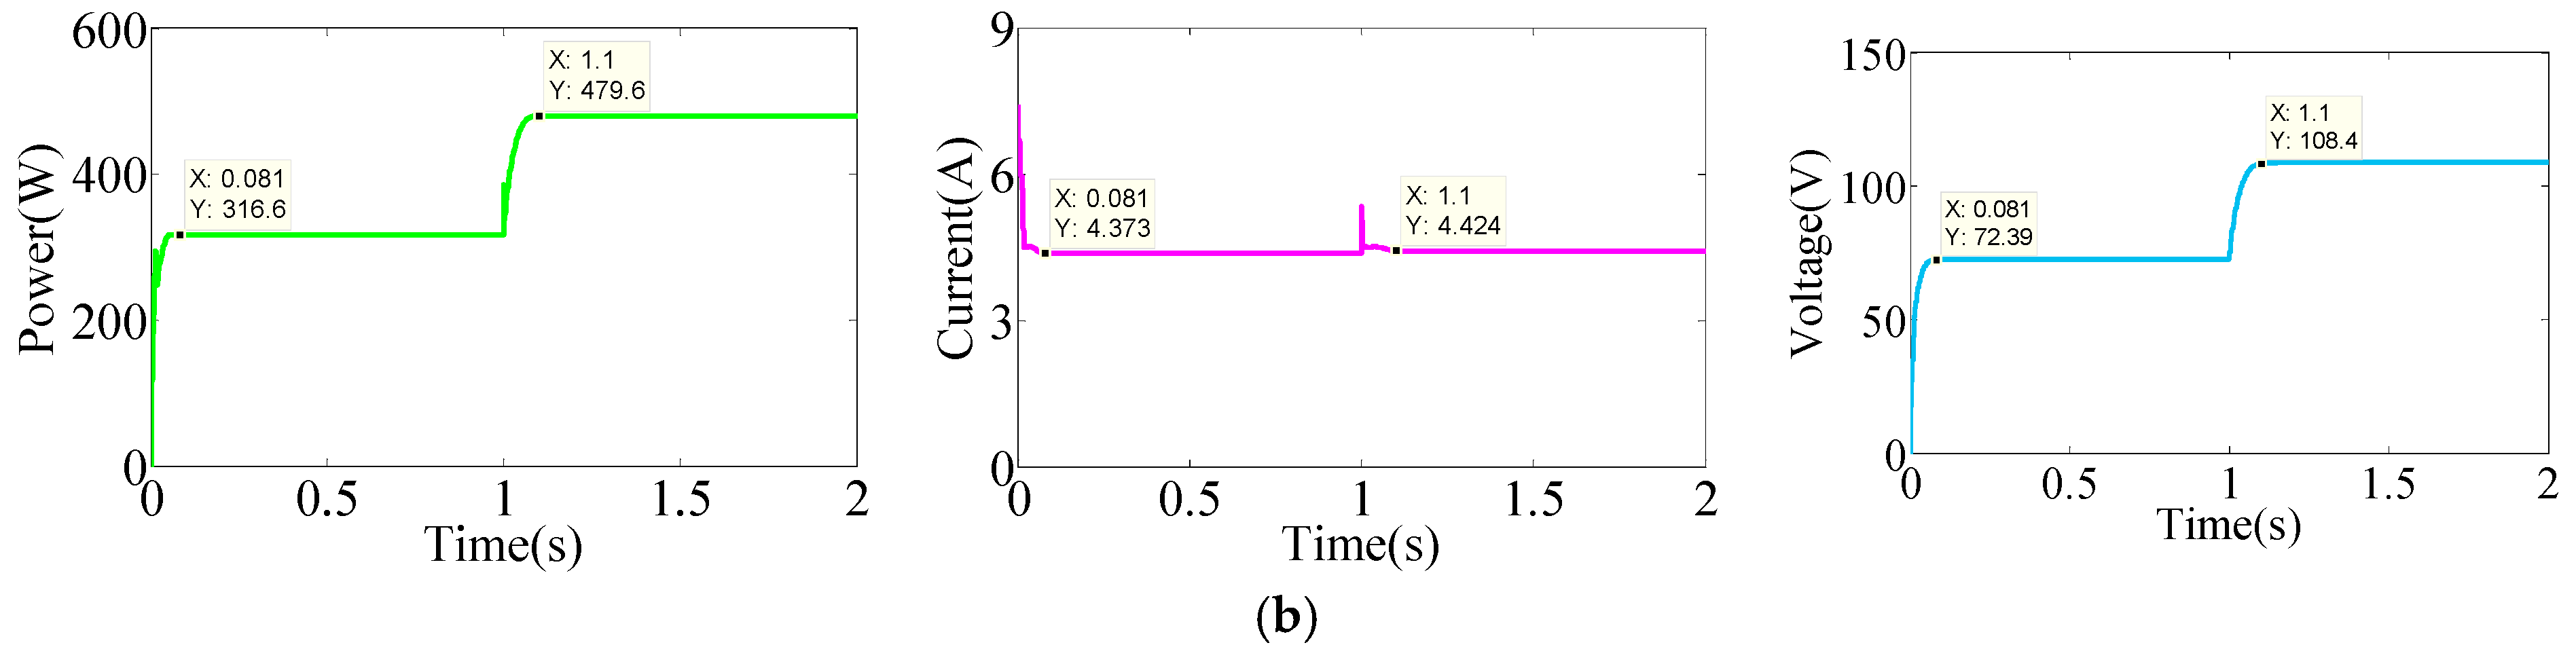
2 respectively. The corresponding global peak is located at 479.7 W and local peaks are situated at 243 W and 409 W. However, the MFPA settles to the global peak within 0.1 s. The FPA can also track the global peak, but it takes longer to converge and has more losses compared with MFPA. Power, current and voltage tracking curves of FPA and MFPA from strong to weak shading are shown as
Figure 11.
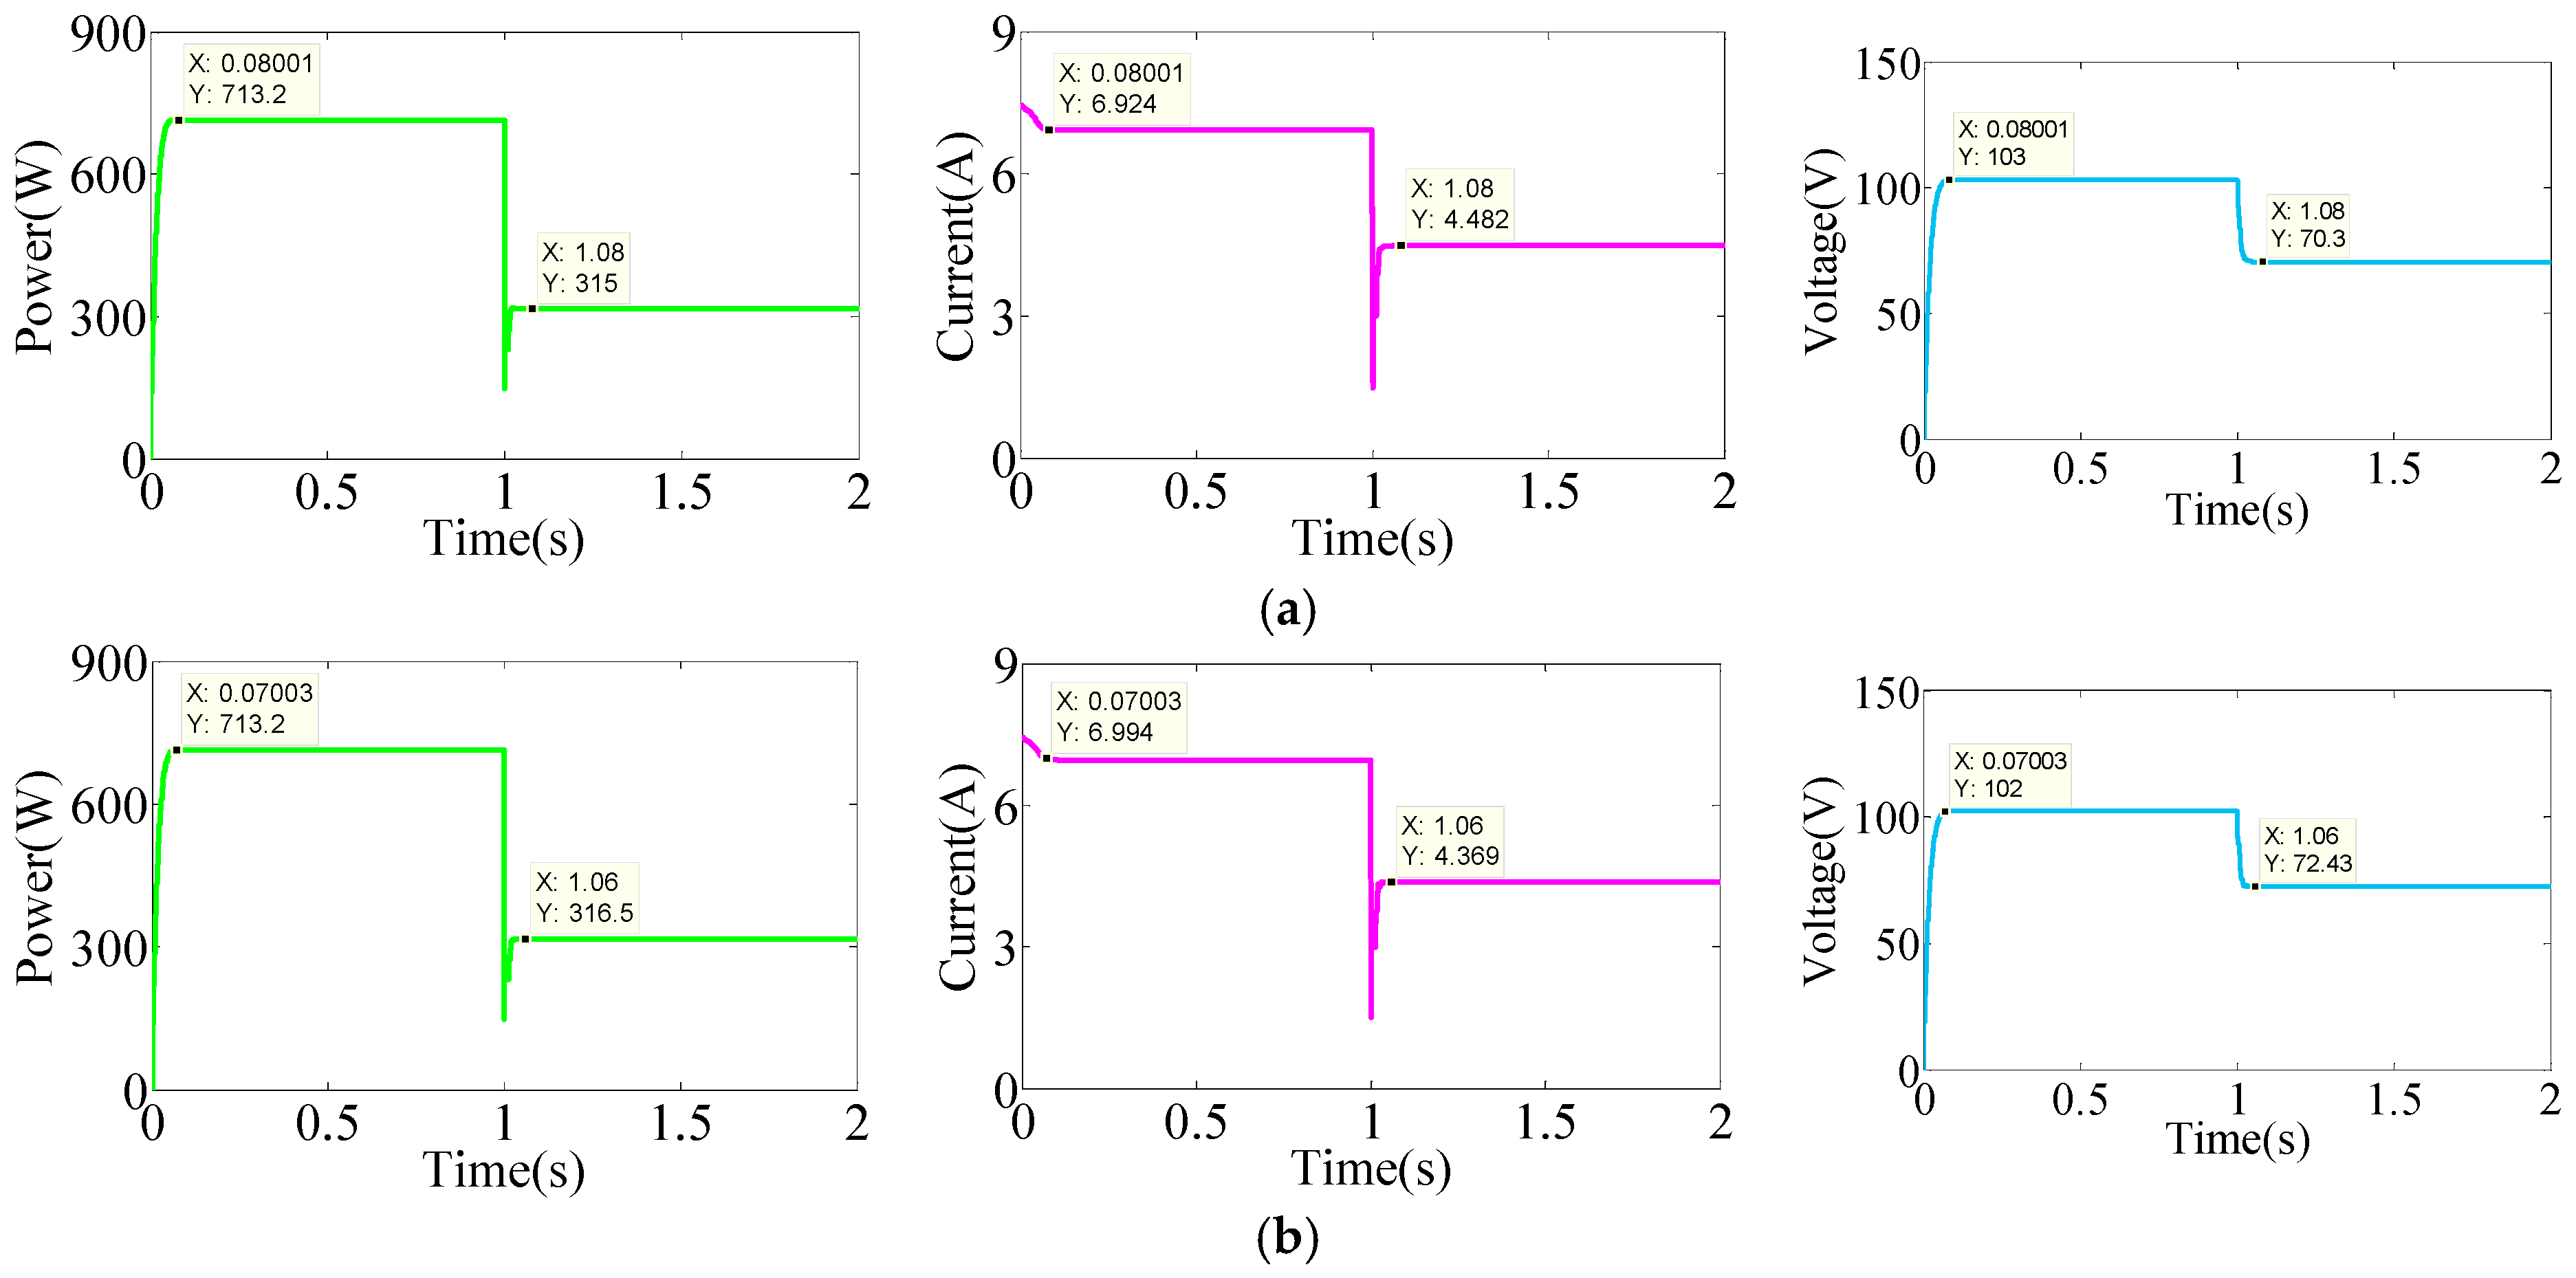
For the irradiation change from weak shading to strong shading, the PV system only receives one irradiation 1000 W/m
2 under weak shading at the beginning, which is considered a special form of weak shading. Global peak is located at 713.7 W. After 1 s, the PV system obtained the six different irradiations under strong shading, which is similar to the six kinds of irradiation mentioned earlier. Both the MFPA and FPA can reach to global maximum and they have favorable tracking performance with uniform irradiation in 0–1 s. But the FPA presents longer convergence time and lower convergence accuracy with the change of shading after 1 s. Power, current and voltage tracking curves of FPA and MFPA from weak to strong shading are shown as
Figure 12.
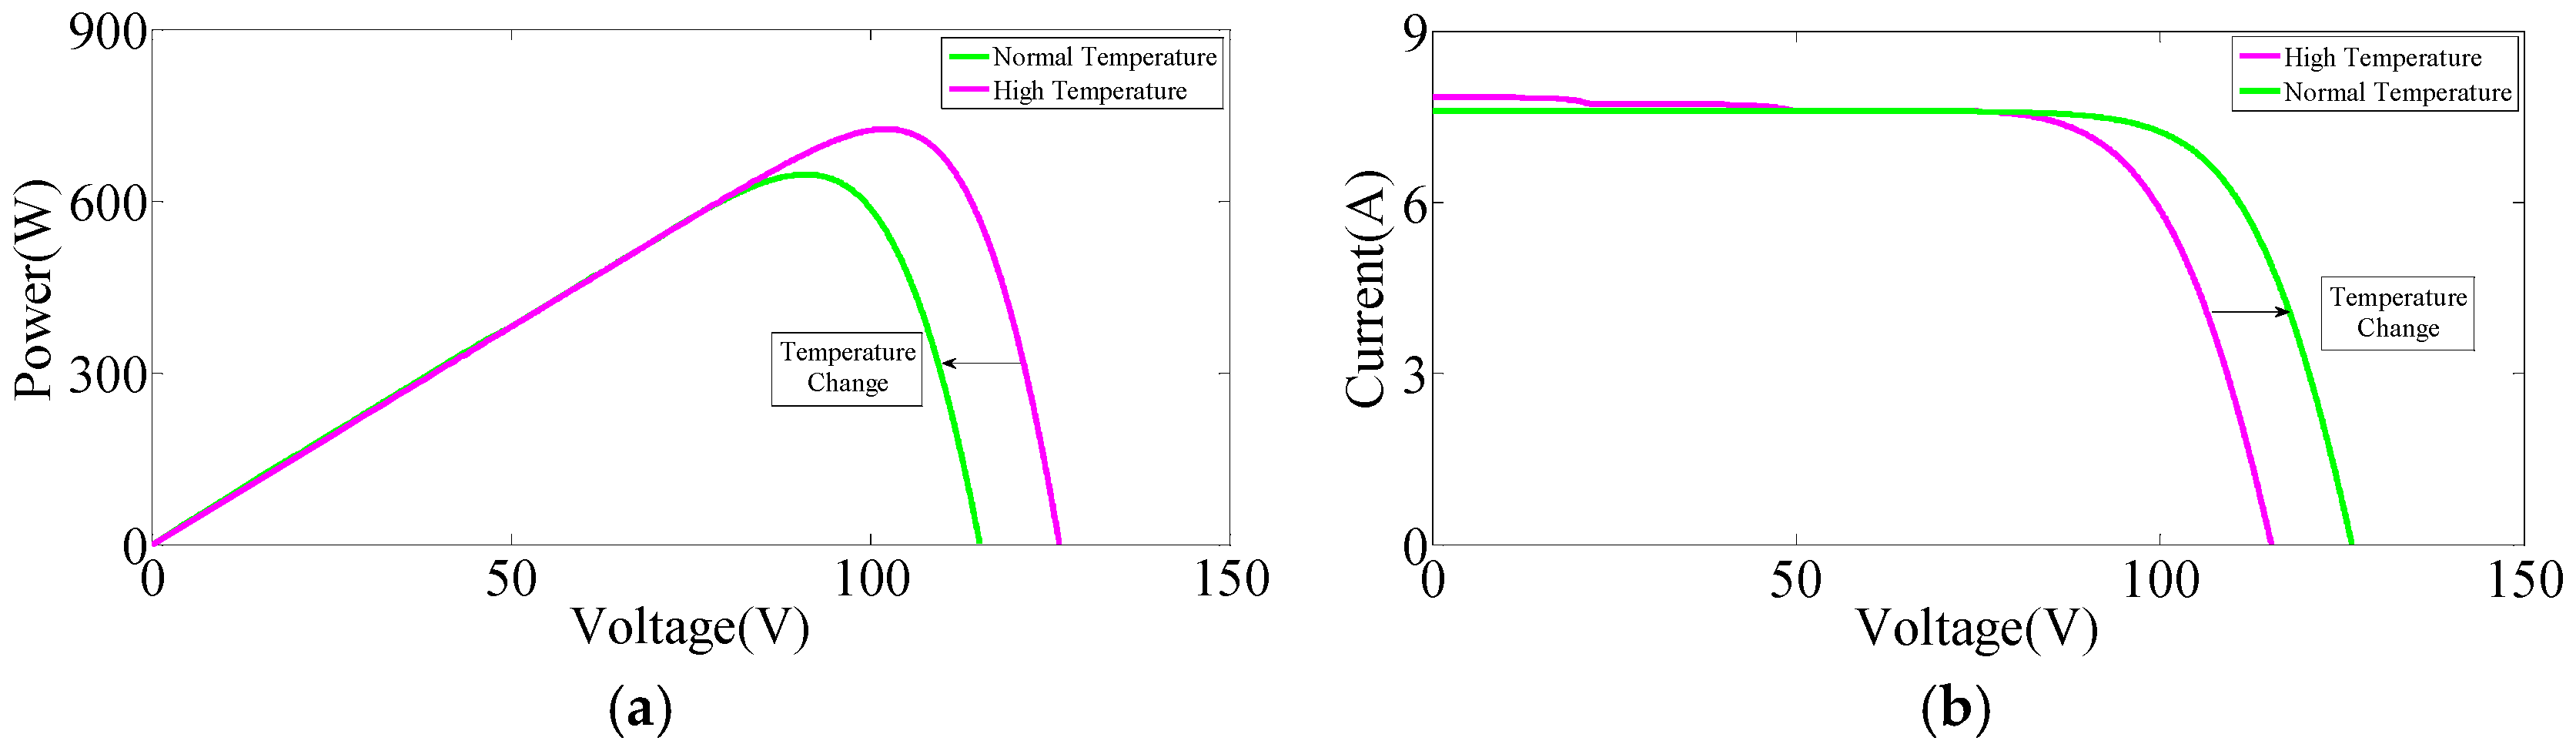
5.3. Variable Temperature Conditions
In this case, irradiation is always stabilized in 1000 W/m
2 and the temperature of the PV system is varied after 1 s. For experiment the situation, the PV array configuration is analogous as shown in
Figure 6. The output characteristics of the PV array for variable temperature is shown in
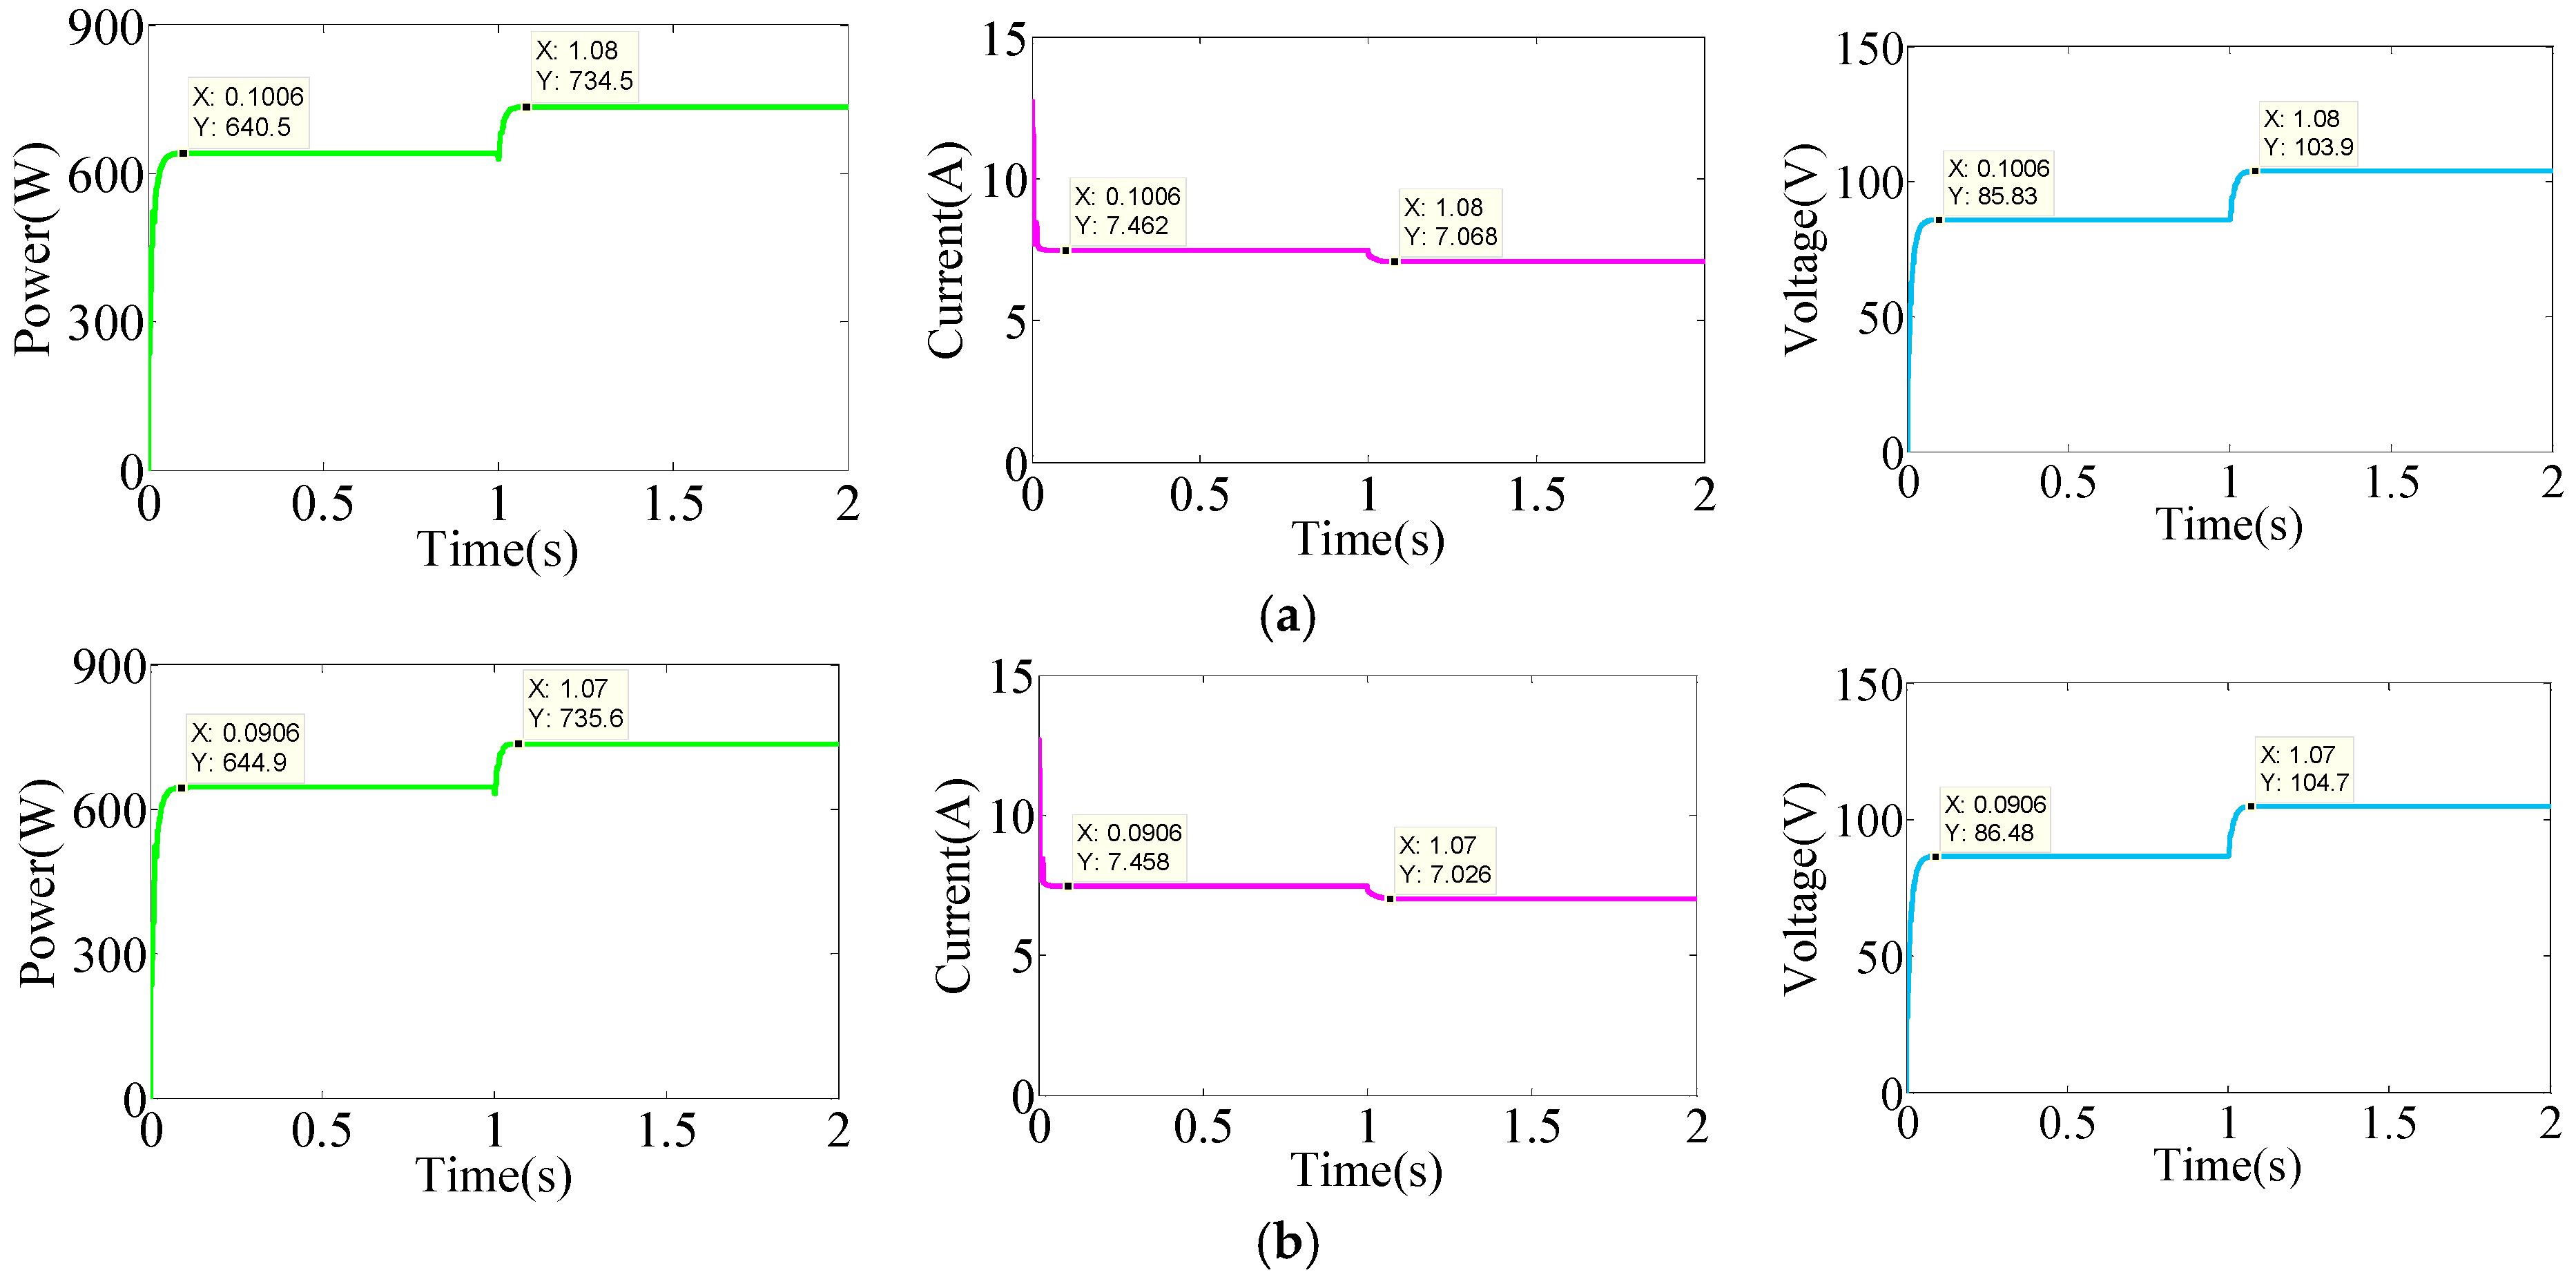
Figure 13. It is obvious that the PV system has only one peak when the temperature applied the system is non-uniform. Initial temperatures are set to 75 °C, 50 °C and 25 °C, and uniform temperature as 20 °C is exploited after 1 s. At the two stages, the global peaks are arranged at 647 W and 736.5 W, respectively. Throughout the tracking process, both MFPA and FPA have tracked the global maximum. However, the MFPA’s tracking result exhibits better robustness. It is noteworthy to mention that when the operating temperature of the PV system is decreased, the output power and voltage of the system increase, and the current drops slightly. Power, current and voltage tracking curves of FPA and MFPA for change temperature are shown as
Figure 14.
5.4. Partial Shading Conditions
Real working environment data for the PV system were collected in the day with the fastest weather change in the local PV power station at Gansu, China. The number of hours of irradiation were 12 on the day with the average ambient temperature as 30.08 °C and the average irradiation as 690.75 W/m
2. In the station, the PV array received simultaneously at the most three different combinations of temperature and irradiation on the day, which are respectively 1000 W/m
2 and 45 °C, 700 W/m
2 and 40 °C, 500 W/m
2 and 35 °C. For verifying the effectiveness of the proposed method, the aforementioned real environment data are applied to the PV array possessing homothetic configuration as shown
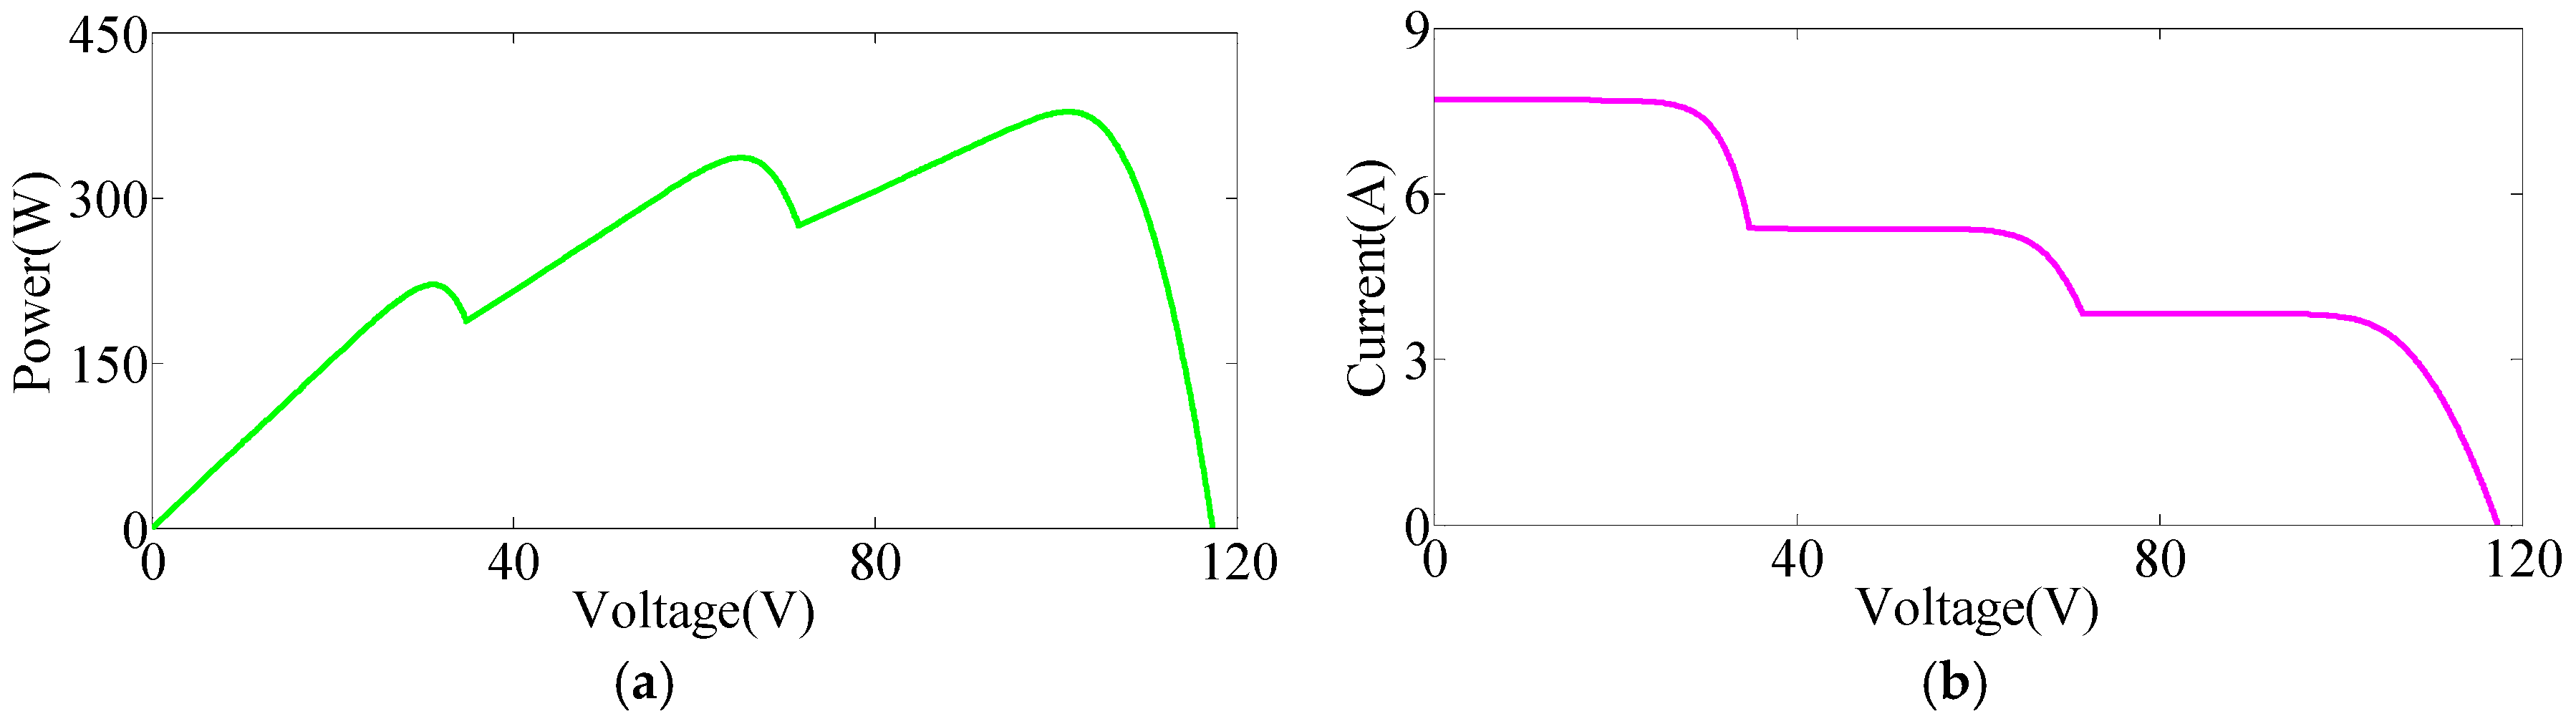
Figure 6. The output characteristics of the PV array for partial shading conditions are shown in
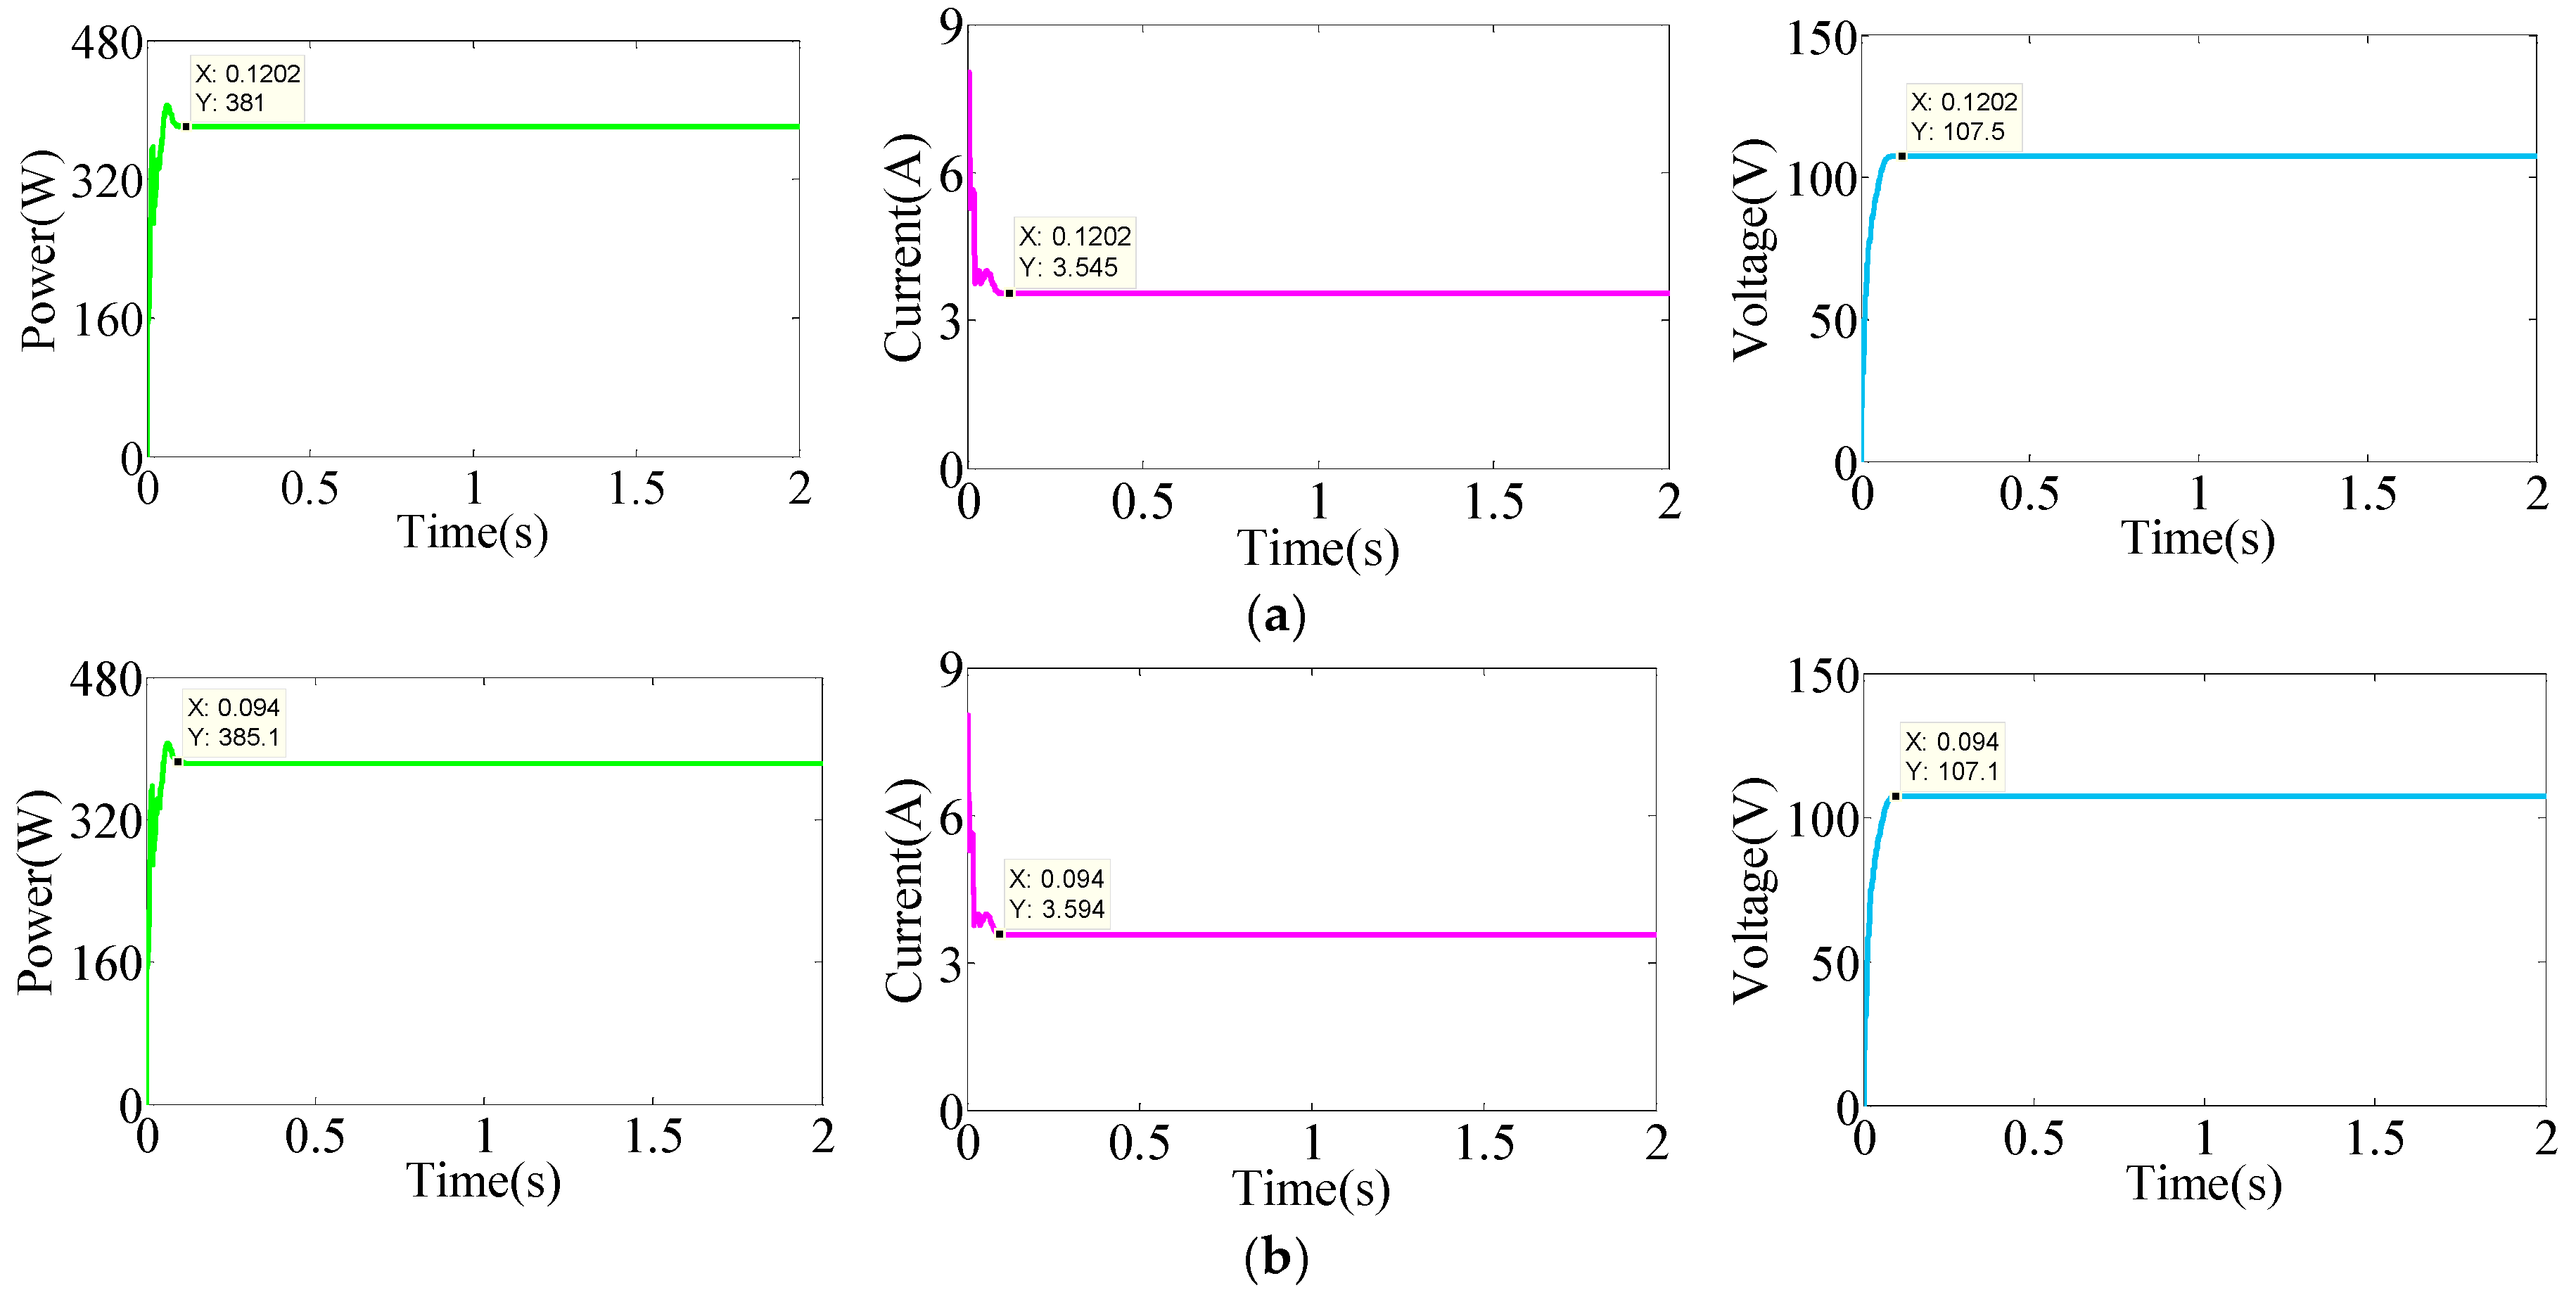
Figure 15. It can be seen from the output P-V characteristic curve that three peaks are observed corresponding respectively to different operating points. The global peak is settled to 385.7 W, and the other local peaks are positioned at 231.4 W and 351.1 W. Still, the MFPA method can rapidly and accurately focus on the global peak. However, FPA can also recognize the global maximum, but it is obvious that its tracking result with a large power loss is more unsatisfactory using actual environmental data. The power, current and voltage tracking curves of FPA and MFPA for partial shading conditions are shown as
Figure 16.
6. Conclusions
In the work, a modified flower pollination algorithm has been employed to track the MPP for the PV system. This proposed method not only preserves the unique randomness characteristic of the FPA, but also dual-mode optimization is carried out according to population fitness values, which is no longer limited only by the control of switch probability. Further, the simple structure and low complexity of the proposed method are the key merits to implement MPPT for a PV system. The performance of the MFPA method compared with P&O method and FPA is validated based on MATLAB/Simulink platform under all experimental protocols (different irradiation levels, variable irradiation, variable temperature and partial shading). Results show that the proposed method has faster tracking speed and higher convergence accuracy, especially under strong irradiation level and partial shading conditions. Although this proposed method has successfully achieved the expected objective, the series-parallel structure of the PV array is only considered for MPPT implementation of the PV system. Based on the above, we need to further study the MPPT problem with non-uniform irradiation and temperature under the different configurations of the PV array in the future.


