Effect of Intermediate Principal Stress on the Strength, Deformation, and Permeability of Sandstone


 ,
, 
Abstract
1. Introduction
2. Instruments Used and Methodology
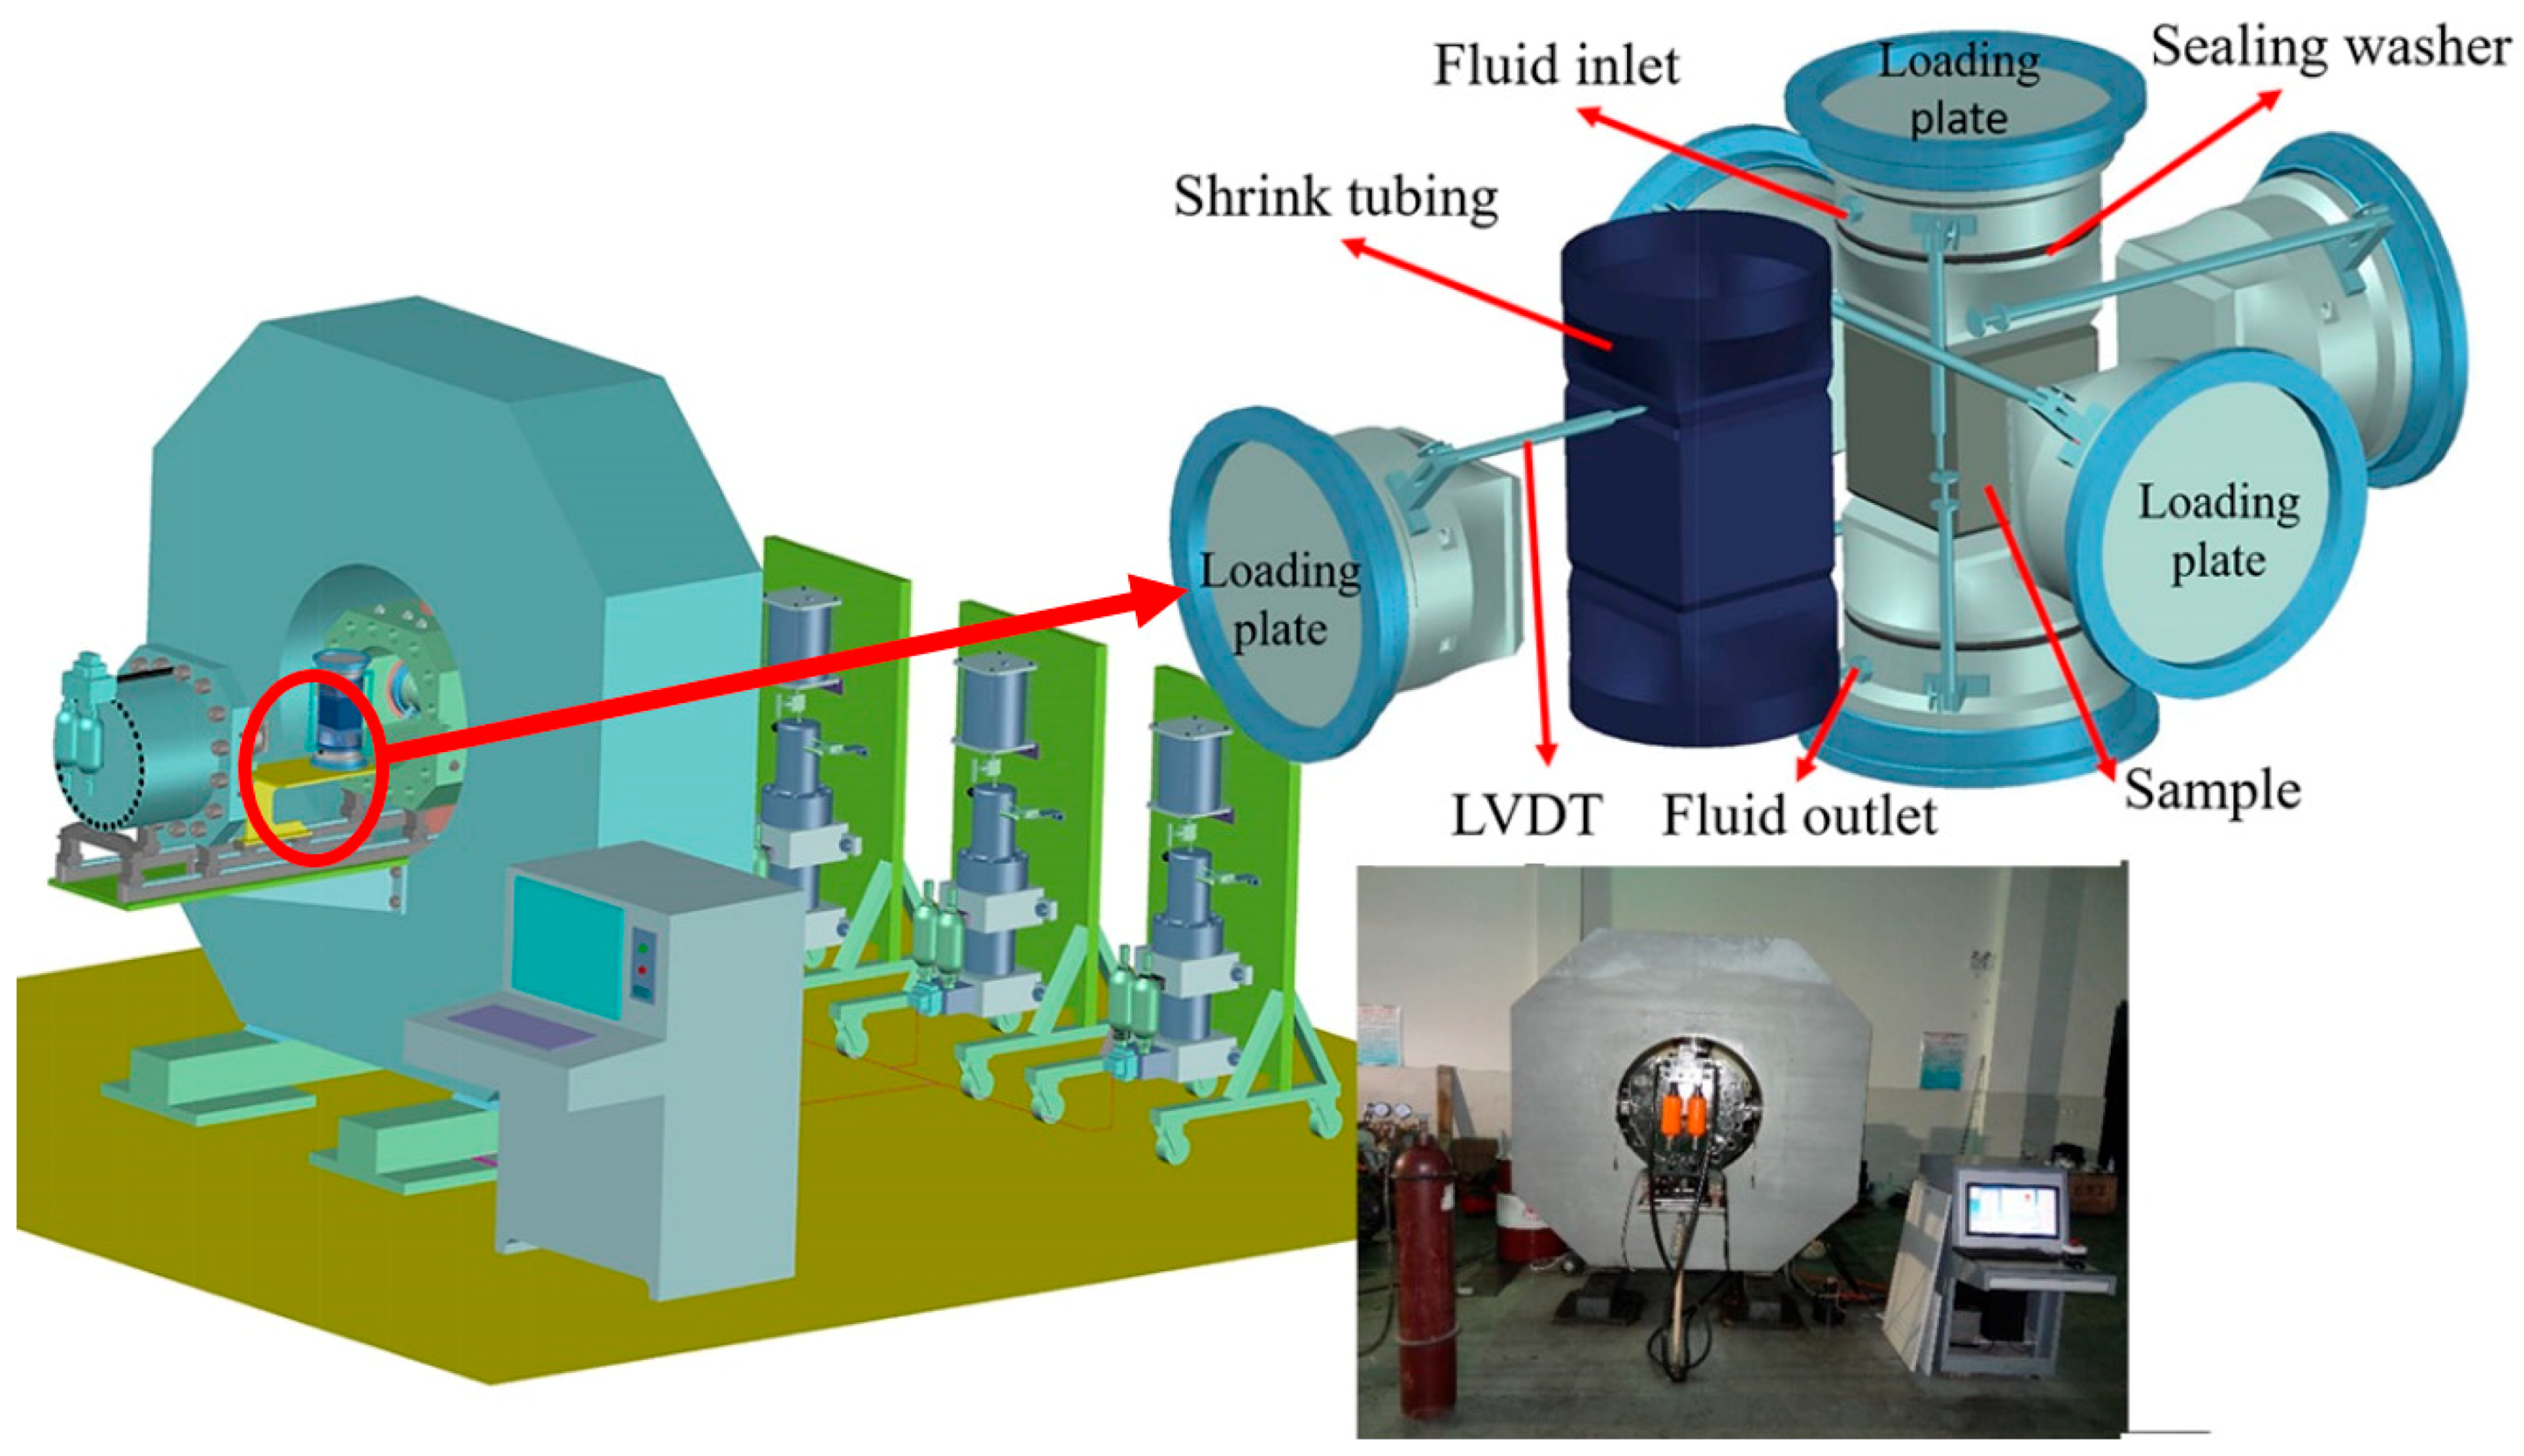
2.1. Experimental Apparatus
2.2. Experimental Scheme
2.3. Specimen Preparation for the True-Triaxial Experiment
3. Results and Discussion
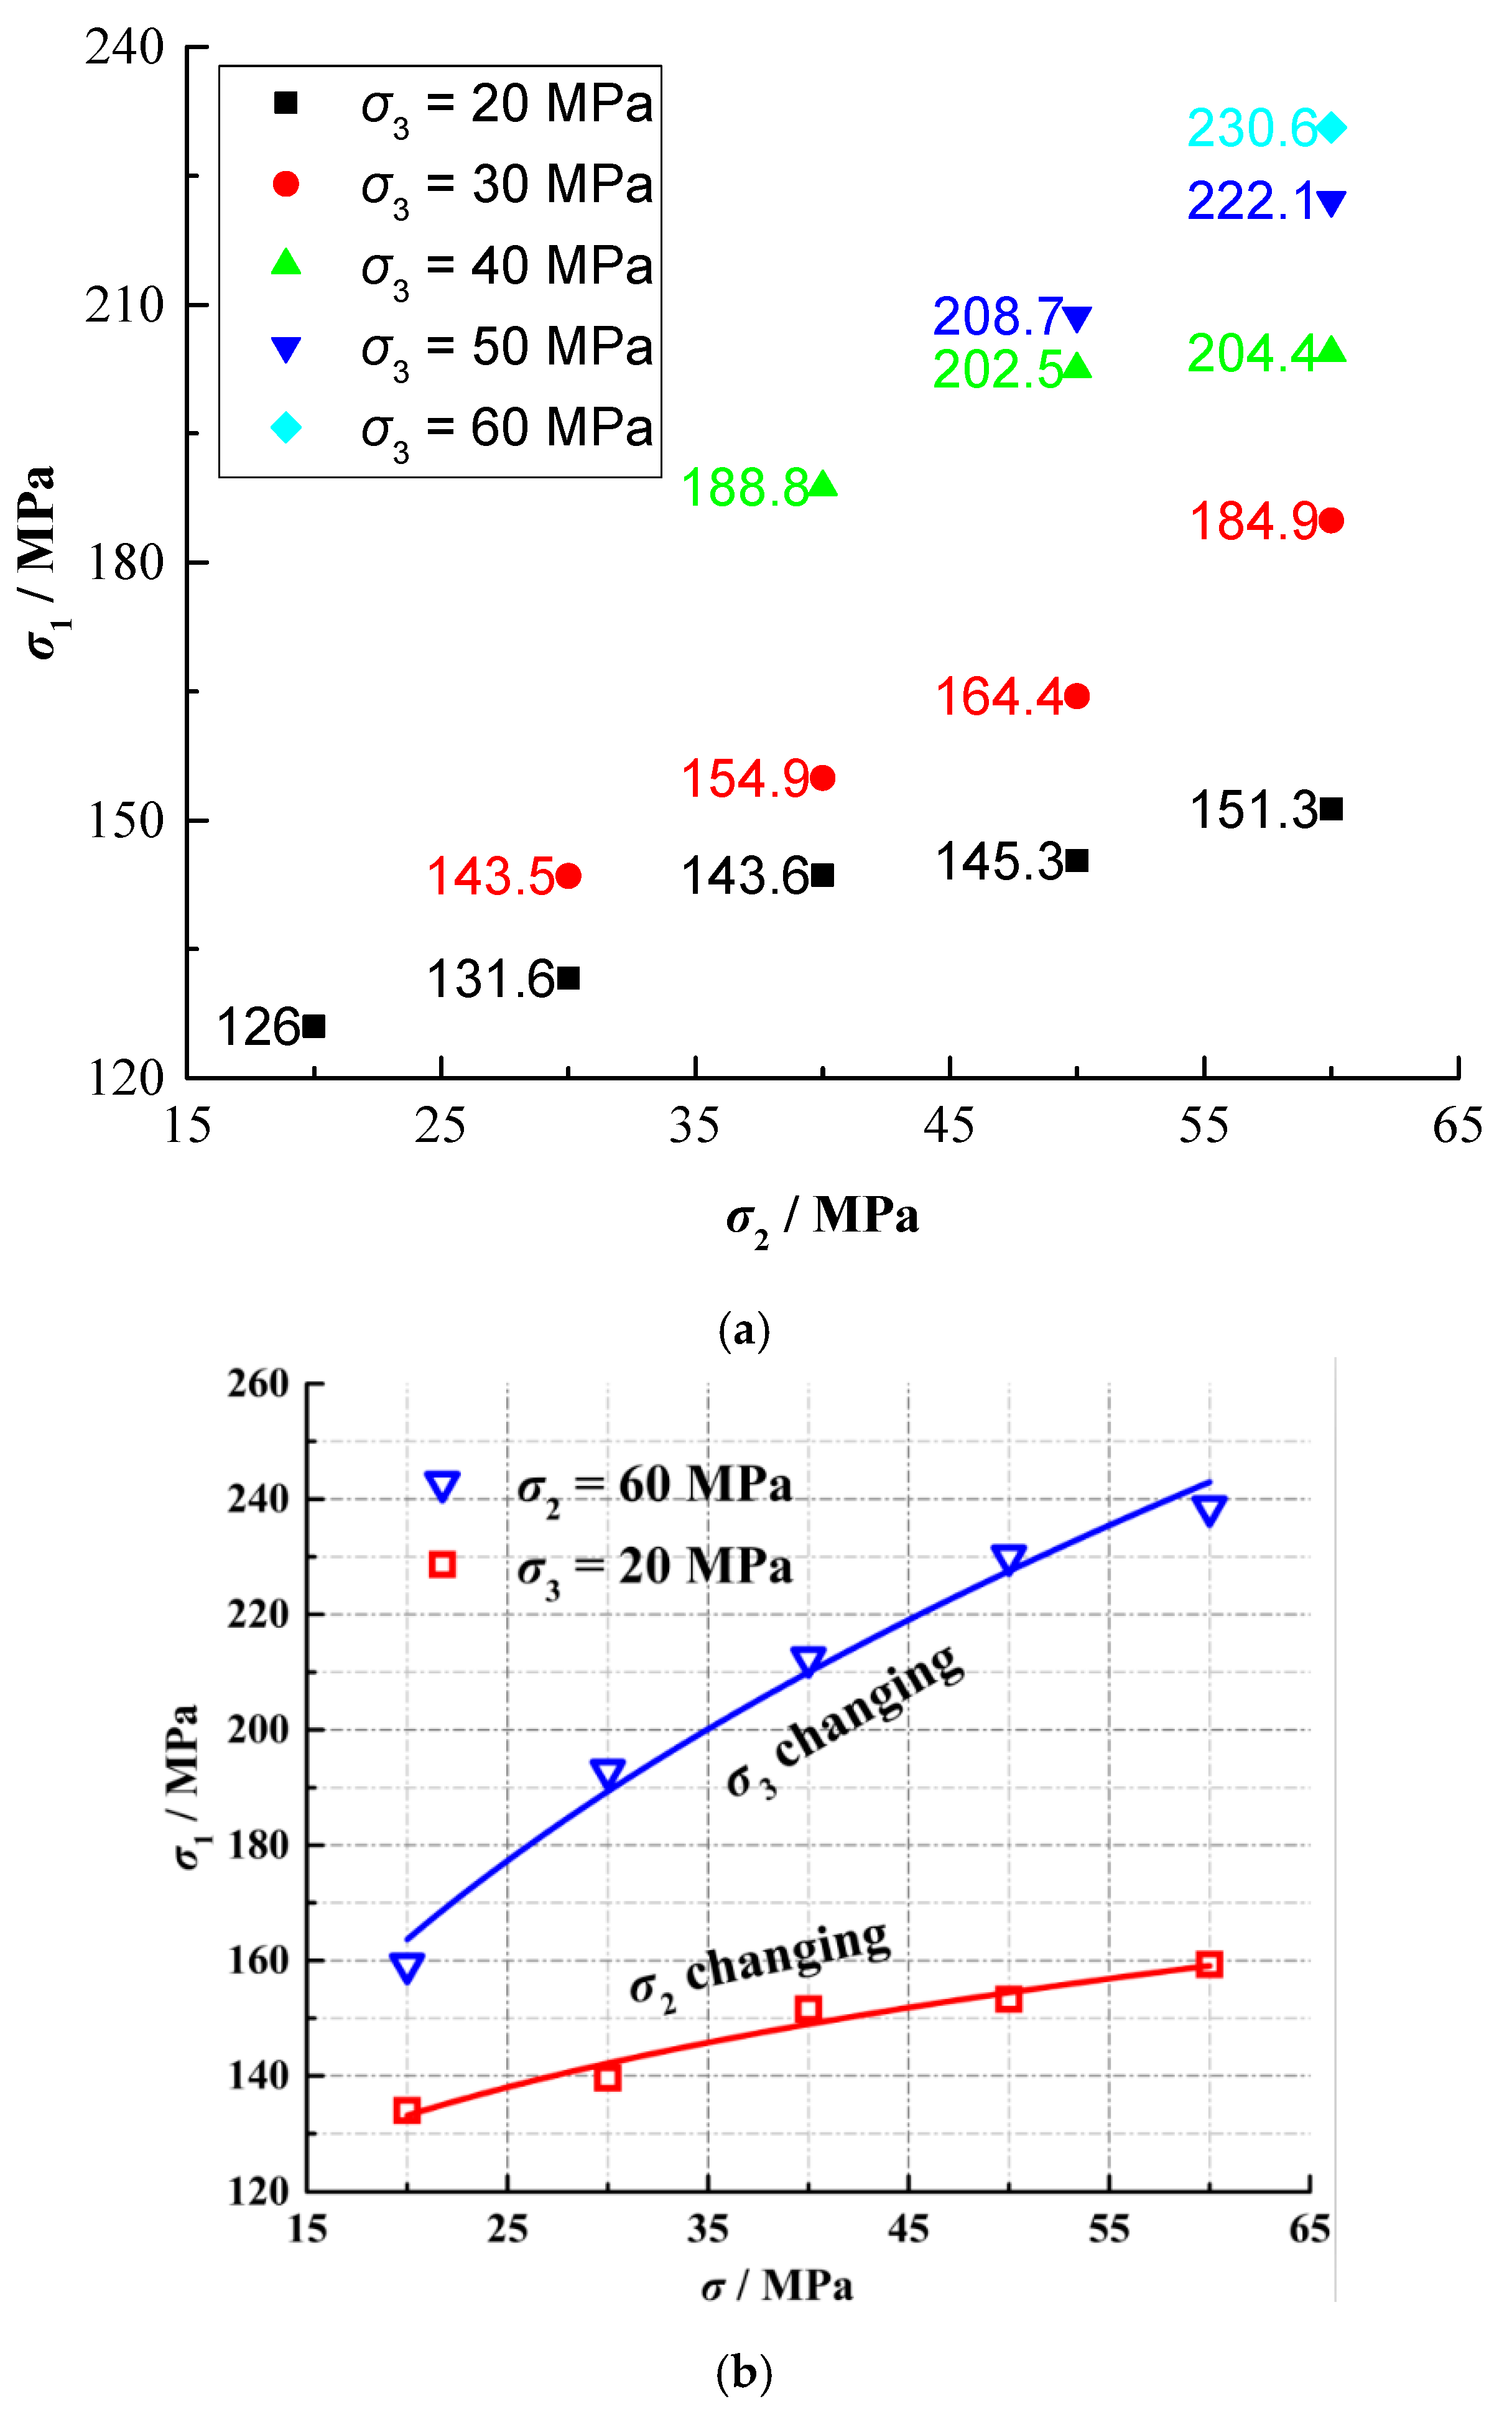
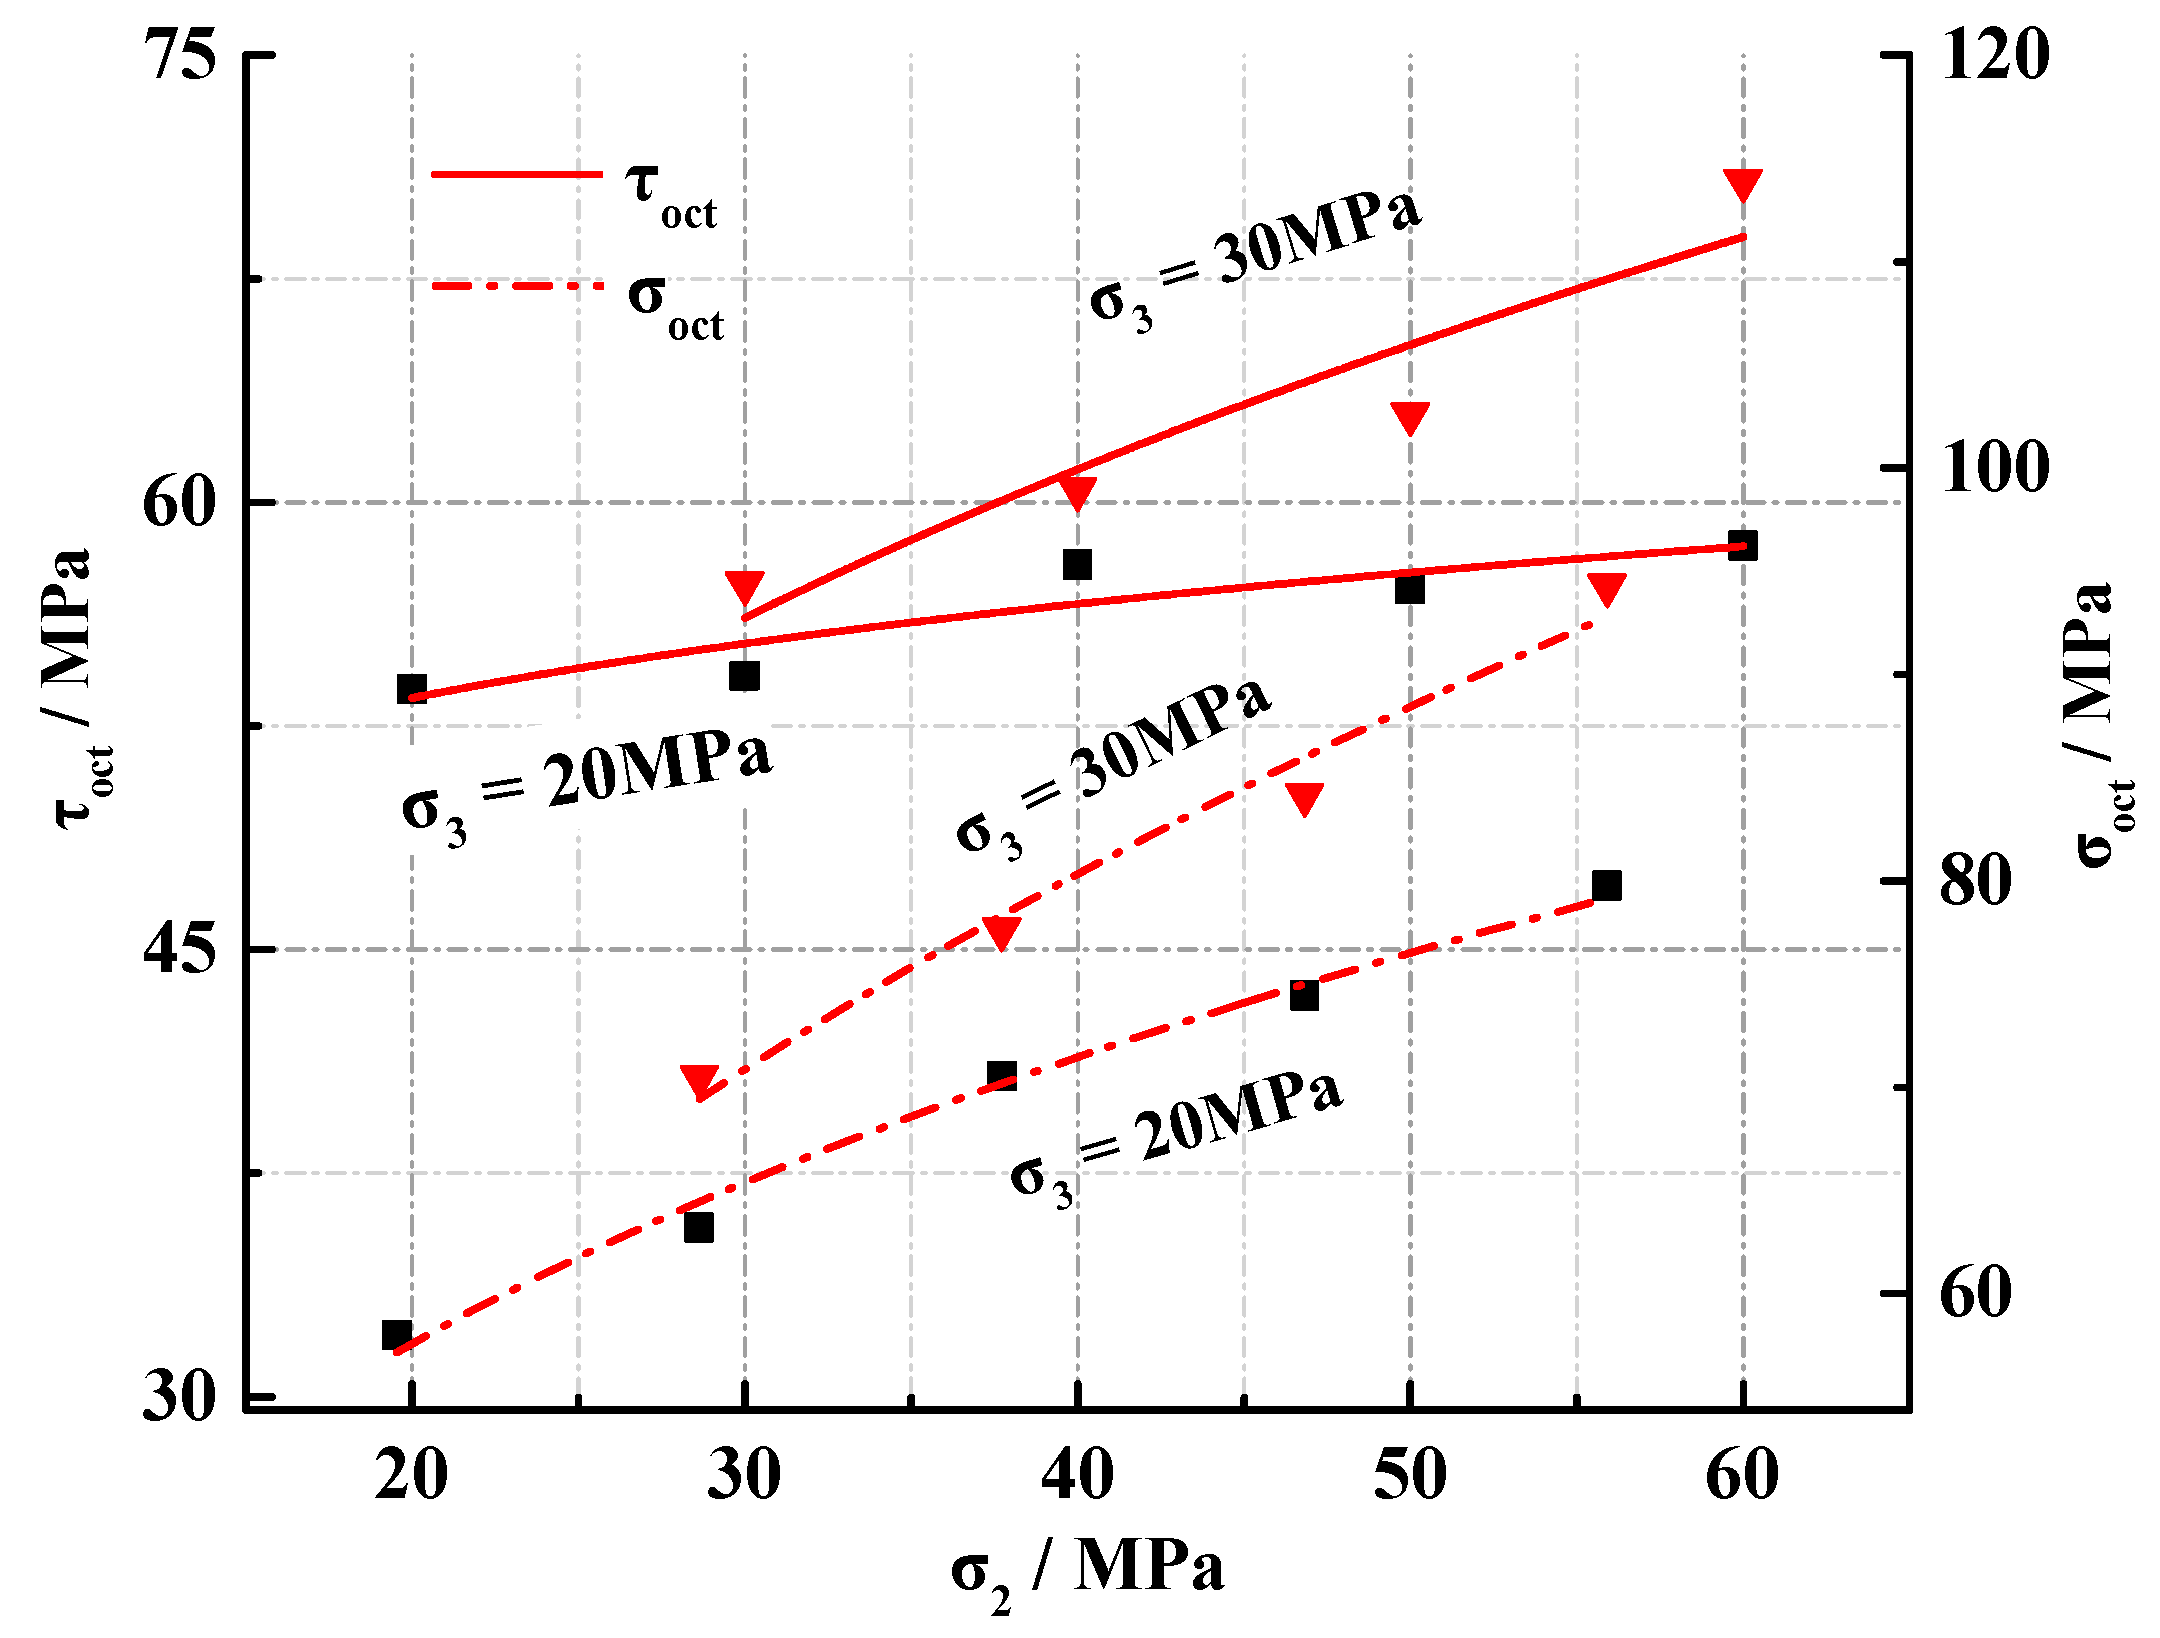
3.1. Effect of Intermediate Principal Stress on Rock Strength
3.2. Effect of Intermediate Principal Stress on Rock Deformation
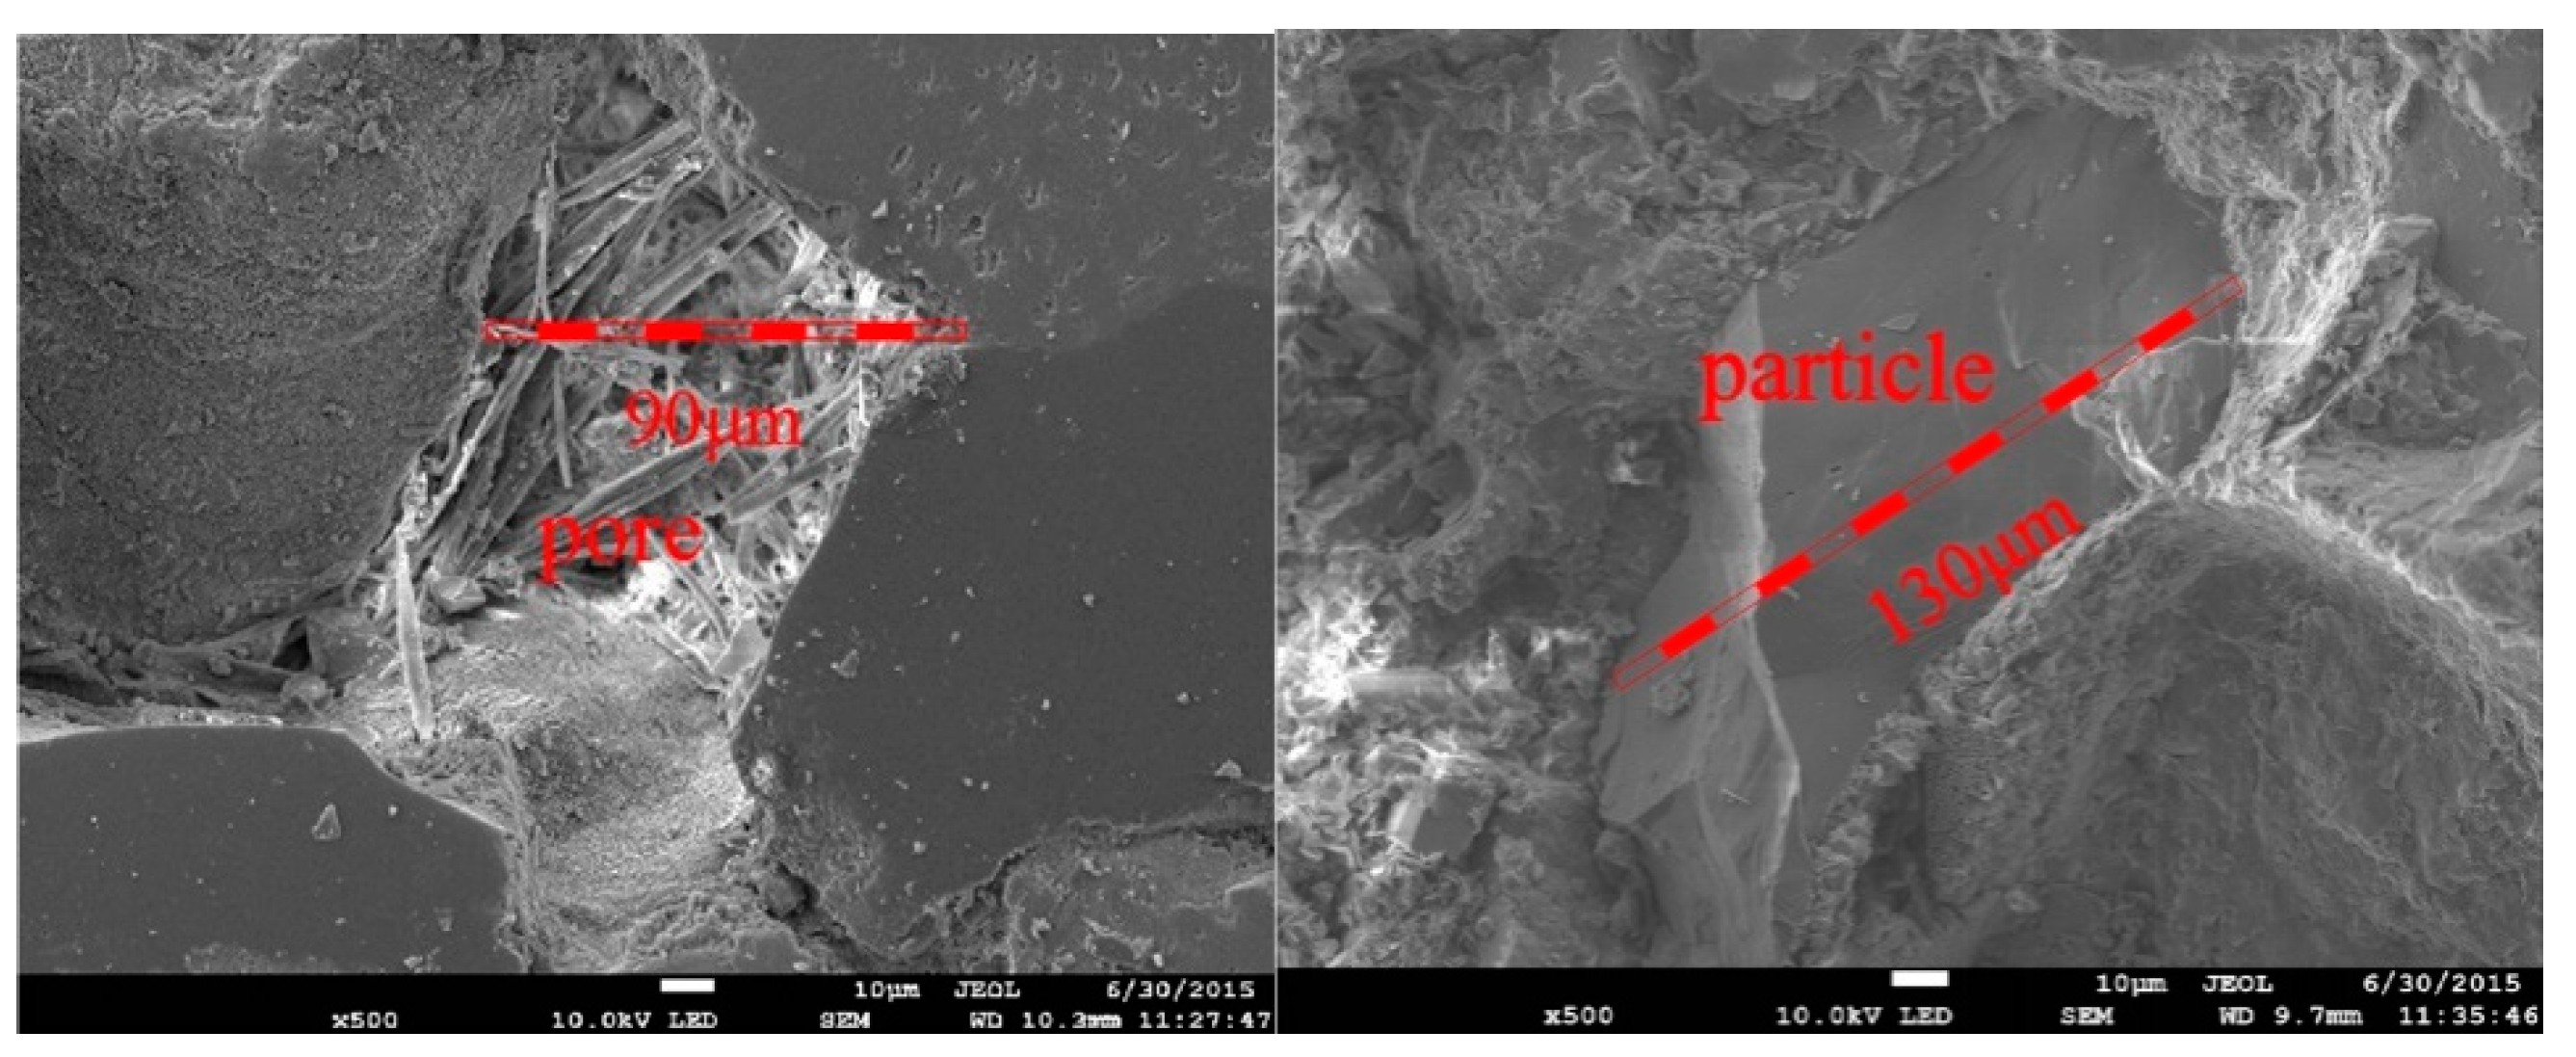
3.3. Effect of Intermediate Principal Stress on the Transport Properties of the Sandstone
4. Conclusions
- (1)
- The peak strength, octahedral shear stress, and octahedral effective normal stress of the sandstone increased with increasing σ2. However, the rate of increase decreased with increasing σ2. This is because the relatively high intermediate principal stress coefficient b has an inhibitory effect on rock strength.
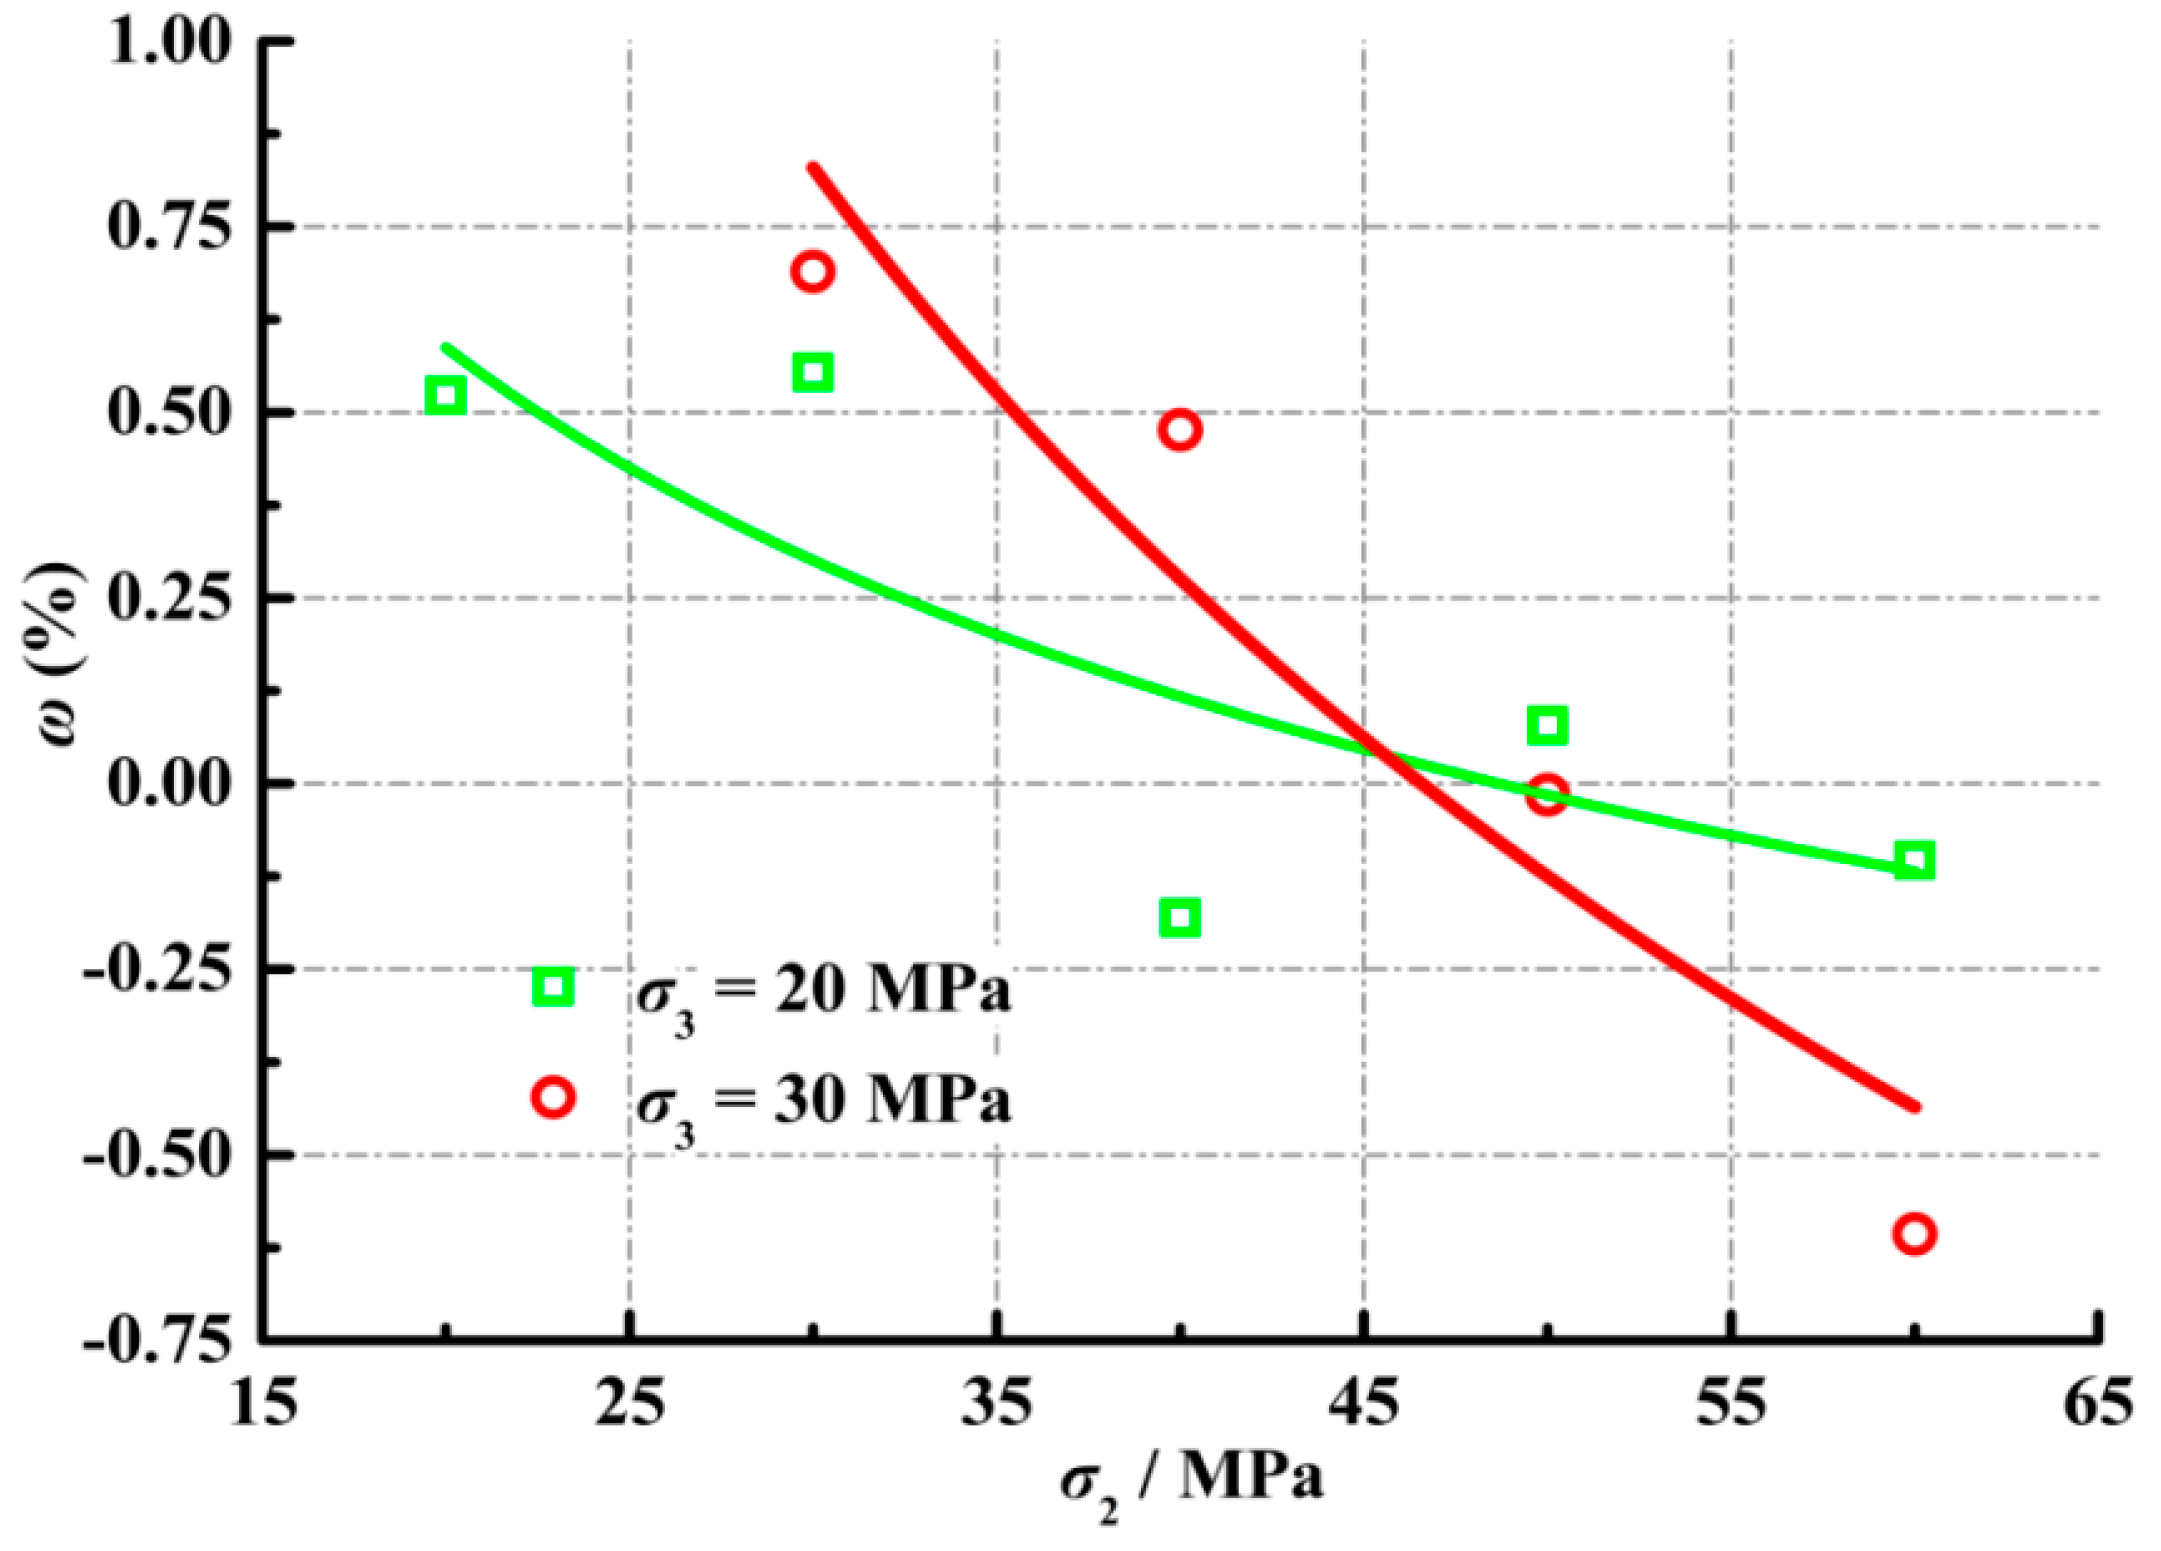
- (2)
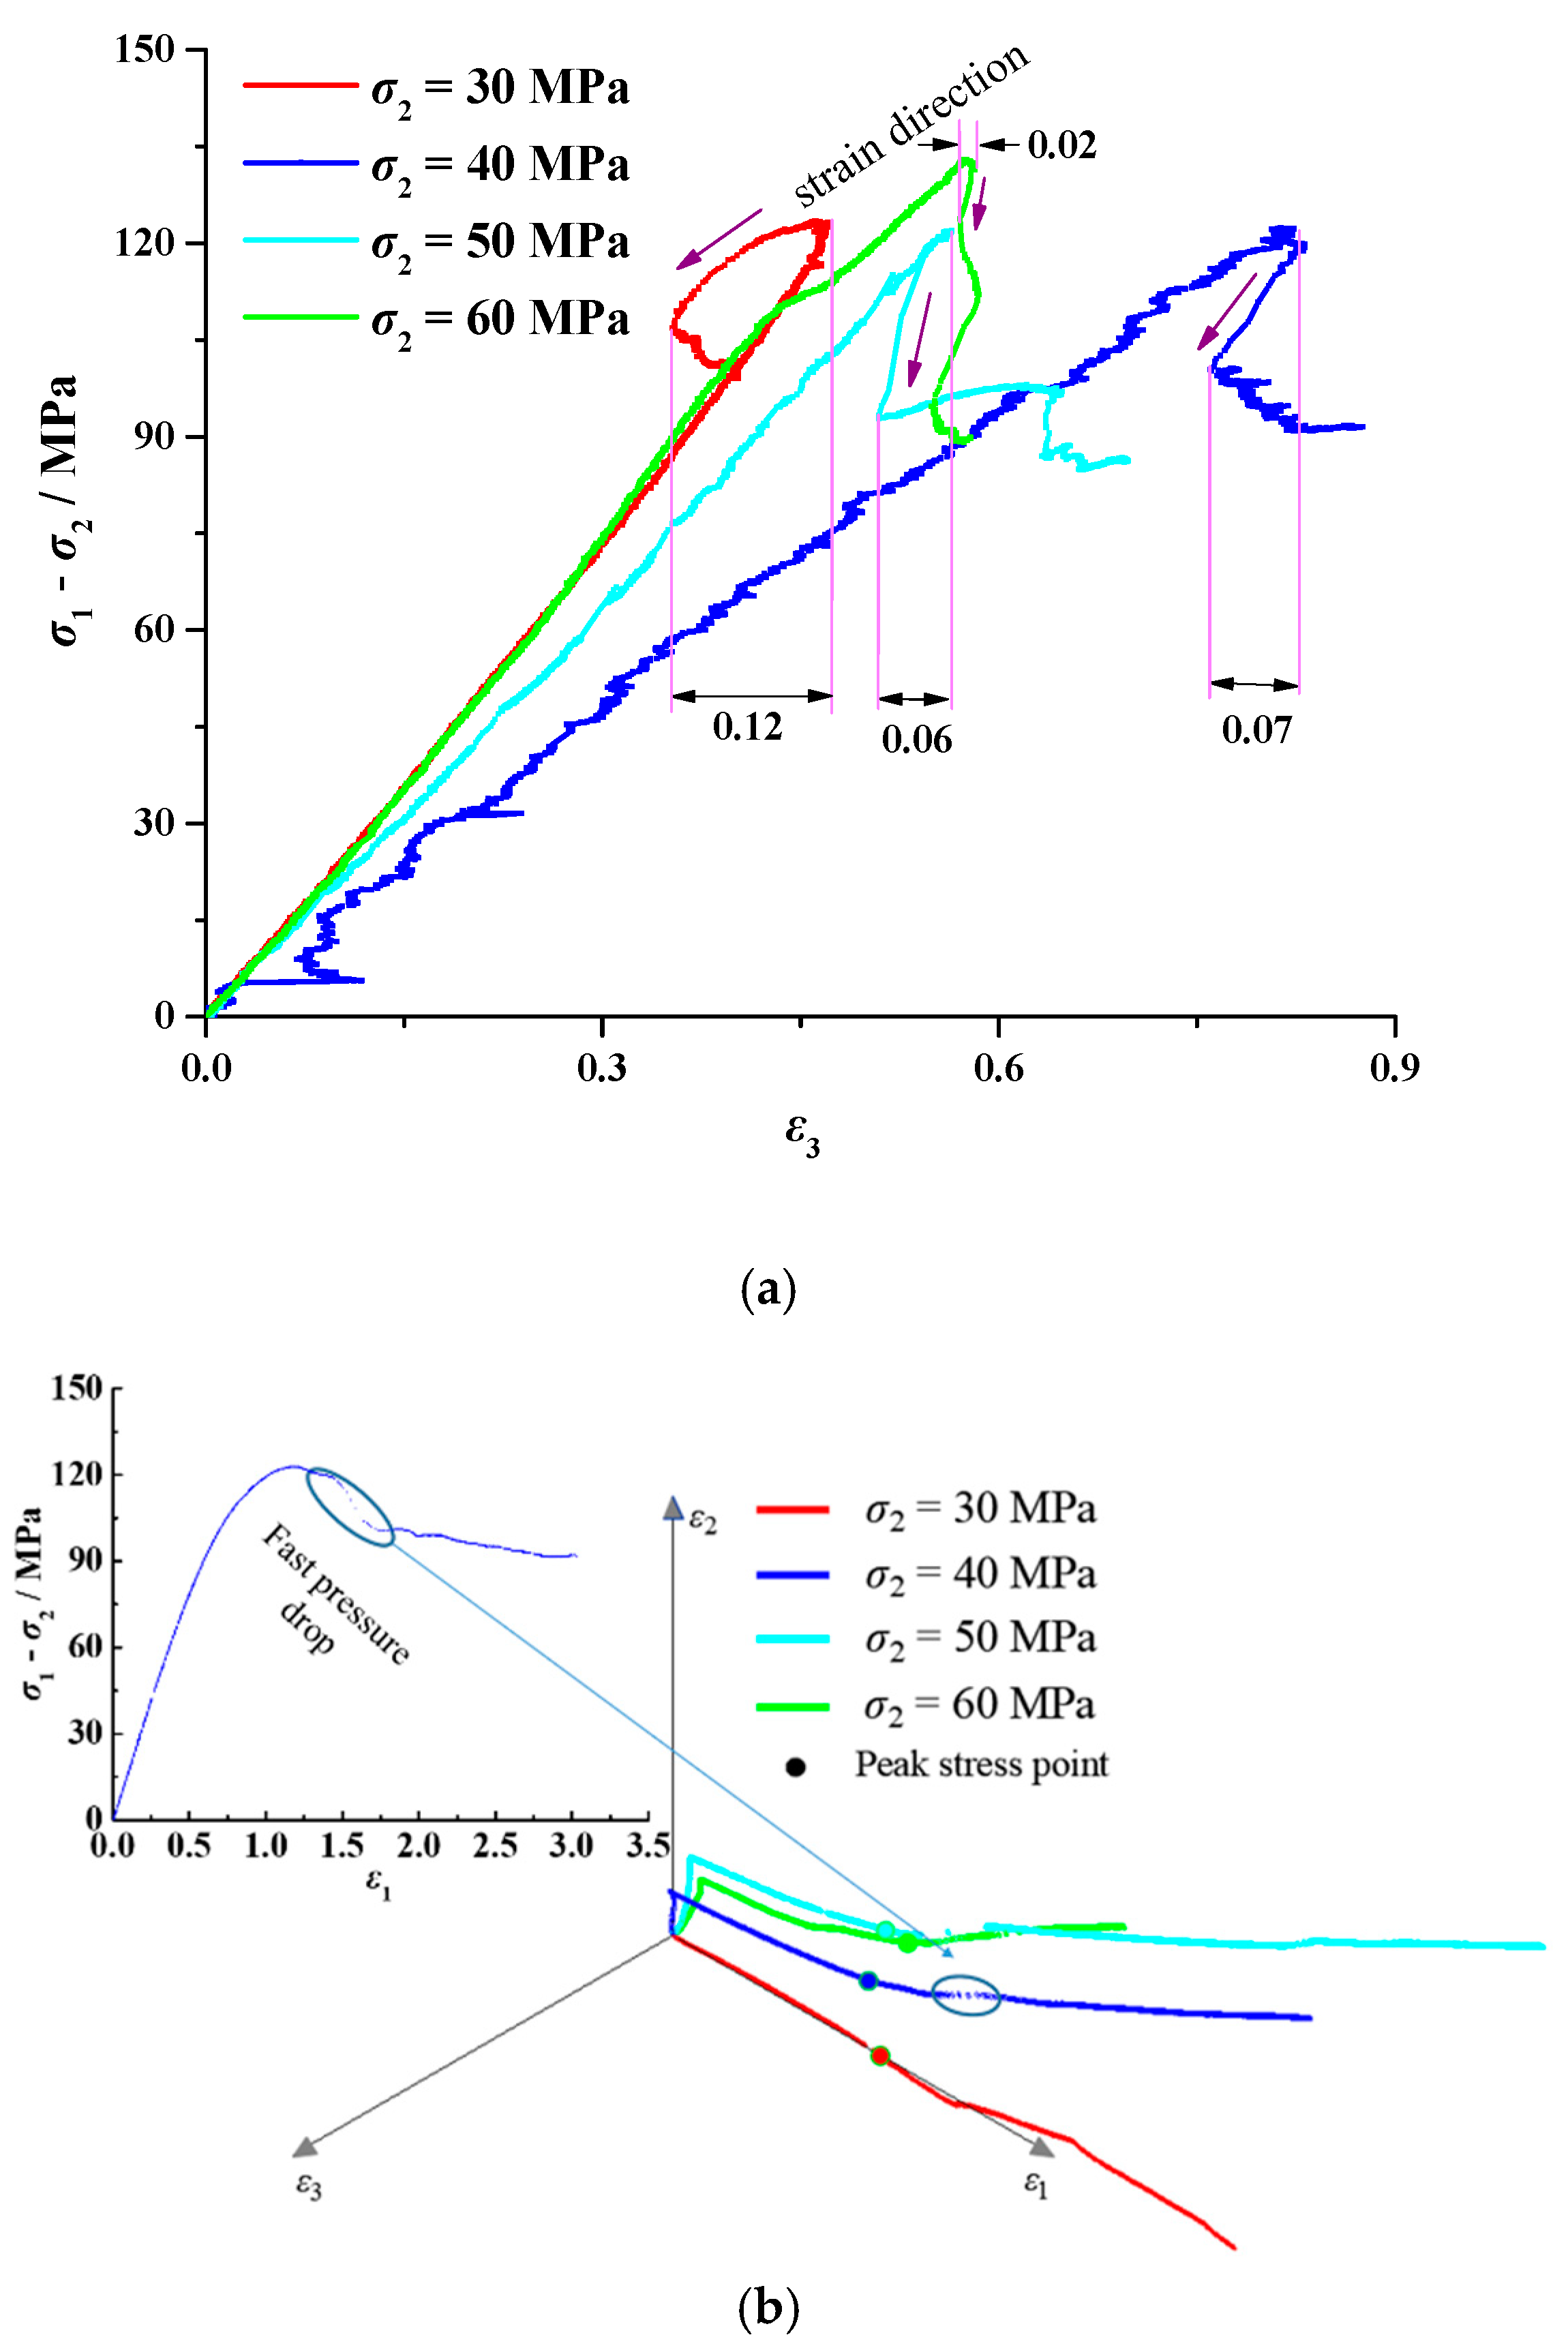
- As the ratio of σ2/σ3 increased, the specimen entered compressive strain in the σ2 direction during the first stress drop, when the compression exponentially increased with the increasing stress ratio.
- (3)
- Stress and strain deviation occurred during the loading period. This phenomenon indicates that elastic mechanics are not suitable for analyzing this sandstone rock from a macro view.
- (4)
- During the complete true triaxial stress–strain experiments, the variation in gas seepage velocity could be divided into two stages. Before the first pressure drop, the gas seepage velocity was mainly affected by volume strain. After the first pressure drop, the seepage velocity was affected by the deviator strain, which can change the seepage channels.
Author Contributions
Funding
Conflicts of Interest
Symbols
| σ1 | Maximum principal stress |
| σ2 | Intermediate principal stress |
| σ3 | Minimum principal stress |
| b | Intermediate principal stress coefficient, |
| σoct | Octahedral normal stress |
| τoct | Octahedral shear stress |
| Δε | Deformation during the first stress drop |
| ω | Δε/ε2 |
References
- Bagalkot, N.; Zare, A.; Kumar, G. Influence of Fracture Heterogeneity Using Linear Congruential Generator (LCG) on the Thermal Front Propagation in a Single Geothermal Fracture-Rock Matrix System. Energies 2018, 11, 916. [Google Scholar] [CrossRef]
- Li, Q.; Lu, Y.; Ge, Z.; Zhou, Z.; Zheng, J.; Xiao, S. A New Tree-Type Fracturing Method for Stimulating Coal Seam Gas Reservoirs. Energies 2017, 10, 1388. [Google Scholar] [CrossRef]
- Hoek, E.; Brown, E.T. Empirical strength criterion for rock masses. J. Geotech. Geoenviron. Eng. 1980, 106, 1013–1035. [Google Scholar]
- Yin, G.; Li, M.; Wang, J.G.; Xu, J.; Li, W. Mechanical behavior and permeability evolution of gas infiltrated coals during protective layer mining. Int. J. Rock Mech. Min. Sci. 2015, 80, 292–301. [Google Scholar] [CrossRef]
- Colmenares, L.B.; Zoback, M.D. A statistical evaluation of intact rock failure criteria constrained by polyaxial test data for five different rocks. Int. J. Rock Mech. Min. Sci. 2002, 39, 695–729. [Google Scholar] [CrossRef]
- Haimson, B. True Triaxial Stresses and the Brittle Fracture of Rock. Pure Appl. Geophys. 2006, 163, 1101–1130. [Google Scholar] [CrossRef]
- Yang, J.-H.; Liu, H.-D. True triaxial experimental study on rock strength and deformation. J. North China Inst. Water Conserv. Hydroelectr. Power. 2007, 28, 66–68. [Google Scholar]
- Chang, C.; Haimson, B. A Failure Criterion for Rocks Based on True Triaxial Testing. Rock Mech. Rock Eng. 2012, 45, 1007–1010. [Google Scholar] [CrossRef]
- Mogi, K. Effect of the intermediate principal stress on rock failure. J. Geophys. Res. 1967, 72, 5117–5131. [Google Scholar] [CrossRef]
- Mogi, K. Fracture and flow of rocks under high triaxial compression. J. Geophys. Res. Atmos. 1971, 76, 1255–1269. [Google Scholar] [CrossRef]
- Wiebols, G.A.; Cook, N.G.W. Energy Criterion for the Strength of Rock in Polyaxial Compression. Int. J. Rock Mech. Min. Sci. 1968, 5, 529–549. [Google Scholar] [CrossRef]
- Zhou, S. A Program to Model the Initial Shape and Extent of Borehole Breakout; Pergamon Press, Inc.: New York, NY, USA, 1994; pp. 1143–1160. [Google Scholar]
- Zheng, Y.; Deng, S. Failure Probability Model considering the Effect of Intermediate Principal Stress on Rock Strength. Math. Prob. Eng. 2015, 2015, 960973. [Google Scholar] [CrossRef]
- Haimson, B.; Chang, C. A new true triaxial cell for testing mechanical properties of rock, and its use to determine rock strength and deformability of Westerly granite. Int. J. Rock Mech. Min. Sci. 2000, 37, 285–296. [Google Scholar] [CrossRef]
- Zongyuan, M.; Jianhong, L.; Faning, D. Effect of intermediate principal stress on strength of soft rock under complex stress states. J. Cent. South Univ. 2014, 21, 1583–1593. [Google Scholar]
- Zheng, Y.; Deng, S.; Le, V.; Sun, Y. Micro-Mechanism of the Intermediate Principal Stress Effect on the Strength of Granular Materials. In Proceedings of the Soil Behavior and Geomechanics, Shanghai, China, 26–28 May 2014; pp. 465–475. [Google Scholar]
- Rodriguez, N.M.; Lade, P.V. True Triaxial Tests on Cross-Anisotropic Deposits of Fine Nevada Sand. Int. J. Geomech. 2014, 13, 779–793. [Google Scholar] [CrossRef]
- Pan, P.Z.; Feng, X.T.; Hudson, J.A. The influence of the intermediate principal stress on rock failure behaviour: A numerical study. Eng. Geol. 2012, 124, 109–118. [Google Scholar] [CrossRef]
- Phueakphum, D.; Fuenkajorn, K.; Walsri, C. Effects of intermediate principal stress on tensile strength of rocks. Int. J. Fract. 2013, 181, 163–175. [Google Scholar] [CrossRef]
- Yin, G.; Li, H.; Xian, X.; Xu, J. The experimental study of the influence of engineering stress changes on strength characteristics of rocks. Chin. J. Geotech. Eng. 1987, 9, 20–28. [Google Scholar]
- Haimson, B.; Rudnicki, J. The intermediate principal stress effect on faulting and fault orientation. EGU Gen. Assem. 2010, 12, 2070. [Google Scholar]
- Haimson, B.; Rudnicki, J.W. The effect of the intermediate principal stress on fault formation and fault angle in siltstone. J. Struct. Geol. 2010, 32, 1701–1711. [Google Scholar] [CrossRef]
- Chen, Y.; Xu, J.; Peng, S.; Yan, F.; Fan, C. A Gas–Solid–Liquid Coupling Model of Coal Seams and the Optimization of Gas Drainage Boreholes. Energies 2018, 11, 560. [Google Scholar] [CrossRef]
- Al-Harthy, S.S.; Jing, X.D.; Marsden, J.R.; Dennis, J.W. Petrophysical Properties of Sandstones Under True Triaxial Stresses I: Directional Transport Characteristics and Pore Volume Change. In Proceedings of the SPE Asia Pacific Improved Oil Recovery Conference, Kuala Lumpur, Malaysia, 25–26 October 1999; pp. 357–372. [Google Scholar]
- Nasseri, M.H.B.; Goodfellow, S.D.; Lombos, L.; Young, R.P. 3-D transport and acoustic properties of Fontainebleau sandstone during true-triaxial deformation experiments. Int. J. Rock Mech. Min. Sci. 2014, 69, 1–18. [Google Scholar] [CrossRef]
- Goodfellow, S.D.; Tisato, N.; Ghofranitabari, M.; Nasseri, M.H.B.; Young, R.P. Attenuation Properties of Fontainebleau Sandstone During True-Triaxial Deformation using Active and Passive Ultrasonics. Rock Mech. Rock Eng. 2015, 48, 2551–2566. [Google Scholar] [CrossRef]
- Lombos, L.; Roberts, D.W.; King, M.S. Design and development of integrated true triaxial testing system. In True Triaxial Testing of Rocks; Taylor and Francis Group: London, UK, 2013; Chapter 3. [Google Scholar]
- Li, M.; Yin, G.; Xu, J.; Li, W.; Song, Z.; Jiang, C. A novel true triaxial apparatus to study the geomechanical and fluid flow aspects of energy exploitations in geological formations. Rock Mech. Rock Eng. 2016, 49, 4647–4659. [Google Scholar] [CrossRef]
- Li, M.; Yin, G.; Xu, J.; Cao, J.; Song, Z. Permeability evolution of shale under anisotropic true triaxial stress conditions. Int. J. Coal Geol. 2016, 165, 142–148. [Google Scholar] [CrossRef]
- Mogi, K. Experimental Rock Mechanics; Taylor and Francis Group: London, UK, 2007. [Google Scholar]
- Drucker, D.C.; Prager, W. Soil mechanics and plastic analysis or limit design. Q. Appl. Math. 1952, 10, 157–165. [Google Scholar] [CrossRef]


| Serial Number | σ2/MPa | σ3/MPa | Displacement Rate |
|---|---|---|---|
| M-1 | 20 | 20 | 0.001 mm/s |
| M-2 | 30 | 20 | 0.001 mm/s |
| M-3 | 40 | 20 | 0.001 mm/s |
| M-4 | 50 | 20 | 0.001 mm/s |
| M-5 | 60 | 20 | 0.001 mm/s |
| M-6 | 30 | 30 | 0.001 mm/s |
| M-7 | 40 | 30 | 0.001 mm/s |
| M-8 | 50 | 30 | 0.001 mm/s |
| M-9 | 60 | 30 | 0.001 mm/s |
| M-10 | 40 | 40 | 0.001 mm/s |
| M-11 | 50 | 40 | 0.001 mm/s |
| M-12 | 60 | 40 | 0.001 mm/s |
| M-13 | 50 | 50 | 0.001 mm/s |
| M-14 | 60 | 50 | 0.001 mm/s |
| M-15 | 60 | 60 | 0.001 mm/s |
© 2018 by the authors. Licensee MDPI, Basel, Switzerland. This article is an open access article distributed under the terms and conditions of the Creative Commons Attribution (CC BY) license (http://creativecommons.org/licenses/by/4.0/).
Share and Cite
Song, Z.; Li, M.; Yin, G.; Ranjith, P.G.; Zhang, D.; Liu, C. Effect of Intermediate Principal Stress on the Strength, Deformation, and Permeability of Sandstone. Energies 2018, 11, 2694. https://doi.org/10.3390/en11102694
Song Z, Li M, Yin G, Ranjith PG, Zhang D, Liu C. Effect of Intermediate Principal Stress on the Strength, Deformation, and Permeability of Sandstone. Energies. 2018; 11(10):2694. https://doi.org/10.3390/en11102694
Chicago/Turabian StyleSong, Zhenlong, Minghui Li, Guangzhi Yin, Pathegama Gamage Ranjith, Dongming Zhang, and Chao Liu. 2018. "Effect of Intermediate Principal Stress on the Strength, Deformation, and Permeability of Sandstone" Energies 11, no. 10: 2694. https://doi.org/10.3390/en11102694
APA StyleSong, Z., Li, M., Yin, G., Ranjith, P. G., Zhang, D., & Liu, C. (2018). Effect of Intermediate Principal Stress on the Strength, Deformation, and Permeability of Sandstone. Energies, 11(10), 2694. https://doi.org/10.3390/en11102694