Article

Thermal Performance Analysis of an Absorption Cooling System Based on Parabolic Trough Solar Collectors

School of Energy, Power and Mechanical Engineering, North China Electric Power University, Baoding 071003, Hebei, China
*
Author to whom correspondence should be addressed.
Energies 2018, 11(10), 2679; https://doi.org/10.3390/en11102679
Submission received: 4 September 2018 / Revised: 24 September 2018 / Accepted: 7 October 2018 / Published: 9 October 2018
(This article belongs to the Special Issue Solar Thermal Energy Utilization Technologies in Buildings)

Abstract

:
Solar radiation intensity significantly influences the cooling loads of building, and the two are correlated and accorded to a certain extent. This study proposes a double effect LiBr–H2O absorption cooling system based on the parabolic trough collector (PTC) of solar heat energy. Thermodynamic models including PTC and absorption chiller are constructed, and their accuracy is verified by comparing the simulation results and the experimental data. Subsequently, the impact of variable design parameters on the thermodynamic performance is analyzed and discussed. The analysis of a solar cooling system in a hotel case study is related to its operation in a typical day, the average coefficient of performance of the absorption chiller is approximately 1.195, and the whole solar cooling system achieves 61.98% solar energy utilization efficiency. Furthermore, the performance comparison of a solar cooling system in different types of building indicates that higher matching and a higher correlation coefficient between the transient solar direct normal irradiance and cooling load is helpful in decreasing the heat loss and improving systemic performance. The solar cooling system in the office building exhibits a correlation coefficient of approximately 0.81 and achieves 69.47% systemic thermal efficiency.

1. Introduction

The energy consumption of heating, ventilation, and air conditioning (HVAC) systems in office buildings generally accounts for 30% of the total building energy consumption [1]. Moreover, in developed countries or areas with extreme climates, it increases up to 50% [2]. In order to improve energy efficiency and reduce energy consumption, passive technologies such as solar gain wall; photovoltaic (PV) green roofs and passive cooling; and HVAC technologies including radiant heating/cooling systems, variable-air-volume-based air-conditioning systems, and so on, have been proposed and developed from different aspects [3]. A method used in these technologies involves adopting renewable energy, such as biomass [4] and solar energy [5], to replace fossil fuels. Solar energy is an alternative for fossil energy owing to its high reserve, wide distribution, renewal, and non-polluting capabilities.
The combination of cooling and solar energy is a suitable method to realize a better balance between solar thermal energy input and cooling output in the future market [6]. Typically, the collection of higher solar energy is involved when a building needs increased cooling demand. Consequently, a solar cooling system is employed to reduce electricity consumption at the peak of summer and relieve electricity shortages. The main alternative routes from solar energy into the cooling system include solar thermal or electric PV, and the corresponding cooling thermodynamic cycles such as absorption and vapor compression are different [7]. In this case, the PV electric cooling system nowadays has higher energy efficiency and better economic performance [7]. With the development and promotion of solar heat collectors including concentrating and non-concentrating collectors, the technologies of cooling driven by solar thermal energy, such as solar adsorption cooling system [8], solar assisted liquid desiccant dehumidifier [9], and solar adsorption desalination-cooling system [10], were developed and analyzed from different aspects including energetic efficiency, economic feasibility [11], and environmental assessment [12] by researchers from different countries and regions [13].
Parabolic trough collector (PTC) for solar thermal energy is a relatively mature technology corresponding to a concentrating-type solar collector that ensures heat collecting efficiency at a higher temperature [14]. The temperature of the heat source from PTC is compatible with the heat demand of a double-effect LiBr–H2O absorption chiller that achieves a higher coefficient of performance (COP). The double-effect absorption chiller coupled with PTC can reach almost the same parity as PV-driven electric chillers, only in terms of energy efficiency [7,15].
Currently, several studies examined performance improvement and practical application of solar cooling system using experiments, simulations, and other methods. Tsilingiris [16] proposed the theoretical modelling of a solar cooling system for domestic applications in homes and confirmed the economic performance of the solar cooling system at the cost of fossil fuels. Mazloumi et al. [17] simulated the thermal performances of a solar single effect LiBr–H2O absorption chiller system integrated with a heat storage tank at the end of PTC, and the results indicated that the optimal capacity of the thermal storage tank significantly affects systemic operation performances. Li et al. [18] investigated the performance of a 23 kW solar powered single-effect LiBr–H2O absorption cooling system using a PTC of 56 m2 aperture area, and the experiment results indicated that the daily cooling COP varied from 0.11 to 0.27 in the sunny and clear sky days and the daily solar heat fraction ranged from 0.33 to 0.41. Qu et al. [19] modeled a PTC absorption chiller system in the transient system simulation program and constructed a corresponding 52 m2 experimental platform. The systemic performances in different wind speeds and solar radiations were analyzed and verified with the experimental data, and it was concluded that the solar thermal system could potentially supply 39% of the cooling and 20% of the heating demands for the building space. Tzivanidis and Bellos [20] investigated the influences of design parameters such as mass flow rate and storage tank volume on the performance of a one-stage absorption chiller coupled with a PTC in the climate of Athens, and concluded that using a 54 m2 collecting area and a storage tank of 1.35 m3, it is possible to achieve a maximum cooling load of 12.8 kW. Besides PTC, solar cooling systems coupled with different collectors were developed and analyzed. Aman et al. [21] proposed an ammonia–water absorption cooling system based on a flat plate solar collector for residential application and focused on energy and exergy analyses of an absorption chiller. Furthermore, Bellos et al. [22] presented exergetic, energetic, and economic evaluations of a solar-driven absorption cooling system with four various collectors including flat plate collectors, evacuated tube collectors, compound parabolic collectors, and PTCs. The comparisons illustrated that the system with the higher solar COP is the one with PTC because of their high efficiency, and is also the one with the maximum solar exergetic efficiency.
Aiming to achieve greater energy efficiency, Delač et al. [23] designed a solar heating and cooling system configured with condenser and absorber heat recovery, and the presentation of scenario shows recovery of up to 53% of waster condenser and absorber heat. Neyer et al. [24] focused on the integration of a single-/half-effect NH3/H2O absorption chiller into parallel/serial to conventional systems and concluded that its application for solar- and combined heating and power(CHP)-driven systems are reaching non-renewable primary energy savings of 30–70% at almost equal costs compared with conventional systems. Calise et al. [25] proposed a novel high-temperature solar assisted triple-pressure level combined cycle power plant and presented the thermoeconomic analysis of a novel solar cooling system for the combined cycle power plant. The application of solar cooling system integrated with different technologies is the current research focus, and the previous studies focused on the performances of a solar cooling system integrated with different solar collectors by simulations or experiments. However, the performances in off-design work conditions involved the whole system and the different characteristics of building cooling loads were examined in a few studies from the literature.
The specific objectives of this work are to propose a double-effect absorption chiller system driven by solar thermal energy collection through PTC, to analyze the thermodynamic performances of the solar cooling system, and to characterize its applicability in different buildings with different cooling loads using the correlation coefficient. Section 2 proposes the integrated solar cooling system and models the equipment and system. Section 3 analyzes the thermal performances including design and off-design work conditions, and discusses application performances in different kinds of buildings. Section 4 summarizes the conclusions of the study.

2. System and Model

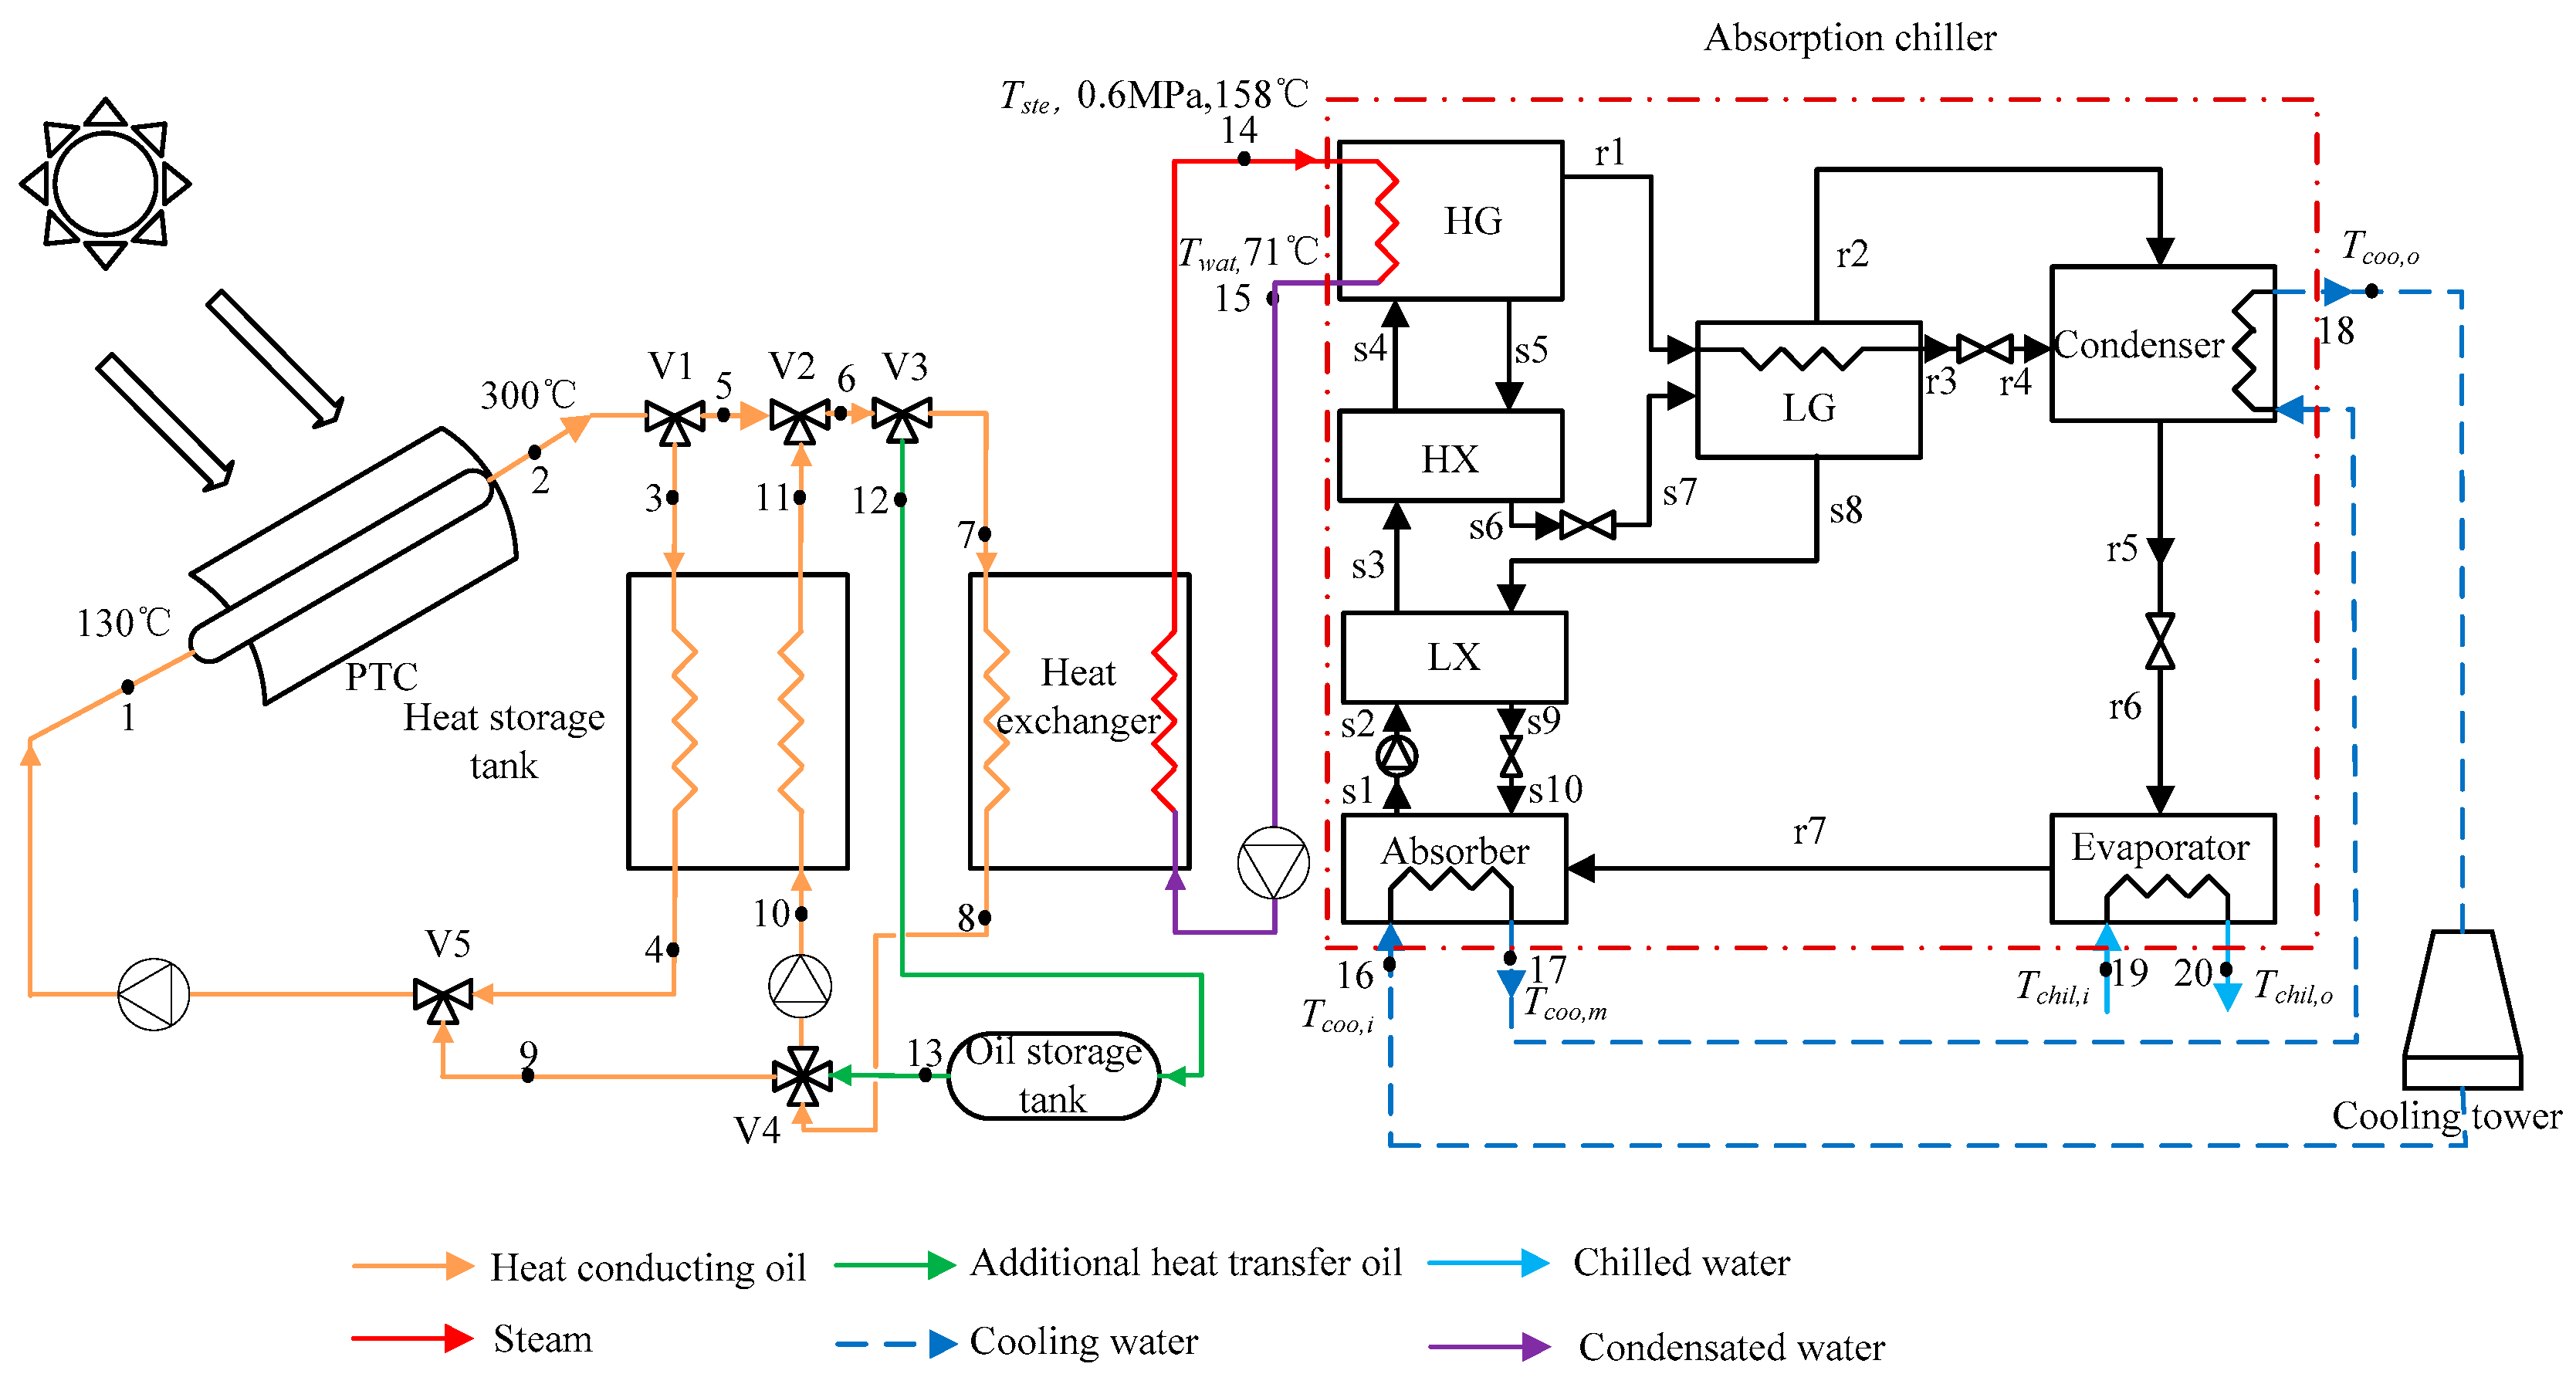
2.1. System Description

The flowchart of the proposed double-effect LiBr–H2O absorption chiller system driven by PTC is shown in Figure 1 The complete system consists of a solar heat collecting subsystem, a heat storage subsystem, a heat exchange subsystem, and a double-effect LiBr–H2O absorption chiller driven by steam. Sunlight is irradiated on a parabolic reflector and is reflected on the absorber by a mirror. The heat conducting oil (HCO) into the absorption tube (state 1) is heated to a high temperature (state 2). Subsequently, the high temperature HCO (state 7) enters the heat exchanger to produce steam (state 14), and the low temperature HCO is returned to the PTC through heat release (state 8). The steam with high temperature and high pressure is used to drive the absorption chiller to produce chilled water for space cooling (states 19 and 20). The steam releasing heat becomes the condensated water (state 15) and then returns to the heat exchanger.
The double-effect LiBr–H2O absorption chiller includes a high-pressure generator (HG), a low-pressure generator (LG), a condenser, an evaporator, an absorber, a low temperature heat exchanger (LX), a high temperature exchanger (HX), two solution reducing valves, and two refrigerant expansion valves. The high temperature steam produced by the HCO flows into the HG to generate the primary steam (state r1) and a concentrated working solution (state s5). Subsequently, the two streams enter into two different circulations: solution circulation and refrigerant circulation. In the solution circulation, the weak solution (state s1) produced in the absorber is pumped through the LX and HX to recover the surplus heat of the medium concentration solution from LG (states s8 and s9) and the strong concentration solution from HG (states s5 and s6), respectively. The weak solution (state s4) is then introduced into the HG, where it is heated and concentrated into medium concentration solution (state s5) by the steam resource, and thus high pressure refrigerant steam (state r1) is produced. The medium concentration solution (state s5) then passes through the HX and enters the LG after decreasing the pressure (state s7), where the medium concentration solution is further concentrated into a strong solution (state s8). The strong solution enters the absorber after it is cooled in the LX. In the refrigerant circulation, the refrigerant steam from the HG (state r1) condenses in the LG and low-pressure refrigerant steam (state r2) is generated. Both the high-pressure refrigerant water (state r2) and low-pressure refrigerant steam (state r3) flow into the condenser. The refrigerant water (state r5) is throttled and introduced into the evaporator to generate chilled water (states 19 and 20). Finally, the refrigerant steam (state r7) is absorbed by a strong solution in the absorber.
In the solar cooling system, a heat storage tank (HST) is necessary to match the heat supply from solar PTC and the cooling demand of building, and it adopts molten phase change material (PCM) storage. The PCM HST is connected in parallel to the collector field to enable charging and discharging. There are three operation switch modes of HST. Firstly, when the heat collected by the PTC exceeds the heat demand for cooling load, the valve V1 splits HCO to two streams (states 3 and 5). One of streams through the valves V2 and V3 is sent to heat exchanger to produce steam for chiller, and another stream being the excess heat through the HCO (states 3 and 4) is stored in the HST. The return HCO from HST and heat exchanger (states 4 and 8) through the valves V4 and V5 is sent together to the PTC again. Secondly, when the heat collected by the PTC is less than the heat demand, a part of HCO (state 10) is sent to the HST to absorb the stored heat, and then, with all HCO from the PTC through controlling the valve V1, it is sent to the heat exchanger to produce steam. Thus, the heat from the HST (states 10 and 11) is removed to supplement the shortage. Finally, when the heat collected from the PTC is not available in the night or daytime with no solar radiation, the valves V1 and V5 are closed and the cycle of the collected heat of PTC (states 3 and 4) does not work. The heat demand of cooling system is supplied by the HST through controlling the valves V2 and V4. During the operation process, the heat of flows, including that of HCO, steam, and storage stream, is adjusted by changing the flow rates.

2.2. Thermodynamic Model
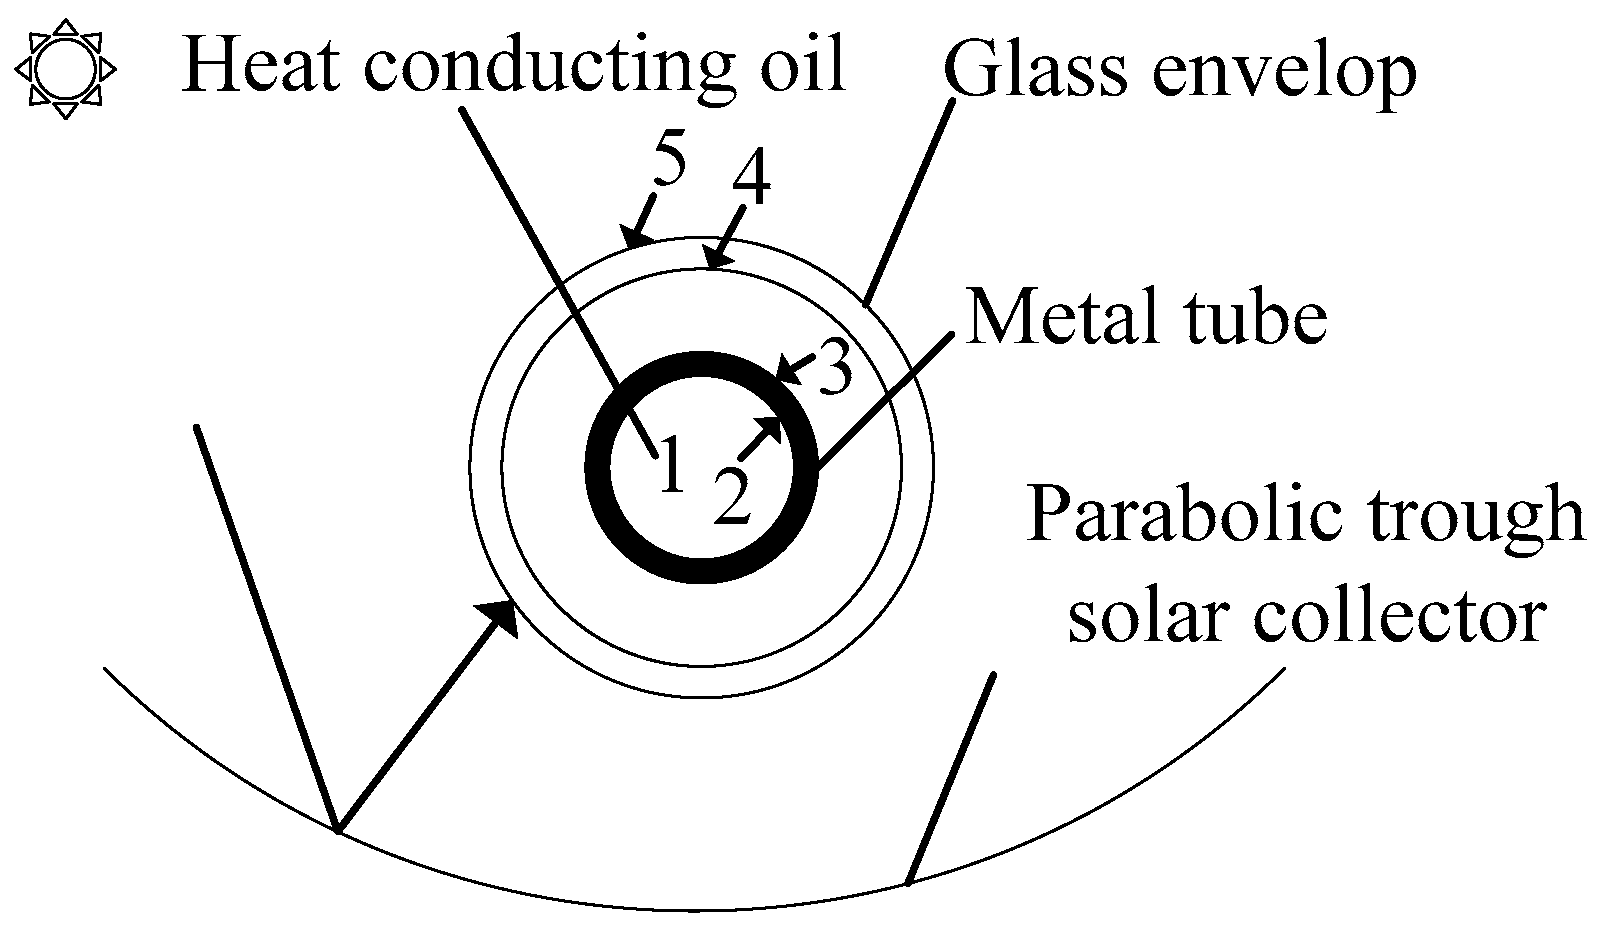
2.2.1. PTC

A solar PTC mainly consists of a parabolic mirror, a glass tube, and a metal tube [26], and this is shown in Figure 2 The parabolic mirror uses aluminum or silver to reflect solar radiation to the surface of the metal tube and is covered by a coating with high absorptivity and low emissivity; it then heats the HCO in the metal tube. The space between the glass tube and metal tube is set to vacuum to reduce heat loss.
The heat transfer process and the thermal resistance model considering one-dimensional heat transfer is shown in Figure 3 [27]. The solar radiation is reflected onto the glass tube through the parabolic mirror. The reflected sunlight passes through the glass tube to reach the outer surface of the metal tube. The metal pipe is heated owing to the higher density of sunlight on the outer wall of the metal tube, and the thermal energy is then transmitted to the working fluid, HCO, through heat conduction and convection, in that order. Thus, the flowing HCO is heated to collect solar heat.
The following points are assumed during the heat transfer analysis of PTC.
(1).
The space between the metal and glass tubes does not absolutely correspond to the vacuum because of a small amount of residual air, thus the convection heat transfer exists.
(2).
The heat conduction between the metal tube and hose is ignored.
(3).
The heat conduction between the metal tube and bracket of the PTC is ignored.
The solar radiation energy absorbed by the metal tube, Q s o l , is expressed as follows [28]:
Q s o l = I A η o p t I A M cos θ ( 1 ε 5 )  
where I is the solar direct normal irradiance (DNI), A is the collector area, η o p t is the PTC’s optical efficiency, θ is the solar incidence angle, I A M is the solar incidence angle modifier, and ε 5 is the reflectivity of glass outer wall. A part of the absorbed heat of the metal tube is transmitted to the working fluid, HCO, and another part is transferred to the inner wall of glass tube. Consequently, the heat balance is expressed as follows [27]:
Q s o l = Q 23 c o n d + Q 34 r a d + Q 34 c o n d + Q 34 c o n v  
where Q23cond is the heat conduction between the inner wall and outer wall of the metal tube; Q34rad and Q34conv are the radiation heat and the convection heat between metal tube and glass tube, respectively; and Q34cond is the heat conduction of the air in the space between metal and glass tubes. The conductive heat from the outer wall of metal tube to inner wall is absorbed by the HCO through convective heat transfer, and it is assumed that they are equal at the instantaneous steady state condition.
Q12conv = Q23cond
Additionally, the heat absorbed by the HCO, Q12conv, is calculated as follows [29]:
Q 12 c o n v = λ 12 c o n v A 2 ( T 2 T 1 )  
where λ 12 c o n v is the convective heat transfer coefficient in the single-phase region and can be defined as follows: λ 12 c o n v = N u D 2 k 1 D 2 and N u D 2 = 0.023 Re 0.8 Pr 0.4 , for which the validity is in the ranges of 0.6 Pr 160 , Re 10,000 , and L D 2 > 10 . L is the length of collector; D 2 is the diameter inside of the metal tube; N u D 2 is the Nusselt number; Re is the Reynolds number; Pr is the Prandtl number; k 1 is the thermal conductivity coefficient of the HCO at the temperature of T 1 ; A 2 is the inner area of the metal tube; T 1 and T 2 are the average temperatures of the HCO ( T 1 = T i + T o 2 ) and the inner wall of metal tube, respectively; and T i and T o are the inlet and outlet temperatures of HCO, respectively.
The heat absorbed in the inner wall of glass tube through heat conduction, convection, and radiation transfers to its outer wall through conduction and is expressed as follows:
Q 45 c o n d = Q 34 r a d + Q 34 c o n d + Q 34 c o n v  
where Q 45 c o n d is the heat conduction between the inner and outer wall of the glass tube, and is emitted to the atmosphere through heat convection and radiation. Thus, the following expression holds:
Q 45 c o n d = Q 56 c o n v + Q 57 r a d  
where Q 56 c o n v and Q 57 r a d are the convective heat and radiation heat between the outer wall of glass tube and atmosphere, respectively.
Therefore, the thermal efficiency of the collector is defined as the ratio of the solar radiation energy absorbed by the working fluid in the metal tube to the received total energy on the mirror of the PTC, and is expressed as follows [30]:
η P T C = Q 12 c o n v I A  
where η P T C is the thermal efficiency of the PTC.
In the study, the SEGS (Solar Electric Generating System) LS-2 PTC [31] is employed to heat the HCO for the generation of steam. The design parameters [5,30,31] are listed in Table 1.
Because of the discontinuity of solar energy, the additional collection area should be considered to satisfy the heat demand for producing chilled water at night. Thus, the collected heat from the PTC covers the heat demand in the daytime and the stored heat for utilization at night. Consequently, the total collection area of the PTC is estimated according to the heat demands of cooling loads, as follows:
i = X 1 X N A I i η i = i = X 1 X N Q D i + Q D n i g h t ( 1 a ) ( 1 b ) ( 1 c )  
Q D n i g h t = i = 0 X 1 1 Q D i + i = X N + 1 23 Q D i  
where Q D i is the heat demand to match the hourly cold load when solar energy is available; Q D n i g h t is the heat collected by the PTC to satisfy the total demand at night; X 1 is the time when the collector begins to work; X N is the last time of the collector’s work; a, b, and c are the heat loss coefficients during heat storing, static storage, and heat releasing of the HST, respectively (herein, all of them are set to 0.1); and I i and η i are the DNI in the i-th hour and the corresponding collection efficiency of solar thermal energy, respectively. During the computation process of the collector’s area, the thermal efficiency of PTC is obtained through simulation programs using Engineering Equation Solver (EES) after setting the cooling load of a building in a typical day.

2.2.2. Absorption Chiller

A double effect LiBr–H2O absorption chiller driven by steam is integrated with the solar thermal collection system in which its COP is relatively high in several types of absorption chillers driven by hot water or exhausted gas. During modeling and calculation of the absorption chiller, the following assumptions are considered [5]:
(1).
The heat losses in each component and the pressure losses between each connection lines are ignored.
(2).
The systemic analysis is based on the steady state, and the LiBr–H2O solution is steady during the cycle.
(3).
The states are statured and include the outlet refrigerant steam of evaporator, the outlet refrigerant liquid of condenser, the outlet weak solution of absorber, and the outlet solution of HG and LG.
(4).
The power consumption of solution pump is ignored.
(5).
Counter flow heat exchanger is employed, and the logarithmic mean temperature difference is adopted in the heat transfer calculation.
During the cycle of LiBr–H2O solution, the balances of each component including mass, energy, and solution phase equilibrium are employed to construct the thermodynamic model and the universal formulations are listed as follows [32]:
m i m o = 0  
m i w i m o w o = 0  
m i h i m o h o = 0  
where m, w, and h represent mass, concentration, and enthalpy, respectively; and the subscripts i and o represent the inlet and outlet of the component, respectively.
Thus, given the pump’s power consumption, the energy balance of the absorption chiller is expressed as follows [33]:
Q H G + Q C = Q A + Q C o n  
where Q H G is the heat absorbed by the HG, Q C is the heat absorbed by the evaporator, Q A is the heat released by the absorber, and Q C o n is the heat released by the condenser. Its COP is defined as follows:
C O P = Q C Q H G  

2.3. Evaluation Criteria

Appropriate evaluation criteria are selected to assess the performances of the absorption system based on the parabolic trough solar collector. The systemic thermal efficiency, η s y s , is defined as the ratio of the cooling output to the total solar energy input, and is expressed as follows [30]:
η s y s = Q C I A × 100 %  

3. Results and Discussions

3.1. Validity of Models

The main constructed models, including PTC and absorption chiller, are verified to show their validities. Firstly, the simulated outlet temperature of HCO in the PTC model is compared with the experimental data at the same parameters [31], and the relative errors of the outlet temperature of HCO at seven sets of work conditions are shown in Table 2. The maximum relative error is 1.29%, and the average relative error is 0.89%, which is within the acceptable range.
Secondly, the thermodynamic model of the absorption chiller driven by steam is established and simulated by using EES, and in particular, the thermal properties of the LiBr–H2O solution are directly obtained in the EES software. In order to verify the accuracy of the simulated model, the model and results from the literature [34] are referred to for comparison purposes. Because there are 17 internal states in the absorption chiller and 7 interactive states, the average relative errors of each parameter are employed to verify the model of absorption chiller, and the comparison results are shown in Table 3. It is observed that the error of temperature is the highest, although it is only 0.056%. Consequently, the simulation error and the accuracy of modeling is acceptable. Given the simulation, the COP of absorption chiller is approximately 1.312, which is the same as the reference value in previous studies.

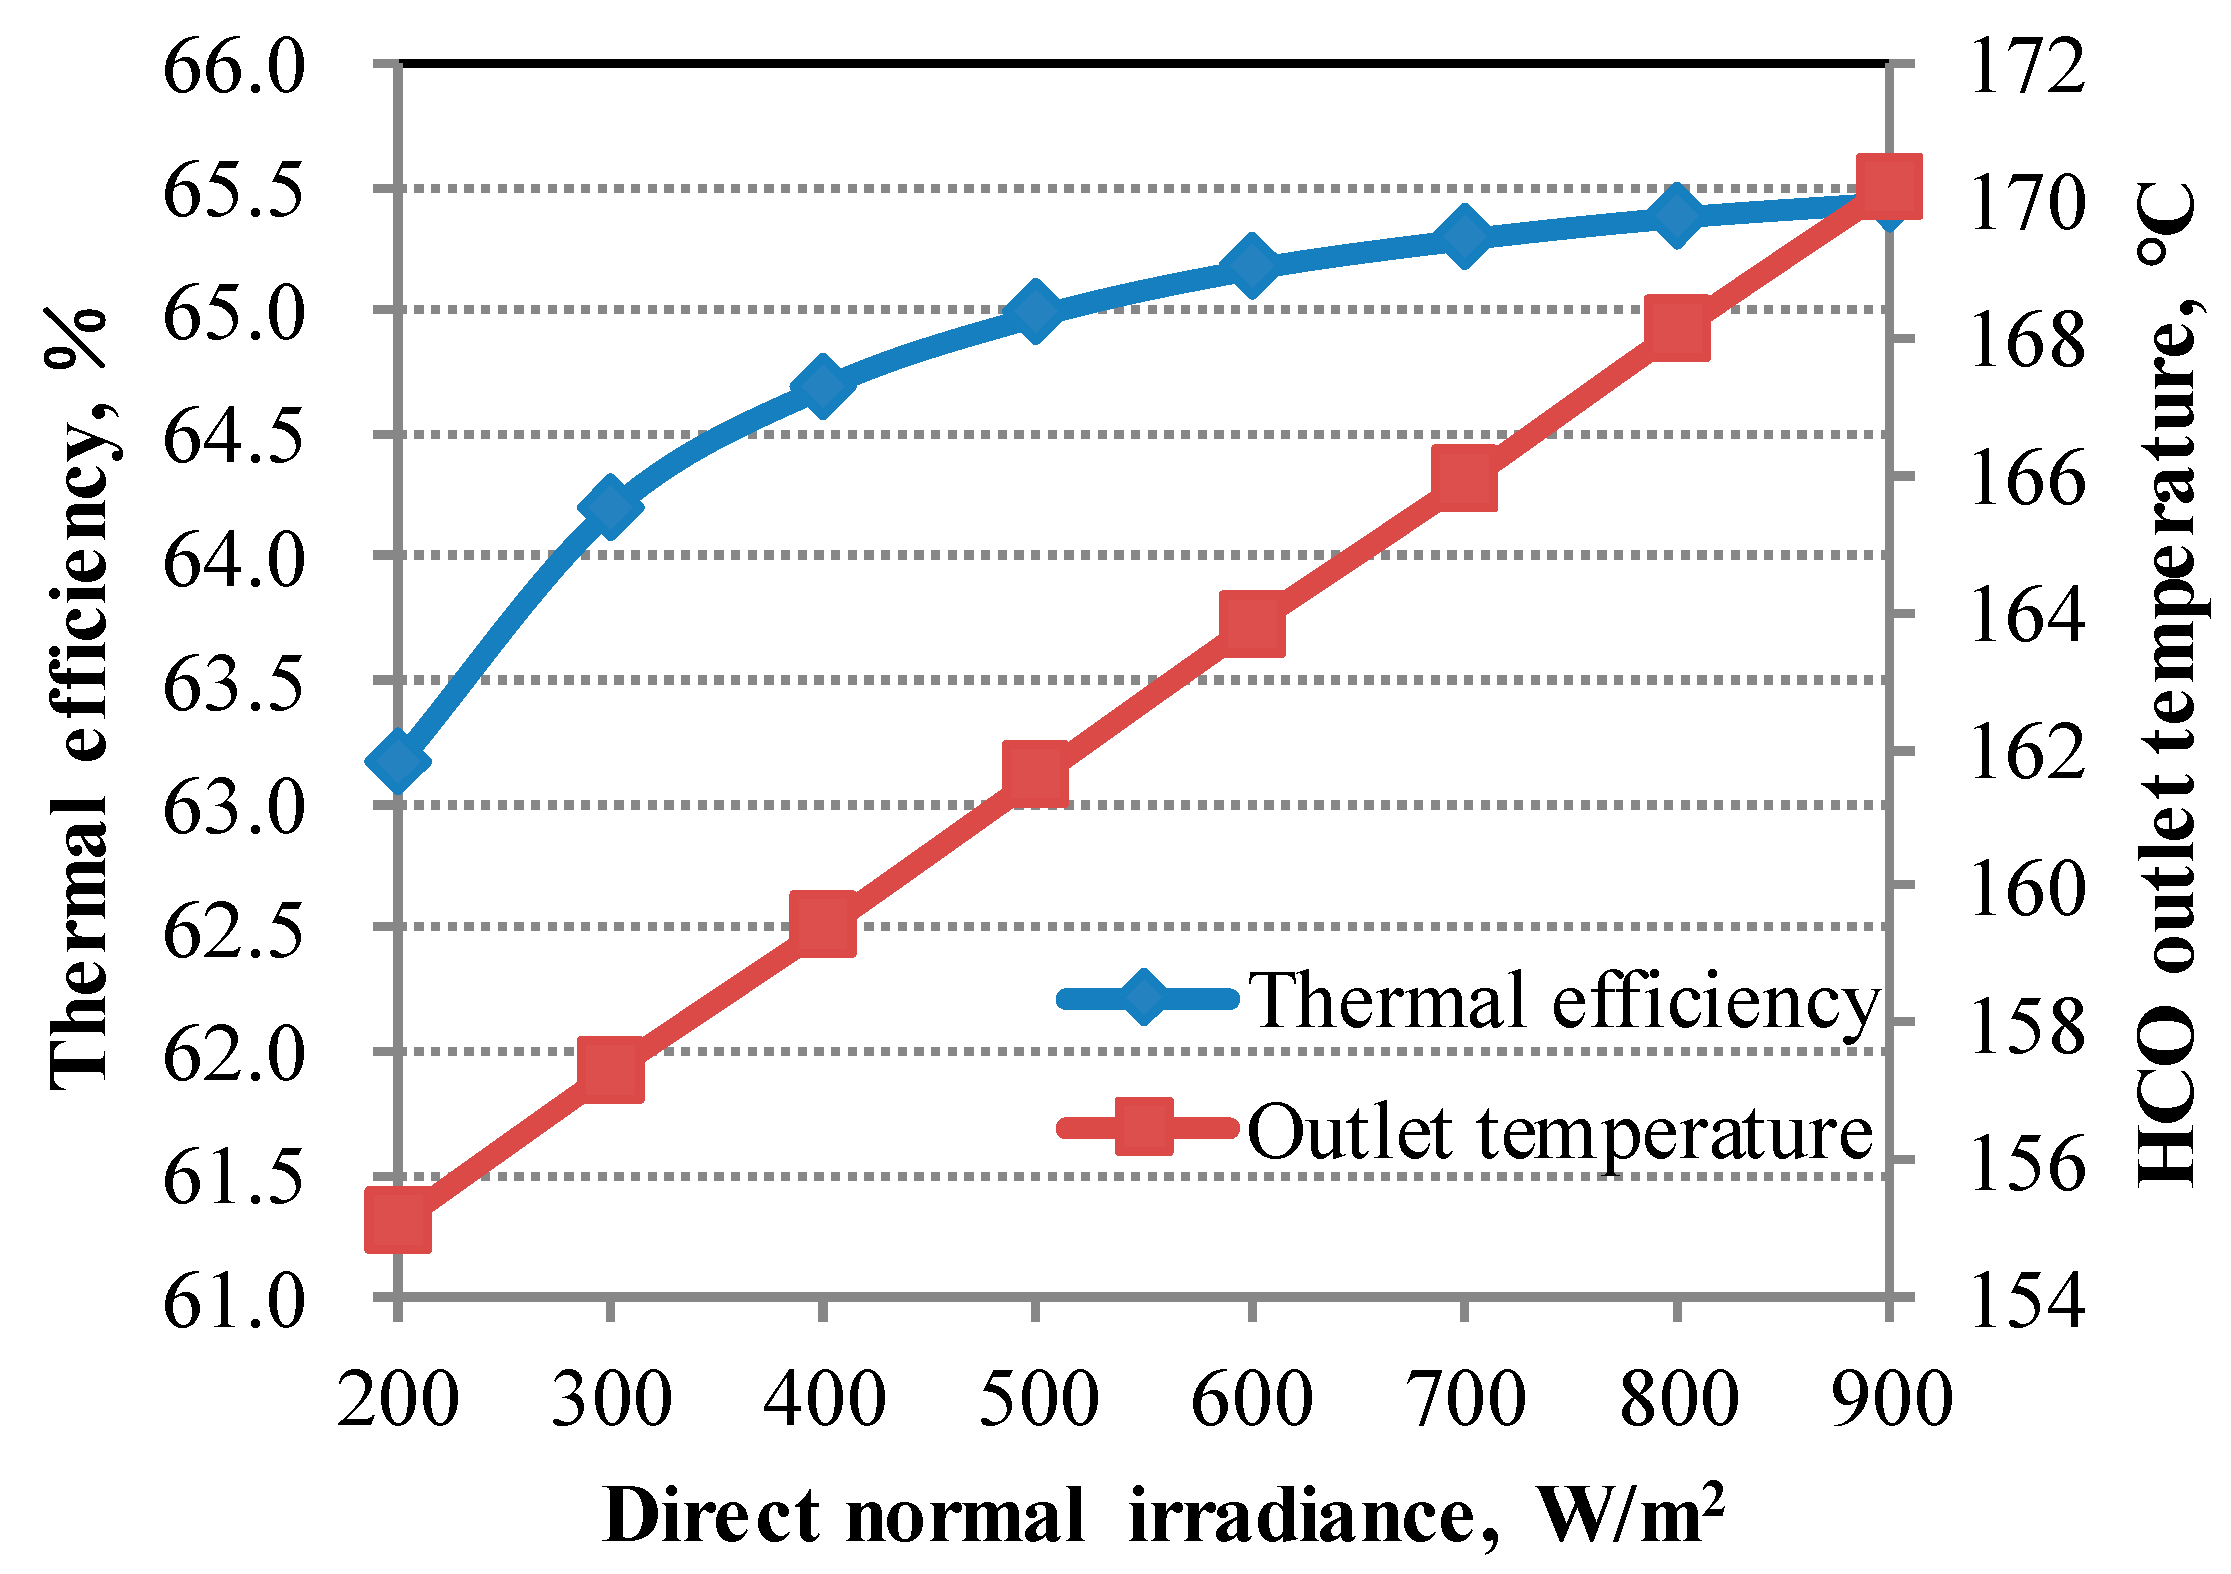
3.2. Performances of the Solar Collector

The solar heat collecting subsystem is the base of the absorption chilling system, and this significantly influences the systemic performances. The impacts of solar DNI and temperature and flow rate of the HCO on the thermal efficiency of a LS-2 PTC in Table 1 are analyzed on the base parameters of No. 2 work conditions in Table 2.
Figure 4 displays the variations in the heat collecting efficiency and HCO outlet temperature with the different DNI when the inlet temperature and flow rate of the HCO are 151 °C and 47.8 L/min, respectively. It is evident that the thermal efficiency increases with the increasing DNI. The thermal efficiency is approximately 63.2% when the DNI is 200 W/m2. When the outlet temperature is set as constant, the lower DNI requires a lower flow rate of the HCO. However, the HCO easily appears as a coking phenomenon in the heat collecting tube as a result of an excessively high temperature when the flow rate of the HCO is excessively low, and then coke deposits will affect the heat transfer performance, even resulting in tube failures. Consequently, the heat collection system stops working to avoid the phenomenon of coking at an excessively low flow rate, resulting from the low DNI. The higher DNI leads to a higher temperature of the metal tube wall, and this enlarges the temperature difference between the HCO and the metal tube and enforces their heat transfer. The collection thermal efficiency increases to 65.4% when the DNI increases to 900 W/m2. Additionally, the growth rate of the heat collecting efficiency at the lower solar radiation exceeds that at the higher solar radiation. At the initial stage of increasing DNI, the higher temperature difference between the metal tube and HCO promotes heat conduction and then leads to the overall increase in the solar collector efficiency. A further increase in the DNI decreases the temperature difference between the metal tube and HCO and the increasing rate of the collection efficiency also becomes slow. In addition, differently to the changing trend of collection efficiency, the HCO outlet temperature increases with the increasing DNI and the increasing speed is kept constant. When the DNI increases by 100 W/m2, the outlet temperature of the LS-2 collector will increase by approximately 2 °C.
The variations in heat collecting efficiency with the DNI and HCO temperature (from 100 °C to 300 °C) are shown in Figure 5, when the flow rate of HCO is 47.8 L/min. It is observed that the thermal efficiency decreases with the increasing inlet temperature of HCO. The lower inlet temperature results in a higher temperature difference between the metal tube and the HCO and enhances the heat transfer of the solar collector. Additionally, the decline of efficiency at the DNI of 300 W/m2 from 65.5% to 57.7% exceeds that at 700 W/m2 from 66.0% to 61.8%. This indicates that the higher inlet temperature of HCO influences the thermal efficiency more evidently at the low DNI.
When the inlet temperature of the HCO is 151 °C and the other parameters remain unchanged, the variations in the thermal efficiency of the PTC with the DNI and HCO flow rate are displayed in Figure 6 It is observed that the higher flow rate of the HCO results in a higher collecting efficiency of solar heat. At a constant DNI, the higher flow rate decreases the outlet temperature of the HCO, and then the average temperature of the HCO naturally declines. However, the total temperature difference between the HCO and metal wall increases, and this enhances the heat transfer and increases the collection efficiency. At a higher flow rate, the changes in the average temperature of the HCO are low, such that the increasing rate in the thermal efficiency also becomes slow. When the DNI is 700 W/m2 and the flow rate of HCO increases from 20 L/min to 35 L/min, the collector efficiency increases from 63.98% to 64.96%. However, the thermal efficiency increases slowly at a higher flow rate, and it increases by only 0.43% when the flow rate increases to 55 L/min.

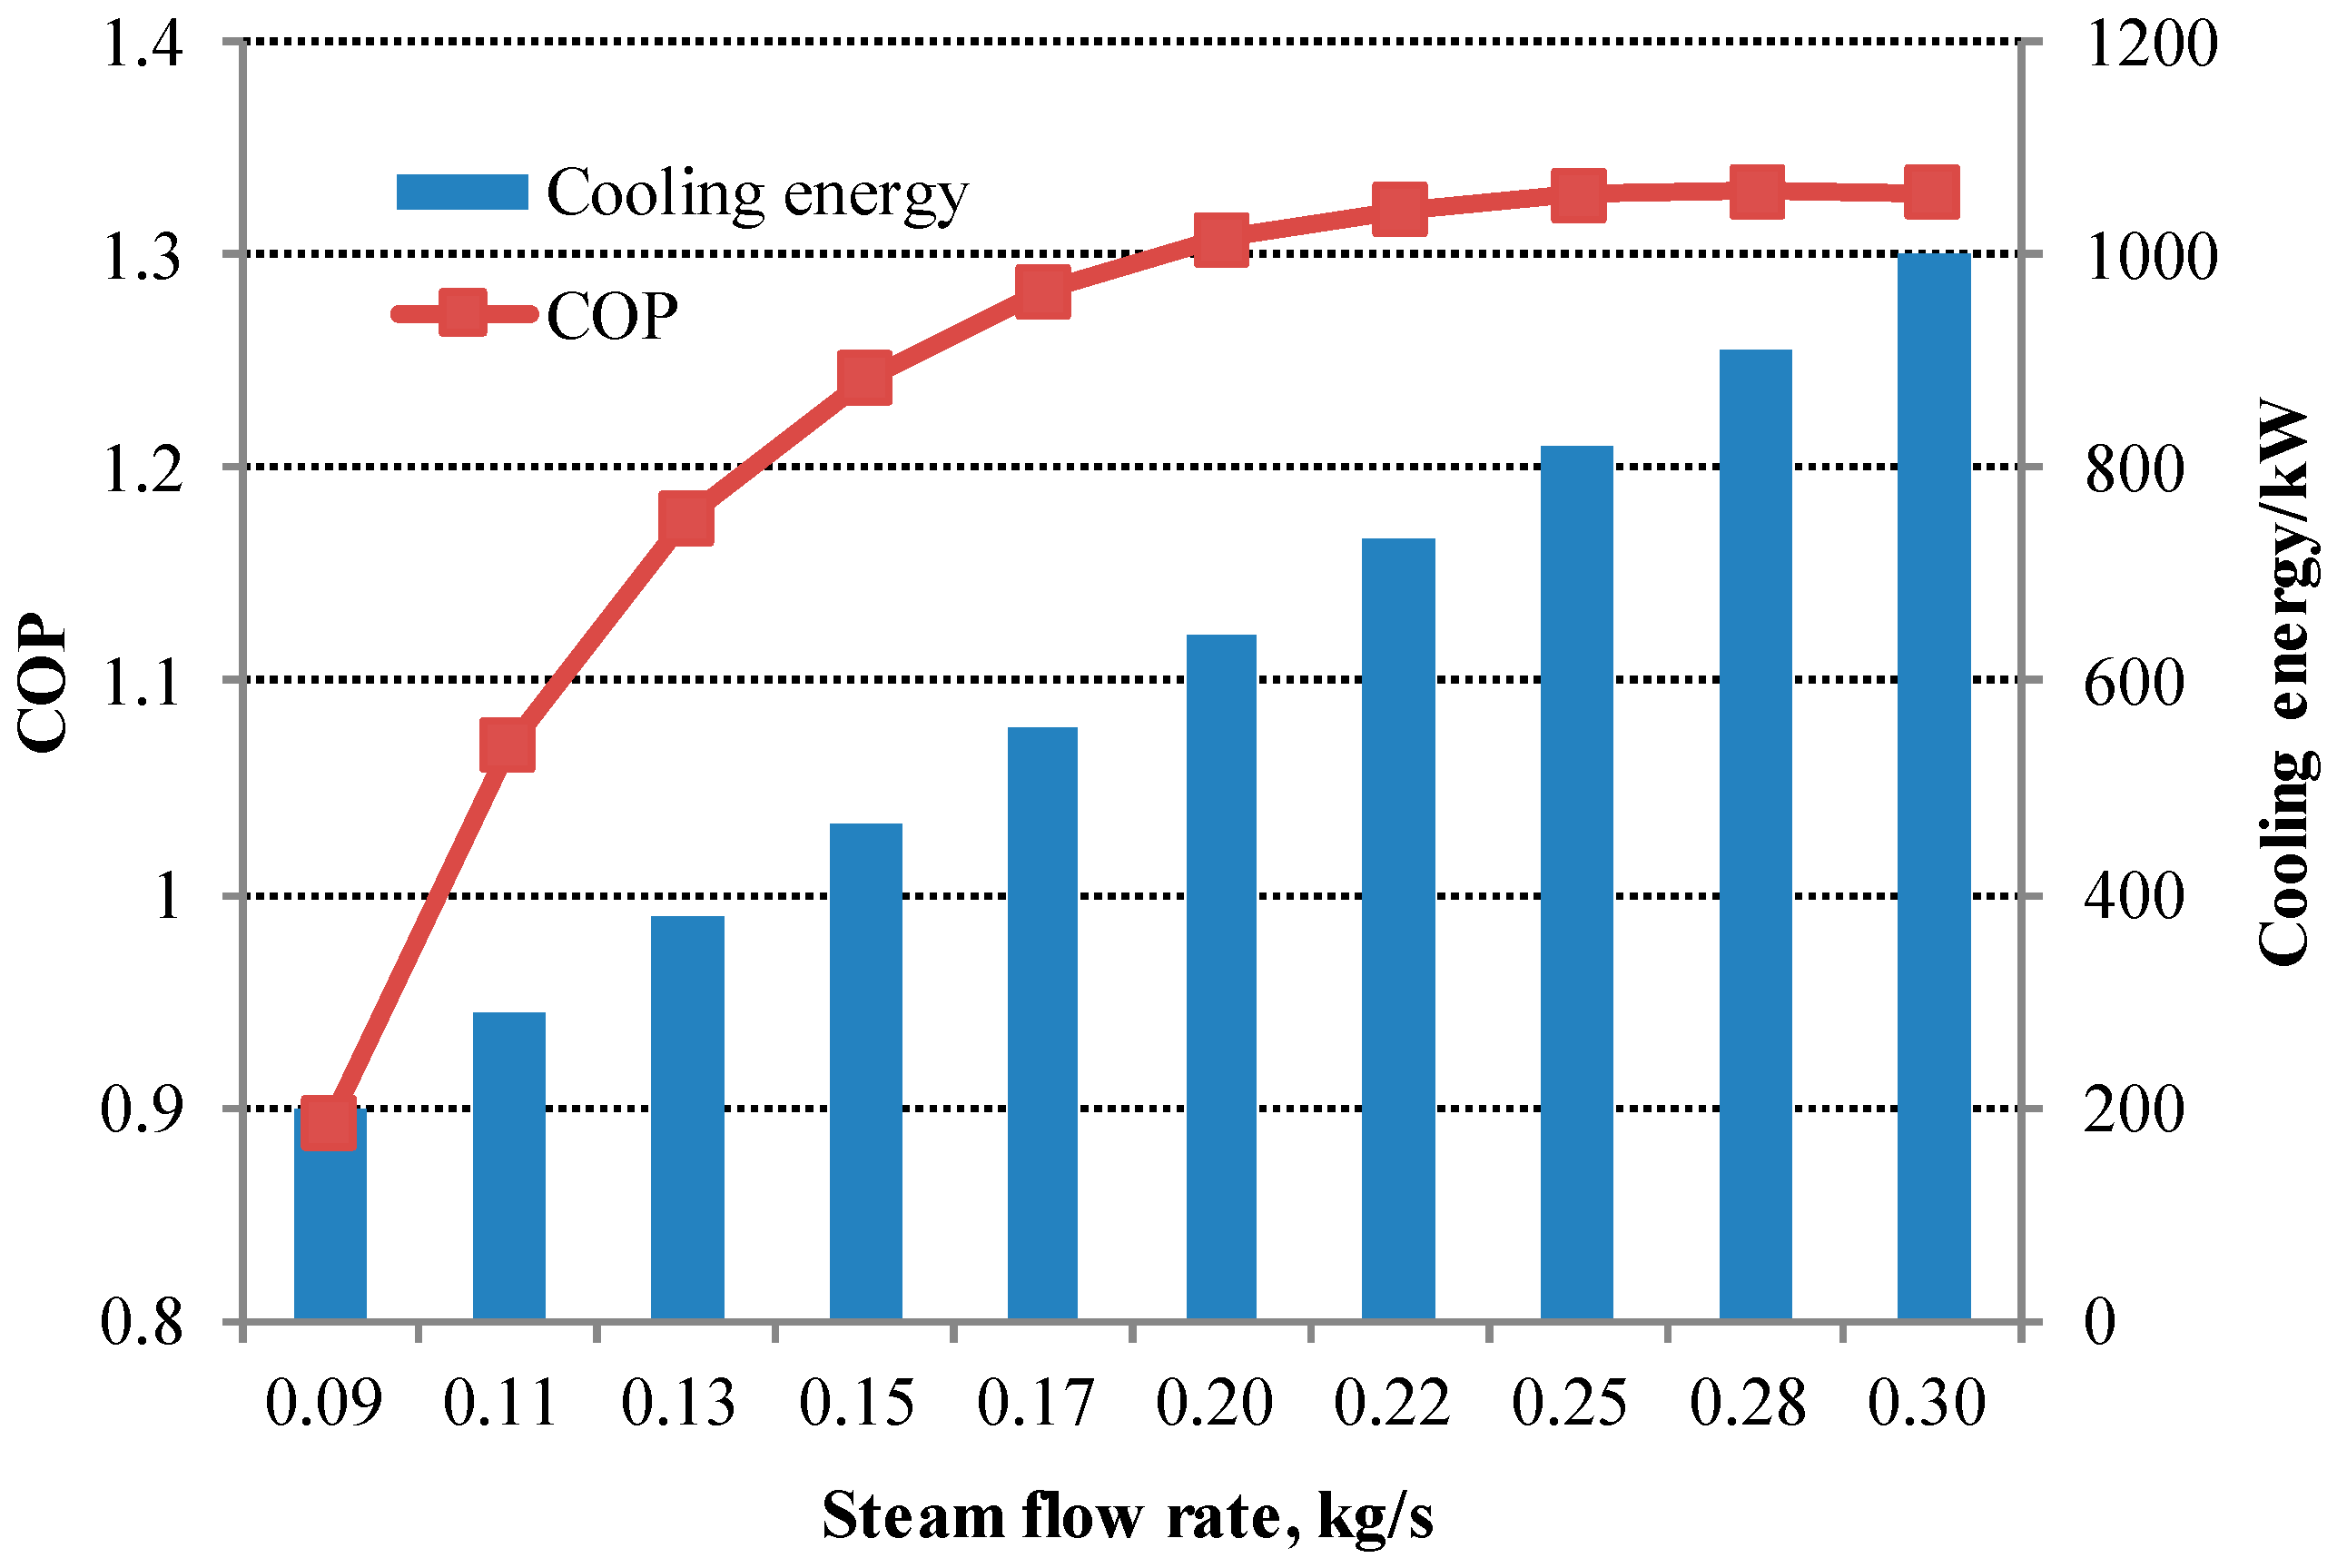
3.3. Performances of Absorption Chiller

An absorption chiller with a 1000-kW cooling output is simulated using the model constructed above. The design parameters and their performance with respect to the design work conditions are listed in Table 4. It is observed that the COP is approximately 1.332. The performances of the absorption chiller change when a few parameters, including cooling load, temperature, or flow rate of cooling water, are different from the design work conditions during the actual operation. Figure 7 shows the variations in the cooling load and COP with the steam flow rate. The COP increases from 0.893 to 1.332 when the cooling load factor increases from 20% to 100%, which is similar to the changing trend of the absorption chiller driven by high temperature exhausted gas in the literature [33]. The reason for the decreasing COP with the decreasing steam flow rate is that the temperature, pressure, and concentration LiBr solution in the HG decline with the decreasing steam flow rate; the flow rate of H2O steam naturally becomes less; the circulating ratio will increase quickly; and these influences result in the decline of COP.
The reduction of steam flow rate leads to a decrease in the intermediate solution temperature. Subsequently, the high-pressure refrigerant vapor decreases and the concentration of the intermediate solution decreases. With the decreases in the high-pressure refrigerant vapor, the absorbed heat in the LG is reduced. Consequently, the outlet temperature of concentrated solution reduces, the concentration of the concentrated solution decreases, and the cooling capacity reduces. With the increase in steam flow rate, the temperature, pressure, and concentration of the HG increase to the limits of the unit itself. During the increase, the COP increases rapidly at the initial increasing stage because of the higher difference, and the increasing speed of COP then decreases.

3.4. Systemic Performances

In order to analyze the performances of the complete system including solar collecting subsystem and absorption chiller, a hotel building in Beijing (north latitude 40° and east longitude 116°) is selected as a case study [35]. The hourly cooling loads were simulated using the Software DeST through setting the occupancy schedules of people, electric equipment, and light, among others. The hourly cooling loads and solar irradiance in a typical day (15 July) are shown in Figure 8.
In order to satisfy the cooling loads of a complete day, the collection area of the PTC is 2886 m2, and 74 sets of LS-2 collectors based on the calculation methods in Equations (8) and (9) are used. In order to match the flow rate of the HCO and the requirement of absorption chiller, the 74 sets of collectors are divided into 8 rows that include 7 rows with 11 collectors and 1 row with 8 collectors in a series. At the base design work conditions, the design parameters and system performances are listed into Table 5.
In the solar collect system, adjustments in the flow rate of the HCO are employed to suit to the variation in DNI and maintain the constant outlet temperature of the HCO. Similarly, the cooling output is adjusted by changing the flow rate of steam into the absorption chiller and maintaining the constant inlet temperature of HG. Consequently, the inlet and outlet temperatures of the HCO and the HG in Table 5 are always kept constant. The hourly flow rate and transient collecting efficiency of PTC and COP of the absorption chiller are shown in Figure 9 and Figure 10, respectively.
From Figure 9, it is observed that the variation curve of steam flow rate shows a trend similar to the variation in the cooling load in Figure 8. Additionally, the flow rate of the HCO matches the change in the DNI to stratify the constant outlet temperature of PTC. When the solar DNI is below 400 W/m2, the solar collector does not work, and the solar collector works for nine hours from 08:00 to 16:00 in a typical day. During other times, the collector system is unable to collect the heat for the refrigeration cycle, and the HST supplements the heat demands as the heat source.
As shown in in Figure 10, the collector efficiency reaches a maximum value of 65% at the highest DNI, and the collector efficiency does not exhibit significant changes during its work time. The heat collected is used to produce the cooling energy in its work time and is stored in the HST to drive the absorption chiller in its non-work time. Thus, there are nine hours (from 08:00 to 16:00) to collect heat for the 24 h of cooling demands shown in Figure 8, and the results indicate that approximately 73% of the collected heat of the PTC is stored in the HST for heat demands in the night or daytime with no solar radiation (from 15:00 to 07:00). As discussed in the section on the COP variations with the steam flow rate in Figure 7, the COP also exhibits a trend similar to the cooling loads. The minimum COP is approximately 0.884 at the lowest cooling load, while the maximum COP reaches 1.332 at the highest cooling load.
Thus, the utilization efficiency of solar energy is 61.98% in a typical day in which the average COP of absorption chiller is approximately 1.195, and the average collection efficiency of solar collector is 64.4%, as shown in Table 5.

3.5. Applicability of the Solar Cooling System

The input of the cooling system is solar energy, and its output is the chilled water for building the cooling load. Both of these are uncertain and time variant. When they match well, the systemic performances including energy and economy improve. In order to demonstrate their correlations, a correlation coefficient between hourly cooling load and hourly DNI is introduced to compare the performances and to analyze two or more variable elements with relativity and measure the relative degree of correlation between the two variables. The correlation coefficient between variable arrays I and Q C , r ( I , Q C ) is expressed as follows:
r ( I , Q C ) = C o v ( I , Q C ) V a r [ I ] V a r [ Q C ]  
where C o v ( I , Q C ) is the covariance of I and Q C and V a r [ I ] and V a r [ Q C ] are the variances of I and Q C , respectively. The higher correlation coefficient implies increased consistency between the two variables.
Two additional buildings in Beijing, namely a shopping mall and an office building, are selected for comparison with the hotel building and for analyzing the application of the solar cooling system in different buildings. The hourly cooling loads are shown in Figure 11, and the simulation results are listed in Table 6.
As shown in Table 6, the correlation coefficient in the office building (0.80) is the highest, while that in the hotel (0.16) is the lowest. This point implies that the solar DNI is more similar to the cooling load in the office building. Correspondingly, the thermal efficiency in the office building (69.47%) is the highest, while that in hotel (61.98%) is the lowest. Consequently, it is concluded that the increased correlation coefficient between solar DNI and cooling load allows the solar cooling system to achieve increased benefits and leads to increased thermal efficiency.
The relationship between hourly solar DNI and cooling load is analyzed, and the increased correlation coefficient implies more similar changing trends between system input, solar energy and system output, cooling energy. When the input completely matches the output, then the correlation coefficient is equal to 1.0 and the heat storage system as a balance segment for input and output is not necessary. Table 5 shows a comparison of the thermal storage ratios (which are defined as the ratios of the total stored heat to the total collected solar heat), and it is observed that the office building with the highest correlation coefficient and the highest thermal efficiency exhibits the lowest thermal storage ratio. The installation capacity of the HST in the office building is the lowest (2354 kWh), while that in the hotel building is the largest (8995 kWh). Consequently, the heat loss during heat storage and release decreases and the systemic thermal efficiency naturally increases.

4. Conclusions

The study proposed a double-effect LiBr–H2O absorption chiller based on solar PTC, constructed the thermodynamic model, and presented the thermodynamic performance analysis on the design and off-design work conditions. The following conclusions are obtained:
The comparisons of the simulation results from the constructed thermodynamic models and the experimental data indicated that the maximum relative error of solar PTC model is approximately 1.29% and the maximum error of the absorption chiller model is only 0.056%, which satisfied the requirements of thermodynamic simulation. The influence analysis of uncertain factors on solar PTC indicated that the outlet temperature of collector will increase by approximately 2 °C when the DNI increases by 100 W/m2 in the case study. The solar irradiance has a strong effect on the collecting thermal efficiency. As for the absorption chiller, the influence of steam flow rate on its COP demonstrates that the COP increases rapidly with the increasing steam flow rate at a lower cooling load, and the increasing rate of COP then becomes slow with increases in the cooling load. In total, the combination of solar PTC and steam LiBr–H2O absorption chiller is a good method to match the energy level of medium temperature solar energy. The solar energy utilization efficiency reaches approximately 61.98% in the hotel building.
A correlation coefficient between solar irradiance and cooling load is proposed to quantify the applicability of the solar cooling system in the buildings. The performance comparison of the solar cooling system in different types of building indicates that better matching and a higher correlation coefficient between the transient solar DNI and cooling load is helpful in decreasing the heat loss and improving the systemic performance. The solar cooling system in the office building with a correlation coefficient of approximately 0.81 achieves 69.47% systemic thermal efficiency.
The thermodynamic performance of the solar cooling system on the design and off-design work conditions were only analyzed in this paper, while other performances such as economic feasibility, reliability, and availability are not considered. These aspects should be studied to promote the development of solar cooling systems in future research.

Author Contributions

Formal analysis, Z.W.; Methodology, R.Y.; Project administration, J.W.; Software, X.Z.; Writing–original draft, J.W.; Writing–review & editing, G.S.

Funding

This study was supported by the National Natural Science Foundation of China (Grant No. 51876064) and the Fundamental Research Funds for the Central Universities (2018MS098).

Acknowledgments

We gratefully acknowledge the anonymous reviewers for their insightful comments on the manuscript.

Conflicts of Interest

The authors declare no conflicts of interest.

References

  1. Manjarres, D.; Mera, A.; Perea, E.; Lejarazu, A.; Gil-Lopez, S. An energy-efficient predictive control for HVAC systems applied to tertiary buildings based on regression techniques. Energy Build. 2017, 152, 409–417. [Google Scholar] [CrossRef]
  2. Pérez-Lombard, L.; Ortiz, J.; Pout, C. A review on buildings energy consumption information. Energy Build. 2008, 40, 394–398. [Google Scholar] [CrossRef]
  3. Cao, X.; Dai, X.; Liu, J. Building energy-consumption status worldwide and the state-of-the-art technologies for zero-energy buildings during the past decade. Energy Build. 2016, 128, 198–213. [Google Scholar] [CrossRef]
  4. Wang, J.J.; Yang, K.; Xu, Z.L.; Fu, C. Energy and exergy analyses of an integrated CCHP system with biomass air gasification. Appl. Energy 2015, 142, 317–327. [Google Scholar] [CrossRef]
  5. Wang, J.J.; Yang, Y. Energy, exergy and environmental analysis of a hybrid combined cooling heating and power system utilizing biomass and solar energy. Energy Convers. Manag. 2016, 124, 566–577. [Google Scholar] [CrossRef]
  6. Ge, T.S.; Wang, R.Z.; Xu, Z.Y.; Pan, Q.W.; Du, S.; Chen, X.M.; Ma, T.; Wu, X.N.; Sun, X.L.; Chen, J.F. Solar heating and cooling: Present and future development. Renew. Energy 2018, 126, 1126–1140. [Google Scholar] [CrossRef]
  7. Lazzarin, R.M.; Noro, M. Past, present, future of solar cooling: Technical and economical considerations. Sol. Energy 2018. [Google Scholar] [CrossRef]
  8. El Fadar, A. Novel process for performance enhancement of a solar continuous adsorption cooling system. Energy 2016, 114, 10–23. [Google Scholar] [CrossRef]
  9. Chen, Y.; Yang, H.; Luo, Y. Investigation on solar assisted liquid desiccant dehumidifier and evaporative cooling system for fresh air treatment. Energy 2018, 143, 114–127. [Google Scholar] [CrossRef]
  10. Alsaman, A.S.; Askalany, A.A.; Harby, K.; Ahmed, M.S. Performance evaluation of a solar-driven adsorption desalination-cooling system. Energy 2017, 128, 196–207. [Google Scholar] [CrossRef]
  11. Li, Y.; Lu, L.; Yang, H. Energy and economic performance analysis of an open cycle solar desiccant dehumidification air-conditioning system for application in Hong Kong. Sol. Energy 2010, 84, 2085–2095. [Google Scholar] [CrossRef]
  12. Allouhi, A.; Kousksou, T.; Jamil, A.; El Rhafiki, T.; Mourad, Y.; Zeraouli, Y. Economic and environmental assessment of solar air-conditioning systems in Morocco. Renew. Sustain. Energy Rev. 2015, 50, 770–781. [Google Scholar] [CrossRef]
  13. Prieto, A.; Knaack, U.; Auer, T.; Klein, T. Solar coolfacades: Framework for the integration of solar cooling technologies in the building envelope. Energy 2017, 137, 353–368. [Google Scholar] [CrossRef]
  14. Jin, J.; Ling, Y.; Hao, Y. Similarity analysis of parabolic-trough solar collectors. Appl. Energy 2017, 204, 958–965. [Google Scholar] [CrossRef]
  15. Noro, M.; Lazzarin, R.M. Solar cooling between thermal and photovoltaic: An energy and economic comparative study in the Mediterranean conditions. Energy 2014, 73, 453–464. [Google Scholar] [CrossRef]
  16. Tsilingiris, P.T. Theoretical modelling of a solar air conditioning system for domestic applications. Energy Convers. Manag. 1993, 34, 523–531. [Google Scholar] [CrossRef]
  17. Mazloumi, M.; Naghashzadegan, M.; Javaherdeh, K. Simulation of solar lithium bromide-water absorption cooling system with parabolic trough collector. Energy Convers. Manag. 2008, 49, 2820–2832. [Google Scholar] [CrossRef]
  18. Li, M.; Xu, C.; Hassanien, R.H.E.; Xu, Y.; Zhuang, B. Experimental investigation on the performance of a solar powered lithium bromide-water absorption cooling system. Int. J. Refrig. 2016, 71, 46–59. [Google Scholar] [CrossRef]
  19. Qu, M.; Yin, H.; Archer, D.H. A solar thermal cooling and heating system for a building: Experimental and model based performance analysis and design. Sol. Energy 2010, 84, 166–182. [Google Scholar] [CrossRef]
  20. Tzivanidis, C.; Bellos, E. The use of parabolic trough collectors for solar cooling—A case study for Athens climate. Case Stud. Therm. Eng. 2016, 8, 403–413. [Google Scholar] [CrossRef]
  21. Aman, J.; Ting, D.S.K.; Henshaw, P. Residential solar air conditioning: Energy and exergy analyses of an ammonia-water absorption cooling system. Appl. Therm. Eng. 2014, 62, 424–432. [Google Scholar] [CrossRef]
  22. Bellos, E.; Tzivanidis, C.; Antonopoulos, K.A. Exergetic, energetic and financial evaluation of a solar driven absorption cooling system with various collector types. Appl. Therm. Eng. 2016, 102, 749–759. [Google Scholar] [CrossRef]
  23. Delač, B.; Pavković, B.; Lenić, K. Design, monitoring and dynamic model development of a solar heating and cooling system. Appl. Therm. Eng. 2018, 142, 489–501. [Google Scholar] [CrossRef]
  24. Neyer, D.; Ostheimer, M.; Hauer, N.; Halmdienst, C.; Pink, W. Application of an adapted single-/half-effect NH3/H2O absorption chiller in tri-generation and solar cooling systems. Sol. Energy 2018, 173, 715–727. [Google Scholar] [CrossRef]
  25. Calise, F.; Libertini, L.; Vicidomini, M. Dynamic simulation and thermoeconomic analysis of a novel solar cooling system for a triple-pressure combined cycle power plant. Energy Convers. Manag. 2018, 170, 82–96. [Google Scholar] [CrossRef]
  26. Jebasingh, V.K.; Herbert, G.M.J. A review of solar parabolic trough collector. Renew. Sustain. Energy Rev. 2016, 54, 1085–1091. [Google Scholar] [CrossRef]
  27. Wang, J.; Wang, J.; Zhang, Y.; Bi, X. Analysis of heat transfer characteristics for parabolic trough solar collector. Trans. Chin. Soc. Agric. Eng. 2015, 31, 185–192. [Google Scholar]
  28. Burkholder, F.; Kutscher, C.F. Heat Loss Testing of Schott’s 2008 PTR 70 Parabolic Trough Receiver; NREL/TP-550-45633 2012; National Renewable Energy Laborator: Golden, CO, USA, 2009.
  29. Chen, G. Thermal Performance Analysis and Experimental Study of Parabolic Trough Collector. Master’s Thesis, Chongqing University, Chongqing, China, 2012. [Google Scholar]
  30. Dong, Z.; Zhang, M.; Geng, S. Research on heat efficiency of solar paarabolic trough collectors. Energy Conserv. 2012, 7, 28–32. [Google Scholar]
  31. Dudley, V.E.; Kolb, G.J.; Mahoney, A.R.; Mancini, T.R.; Matthews, C.W.; Sloan, M.; Kearney, D. Test Results: SEGS LS-2 Solar Collector; SAND-94-1884ON: DE95010682; Sandia National Laboratories: Albuquerque, NM, USA, 1994; pp. 2506–2514.
  32. Wang, J.; Wu, J. Investigation of a mixed effect absorption chiller powered by jacket water and exhaust gas waste heat of internal combustion engine. Int. J. Refrig. 2015, 50, 193–206. [Google Scholar] [CrossRef]
  33. Zheng, J.J. Study of the Off-Design Performance of Absorption Chiller in Distributed Energy System. Master’s Thesis, Institute of Engineering Thermophysics, Chinese Academy of Sciences, Beijing, China, May 2012. [Google Scholar]
  34. Liu, L. The Simulation and Experimental Analysis of the Small Steam Absorption Chiller. Master’s Thesis, Hunan University, Changsha, Hunan, China, 2004. [Google Scholar]
  35. Wang, J.; Zhai, Z.; Jing, Y.; Zhang, C. Optimization design of BCHP system to maximize to save energy and reduce environmental impact. Energy 2010, 35, 3388–3398. [Google Scholar] [CrossRef]
Figure 1. Double-effect LiBr–H2O absorption chiller system driven by parabolic trough collector (PTC). HG—high-pressure generator; HX—high temperature exchanger; LG—low-pressure generator; LX—low temperature heat exchanger.
Energies 11 02679 g001
Figure 2. PTC structure diagram.
Energies 11 02679 g002
Figure 3. Thermal resistance model.
Energies 11 02679 g003
Figure 4. Variations in heat collecting efficiency and heat conducting oil (HCO) outlet temperature of the LS-2 PTC with the different direct normal irradiance (DNI) (the inlet temperature and flow rate of the HCO are 151 °C and 47.8 L/min, respectively).
Energies 11 02679 g004
Figure 5. Variations in heat collecting efficiency of the LS-2 PTC with the different DNI and HCO temperature (the mass flow of the HCO is 47.8 L/min).
Energies 11 02679 g005
Figure 6. Variations in heat collecting efficiency of the LS-2 PTC with the different DNI and HCO flow rate (the inlet temperature of the HCO is 151 °C).
Energies 11 02679 g006
Figure 7. Variations in the cooling load and COP with respect to the steam flow rate.
Energies 11 02679 g007
Figure 8. Hourly cooling loads and solar DNI in a typical day.
Energies 11 02679 g008
Figure 9. Variations in the flow rates of HCO and steam.
Energies 11 02679 g009
Figure 10. Variations in coefficient of performance (COP) and collecting efficiency of solar collector.
Energies 11 02679 g010
Figure 11. Hourly cooling loads for different buildings.
Energies 11 02679 g011
Table 1. Design parameters of the parabolic trough collector.
ParameterValueParameterValue
StructureTorsion tubeInside diameter of glass tube, m0.115
Concentration ratio71:1Thermal conductivity, W/m·K54
Length, m7.8Optical efficiency0.733
Opening width, m5Coating absorptivity0.915
Outside diameter of metal tube, m0.075Metal tube emissivity0.08
Inside diameter of metal tube, m0.067Glass tube emissivity0.88
Outside diameter of glass tube, m0.118Solar incidence angle modifier1.0
Table 2. Relative error of the outlet temperature of heat conducting oil (HCO) in the parabolic trough collector (PTC) model. DNI—direct normal irradiance.
NumberDNI, W/m2Inlet Temperature of HCO, °COutlet Temperature of HCO, °CRelative Error, %
Experimental DataSimulation Data
1933.7102.2124122.41.29
2968.2151.0173.3171.70.92
3982.3197.5219.5217.70.82
4909.5250.7269.4267.30.78
5937.7297.8316.9314.40.79
6880.6299.0317.2314.50.85
7920.9379.5398394.80.80
Table 3. Average relative error of each parameter of the absorption chiller.
Parametersm, kg/s T , °Cw, %Q, kWkA, kW/K
Average relative error0.056%0.038%00.01%0.015%
Table 4. Design parameters and performances of the absorption chiller on the work conditions. HG—high-pressure generator; HX—high temperature exchanger; LG—low-pressure generator; LX—low temperature heat exchanger; COP—coefficient of performance.
ParameterValueParameterValue
Steam temperature, °C158Heat efficiency of HX, %85
Steam pressure, MPa0.6Heat efficiency of LX, %85
Steam flow rate, kg/s0.3
Condensate temperature, °C71kAa of HG, kW/K36.48
Condensate pressure, MPa0.1kA of LG, kW/K111.7
Temperature of chilled water, °C7/12kA of the evaporator, kW/K191.2
Temperature of cooling water, °C35/30kA of the condenser, kW/K113.9
Evaporating temperature, °C3.878kA of the absorber, kW/K238
Condensing temperature, °C39COP1.332
a: kA is the product of the heat transfer area and the thermal conductivity coefficient of the equipment.
Table 5. Design parameters of the case study in the typical day.
ParameterValue
Solar collector area, m22886
Sets of collectors74
Arrangements (row/column)7/11
Inlet temperature of HCO, °C160
Outlet temperature of HCO, °C300
Cooling capacity of absorption chiller, kW1000
Pressure of steam, Mpa0.6
Steam temperature, °C158
Condensed water temperature, °C71
Table 6. Performance comparisons of solar cooling systems in different buildings. HST—heat storage tank.
ItemHotelShopping MallOffice
Cooling capacity, kW10001000750
Correlation coefficient0.160.720.80
Area of the PTC, m2288621841716
Number of LS-2 solar collector745644
Thermal storage ratio0.730.390.32
Capacity of HST, kWh899536332354
Thermal efficiency, %61.9868.7369.47

