Article

Lightning Breakdown Voltage Evaluation of Palm Oil and Coconut Oil as Transformer Oil under Quasi-Uniform Field Conditions

by
Nurul Izzatul Akma Katim
1,
Mohd Taufiq Ishak
1,*,
Nur Aqilah Mohamad Amin
1,
Mardhiah Hayati Abdul Hamid
1,
Khairol Amali Ahmad
1 and
Norhafiz Azis
2
1
Faculty of Engineering, Universiti Pertahanan Nasional Malaysia, Kem Sg Besi 57000, Malaysia
2
Centre for Electromagnetic and Lightning Protection Research, Universiti Putra Malaysia, Serdang 43400, Malaysia
*
Author to whom correspondence should be addressed.
Energies 2018, 11(10), 2676; https://doi.org/10.3390/en11102676
Submission received: 14 August 2018 / Revised: 6 September 2018 / Accepted: 6 September 2018 / Published: 9 October 2018
(This article belongs to the Section F: Electrical Engineering)

Abstract

:
This paper presents lightning (1.2/50 µs) breakdown voltages of palm oil (PO), coconut oil (CO) and mineral oil (MO) in a quasi-uniform sphere to sphere electric field at two gap distances. The type of PO used in this study is Refined Bleached Deodorized Palm Oil (RBDPO) Olein type. The effect of voltage polarities (positive and negative) and testing methods (rising voltage, up and down and multiple level) on the lightning breakdown performance were investigated. The results indicated that lightning breakdown voltages of CO and RBDPO are comparable to those of MO under various test conditions. The results indicated that there is no polarity effect for lightning impulse breakdown tests in a quasi-uniform field. The testing methods, including rising voltage method, up and down method and multiple level method have a notable influence on the breakdown voltages. The effect of the 50% breakdown voltage on rising voltage method, up and down method and multiple level method for RBDPO and CO is comparable to MO. The withstand voltage at 1% and 50% breakdown probabilities were obtained using the Normal distribution fitting on the cumulative probability plot of impulse shots. Based on a normal distribution fitting, withstand voltages 1% breakdown probability of POA were close to the MO. Finally, based on statistical studies and simulation using ANSYS software, the prediction formulas for breakdown voltage for larger gap distances for all samples were derived.

1. Introduction

Application of vegetable oils in power transformers has been investigated intensively in the past few decades [1,2,3,4,5,6,7,
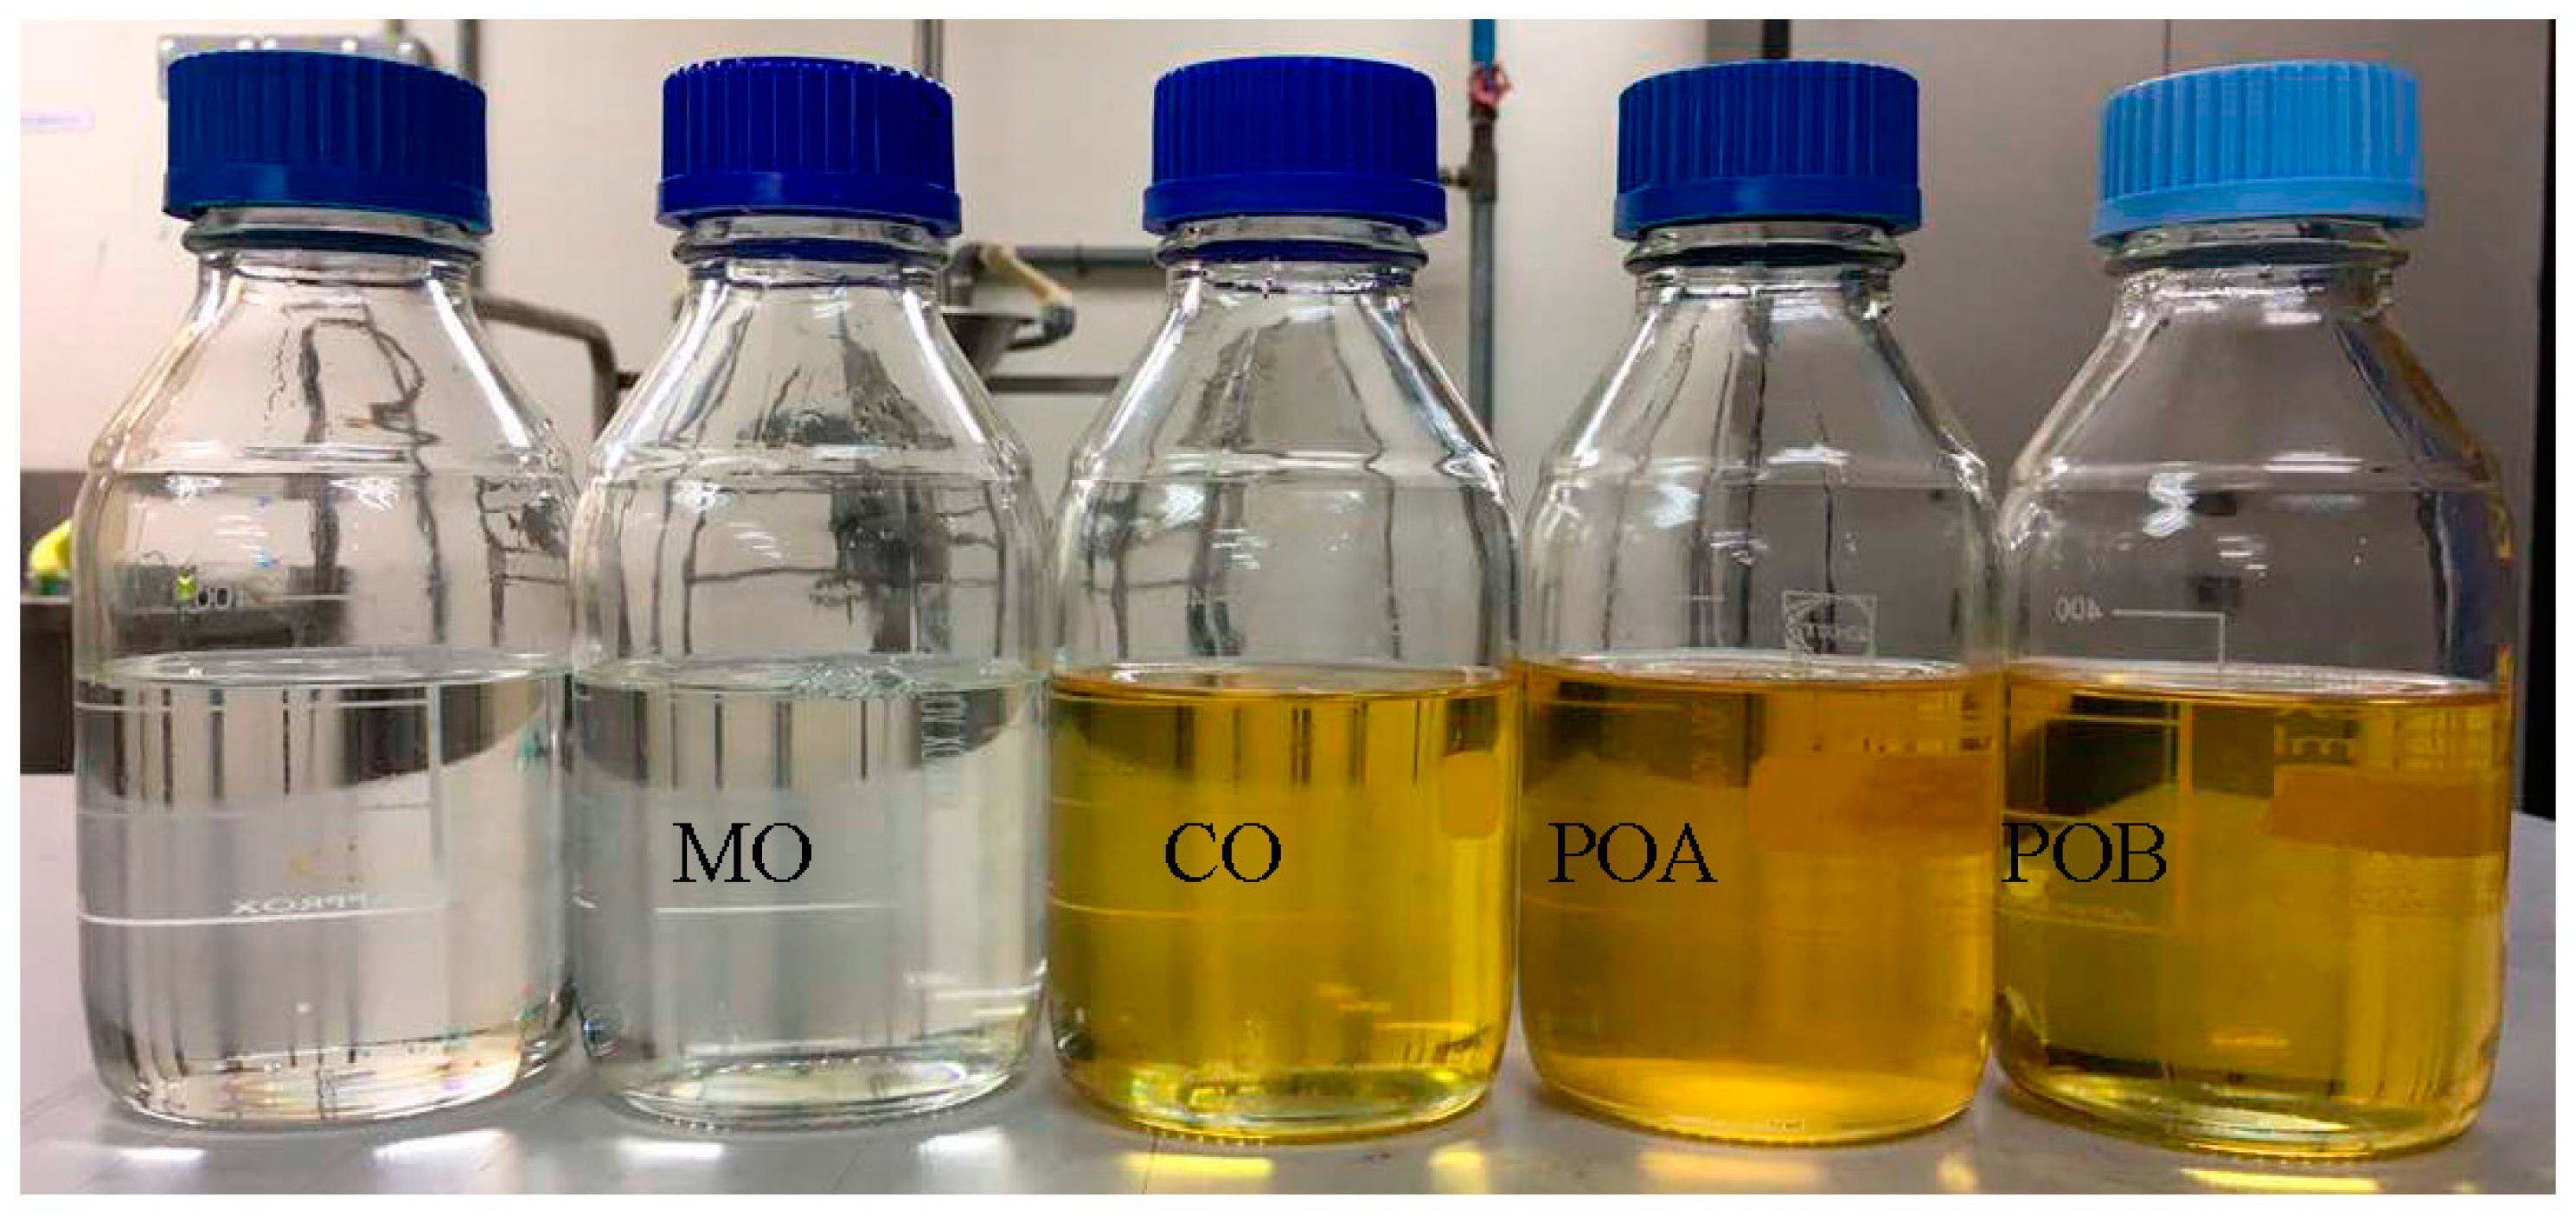
8]. Vegetable oils have been considered due to their better environmental performance and safety aspects, i.e., when decomposed, they produce almost no toxic products thus no pollution is created. Currently, vegetable oils produced from palm oil (PO) and coconut oil (CO) are being considered as dielectric liquids in transformers. Both these oils are biodegradable and non-toxic, which makes them desirable for transformer applications. A number of studies had been carried out on PO and CO covering different aspects such as their dielectric, chemical and physical properties and ageing characteristics [8,9,10,11,12,13,14]. It was found that their physical and chemical properties are closely similar to those of natural esters which have been widely used in transformers. In general, there are different types of PO that can be obtained from palm nuts. These are Crude Palm Oil (CPO), Palm Kernel Oil (PKO) and Refined, Bleached and Deodorized Palm Oil (RBDPO). CPO can be extracted from the mesocarp, while PKO can be extracted from the palm nut kernels. Further refining of CPO produces RBDPO. Then, RBDPO Olein is produced through a fractionation of RBDPO. On the other hand, PKO can be further reacted to become PKO Alkyl Ester [9,10]. Among these oils, RBDPO is the most commonly proposed for transformer applications. This is because it has a higher breakdown voltage and equality characteristics, i.e., low loss factor and high relative permittivity compared to mineral oil [3,9]. CO is a colourless to pale brownish-yellow liquid extracted from the kernel of mature coconut palms. After a purification processes involving neutralization, bleaching, and deodorization the properties of CO are suitable for use as a transformer oil [13].
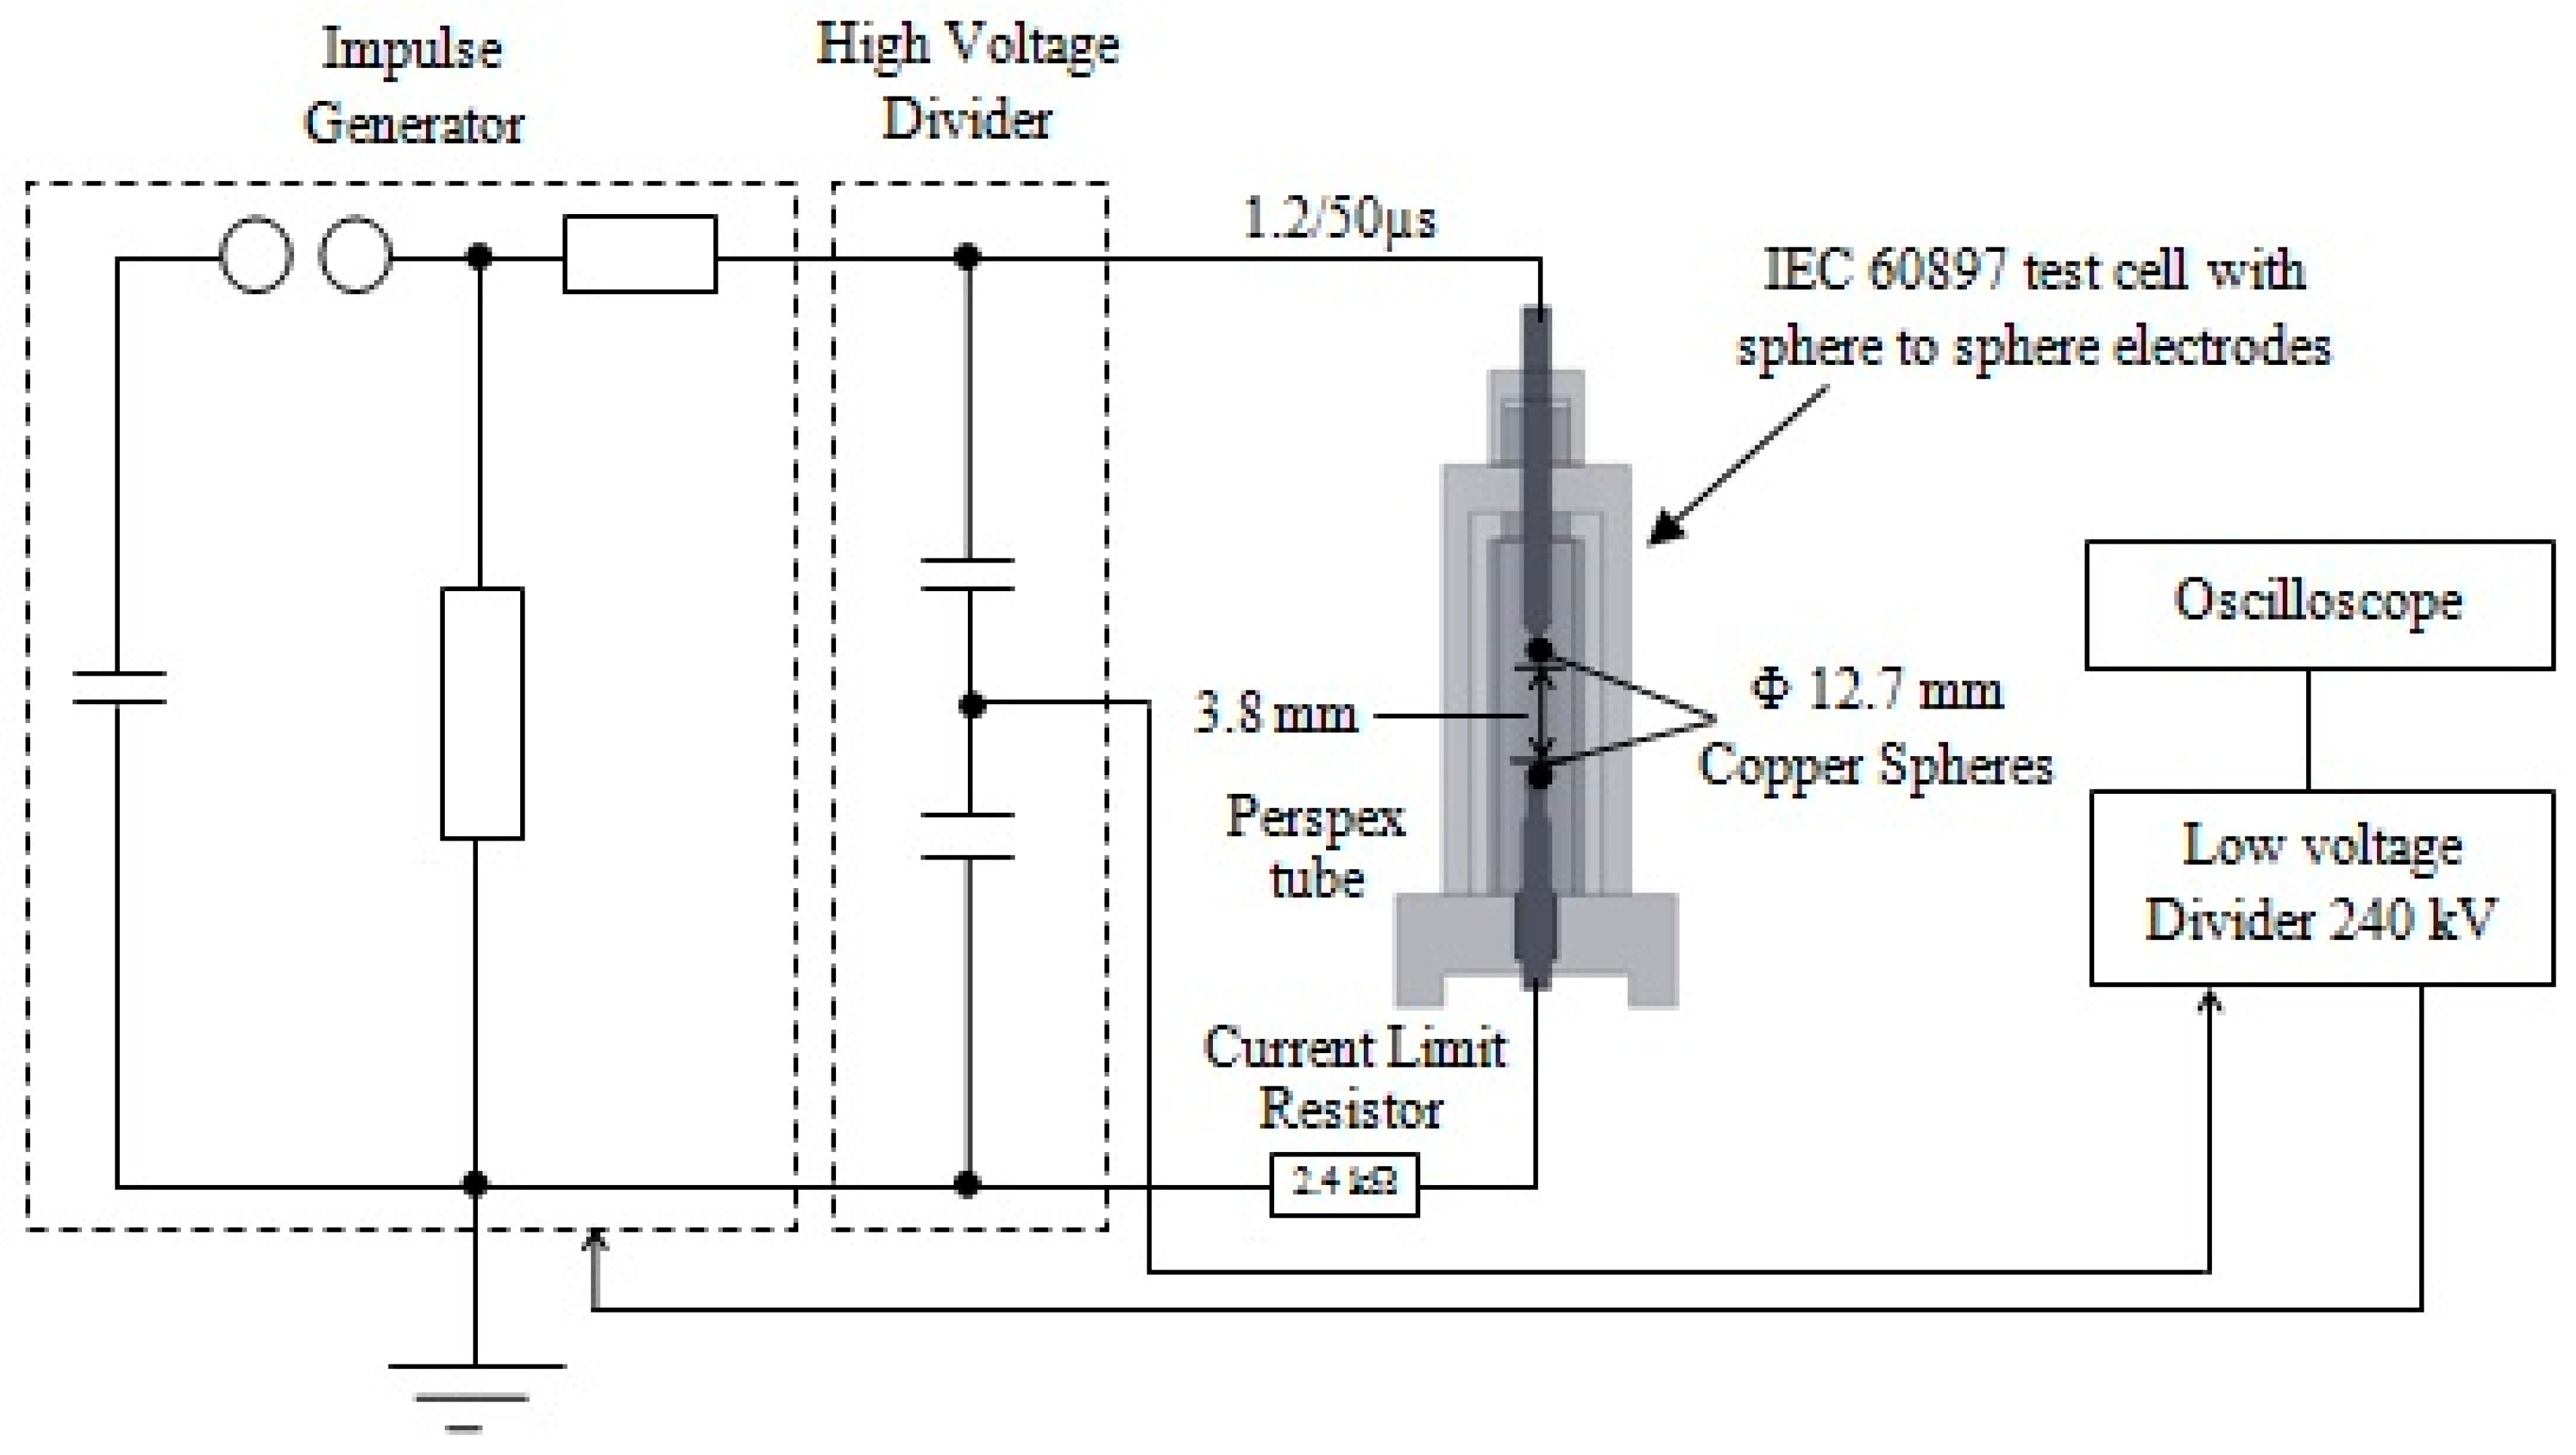
Lightning impulse breakdown voltage is commonly used as the insulation design criterion for large transformers. Therefore, it is usually required as a routine factory test for transformers with a power larger than 170 kV. An essential lightning impulse breakdown test needs to be performed before PO and CO can be considered as an insulating liquid for transformers. It can be performed under uniform, quasi-uniform, and non-uniform field conditions. The uniform and quasi-uniform fields can be represented by plane-plane and sphere-sphere electrode configurations. These configurations replicate the uniform and quasi-uniform fields experienced by the majority of insulation material inside a transformer, e.g., between turns, disks, and windings. These are usually tested to represent the in-service conditions in transformers. The non-uniform field can be created using either point-plane or point-sphere configurations which represent the imperfections that could occur in transformers.
Generally, the lightning impulse breakdown voltage of ester liquids investigated is either positive or negative in polarity [15,16,17,18,19,20,21,22,23,24,25]. In a non-uniform field, there is usually an obvious polarity effect that positive polarity results in a higher discharge inception voltage (but lower breakdown voltage) than negative polarity due to space charged issue. On the other hand, this event is not expected in a uniform/quasi-uniform field. This was confirmed by Liu [15], where no polarity effect was observed for both the ester liquids or mineral oil under uniform/quasi-uniform field conditions. This phenomenon is due to the symmetrical configuration of the electrodes. Liu also found out that the average lightning breakdown voltages of the ester liquids are slightly lower than the mineral oil under both positive and negative polarities.
Hemmer [26] performed another study by using a positive polarity lightning breakdown voltage for rape-seed oil at gap distances from 5 mm to 15 mm in a plane-plane electrode. The results indicated that the rape-seed oil has a similar breakdown voltage as mineral oil. In another study [18], it was observed that the lightning impulse tests for a larger gap in uniform/quasi-uniform fields become more difficult. This is due to larger volume of sample and the fact longer time is required for sample preparation. In that paper, the lightning breakdown voltages of FR3 natural ester (soya-seed- based oil) in quasi-uniform fields at gap distances between 12 mm to 50 mm was reported. The volume of oil used in the experiment was in the range of 210 to 2400 litres. The lightning impulse breakdown tests were conducted using the rising-voltage method. The lightning breakdown voltages of natural esters are comparable to mineral oil with a maximum of 17% reduction at the largest gap distance under both polarities.
Besides that, various testing methods, including rising-voltage method [26,27,28], up-and-down method [29,30] and multiple method [29,30] were used to test impulse strength of the vegetable oils. Thien [31] performed a study on the lightning breakdown voltages of PO and CO under non-uniform field conditions and found that there is a slight effect of the voltage polarities on the 50% breakdown voltages of PO and CO where the negative polarity gave higher 50% breakdown voltage than positive polarity. The authors also found that the multiple-level method has the highest breakdown voltages compared with the other methods. These results might not be valid for quasi-uniform electric field. Therefore, this paper tries to investigate the effect on the impulse breakdown voltages of PO, CO and mineral oil in a quasi-uniform electric field. The influences of testing methods and voltage polarity on the 50% breakdown voltages were also investigated. In addition, withstand voltage at 1% breakdown probability of PO and CO is deduced using statistical analysis. Finally, based on statistical studies and simulation using ANSYS software version 19.1, the equations, based on the combination of experiment data and simulation for all samples, were derived.

2. Experimental Description

2.1. Sample Processing and Procedures

The samples used in this study were MO, CO and three types of RBDPO Olein as shown in Figure 1. The RBDPO Olein and CO samples were obtained from readily available cooking oil products in the market. Table 1 presents the saturated, monounsaturated and polyunsaturated fat compositions fats for four different samples. It shows that RBDPOs has almost the same fat content as Olein (about 46%). The CO differs from RBDPO which is rich in saturated fat (about 90%). This high amount of saturated fat increases its melting point [9]. CO does not contain any vitamin A and E. However, the content of vitamin A and E have no noteworthy consequence on the lightning breakdown voltages of RBDPO, as reported by [9].
The “as-received” oil samples were filtered three times using a Thermo Fisher Nalgene membrane filter (ThermoFisher Scientific, Waltham, MA, USA) with a pore size of 0.2 µm. After being filtered, the oil samples were then degassed and dehydrated in a Memmert vacuum (Memmert GmbH + Co., Schwabach, Germany) oven at 85 °C under 500 Pa (5 mbar) for 48 h. Filtering and dehydrating the oils are important and crucial steps to minimize the impurities such as particulates and moisture in the samples that will affect the experimental outcomes. The oil samples were given a further 24 h to cool down to ambient temperature under vacuum and were used instantaneously in determining the lightning impulse breakdown voltage.

2.2. Test Methods for the Lightning Breakdown Voltage

Figure 2 shows the configuration for the lightning impulse breakdown voltage test. A 2-stage TERCO impulse generator (Terco, Kungens Kurva, Sweden was used to provide the 1.2 (±30%)/50 (±20%) µs lightning impulse voltages of increasing crest value. The voltage was injected to the liquid until the breakdown occurs. A 2.4 kΩ current-limiting resistor was inserted in series with the circuit to protect the equipment and to avoid excessive decomposition of the liquid at the instant of breakdown which may affect the results [31]. The lightning impulse breakdown voltage test was carried out based on sphere-sphere electrode configuration to simulate quasi-uniform electric field. A cylindrical test cell was made from a transparent perspex with a volume of 300 mL according to IEC 60897 and ASTM-D3300 standards [27,28]. Both spherical copper electrodes were made of copper and consist of a bearing ball with 12.7 mm in diameter. All the tests were performed at 2.0 mm and 3.8 mm gap distances under both positive and negative voltage polarities.

2.3. Testing Methods

2.3.1. Rising Voltage Method

The rising voltage method is usually used to investigate how the insulation recovers its insulating capacity after breakdown. It can be performed under both AC and impulse conditions. In this method, for one set of testing, the applied voltage is increased at a specified rate (kV/s) from specified initial voltage until breakdowns occur. Next, the applied voltage is reduced and previous procedure was repeated. The initial voltage level for this study was set at 70 kV for 2.0 mm and 150 kV for 3.8 mm with the increasing step voltage of 5 kV [15,21,27]. The procedure was repeated with the time interval between each breakdown was set to 60 s. The considerable time interval between two breakdowns is to allow the recovery process to occur and foster low electrical stresses in the region of the initial voltage. A total of 15 breakdowns for each type of sample was obtained.

2.3.2. Up and Down Method

This method was proposed by Dixon and Mood based on an estimation of the normal distribution of 50% breakdown voltages [15,21,32]. In this method, the initial voltage is set and increased in a fixed step voltage of ΔU until the first breakdown occurs. Then, the voltage is reduced by the same step of a fixed amplitude ΔU by decreasing step by step until breakdown does not occur. The steps are repeated and recorded after a certain number of breakdowns. The average value of the applied voltages is marked as the 50% breakdown voltage. The initial voltage level for all gap distances in this study was set to 70 kV and 150 kV. The fixed step voltage, ΔU was set to 5 kV, with 60 s of the time interval between each breakdown event. A total of 30 shots was applied for each set of samples.

2.3.3. Multiple Level Methods

A multi-level method is also known as a constant voltage method where the method is used to determine the breakdown probability [32]. A fixed number of shots are applied at various voltage levels and the number of breakdowns at each voltage level is recorded. From the breakdown voltage results, a cumulative frequency plot is carried out and the breakdown voltage can be determined. In this study, 20 shots were applied at each voltage level with charging time interval of 60 s and a step voltage, ΔU of 5 kV for each shot. Initial voltage level for all gap distances was set to 100 kV and 150 kV.

3. Results and Analysis of Data

3.1. Polarity Effect on Breakdown Voltages

The 50% lightning breakdown voltages under positive and negative polarities of the samples are given in Table 2 and 
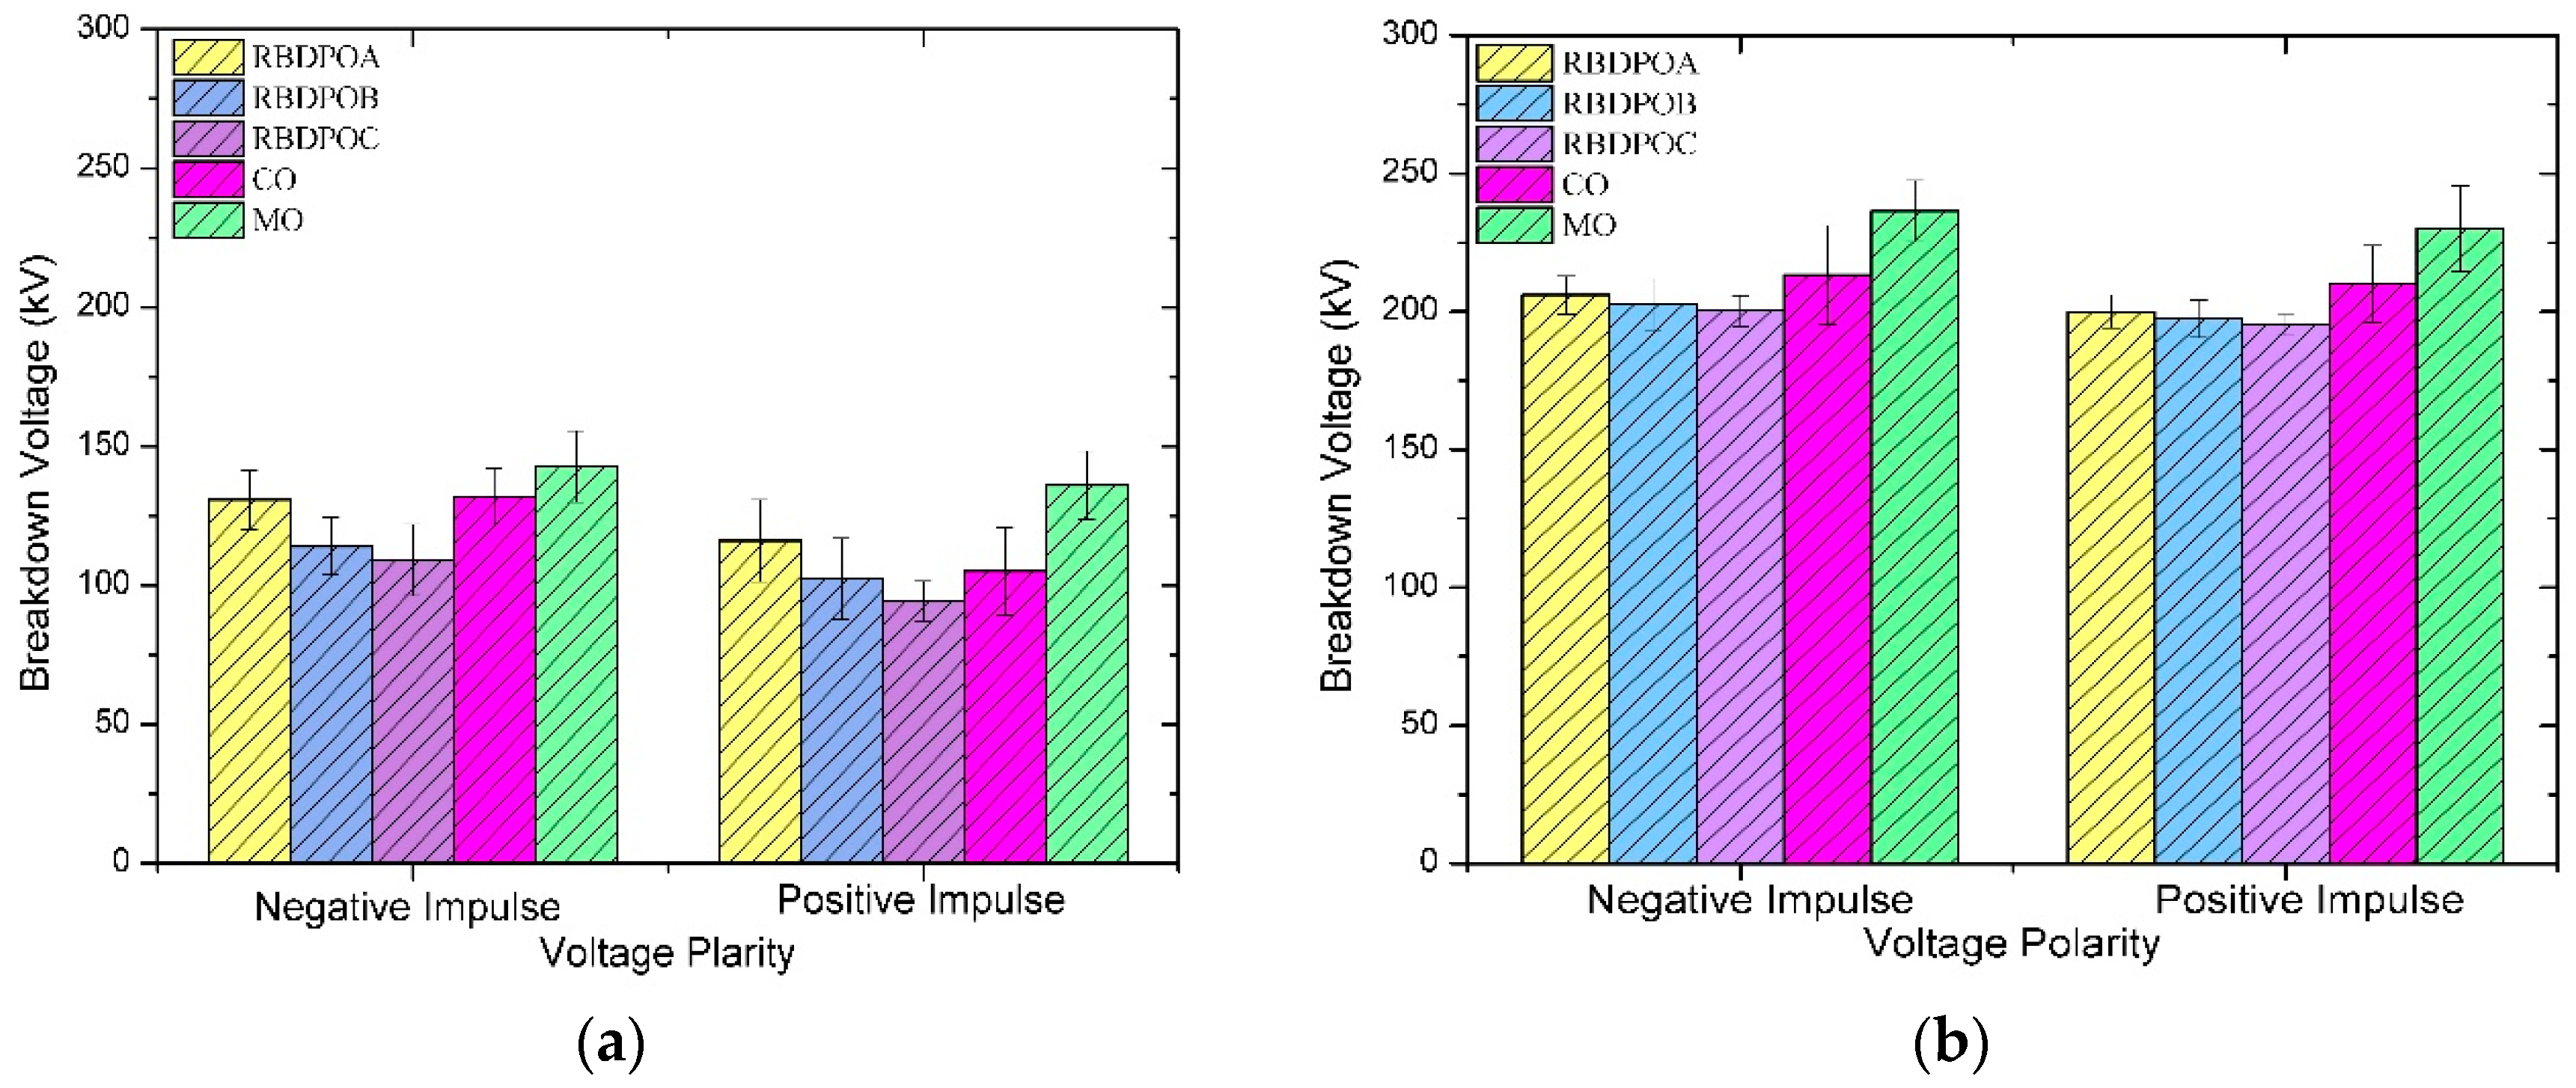
Table 3. From the tables, under negative polarity at 3.8 mm gap distance, the mean breakdown voltage of MO is the highest at 236.33 kV, followed by CO (217.83 kV), POA (206 kV), POB (202.67 kV) and then POC with 200.33 kV, whereas, under positive polarity at the same gap distance, the mean breakdown voltage of MO is also the highest at 230 kV followed by CO, POA, POB and POC with 210 kV, 200 kV, 197.33 kV and 195.33 kV, respectively. Based on Table 2, under both positive and negative voltage polarities, MO has the highest breakdown voltage among all the types of oils. A cross comparison of the effect of polarities on LI breakdown voltages between PO, CO and MO is plotted in Figure 3.
Using mineral oil as the baseline, under positive polarity, the highest percentages of difference on the 50% breakdown voltages between RBDPO and MO, are 24.7% (POC) at 2 mm gap and 15.1% (POC) at 3.8 mm gap. While CO has 3.4% (2.0 mm) and 8.7% (3.8 mm) percentages of difference in the breakdown voltages compared to mineral oil. On the other hand, under negative polarity, the highest percentage of difference on the 50% breakdown voltages between RBDPO and MO, are 22.3% (POC) at 2 mm gap and 15.2% (POC) at 3.8 mm gap, while CO has 4.8% (2.0 mm) and 7.8% (3.8 mm) percentages of difference in the breakdown voltages compared to mineral oil.
The highest percentage of differences in the 50% breakdown voltage of RBDPO between positive and negative voltage polarities at 2.0 mm and 3.8 mm gaps are 5.2 % (POB) and 3.0 % (POA) respectively, while for CO and MO, the highest differences between positive and negative polarities at 2.0 mm gap, are 3.7% and 1.2% respectively. For the 3.8 mm gap, the percentage differences between positive and negative polarities, are 2.8% and 3.7%. The percentage of difference for both polarities under difference gap distances is less than 5% for all oil samples. As seen in the results, the breakdown voltage under negative polarity is almost similar to that under positive for the same gap distance. This might be due to space charge issue in a uniform field as mentioned by Liu. Normally in a non-uniform field, there is usually an obvious polarity effect found in which the negative polarity LI breakdown voltages result in a lower discharge inception voltage but a higher breakdown voltage than positive polarity. However, such a phenomenon is not expected in a uniform field due to the symmetric configuration. The results from this study and supported by the previous work by Liu [21], confirm that there is no polarity effect for both the vegetable oil and the mineral oil under quasi-uniform electric field.

3.2. Testing Methods Effect on the Breakdown Voltage

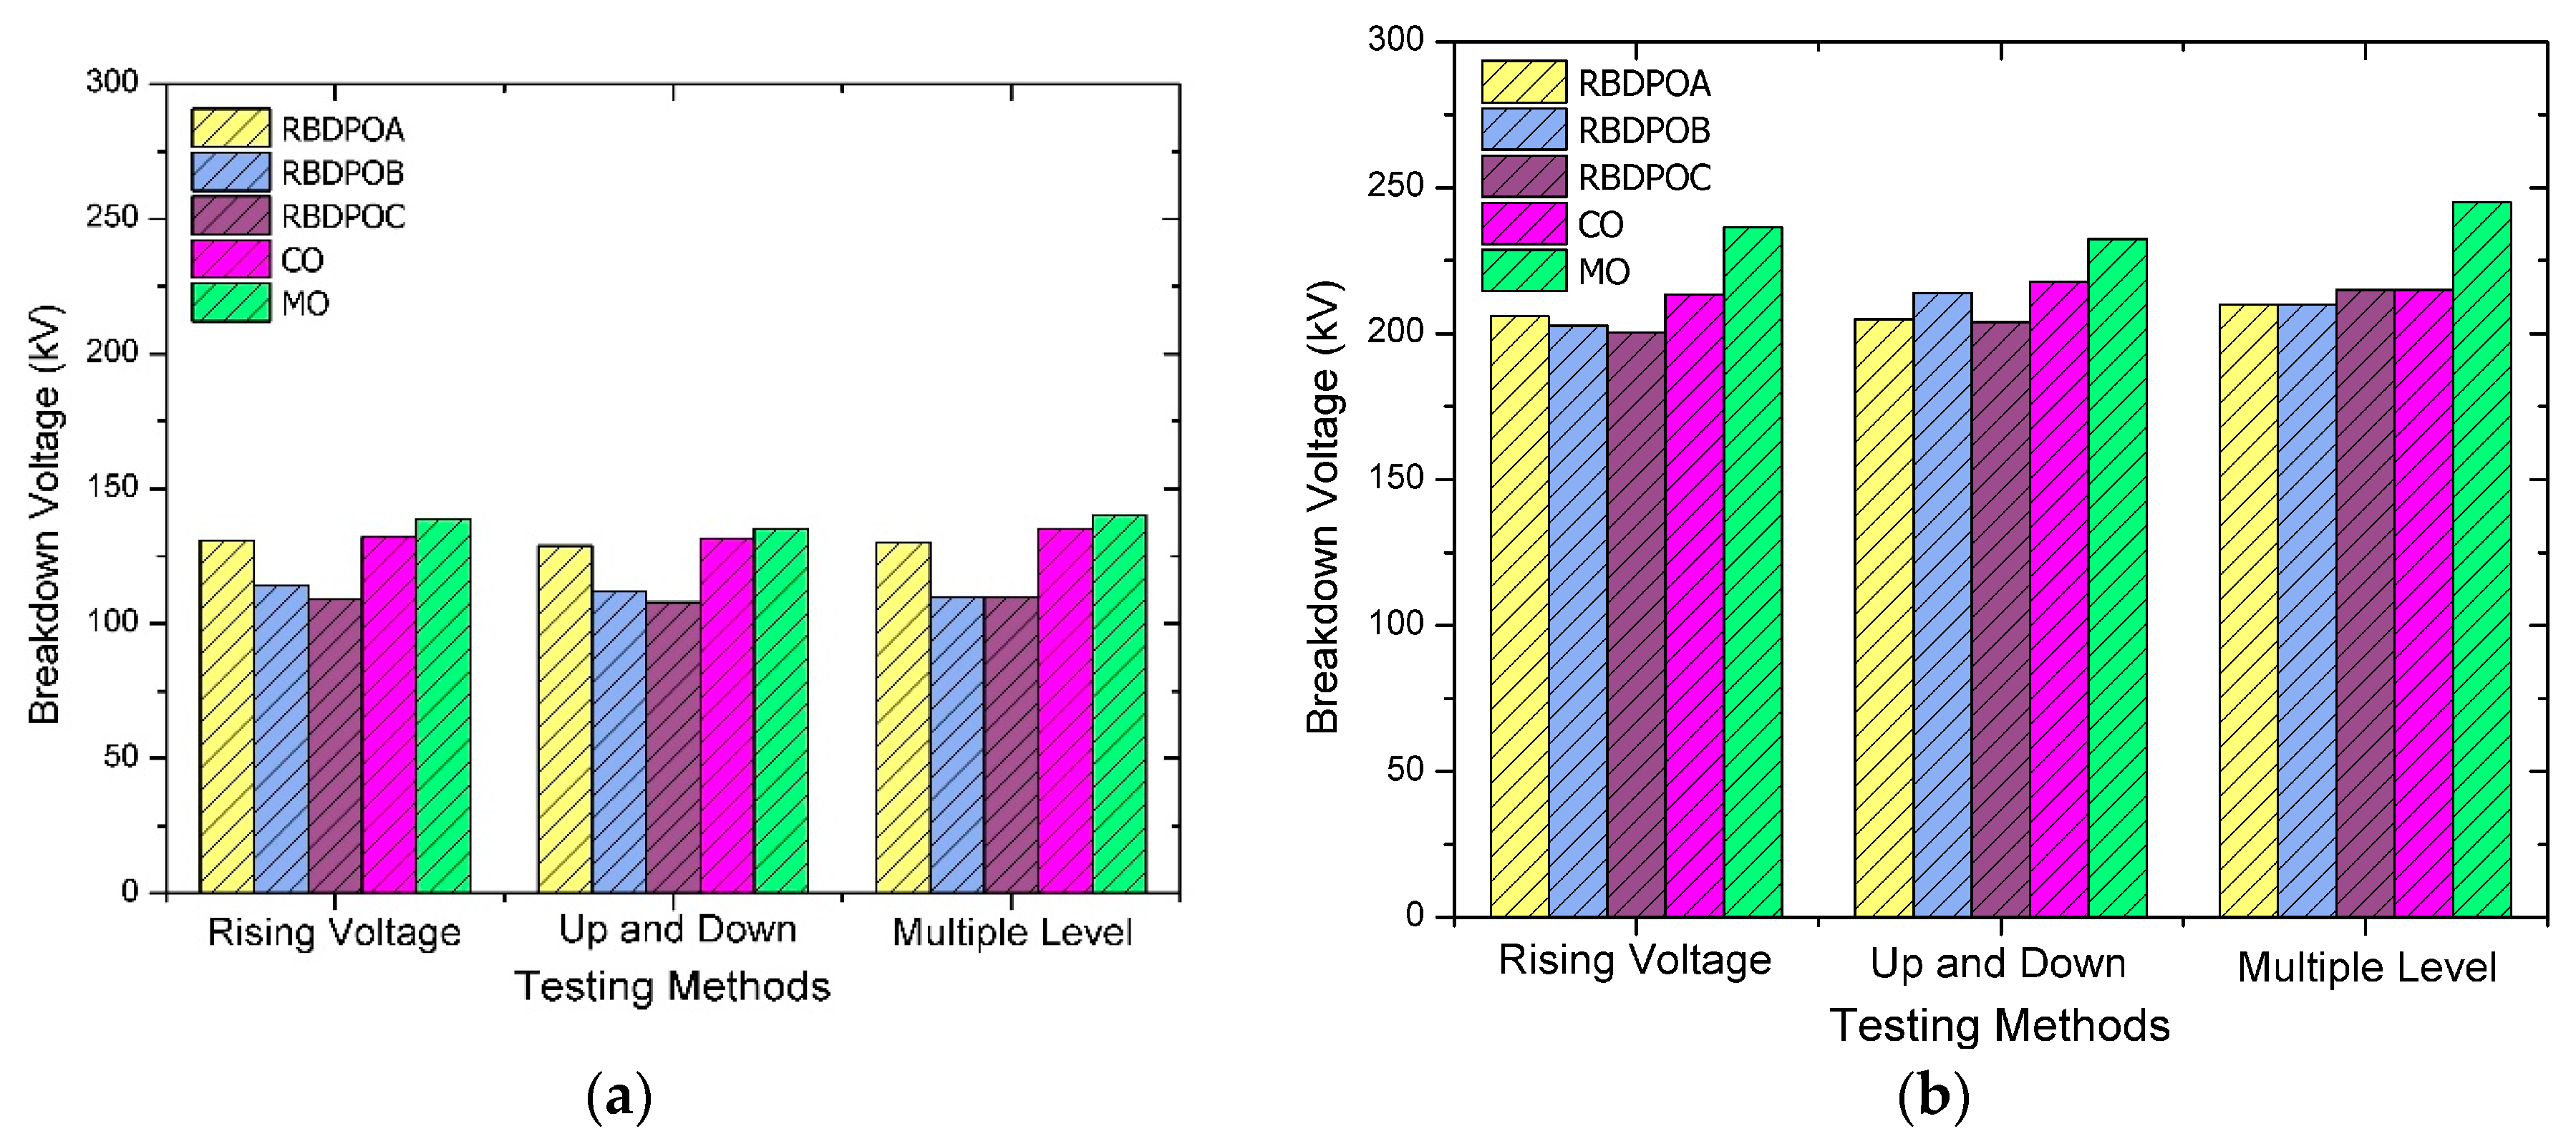
In this section, various testing methods were used for the lightning breakdown tests such as rising voltage, up and down and multiple level methods. Negative polarity was used in this study since the results in the negative polarity still valid for positive polarity based on the previous studies. The 50% lightning breakdown voltages of RBDPO, CO and MO are summarized in Table 4 and the cross-comparison of impulse breakdown voltages between the oil samples is plotted in Figure 4.
Taking the rising voltage method as a reference, at 2.0 mm gap, it can be seen in Table 4 that the multi-level method having the highest percentage of differences among the methods with the biggest differences can be seen in POB with 5.3%, followed by CO with 2.3%, MO with 1%, POC with 0.9% and lastly POA with 0.5%. For the up and down method, the highest percentage difference can be seen for MO with 2.5% and CO has the lowest percentage difference with 0.4%. However, as the gap distance increases, the percentage differences in all the testing methods show increases with the multiple-level method still having the highest percentage difference with 7% for POC. For the up and down method, POB has the highest percentage difference between the oils with 5.6% and CO shows no changes in the breakdown voltage, when compared to the rising-up method at 3.8 mm gap.
It can be seen that the POs have comparable 50% breakdown voltages with CO at various gap distances and testing methods where the highest percentage of difference is less than 6%, whereas, PO and CO have lower breakdown voltages compared to MO with the highest percentage of difference being less than 20% for all methods and gap distances, which is close to the previous finding [21]. The 50% breakdown voltage of all samples for all testing methods under negative polarity is slightly higher than that under positive polarity and this agrees with the previous results. The multiple-level method always has the highest impulse breakdown voltage for all samples at both gap distances under various testing methods, followed by the rising voltage and up and down methods.
From this study, it is found that the testing methods have a notable influence on the measured breakdown voltage in which for all testing methods under both polarities and gap distances, the percentage of difference is less than 10%, in agreement with the previous study [21]. The multi-level method has the highest percentage of difference for all cases. In addition the multi-level method and rising up method provide the closest results to each other, which generally are higher than those obtained using the up and down method. However, no matter which testing methods were used, PO and CO always showed lower breakdown voltages than MO. This might be due to streamer propagation in vegetable oils being different from in mineral oil. The previous studies in a divergent field and uniform/quasi uniform field [15,21,29,33,34,35] showed that the ester liquids have lower impulse breakdown voltages, especially at larger gaps, than mineral oil. This is because streamers in the vegetable oils propagate faster and further than in the mineral oil at the same voltage level. Liu [21,33] mentioned that the average time to breakdown for ester oils is approximated 3.8 μs compared to 5.7 μs in mineral oil. He also mentioned that, under positive polarity, the streamer velocity in vegetable oil is around 10 km/s at 50 mm of oil gap and reaches 30 km/s at 100 mm. The streamer velocity in mineral oil remains at a constant speed at 1–2 km/s under positive polarity.
From this study we can also say that all the testing methods are suitable to be used in the lightning impulse breakdown study since only a small difference in terms of breakdown voltage was found in this study. However, a rising voltage method is always the preferred method and is adopted by the IEC 60897 and ASTM D3300 standards since this method requires less time to obtain the results, the testing is easy to do and the results are consistent.

3.3. Determination of Lightning Withstands Voltage

Withstand voltage is critically important for the design of power transformer insulation. The normal distribution is usually used to fit the breakdown data, and the withstand voltage can be determined based on the fitted curve. By considering the breakdown voltages from the results obtained from different testing methods, a withstand voltage and breakdown probabilities can be determined. The normal distribution F(x) is given as follows:
F ( x ) = 1 2 π σ 2 E e ( x μ ) 2 2 σ 2 d x
where μ is the mean and σ is the standard deviation.
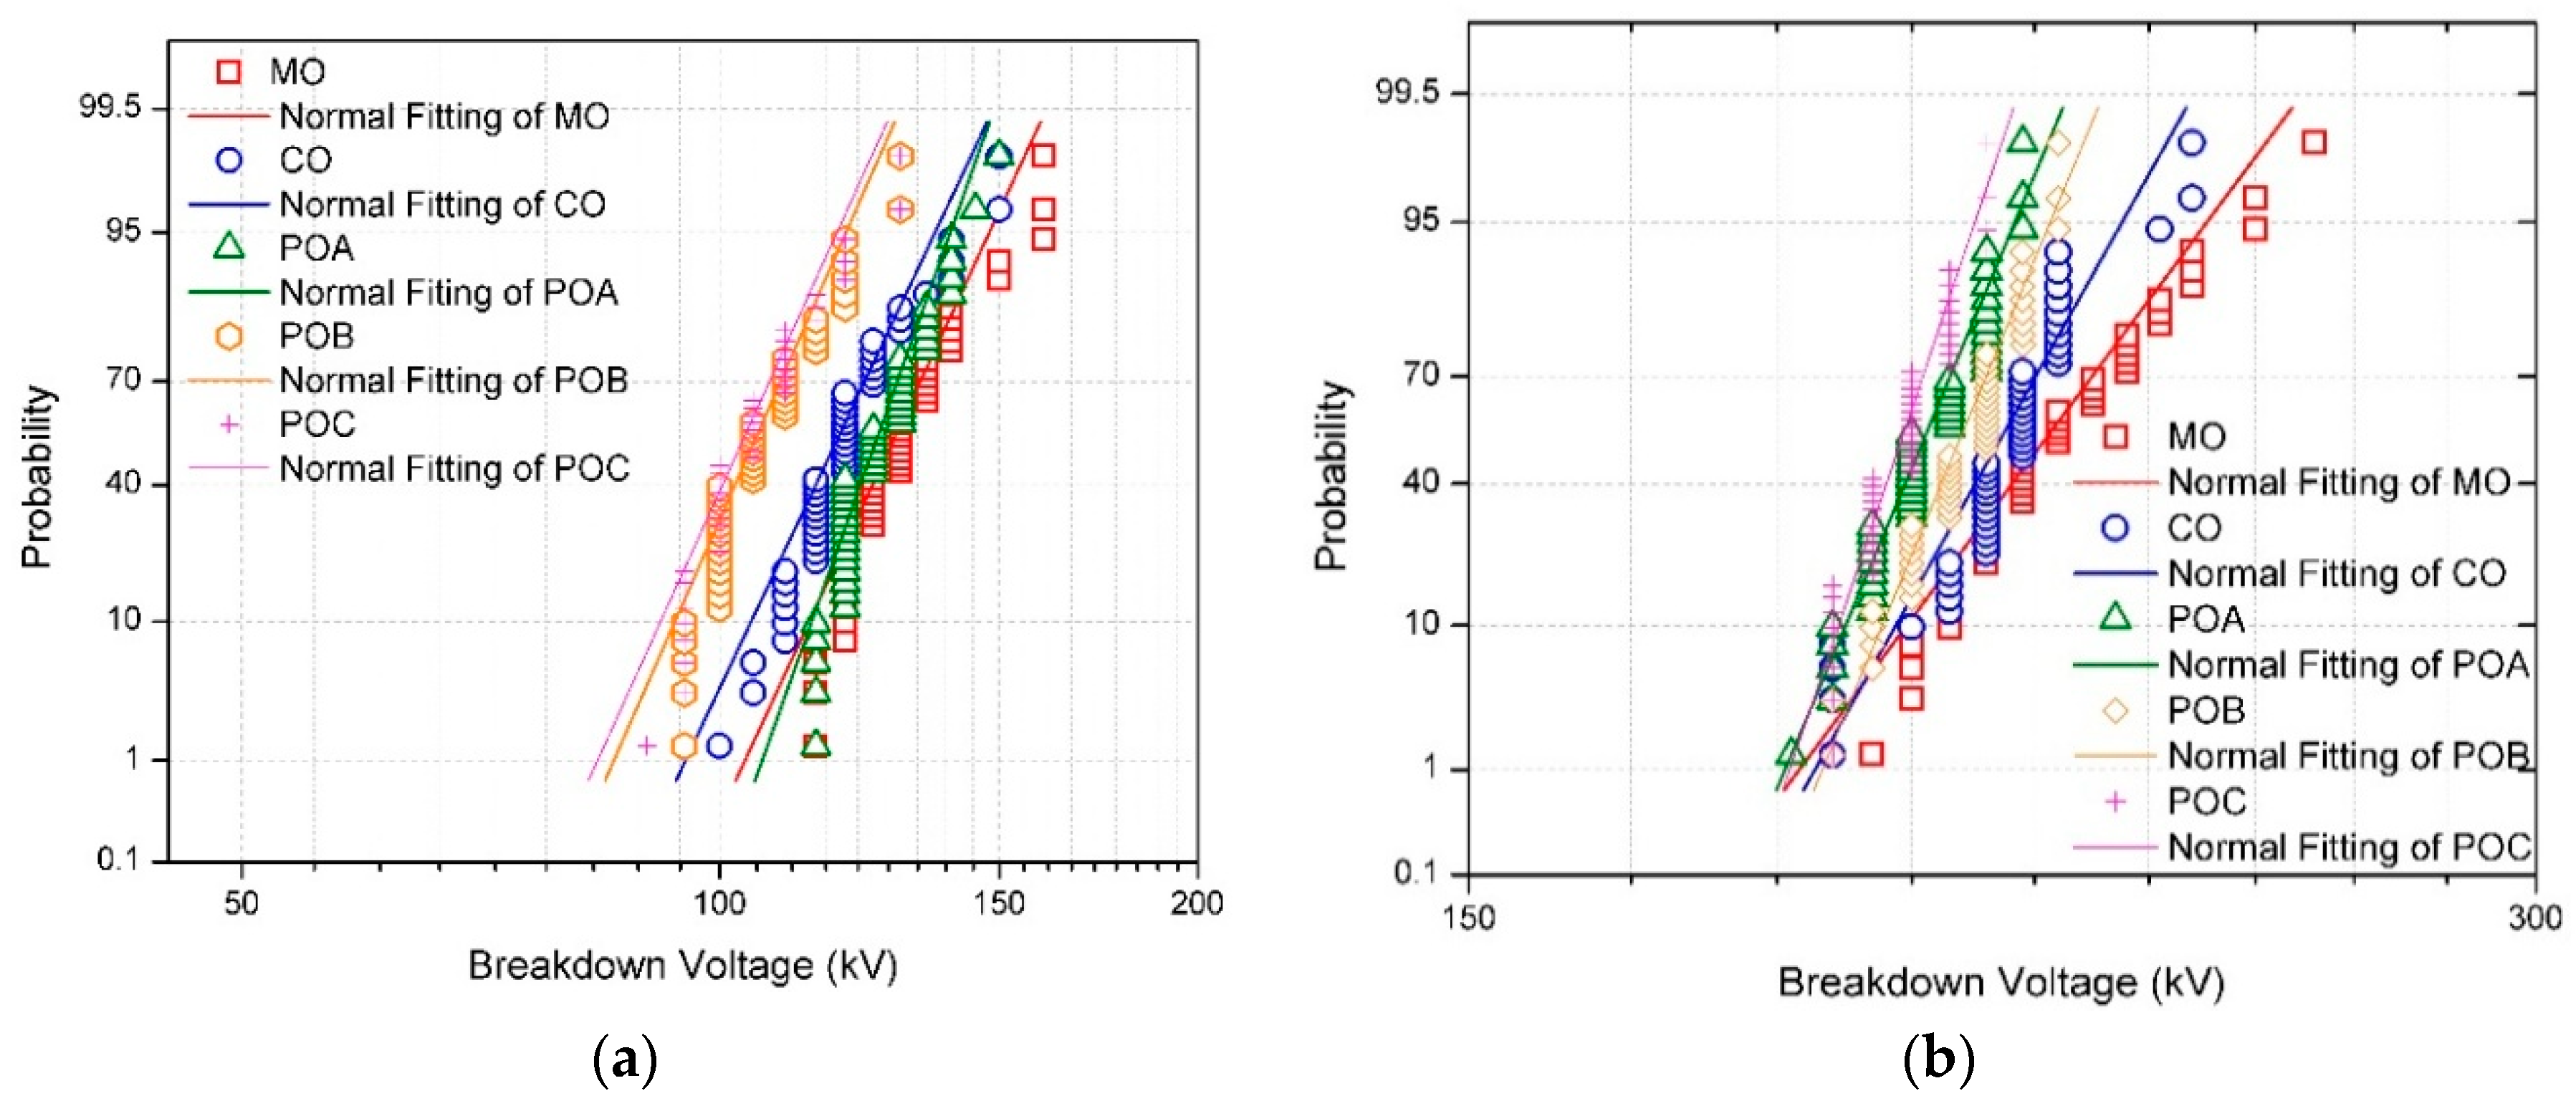
The breakdown voltages and the normal fitting results are shown in Figure 5 for different gap distances and negative polarities. The estimation of withstand breakdown voltages at 1% probability and 50% probability of failure for lightning breakdown voltages of all samples can be determined using statistical analysis. A distribution is considered a good fit if the data points follow a straight line.
Between the failure rates of 10% and 90%, all the distributions give relatively similar fittings of the measurement results of the breakdown voltages for PO, CO and MO. However, at low failure rates (<10%) and high failure rates (>90%), the normal distribution gives larger prediction values than measurement results of the breakdown voltages. The findings are different for 3.8 mm gap distance where for high failure rates (>95%), the normal distribution gives lower prediction values than the measurement results of CO and MO breakdown voltages. However, at lower failure rates, the measurement results fit well with the normal distribution prediction for all oil samples except the mineral oil for which the normal distribution predicts lower values than the measured results.
Table 5 indicates the breakdown probabilities for negative polarity at 2.0 mm and 3.8 mm gap distances. The 50% breakdown voltages of PO and CO are lower than that of mineral oil, which is consistent with the conclusions previously drawn using various testing methods. Under negative polarity and at 2.0 mm gap distance, the difference on the breakdown voltages among RBDPO samples at 1% and 50% probability are between 14% and 21% as shown in Table 5. The breakdown voltages of CO are slightly higher than POB and POC but slightly lower than POA. The difference on the breakdown voltages between CO and PO at 1% and 50%, where the highest are 12% and 13% respectively. On the other hand, the breakdown voltages of RBDPO and CO are much lower than MO where the highest percentages of differences on the breakdown voltage at 1% and 50% probabilities are 22% and 20%, respectively.
Under 3.8 mm gap distance, the difference on the breakdown voltages among RBDPO samples at 1% and 50% probability are between 2% and 5% as shown in Table 5. The breakdown voltages of CO are slightly higher than RBDPO samples, similar to the 2.00 mm gap distance. The difference in the breakdown voltages between CO and PO at 1% and 50% where the highest percentage of difference are 2% and 7%, respectively. Similar to the previous results, the breakdown voltages of RBDPO and CO are much lower than MO where the highest percentages of differences on the breakdown voltage at 1% and 50% probability are 3% and 10% respectively.
As seen in Table 5, the 50% breakdown voltages of vegetable oils are lower than that of mineral oil, which is consistent with previously drawn conclusions using various testing methods. Moving down to the lower breakdown probability, the difference between the vegetable oils and the mineral oil becomes smaller. The withstand voltage is always be used for the safety requirements of transformer insulation design. It also determines the amount of insulation material used in the transformer, and thus the size of the transformer. For example, if the withstand voltage of an insulating liquid is small, larger bulk oil gaps should be provided to meet the safety of a transformer. In case of POA, the withstand voltage of POA is close to mineral oil under both gap distances and the best results among the vegetable oils. Therefore the transformer designer might use a similar transformer design for using POA as insulating liquid.

3.4. Dielectric Strength Characteristics

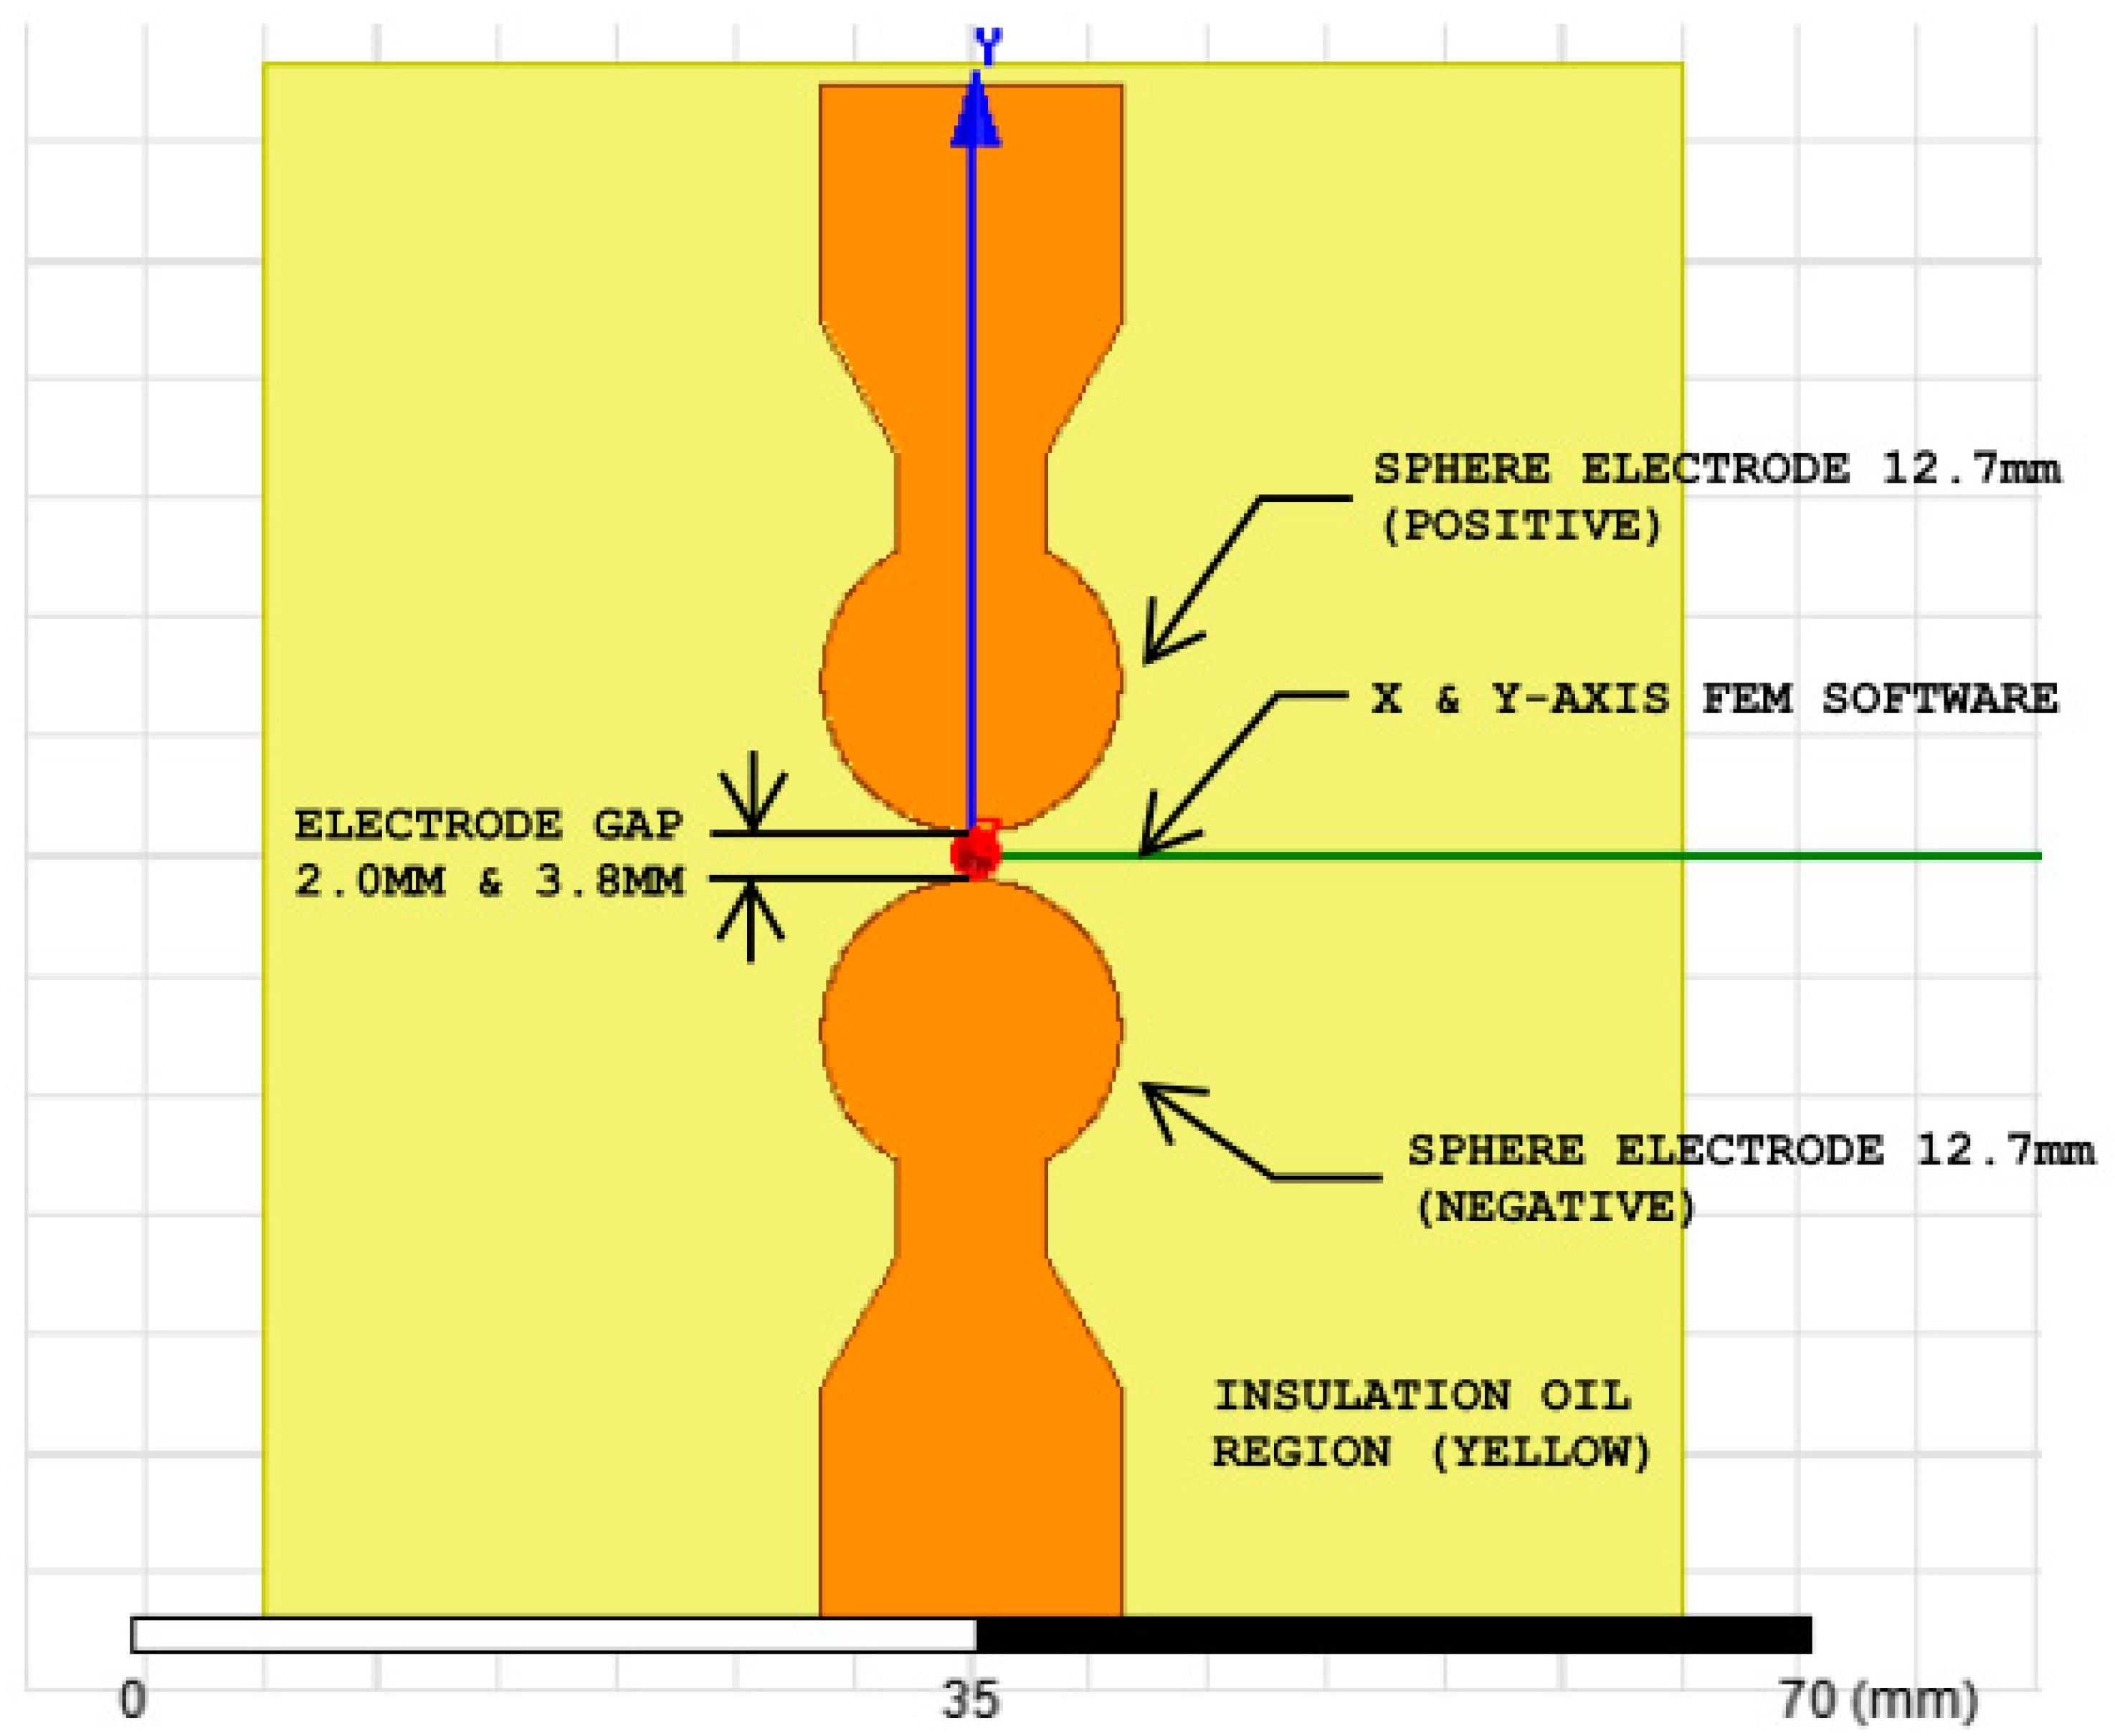
The dielectric strength (electric field strength) is defined as the maximum stress which the insulation can withstand before breakdown. It depends on the insulation material, impurities and the geometries of the electrodes under the applied electric field. In this paper, the 2D of finite element method (FEM) model of sphere-to-sphere electrode with real geometrical dimension was developed in ANSYS Maxwell software as shown in Figure 6. ANSYS Maxwell software is a powerful interactive environment for modeling and solving of engineering problems based on partial different equations (PDEs). The input parameters such as material, relative permittivity and conductivity of copper conductor and oils were obtained from the experiments are shown in Table 6. All the parameters were obtained from the experiment using ADTR-2K Plus measuring equipment. The lightning injected voltage in this simulation was simulated using a double exponential curves [36] as shown in Equation (2):
V = V o   ( e α t e β t )
where, α = 14700, β = 2,470,000 and Vo is the charging voltage. In this analysis, the 50% breakdown measurements obtained from the experiments were used in the calculation and simulation of breakdown strength.
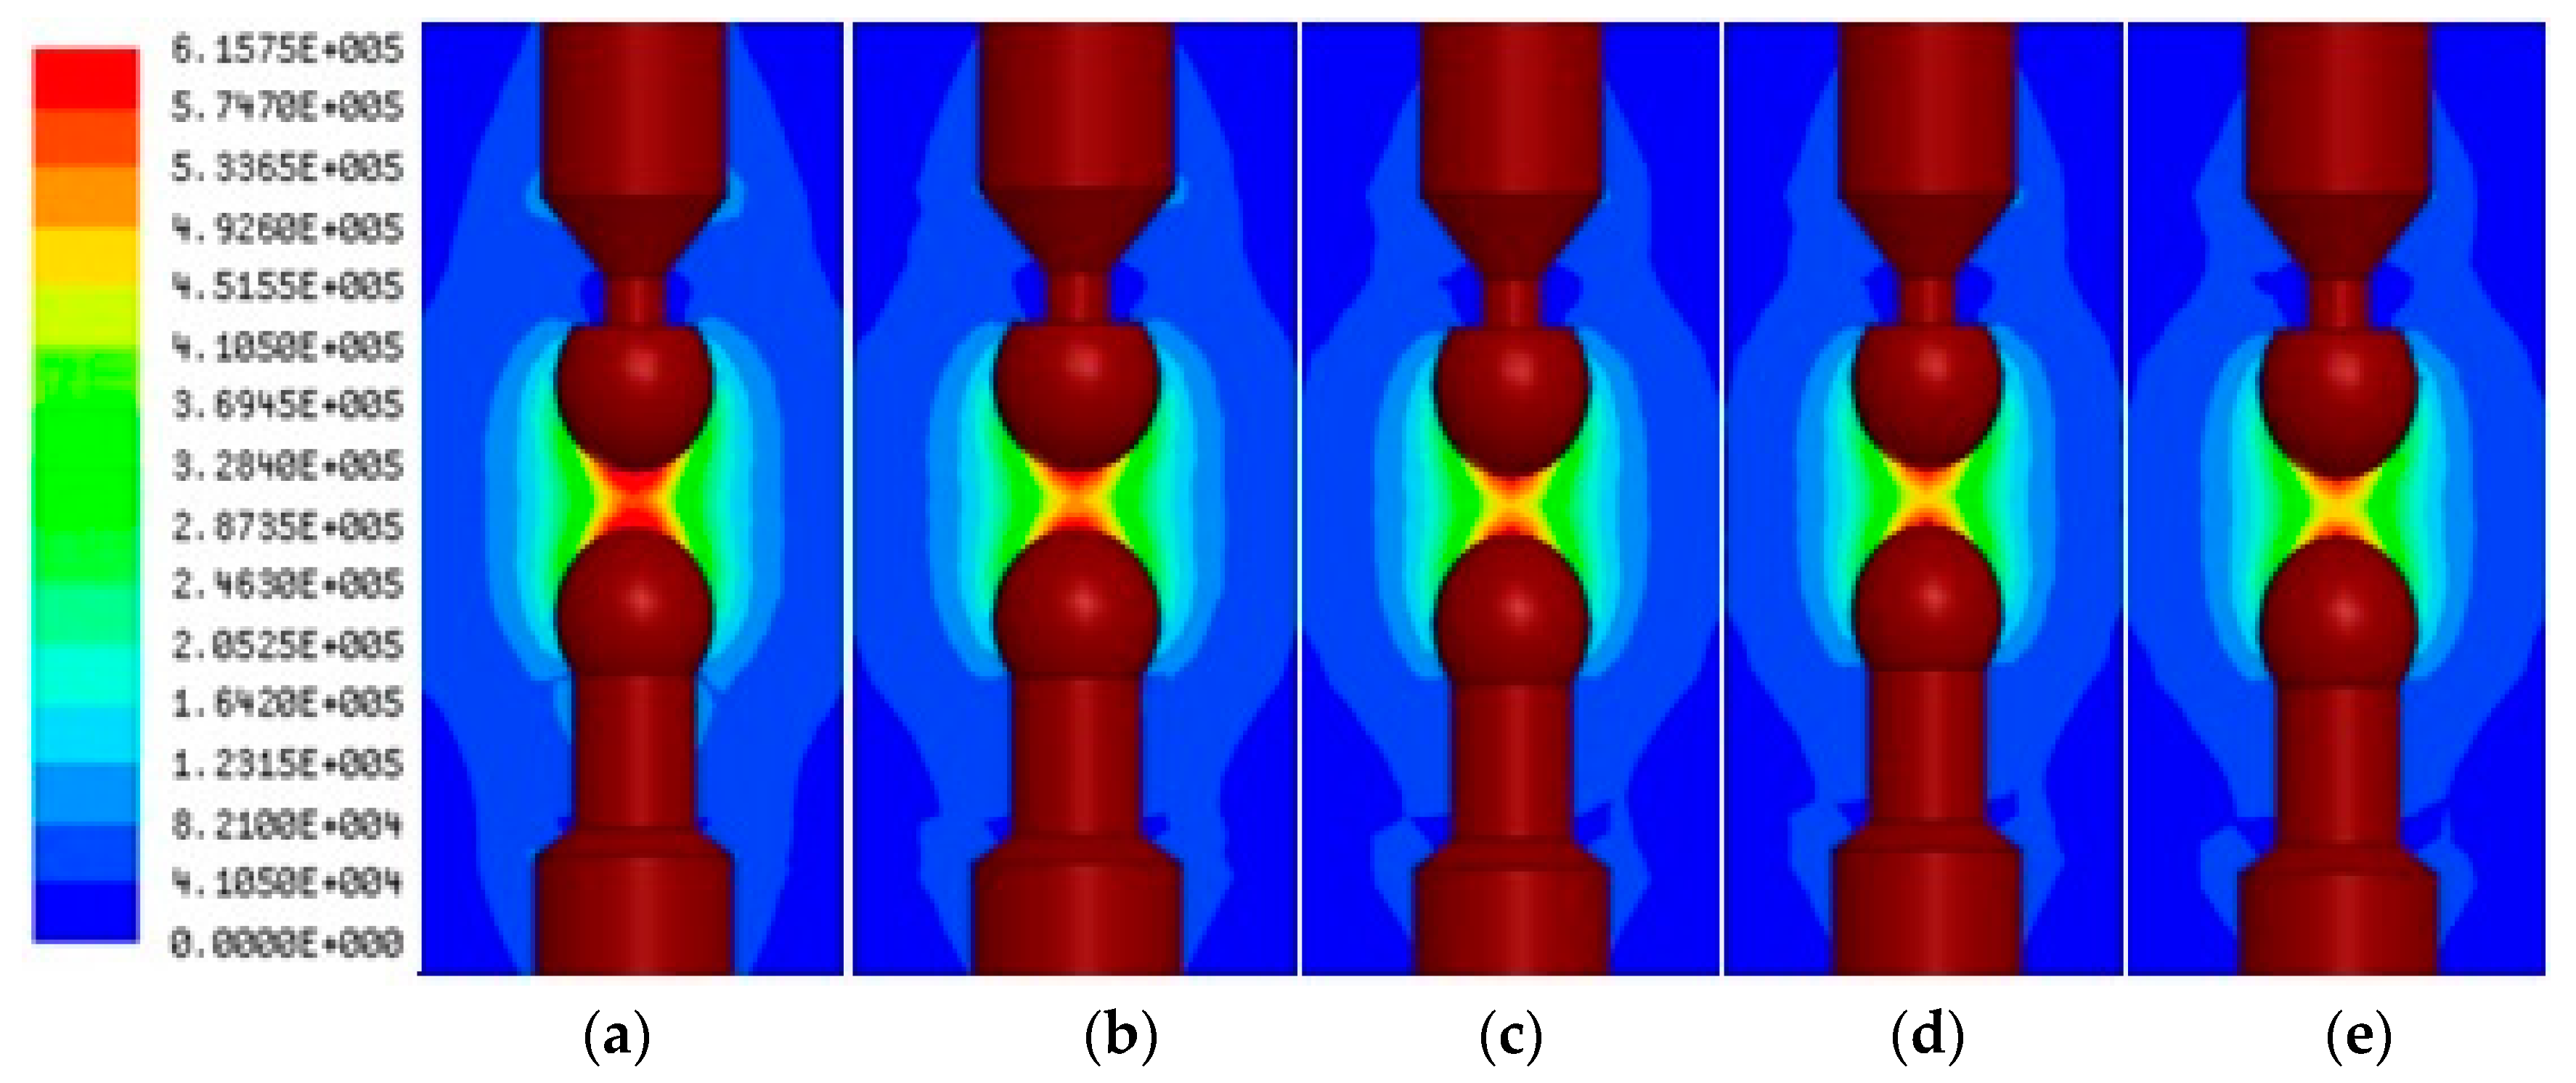
The simulated electric field distribution of 2D for the spherical electrode system is illustrated in Figure 7. As shown in the figure, a strong electric field intensity was detected in MO and then followed by CO and PO, respectively.
For validation purposes, a simulation has been conducted using ANSYS software to simulate the dielectric field distribution. Meanwhile, the calculation was performed by using the approximate formula for a uniform field near the symmetrical axis of the same radius of the spherical electrode which valid in narrow gaps as follows [37]:
E V d + 2 R ( 1 cos θ )
where, E is the maximum electric field, V is the breakdown voltage, kV, d is the gap distance, mm, and R is the radius of the spherical electrodes, mm. The polar angle, θ = 0° which corresponds to the apex of the sphere; which means that only a small part of the spherical electrode surface area near the symmetrical axis contributed to the breakdown voltage.
Table 7 shows the comparison between calculation and simulation of dielectric strength for all oil samples. It shows that very small percentage of the difference between calculation and simulated results which are between 0.1% up to 0.7%.
The simulation results match well with the calculation and experimental result at a gap distance of 3.8 mm. Hence we can use the simulation model to simulate the breakdown for larger gap distances. The simulation results for larger gap distances with similar injected voltage are shown in Table 8.
The power law function which represents the scale effect [21,22] is normally used to calculate the breakdown strength E (kV/mm) at the gap distance, d (mm). By using the data from Table 8, the prediction breakdown strength, E for the oils in this study are given as follows and the equations are plotted in
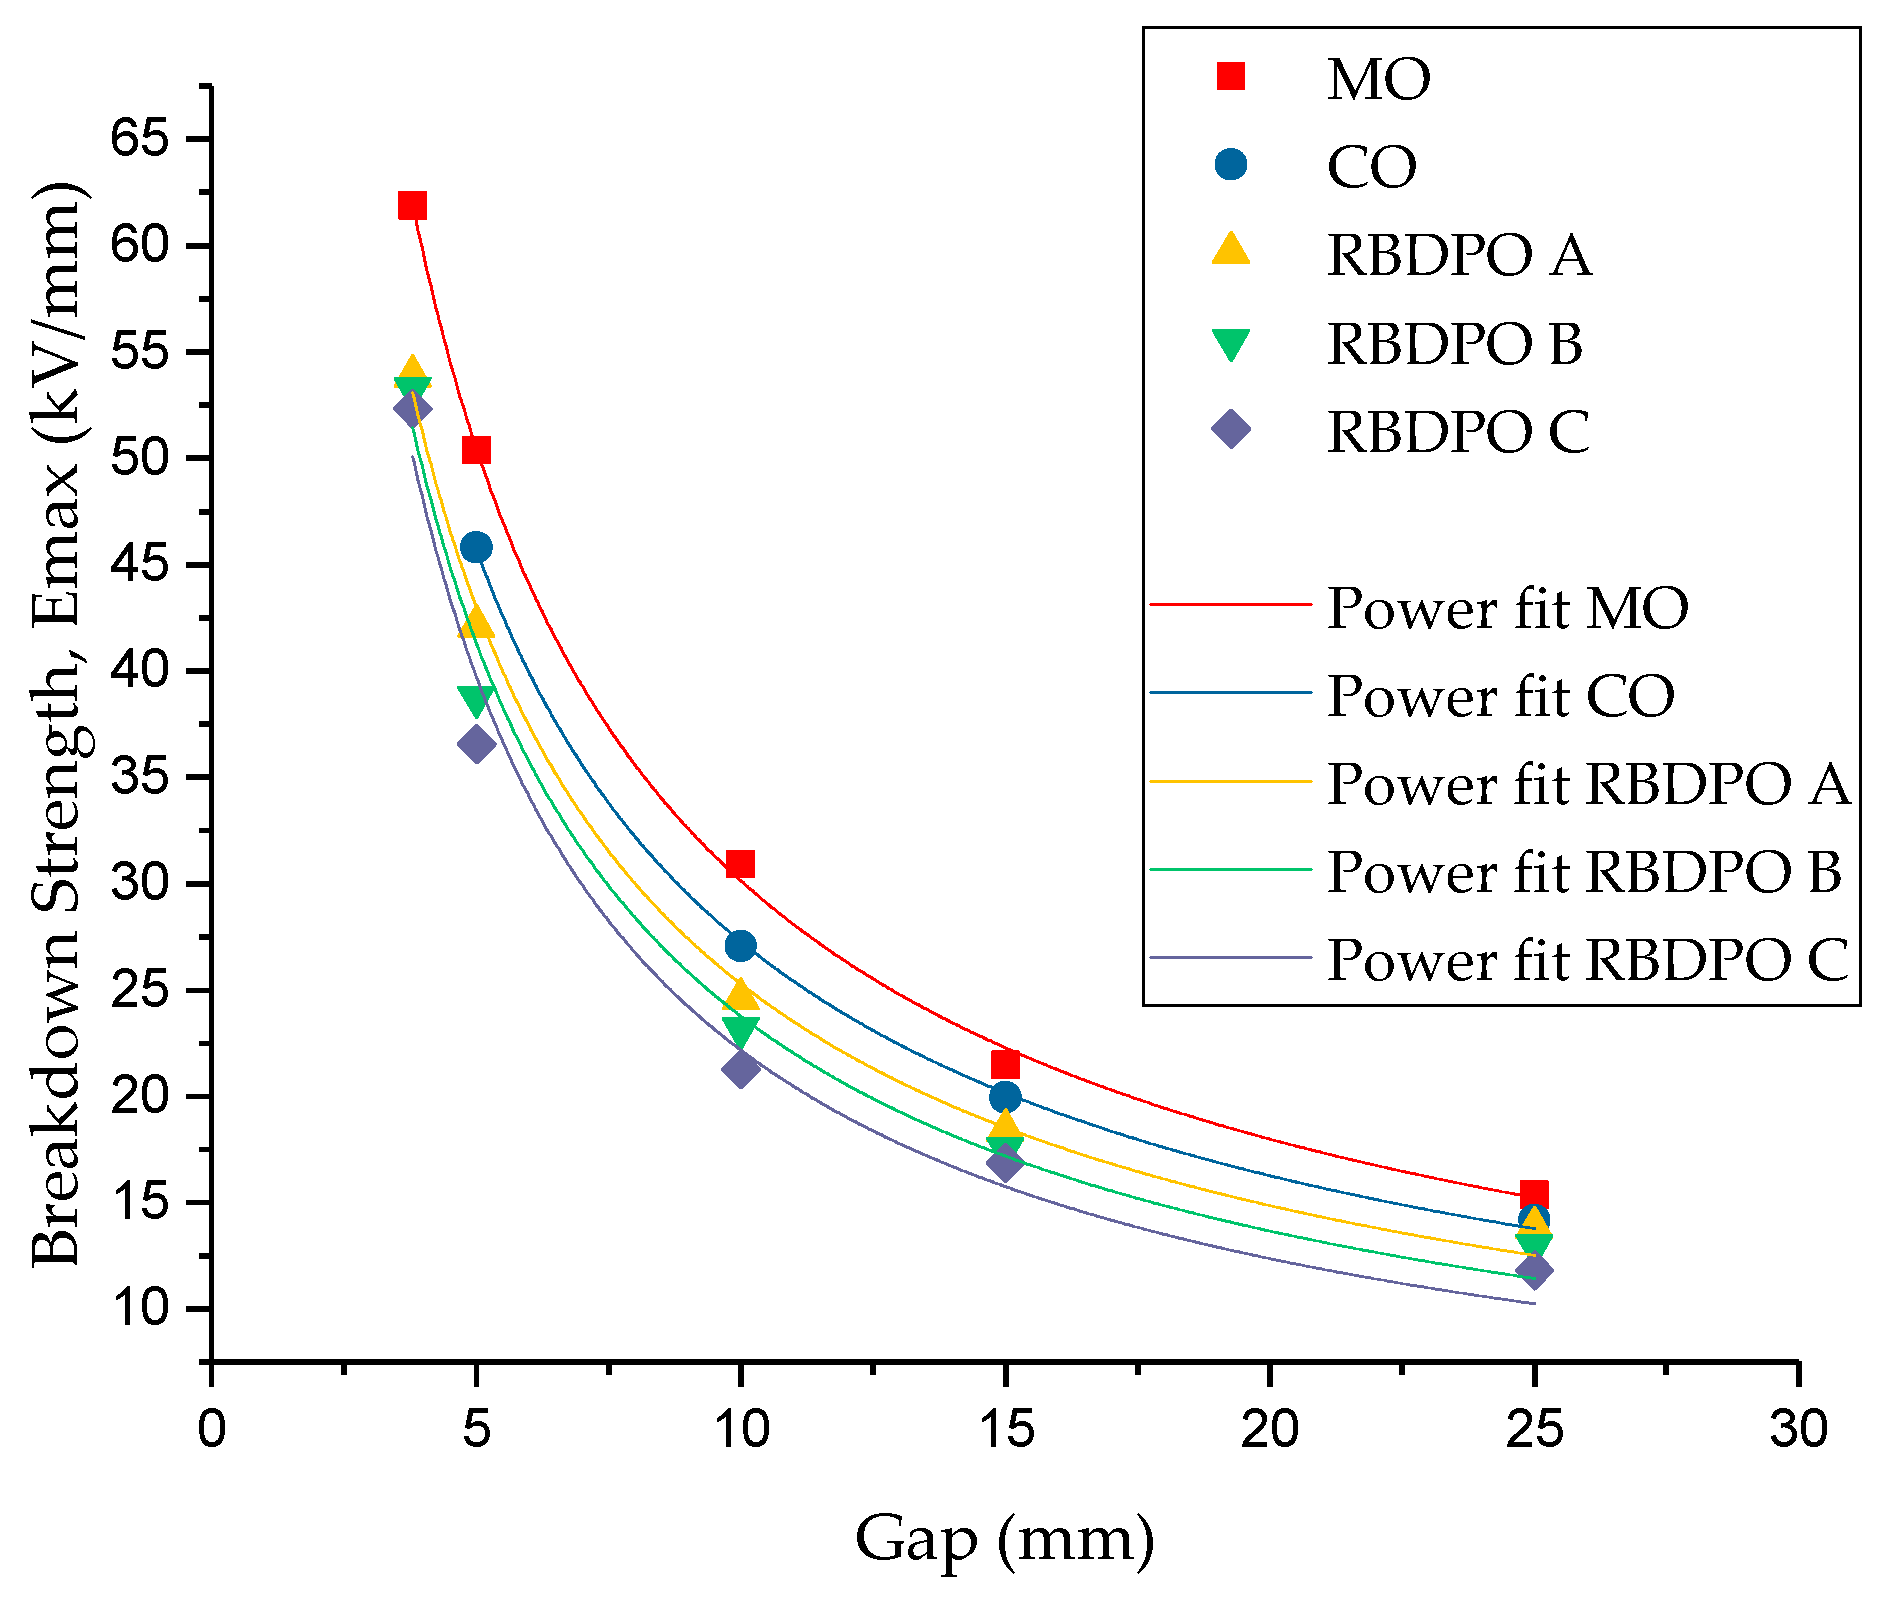
 Figure 8:
EMO = 168 × d−0.747
ECO = 148.12 × d−0.734
ERBDPOA = 137.03 × d−0.728
ERBDPOB = 133.32 × d−0.739
ERBDPOC = 133.43 × d−0.766
Figure 8 represents the relationship between lightning impulse strength and gap distance for sphere-sphere electrodes. It is noted that lightning impulse strengths for both breakdown and withstand decrease with the increase of gap distance. Similar results are also found in [22]. This explains why liquid insulations are particularly weak when the gaps are larger, and that’s why barriers are effectively used in improving the dielectric integrity. Besides that, comparing the CO, PO, and MO, it is remarkable that the negative lightning impulse strengths of CO and PO stay close to those of MO in the quasi- uniform field at gap distance up to 25 mm in this simulation.

4. Conclusions

Impulse breakdown voltages of three types of PO, CO and MO for transformer insulation liquid in a quasi-uniform electric field were investigated by considering the influences of voltage polarity and testing method. The results indicated that there is no polarity effect for lightning impulse breakdown tests in a quasi-uniform field. The testing methods, including rising voltage method, up and down method and multiple level method have a notable influence on the breakdown voltages. The effect of the 50% breakdown voltage on rising voltage method, up and down method and multiple level method for RBDPO and CO is comparable to MO. Based on a normal distribution fitting, withstand voltages 1% breakdown probability of POA were close to the MO. The calculated lightning impulse breakdown strength using the experimental data at 3.8 mm gap is very close to the results simulated using ANSYS Maxwell software. The predicted dielectric strength equations based on simulation for all oil samples were obtained using the power law function.

Author Contributions

The research study was carried out successfully with contribution from all authors. The main research idea, simulation works and manuscript preparation were contributed by N.I.A.K. M.T.I. contributed to the manuscript preparation and research idea. N.Z. assisted on finalizing the research work and manuscript. M.H.A.H. and N.A.M.A. gave several suggestions from the industrial perspectives. K.A.A. provided the data analysis and also helped to check the English. All authors revised and approved the publication of the paper.

Acknowledgments

The authors would like to thank Ministry of Education and National Defence University of Malaysia for the funding under short term grant (J0117-UPNM/2016/GPJP/5/ICT/2).

Conflicts of Interest

The authors declare no conflict of interest.

Nomenclature

αShape parameter
βScale parameter
UStep voltage increment
θPolar angle

References

  1. Amanullah, M.; Islam, S.M.; Chami, S.; Ienco, G. Analyses of Physical Characteristics of Vegetable Oils as an Alternative Source to Mineral Oil-based Dielectric Fluid. In Proceedings of the IEEE International Conference in Dielectric Liquids (ICDL), Coimbra, Portugal, 26 June–1 July 2005; pp. 397–400. [Google Scholar]
  2. Bingenheimer, D.; Franchini, L.; Del Fiacco, E.; Mak, J.; Vasconellos, V.; Rapp, K. Sustainable Electrical Energy using Natural Ester Technology. In Proceedings of the 21st International Conference on Electricity Distribution, Frankfrut, Germany, 6–9 June 2011. [Google Scholar]
  3. Azis, N.; Jasni, J.; Ab Kadir, M.Z.A.; Mohtar, M.N. Suitability of Palm Based Oil as Dielectric Insulating Fluid in Transformer. J. Electr. Eng. Technol. 2013, 1, 742–749. [Google Scholar] [CrossRef]
  4. Katim, N.I.A.; Ishak, M.T.; Ishak, A.M.; Thein, Y.V.; Azis, N.; Ab Kadir, M.Z.A. Examination on lightning breakdown strength of biodegradable oil under quasi-uniform field. In Proceedings of the 2014 IEEE International Conference on Power and Energy (PECON), Kuching, Malaysia, 1–3 December 2014; pp. 17–20. [Google Scholar]
  5. Khayam, U.; Rajab, A. Dielectric properties, partial discharge properties, and dissolved gas analysis of ricinnus oils as biodegradable liquid insulating materials. In Proceedings of the International Conference on Condition Monitoring and Diagnosis (CMD), Bali, Indonesia, 23–27 September 2012; pp. 1249–1252. [Google Scholar]
  6. Oommen, T.V. Vegetable oils for liquid-filled transformers. IEEE Electr. Insul. Mag. 2002, 18, 6–11. [Google Scholar] [CrossRef]
  7. Stockton, D.P.; Bland, J.R.; McClanahan, T.; Wilson, J.; Harris, D.L.; McShane, P. Natural Ester Transformer Fluids Safety Reliability & Environmental Performance. In Proceedings of the IEEE Petroleum and Chemical Industry Technical Conference (PCIC), Calgary, AB, Canada, 17–19 September 2007; pp. 1–7. [Google Scholar]
  8. Martin, D.; Khan, I.; Dai, J.; Wang, Z.D. An Overview of the Suitability of Vegetable Oil Dielectrics for Use in Large Power Transformers. In Proceedings of the TJH2b Euro Technical Conference, Chester, UK, 28–30 November 2006. [Google Scholar]
  9. Aditama, S. Dielectric properties of palm oils as liquid insulating materials: Effects of fat content. In Proceedings of the IEEE 2005 International Symposium on Electrical Insulating Materials (ISEIM 2005), Kitakyushu, Japan, 5–9 June 2005; pp. 91–94. [Google Scholar]
  10. Sitinjak, F.; Suhariadi, I.; Imsak, L. Study on the characteristics of palm oil and it’s derivatives as liquid insulating materials. In Proceedings of the IEEE 7th International Conference on Properties and Applications of Dielectric Materials, Nagoya, Japan, 1–5 June 2003; pp. 495–498. [Google Scholar]
  11. Lucas, J.R.; Abeysundara, D.C.; Weerakoon, C.; Perera, K.B.M.I.; Obadage, K.C.; Gunatunga, K.A.I. Coconut Oil Insulated Distribution Transformer. In Proceedings of the 8th Annual Conference of IEE Sri Lanka, Colombo, Sri Lanka, 22 September 2001; pp. 1–5. [Google Scholar]
  12. Ranawana, S.; Ekanayaka, C.M.B.; Kurera, N.A.S.A.; Fernando, M.A.R.M.; Perera, K.A.R. Analysis of Insulation Characteristics of Coconut Oil as an Alternative to the Liquid Insulation of Power Transformers. In Proceedings of the 2008 IEEE Region 10 and the 3rd International Conference on Industrial and Information Systems (ICIIS), Kharagpur, India, 8–10 December 2008; pp. 1–5. [Google Scholar]
  13. Matharage, B.S.H.M.S.Y.; Fernando, M.A.R.M.; Bandara, M.A.A.P.; Jayantha, G.A.; Kalpage, C.S. Performance of coconut oil as an alternative transformer liquid insulation. IEEE Trans. Dielectr. Electr. Insul. 2013, 20, 887–898. [Google Scholar] [CrossRef]
  14. Abdelmalik, A.A.; Fothergill, J.C.; Dodd, S.J. Electrical conduction and dielectric breakdown characteristics of alkyl ester dielectric fluids obtained from palm kernel oil. IEEE Trans. Dielectr. Electr. Insul. 2012, 19, 1623–1632. [Google Scholar] [CrossRef] [Green Version]
  15. Liu, Q. Electrical Performance of Ester Liquids Under Impulse Voltage for Application in Power Transformers. Ph.D. Thesis, The University of Manchester, Manchester, UK, 2011. [Google Scholar]
  16. Arazoe, S.; Saruhashi, D.; Sato, Y.; Yanabu, S.; Ueta, G.; Okabe, S. Electrical characteristics of natural and synthetic insulating fluids. IEEE Trans. Dielectr. Electr. Insul. 2002, 18, 6–11. [Google Scholar] [CrossRef]
  17. Vukovic, D.; Tenbohlen, S.; Harthun, J.; Perrier, C.; Fink, H. Breakdown strength of vegetable-based oils under AC and lightning impulse voltages. In Proceedings of the IEEE International Conference on Dielectric Liquids (ICDL), Trondheim, Norway, 26–30 June 2011; p. 116. [Google Scholar]
  18. Rapp, K.J.; Corkran, J.; McShane, C.P.; Prevost, T.A. Lightning impulse testing of natural ester fluid gaps and insulation interfaces. IEEE Trans. Dielectr. Electr. Insul. 2009, 8, 1595–1603. [Google Scholar] [CrossRef]
  19. Rapp, K.J.; McShane, C.P.; Vandermaar, J.; Vukovic, D.; Tenbohlen, S. Long gap breakdown of natural ester fluid. In Proceedings of the International Conference on High Voltage Engineering and Application (ICHVE), New Orlens, LA, USA, 11–14 October 2010; pp. 104–107. [Google Scholar]
  20. Prevost, T.A. Dielectric properties of natural esters and their influence on transformer insulation system design and performance—An update. In Proceedings of the IEEE Power & Energy Society General Meeting (PES), Calgary, AB, Canada, 26–30 July 2009; pp. 1–7. [Google Scholar]
  21. Liu, Q.; Wang, Z.D. Breakdown and withstand strengths of ester transformer liquids in a quasi-uniform field under impulse voltages. IEEE Trans. Dielectr. Electr. Insul. 2013, 20, 571–579. [Google Scholar] [CrossRef]
  22. Nelson, J.K.; Shaw, C. The Impulse Design of Transformer Oil-Cellulose Structures. IEEE Trans. Dielectr. Electr. Insul. 2006, 13, 477–483. [Google Scholar] [CrossRef]
  23. Beroul, A.; Tobazeon, R. Pre-breakdown phenomena in liquid dielectrics. IEEE Trans. Electr. Insul. 1986, EI-21, 613–627. [Google Scholar] [CrossRef]
  24. Massala, G.; Lesaint, O. A comparison of negative and positive streamers in mineral oil at large gaps. J. Phys. D Appl. Phys. 2001, 34, 1525–1532. [Google Scholar] [CrossRef]
  25. Badent, R.; Kist, K.; Schwab, A.J. Voltage dependence of pre-breakdown phenomena in insulating oil. In Proceedings of the IEEE International Symposium on Electrical Insulation (ISEI), Pittsburgh, PA, USA, 5–8 June 1994; pp. 414–417. [Google Scholar]
  26. Hemmer, M.; Julliard, Y.; Badent, R.; Schwab, A.J. Streamer inception and propagation in rape-seed oils and mineral oils. In Proceedings of the 2001 Annual Report Conference on Electrical Insulation and Dielectric Phenomena (CEIDP), Kitchener, ON, Canada, 14–17 October 2001; pp. 548–551. [Google Scholar]
  27. International Electrotechnical Commission (IEC). Methods for the Determination of the Lightning Impulse Breakdown Voltage of Insulating Liquids; IEC 60897; International Electrotechnical Commission: Geneva, Switzerland, 1987. [Google Scholar]
  28. ASTM. Dielectric Breakdown Voltage of Insulating Oils of Petroleum Origin under Impulse Conditions; ASTM-D3300; ASTM International: West Conshohocken, PA, USA, 1994. [Google Scholar]
  29. Thein, Y.V.; Azis, N.; Jasni, J.; Ab Kadir, M.Z.A.; Yunus, R.; Ishak, M.T.; Yaakub, Z. Investigation on the Lightning Breakdown Voltage of Palm Oil and Coconut Oil under Non-Uniform Field. In Proceedings of the IEEE International Conference on Power and Energy (PECon), Kuching, Malaysia, 1–3 December 2014; pp. 1–4. [Google Scholar]
  30. IEEE. IEEE Standard for High-Voltage Testing Technique; IEEE Std 4-2013 (Revision of IEEE Std 4-1195); IEEE: Piscataway, NJ, USA, 2013. [Google Scholar]
  31. Thein, Y.V.; Azis, N.; Jasni, J.; Ab Kadir, M.Z.A.; Yunus, R.; Ishak, M.T.; Yaakub, Z. The effect of polrity on the lightning breakdown voltages of palm oil and coconut oil under non-uniform field for transformers application. Ind. Crops Prod. 2016, 89, 250–256. [Google Scholar] [CrossRef]
  32. Hauschild, W.; Mosh, W. Statistical Techniques for High-Voltage Engineering; J. W. Arrowsmith Ltd.: Bristol, UK, 1992. [Google Scholar]
  33. Liu, Q.; Wang, Z.D. Streamer characteristics and breakdown in synthetic and natural ester transformer liquids under standard lightning impulse voltage. IEEE Trans. Dielectr. Electr. Insul. 2011, 18, 285–294. [Google Scholar] [CrossRef]
  34. Duy, C.T.; Lesaint, O.; Denat, A.; Bonifaci, N. Streamer propagation and breakdown in natural ester at high voltage. IEEE Trans. Dielectr. Electr. Insul. 2009, 16, 1582–1594. [Google Scholar] [CrossRef]
  35. Dang, V.H.; Beroual, A. Investigation on streamers phenomena in mineral, synthetic and natural ester oils under lightning impulse voltage. IEEE Trans. Dielectr. Electr. Insul. 2012, 19, 1521–1527. [Google Scholar] [CrossRef]
  36. Wang, J.; Zhang, X. Double exponential Expression of Lightning Current Waveforms. In Proceedings of the 4th Asia-Pasific Conference on Environmental Electromagnetics, Dalian, China, 1–4 August 2006; pp. 320–323. [Google Scholar]
  37. Ding, H.Z.; Wang, Z.D.; Jarman, P. On electric stresses at wedge-shaped oil gaps in power transformers with application to surface discharge and breakdown. In Proceedings of the IEEE International Conference on Dielectric Liquids (ICDL), Futuroscope-Chasseneuil, France, 30 June–3 July 2008; pp. 1–4. [Google Scholar]
Figure 1. Samples of MO, CO, and palm oil for the study.
Energies 11 02676 g001
Figure 2. Test configuration for the lightning impulse.
Energies 11 02676 g002
Figure 3. Voltage polarity effect on 50% lightning breakdown voltages of all samples at gap distances of (a) 2.0 mm and (b) 3.8 mm.
Energies 11 02676 g003
Figure 4. Testing methods effect on 50% lightning breakdown voltages of all samples at gap distances of (a) 2.0 mm and (b) 3.8 mm.
Energies 11 02676 g004
Figure 5. Normal cumulative probability fitting of negative polarity for all samples at gap distances of (a) 2.0 mm and (b) 3.8 mm.
Energies 11 02676 g005
Figure 6. Sphere-to-sphere modeling for the simulation in ANSYS Maxwell.
Energies 11 02676 g006
Figure 7. Electric field distributions and maximum electric field intensity of (a) MO, (b) CO, (c) RBDPOA, (d) RBDPOB and (e) RBDPOC.
Energies 11 02676 g007
Figure 8. Negative lightning impulse strengths of MO, CO and PO versus gap distances in uniform field.
Energies 11 02676 g008
Table 1. Fat, Vitamin A/E contents of all samples.
SamplesSaturated Fat (g)Unsaturated Fat (g)Vitamin A (µg)Vitamin E (mg)
MonoPolo
CO92.83.63.6--
RBDPOA45.443.011.62644.4
RBDPOB44.443.312.2-50.0
RBDPOC43.043.014-75
Table 2. 50% lightning breakdown voltages, d = 3.8 mm.
Voltage PolaritiesMO (kV)CO (kV)RBDPOA (kV)RBDPOB (kV)RBDPOC (kV)
Negative236.33213.33206202.67200
Positive230210200197.33195.33
Table 3. 50% lightning breakdown voltages, d = 2.0 mm.
Voltage PolaritiesMO (kV)CO (kV)RBDPOA (kV)RBDPOB (kV)RBDPOC (kV)
Negative140.3132130.67114109
Positive138.6127.6126108.33104.33
Table 4. 50% lightning breakdown voltages using various testing methods at different gap distance.
Testing MethodsGap Distances (mm)Rising Voltage (kV)Up and Down (kV)Multiple Level (kV)
RBDPOA2.0130.67128.83130
3.8206205210
RBDPOB2.0114111.88120
3.8202.67213.93210
RBDPOC2.0109107.89110
3.8200.33203.93215
CO2.0132131.43135
3.8213.33217.83215
MO2.0138.67135.19140
3.8236.33232.5245
Table 5. Negative lightning breakdown voltages probabilities of all samples at gap distance 2.0 mm and 3.8 mm.
SamplesBreakdown Probabilities (%)Breakdown Voltage at Gap Distances (kV)
2.0 mm3.8 mm
RBDPOA1106.58184.33
50126.60201.93
RBDPOB186.03188.83
50106.81206.70
RBDPOC184.03184.85
50105.11198.83
CO195.48188.05
50120.64212.77
MO1108.14189.69
50130.85220.11
Table 6. Input parameters for simulation.
Insulation OilRelative Permittivity (E)Conductivity (×10−12 Siemens/m)Resistivity (×10−12 Ωm)
MO1.5350.0083.042
CO1.6384.3203.37
POA1.9720.6366.273
POB1.6610.1625.578
POC1.9820.1083.893
Table 7. The measurement, calculation, and simulation of breakdown voltages of each sample.
Breakdown Voltage Measurements of Samples (kV)
MOCORBDPOARBDPOBRBDPOC
236.33213.33206202.67200
Calculation of Dielectric Strength of Samples (kV/mm) Using Equation (2)
MOCORBDPOARBDPOBRBDPOC
62.1956.1454.2153.3352.63
Simulation of Dielectric Strength of Samples (kV/mm)
MOCORBDPOARBDPOBRBDPOC
61.8855.7453.8853.2852.34
Table 8. The simulation of maximum dielectric strength of each sample for larger gap distances.
Gap (mm)MO (kV/mm)CO (kV/mm)RBDPOA (kV/mm)RBDPOB (kV/mm)RBDPOC (kV/mm)
3.861.8855.7453.8853.2852.34
550.3845.8242.1138.7736.55
1030.9227.0624.5823.1921.26
1521.4719.9418.4117.5616.87
2515.3614.1813.8412.9911.82

