Article

Investigation into the Classification of Tight Sandstone Reservoirs via Imbibition Characteristics

1
State Key Laboratory of Oil and Gas Reservoir Geology and Exploitation, Southwest Petroleum University, Chengdu 610500, Sichuan, China
2
Oil & Gas Technology Research Institute of Changqing Oilfield Company, PetroChina, Xi’an 710018, Shaanxi, China
3
National Engineering Laboratory of Low Permeability Oil & Gas Field Exploratory and Development, Xi’an 710018, Shaanxi, China
4
College of Petroleum Engineering, Xi’an Shiyou University, Xi’an 710065, Shaanxi, China
5
Engineering Research Center of Development and Management for Low to Extra-Low Permeability Oil & Gas Reservoirs in West China, Ministry of Education, Xi’an 710065, Shaanxi, China
*
Authors to whom correspondence should be addressed.
Energies 2018, 11(10), 2619; https://doi.org/10.3390/en11102619
Submission received: 30 June 2018 / Revised: 18 September 2018 / Accepted: 20 September 2018 / Published: 1 October 2018
(This article belongs to the Special Issue Latest Research Progress for Nanotech for Oil and Gas)

Abstract

:
Tight sandstone reservoirs are often produced by shutting in the well and inducing imbibition. However, by adopting current reservoir classifications, the heterogeneity of reservoirs cannot be properly treated. Based upon the analysis of the imbibition curves and mercury intrusion porosimetry tests, Chang-7 tight sandstone reservoirs were classified into three categories according to the newly proposed standards. Imbibition tests demonstrated that for the first category, imbibition and drainage occurred continuously and never reached the plateau within the experiment duration. It was suggested that a longer shut-in time favors the production of oil. For the second category, a steady state for imbibition was reached and a shut-in time as short as three days resulted in a high imbibition rate. For the third category, a plateau was reached for the first time and imbibition restarted until a steady state was reached. The average shut-in time for the third category was eight days. Compatibility between reservoir characteristics and a soaking development regime based upon the proposed classification methods effectively enhances the oil recovery efficiency of formations with distinct petrophysical properties. This provides insight into the classification methods of tight sandstone reservoirs.

1. Introduction

The demand for crude oil grows rapidly in pace with the continuous development of industry. Oil production from conventional resources is declining gradually, yet unconventional resources demonstrate great potential [1,2]. Specifically, tight oil and shale oil reserves are estimated as 2570 billion barrels, while tight gas [3], coalbed methane, and shale gas reserves are approximately 2300 billion barrels of oil equivalent (BOE) [4,5]. This could alleviate the concerns about the future energy scarcity [6]. In China, tight oil reserves are widely distributed in the Ordos, Junggar, Sichuan, and Songliao Basins, with an estimated 147 billion barrels in total [7,8].
Tight oil and gas are adsorbed or are free inside source rocks or neighboring reservoir rocks such as tight sandstone or carbonate that have not undergone long-distance migration [9]. Despite the large potential of unconventional resources like tight oil and gas, the exploration and production of such reservoirs are still challenging, owing to their characteristics such as low permeability and low porosity [10,11]. To improve the production efficiency, volume fracturing for vertical wells and multi-stage fracturing for horizontal wells are the key research areas [12]. Tight formations are usually highly heterogeneous, complicated regarding pore-throat structure, and possess low natural energy to drive production. During practical production processes, issues like high production pressure differential, rapid decline of production rate, and low primary recovery efficiency are more common compared with production from conventional reservoirs [13]. Additionally, the water intake capacity of injection wells is relatively low, while the threshold and injection pressures are relatively high. Owing to the reservoir heterogeneity, the recovery of trapped oil inside micropores is difficult, resulting in low waterflooding efficiency. Therefore, for tight reservoirs with highly heterogeneous formations, differential development regimes are desired in order to improve oil recovery efficiency [14]. A great amount of work has been done in the past regarding this particular issue. Computed tomography (CT) scanning has been applied to establish the criteria for reservoir classifications based upon the shape of the pores using three-dimensional images [15], while Claes et al. adopted the CT scanning technique and discovered five types of pore-throat configuration that were regarded as the classification criteria [16]. Zhao et al. developed classification standards for reservoir simulation based on microscopic pore-throat characteristics via mercury intrusion porosimetry (MIP) experiments and observations through the microscope [17]. Chen et al. experimentally studied the threshold pressure gradient, overburden pressure sensitivity, median pore-throat radius, and waterflooding efficiency to obtain the characteristics of injection and production processes for different reservoirs [18]. Zhao et al. performed experiments using core samples and thin sections, combined with techniques such as using a scanning electron microscope (SEM) and X-ray diffraction (XRD). The quality of the reservoirs has been distinguished by the lithology, microscale pore-throat configuration, and other physical properties [19]. Meanwhile, reservoir simulations were applied to characterize the classification parameters of reservoirs and determine the classification coefficients, as well as the classification domains according to their production capacity [20]. Dai et al. applied the fuzzy clustering method and proposed a new classification standard by considering sandstone thickness, sand ratio, porosity, and permeability as classification parameters [21]. The proposed classification standards only consider and evaluate the characteristics of the formations, but cannot solve the issues encountered during the development of tight reservoirs [22,23,24].
The capillary effect becomes prominent in tight reservoirs due to small pore-throat size. By taking advantage of this feature, capillary force can therefore be considered as the driving force with which to displace oil in the pores by imbibition during production processes when the shut-in method is applied. Imbibition between fractures and the matrix of fractured reservoirs was investigated, and it was discovered that the oil recovery was greatly improved by the exchange between water in the fractures and oil in the matrix [25,26,27]. Bertoncello et al. investigated a spontaneous imbibition phenomenon during flowback after fracturing in single wells in the early stage, and showed that early productivity can be enhanced by a well resting period [28]. Mohammad et al. examined the aspects influencing imbibition in oil-wet fractured cores with CT scanning. Wettability and oil viscosity are considered as the major influencing factors, and thus oil recovery from the reservoir they were studying could be improved by injecting steam, low-salinity water, and surfactant [29]. It has also been proposed that factors impacting the recovery efficiency of tight reservoirs are: wettability > brine, and salinity > residual oil saturation [30,31,32,33]. Ali Habibi et al. suggested that the position for imbibition is random inside the same core, and that by soaking the core sample in brine solution the affinity between rock and fluids can be promoted, which further affects the wettability [34]. Additionally, other work demonstrates that brine solution has an impact on the oil recovery of weak water-wet and mixed-wet cores, with the recovery up to 38–46% [35]. M.K. Valluri et al. revealed that the interactions between the ultra-tight cores and Na+, Ca2+ ions enhanced the recovery efficiency of tight reservoirs [36]. Q. Lan et al. explored the relationship between water loss via imbibition and soaking time of tight sandstone reservoirs. They showed that the variation of illite content had a negligible effect on the imbibition. Water loss increased as clay content increased, whereas the imbibition rate declined when the total organic carbon (TOC) content increased [37]. Techniques like orthogonal experimental design (allows investigation of multiple influencing factors), MIP, nuclear magnetic resonance (NMR), and CT scanning were applied to investigate the factors affecting the imbibition rate of tight oil reservoirs. Results illustrated that pore-throat connectivity dominates the imbibition process, and sub-micron pores are mainly responsible for this process [38]. Moreover, nitrogen absorption and the Amott test have been applied in combination with MIP and NMR analysis to examine the aspects affecting imbibition, which are: reservoir quality, maximum connected pore-throat size, specific surface area, and relative wettability index [39]. Surfactant is regarded as another significant aspect influencing imbibition. Studies have demonstrated that anionic surfactant is superior to cationic and nonionic surfactants, with regard to the ability to modify the rock wettability [40,41,42].
The research detailed above solely focused upon the influence of single or multiple aspects of the imbibition process within a limited region, yet the evaluation of the compatibility between the characteristics of reservoirs and the shut-in production through imbibition has been overlooked. Therefore, in this work, imbibition experiments were performed using real core samples with diverse physical properties, and the characteristics of imbibition were assessed via NMR and MIP experiments. We concentrated on the issue that differentiated reservoir development cannot be successfully implemented by the current reservoir classification method, and therefore established a new classification method for tight sandstone reservoirs, coordinating imbibition with the shut-in production method that favorably promotes the production efficiency.

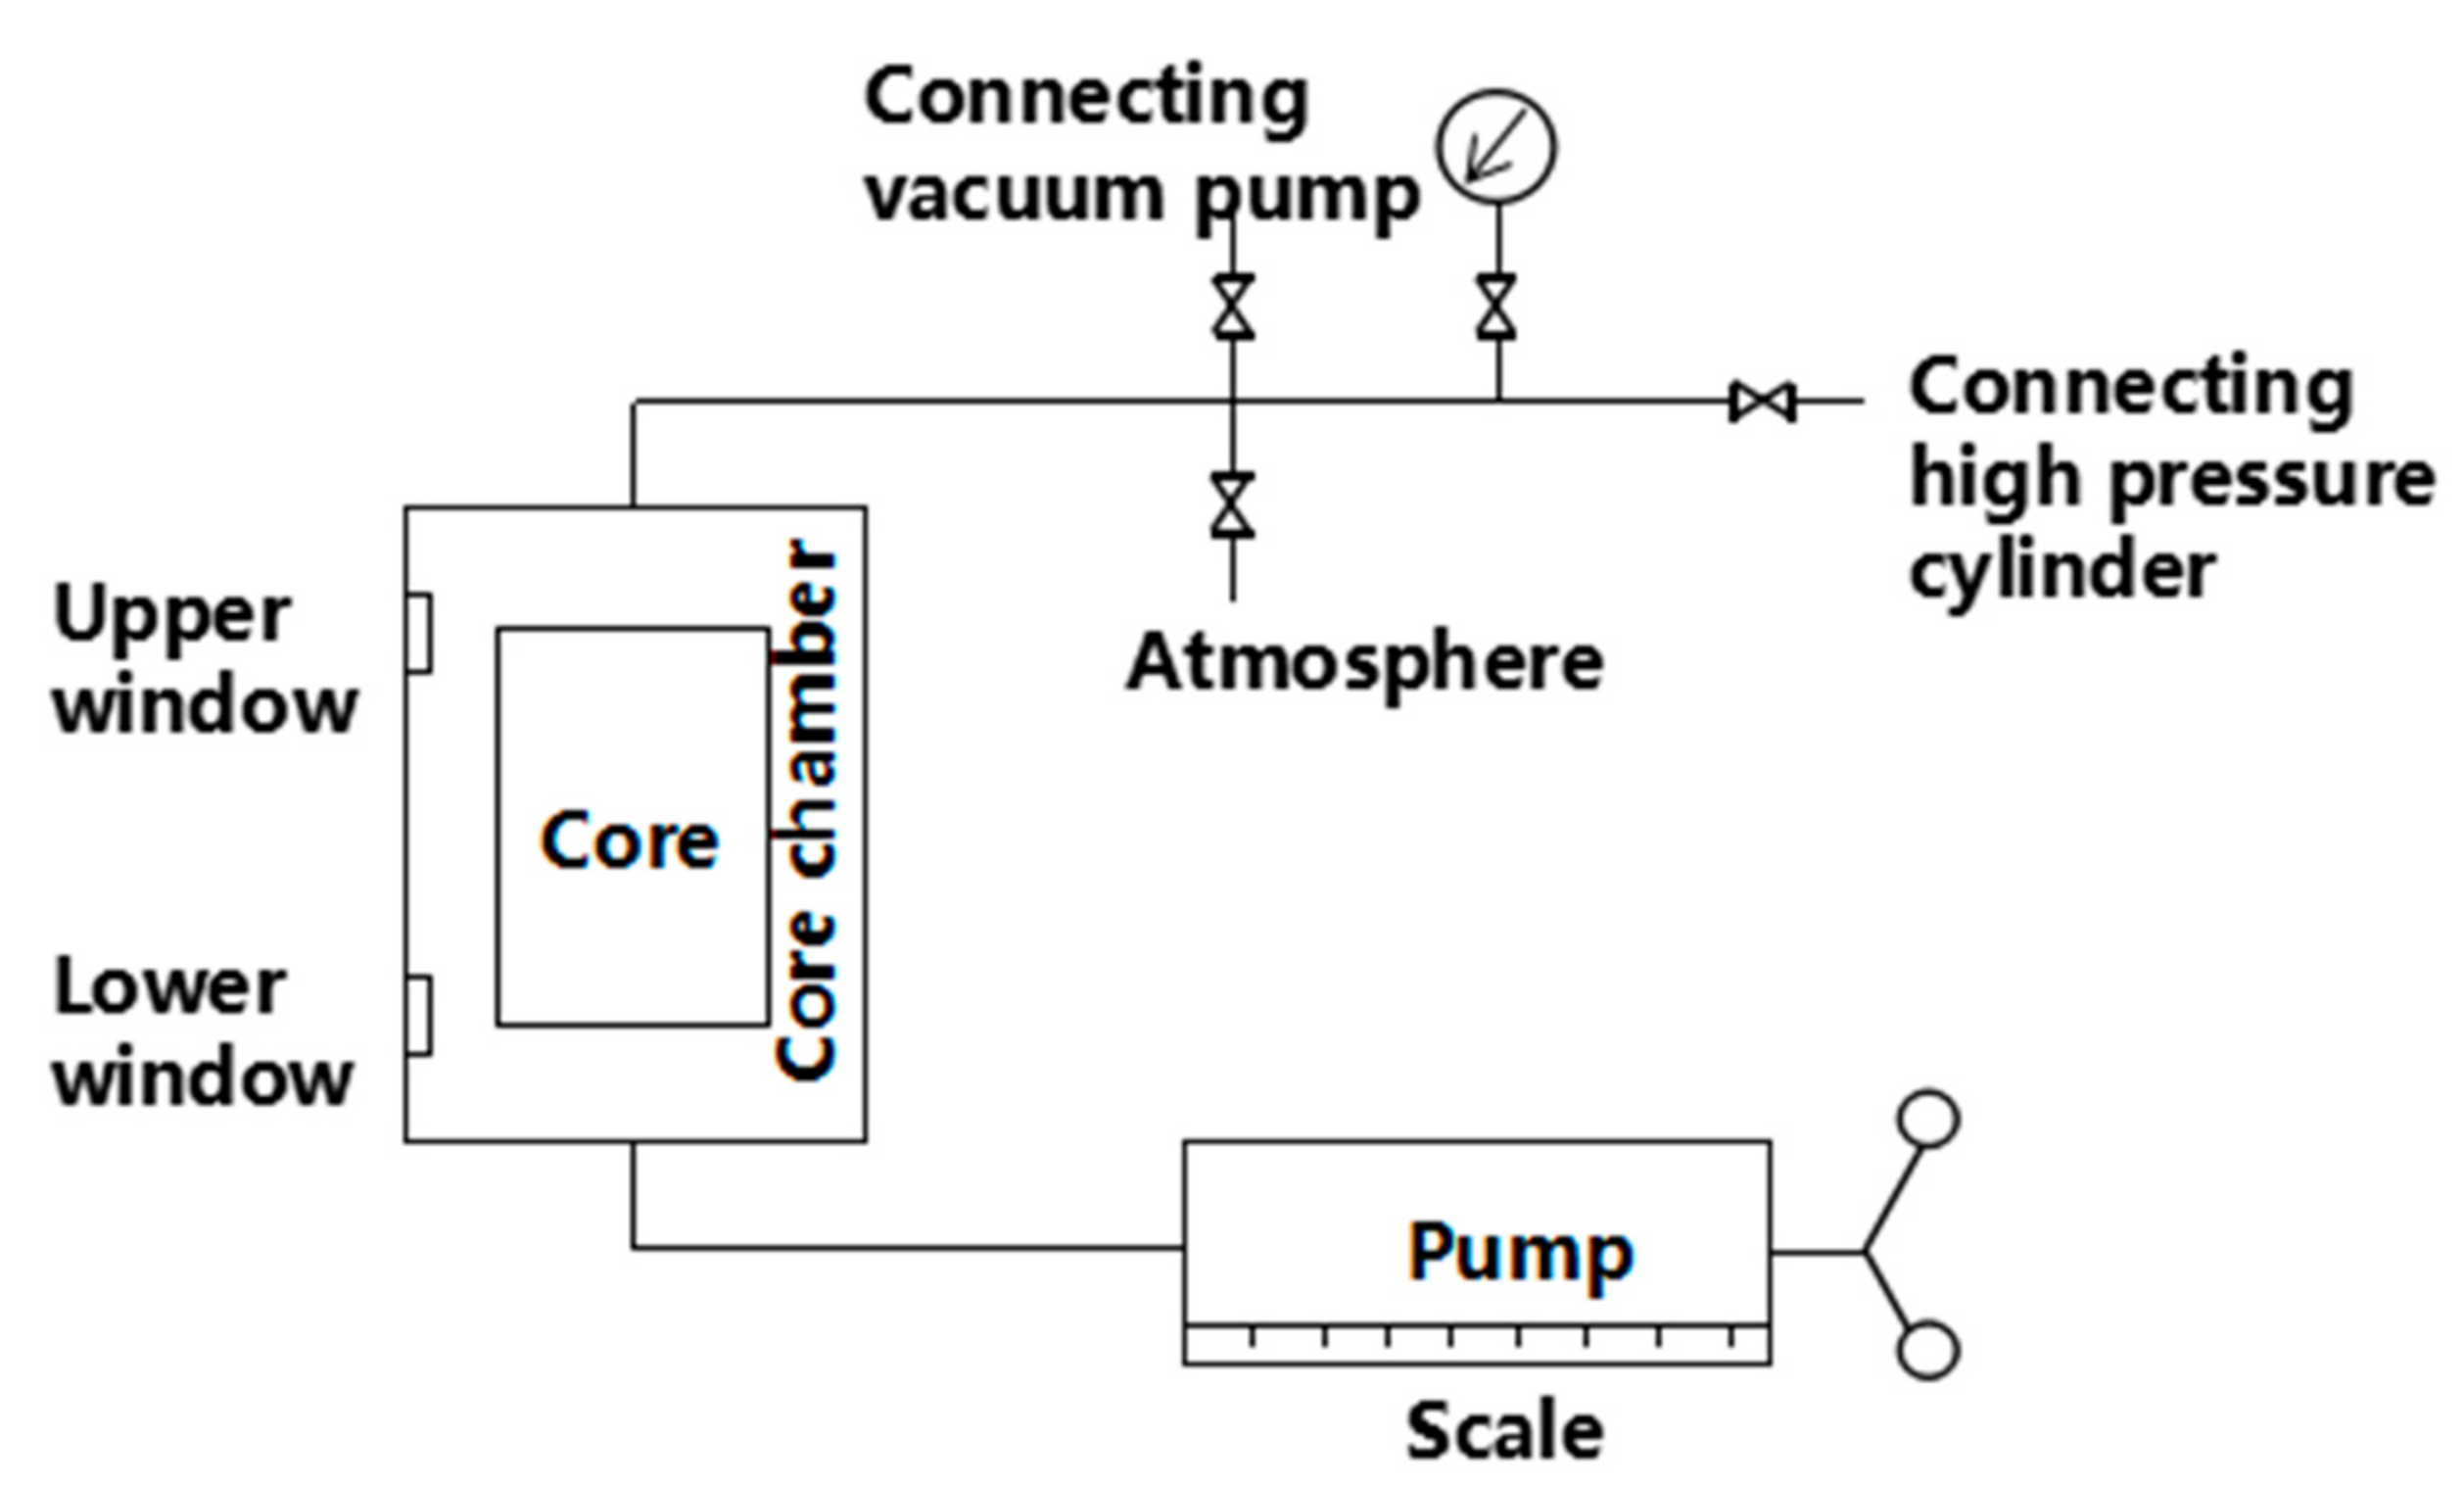
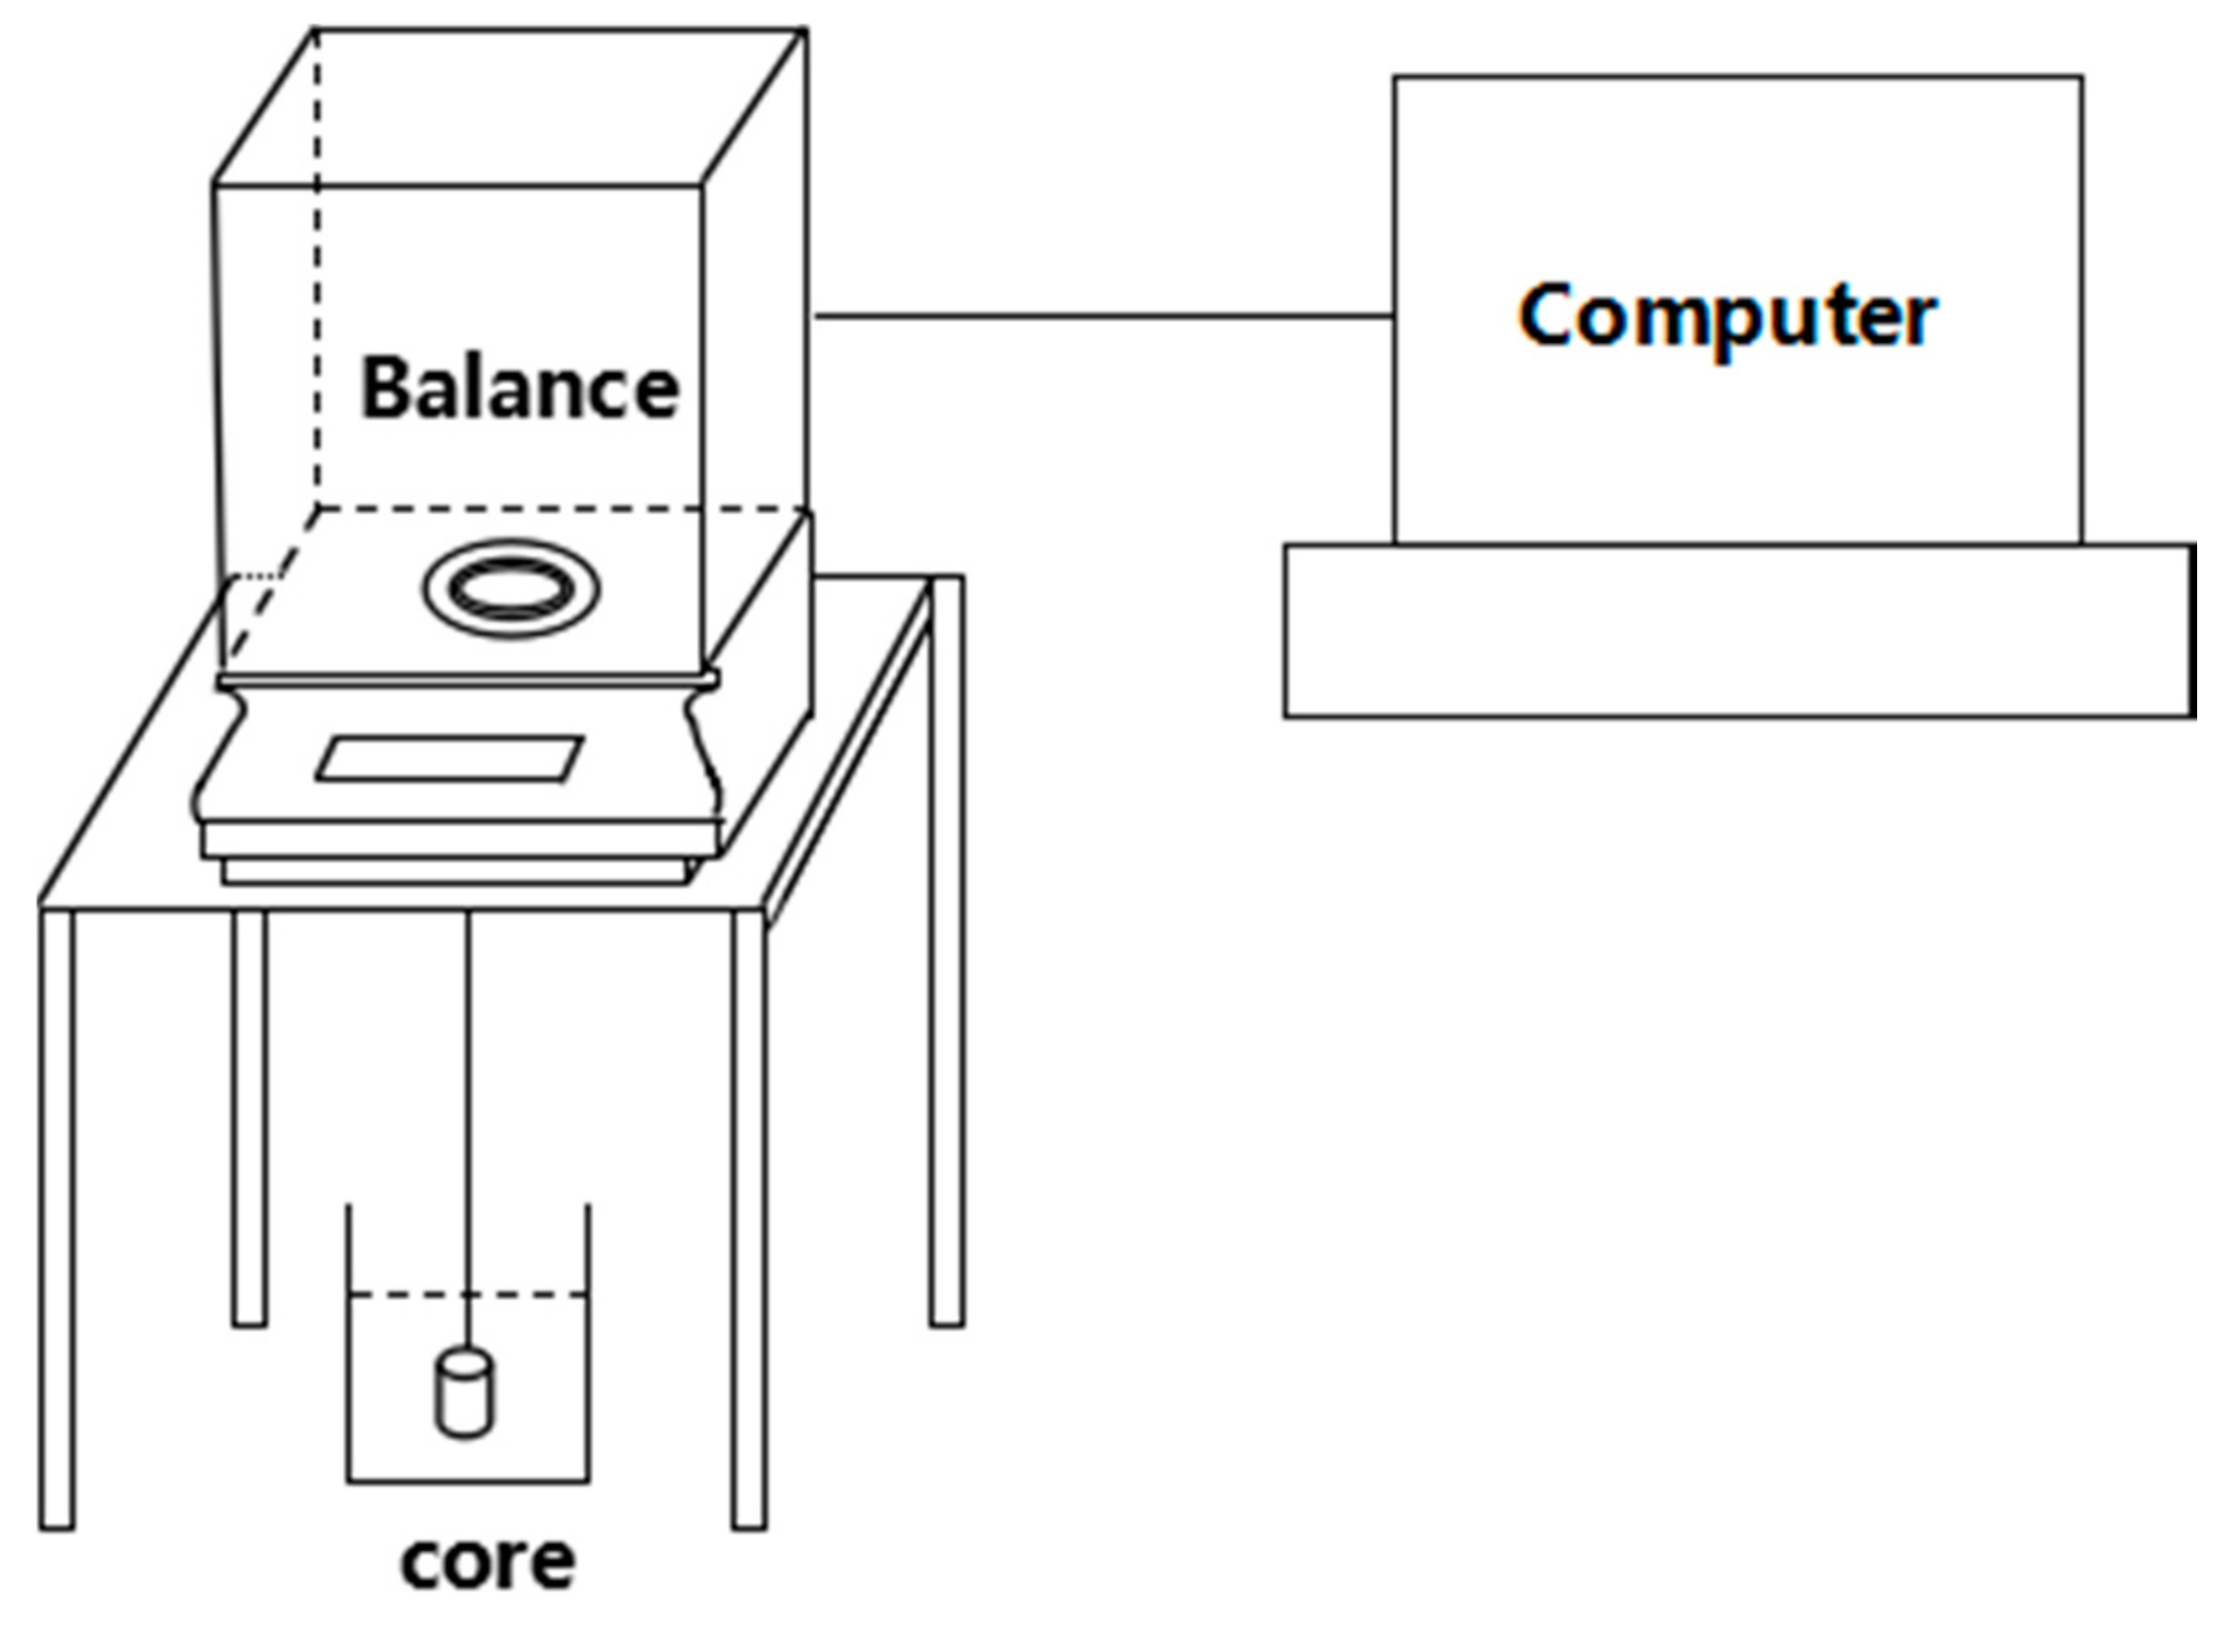
2. Experimental Setup

2.1. Spontaneous Imbibition Tests

Cores retrieved from Yanchang Formation Chang-7 tight sandstone reservoirs were utilized to conduct spontaneous imbibition tests. These core samples were extracted from nine wells in six different regions, with a depth span of 500 m. They were therefore considered appropriate to represent the characteristics of the reservoir formation within a certain block. The average length and diameter of cores were 4.37 cm and 2.52 cm, respectively. The porosity of the cores ranged from 4.40% to 9.61%, with an average of 6.92%. The permeability of the cores ranged from 0.039 mD to 0.313 mD, with an average of 0.129 mD. Detailed properties of the cores are listed in Table 1. The materials used were: distilled water, CaCl2 brine solution (15,000 mg/L), and paraffin oil of 1.87 mPa·s in viscosity (with red dye).
Prior to the imbibition tests, all cores were cleaned multiple times using a mixture of toluene and methanol, and then dried. The cores were then vacuumed and saturated with formation brine, followed by the saturation of oil. The cores saturated with oil were aged in a beaker containing oil. A schematic of the experimental setup is illustrated in Figure 1. To start the imbibition tests, a saturated core was fully immersed in a beaker containing distilled water. The weights of the cores during the imbibition process were measured and recorded accurately using a scale (Mettler Toledo MS204). The variation in the weight throughout the experiment process was interpreted as the amount of oil recovered via imbibition. Distilled water was slowly imbibed into the core, while paraffin oil was expelled, as shown in Figure 2. Measurement errors were regarded negligible throughout the 240 h imbibition process.

2.2. Mercury Intrusion Porosimetry Tests

To further explore the distribution of micropores and throats within the core samples, conventional MIP was subsequently performed for all cores. Mercury does not wet most minerals, therefore mercury enters the pore space only when the pressure exerted is equal to the capillary pressure. Figure 3 illustrates the experimental setup for MIP.
Cleaned core samples were placed inside the chamber, sealed, and vacuumed. The mercury was then injected by applying pressure, Pc. In the meantime, the volume of injected mercury was recorded as VHg. Mercury saturation (SHg) was calculated by the following equation: SHg = VHg/(ΦVf), where Φ is the porosity of the core sample and Vf is the apparent volume of the core. When the pressure reached the maximum, it was lowered gradually, allowing the mercury to extrude. A capillary pressure curve was plotted with the volume of mercury injected versus the corresponding pressure.

3. Results and Discussions

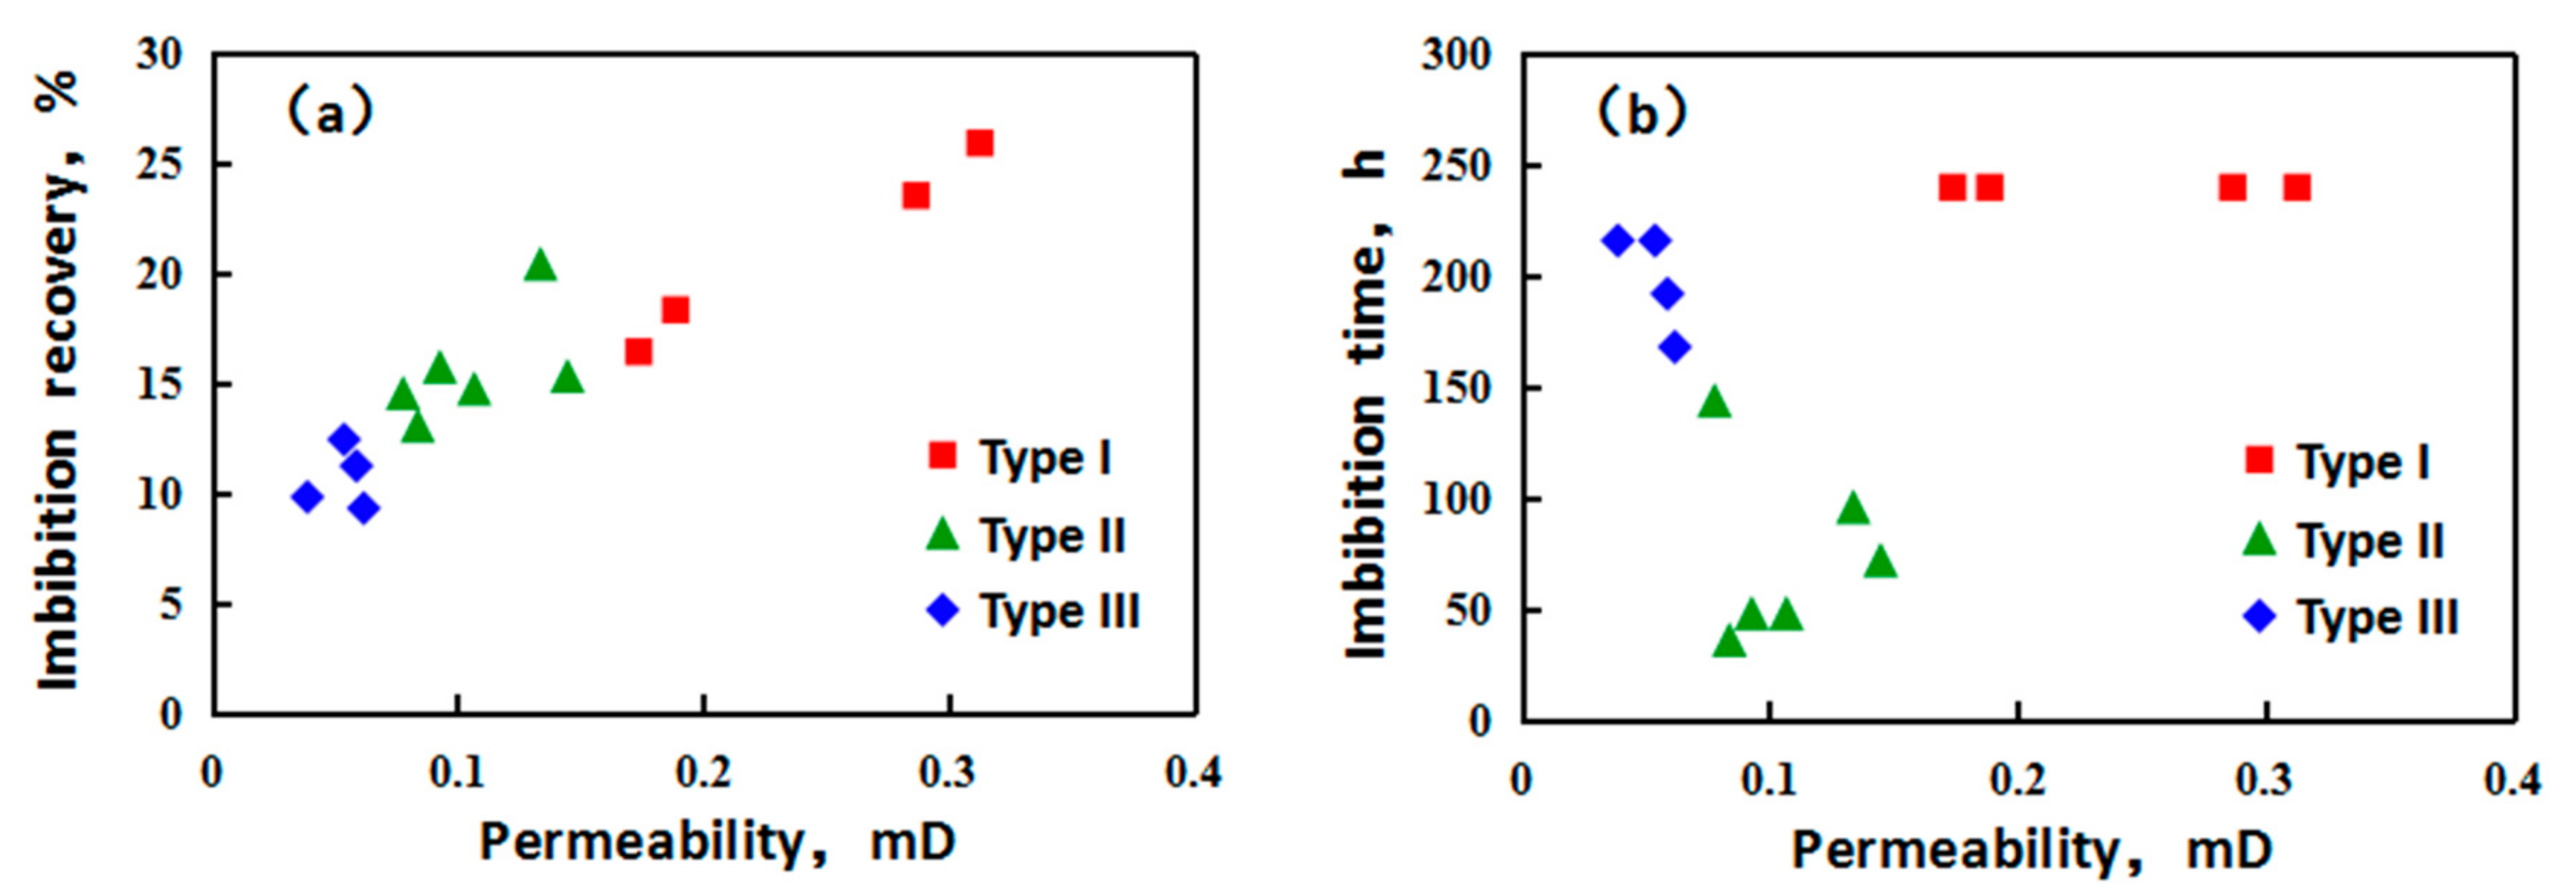
3.1. Imbibition Tests

The recovery of oil during imbibition using 14 core samples with distinct physical properties is illustrated in Figure 4. To better compare the imbibition characteristics, the incremental weight of the cores was normalized (normalized incremental weight = periodically measured incremental weight/total incremental weight). The results are summarized in Table 2.
From the pictures taken during the imbibition experiments shown in Figure 2, it can be observed that for different cores, the quantity of expelled oil droplets was different. The amount of displaced oil droplets from cores No.1 and No.5 was significantly greater than that from core No.14. Namely, the latter core had a lower permeability, leading to a greater resistance to oil displacement. Therefore, we can assume that the higher the permeability, the higher the imbibition rate.
Imbibition curves for 14 core samples were plotted, with the incremental weight of the core sample against the imbibition duration. The pattern of the curves can be divided into three categories. Type I includes cores No.1, 2, 11, and 12. Figure 4a shows the imbibition curves of Type I cores. During the experiment, the imbibition and drainage processes occurred continuously, as indicated by the fact that the increased rate of the incremental weight was always greater than 0.1 g per 100 h. In this case, a plateau or steady state—which was defined as the point where the imbibition rate or the incremental weight is minimal and close to zero—was never reached. Type II includes cores No.3, 4, 5, 8, 10, and 13. As shown in Figure 4b, with the progression of the experiment, the imbibition rate was initially high and then gradually decreased until eventually it reached a plateau. The slope of the “plateau” was always smaller than 0.1 g per 100 h. Type III includes cores No.6, 7, 9, and 14. In Figure 4c it can be observed that as the experiment progressed, after a period of time the imbibition rate gradually stabilized and maintained for a certain duration, after which point the cores underwent another imbibition activity, and eventually reached a steady state. Details of the imbibition experiments are shown in Table 2.
To correlate the imbibition characteristics with the physical properties of the cores, Figure 5 demonstrates the scatter plots of permeability against imbibition recovery, and time required to reach a plateau (defined as imbibition time), respectively. Classification according to the aforementioned imbibition characteristic distinguishes the different types of cores shown in Figure 5. In Figure 5a, it is shown that the greater the permeability, the higher the imbibition recovery, which verifies the results obtained in Figure 2. From Figure 5b it can be observed that the relationship between permeability and time required to reach the steady state displayed a bifurcation configuration. When the permeability was less than 0.18 mD, the duration decreased as the permeability increased, and a plateau was never reached when the permeability was greater than 0.18 mD. The type I cores possessed high permeability and good pore-throat connectivity results in a negligible capillary effect. Therefore, the displacement of oil occurred continuously, and it was difficult to reach a steady state. The high recovery rate for Type I cores was due to the imbibition and gravitational effect. For Type II cores, permeability was lower than in those of Type I, and the pore-throat size was relatively small. The capillary effect driving imbibition to occur was significant, which took less time to reach a stable state and a relatively high imbibition rate. The permeability of Type III cores was low, and the pore-throat size was much smaller than in the Type I and II cores. As a result, the capillary effect dominated and motivated the displacement of oil. However, the flow resistance was large, which slowed the movement of oil and water and in turn led to a longer period of time required to reach a steady state and a poor recovery.
The imbibition process is closely associated with the petrophysical properties of the cores, and therefore SEM images were taken to closely examine the microscale pore-throat configuration. Three images are shown in Figure 6, representing each category of core. The image of core No.2 clearly displays a pore space with clay minerals such as illite adhering to the surface. Some pore space can be observed in core No.3, yet the intergranular pore was filled with clay minerals such as illite. Whereas core No.7 possessed much less pore space than the other two core types, due to an attachment of clays like illite and smectite. As a result, Type I cores possessing larger pore space allowed fluids to flow freely inside the rock, meaning that imbibition continuously occurred and required a longer time to reach the “plateau”. Type II cores possessed smaller pores, leading to a stronger capillary effect which facilitated imbibition. It therefore takes less time to reach a steady state for imbibition. Type III cores were relatively tight and therefore fluids could be easily imbibed via capillary forces, yet were difficult to expel due to a large flow resistance. Pores can be “blocked” and “unblocked” as the pressure inside is sufficient to re-mobilize the fluids. As a consequence, the imbibition curve of Type III cores demonstrated multiple stages. An analysis of the SEM images further supports the interpretation of the imbibition curves for the three types of cores.

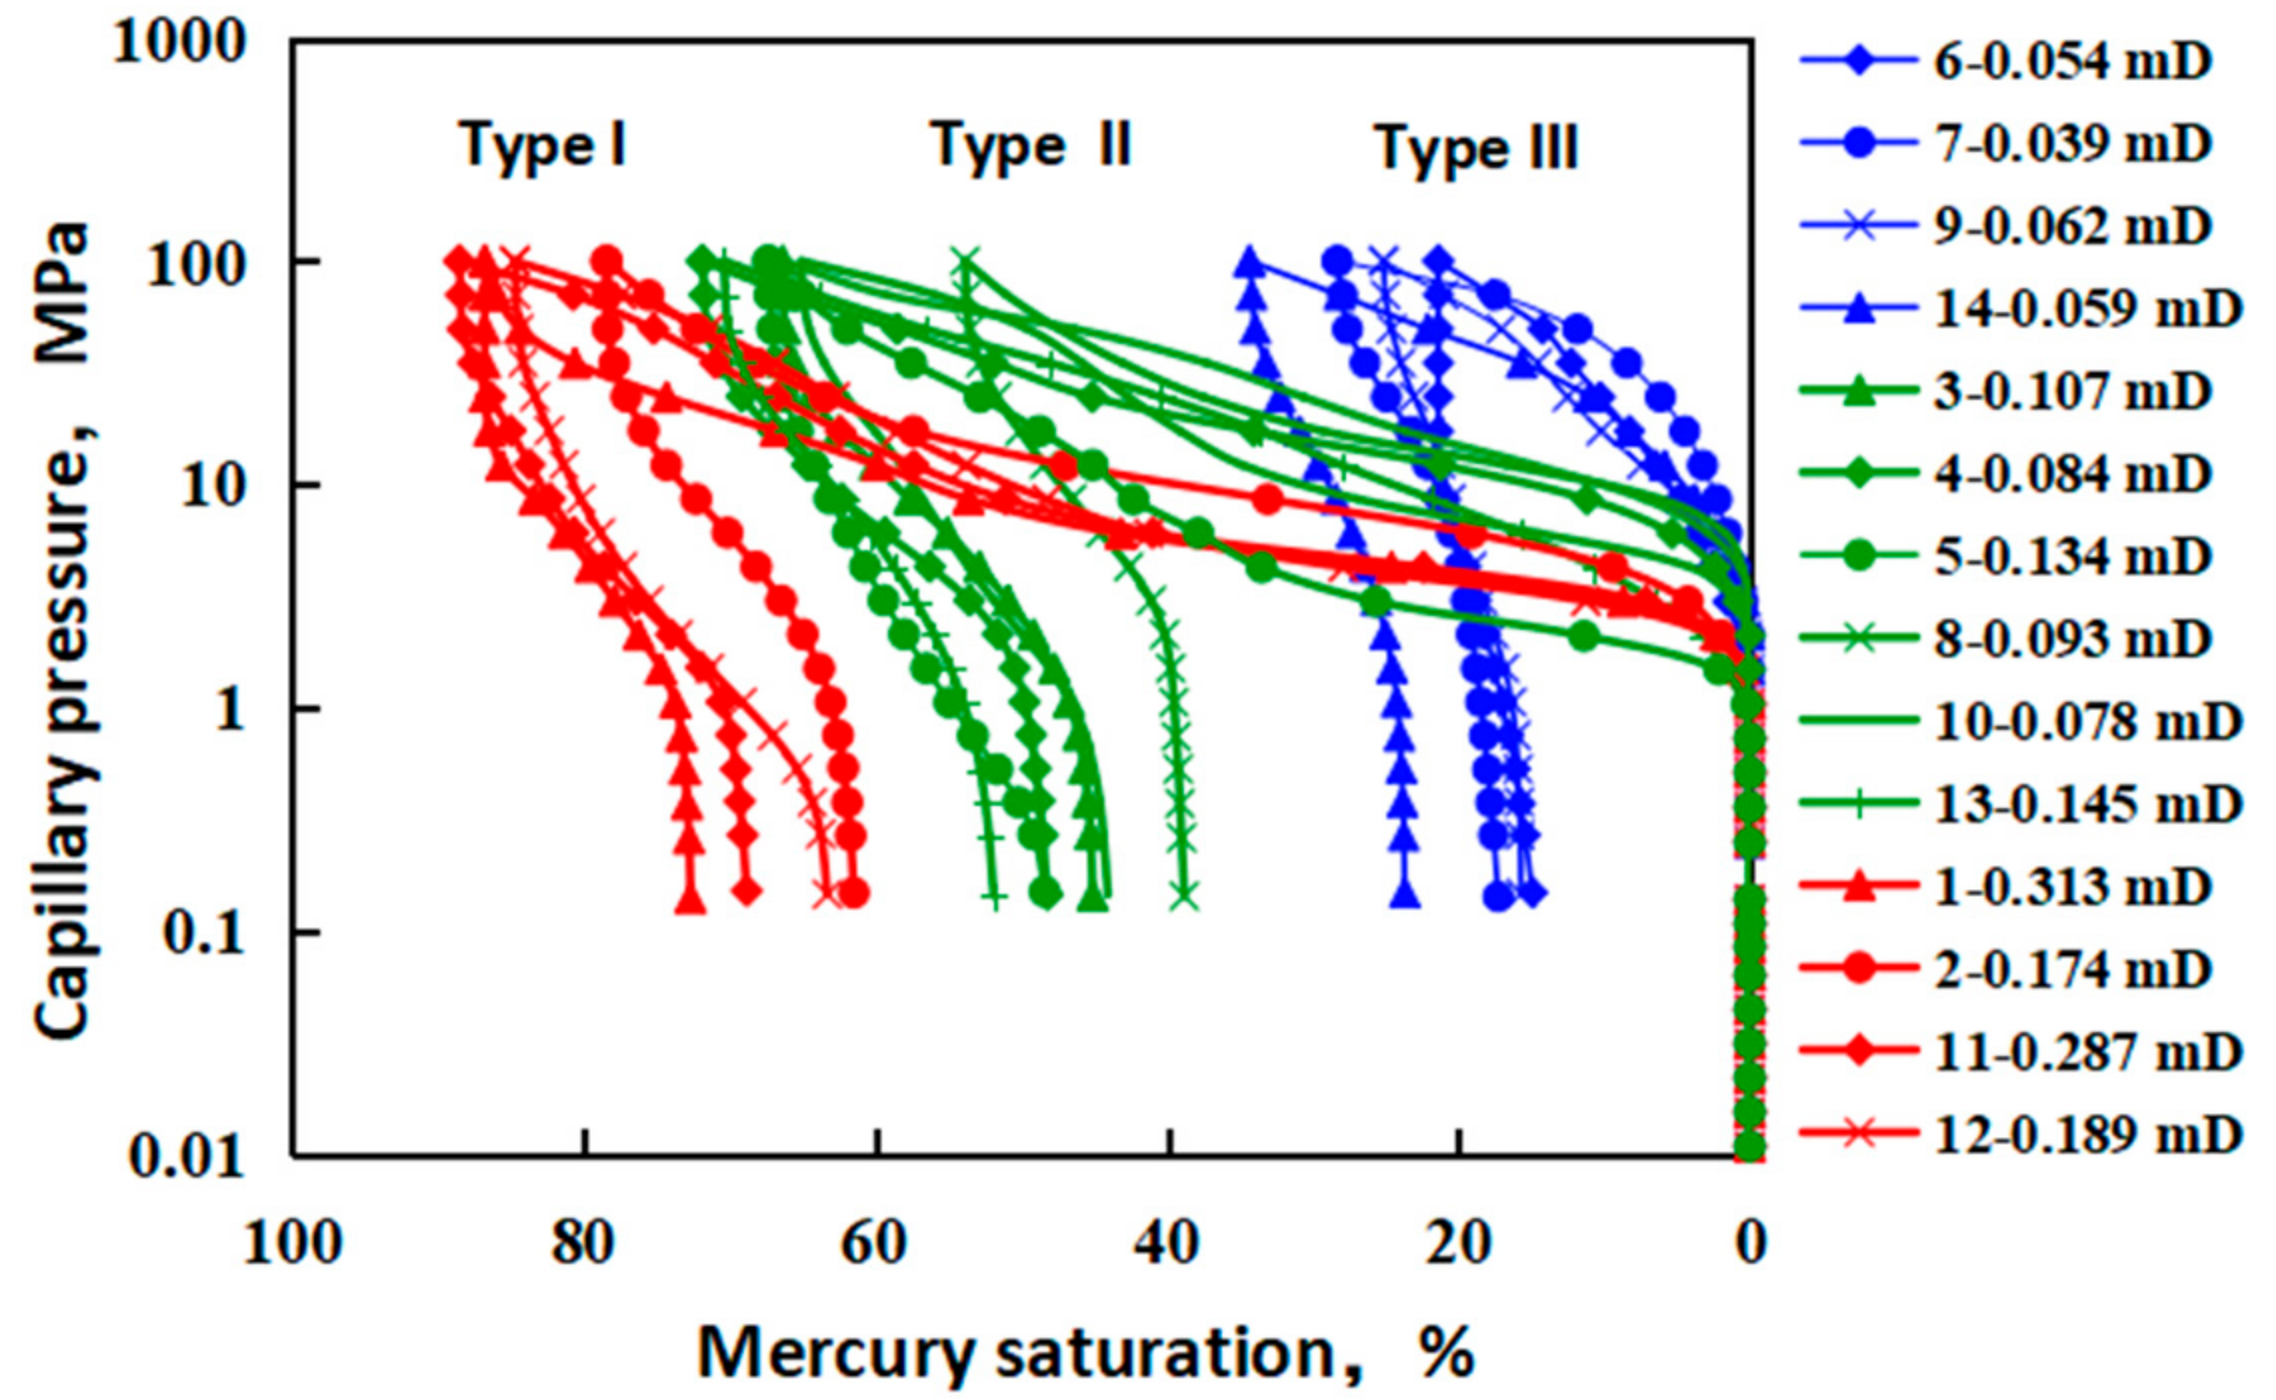
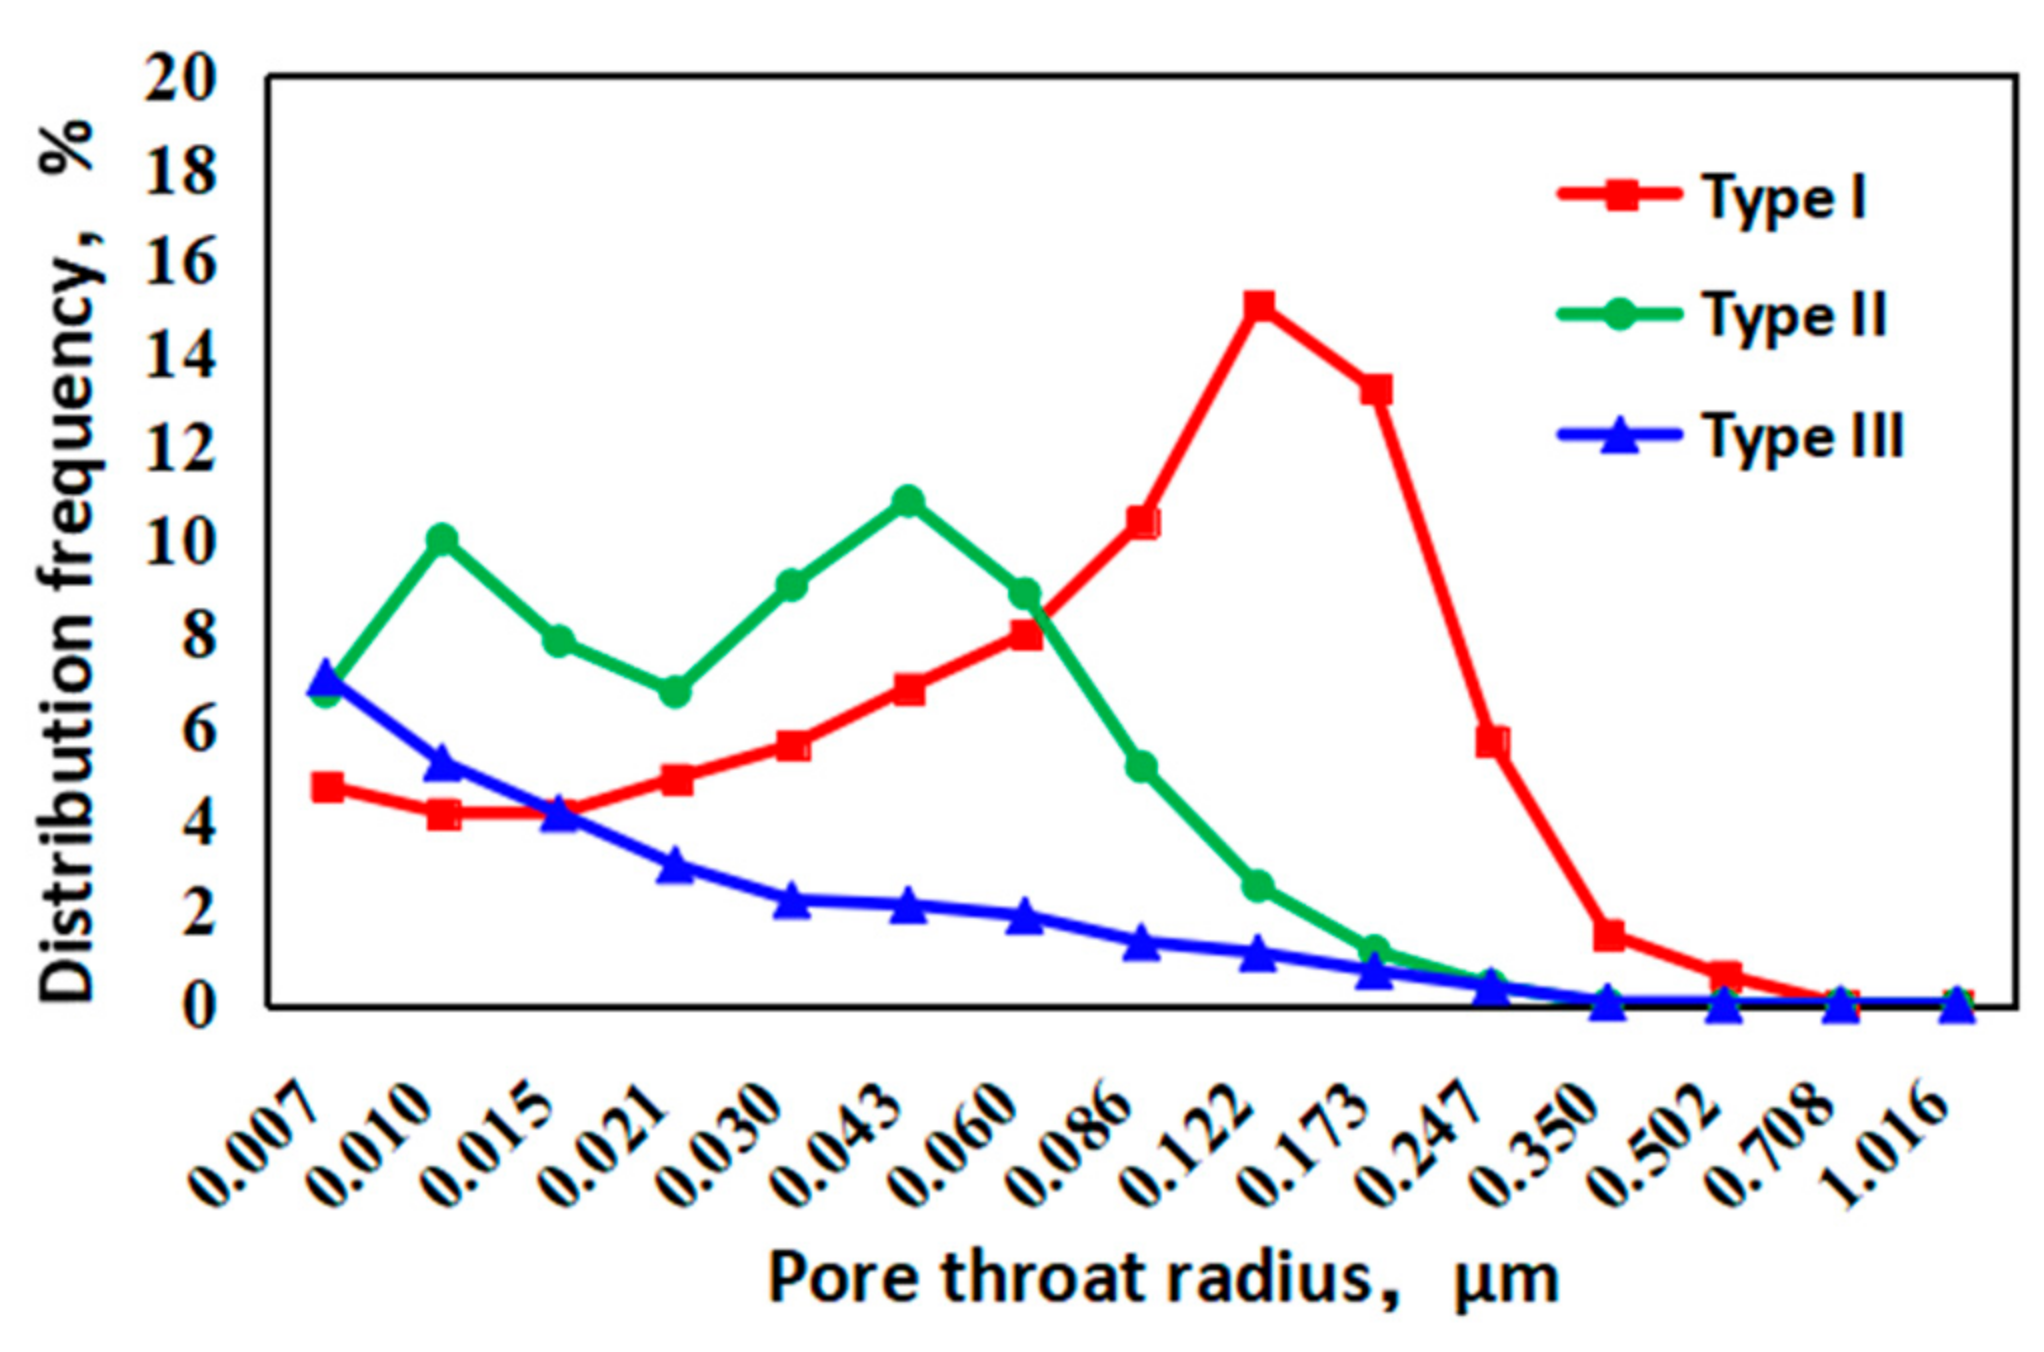
3.2. Mercury Intrusion Porosimetry Tests

From MIP tests, the capillary pressure curves of all 14 cores were obtained and are displayed in Figure 7. These can be roughly categorized into three types: the residual mercury saturation greater than 60%, between 20–60%, and less than 20%. Furthermore, they directly relate to the aforementioned classifications based upon imbibition characteristics.
For Type I cores, the permeability was relatively high and the pore-throat connectivity was better. During the imbibition process, the capillary effect was less prominent due to larger pore size, and therefore the imbibition process was slow and required a longer time to reach a steady state. Mercury was the non-wetting phase, and during the removal of mercury the capillary force drove the recovery. For the first category, a large residual mercury saturation indicated smaller capillary forces. Therefore, the resistance to imbibition and drainage was low, although imbibition occurred slowly due to the lack of driving forces. Compared to the first category, the residual mercury saturation of the second category was less, as the capillary effect was stronger. As a result, imbibition was favored and expelled oil was easily migrated, owing to a relatively large pore size. It therefore took less time to reach the steady state of imbibition. For the third category, residual mercury saturation was less compared with previous cases, implying that the capillary effect was prominent and the water phase was imbibed into the core sample due to strong capillary forces. Nevertheless, Type III cores possessed small pores, and the migration of displaced oil was limited because of a greater flow resistance. In this case, “water lock” was highly likely to occur. As illustrated in Figure 4c, with the progress of imbibition, oil was accumulated inside larger pores and throats and when the displacement pressure was greater than the resistance, and “water lock” was eliminated, leading to an increase in oil production. This explains the second increase in oil production for core No.6. Afterwards, imbibition gradually reached a steady state.
Pore-throat size distribution was another important result obtained from MIP tests. As displayed in Figure 8, distributions of the pore-throat size for three types of core samples were significantly different. For Type I cores, the red line demonstrates a single peak, implying that the pore-throat size mainly lies in the range of 0.086–0.173 μm, thus the capillary effect was less intense within relatively large pores. A wider range of pores and throats was available for fluid to flow inside the cores. In accordance with the Type I imbibition curve, imbibition occurred continuously, but it took much longer to reach the plateau. For Type II cores, double peaks with a similar distribution frequency were observed, with one peak representing pores smaller than 0.02 μm and the other representing pores larger than 0.02 μm. Namely, for this type of core, smaller pores motivated imbibition to occur, whereas larger pores provided pathways for oil displacement. As a consequence, oil could be steadily and effectively recovered by imbibition. Type III cores were relatively tight, with pore-throat size majorly distributed in a narrower range of 0.007–0.015 μm, and less pore space could be occupied by fluids—as displayed in Figure 8. Although the capillary effect was significant, fluid flow was restricted inside the narrow space because of a large flow resistance. Pores and throats can be easily blocked during oil displacement, leading to the first cessation of imbibition. However, after the fluid breaks through the blocked pathways, imbibition takes place once again until the plateau is reached. The pore size distributions obtained from MIP tests further verify the interpretation of the imbibition curves shown in Figure 4.

3.3. Classification Standard

According to the imbibition curves and capillary curves, tight sandstone cores were divided into three types. To further explore the relationship between imbibition and the intrinsic properties of the cores, the permeability of the cores versus their porosity was plotted (Figure 9), and the data points also fell into three categories. In general, a linear relationship between permeability and porosity was displayed, yet the slope varied for different types of cores.
For the first type of core, the permeability was mainly greater than 0.15 mD and the porosity ranged from 8% to 10%. The variation in porosity was minor compared with the change in permeability. For this type of reservoir, the pores are relatively large, with good connectivity, and the porosity is directly related to the permeability of the formation. A longer shut-in time leads to a higher oil recovery rate. The increase in oil recovery is likely attributable to the exchange between oil and water, rather than imbibition. For the second type, the permeability was mainly distributed from 0.08 to 0.15 mD, and the porosity ranged from 5% to 8%. Smaller pores and larger pores were interconnected and matched well. This type of reservoir is most suitable for adopting imbibition as the recovery method. It demands a shorter shut-in time and reaches the plateau at a high imbibition rate in a relatively short duration. In the laboratory study, the average shut-in time was three days. For the third core type, the permeability of the reservoir was below 0.08 mD, and the porosity ranged from 4% to 7%. As shown in Figure 9, an increase in porosity had less impact on the permeability, indicating that for this type of formation the pore-throat ratio and connectivity are the key factors, and not porosity. This type of reservoir requires a longer shut-in time if imbibition is regarded as the oil recovery mechanism. After the state is reached in which oil production no longer increases, an extension of the shut-in time leads to another stage of production until it reaches the steady state. Within the scope of the laboratory study, the average shut-in time was eight days.
Imbibition and the shut-in method are of great importance to the development of low-permeability or tight sandstone reservoirs. Previously proposed reservoir classification methods are solely based upon the geological characteristics or microscale pore-throat configurations, without considering the imbibition characteristics [15,23]. As for the study of imbibition, the most attention has been paid to the mechanisms and aspects impacting imbibition [29,39]. Additionally, reservoir development regimes have mostly been established for conventional reservoirs [17,21]. The shut-in method plays an important role in the development of low-permeability or tight reservoirs, yet the classification has rarely been built upon the development regime combining imbibition and shut-in method. The compatibility between the shut-in time and oil recovery cannot be satisfied simply through a classification method based upon the geological features of the reservoir. Issues like an excessive or insufficient shut-in duration could emerge, which potentially induce formation contamination, resulting in inefficient production. In this work, imbibition experiments were conducted using real core samples demonstrating differential properties. Imbibition behaviors were thoroughly analyzed incorporating the impact of the intrinsic properties of the cores, by which a new classification method was established, identifying the correlation between the imbibition characteristics, the petrophysical properties of the rock, and the shut-in method. The proposed development regime is compatible with the reservoir characteristics by involving the investigation of imbibition behaviors. Namely, different types of reservoirs correspond to their specific shut-in time and recovery method. This will effectively improve the ultimate recovery of reservoirs with differential physical properties. As a result, a classification method can be easily established by analyzing the basic petrophysical parameters of the reservoir and recognizing different imbibition patterns. This can be subsequently applied to the development of a production strategy like shut-in time, which provides a new and facile approach to characterizing reservoirs and developing appropriate production methods. In this work, imbibition experiments were performed via a conventional weight method under laboratory conditions instead of reservoir conditions. Subsequent work can therefore be improved by simulating imbibition under high temperatures and high pressures in order to provide a more realistic correlation between imbibition and oil recovery. Additionally, the shut-in method can be further optimized by quantifying the relationship between imbibition and oil recovery to achieve a higher production efficiency.

4. Conclusions

In this work, a new classification method for Chang-7 tight sandstone reservoirs was established based upon imbibition experiments. Conclusions are drawn as follows:
(1)
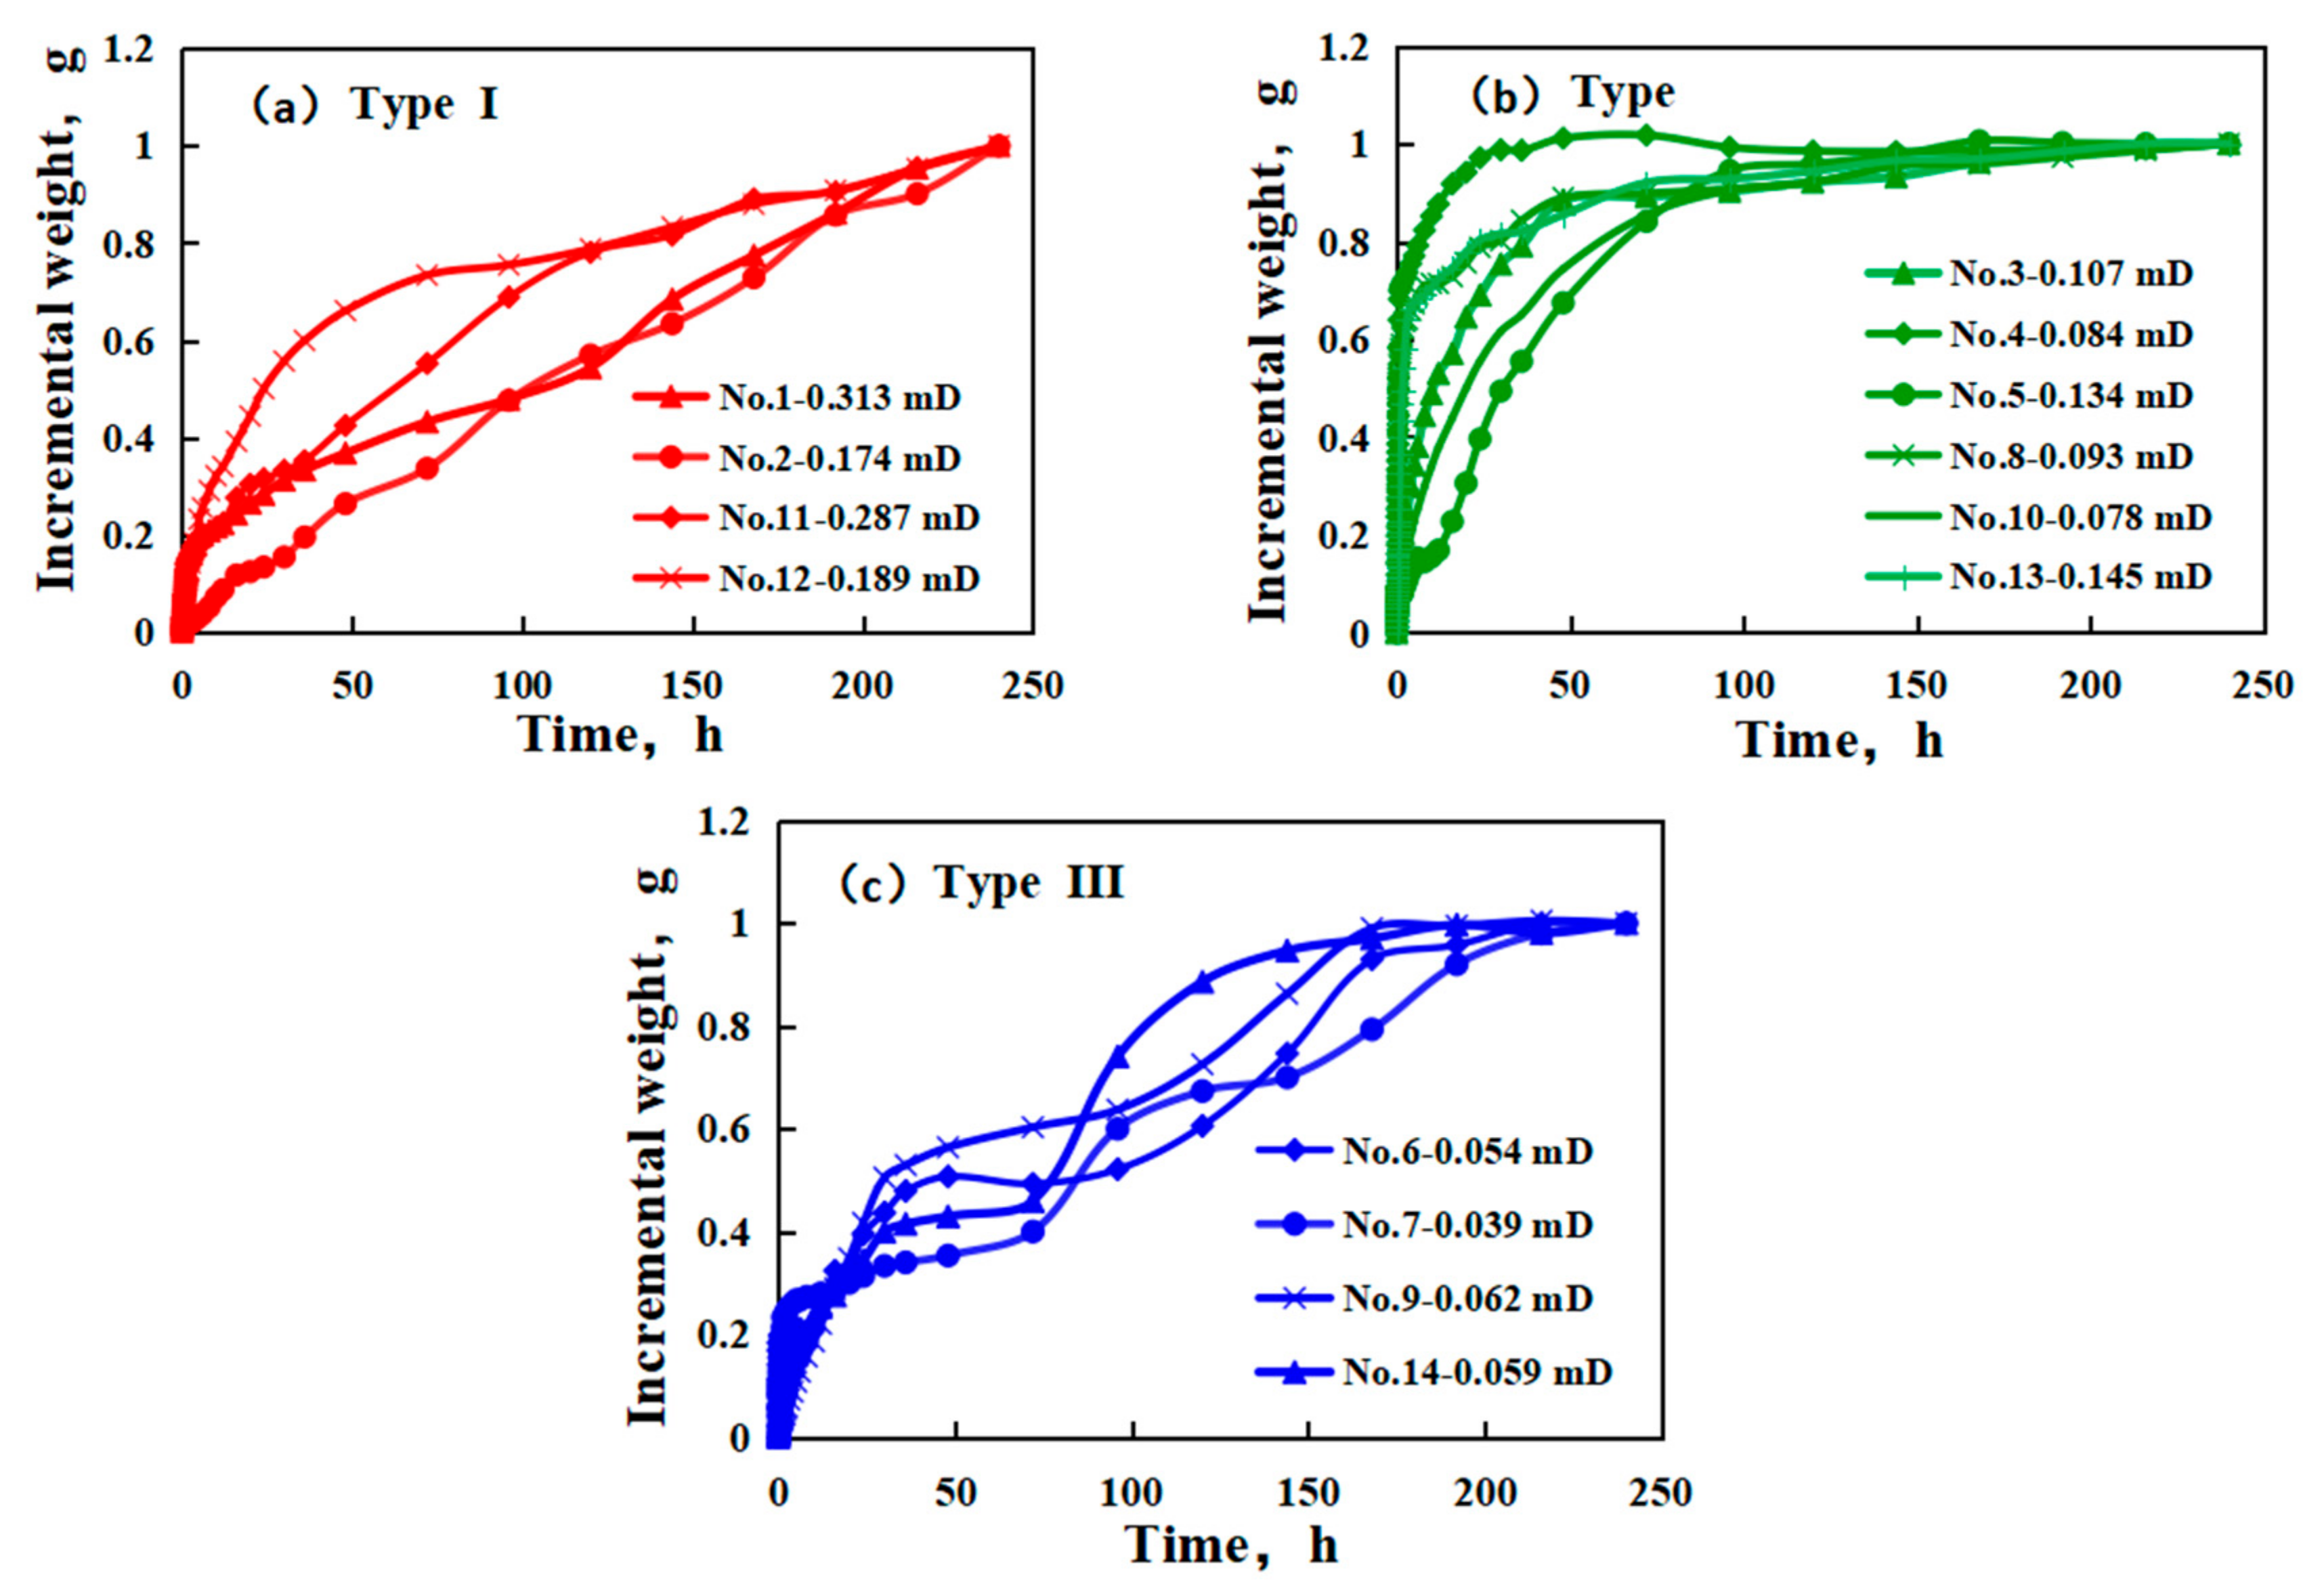
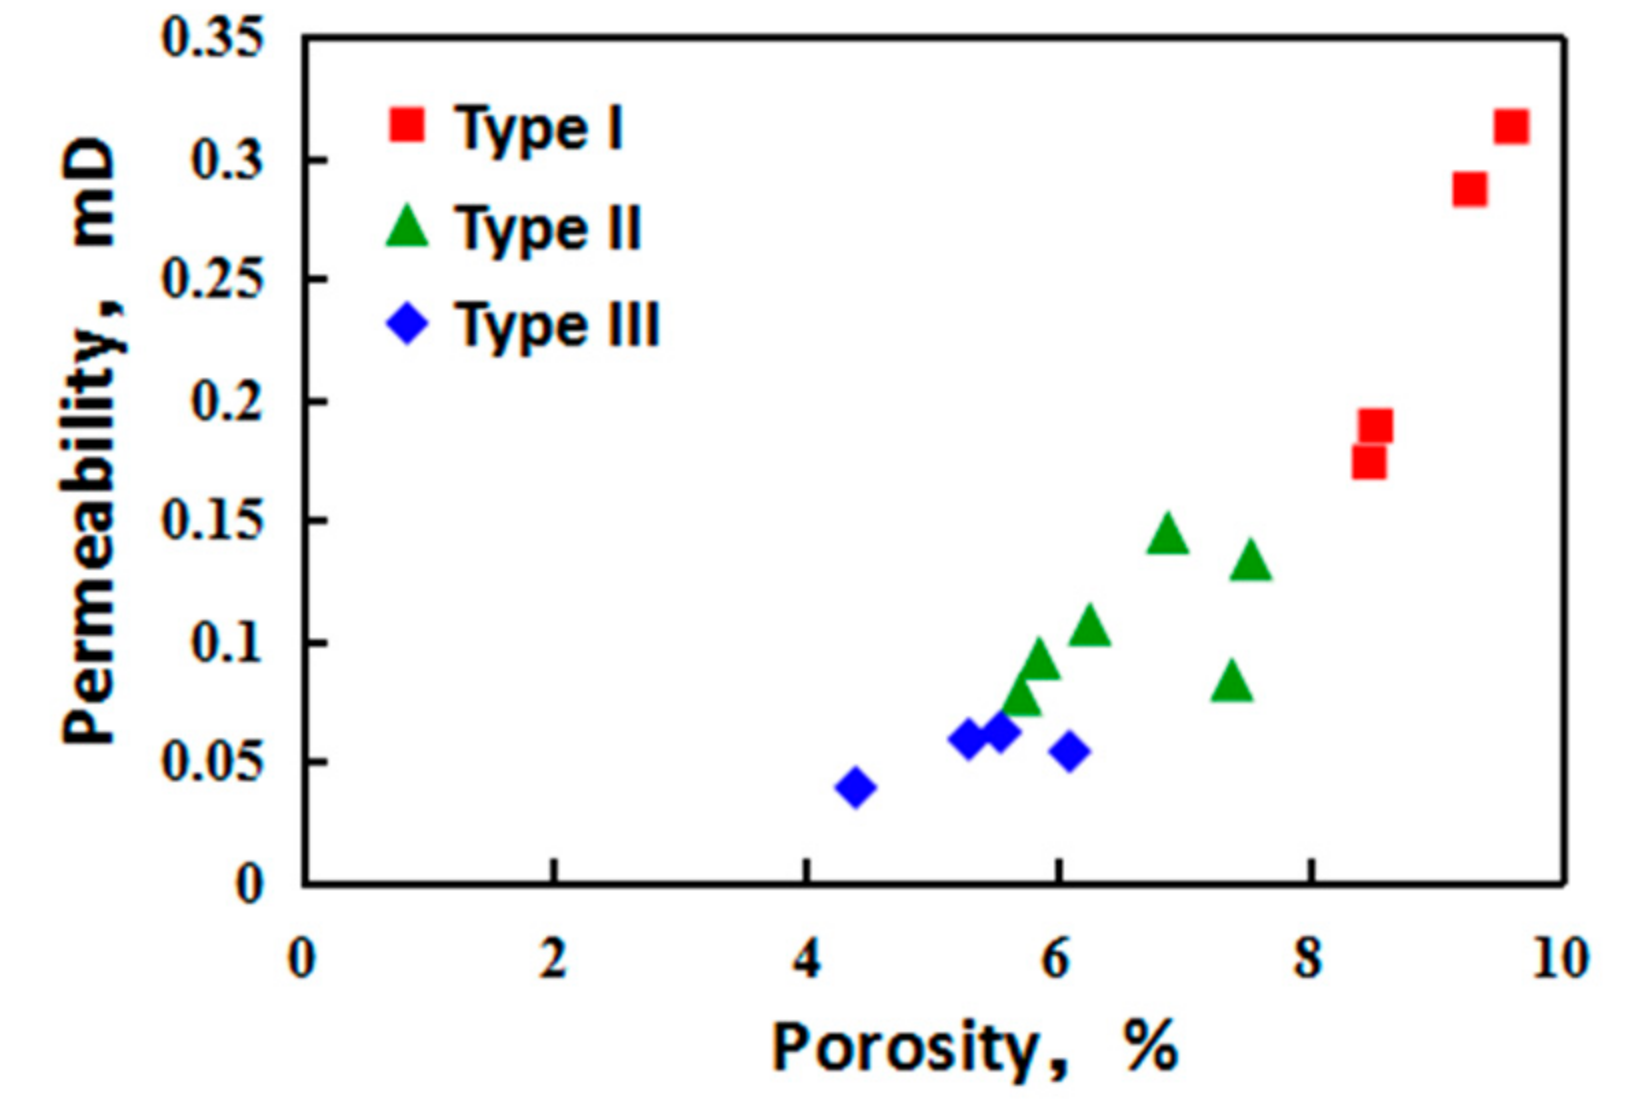
Three types of formation were identified. For the first type, reservoir permeability was above 0.15 mD and its porosity ranged from 8 to 10%. The capillary effect was less intense, and imbibition and drainage occurred continuously without ever reaching a plateau within the experiment duration. A longer time was required to reach a steady state of imbibition, and therefore a longer shut-in time will yield a higher oil recovery. For the practical reservoir development, the optimal shut-in time should be determined while also considering the cost.
(2)
For the second category, reservoir permeability ranged from 0.08 to 0.15 mD, and the porosity was between 5% and 8%. This type of core displayed a strong imbibition effect. The aqueous phase quickly entered the matrix and displaced the oil, requiring less time to reach the plateau. This type of reservoir is most suitable for adopting imbibition as the recovery method, owing to a relatively shorter shut-in time and a greater oil recovery efficiency. The average shut-in time was experimentally determined as three days under laboratory conditions.
(3)
For the third category, reservoir permeability was mainly below 0.08 mD, and the porosity ranged from 4% to 7%. The capillary effect was prominent, leading to vigorous imbibition activity. Water was readily imbibed into the matrix, yet oil was difficult to expel due to a large resistance within small pores. It is highly likely that “water block” will occur. However, when the displacement pressure surpasses the flow resistance, “water block” can be eliminated and imbibition continues. This type of reservoir therefore demonstrates two stages of an increase in oil production and demands a longer imbibition time, resulting in a relatively low oil recovery efficiency. The average shut-in time was eight days under laboratory conditions.

Author Contributions

Conceptualization, D.Z.; Methodology, M.L., D.Z. and Y.L.; Validation, M.L., Y.L. and D.Z.; Investigation, M.L., H.Y., H.L. and T.W.; Data Curation, M.L.; Writing-Original Draft Preparation, M.L. and Y.L.; Writing-Review & Editing, D.Z. and Y.L.; Supervision, D.Z. and Y.L.; Project Administration, D.Z.; Funding Acquisition, D.Z.

Funding

This research was funded by the National Natural Science Foundation of China (No. 51874242) and the National Science and Technology Major Project of China (No. 2016ZX05050-009).

Acknowledgments

Acknowledgement is made to the National Natural Science Foundation of China and the Ministry of Science and Technology of China for support of this research.

Conflicts of Interest

The authors declare no conflict of interest. The funders had no role in the design of the study; in the collection, analyses, or interpretation of data; in the writing of the manuscript, or in the decision to publish the results.

References

  1. Boudet, H.S.; Zanocco, C.M.; Howe, P.D.; Clarke, C.E. The effect of geographic proximity to unconventional oil and gas development on public support for hydraulic fracturing. Risk Anal. 2018, 38. [Google Scholar] [CrossRef] [PubMed]
  2. Jia, C.; Zheng, M.; Zhang, Y. Unconventional hydrocarbon resources in China and the prospect of exploration and development. Pet. Explor. Dev. 2012, 39, 129–136. [Google Scholar] [CrossRef]
  3. Leimkuhler, J.; Leveille, G. Unconventional Resources; Society of Petroleum Engineers: Richardson, TX, USA, 2012; Volume 8, pp. 27–28. [Google Scholar]
  4. Kazempour, M.; Kiani, M.; Nguyen, D.; Salehi, M.; Moradi, M.; Lantz, M. Boosting Oil Recovery in Unconventional Resources Utilizing Wettability Altering Agents: Successful Translation from Laboratory to Field. In Proceedings of the SPE Improved Oil Recovery Conference, Tulsa, OK, USA, 14–18 April 2018. [Google Scholar]
  5. Zhang, D.; Zhang, J.; Wang, Y.; Tang, Y.; Yu, W. China’s unconventional oil and gas exploration and development: Progress and prospects. Resour. Sci. 2015, 37, 106–112. [Google Scholar]
  6. Wheaton, R. Unconventional Resources. In Fundamentals of Applied Reservoir Engineering; Elsevier Science: Amsterdam, The Netherlands, 2016. [Google Scholar]
  7. Wang, X.; Ren, L.; He, Y. Definition of tight oil in Ordos Basin. Pet. Geol. Recover. Effic. 2016, 23, 1–7. [Google Scholar]
  8. Zou, C.; Zhang, G.; Yang, Z.; Tao, S.; Hou, L.; Zhu, R.; Yuan, X.; Ran, Q.; Li, D.; Wang, Z. Geological concepts, characteristics, resource potential and key techniques of unconventional hydrocarbon: On unconventional petroleum geology. Pet. Explor. Dev. 2013, 40, 385–399. [Google Scholar] [CrossRef]
  9. Zhou, Q.; Yang, G. Definition and application of tight oil and shale oil terms. Oil Gas Geol. 2012, 33, 541–544. [Google Scholar]
  10. Li, M.; Li, J. “Dynamic trap”: A main action of hydrocarbon charging to form accumulations in low permeability-tight reservoir. Acta Pet. Sin. 2010, 31, 718–722. [Google Scholar]
  11. Ghanizadeh, A.; Clarkson, C.R.; Aquino, S.; Ardakani, O.H.; Sanei, H. Petrophysical and geomechanical characteristics of Canadian tight oil and liquid-rich gas reservoirs: I. Pore network and permeability characterization. Fuel 2015, 153, 682–691. [Google Scholar] [CrossRef]
  12. Wang, H.; Liao, X.; Lu, N.; Cai, Z.; Liao, C.; Dou, X. A study on development effect of horizontal well with SRV in unconventional tight oil reservoir. J. Energy Inst. 2014, 87, 114–120. [Google Scholar] [CrossRef]
  13. Khan, R.; Al-Nakhli, A.R. An Overview of Emerging Technologies and Innovations for Tight Gas Reservoir Development. In Proceedings of the SPE International Production and Operations Conference & Exhibition, Doha, Qatar, 14–16 May 2012; p. 387. [Google Scholar]
  14. Truong, N.H.; Bae, W. Optimal Fracturing Parameters Condition of Integrated Model Development for Tight Oil Sands Reservoir with 2D Fracture Geometry Using Response Surface Methodology. Res. J. Appl. Sci. Eng. Technol. 2016, 12, 994–1006. [Google Scholar] [CrossRef]
  15. Schmitt, M.; Halisch, M.; Müller, C.; Fernandes, C.P. Classification and quantification of pore shapes in sandstone reservoir rocks with 3-D X-ray micro-computed tomography. Solid Earth 2016, 7, 3441–3479. [Google Scholar] [CrossRef]
  16. Claes, S.; Soete, J.; Cnudde, V.; Swennen, R. A three-dimensional classification for mathematical pore shape description in complex carbonate reservoir rocks. Math. Geosci. 2016, 48, 619–639. [Google Scholar] [CrossRef]
  17. Zhao, J.; Liu, Z.; Xie, Q.; Zhou, J. Micro Pore Throat Structural Classification of Chang 7 Tight Oil Reservoir of Jiyuan Oilfi eld in Ordos Basin. China Pet. Explor. 2014, 19, 73–79. [Google Scholar]
  18. Chen, S.-B.; Xia, X.-G.; Fu, C.-Q. Classification of pore structures in shale gas reservoir at the Longmaxi Formation in the south of Sichuan Basin. J. Coal Sci. Eng. 2013, 38, 760–765. [Google Scholar]
  19. Zhao, C.; Qu, H.; Zhang, Z. The characteristics and classification evaluation of Chang-6 reservoir in south Huaziping Area of Xingzichuan oilfield. Unconv. Oil Gas 2017, 4, 44–50. [Google Scholar]
  20. Jiang, R.; Qian, J.; Sun, H.; Fu, J.; Peng, G.; Qiao, X. Reservoir classification method for low-permeability glutenite reservoirs. Pet. Geol. Recover. Effic. 2018, 1, 90–93. [Google Scholar]
  21. Dai, J.; Xie, J.; Li, Z.; Ren, Q.; Zhang, H. Reservoir classification and evaluation in the east of Sulige gasfield. Pet. Geol. Recover. Effic. 2017, 31, 57–60. [Google Scholar]
  22. Ghosh, A.; Vasudevan, K. Bipartite Carbonate Reservoir classification methodology to address data inadequacy and capture pore level heterogeneity: A Case Study. In Proceedings of the Spwla India Symposium, Mumbai, India, 11–12 February 2017. [Google Scholar]
  23. Cao, J. Reservoir identification: Parameter characterization or feature classification. In Proceedings of the AGU Fall Meeting, New Orleans, LA, USA, 11–15 December 2017. [Google Scholar]
  24. Xu, X.; Wang, H.; Zhang, Z. Classification and evaluation of low permeability reservoir of Chang 8 formation in Jiyuan oilfield. Coal Technol. 2017, 36, 118–120. [Google Scholar]
  25. Oen, P.M.; Engell-Jensen, M.; Barendregt, A.A. Skjold field, Danish North Sea: Early evaluations of oil recovery through water imbibition in a fractured reservoir. SPE Reservoir Eng. 1988, 3, 17–22. [Google Scholar] [CrossRef]
  26. Babadagli, T.; Ershaghi, I. Imbibition assisted two-phase flow in natural fractures. In Proceedings of the Western Regional Meeting, Bakersfield, CA, USA, 30 March–1 April 1992. [Google Scholar]
  27. Al-Lawati, S.; Oman, P.D.O.; Saleh, S. Oil recovery in fractured Oil Reservoirs by low IFT imbibition process. In Proceedings of the SPE Annual Technical Conference and Exhibition, Denver, CO, USA, 6–9 October 1996. [Google Scholar]
  28. Bertoncello, A.; Wallace, J.; Blyton, C.; Honarpour, M.; Kabir, C.S. Imbibition and water blockage in unconventional reservoirs: Well management implications during flowback and early production. In Proceedings of the SPE/EAGE European Unconventional Conference and Exhibition, Vienna, Austria, 25–27 February 2014. [Google Scholar]
  29. Mirzaei, M.; Dicarlo, D.A.; Pope, G.A. Visualization and analysis of surfactant imbibition into oil-wet fractured core. In Proceedings of the SPE Annual Technical Conference and Exhibition, New Orleans, LA, USA, 30 September–2 October 2013. [Google Scholar]
  30. Kathel, P.; Mohanty, K.K. EOR in tight oil reservoirs through wettability alteration. In Proceedings of the SPE Annual Technical Conference and Exhibition, New Orleans, LA, USA, 30 September–2 October 2013. [Google Scholar]
  31. Alvarez, J.O.; Schechter, D.S. Wettability Alteration and Spontaneous Imbibition in Unconventional Liquid Reservoirs by Surfactant Additives. SPE Reserv. Eval. Eng. 2017. [Google Scholar] [CrossRef]
  32. Gao, Z.; Hu, Q. Initial water saturation and imbibition fluid affect spontaneous imbibition into Barnett shale samples. J. Nat. Gas Sci. Eng. 2016, 34, 541–551. [Google Scholar] [CrossRef]
  33. Mehana, M.; Alsalman, M.; Fahes, M. The Impact of Salinity and Mineralogy on Slick Water Spontaneous Imbibition and Formation Strength in Shale. Energy Fuels 2018, 32, 5725–5735. [Google Scholar] [CrossRef]
  34. Habibi, A.; Binazadeh, M.; Dehghanpour, H.; Binazadeh, M.; Bryan, D.; Uswak, G. Advances in understanding wettability of tight oil formations. In Proceedings of the SPE Annual Technical Conference and Exhibition, Houston, TX, USA, 28–30 September 2015. [Google Scholar]
  35. Chahardowli, M.; Farajzadeh, R.; Masalmeh, S.K.; Mahani, H.; Bruining, H. A novel enhanced oil recovery technology using dimethyl ether/brine: Spontaneous imbibition in sandstone and carbonate rocks. In Proceedings of the SPE annual technical conference and exhibition, Dubai, UAE, 26–28 September 2016. [Google Scholar]
  36. Valluri, M.K.; Alvarez, J.O.; Schechter, D.S. Study of the rock/fluid interactions of sodium and calcium brines with ultra-tight rock surfaces and their impact on improving oil recovery by spontaneous imbibition. In Proceedings of the SPE Low Perm Symposium, Denver, CO, USA, 5–6 May 2016. [Google Scholar]
  37. Lan, Q.; Ghanbari, E.; Dehghanpour, H.; Hawkes, R. Water loss versus soaking time: Spontaneous imbibition in tight rocks. In Proceedings of the SPE/EAGE European Unconventional Conference and Exhibition, Vienna, Austria, 25–27 February 2014. [Google Scholar]
  38. Gu, X.; Pu, C.; Huang, H.; Huang, F.; Li, Y.; Liu, Y.; Liu, H. Micro-influencing mechanism of permeability recovery for tight sandston on spontaneous imbibition reservoirs. Pet. Explor. Dev. 2017, 44, 948–954. [Google Scholar] [CrossRef]
  39. Wei, Q.; Li, Z.; Wang, X.; Wang, C.; Bai, R.; Wang, C.; Li, H. Mechanism and influence factors of imbibition in fractured tight sandstone reservoir: An example from Chang 8 reservoir of Wuqi area in Ordos Basin. Pet. Geol. Recover. Effic. 2016, 23, 102–107. [Google Scholar]
  40. Santanna, V.C.; Castro, T.A.; Borges, T.A.; Bezerril, A.R.; Nascimento, A.E.G. The Influence of Surfactant Solution Injection in Oil Recovery by Spontaneous Imbibition. Pet. Sci. Technol. 2014, 32, 2896–2902. [Google Scholar] [CrossRef]
  41. Towler, B.F.; Lehr, H.L.; Austin, S.W.; Bowthorpe, B.; Feldman, J.H.; Forbis, S.K.; Germack, D.; Firouzi, M. Spontaneous Imbibition Experiments of Enhanced Oil Recovery with Surfactants and Complex Nano-Fluids. J. Surfactants Deterg. 2017, 20, 1–11. [Google Scholar] [CrossRef]
  42. Li, X.; Teklu, T.W.; Abass, H.; Cui, Q. The Impact of Water Salinity/Surfactant on Spontaneous Imbibition through Capillarity and Osmosis for Unconventional IOR. In Proceedings of the Unconventional Resources Technology Conference, San Antonio, TX, USA, 1–3 August 2016. [Google Scholar]
Figure 1. Schematic of the experimental setup of the imbibition tests.
Energies 11 02619 g001
Figure 2. Pictures showing oil discharge during imbibition using cores No. 1, 5, and 14, respectively.
Energies 11 02619 g002
Figure 3. Experimental setup of the mercury intrusion porosimetry test.
Energies 11 02619 g003
Figure 4. Incremental weight of the core by imbibition over 240 h. Three types of curve were identified.
Energies 11 02619 g004
Figure 5. The relationship between permeability and: (a) oil recovery from imbibition; (b) time required for the imbibition inside core samples to reach a plateau.
Energies 11 02619 g005
Figure 6. Scanning electron microscope (SEM) images of the core samples.
Energies 11 02619 g006
Figure 7. Capillary pressure curve for 14 core samples via mercury intrusion porosimetry.
Energies 11 02619 g007
Figure 8. Distribution of the average pore-throat size for different types of cores.
Energies 11 02619 g008
Figure 9. The relationship between the permeability and porosity of the core samples.
Energies 11 02619 g009
Table 1. Basic physical properties of the core samples.
No.Depth, mLength, cmDiameter, cmPorosity, %Permeability, mD
11671.84.3802.5329.610.313
21674.254.3922.5308.480.174
31680.54.3402.5326.260.107
41737.244.3642.5167.390.084
51837.84.3782.5007.540.134
62149.764.3862.5006.100.054
72136.754.5102.5164.400.039
824244.3422.5145.860.093
92458.74.2602.5145.550.062
102035.184.4062.5205.710.078
112043.814.3062.5209.280.287
122074.44.3302.5228.530.189
1320834.3862.5186.880.145
1422074.3942.5185.300.059
Table 2. Summary of the properties of the core samples and imbibition experiment results.
No.Porosity, %Permeability, mDOil Recovery, %Time Required to Reach Plateau, h
19.610.31325.94240
28.480.17416.43240
36.260.10714.7648
47.390.08413.0736
57.540.13420.4596
66.100.05412.43216
74.400.0399.81216
85.860.09315.7648
95.550.0629.3168
105.710.07814.56144
119.280.28723.55240
128.530.18918.34240
136.880.14515.3472
145.300.05911.23192

