Collaborative Optimization of Post-Disaster Damage Repair and Power System Operation

Abstract
1. Introduction
2. Model Description
3. Mathematical Model
- All repair teams are capable of repairing any type of damage. Once a damaged component is repaired, repair team will leave for the next one immediately, until all the tasks are completed.
- The repair time and resource to fix a fault is known and certain; the vehicle speed of repair teams is fixed.
- During the process of damage repair and system restoration, no extra new equipment damage occurs.
- The repair expense of fault points and the outage unit restoration cost are fixed, which have nothing to do with the repair moment or repair teams.
- Generators are not damaged by disasters because they are often located indoors.
3.1. Objective Function
3.2. Constraints
3.2.1. Constraints of Damage Repair
- Constraints of damage repair routing
- Constraints of repair resources
- Constraints of damaged component states
3.2.2. Constraints of Power System Operation
- Constraints of power system safe and stable operation
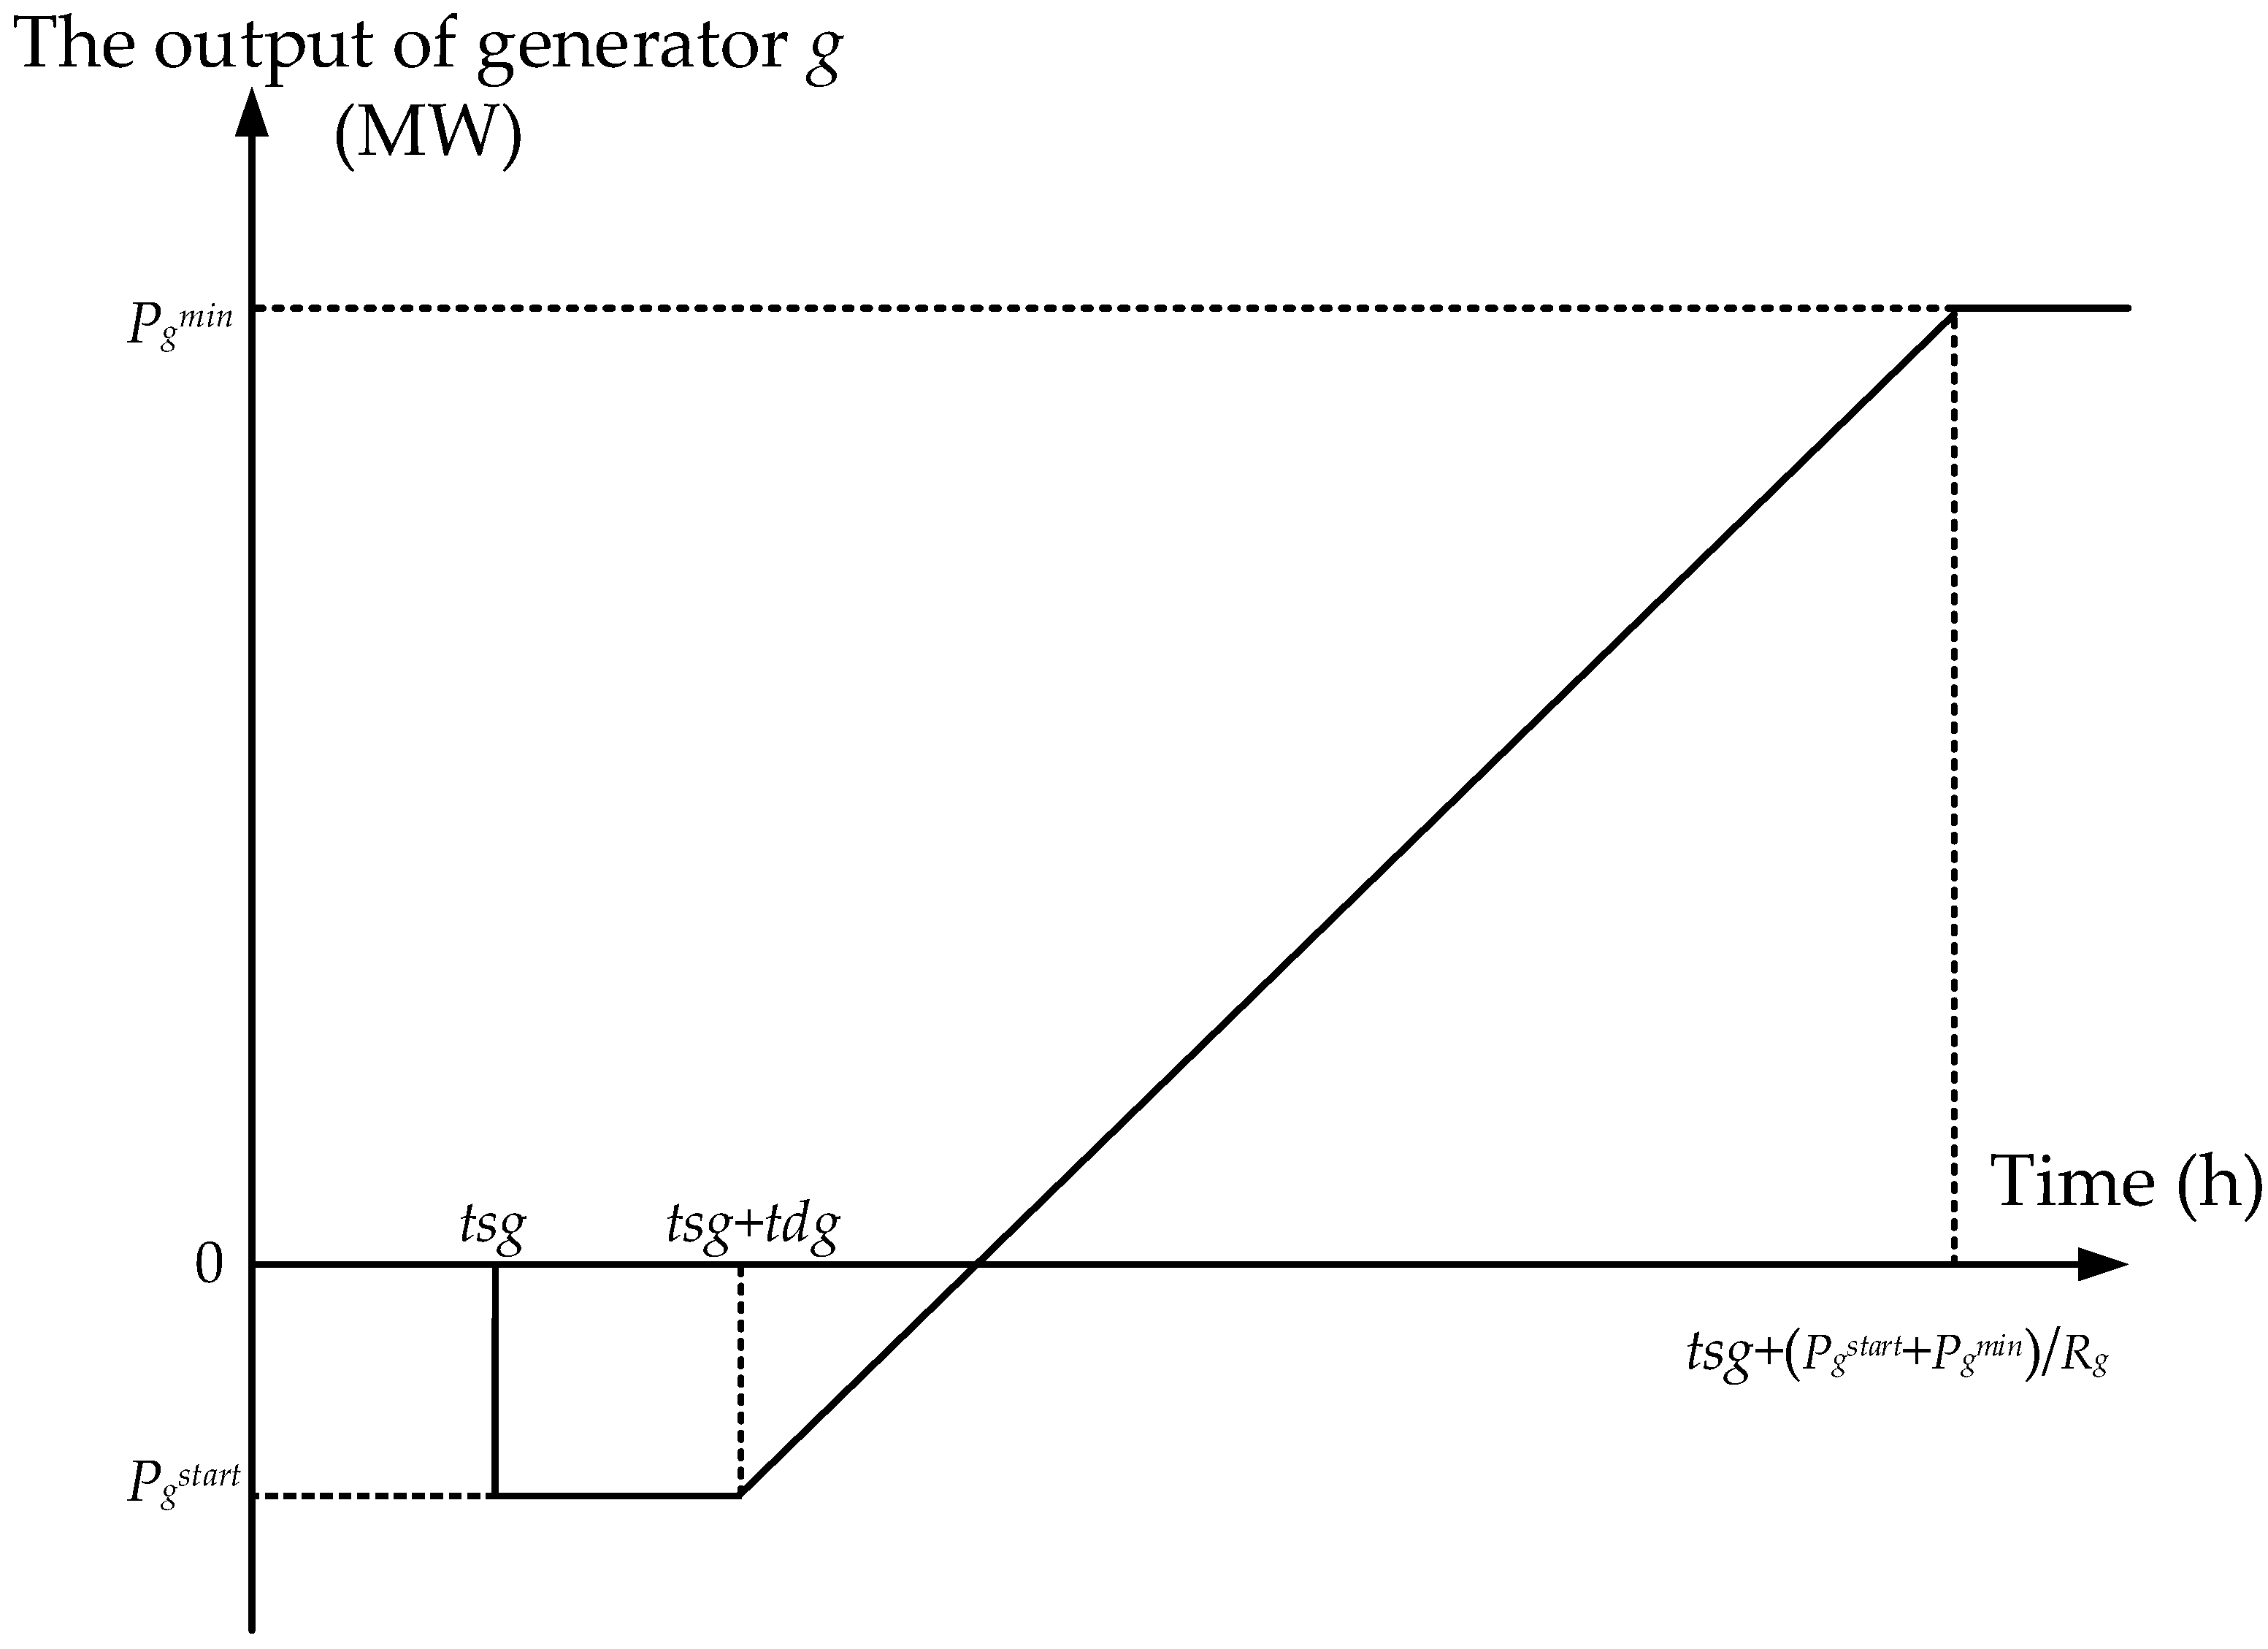
- The restoration characteristic of generators
- Constraints of component operation states
3.2.3. Coupling Constraints
3.2.4. Transformation of Complex Nonlinear Constraint
4. Solution
4.1. Lagrange Relaxation of the MISOCP Model
- The damage repair routing problem
- The power system operation optimization problem
4.2. The Acceleration Strategy
4.3. The Algorithm Flow
- The original co-optimization model is transformed to the modified MISOCP model by linearizing some complex constraints.
- Set the initial values of Lagrange multipliers.
- The MISOCP model is decomposed into the upper sub problem of damage repair routing and the lower sub problem of power system operation optimization.
- Solve the two sub problems alternately in each iteration. If the LR convergence criterion is satisfied, output the result and end the calculation or else go to step 5.
- If the acceleration convergence condition is satisfied, implement the acceleration strategy and output the result. Otherwise, update the values of Lagrange multipliers and go to step 4.
5. Case Study
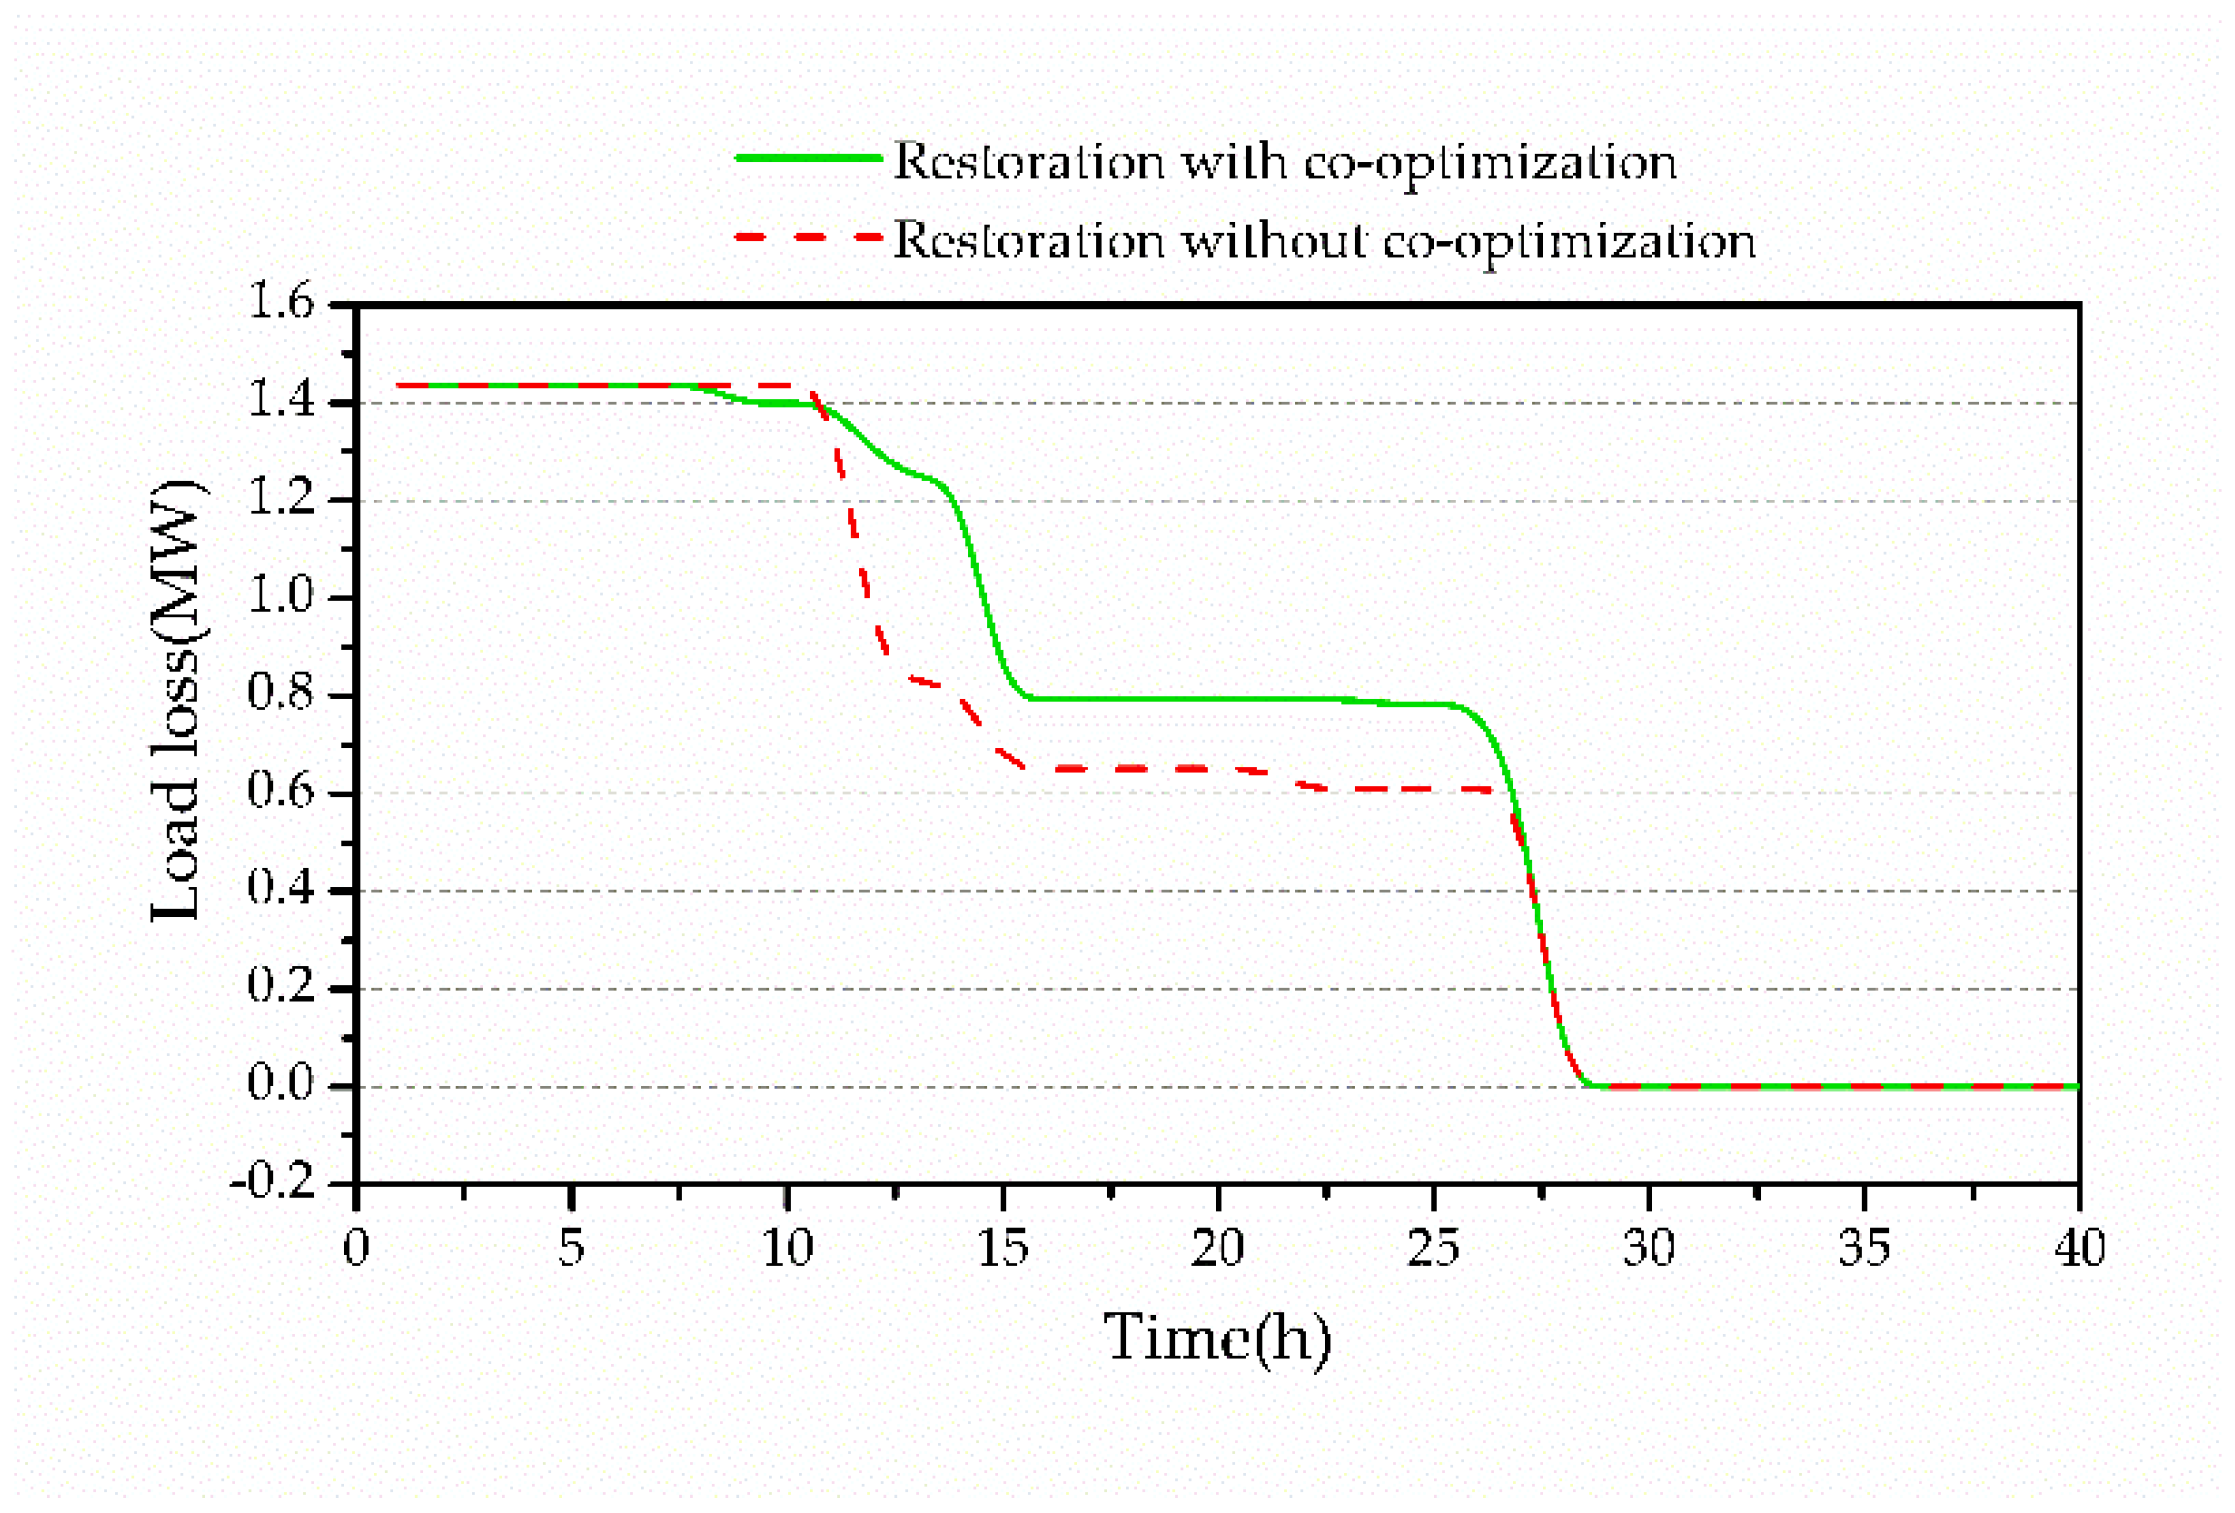
5.1. The Advantage Analysis of the Proposed Co-Optimization Model
5.2. The Effect Analysis of the Acceleration Algorithm
5.3. The Impacts of Damage Repair Resources Allocation and Adequacy on Restoration
5.4. The Impacts of Weight Factors in the Objective Function on Restoration
6. Conclusions
- The proposed model can support the formulation of reasonable damage repair scheme, the plan of unit output and the decisions of optimal transmission switching, to minimize the power outage loss with lower cost of damage repair and power system operation.
- Lagrange relaxation decomposes the original complex model into two small-scale sub problems and the acceleration strategy is implemented to realize the fast solution. For utilities, the work of maintenance department and system dispatching department could be separated and Lagrange multipliers help to coordinate their work. Consequently, the work efficiency will be improved.
- The adequacy and allocation of damage repair resource can greatly influence the restoration effect and the load loss level. The sufficient resource reserve of repair centers will significantly decrease loss in economy due to power outage.
- To reduce the power outage loss and realize the enhancement of post-disaster power system resilience, it is significant to highlight the fast restoration of outage loads according to their importance.
Author Contributions
Funding
Acknowledgments
Conflicts of Interest
Nomenclature
| Indices and sets | |
| g | Index for generation units |
| i/j | Index for buses |
| x/y/z | Index for damaged components |
| c | Index for repair team |
| t | Index for time |
| b | Index for repair center (starting point) |
| d | Index for repair center (return point) |
| DC | Set of damaged components |
| DB | Set of damaged buses |
| DL | Set of damaged transmission lines |
| Parameters | |
| α | Weight factor |
| ag | Generation cost quadric coefficient of unit g |
| bg | Generation cost linear coefficient of unit g |
| cg | Generation cost constant of unit g |
| lpi,t/lqi,t | Active/reactive demand at bus i and time t under normal conditions |
| eli | Economic loss of lost load at bus i per hour |
| Gi/Bi | Conductance/susceptance from bus i to the ground |
| Vimax/Vimin | Upper/lower limit of voltage magnitude at bus i |
| θimax/θimin | Upper/lower limit of voltage angle at bus i |
| Pgmax/Pgmin | Upper/lower limit of active power generation of unit g |
| Qgmax/Qgmin | Upper/lower limit of reactive power generation of unit g |
| Pgstart | Power required by unit g for start-up |
| Rg | Ramp speed limit of unit g |
| tsg | Start-up time of unit g |
| tdg | The interval of unit g with positive start-up power requirement and zero ramping rate |
| Sij | Upper limit of apparent power flow on line i→j |
| Iijmax | Upper limit of current on line i→j |
| rij/xij | Resistance/reactance of line i→j |
| dx,y | Distance between damaged component x and y |
| Vc | Average driving speed of team c |
| Capc | Resource capacity of team c |
| RESx | Repair resources required to fix damaged component x |
| resd | Resource amount of repair center |
| RTx,c | Repair time required to fix damaged component x |
| Numc | Number of repair teams |
| M | Value of big M |
| T | Time horizon |
| ωcrew | Wages of a repair team per hour |
| ωroad | Driving cost of a repair team per km |
| Variables | |
| PGg,t/QGg,t | Active/reactive power generation of unit g at time t |
| PLij,t/QLij,t | Active/reactive power flow on line i→j |
| hij,t | Square of current magnitude on line i→j at time t |
| LPi,t/LQi,t | Actual active/reactive load at bus i and time t |
| Vi,t | Voltage magnitude at bus i and time t |
| θi,t | Voltage phase at bus i and time t |
| ALSij,t | Binary variable equals to 0 if line i→j is damaged or under repair and 1 else at time t |
| LSij,t | Binary variable equals to 0 if line i→j is removed from the system and 1 else at time t |
| BSi,t | Binary variable equals to 0 if bus i is damaged or under repair and 1 else at time t |
| GSg,t | Binary variable equals to 1 if unit g is committed and 0 else at time t |
| SSg,t | Binary variable equals to 1 if unit g is started up at time t and 0 else |
| ATx,c | Arrival time of team c at damaged component x |
| FTx,t | Binary variable equals to 1 if damaged component x is repaired at time t and 0 else |
| Mx,y,c | Binary variable equals to 1 if team c moves from damaged component x to y and 0 else |
| Nx,c | Binary variable equals to 1 if damaged component x is repaired by team c and 0 else |
| Sx,t | Binary variable equals to 0 if damaged component x is damaged or under repair and 1 else at time t |
Appendix A

| Numbers of Damaged Components | Bus Number | Line Number | |||||||||
|---|---|---|---|---|---|---|---|---|---|---|---|
| 3 | 14 | 52 | 53 | 14 | 17 | 29 | 32 | 40 | 70 | ||
| Bus number | 3 | 0 | 345 | 840 | 870 | 375 | 450 | 60 | 120 | 735 | 975 |
| 14 | 345 | 0 | 915 | 900 | 45 | 135 | 225 | 195 | 1065 | 840 | |
| 52 | 840 | 915 | 0 | 90 | 885 | 1050 | 780 | 660 | 90 | 180 | |
| 53 | 870 | 900 | 90 | 0 | 855 | 1080 | 750 | 630 | 180 | 90 | |
| Line number | 14 | 375 | 45 | 885 | 855 | 0 | 165 | 330 | 285 | 900 | 930 |
| 17 | 450 | 135 | 1050 | 1080 | 165 | 0 | 375 | 345 | 1050 | 1065 | |
| 29 | 60 | 225 | 780 | 750 | 330 | 375 | 0 | 90 | 750 | 870 | |
| 32 | 120 | 195 | 660 | 630 | 285 | 345 | 90 | 0 | 705 | 690 | |
| 40 | 735 | 1065 | 90 | 180 | 900 | 1050 | 750 | 705 | 0 | 270 | |
| 70 | 975 | 840 | 180 | 90 | 930 | 1065 | 870 | 690 | 270 | 0 | |
| Repair Center | Bus Number | Line Number | ||||||||
|---|---|---|---|---|---|---|---|---|---|---|
| 3 | 14 | 52 | 53 | 14 | 17 | 29 | 32 | 40 | 70 | |
| 1 | 780 | 885 | 90 | 82.5 | 810 | 1020 | 832.5 | 555 | 150 | 120 |
| 2 | 120 | 315 | 735 | 720 | 450 | 540 | 105 | 180 | 780 | 780 |
| 3 | 465 | 45 | 840 | 825 | 120 | 195 | 360 | 307.5 | 795 | 950 |
| Damage Repair Requirements | Bus Number | Line Number | ||||||||
|---|---|---|---|---|---|---|---|---|---|---|
| 3 | 14 | 52 | 53 | 14 | 17 | 29 | 32 | 40 | 70 | |
| Damage repair resource | 30 | 28 | 34 | 32 | 8 | 11 | 9 | 14 | 6 | 7 |
| Damage repair time (h) | 12 | 13 | 12 | 14 | 8 | 7 | 9 | 10 | 6 | 8 |
| Repair Center | Resource (Capability of Each Team) |
|---|---|
| 1 | 85 (45; 45) |
| 2 | 60 (45; 45) |
| 3 | 60 (45; 45) |
| Load Bus Number | Economic Loss of Lost Load ($/kWh) |
|---|---|
| 1 | 0.110 |
| 2 | 0.110 |
| 3 | 0.110 |
| 4 | 3.816 |
| 5 | 0.110 |
| 6 | 10.000 |
| 8 | 0.110 |
| 9 | 0.110 |
| 10 | 0.110 |
| 12 | 0.110 |
| 13 | 0.110 |
| 14 | 0.110 |
| 15 | 0.110 |
| 16 | 6.979 |
| 17 | 0.110 |
| 18 | 0.110 |
| 19 | 0.110 |
| 20 | 3.816 |
| 23 | 0.110 |
| 25 | 10.000 |
| 27 | 3.816 |
| 28 | 0.110 |
| 29 | 0.110 |
| 30 | 0.110 |
| 31 | 0.110 |
| 32 | 6.979 |
| 33 | 0.110 |
| 35 | 0.110 |
| 38 | 0.110 |
| 41 | 6.979 |
| 42 | 0.110 |
| 43 | 0.110 |
| 44 | 0.110 |
| 47 | 0.110 |
| 49 | 0.110 |
| 50 | 0.110 |
| 51 | 0.110 |
| 52 | 3.816 |
| 53 | 0.110 |
| 54 | 0.110 |
| 55 | 3.816 |
| 56 | 0.110 |
| 57 | 0.110 |
References
- Shao, D.; Yin, X.; Chen, Q.; Tong, G.; Zhang, Z.; Zheng, Y.; Hou, H. Affects of Icing and Snow Disaster Occurred in 2008 on Power Grids in South China. Power Syst. Technol. 2009, 33, 38–43. [Google Scholar]
- Bie, Z.; Lin, Y.; Li, G.; Li, F. Battling the Extreme: A Study on the Power System Resilience. Proc. IEEE 2017, 105, 1253–1266. [Google Scholar] [CrossRef]
- Smith, R. US Risks National Blackout from Small Scale Attack. Wall Street Journal. 12 March 2014. Available online: https://www.studentnewsdaily.com/daily-news-article/u-s-risks-national-blackout-from-small-scale-attack/ (accessed on 12 March 2014).
- Panteli, M.; Trakas, D.N.; Mancarella, P.; Hatziargyriou, N.D. Power Systems Resilience Assessment: Hardening and Smart Operational Enhancement Strategies. Proc. IEEE 2017, 105, 1202–1213. [Google Scholar] [CrossRef]
- Zhang, H.; Yuan, H.; Li, G. Quantitative Resilience Assessment under a Tri-Stage Framework for Power Systems. Energies 2018, 11, 1427. [Google Scholar] [CrossRef]
- Yuan, W.; Wang, J.; Qiu, F.; Chen, C.; Kang, C.; Zeng, B. Robust Optimization-Based Resilient Distribution Network Planning Against Natural Disasters. IEEE Trans. Smart Grid 2016, 7, 2817–2826. [Google Scholar] [CrossRef]
- Shao, C.; Shahidehpour, M.; Wang, X.; Wang, X.; Wang, B. Integrated Planning of Electricity and Natural Gas Transportation Systems for Enhancing the Power Grid Resilience. IEEE Trans. Power Syst. 2017, 32, 4418–4429. [Google Scholar] [CrossRef]
- Arab, A.; Khodaei, A.; Khator, S.K.; Ding, K.; Emesih, V.A.; Han, Z. Stochastic pre-hurricane restoration planning for electric power systems infrastructure. IEEE Trans. Smart Grid 2015, 6, 1046–1054. [Google Scholar] [CrossRef]
- Lin, Y.; Bie, Z. Tri-level optimal hardening plan for a resilient distribution system considering reconfiguration and DG islanding. Appl. Energy 2018, 201, 1266–1279. [Google Scholar] [CrossRef]
- Tan, Y.; Das, A.K.; Arabshahi, P.; Kirschen, K.S. Distribution Systems Hardening against Natural Disasters. IEEE Trans. Power Syst. 2017, 99. [Google Scholar] [CrossRef]
- Zhang, B.; Dehghanian, P.; Kezunovic, M. Optimal Allocation of PV Generation and Battery Storage for Enhanced Resilience. IEEE Trans. Smart Grid 2017, 99. [Google Scholar] [CrossRef]
- Gao, H.; Chen, Y.; Mei, S.; Huang, S.; Xu, Y. Resilience-oriented pre-hurricane resource allocation in distribution systems considering electric buses. Proc. IEEE 2017, 105, 1214–1233. [Google Scholar] [CrossRef]
- Wang, Z.; Wang, J. Self-Healing Resilient Distribution Systems Based on Sectionalization into Microgrids. IEEE Trans. Power Syst. 2015, 30, 3139–3149. [Google Scholar] [CrossRef]
- Panteli, M.; Trakas, D.N.; Mancarella, P.; Hatziargyriou, N.D. Boosting the power grid resilience to extreme weather events using defensive islanding. IEEE Trans. Smart Grid 2017, 7, 2913–2922. [Google Scholar] [CrossRef]
- Pinto, R.T.; Aragüés-Peñalba, M.; Gomis-Bellmunt, O.; Sumper, A. Optimal operation of dc networks to support power system outage management. IEEE Trans. Smart Grid 2016, 7, 2953–2961. [Google Scholar] [CrossRef]
- Ding, T.; Lin, Y.; Li, G.; Bie, Z. A new model for resilient distribution systems by microgrids formation. IEEE Trans. Power Syst. 2017, 7, 2953–2961. [Google Scholar] [CrossRef]
- Gao, H.; Chen, Y.; Xu, Y.; Liu, C.C. Resilience-oriented critical load restoration using microgrids in distribution systems. IEEE Trans. Smart Grid 2016, 7, 2837–2848. [Google Scholar] [CrossRef]
- Francesco, E.; Leccese, F. Risks analysis for already existent electric lifelines in case of seismic disaster. In Proceedings of the International Conference on Environment and Electrical Engineering, Venice, Italy, 18–25 May 2012. [Google Scholar]
- Seneviratne, D.; Ciani, L.; Catelani, M. Smart maintenance and inspection of linear assets: An Industry 4.0 approach. ACTA IMEKO 2018, 7, 50–56. [Google Scholar] [CrossRef]
- Zhao, Y.; Lin, Z.; Ding, Y.; Liu, Y.; Sun, L.; Yan, Y. A Model Predictive Control Based Generator Start-Up Optimization Strategy for Restoration with Microgrids as Black-Start Resources. IEEE Trans. Power Syst. 2018, 99. [Google Scholar] [CrossRef]
- Sun, L.; Lin, Z.; Xu, Y.; Wen, F.; Zhang, C.; Xue, Y. Optimal skeleton-network restoration considering generator start-up sequence and load pickup. IEEE Trans. Smart Grid 2018, 99. [Google Scholar] [CrossRef]
- Patsakis, G.; Rajan, D.; Aravena, I.; Rios, J.; Oren, S. Optimal black start allocation for power system restoration. IEEE Trans. Smart Grid 2018, 99. [Google Scholar] [CrossRef]
- Abbasi, S.; Barati, M.; Lim, G.J. A parallel sectionalized restoration scheme for resilient smart grid systems. IEEE Trans. Smart Grid 2017. [Google Scholar] [CrossRef]
- Liu, W.; Lin, Z.; Wen, F.; Chung, C.Y.; Xue, Y.; Ledwich, G. Sectionalizing strategies for minimizing outage durations of critical loads in parallel power system restoration with bi-level programming. Int. J. Electr. Power. 2015, 71, 327–334. [Google Scholar] [CrossRef]
- Zhao, J.; Wang, H.; Liu, Y.; Azizipanah-Abarghooee, R.; Terzija, V. Utility-Oriented On-Line Load Restoration Considering Wind Power Penetration. IEEE Trans. Sustain. Energy 2018, 99. [Google Scholar] [CrossRef]
- Wang, C.; Vittal, V.; Sun, K. Obdd-based sectionalizing strategies for parallel power system restoration. IEEE Trans. Power Syst. 2011, 26, 1426–1433. [Google Scholar] [CrossRef]
- Qin, Z.; Hou, Y.; Liu, C.C.; Liu, S. Coordinating generation and load pickup during load restoration with discrete load increments and reserve constraints. IET Gener. Transm. Distrib. 2015, 9, 2437–2446. [Google Scholar] [CrossRef]
- Hentenryck, P.V.; Coffrin, C.; Bent, R. Vehicle routing for the last mile of power system restoration. In Proceedings of the 17th Power Systems Computation Conference (PSCC), Stockholm, Sweden, 22–26 August 2011. [Google Scholar]
- Simon, B.; Coffrin, C.; Hentenryck, P.V. Randomized adaptive vehicle decomposition for large-scale power restoration. In Proceedings of the International Conference on Integration of Ai and or Techniques in Constraint Programming for Combinatorial Optimization Problems, Nantes, France, 28 May–1 June 2012. [Google Scholar]
- Arif, A.; Wang, Z.; Wang, J.; Chen, C. Power distribution system outage management with co-optimization of repairs, reconfiguration, and DG dispatch. IEEE Trans. Smart Grid 2017. [Google Scholar] [CrossRef]
- Wood, A.J.; Wollenberg, B.F. Power Generation, Operation, and Control, 2nd ed.; Wiley, Inc.: New York, NY, USA, 1996; ISBN 978-0-471-58699-9. [Google Scholar]
- Bai, Y.; Zhong, H.; Xia, Q.; Wang, Y. A conic programming approach to optimal transmission switching considering reactive power and voltage security. In Proceedings of the Power & Energy Society General Meeting, Denver, CO, USA, 26–30 July 2015. [Google Scholar]
- Hou, Y.; Liu, C.C.; Sun, K.; Zhang, P.; Liu, S.; Mizumura, D. Computation of milestones for decision support during system restoration. IEEE Trans. Power Syst. 2011, 26, 1399–1409. [Google Scholar] [CrossRef]
- Zhao, X.; Luh, P.B.; Wang, J. Surrogate gradient algorithm for lagrangian relaxation. J. Optim. Theory Appl. 1999, 100, 699–712. [Google Scholar] [CrossRef]
- Power System Test Case Archive; Department of Electrical Engeneering, University of Washington: Seattle, WA, USA, 2007; Available online: https://www2.ee.washington.edu/research/pstca/pf57/pg_tca57bus.htm (accessed on 7 August 2018).
- London Economics International LLC. Estimating the Value of Lost Load; Electricity Reliability Council of Texas Inc., London Economics International (LLC): Boston, MA, USA, 2013. [Google Scholar]
- Arab, A.; Khodaei, A.; Khator, S.K.; Han, Z. Electric Power Grid Restoration Considering Disaster Economics. IEEE Access 2016, 4, 639–649. [Google Scholar] [CrossRef]


| Repair Center | Bus Number | Line Number (Bus i–Bus j) | ||||||||
|---|---|---|---|---|---|---|---|---|---|---|
| 3 | 14 | 52 | 53 | 14(13–15) | 17(1–17) | 29(18–19) | 32(21–22) | 40(28–29) | 70(54–55) | |
| 1 | 0 | 0 | 1 | 1 | 0 | 0 | 0 | 0 | 1 | 1 |
| 2 | 1 | 0 | 0 | 0 | 0 | 0 | 1 | 1 | 0 | 0 |
| 3 | 0 | 1 | 0 | 0 | 1 | 1 | 0 | 0 | 0 | 0 |
| Damaged Component | Bus Number | Line Number | ||||||||||
|---|---|---|---|---|---|---|---|---|---|---|---|---|
| 3 | 14 | 52 | 53 | 14 | 17 | 29 | 32 | 40 | 70 | |||
| Arrival moment (h) | Repair center 1 | Team 1 | - | - | 1.8 | - | - | - | - | - | - | 15.6 |
| Team 2 | - | - | - | 12.2 | - | - | - | - | 2.4 | - | ||
| Repair center 2 | Team 1 | - | - | - | - | - | - | 2.1 | 12.9 | - | - | |
| Team 2 | 14.0 | - | - | - | - | - | - | - | - | - | ||
| Repair center 3 | Team 1 | - | - | - | - | 14.2 | 3.9 | - | - | - | - | |
| Team 2 | - | 0.9 | - | - | - | - | - | - | - | - | ||
| Damaged Component | Bus Number | Line Number | ||||||||||
|---|---|---|---|---|---|---|---|---|---|---|---|---|
| 3 | 14 | 52 | 53 | 14 | 17 | 29 | 32 | 40 | 70 | |||
| Arrival moment (h) | Repair center 1 | Team 1 | - | - | - | 12.2 | - | - | - | - | - | 2.4 |
| Team 2 | - | 1.8 | - | - | - | - | - | 15.6 | - | |||
| Repair center 2 | Team 1 | - | - | - | - | - | - | 2.1 | 12.9 | - | - | |
| Team 2 | 2.4 | - | - | - | - | - | - | - | - | - | ||
| Repair center 3 | Team 1 | - | - | - | - | 2.4 | 13.7 | - | - | - | - | |
| Team 2 | - | 0.9 | - | - | - | - | - | - | - | - | ||
| Economic Index | Restoration with Co-Optimization | Restoration without Co-Optimization |
|---|---|---|
| Damage repair expense ($1000) | 53.32 | 47.90 |
| System operation cost ($1000) | 1741.14 | 1750.21 |
| Power outage loss ($1000) | 803.38 | 967.55 |
| Model | The Original Model | The MISOCP Model | The MISOCP Model+ the Acceleration Algorithm |
|---|---|---|---|
| Computation time | Did not converge | 22.5 h | 4.6 h |
| The objective function value | - | 9802.31 | 9828.24 |
| Economic Index | The Original Resource Allocation Case | The Changed Resource Allocation Case |
|---|---|---|
| Damage repair expense ($1000) | 53.32 | 57.61 |
| Power outage loss ($1000) | 803.38 | 865.62 |
| α1 | α2 | α3 | Power Outage Loss ($1000) | System Operation Cost ($1000) | Damage Repair Expense ($1000) |
|---|---|---|---|---|---|
| 1 | 1 | 10 | 803.38 | 1741.14 | 53.32 |
| 1 | 1 | 1 | 833.47 | 1695.92 | 49.25 |
| 10 | 1 | 1 | 1930.08 | 1361.93 | 54.79 |
| 1 | 10 | 1 | 883.23 | 1696.17 | 51.20 |
© 2018 by the authors. Licensee MDPI, Basel, Switzerland. This article is an open access article distributed under the terms and conditions of the Creative Commons Attribution (CC BY) license (http://creativecommons.org/licenses/by/4.0/).
Share and Cite
Zhang, H.; Li, G.; Yuan, H. Collaborative Optimization of Post-Disaster Damage Repair and Power System Operation. Energies 2018, 11, 2611. https://doi.org/10.3390/en11102611
Zhang H, Li G, Yuan H. Collaborative Optimization of Post-Disaster Damage Repair and Power System Operation. Energies. 2018; 11(10):2611. https://doi.org/10.3390/en11102611
Chicago/Turabian StyleZhang, Han, Gengfeng Li, and Hanjie Yuan. 2018. "Collaborative Optimization of Post-Disaster Damage Repair and Power System Operation" Energies 11, no. 10: 2611. https://doi.org/10.3390/en11102611
APA StyleZhang, H., Li, G., & Yuan, H. (2018). Collaborative Optimization of Post-Disaster Damage Repair and Power System Operation. Energies, 11(10), 2611. https://doi.org/10.3390/en11102611