Article

Real-World Measurement of Hybrid Buses’ Fuel Consumption and Pollutant Emissions in a Metropolitan Urban Road Network

by
Christos Keramydas
1,
Georgios Papadopoulos
1,
Leonidas Ntziachristos
2,*,
Ting-Shek Lo
3,
Kwok-Lam Ng
3,
Hok-Lai Anson Wong
3 and
Carol Ka-Lok Wong
3
1
Emisia S.A., 21 Antoni Tritsi str., P.O. Box 8138, GR 57001 Thessaloniki, Greece
2
Department of Mechanical Engineering, Aristotle University of Thessaloniki, P.O. Box 483, GR 54124 Thessaloniki, Greece
3
Environmental Protection Department, Hong Kong SAR Government, Hong Kong
*
Author to whom correspondence should be addressed.
Energies 2018, 11(10), 2569; https://doi.org/10.3390/en11102569
Submission received: 5 September 2018 / Revised: 21 September 2018 / Accepted: 24 September 2018 / Published: 26 September 2018
(This article belongs to the Section A: Sustainable Energy)

Abstract

:
This study investigates pollutant emissions and fuel consumption of six Euro VI hybrid-diesel public transport buses operating on different scheduled routes in a metropolitan urban road network. Portable emission measurement systems (PEMS) are used in measurements and results are compared to those obtained from a paired number of Euro V conventional buses of the same body type used as control over the same routes. The selected routes vary from urban to highway driving and the experimentation was conducted over the first half of 2015. The available emissions data correspond to a wide range of driving, operating, and ambient conditions. Fuel consumption, distance- and energy-based emission levels are derived and presented in a comparative manner. The effect of different factors, including speed, ambient temperature, and road grade on fuel consumption and emissions performance is investigated. Mean fuel consumption of hybrid buses was found 6.1% lower than conventional ones, from 20% lower up to 16% higher, over six routes tested in total. The mean route difference between the two technologies was not statistically significant. Air conditioning decreased consumption benefits of the hybrid buses. Decrease of the mean route speed from 15 km h−1 tο 8 km h−1 increased the hybrid buses consumption by 63%. Nitrogen oxides (NOx) emissions of the Euro VI hybrid buses were 93 ± 5% lower than conventional Euro V ones. Nitrous oxide (N2O) emissions from hybrid Euro VI buses made up 5.9% of total greenhouse gas emissions and largely offset carbon dioxide (CO2) benefits. The results suggest that hybrid urban buses need to be assessed under realistic operation and environmental conditions to assess their true environmental and fuel consumption benefits.

Graphical Abstract

1. Introduction

Control of the environmental impacts of road transport is pursued by local authorities of metropolitan areas around the world to ensure the quality of urban living [1], protect public health [2] and mitigate associated costs [3]. For public authorities, the cost of transport comprises both externalities, i.e., congestion, accidents, environmental and health related costs [4,5], but also direct costs for purchasing and operating the vehicle fleet [6] and maintaining road infrastructure [7]. Fuel consumption is the main direct cost element of urban transit fleet operation [8]. Options that can reduce direct and external costs of road transport are therefore of importance [9,10].
Hybrid urban buses are considered as one such option, with the main reduction in costs expected from a decreased fuel consumption (FC) over conventional buses. Powertrain simulation results indicate that both parallel and series hybrid systems can offer fuel economy benefits up to 45% over conventional buses [11,12,13,14]. Results from experimental assessments vary. Merkisz and Pielecha [15] found that the FC of a hybrid-diesel bus was 15–18% lower than a corresponding conventional one, depending on traffic conditions in the city of Poznan, Poland. Hallmark et al. [8] reported an average 11.8% higher fuel economy of three hybrid buses than two conventional ones in Iowa, USA. Semercioglu et al. [16] observed a 30% fuel savings potential, after examining the results of one hybrid bus over a conventional one in Sakarya, Turkey. Guo et al. [17] also reported significant fuel benefits from two parallel hybrid buses over conventional ones, but the variability in driving conditions did not make possible to precisely quantify the improvement. Zhang et al. [18] analysed on-road emissions of 75 Euro II to Euro V transit buses in Beijing, China, including two Euro IV single deck hybrid-diesel buses. Hybrid-diesel buses were found to consume 29% less fuel compared to conventional ones. However, the authors also reported a 50% hybrid bus fuel consumption increase when average speed dropped from 25 km h−1 to 15 km h−1 and an offset of consumption benefits when the air conditioning was enabled. This last finding is very important as urban buses are mostly employed in routes of low speeds, and often—depending on the urban environment—with their air-condition (A/C) on; this has an impact on engine operation and emissions as has been observed in similar studies of urban buses in Europe [19,20]. These studies indicate that the FC benefit of hybrid buses strongly deviates in field operation than what powertrain simulation studies suggest. However, the reasons of the deviation as well as the impact of driving conditions on the relative consumption difference have not been made clear yet.
The hybrid powertrain leads to lower CO2 emissions particularly for low speed routes [21,22]. Investment in hybrid technology may therefore be pursued as an effective means to decrease the carbon footprint of transport in cities [23]. Hybrid powertrain technology is often also considered as a candidate to decrease air pollutants emissions [24]. Many cities around the world face problems in meeting their NO2 air quality targets [25], and new vehicle technologies are sought to reduce ambient NOx concentrations [26,27]. Andersson [28] reported more than 90% lower emissions from a hybrid Euro V bus over a conventional one in Brighton, UK. Zhang et al. [29] also found that the average NOx emission factor of two Euro IV diesel hybrid buses was 63% lower than conventional Euro IV, and also lower than Euro V conventional ones.
For vehicles certified according to the EU certification system, emission levels depend on the certification step, so called Euro standard, rather than on the powertrain technology. The latest Euro VI standard imposes the same emission limits both for conventional and hybrid powertrains and is achieved by a combination of exhaust gas recirculation (EGR) and selective catalytic reduction (SCR) aftertreatment [30]. Although the potential of EGR and SCR combination in decreasing NOx is theoretically sufficient to meet the most stringent diesel standards around the world [31], their actual calibration [32] and true efficiency [33] under real world conditions is a point of uncertainty and concern [34,35]. Real world NOx emission factors (EFs) for Euro VI vehicles are therefore required to reliably assess their environmental performance. As regards the operation of Euro V buses under urban conditions, there are studies reporting higher NOx levels than the respective regulatory limits. Zhang et al. [29] reported 5.6 g kWh−1 for two single-deck Euro V SCR-equipped diesel buses operating in the area of Beijing. The Netherlands Organisation for Applied Scientific Research (TNO) (Nederlandse Organisatie voor Toegepast Natuurwetenschappelijk Onderzoek, Hague, The Netherlands) [36] reported a range of 3 to 7 g kWh−1 for 40 buses operating under a mix of conditions and also including some, similar to Euro V technology, EEV (enhanced environmentally friendly vehicle) ones. NOx levels of a single EEV bus in Poznan, Poland was equal to 6.1 g kWh−1, in the study of Merkisz and Rymaniak [37].
The present study provides fuel consumption rates from a sample of six latest-technology Euro VI hybrid double-deck buses under real-world operation conditions over a metropolitan urban road network. The tests are conducted on actual scheduled routes vis-à-vis corresponding conventional Euro V buses. The intention is to investigate the effectiveness of hybrid technology in reducing fuel consumption in actual operation and also in comparison to their conventional counterparts. This pairwise comparison involves the highest number of vehicles in similar studies and is the only one comprising latest technology (Euro VI) hybrid vehicles. The particular study design allows to limit any bias potentially caused by variance in driving and operational conditions, as vehicles of different powertrain technologies are tested over the exact driving routes.
Based on the large number of measurements conducted, the study also delivers representative field EFs for Euro VI buses and an assessment of the environmental benefits these may offer. Such fuel consumption and EF information is necessary to municipal authorities and bus service operators to estimate the environmental impacts and cost implications when investing in new powertrain and emission control technologies.

2. Methods

2.1. Test Vehicles

The vehicle sample employed in the experimentation includes six Euro V diesel-fueled conventional (non-hybrid) and six Euro VI diesel-fueled hybrid double-deck buses. Bus operators operating older buses, e.g., of Euro V standard, might wish to know the environmental benefits of moving to the latest Euro VI standard. This is expected to lead to lower emissions for all regulated pollutants (carbon monoxide (CO), hydrocarbons (HC), NOx, particulate matter (PM)). In addition, in this study we investigate the potential benefits in FC when hybrid buses are introduced. The hybrid technology is not per se expected to improve regulated pollutants; their level is defined by compliance to specific Euro standards rather than power train configuration. A typical Euro VI trial diesel-hybrid bus, equipped with exhaust measurement devices during field testing, is presented in Figure 1.
The buses are regular full-service vehicles operated by two major public transportation service providers in Hong Kong (HK) and have a total capacity of 117 passengers. The manufacturer of the buses is Alexander Dennis (Folkerk, UK) and the models are Enviro 500 (conventional) and Enviro 500H (hybrid); the latter operates under the BAE HDS200 HybriDrive System, whereas all internal combustion engines are manufactured by Cummins (Columbus, IN, USA). The engine size of the hybrid buses is 6.7 L and is smaller than the size of the respective conventional ones (8.9 L). The engine rated power is 204 kW and 243 kW for the hybrid and conventional buses, respectively. Odometer values varied from 15,858 to 92,143 km and the test age of the buses was roughly the same, on average being lower than one year old. The conventional buses are equipped with an SCR aftertreatment device, whereas hybrid buses are additionally equipped with a diesel particulate filter (DPF) and EGR. The average tare weight of the hybrid buses is by 2% lower than the conventional ones, however, Gross Vehicle Weight (GVW) is almost identical between the two vehicle types. The diesel fuel used during testing is commercially available with an average density of 0.838 kg L−1 at 15 °C (sulphur: 7.1 mg kg−1 fuel; cetane number of not less than 51, as determined in accordance to EN ISO 5165:1998 [38]; viscosity at 40 °C of not lower than 2.00 mm2 s−1 and not higher than 4.50 mm2 s−1, as determined in accordance to EN ISO 3104:1996 [39]); the fuels that were used in the trials conformed to the respective HK “Air Pollution Control (Motor Vehicle Fuel) Regulation” [40]. Table 1 provides an overview of the test vehicle specifications.

2.2. Equipment, Instruments, Measurements and Data Processing

Several signals were recorded during on-road measurements, including the date/time of the test, global positioning system (GPS) data (position and altitude), on-board diagnostics (OBD) and engine management data (e.g., speed at the wheels, exhaust temperature, exhaust flow rate, engine speed), and gaseous and particulate pollutant concentrations. A commercially available portable emission measurement system (PEMS) was used (SEMTECH-DS, Sensors, Inc., Saline, MI, USA) for the measurement of CO, CO2, nitrogen monoxide (NO), nitrogen dioxide (NO2), and HC, and an Fourier Transform InfraRed spectrometer (FTIR, A&D Technology, Ann Arbor, MI, USA) was employed for the measurement of ammonia (NH3) and N2O. Exhaust gas flowrate was measured in real time by a SEMTECH EFM-2 or EFM-HS (Sensors, Inc., Saline, MI, USA) exhaust flowmeter. The PEMS testing complied with the specifications of ISO 16183 [41], US EPA [42] and the European Commission [43] in terms of instrument calibration and verification. The PEMS instruments themselves along with the rest of the measurement equipment were installed inside each bus and were powered by two 3 kW portable generators. Zero gases were used to set PEMS zero level at the beginning and end of each route (practically every hour), audit every three hours, and span twice a day (before/after testing), at concentrations comparable to measured pollutants levels. All data were subject to the necessary time-alignment procedures, whereas standard corrections were additionally applied to emissions data (e.g., analyser drift, dry-to-wet, NOx humidity effect) according to specifications [42,43]. Speed data corrections were based on a procedure developed by HK EPD, where speedometer data are calibrated by speed obtained by GPS. Invalid and non-realistic test data were filtered out based on a set of quality criteria defined.

2.3. Design of Trials

The trials were conducted from January to June 2015 to cover a range of environmental conditions. In total, 140 h of field data were collected, corresponding to more than 10 h of measurements per bus. These were randomly distributed over different weekdays in the 10 a.m. to 7 p.m. time frame to cover a range of typical busy morning and early afternoon conditions as well as afternoon rush hours. Six original Hong-Kong city routes were selected to cover, to the extent possible, the variability of city road pattern and traffic conditions. A pair of buses of Euro V conventional and Euro VI hybrid powertrains were allocated to each route. Buses were driven by professional drivers in a so-called “bus trailing” mode. This means that an in-service bus driving on its original route was followed (trailed) by the instrumented bus under test, to exactly replicate real-world operation, including speed pattern, idling periods, duration of bus stops, etc. If the trailed bus was missed due to heavy traffic, the testing bus continued its fixed-route trip and the driver was asked to follow another bus on the route. In order to emulate the passenger load, the bus load during each trip was set to 50–60% of the respective maximum vehicle payload, by using ballast uniformly distributed on the bus floor; these load levels are considered to be representative of the typical passenger load of an urban bus in HK. Traffic was captured by a video camera mounted in front of the vehicle under test. Air conditioning was constantly on during testing.

2.4. Testing Routes

The original city bus routes selected for the trials were conducted in urban, a combination of urban and highway, or mostly in highway conditions. Table 2 provides an overview of the routes and Figure 2 presents their locations within the wider HK metropolitan area.
Each bus performed at least three round-trips, traveling from the starting terminus to the destination terminus and then back. The experimental setting ensured an adequate repeatability of measurements, as it has been observed in some studies that, under similar schedules, the excursions of urban buses in the same route are similar [19].

2.5. Calculation Methods

Instantaneous FC rates were calculated on the basis of real-time recordings of CO2 and carbon-containing pollutants (CO and HC), by properly modifying the respective standardized carbon balance methodology for diesel combustion [44], as illustrated in Equation (1) [24]:
  FR   =   0 . 861   ×   ER THC   +   0 . 429   ×   ER CO   +   0 . 273   ×   ER CO 2 W C  
In this equation, FR is the instantaneous FC rate (g s−1); ER THC (where THC stands for total hydrocarbons), ER CO , and ER CO 2 are the instantaneous emission rates (g s−1) of HC, CO, and CO2 pollutants, respectively, and WC is the carbon mass fraction of fuel (0.861 for diesel).
The distance-weighted EFs for each gaseous pollutant per vehicle were estimated according to Equation (2):
  EF i , k d = j = 1 R i t = 1 T i , j ER i , j , k , t j = 1 R i t = 1 T i , j d i , j , t  
where EF i , k d is the estimated emission factor (g km−1) for pollutant k and vehicle i ; R i is the total number of trips for vehicle i ; T i , j is the total duration (s) of the j th trip of vehicle i ; ER i , j , k , t is the instantaneous emission rate of pollutant k during the tth second of the j th trip travelled by vehicle i (g s−1); and d i , j , t is the distance travelled by vehicle i during the tth second of its j th trip (km s−1).
Similarly, the estimated fuel consumption (FC) for each vehicle was calculated according to Equation (3):
  FC i = 100 × j = 1 R i t = 1 T i , j FR i , j , t j = 1 R i t = 1 T i , j d i , j , t  
Calculation of specific power is useful in comparing the characteristics of different routes or driving similarities over different repetitions of the same route. The instantaneous power was calculated by Equation (4), which is detailed in Equation (5):
  P   =   P air   +   P rolres   +   P inertia   +   P gradient   +   P aux  
  P   =   1 2 ρ C d Av 3   +   τ 0 gmv   +   [ m tare ( 1   +   λ )   +   m load ] va + mgvsin ( b )   +   P aux
P is the total instantaneous power (W) required for vehicle traction and consumed by its auxiliaries, with the individual terms referring to different resistance factors, namely P air for aerodynamic, P rolres for tyre-road interaction, P inertia for inertial forces during accelerations, and P gradient for gravitational resistance over road gradients. P aux is the power consumed by auxiliaries, prominently by the A/C system. In Equation (5), ρ is the air density (kg m−3; calculated by the ideal gas law and using the measured instantaneous ambient temperature and atmospheric pressure as inputs), C d is the aerodynamic drag coefficient ( C d = 0.60), A is the frontal bus area ( A = 10.6 m2), v is the vehicle speed (m s−1), τ 0 is the rolling resistance coefficient ( τ 0 = 0.007 ), g is the gravitational acceleration ( g = 9.81 m s−2), m is the total vehicle mass comprising the tare mass of the vehicle ( m tare ) and the mass of and load ( m load ) . The term λ is stands for the equivalent inertia of rotational masses and is assumed to be 0.1 for conventional and 0.15 for hybrid buses, the latter to account for the additional inertia of electrical motor and couplings.   sin ( b ) is the road grade.
P aux can be significant in case that the A/C is constantly on to cool the passenger cabin for buses operating in hot and humid climates, like in Hong Kong [45]. The instantaneous power consumed by the compressor of mechanical systems used in conventional vehicles depends on the cooling load and the engine speed [46]. Hybrid buses may operate on full electrical systems with a different consumption profile. Characterizing the detailed profile of A/C use was not within the objectives of the study. Therefore, the A/C power consumption of the double-deck buses was estimated on the basis of the Heat Index (HI) measure [47], taking into account ambient temperature and ambient relative humidity, and a maximum A/C power consumption of 25 kW [48], as follows (Equation (6)):
  P aux ( HI ) = { 12 . 50   ( kW ) ,   0     HI     70 16 . 67   ( kW ) ,   70   <   HI     80 20 . 83   ( kW ) ,   80   <   HI     90 25 . 00   ( kW ) ,                         HI   >   90  
The energy-based emission factors (EF) for gaseous pollutants (per vehicle) were estimated by Equation (7).
  EF i , k e = j = 1 R i t = 1 T i , j ER i , j , k , t j = 1 R i t = 1 T i , j ( P i , j , t ) +  
where EF i , k e is the energy-based estimated emission factor (g kWh−1) for pollutant k and vehicle i ; P i , j , t is the power (kW) of vehicle i during the tth second of its jth trip; ( x ) + denotes the positive values of x , i.e., ( x ) +   =   x if x   >   0 and ( x ) +   =   0 otherwise.
An indication of the occurrence of positive road gradients over the route which require an engine power surplus to overcome driving resistances is given by the height gain (%) value. This was calculated as the sum of the instantaneous positive vertical altitude differences over the total distance travelled, according to Equation (8):
  HG i ( % )   =   100 × j = 1 R i t = 2 T i , j ( h i , j , t - h i , j , t - 1 ) + j = 1 R i t = 2 T i , j d i , j , t  
In this, h i , j , t is the altitude (m) that the vehicle i is driving at the tth second of its jth trip. This is different than the mean road gradient because the height gain only considers positive gradient road segments. Instantaneous altitude was estimated by map-based information, using GPS coordinates. The standard deviation of height on a specific route is calculated as the standard deviation of the instantaneous altitude values, all trips included, of the vehicle driving on the route.
The R programming language and the IBM® SPSS® Statistics 24 statistical software (International Business Machines Corp., Armonk, NY, USA) were employed in processing and analysing the data. The QGIS 2.18.9 geographic information system (GIS) application (QGIS.ORG, Grüt, Switzerland) was used in viewing and editing geospatial data.

3. Results and Discussion

3.1. Testing Conditions

The mean driving and operation conditions for each route are presented in Table 3. Mean values of environmental and operation parameters, i.e., speed, positive acceleration, specific power, engine speed, exhaust temperature and altitude, are similar between Euro V and Euro VI testing (p-values from 0.227 to 0.881). This is important to avoid a potential bias in the comparison introduced by traffic or ambient conditions. Statistically significant differences between Euro V and Euro VI tests per route are also marked on the table. Temperature varies in some of the pair-wise comparisons as the respective tests were executed on different days. This needs to be taken into account in the analysis. Mean speed, on the other hand, exhibited no statistically significant difference in any of the route pairs. This indicates that both hybrid and conventional vehicles were tested under similar traffic and congestion conditions in each route. The “start/stop” engine function remained active for the hybrid vehicles in routes #2 and #3, and this is reflected to the significant difference in mean engine speed of hybrids over conventional vehicles in the specific routes.

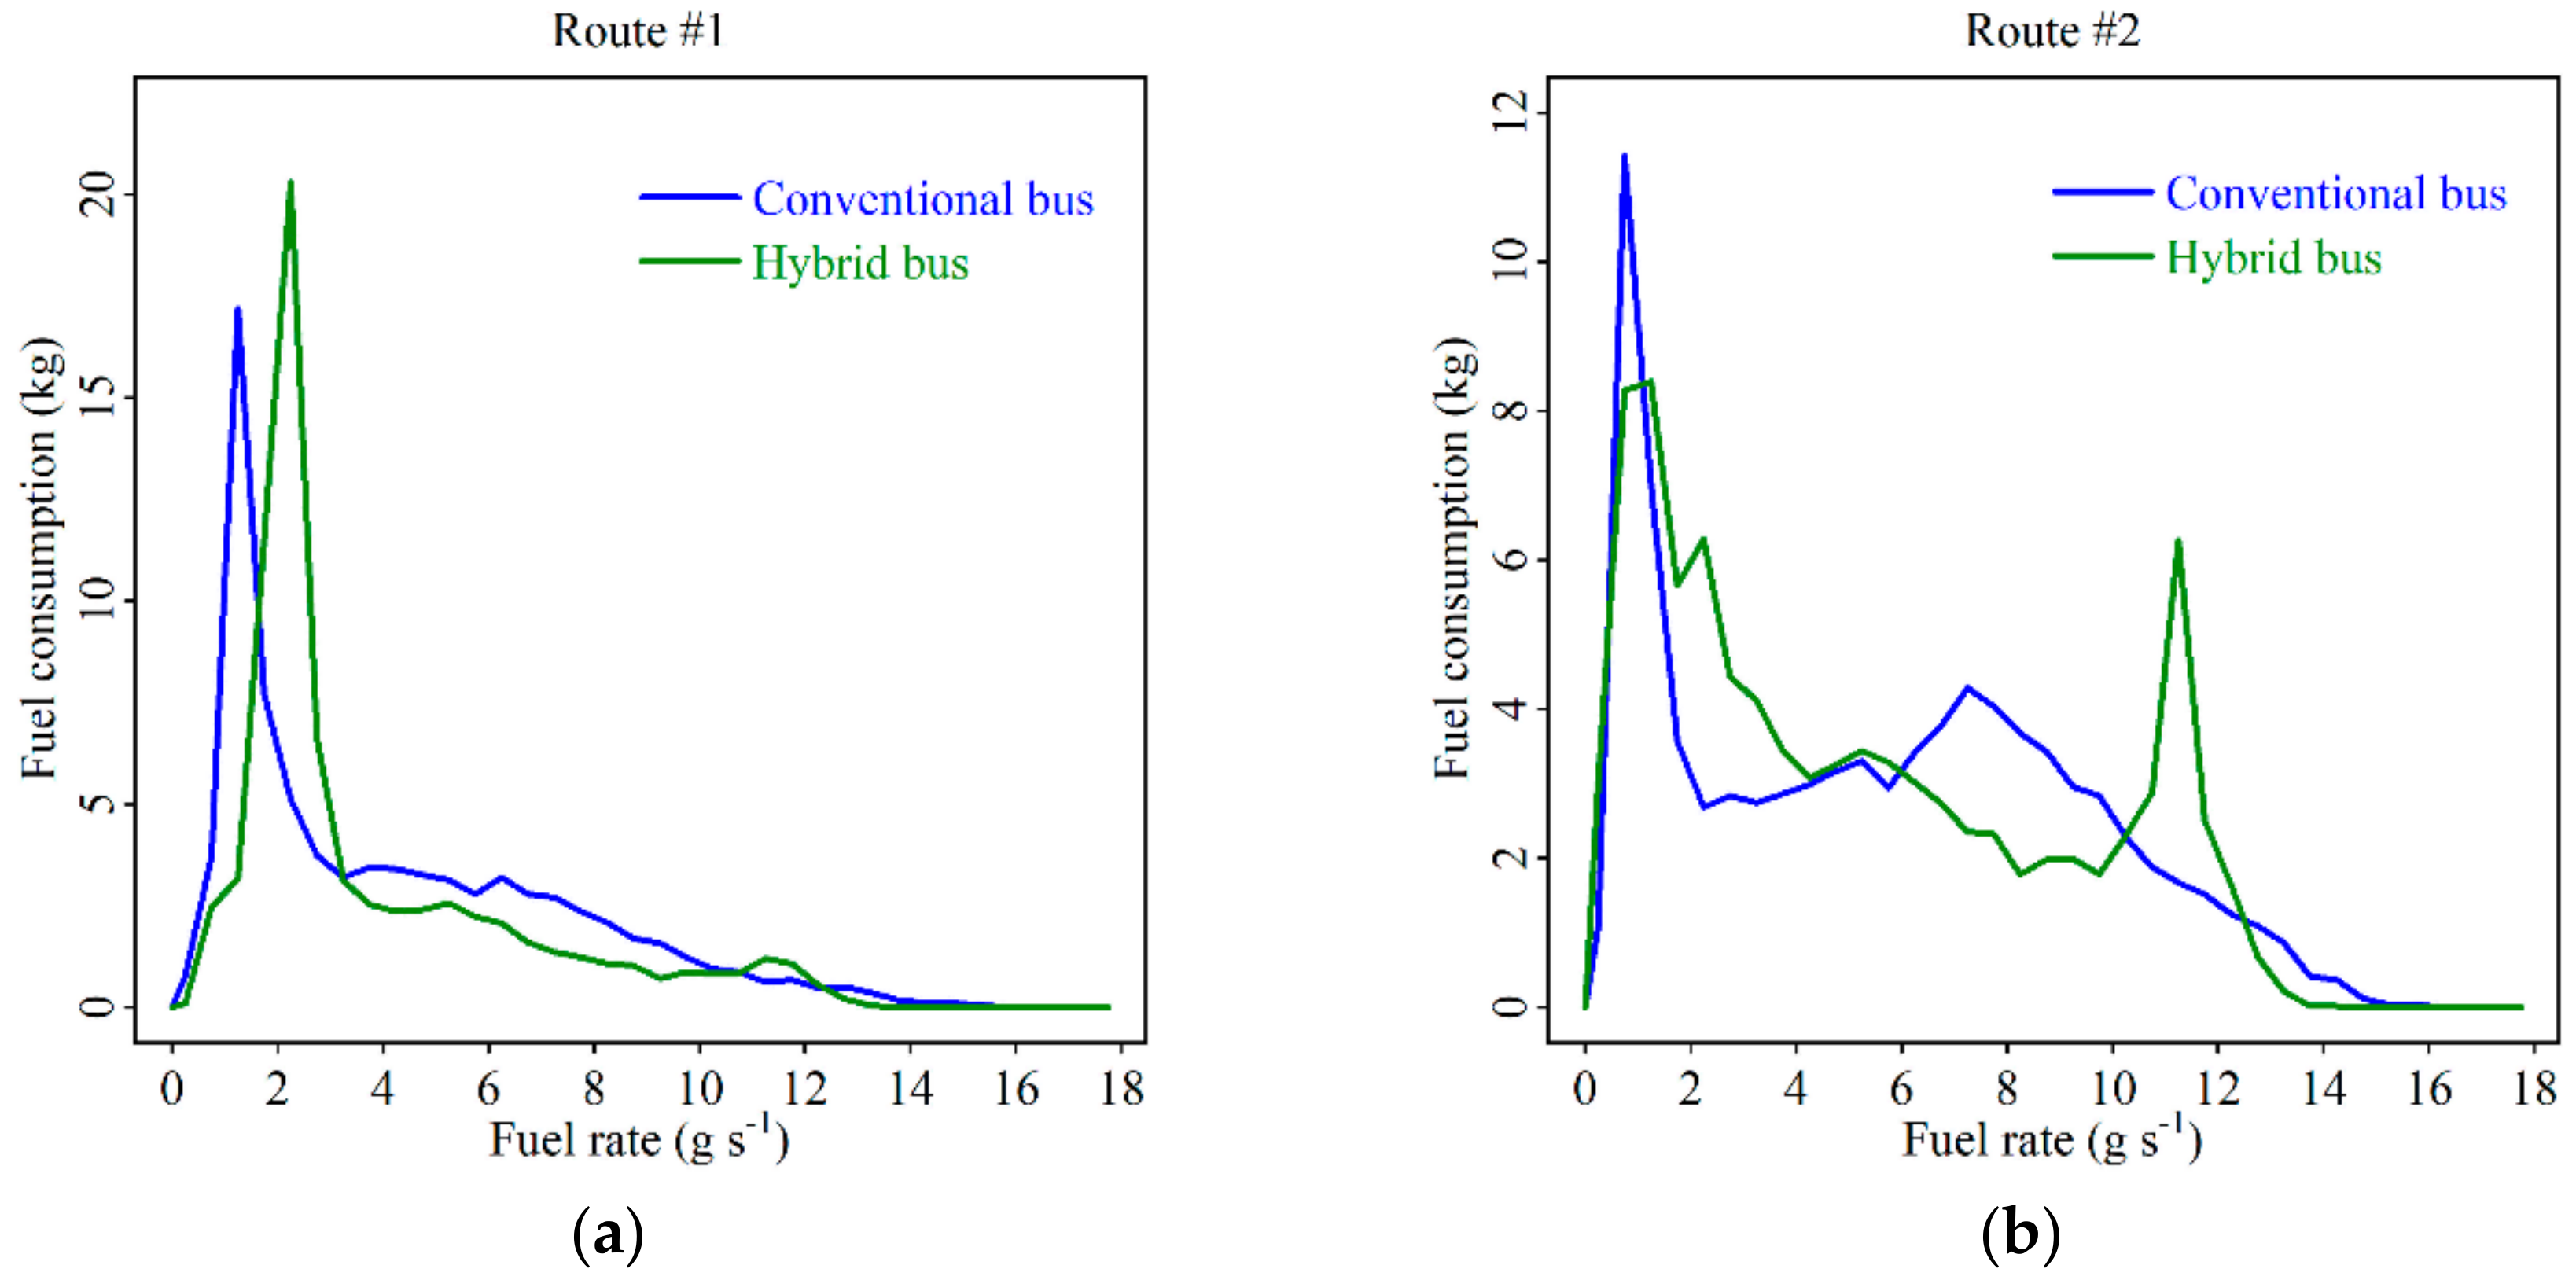
3.2. Fuel Consumption Levels

The mean distance-based FC and the respective relative difference between the two bus types are presented in Figure 3. The FC of the conventional buses ranged from 44.7 to 114 kg (100 km)−1 and the associated tailpipe CO2 emissions varied from 1.41 to 3.0 kg km−1. The FC of the hybrid buses fell within the range of 41.7 to 111 kg (100 km)−1 and the associated CO2 emissions varied from 1.31 to 3.49 kg km−1, depending on the route. The mean fuel consumption of the hybrid buses was by 6.1% ± 12.4% (mean ± standard deviation) lower than conventional ones. This varied from 20% lower up to 16% higher than the respective conventional buses, although one needs to note that the ambient temperature was 4.9 °C higher in the route where the hybrid bus consumption was higher. No statistical differences, neither for FC, nor for tailpipe CO2 emissions were detected between the two technologies, according to the outcome of the non-parametric Wilcoxon signed rank test (sig. = 0.345). The consumption level of double-deck hybrid buses in HK appears 45–65% higher than single-deck hybrid buses tested in Beijing [18].

3.3. Pollutant Emissions

Table 4 presents the estimated distance-based emission levels of NOx (NO and NO2), CO, THC, NH3, and N2O per bus and route, together with a qualitative characterization of routes based on their main characteristics and implementation of a simple statistical classification methodology (K-means cluster analysis). In general, Euro VI buses are lower in all pollutants but N2O; the statistical significance of these observations is confirmed by the respective dependent samples t-testing (sig. = 0.00 to 0.01 for NOx, NO, NO2, CO, and THC; sig. = 0.37 for NH3, sig. = 0.08 for N2O, i.e., the N2O difference is statistically significant at the α = 10% level). For NOx, which appears as the most relevant transport-related pollutant in terms of urban air quality [49], Euro VI levels are on average 93% ± 5% (mean ± standard deviation) lower than Euro V. Similar significant emission reductions attributed to hybrid technology were also observed for hybrid buses operating in urban areas in Brighton, UK [28] and Beijing, China [29]. In terms of individual NOx components, the difference is higher for NO (96%) than NO2 (78%). As a result, the NO2/NOx ratio is higher for Euro VI buses (0.48 ± 0.26) than Euro V ones (0.31 ± 0.04), but this difference is statistically non-significant. The respective coefficient of variance was 55% for the hybrid buses compared to 13% for the Euro V ones, indicating larger individual NO2/NOx differences per route in case of hybrid buses. CO and THC Euro VI emission levels are also significantly lower, by 67% ± 12% and 73% ± 10%, respectively over Euro V levels. Euro VI N2O levels appear almost four times higher compared to Euro V while most of the instantaneous NH3 concentrations were lower than the detection limit of the measurement instrument for both Euro V and Euro VI buses.
To put Euro VI NOx emissions into context, one may consider that the average distance-weighted NOx emission level of 0.74 g km−1 for hybrid buses results to a per passenger level of 7.4 mg pkm−1, considering the total bus capacity of 117 passengers and an average occupancy ratio of 85% [50]. In comparison, urban activity of gasoline Euro 6 vehicles, considered as the cleanest passenger cars according to Euro standards certification, corresponds to approximately 28.6 mg NOx pkm−1. This assumes a NOx emission level of 40 mg/km [51] and an occupancy rate of 1.4 [52]. This shows that hybrid diesel Euro VI buses provide almost four times less NOx than private cars per unit of passenger-distance travelling in Hong Kong.
Route characteristics are reported in a XY form where X denotes each of the variables speed (S), exhaust temperature (E), ambient temperature (A), or height standard deviation (H) and Y the respective level low (L), moderate (M), or high (H).
The measured NOx levels of all Euro V ones and one Euro VI hybrid bus are higher than the corresponding limit values. Other studies also report higher—than the limits—NOx emission levels for Euro V buses under urban conditions, as for example for urban buses that were measured in Beijing, China [29], in the Netherlands [36], and also in Poznan, Poland [37]. In comparing with the corresponding limit, one needs to consider that WHTC (the type approval transient cycle) comprises urban, rural and highway conditions, and not only urban ones, examined in the present study. On the other hand, all Euro V and Euro VI buses complied with the corresponding limits in terms of CO and HC. The highest average NH3 exhaust content for a Euro VI vehicle was 0.71 ppm, far below the provision of the Euro VI regulation allowing up to 10 ppm NH3 emissions. No NH3 regulatory limits are available for earlier Euro classes.
The difference in the profile of pollutant emissions between Euro V and Euro VI hybrid buses should be mostly attributed to the different emission control, rather than their powertrain system. The hybrid bus engines are equipped with EGR and, presumably, a more efficient SCR system to comply with Euro VI limits. The current results show that aftertreatment and powertrain tuning of hybrid buses may offer substantial reductions in NOx, a finding that comes in contrast to some earlier studies [8,15,17]. As an example of emission control specific tuning, Euro VI bus over route #1 exhibits a higher exhaust gas temperature than Euro V, presumably as a result of engine thermal management to retain a high NOx conversion efficiency in the SCR. This of course has fuel efficiency implications but a trade-off between fuel consumption and NOx emission levels for heavy duty vehicles is well established in the literature [53]. The balance in terms of fuel consumption and NOx emission reductions of late technology hybrid buses seems therefore very sensitive to their powertrain calibration [12].
Table 4 also shows equivalent CO2 emissions (CO2e) by converting N2O emissions using the 100-years global warming potential of N2O (GWP100,N2O = 265) and adding this to tailpipe CO2 emissions [54]. The high N2O emissions of Euro VI buses also deserve some attention. These may be due to an intentionally higher NO2/NOx ratio to improve SCR performance [55] or use of a different catalyst (e.g., V-based) [56] in Euro VI than Euro V. Owed to the high relative global warming potential (GWP) of N2O over CO2, these high N2O levels contribute up to 8.1% (average 5.9%) of total greenhouse gases (Route #1) and hence largely offset any exhaust CO2 benefits of hybrid buses. It can be assumed that catalyst and urea injection optimization could lead to better N2O control and hence, the high levels reported should be seen as being specific to the vehicles utilized in this study and should not be necessary generalized to all hybrid powertrains.

3.4. Comparative Assessment over Different City Routes

The mean fuel consumption difference strongly depends on the route considered. Hybrid buses consumption is clearly lower than conventional buses in three routes (#2, #3, #4), at the same level in two routes (#5, #6), and higher over one route (#1). The routes where significant benefits are observed are characterized by moderate speed, low ambient temperatures (for HK climatic conditions) and moderate altitude variance. Routes of marginal benefits are of moderate/high speed, medium/high ambient temperature, and relatively high altitude variance. The route with the significantly higher FC for hybrids corresponds to high ambient temperature and, lowest speed and lowest power demand. Moreover, route #1 is characterised by a 4.9 °C higher ambient temperature for hybrid buses than conventional ones.
The average FC of hybrid buses is 15% lower for the three routes with the lowest ambient temperatures (avg. 20 °C), whereas hybrids show a 3% higher average FC for the three moderate/high ambient temperature routes (avg. 30 °C) when compared to their conventional counterparts. The study findings suggest that fuel consumption increases in the summer months over winter ones. This increase in fuel consumption with temperature may be expected, as A/C load increases, and comparison of the different routes suggests that the relative effect is higher in the case of hybrid buses. The difference in average FC between the hybrid buses driving on the low ambient temperature routes (#2, #3, #4) and those driving on the high temperature ones (#1, #5) is 52%, corresponding to a shift from an average FC of 59 to 90 kg (100 km)−1. This result corroborates the observations of [18], who reported that the average hybrid bus FC appeared to increase by 48% when A/C systems were enabled. The simulation results of Bottiglione et al. [48] also indicated that when the A/C is on, the benefit of hybrid buses over conventional ones is substantially decreased. Also, Muncrief et al. [57] reported more than 20% increase in fuel consumption when the A/C unit of a series hybrid bus was activated.
In better understanding the impact of temperature on fuel consumption, Figure 4 focuses on routes #1 and 2, i.e., the routes of the two extremes in the fuel consumption difference between the two vehicle technologies. The figure illustrates the normalised cumulative distance travelled over time for each bus type. Time is also normalised to the mean duration of each route. The speed traces for the two vehicle types are almost on top of each other in route #1, practically indicating identical mean driving profiles. Although the spread is much higher in Route #2, there is a significant overlap in the speed traces of the two vehicle types. Operation profile differences in these routes can therefore not justify fuel consumption differences.
To explain the difference, Figure 5 shows the distribution of fuel consumption over different fuel rate classes. This is equivalent to expressing emissions over vehicle specific power (VSP) bins, as many studies suggest (e.g., Guo et al. [17]; Hallmark et al. [8]; Zhang et al. [29]), but the chosen representation is more reliable, being directly based on measured signals. In route #1, conducted at low speeds and high temperatures, most of the fuel consumption is at low flow rates and the peak in the concentration is shifted to higher fuel rates for the hybrid than the conventional bus. In the higher speed and lower ambient temperature Route #2, the peak at low fuel flow rates is smaller and moderate fuel rates contribute more to fuel consumption.
Although all technical details of the buses are not available, hybrid buses are known to operate on electrical compressor A/C units powered from the vehicle’s battery, while conventional buses are equipped with mechanical compressors. In mechanical systems, A/C power consumption depends on engine speed [46], hence the A/C power absorption is low at low fuel rates and increases with fuel rate. On an electrical system, power absorption may also be high at low engine loads, thus increasing the fuel rate to counterbalance the A/C load. This may cause a shift of the low fuel rate peak in route #1, despite this has a smaller engine than the conventional vehicle. The execution of Route #1 by the hybrid bus was conducted at an average temperature that was 4.9 degrees higher than tests with the conventional bus. The cooling demand for the A/C is therefore higher in the case of the hybrid bus. If tests were conducted at the same temperature, the fuel consumption difference between the two vehicle types would presumably be lower, although it is not possible to quantify by how much.
Figure 5 also shows a second peak at high fuel rates for Route #2 with the hybrid bus. This means that the engine is tuned to operate in full power when the vehicle is driven at relatively high load conditions. We may hypothesize this is done for two reasons. First, to charge the batteries under this high efficient mode and use this extra power in later, less efficient modes. Second, to provide hot exhaust gas to the SCR in order to overall retain a high temperature and hence efficiency, despite the engine shuts off when the vehicle is stationary in Route#2. Indeed, the mean exhaust gas temperature between Euro V and VI was not substantially different in Route 2, despite the start-stop function of the engine of the latter.
Use of the “start/stop” engine function, active for the hybrid buses travelling on routes #2 and #3, appears to have a positive effect on fuel consumption as the highest FC gains of 15% and 20%, respectively, appear for these two routes. The difference in fuel consumption of the hybrid bus travelling on a route of similar average speed and ambient temperature (route #4), but with the “start/stop” function inactive drops to 10%. It is not clear why the start/stop activity varied between routes. This could have to do with the battery charge status, the specific calibration of the individual vehicles, or the need to power auxiliaries in the different routes.
In Route #5, no statistically significant differences appear between hybrid and conventional buses over none of the environmental and operation parameters, including vehicle and engine speeds, positive acceleration, power demand, height gain, and exhaust and ambient temperatures (independent t-tests at the trip level, p = 0.11 to 0.93). This route is conducted at the foothills of Hong Kong island and has a positive elevation gain of 2.2%, which is the highest between all routes examined. In this route, the FC difference between the buses was negligible (−1%) or −0.9 ± 2.9 kg (100 km)−1 and statistically non-significant (p = 0.81). Positive road gradient across the route appears as another factor that compromises hybrid powertrain benefits.
An indication regarding the effect of speed on FC is provided by comparing routes #1 and #5 which, in particular for hybrid buses, were conducted practically under the same ambient conditions. The results show that the transition from medium average route speeds (~15 km h−1) to low average route speeds (~8 km h−1) is related to a significant increase in mean FC by 63%, or alternatively a statistically significant (p = 0.00) change in FC by 43 ± 3 kg (100 km)−1, corroborating findings from [18]. The corresponding difference for conventional buses was 39%, equaling 28 ± 3 kg (100 km)−1 (p = 0.00). The difference cannot be justified by a change in ambient conditions or road gradient; in fact route #5 is more hilly than route #1. Hence, the significant difference suggests that hybrid bus consumption is more sensitive to mean speed than conventional ones, a finding which comes in contrast to evidence from popular passenger car hybrid systems [58]. Reasons for this difference most probably reside on the specifics of powertrain implementation between cars and buses. Buses mostly utilize series hybrid powertrains compared to power-split type for cars while the relative capacity of bus batteries may be smaller to decrease cost. This may lead to a more transient internal engine operation on the bus than the car, which leads to a higher sensitivity on speed profile.

4. Conclusions

In this study, six Euro VI diesel hybrid and six Euro V conventional diesel double-deck transit buses were tested using PEMS under scheduled routes in a modern metropolitan urban road network. The measurements helped revealing the sensitivity of fuel consumption and pollutants emission on driving, operation, and ambient conditions.
The fuel consumption of hybrid buses was on average lower by 6.1% ± 12.4% than conventional ones driving on the same routes. The hybrid over conventional bus fuel consumption ratio ranged from 80% to 116%, depending on the route. The hybrid bus consumption exceeded the conventional one under a low speed route and an ambient temperature by 4.9 °C higher than the conventional bus testing. Relatively high ambient temperatures increase power demand by the A/C while creeping speeds and positive road gradients seemed to compromise efficiency gains of the hybrid technology. Distinct hybrid bus benefits, in the order of 10–20%, were found at temperatures no more than 22 °C, mild road slope and total height gains, and mean speeds in the order of 10–15 km h−1. These represent conditions of moderate total power demand for traction and A/C operation.
On the other hand, Euro VI hybrid buses were overall found to emit NOx at significantly lower level (93%) than Euro V ones. Considering Hong Kong occupancy rates for buses and private cars, NOx emission levels of Euro VI hybrid buses appear approximately four times lower than latest Euro 6 gasoline private cars per unit of passenger-distance travel. Investing in Euro VI technology for public transport may therefore overall provide significant environmental benefits in terms of emission of air pollutants.
The results of this study show that the fuel consumption benefits when comparing Euro VI hybrid buses over their Euro V conventional counterparts are marginal, when the assessment is made under the actual urban operational and environmental conditions these vehicles are scheduled to operate. On the other hand, the shift to Euro VI technology offered impressive reductions in NOx emissions compared to Euro V one. The reason for the marginal fuel consumption difference could be the impact of air-conditioning, significant road gradient differences, and creeping speeds in the busy road network of Hong Kong.
The results of this study could be a valuable input to urban bus service providers around the world in selecting optimum technologies in terms of environmental impacts and operation costs. Air pollutant and greenhouse gas emission levels provided are also helpful to city authorities in designing technology plans to meet current and future air quality and transport decarbonisation targets.

Author Contributions

The contribution of the authors are summarized as follows: Conceptualization, L.N., T.-S.L. and C.K.-L.W.; methodology, C.K., G.P. and L.N.; software, C.K., G.P., H.-L.A.W. and K.-L.N.; validation, L.N., T.-S.L. and C.K.-L.W.; formal analysis, C.K., G.P. and L.N.; investigation, T.-S.L., C.K.-L.W., H.-L.A.W. and K.-L.N.; resources, T.-S.L., C.K.-L.W., H.-L.A.W. and K.-L.N.; data curation, T.-S.L., C.K.-L.W., H.-L.A.W. and K.-L.N.; writing—original draft preparation, C.K., G.P. and L.N.; writing—review and editing, C.K., G.P., L.N.

Funding

The study is implemented in the framework of the project entitled “Provision of Services for Analysing Vehicle Emission Data collected by Portable Emission Measuring Systems” (ref. #16-00280), commissioned by the Hong Kong Environmental Protection Department (HK EPD). The contents of this paper are solely the responsibility of the authors and do not necessarily represent official views of the Hong Kong SAR Government.

Acknowledgments

The authors are grateful for the data and the technical support provided by the Hong Kong Environmental Protection Department.

Conflicts of Interest

The authors declare no conflict of interest. The scientific officer of HK EPD and the authors from HK EPD were involved in the study as described in the Authors Contributions paragraph.

References

  1. Paunović, K.; Belojević, G.; Jakovljević, B. Noise annoyance is related to the presence of urban public transport. Sci. Total Environ. 2014, 481, 479–487. [Google Scholar] [CrossRef] [PubMed]
  2. Hertel, O.; Hvidberg, M.; Ketzel, M.; Storm, L.; Stausgaard, L. A proper choice of route significantly reduces air pollution exposure—A study on bicycle and bus trips in urban streets. Sci. Total Environ. 2008, 389, 58–70. [Google Scholar] [CrossRef] [PubMed]
  3. Farsi, M.; Fetz, A.; Filippini, M. Economies of Scale and Scope in Local Public Transportation. J. Transp. Econ. Policy (JTEP) 2007, 41, 345–361. [Google Scholar]
  4. Jakob, A.; Craig, J.L.; Fisher, G. Transport cost analysis: A case study of the total costs of private and public transport in Auckland. Environ. Sci. Policy 2006, 9, 55–66. [Google Scholar] [CrossRef]
  5. Mayeres, I.; Ochelen, S.; Proost, S. The marginal external costs of urban transport. Transp. Res. Part D Transp. Environ. 1996, 1, 111–130. [Google Scholar] [CrossRef]
  6. Viton, P.A. A Translog Cost Function for Urban Bus Transit. J. Ind. Econ. 1981, 29, 287–304. [Google Scholar] [CrossRef]
  7. Gibby, R.; Dawson, R.; Sebaaly, P. Local Urban Transit Bus Impact on Pavements. J. Transp. Eng. 1996, 122, 215–217. [Google Scholar] [CrossRef]
  8. Hallmark, S.L.; Wang, B.; Sperry, R. Comparison of on-road emissions for hybrid and regular transit buses. J. Air Waste Manag. Assoc. 2013, 63, 1212–1220. [Google Scholar] [CrossRef] [PubMed] [Green Version]
  9. Cohen, J.T.; Hammitt, J.K.; Levy, J.I. Fuels for Urban Transit Buses: A Cost-Effectiveness Analysis. Environ. Sci. Technol. 2003, 37, 1477–1484. [Google Scholar] [CrossRef] [PubMed] [Green Version]
  10. Gerbec, M.; Samuel, R.O.; Kontić, D. Cost benefit analysis of three different urban bus drive systems using real driving data. Transp. Res. Part D Transp. Environ. 2015, 41, 433–444. [Google Scholar] [CrossRef]
  11. Hu, X.; Murgovski, N.; Johannesson, L.; Egardt, B. Energy efficiency analysis of a series plug-in hybrid electric bus with different energy management strategies and battery sizes. Appl. Energy 2013, 111, 1001–1009. [Google Scholar] [CrossRef]
  12. Lajunen, A. Energy consumption and cost-benefit analysis of hybrid and electric city buses. Transp. Res. Part C Emerg. Technol. 2014, 38, 1–15. [Google Scholar] [CrossRef]
  13. Millo, F.; Rolando, L.; Fuso, R.; Zhao, J. Development of a new hybrid bus for urban public transportation. Appl. Energy 2015, 157, 583–594. [Google Scholar] [CrossRef]
  14. Xiong, W.; Zhang, Y.; Yin, C. Optimal energy management for a series–parallel hybrid electric bus. Energy Convers. Manag. 2009, 50, 1730–1738. [Google Scholar] [CrossRef]
  15. Merkisz, J.; Pielecha, J. Emissions and fuel consumption during road test from diesel and hybrid buses under real road conditions. In Proceedings of the 2010 IEEE Vehicle Power and Propulsion Conference, Lille, France, 1–3 September 2010; pp. 1–5. [Google Scholar]
  16. Semercioğlu, H.; Bal, A.; Soylu, S. Examination of real world operating conditions and emissions of a hybrid city bus. In Proceedings of the International Conference on Energy and Automotive Technologies—ICAT 2010, Istanbul, Turkey, 5 November 2010. [Google Scholar]
  17. Guo, J.; Ge, Y.; Hao, L.; Tan, J.; Peng, Z.; Zhang, C. Comparison of real-world fuel economy and emissions from parallel hybrid and conventional diesel buses fitted with selective catalytic reduction systems. Appl. Energy 2015, 159, 433–441. [Google Scholar] [CrossRef]
  18. Zhang, S.; Wu, Y.; Liu, H.; Huang, R.; Yang, L.; Li, Z.; Fu, L.; Hao, J. Real-world fuel consumption and CO2 emissions of urban public buses in Beijing. Appl. Energy 2014, 113, 1645–1655. [Google Scholar] [CrossRef]
  19. Armas, O.; Lapuerta, M.; Mata, C. Methodology for the analysis of pollutant emissions from a city bus. Meas. Sci. Technol. 2012, 23, 045302. [Google Scholar] [CrossRef]
  20. Gómez, A.; Mata, C.; Armas, O. Effect of Ethanol–Diesel Fuel Blend on Diesel Engine Emissions Produced by Different Bus Fleets. J. Energy Eng. 2016, 142, E4015003. [Google Scholar] [CrossRef]
  21. Quiros, D.C.; Smith, J.; Thiruvengadam, A.; Huai, T.; Hu, S. Greenhouse gas emissions from heavy-duty natural gas, hybrid, and conventional diesel on-road trucks during freight transport. Atmos. Environ. 2017, 168, 36–45. [Google Scholar] [CrossRef]
  22. Graham, L.A.; Rideout, G.; Rosenblatt, D.; Hendren, J. Greenhouse gas emissions from heavy-duty vehicles. Atmos. Environ. 2008, 42, 4665–4681. [Google Scholar] [CrossRef]
  23. Stempien, J.P.; Chan, S.H. Comparative study of fuel cell, battery and hybrid buses for renewable energy constrained areas. J. Power Sources 2017, 340, 347–355. [Google Scholar] [CrossRef]
  24. Wang, R.; Wu, Y.; Ke, W.; Zhang, S.; Zhou, B.; Hao, J. Can propulsion and fuel diversity for the bus fleet achieve the win–win strategy of energy conservation and environmental protection? Appl. Energy 2015, 147, 92–103. [Google Scholar] [CrossRef]
  25. Zhang, S.; Wu, Y.; Zhao, B.; Wu, X.; Shu, J.; Hao, J. City-specific vehicle emission control strategies to achieve stringent emission reduction targets in China’s Yangtze River Delta region. J. Environ. Sci. 2017, 51, 75–87. [Google Scholar] [CrossRef] [PubMed]
  26. Slovic, A.D.; Ribeiro, H. Policy instruments surrounding urban air quality: The cases of São Paulo, New York City and Paris. Environ. Sci. Policy 2018, 81, 1–9. [Google Scholar] [CrossRef]
  27. Wang, S.; Hao, J. Air quality management in China: Issues, challenges, and options. J. Environ. Sci. 2012, 24, 2–13. [Google Scholar] [CrossRef]
  28. Andersson, J. Real World Emissions and Control: Use of PEMS on Heavy Duty Vehicles to Assess the Impact of Technology and Driving Conditions on Air Quality in Urban Areas. 2016. Available online: http://www.scottishairquality.scot/assets/documents/reports/08_Jon_Andersson_Edinburgh1-PEMS.pdf (accessed on 4 September 2018).
  29. Zhang, S.; Wu, Y.; Hu, J.; Huang, R.; Zhou, Y.; Bao, X.; Fu, L.; Hao, J. Can Euro V heavy-duty diesel engines, diesel hybrid and alternative fuel technologies mitigate NOX emissions? New evidence from on-road tests of buses in China. Appl. Energy 2014, 132, 118–126. [Google Scholar] [CrossRef]
  30. Squaiella, L.L.F.; Martins, C.A.; Lacava, P.T. Strategies for emission control in diesel engine to meet Euro VI. Fuel 2013, 104, 183–193. [Google Scholar] [CrossRef]
  31. Guan, B.; Zhan, R.; Lin, H.; Huang, Z. Review of state of the art technologies of selective catalytic reduction of NOx from diesel engine exhaust. Appl. Therm. Eng. 2014, 66, 395–414. [Google Scholar] [CrossRef]
  32. Jonson, J.E.; Borken-Kleefeld, J.; Simpson, D.; Nyíri, A.; Posch, M.; Heyes, C. Impact of excess NOX emissions from diesel cars on air quality, public health and eutrophication in Europe. Environ. Res. Lett. 2017, 12. [Google Scholar] [CrossRef]
  33. Ntziachristos, L.; Papadimitriou, G.; Ligterink, N.; Hausberger, S. Implications of diesel emissions control failures to emission factors and road transport NOX evolution. Atmos. Environ. 2016, 141, 542–551. [Google Scholar] [CrossRef]
  34. André, M.; Hammarström, U. Driving speeds in Europe for pollutant emissions estimation. Transp. Res. Part D Transp. Environ. 2000, 5, 321–335. [Google Scholar] [CrossRef]
  35. Joumard, R.; André, M.; Vidon, R.; Tassel, P.; Pruvost, C. Influence of driving cycles on unit emissions from passenger cars. Atmos. Environ. 2000, 34, 4621–4628. [Google Scholar] [CrossRef]
  36. Verbeek, R.; Vermeulen, R.; Vonk, W.; Dekker, H. Real World NOX Emissions of Euro V Vehicles; TNO: The Hague, The Netherlands, 2010. [Google Scholar]
  37. Merkisz, J.; Rymaniak, Ł. Tests of urban bus specific emissions in terms of currently applicable heavy vehicles operating emission regulations. Combust. Engines 2017, 21–26. [Google Scholar] [CrossRef]
  38. ISO 5165:1998. Petroleum Products—Determination of the Ignition Quality of Diesel fuels—Cetane Engine Method; International Organization for Standardization: Geneva, Switzerland, 1998.
  39. ISO 3104:1994. Petroleum Products—Transparent and Opaque Liquids—Determination of Kinematic Viscosity and Calculation of Dynamic Viscosity; International Organization for Standardization: Geneva, Switzerland, 1994.
  40. Secretary for the Environment, H.K. Air Pollution Control (Motor Vehicle Fuel) (Amendment) Regulation 2010; Advisory Council on the Environment: Hong Kong, 2010.
  41. ISO 16183. Heavy-Duty Engines Measurement of Gaseous Emissions from Raw Exhaust Gas and of Particulate Emissions using Partial Flow Dilution Systems under Transient Test Conditions; International Organization for Standardization: Geneva, Switzerland, 2002.
  42. US EPA. Subpart J—Field Testing and Portable Emission Measurement Systems, CFR Part 1065; United States Environmental Protection Agency: Washington, DC, USA, 2015.
  43. European Commission. Commission Regulation (EU) No. 582/2011 Implementing and Amending Regulation (EC) No. 595/2009 of the European Parliament and of the Council with Respect to Emissions from Heavy Duty Vehicles (Euro VI) and Amending Annexes I and III to Directive 2007/46/EC of the European Parliament and of the Council; Official Journal of the European Union: Brussels, Belgium, 2011. [Google Scholar]
  44. UN. Agreement Concerning the Adoption of Uniform Technical Prescriptions for Wheeled Vehicles Addendum 100: Regulation No. 101; United Nations: New York, NY, USA, 2013. [Google Scholar]
  45. Shek, K.W.; Chan, W.T. Combined comfort model of thermal comfort and air quality on buses in Hong Kong. Sci. Total Environ. 2008, 389, 277–282. [Google Scholar] [CrossRef] [PubMed]
  46. Campbell, J.; Watts, W.; Kittelson, D. Reduction of Accessory Overdrive and Parasitic Loading on a Parallel Electric Hybrid City Bus; SAE: Warrendale, PA, USA, 2012. [Google Scholar]
  47. Rothfusz, L. The Heat Index “Equation” (or, More Than You Ever Wanted to Know About Heat Index); National Oceanic and Atmospheric Administration, National Weather Service, Office of Meteorology: Fort Worth, TX, USA, 1990. [Google Scholar]
  48. Bottiglione, F.; Contursi, T.; Gentile, A.; Mantriota, G. The Fuel Economy of Hybrid Buses: The Role of Ancillaries in Real Urban Driving. Energies 2014, 7, 4202–4220. [Google Scholar] [CrossRef] [Green Version]
  49. Sillman, S. The relation between ozone, NOx and hydrocarbons in urban and polluted rural environments. Atmos. Environ. 1999, 33, 1821–1845. [Google Scholar] [CrossRef]
  50. The Goverment of the Hong Kong SAR Transport and Housing Bureau. In Public Transport Strategy Study, Final Report; Transport and Housing Bureau: Hong Kong, 2017.
  51. O’Driscoll, R.; Stettler, M.E.J.; Molden, N.; Oxley, T.; ApSimon, H.M. Real world CO2 and NOX emissions from 149 Euro 5 and 6 diesel, gasoline and hybrid passenger cars. Sci. Total Environ. 2018, 621, 282–290. [Google Scholar] [CrossRef] [PubMed]
  52. The Goverment of the Hong Kong SAR Transport Department. The Annual Traffic Census 2015; Transport Department: Hong Kong, 2015.
  53. Gabrielsson, P.L.T. Urea-SCR in Automotive Applications. Top. Catal. 2004, 28, 177–184. [Google Scholar] [CrossRef]
  54. IPCC (Intergovernmental Panel on Climate Change). Climate Change 2014: Synthesis Report. Contribution of Working Groups I, II and III to the Fifth Assessment Report of the Intergovernmental Panel on Climate Change [Core Writing Team, R.K. Pachauri and L.A. Meyer (Eds.)]; IPCC: Geneva, Switzerland, 2014.
  55. Colombo, M.; Nova, I.; Tronconi, E. A comparative study of the NH3-SCR reactions over a Cu-zeolite and a Fe-zeolite catalyst. Catal. Today 2010, 151, 223–230. [Google Scholar] [CrossRef]
  56. Kim, M.H.; Ham, S.-W. Determination of N2O Emissions Levels in the Selective Reduction of NOX by NH3 Over an On-Site-Used Commercial V2O5–WO3/TiO2 Catalyst Using a Modified Gas Cell. Top. Catal. 2010, 53, 597–607. [Google Scholar] [CrossRef]
  57. Muncrief, R.L.; Cruz, M.; Ng, H.; Harold, M. Impact of Auxiliary Loads on Fuel Economy and Emissions in Transit Bus Applications; SAE: Warrendale, PA, USA, 2012. [Google Scholar]
  58. Fontaras, G.; Pistikopoulos, P.; Samaras, Z. Experimental evaluation of hybrid vehicle fuel economy and pollutant emissions over real-world simulation driving cycles. Atmos. Environ. 2008, 42, 4023–4035. [Google Scholar] [CrossRef]
Figure 1. Euro VI diesel-hybrid bus during trials in the streets of Hong Kong. GPS: global positioning system; Semtech-DS analyser (Sensors, Inc., Saline, MI, USA).
Energies 11 02569 g001
Figure 2. Schematic of the city bus routes employed in the PEMS measurement campaign, superimposed on the Hong Kong metropolitan area map. A mix of conditions ranging from urban to rural and highway roads were covered.
Energies 11 02569 g002
Figure 3. Fuel consumption and percentage difference between the two vehicle types per route, together with mean route speed.
Energies 11 02569 g003
Figure 4. Normalised trip distance over normalised trip time for the conventional and hybrid buses driving on Routes #1 (a) and #2 (b).
Energies 11 02569 g004
Figure 5. Total fuel consumption distribution per fuel rate class for the conventional and hybrid buses. (a) Route #1, (b) Route #2.
Energies 11 02569 g005
Table 1. Overview of diesel and hybrid-diesel bus specifications.
SpecificationEuro V ConventionalEuro VI Hybrid
ID1–67–12
Year of registration2013–20152014
Emission standardEuro VEuro VI
TechnologyConventionalHybrid (serial)
FuelDieselDiesel
Emission control technology SCRDPF, EGR, SCR
Mean mileage (min/max) (km)50,506 (23,391/92,143)26,299 (15,858/48,092)
TransmissionAutomaticAutomatic
Gross vehicle weight (t)2424
Weight before/after installation * (t)15.3/19.516.0/20.0
Number of cylinders66
Idle/max speed (RPM)700/2400600/2850
Engine displacement (L)8.96.7
Engine rated power (kW@rpm)243@2100204@2100
Engine peak torque (Nm@rpm)1500@1200–14001100@1200–1600
* The “weight after installation” include the weight of the portable emission measurement systems (PEMS) devices and equipment and the ballast weight that was used to emulate the passenger load. DPF: diesel particulate filter; EGR: exhaust gas recirculation; SCR: selective catalytic reduction.
Table 2. Overview of the testing routes; each one was executed at least three times in both directions.
Route #Bus TerminiRoute NumberDriving ModeAverage One-Way Duration (h; min)Distance (km)
1Kennedy Town–Hong Kong Stadium5BUrban1 h; 2 min8.4
2Lai Chi Kok–Wan Chai North905Urban (mainly)/Highway1 h; 19 min16.3
3Star Ferry–Sau Mau Ping1AUrban1 h; 8 min14.7
4Shun Lee–Macau Ferry619Urban (mainly)/Highway1 h; 15 min17.5
5Heng Fa Chuen–Wan Chai North8Urban (mainly)/Highway0 h; 53 min13.6
6Tin Shui Wai–Causeway Bay969Urban/Highway (mainly)1 h; 31 min43.9
Table 3. Overview of the mean driving and operation conditions per route and bus technology.
Route #Speed (km h−1)Positive Acceleration
(m s−2)
Positive Power
(kW)
Engine Speed
(rpm)
Exhaust Temperature (°C)Ambient Temperature (°C)Height Gain (%)Height st. dev. (m)
Euro V Conventional
18.10.2935.684924126.70.432.2
212.10.3443.487724221.70.641.3
312.70.4548.589224617.41.1621.8
414.20.4353.7n.a.27419.71.8830.3
516.30.3256.196029932.12.2421.8
629.50.3261.2106030928.80.8320.0
Euro VI Hybrid
18.20.40 39.4939 286 31.6 0.402.4
212.50.40 46.8710 24118.9 0.601.4
313.30.4753.4751 26020.5 1.1421.4
414.00.4254.188127418.71.8830.1
515.10.3454.797329332.12.2020.9
628.70.29 62.5105531626.4 0.8220.3
st. dev.: standard deviation. n.a.: not available for complete route due to data recording issues. mean is statistically different from the corresponding value of the Euro V test.
Table 4. Emission levels of basic pollutants per tested bus and route.
Emission Factors (g km−1)Emission Factors (g kWh−1) +
Route #Route CharacteristicsNOxNONO2COTHCNH3 *N2O *CO2eNOxCOTHC
Euro V (conventional) buses
1SL/EL/AM/HM26.6421.744.898.780.105.57230207.982.770.03
2SM/EL/AL/HL9.558.261.299.240.0711.922121683.774.040.03
3SM/EL/AL/HH10.629.551.076.910.084.018121904.402.960.04
4SM/EM/AL/HH8.817.960.845.100.07--22693.572.140.03
5SM/EH/AH/HH12.9510.552.404.520.033.49421944.471.670.01
6SH/EH/AM/HH6.585.451.132.240.032.25914223.871.400.02
Euro V emission limit (transient testing) 2.004.000.55 §
Euro VI (hybrid) buses
1SL/EM/AH/HM4.080.643.443.550.044.6117738030.950.850.01
2 £SM/EL/AL/HL0.210.200.021.260.027.326517700.060.550.01
3 £SM/EM/AL/HH0.480.370.101.810.012.449419640.160.700.01
4SM/EM/AL/HH0.420.340.071.550.022.442121620.140.590.01
5SM/EH/AH/HH0.700.130.581.920.012.754022920.210.640.00
6SH/EH/AM/HH0.640.410.220.990.011.729413900.320.600.01
Euro VI emission limit (transient testing) 0.464.000.16
* NH3, and N2O are reported in mg km−1. + Emission levels presented in this study are based on the calculated wheel power, whereas the respective standard limits refer to engine power. § The limit refers to non-methane hydrocarbons (NMHC). £ The “start-stop” engine function was active.

