Article

A Novel Robust Methodology Based Salp Swarm Algorithm for Allocation and Capacity of Renewable Distributed Generators on Distribution Grids

by
Mohamed Tolba
1,2,*,
Hegazy Rezk
3,4,
Ahmed A. Zaki Diab
4 and
Mujahed Al-Dhaifallah
3,5,*
1
Nuclear Researches Center, Egyptian Atomic Energy Authority, 11787 Cairo, Egypt
2
Electrical Power Systems Department, Moscow Power Engineering Institute, 111250 Moscow, Russia
3
College of Engineering at Wadi Addawaser, Prince Sattam Bin Abdulaziz University, 11991 Wadi Addawaser, Saudi Arabia
4
Electrical Engineering Dept., Faculty of Engineering, Minia University, 61111 Minia, Egypt
5
Systems Engineering Department, King Fahd University of Petroleum and Minerals, Dhahran 31261, Saudi Arabia
*
Authors to whom correspondence should be addressed.
Energies 2018, 11(10), 2556; https://doi.org/10.3390/en11102556
Submission received: 30 August 2018 / Revised: 8 September 2018 / Accepted: 11 September 2018 / Published: 25 September 2018

Abstract

:
A novel methodology based on the recent metaheuristic optimization algorithm Salp Swarm Algorithm (SSA) for locating and optimal sizing of renewable distributed generators (RDGs) and shunt capacitor banks (SCBs) on radial distribution networks (RDNs) is proposed. A multi-objective function index (MOFI) approach is used for assuring the power quality (PQ) through enhancing the voltage level in addition to minimizing the power losses of the system and the whole operating cost of the grid. The proposed methodology is tested via 33-Bus standard radial distribution networks at different scenarios to prove their validity and performance. The obtained results are compared with the Grasshopper Optimization Algorithm (GOA), and the hybrid Particle Swarm Optimization (PSO) and Gravitational Search Algorithm (PSOGSA). The SSA optimizer proved its superiority with high attitude and accuracy for solving the problems of RDGs’ and SCBs’ locations and capacities simultaneously. An Egyptian practical case study at different load levels via different scenarios including the control operation within 24 h is considered.

1. Introduction

Electric power networks, especially distribution systems, commonly suffer from two main issues: high power losses and poor voltage profile [1,2]. The losses in the transmission/distribution grids produce the biggest exhaustion in power systems [3]. Accordingly, the loss of distribution grid is concerning and this has attracted many studies in the distribution schemes field, which have concentrated on line loss decreasing and voltage control. Diverse methodologies of loss minimization and voltage level boost in the distribution system are considered in two solutions like (i) shunt capacitor bank (SCB) locating, and (ii) distributed generator (DG) installations These are more focused on achieving interconnection when small generators exist; for instance, when isolated wind farms or small photovoltaic plants enter the distribution network [3]. By tradition, loss decreases and voltage profile improvement have focused on optimizing the reactive power using a capacitor bank. While the growth from inactive distribution grids into active distribution grids because of the integration of the distributed generator (DG) introduces big changes, in spite of this, parallel-converters being used to connect DGs to the grid can increase the power loss [4,5]. This work incorporates the optimization approaches for enhancing voltage levels; minimizing the distribution losses and the whole operation costs by capacitors compensations, and the integration of RDGs. The optimum integration of renewable distributed generators (RDGs) and their impacts are always a hot topic for solving the major problems of electric power systems (e.g., poor power quality due to degradation in voltage levels, high system losses, low of reliability causing power system blackouts, and congestion in transmission systems) due to a wide range of load growth and investment shortages in transmission networks. The definition of RDGs can be deduced as the electricity generation from renewable generating units that are adequately smaller than central generating plants or the substations, allowing for connections at almost any point in a power network [3,6,7]. A wide range of benefits are achieved by the integration of RDGs in power grids including environmental, economical, and technical, which encourage distribution companies and consumers sufficiently to enlarge investment in the renewable generation field [8,9,10]. The environmental and economic merits are deduced in sufficiently minimizing the transmission and distribution costs, and the prices of electricity [11,12,13]. The optimal installation and capacity of RDGs and SCBs simultaneously on radial distribution networks (RDN) are immensely hot topics. It is a magnificent challenge for power system researchers and planners, due to the fact that the profits that are gained from savings and technical issues can be increased extremely with the separate operation of RDGs and SCBs. Moreover, on account of the complication and divergence of the distribution grids, modern and efficient methodologies are required to assure the power quality (PQ).
Recently, many artificial intelligent-mechanisms (AI-M) have been developed; for instance, the hybrid Particle Swarm Optimization (PSO) and Gravitational Search Algorithm (PSOGSA), the hybrid PSO with Quazi-Newton (PSOQN), the big bang-big crunch optimizer, Bacterial Foraging Optimization (BFO), Tabu Search (TS), the Genetic Algorithm (GA), the immune-based optimization technique, the ant colony search, the Harmony Search Algorithm (HSA), integrated Differential Evolution besides Pattern Search (DE-PS), the Fuzzy-Genetic Algorithm (FGA), the Flower Pollination Algorithm (FPA), and the Artificial Bee Colony (ABC), have been performed in solving the location and size of SCBs [2,14,15]. Methodologies such as the Backtracking Search Optimization Algorithm (BSOA), the modified Firefly Algorithm (FA), the Modified Teaching-Learning Based Optimization (MTLBO), PSO, ABC, Simulated Annealing (SA), GA, the Bat Algorithm (BA), and Harmony Search Algorithm (HAS) were implemented to solve the issues of integration, and the capacity of DGs on RDN [6] and [16,17,18]. Nevertheless, few academics have incorporated RDGs and SCBs jointly with optimum location and size to show their effects on the attitude of RDN, system voltage profile, power loss, and the overall operational cost, as illustrated by the following techniques and methods. Kansal [19] implemented PSO to find the optimal level/size of RDGs and SCBs together on RDN. Reddy [20] executed a Fuzzy-Genetic Algorithm (FGA) to deduce the RDGs allocated besides the optimum sitting with a suitable size of SCBs being produced by the Genetic Algorithm (GA). Naik [21] prepared an analytical approach for the purpose of integrating DGs and SCBs on RDN. In [22,23], the researchers executed PSO, concentrating on minimizing power losses by the optimal incorporation of RDGs and SCBs. Imran [24] implemented Loss-Sensibility-Factors (LSFs) to minimize the optimization search space of the prepared methodology to detect the most sensible nodes for RDG and SCB integrations, then the Bacterial Foraging Optimization Algorithm (BFOA) was constructed to extract their size and location optimally by the elected nodes. In [25], fuzzy Multi-Objective Particle Swarm Optimization (MOPSO) with Pareto issues are suggested for solving the optimum issues of RDGs and SCBs on RDN. The MOPSO-deduced Pareto-front issues, and the subsequent fuzzy electing mechanism picked out the optimum solutions from the Pareto-front. Muthukumar [26] performed the LSFs to detect the appropriate location of RDGs and SCBs; next, the Harmony Search Algorithm was merged to the Particle Artificial Bee Colony algorithm (HAS-PABC) to deduce the optimum solutions from the critical nodes. Khodabakshian [27] implemented an Intersect Mutation Differential Evolution optimizer (IMDE) approach for resolving the issues of RDGs and SCBs levels/capacities together. M. Dixit et al. [28] incorporated the Index Vector Method (IVM) via the Power Loss Index (PLI) to determine the sitting/capacity of RDGs and SCBs optimally.
In accordance with the previous methodologies that have combined RDGs and SCBs together, they did not reach the global optimum, and they may have encountered obstacles because of the following reasons. Some academics performed objective functions that were restricted to minimize the real power losses unaccompanied by another substantial parameters; for instance, the indication of voltage levels, the investment of placements, and the operating and maintenance of RDGs and SCBs with each other [19,20,21,23,24,25]. Other studies have been bound by small RDN scales [20,21,27]. From these studies also, the size values of the integrated RDGs and SCBs on RDN did not find optimum issues [19,20,21,22,23,24,25,26,27,28]. In addition, these academic studies did not considered the operating and maintenance costs of SCBs.
In the prepared research, a new optimizer Salp Swarm Algorithm (SSA) is provided for solving the optimization problem of the RDG and SCB allocations. Two other optimizers, the Grasshopper Optimization Algorithm (GOA) and the PSOGSA, are used for comparison purposes. A multi-objective function Index (MOFI) is performed with the reported optimization methodologies like PSOGSA and GOA, to assure the PQ by enhancing the voltage level, decrease the overall power losses, and the whole yearly grid operational cost. Furthermore, the prepared schemes are applied by two phases. In the first phase, the most nominal nodes for the RDGs and SCBs integrations are computed via LSF method. Whereas, in the second phase, each optimizer determines the optimal location of RDGs and SCBs alongside the appropriate capacity of the designated nodes, depending on minimum MOFI. The proposed schemes are tested on 33-Bus IEEE RDN at various load levels to prove their validity and performance. Furthermore, the best attitude and the most effective techniques of the four techniques is satisfied on a practical case-study of the Middle Egyptian Distribution Network (MEDN) at different load levels, including control operation within 24 h.
The following sections of the prepared article can be deduced as follows: Section 2 presents the problem formulation, the voltage stability, and the types of RDGs studied. The Salp Swarm Algorithm is described in Section 3. Section 4 presents the simulation results of the proposed schemes using SSA, GOA, and PSOGSA algorithms based on 33-Bus IEEE RDN. Section 5 presents the numerical results of the proposed approaches based on a practical case study of the Middle Egypt Distribution Network. Finally, the conclusions of paper are presented in Section 6.

2. Work

2.1. Power-Flow Executing with RDGs and SCBs

The sample of a RDN with the installation of RDGs and SCBs is shown in Figure 1. The Back-ward/Forward Sweep (BFS) technique was carried out for power-flow evaluations [9,25,28]. A distribution network diagram is explained in Figure 1. The evaluations of the BFS power-flow were considered with new parameters that were implemented in this article, such as (active power of RDGs “0/1” set), (reactive power of the SCB “0/1” set), and (reactive power of the RDG “0/1” set) as follows:
The Pij and Qij flow can be formulated as follows:
P i , j = P j + R i , j ( P j 2 + Q j 2 ) V j 2 ( ξ D G p P D G , j )
Q i , j = Q j + X i , j ( P j 2 + Q j 2 ) V j 2 ( ξ S C B q Q C , j + ξ D G q Q D G , j )
where Pj = Pj + PLj and Qj = Qj + QLj.
and,
I i j = ( V i δ i V j δ j ) R i j + j X i j
I i j = ( P i j Q i ) V i δ i
Considering (3) and (4), the bus voltage can be formulated as (5):
V j = [ V i 2 2 ( P i R i j + j Q i X i j ) + ( R i j 2 + X i j 2 ) ( P i 2 + Q i 2 ) V i 2 ] 0.5

2.2. Formulation of Power and Energy Losses with RDGs and SCBs

According to Equations (1) and (2), setting the ξ D G P , ξ S C B q , and ξ D G q parameters by 0, the “active” and “reactive” power losses within nodes “i” and Bus “j” are estimated by:
P L o s s ( i , j ) = R i , j ( P i , j 2 + Q i , j 2 ) V i 2
Q L o s s ( i , j ) = X i , j ( P i , j 2 + Q i , j 2 ) V i 2
Based on (6), the whole basic real power loss of the RDN is given by:
P T L o s s , b = j = 1 N P L o s s ( i , j )
Accordingly, the whole basic energy-cost is represented by the following:
E T L o s s , b = ( t y T p p ( P W F ) t y ) K e P T L o s s , b T h
where, the “present worth factor” (PWF) is written by [25]:
P W F = 1 + I n f R 1 + I n t R
By the location of RDGs and/or SCBs on the RDN via setting the ξ D G P , ξ S C B q , and ξ D G q parameters by 1, the real power losses are estimated by (11):
P D G C , L o s s ( i , j ) = R i , j ( P D G C ( i , j ) 2 + Q D G C ( i , j ) 2 ) V i 2
The whole real power loss with RDGs and/or SCBs can be produced by (12):
P D G C , T L o s s = j = 1 N P D G C , L o s s ( i , j )
Thence, the whole energy-cost via RDG and/or SCB integrations are estimated as follows:
E D G S C B , T L o s s = ( t y T p p ( P W F ) t y ) K e P D G C , T L o s s T h

2.3. Power Loss Index (PLI)

PLI is the rate of whole power-loss via RDGs and/or SCBs to the whole basic power-loss. It can be represented by the following:
Δ P l D G S C B = P D G C , T L o s s P T L o s s , b
The installation of RDGs and/or SCBs minimizes the total power loss in the system. Minimization of the total system power loss is achieved by minimizing Δ P l D G S C B .

2.4. Voltage-Level Index

The voltage-index at the basic-issue VIb without RDGs and SCBs is deduced by:
V I b = i = 2 n b [ ( V i b V max ) 2 + ( V i b V min ) 2 ] ,   i = 2 ,   3 , . ,   n b   ( Number of nodes )
The voltage-index V I D G S C B with RDGs and/or SCBs is represented by the following:
V I D G S C B = i = 2 n b [ ( V i D G S C B V max ) 2 + ( V i D G S C B V min ) 2 ]
The voltage level index Δ V I D e v can be estimated as the following:
Δ V I D e v = V I D G S C B V I b

2.5. Whole Operational-Cost Estimations

(A) Whole operational-cost at the basic case
The whole operational-cost via inserting RDGs and SCBs is introduced as the purchased real power-cost by the grid, including losses, which is given by [28]:
T O C b = ( t y T p p ( P W F ) t y ) E m p P d e m T h a n d , P d e m = P T L o a d + P T L o s s
Thus, the whole base operational-cost of the whole system, including the energy cost base, is deduced by the following new formula:
T O C b a s e = T O C b + E T L o s s , b
(B) Whole operational-cost of SCBs
The SCB installation cost covers the capacity via the siting costs, and they can be calculated as follows:
C o s t Q c , I n s t = [ K S C B j J Q j C + K b K f ] N i n s t
The SCBs size Q j C kVAr is deemed as a discrete amount via the stride capacity 50 kVAr, which is located at the jth node. The N i n s t is a novel factor that has not been used before in the installation of SCBs. This factor is considered as the ratio of time planning Tpp to the 10 years of the SCB’s lifetime, because the maximum life time limit of the SCBs is no more than 10 years.
The capacitor “operating and maintenance” cost can be expressed by [29]:
C o s t Q c , O M = ( t y T p p ( P W F ) t y ) K b K O M C
Subsequently, the whole operational-cost of the SCBs is represented via means of the précis of C o s t Q c , I n s t and C o s t Q c , O M as:
T O C S C B = C o s t Q c , O M + C o s t Q c , O M
(C) Whole operational-cost of RDGs
The RDGs “operating and maintenance” cost can be introduced by (23):
C o s t Q c , O M = ( t y T p p ( P W F ) t y ) K O M D G j J P j D G
The inserted real power P j D G MW is deemed as a discrete amount via the stride capacity of 0.05 MW that is installed at the jth position.
Based on (23), the RDG installation cost can be calculated as follows:
C o s t D G , I n s t = K D G j J S j D G
Accordingly, the whole operational-cost of the RDGs can be represented by the following:
T O C D G = C o s t D G , O M + C o s t D G , O M
Minifying of the whole operational-cost can be deemed as one of the merits of locating the RDGs and SCBs in the RDN. The whole operational-cost via the integration of RDGs and SCBs includes four components. (I) the whole operational-cost of SCBs in (22); (II) the whole operational-cost of RDGs as in (25); (III) the purchased cost of the RDN covering losses via integrating RDGs and SCBs. Consequently, (18) is reformulated to be the purchased cost ( T O C D G S C B ) of the grid via RDGS and SCBs; (V) is the whole energy cost via locating the RDGs and SCBs as in (13).
The whole operational-cost ( T O C T , D G S C B ) of RDN via RDG and SCB allocation is minified based on:
T O C T , D G S C B = T O C T , S C B + T O C D G + T O C D G S C B + E D G S C B , T L o s s
The cost-index Δ O C D G S C B is equal to the proportion of T O C T , D G S C B via the locations of the RDGs and SCBs to T O C b a s e in a basic situation, and it can be minimized based on (19):
Δ O C D G S C B = T O C T , D G S C B T O C b a s e

2.6. Voltage Stability

2.6.1. Voltage Stability Definition

The voltage stability is one of volt is the capability to maintain the voltage and delivered power to loads by the system with an increase in nominal loads. Therefore, the voltage and power transmittance are controllable. If the capability of maintaining voltage and power transfer in the system is lost, the voltage is unstable, which leads to the voltage collapse process. Moreover, the power system will step inside a period of voltage instability before the voltage collapses. Therefore, with the continuity of voltage instability, the control of system voltage and power flow has been lost by system operators. The reverse supplies of the system reactive power will be exhausted, and the motors may begin to stall. According to this, voltage collapse may happen, if voltages decline any more [30]. In this regard, to avoid these problems, it is important to study the impact of installing devices such as SCBs and RDGs on voltage stability in the distribution network. To measure the voltage stability of the system, the Voltage Stability Index (VSI) is proposed [30].

2.6.2. VSI Analysis

For checking the power system security level, VSI can been used. Based on the power-flow for each bus of the RDN, the VSI is extracted [31]. The potential of the voltage collapse is avoided via maximizing the VSI of the nodes. This can be achieved by optimum allocation of SCBs and RDGs in the distribution network. The details of estimating the VSI can be found in [30]. This index can be formulating by the following:
V S I ( j ) = | V i | 4 4 [ P j , e f f X i j Q j , e f f R i j ] 2 4 [ P j , e f f R i j Q j , e f f X i j ] | V i | 2

2.7. Derivation of the Objective Function

The objective function of optimum allocation of RDGs and SCBs into the existing distribution grids can be implemented as multi-objective. In multi-objective functions, the formulas can be divided into three categories. In the first category, the multi-objective function can be formulated as the summation of an individual single objective via weights. The second category considers the formulation of the multi-objective function as a multi-objective index that is turned into a single objective function based on a goal programming technique. In the third one, considering more than one contrasting objective and choosing the best solution between them as main objective. In this work, it is selected multi-objective index via appropriate weighting factors. This multi-objective function index (MOFI) approach is deduced to minimize the power loss, voltage level, and whole operational-cost of the RDN. MOFI can be formulated by (29):
M O F I = min ( λ 1 * Δ P l D G S C B + λ 2 * Δ V I D e v + λ 3 * Δ O C D G S C B )
where:
k = 1 3 λ k * = 1 λ k * [ 0 , 1 ]

Constrains of the Objective Function

The following constraints are taken into consideration during the optimization process:
The Bus voltage Vi:
V min V ( i ) V max
The voltage drop limit is limited as follows:
| V 1 V i | V D r max
The total SCB size j J Q j C can be restricted to the whole demand of the reactive power Q d e m by:
j J Q j C < Q d e m
The size boundaries of the RDGs are restricted to the total demand of the real power P d e m by:
j J P j D G < P d e m
The power line S l ( i ) (kVA) inflows within the branches are restricted by their maximum rating S l ( i ) r a t e d using (35):
S l ( i ) < S l ( i ) r a t e d

2.8. Sensibility Factors Analysis for RDGs and SCBs Location

The loss sensibility factor (LSF) has been used for estimating candidate buses for the SCBs and RDGs. The active power loss is formulated by (37), whereas the LSF real (PLSF(i,j)) and LSF reactive (QLSF(i,j)) for the RDGs and SCBs, respectively, are estimated through (38) and (39) respectively:
P l i n e l o s s ( i j ) = R i j ( P j , e f f 2 + Q j , e f f 2 ) V j 2
P L S F ( i , j ) = P l i n e l o s s P j , e f f = 2 P j , e f f R i j V j 2
and,
Q L S F ( i , j ) = P l i n e l o s s Q j , e f f = 2 Q j , e f f R i j V j 2

2.9. Types of Studied RDGs

Two different systems of RDGs (A) and (C) are deemed in this work. The RDG system (A) is selected as a photovoltaics system (PV) and fuel cell (FC) at a power factor (PF) = 1, which only delivers real power. The second RDG system (C) is considered as a wind turbine (WT) at an optimum PF of 0.8 to 0.95 that is able to deliver real and reactive power.
The PV, WT, and FC models are characterized as the following:
(A) The model of PV:
The PV power depends on the solar irradiance level and the temperature. The relation between the solar irradiance and the PV power can be described according to the following formula [32]:
P P V = { P P V r ( W W r ) , 0 W W r P P V r , W r W }
where, W and Wr are represented as the solar irradiance (W/m2) for the rated radiation and the elected placement at the earth’s surface (1000 W/m2). PPVr denotes the rated output power of PV at a temperature of 25 °C and solar radiation of (1000 W/m2).
It is important to know that Egypt has a high solar radiation intensity—an annual global solar radiation of over 2000 kWh/m2 [33,34].
(B) The model of WT:
In the WT model, the relation between the wind speed and the WT output power can be written as the following formulation [32]:
P P V = { 0 , 0 V V c i , o r V V c o P W r ( V V c i V r V c i ) , V c i V V r P W r , V r V V c o }
where, V, Vci, Vco, and Vr are considered as the wind speed at the site under study, the cut in the speed, the cut out speed, and the rated wind speed, respectively. PWr is represented as the rated output power of the wind at the rated speed.
(C) The model of FC:
The proposed scheme does not employed batteries for storing the energy. It only uses an electrolyzer supplied with the storing surplus output power of PV and WT units for their optimal uses, producing hydrogen (H2) from water by electrolysis. The H2 produced is then stored in a storage tank. It is then used to supply FC for later reuse when the PV power is less than the demand. The proton exchange membrane fuel cells (PEMFC) have attractive properties for the following reasons; lower operating temperatures, lower operating pressures, low pollutant emissions, and silent operation [35,36,37]. The hydrogen enters the anode of the FC and the oxygen enters the cathode. Protons and electrons are separated from hydrogen on the anode side. PEMFC consists of the anode, cathode, and the electrolyte [33]. At the anode; the hydrogen is divided into protons and electrons with the aid of a platinum catalyst. The protons transfer from the anode to the cathode, and then it is attracted to the cathode, while the electrons pass through an external load and produce a FC terminal voltage. The protons and electrons are recombined at the cathode side reacting with oxygen to produce heat and water.
The FC chemical reactions can be described as follows [38]:
H 2 2 H + + 2 e
O 2 + 4 e 2 O 2
H 2 + 1 2 O 2 H 2 O + e l e c t r i c a l e n e r g y + h e a t
Three types of losses occur inside the PEMFC; activation, ohmic, and concentration losses, therefore; the terminal voltage of PEMFC can be written as:
V F C = E N e r n e s t V a c t V o h m V c o n
where, Vact denotes the activation voltage loss, Vohm denotes the ohmic voltage loss, Vcon denotes the concentration voltage loss, and ENernest is the thermodynamic potential given by the following equation:
E N e r n e s t = 1.229 0.85 × 10 3 · ( T c 298.15 ) + 4.3085 × 10 5 · T c · ln ( P H 2 P O 2 )
where, Tc is the cell temperature in Kelvin, and PH2 and PO2 are the partial pressures of hydrogen and oxygen respectively.
The activation voltage loss can be given as follows [37]:
V a c t = [ ξ 1 + ξ 2 · T + ξ 3 · T · ln ( C O 2 ) + ξ 4 · T · ln ( I ) ]
where, ξ1, ξ2, ξ3, ξ4 are the FC model parametric coefficients, and CO2 is the oxygen concentration.
The ohmic voltage loss is produced due to the equivalent resistance of the FC:
V o h m = I · ( R M + R C )
where, RC is the contact to the electron conduction equivalent resistance, and RM is the equivalent resistance of membrane to proton conduction:
R M = ρ M · l t h A
where, ρM is the membrane specific resistivity, lth is the thickness of membrane, and A is the water content of membrane.
The concentration voltage drop is formulated by (50):
V c o n = b · ln ( 1 I A I max )
where, b is the concentration loss constant, and Imax is the maximum current destiny. The FC composes n cells interconnected in series; therefore, the stack terminal voltage is as follows:
V s t a c k = n · V F C = n · ( E N e r n e s t V a c t V o h m V c o n )

3. Salp Swarm Algorithm-Based Strategy

Mirjalili et al. [39] presented an optimization approach, SSA, motivated from the navigation and foraging behavior of salp deep in the ocean. These creatures combine and form a swarm or a salp chain. The salp chain tries to find the best location of food via searching process with the help of a leader salp, with the others as followers. The algorithm starts with initializing a matrix with a dimension of n × dim representing salps’ positions, where n is the number of agents and dim is the number of variables to be designed. After that, each salp position is updated according to instructions received from the leader for swallowing the best food (F). The following equation is used for updating the salps’ positions [40,41]:
X j 1 = { F j + c 1 ( ( u b j l b i ) c 2 + l b j ) ,     c 3 0 F j c 1 ( ( u b j l b i ) c 2 + l b j ) ,       c 3 < 0
where, X j 1 is the siting of the first salp leader in the j-th dimension, Fj shows the siting of the food source in the j-th dimension, u b j / l b i indicate the upper/lower boundaries of j-th dimension c2, and c3 are random numbers. Equation (52) illustrates that the salp leader only updates its siting in accordance with the food source.
The coefficient c1 is a very significant parameter in SSA for the reason that it maintains a balance between exploration and exploitation, and it can be given by:
c 1 = 2 e ( 4 l L ) 2
where l is the current iteration and L is the maximum number of iterations. In fact, random numbers dictate if the next siting in j-th dimension should be towards positive infinity or negative infinity, as well as the step size. To update the position of the followers, the following equations are utilized (Newton’s law of motion):
c 1 = 2 e ( 4 l L ) 2
where, i ≥ 2, x j 1 shows the position of the i-th follower salp in the j-th dimension, t is time, v0 is the initial speed, and a = v f i n a l v 0 , where v = x x 0 t . Because the time of the optimization is an iteration, the discrepancy between the iterations is equal to 1, and considering v 0 = 0 , this equation can be expressed as follows:
x j i = 1 2 a t 2 + v 0 t
In accordance with (52) and (54), the salp chains are modeled.
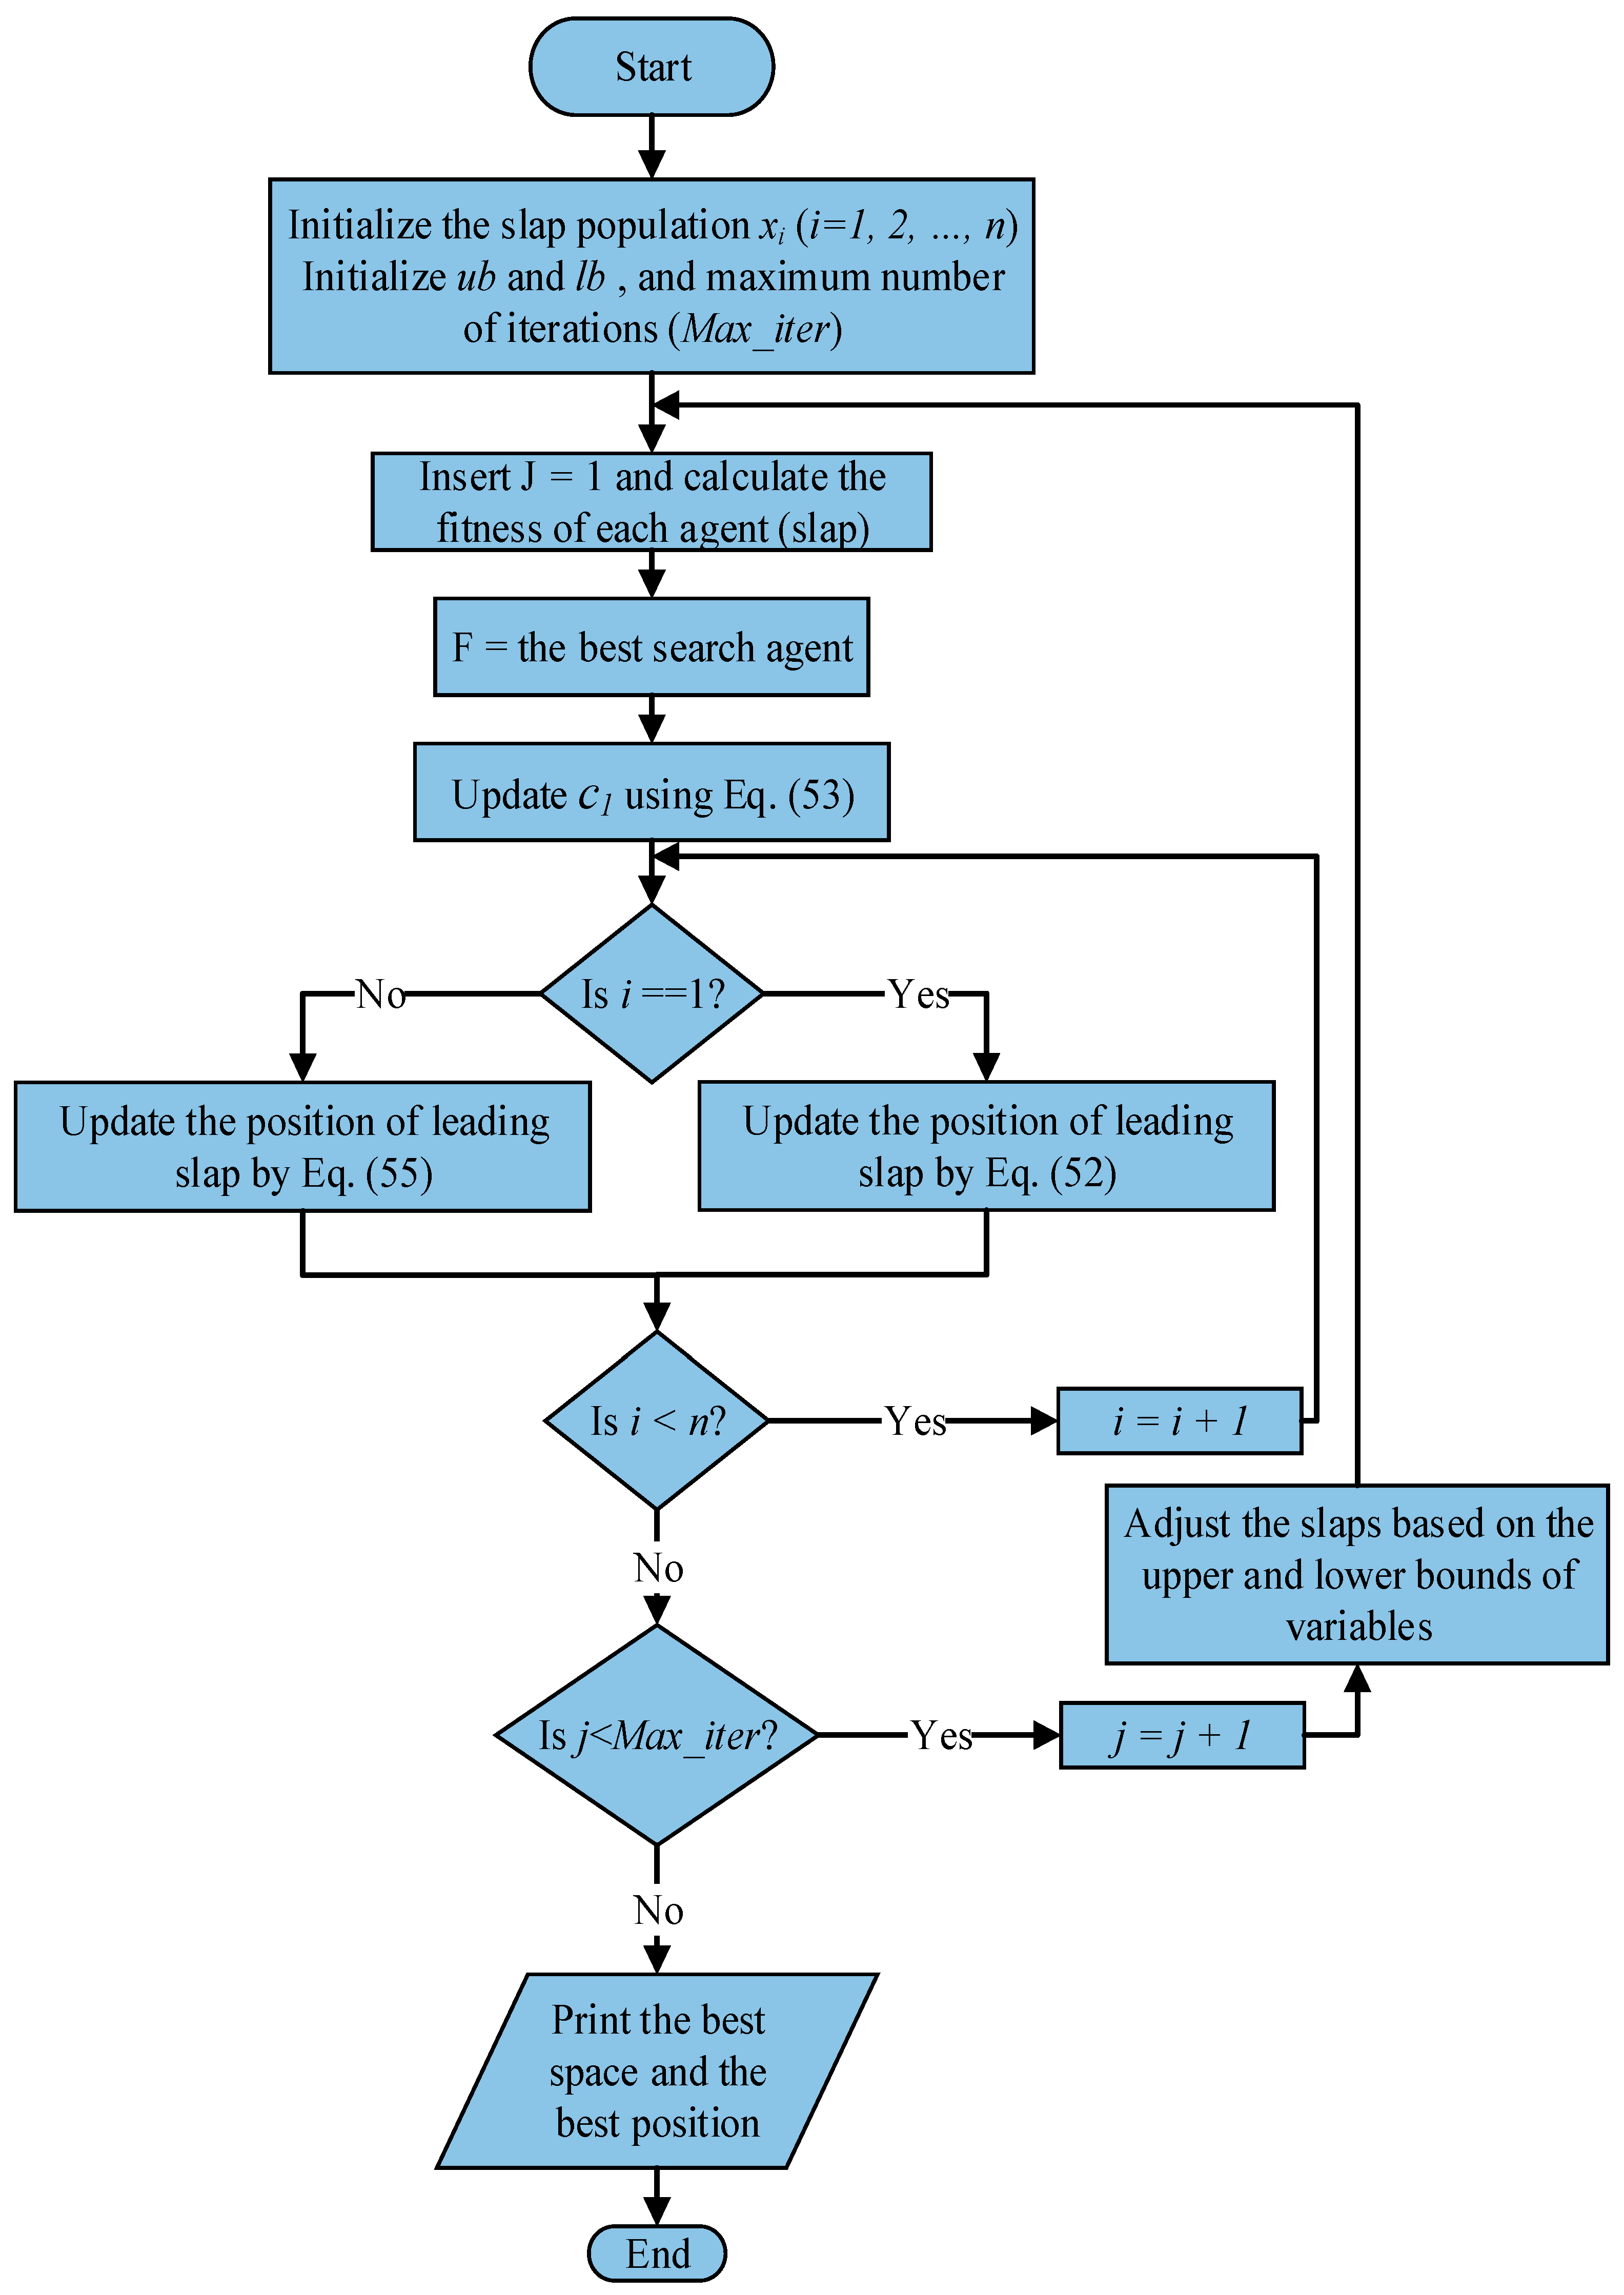
In this regard, the main steps of the SSA methodology are demonstrated in Figure 2. The SSA technique begins the optimization process by initializing multi-salps via random sittings. Consequently, it evaluates the fitness of every salp, discovers the salp via the best fitness, and assigns the position of the best salp to the variable F as the source food to be chased by the salp chain. Meantime the coefficient c1 is updated using Equation (53). For each dimension, the position of leading salp is updated using Equation (52) and the positions of the follower salps are updated utilizing Equation (54). If any of the salp goes outside the search space, it will be brought back to the boundaries. Note that the salp population’s xi are considered as the active and reactive power of the RDGs and SCBs, and nb are the node numbers. All of these strides without the initiating phase are iteratively performed until the satisfying of an end criterion. However, the food source will be renewed within the optimization operation inasmuch as the salp chain is likely to get a better solution by exploring and exploiting the space around it. The salp chain has the potential to go forward to the most favorable solution’s global-optimum, which modifies along the iterations [39]. The adaptive operation of SSA permits the avoidance of local solutions, and lastly discovers an accurate evaluation of the best solution obtained within optimization operation.
The problem of optimal sizing and allocation of DGs is similar to many optimization problems that need a robust optimizer to obtain a good solution. Although the advantages of numerous modern optimization algorithms have been noted in the literature, it has been demonstrated by the No-Free-Lunch theorem [42] that none of these algorithms can solve all optimization problems. This theorem reveals the significance of new optimizers in different fields because the validation of certain optimizer to deal a set of problems does not guarantee its success in dealing with other problems. For example, a recently suggested SSA by Mirjalili [38] was not employed in the field of optimal sizing and allocating of DGs. SSA has been tested by many mathematical functions [43]; in addition, it has been used with global maximum power point tracking of photovoltaic systems [39]. It has been proven that the SSA algorithm is able to improve initial random solutions effectively and converge towards an optimal solution. This urges us to employ SSA to deal the problem of optimal sizing and allocation of DGs.

4. Simulation Investigation Results

The proposed schemes using the SSA, GOA, and PSOGSA algorithms were performed via MATLAB software (2015a, USA). The simulation results were investigated in two basic parts. In the first part (A), a comprehensive analysis between the studied techniques was implemented in two scenarios to prove and illustrate the most superior and effective technique to solve the optimal problems of the RDG and SCB installations. The second part (B) was considered as a study on the impact of the incorporation of RDGs and SCBs on the distribution grid by superior techniques. For distribution grids, the detailed data at different load levels, electricity price, and energy price, are introduced in Table 1 [44]. Table 2 shows the parameters of each optimizer.
A. Comprehensive Analysis of Novel Techniques
The studied algorithms were performed and they satisfied the 33-Bus IEEE standard RDN [27,28]. The 33-Bus model is drawn in Figure 3. To verify the prepared mechanisms via the MOFI, two scenarios were assumed. In Scenario A, it three RDG units of PV type at unity PF and three SCBs devices were considered. Scenario B considers one PV and two WT at optimal PFs, in addition to three SCBs devices.
The aim of the current work was to discover the most optimum status that assured minimum power losses and the whole operational-cost, in addition to the high enhancement of the voltage level, and energy savings by the means of incorporating RDGs and SCBs. Therefore, the selection of weighting factors λ 1 * , λ 2 * and λ 3 * was tested to be very suitable for this operation. Different values of the weighting factors of the main objective functions MOFI were tested on the 33-bus distribution grid (Scenario A), based on the SSA technique, and the results are shown in Table 3. From this table, to minimize system power losses and the MOFI objective function without violating the voltage limits or increasing ΔOCDGSCB, the best values of weighting factors were 0.5, 0.4 and 0.1 at iteration 6.
Although iterations 12 and 13 had low TOCT,DGSCB and MOFI values besides the high minimum voltage (Vmin) level in comparison with iteration 6, iterations 12 and 13 had a high amount of RDG values, with a high value of total system power losses. Therefore, the 6th iteration was considered as a suitable iteration.
Comprehensive analysis: The PLSF and QLSF values in Figure 4 are based on (38) and (39). The GOA and SSA algorithms elected the most favorable nodes from the PLSF and QLSF methods for the location and capacity of RDGs (nodes: 6, 14, and 31) and SCBs (nodes: 6, 17, and 30) optimally. However, the PSOGSA selected for the RDG location (nodes: 6, 13, and 31) and for the SCB location (nodes: 8, 14, and 30).
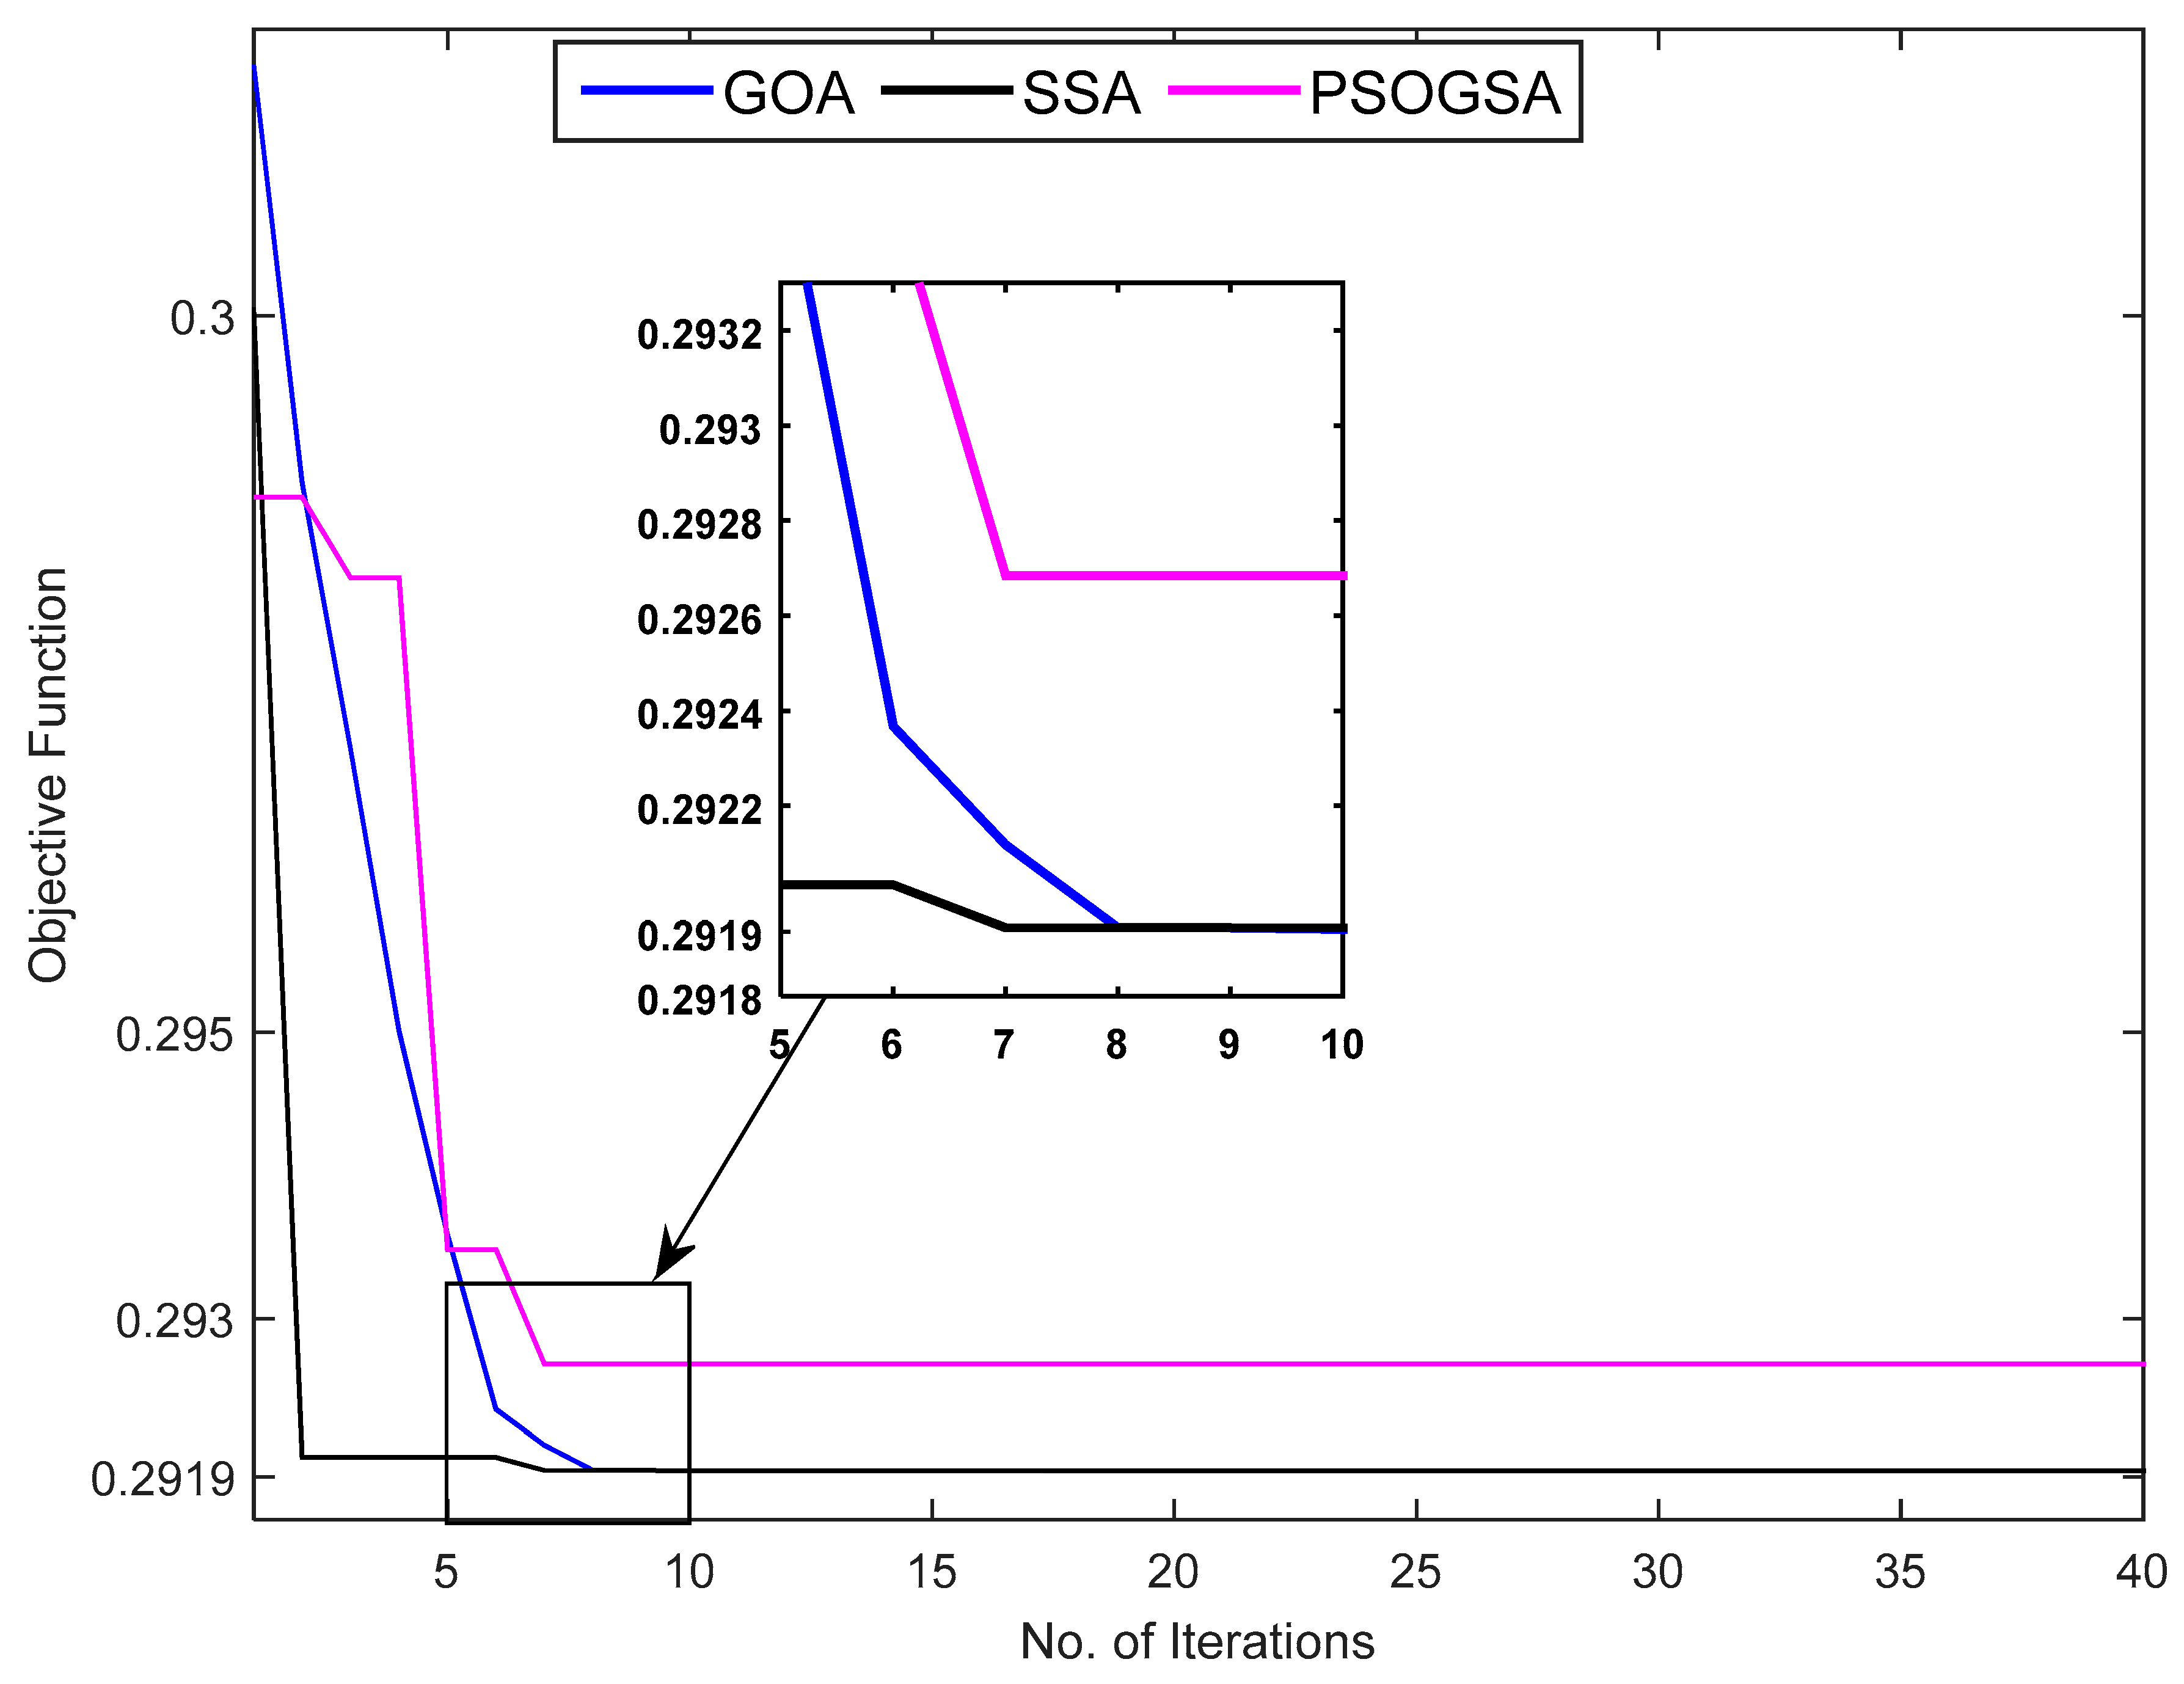
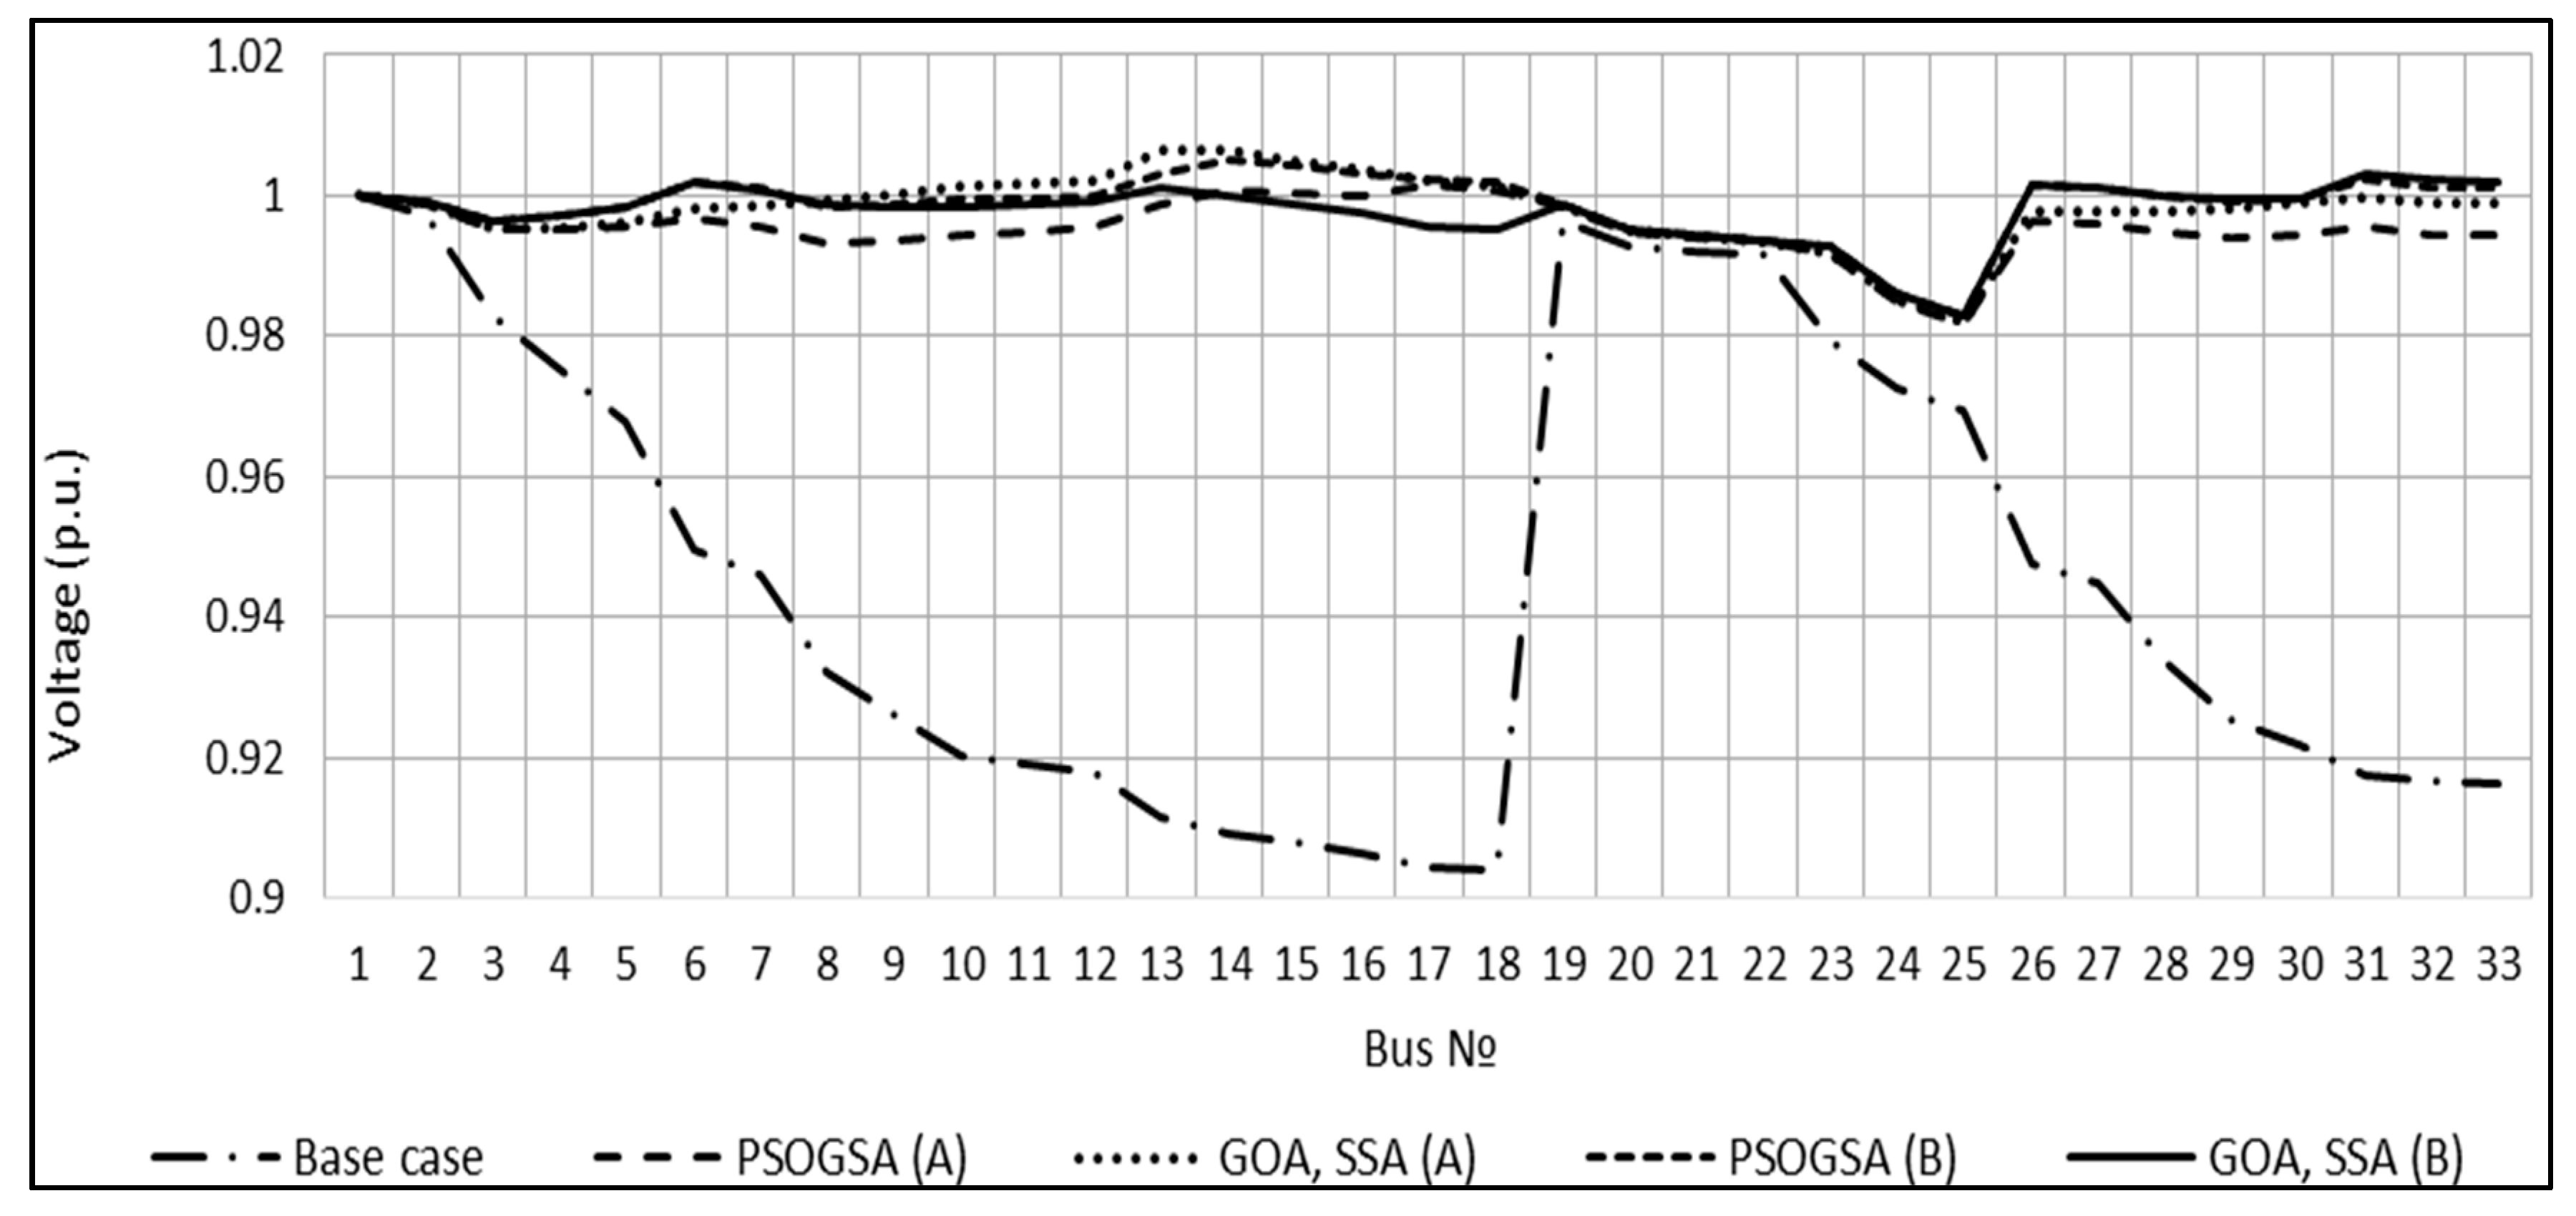
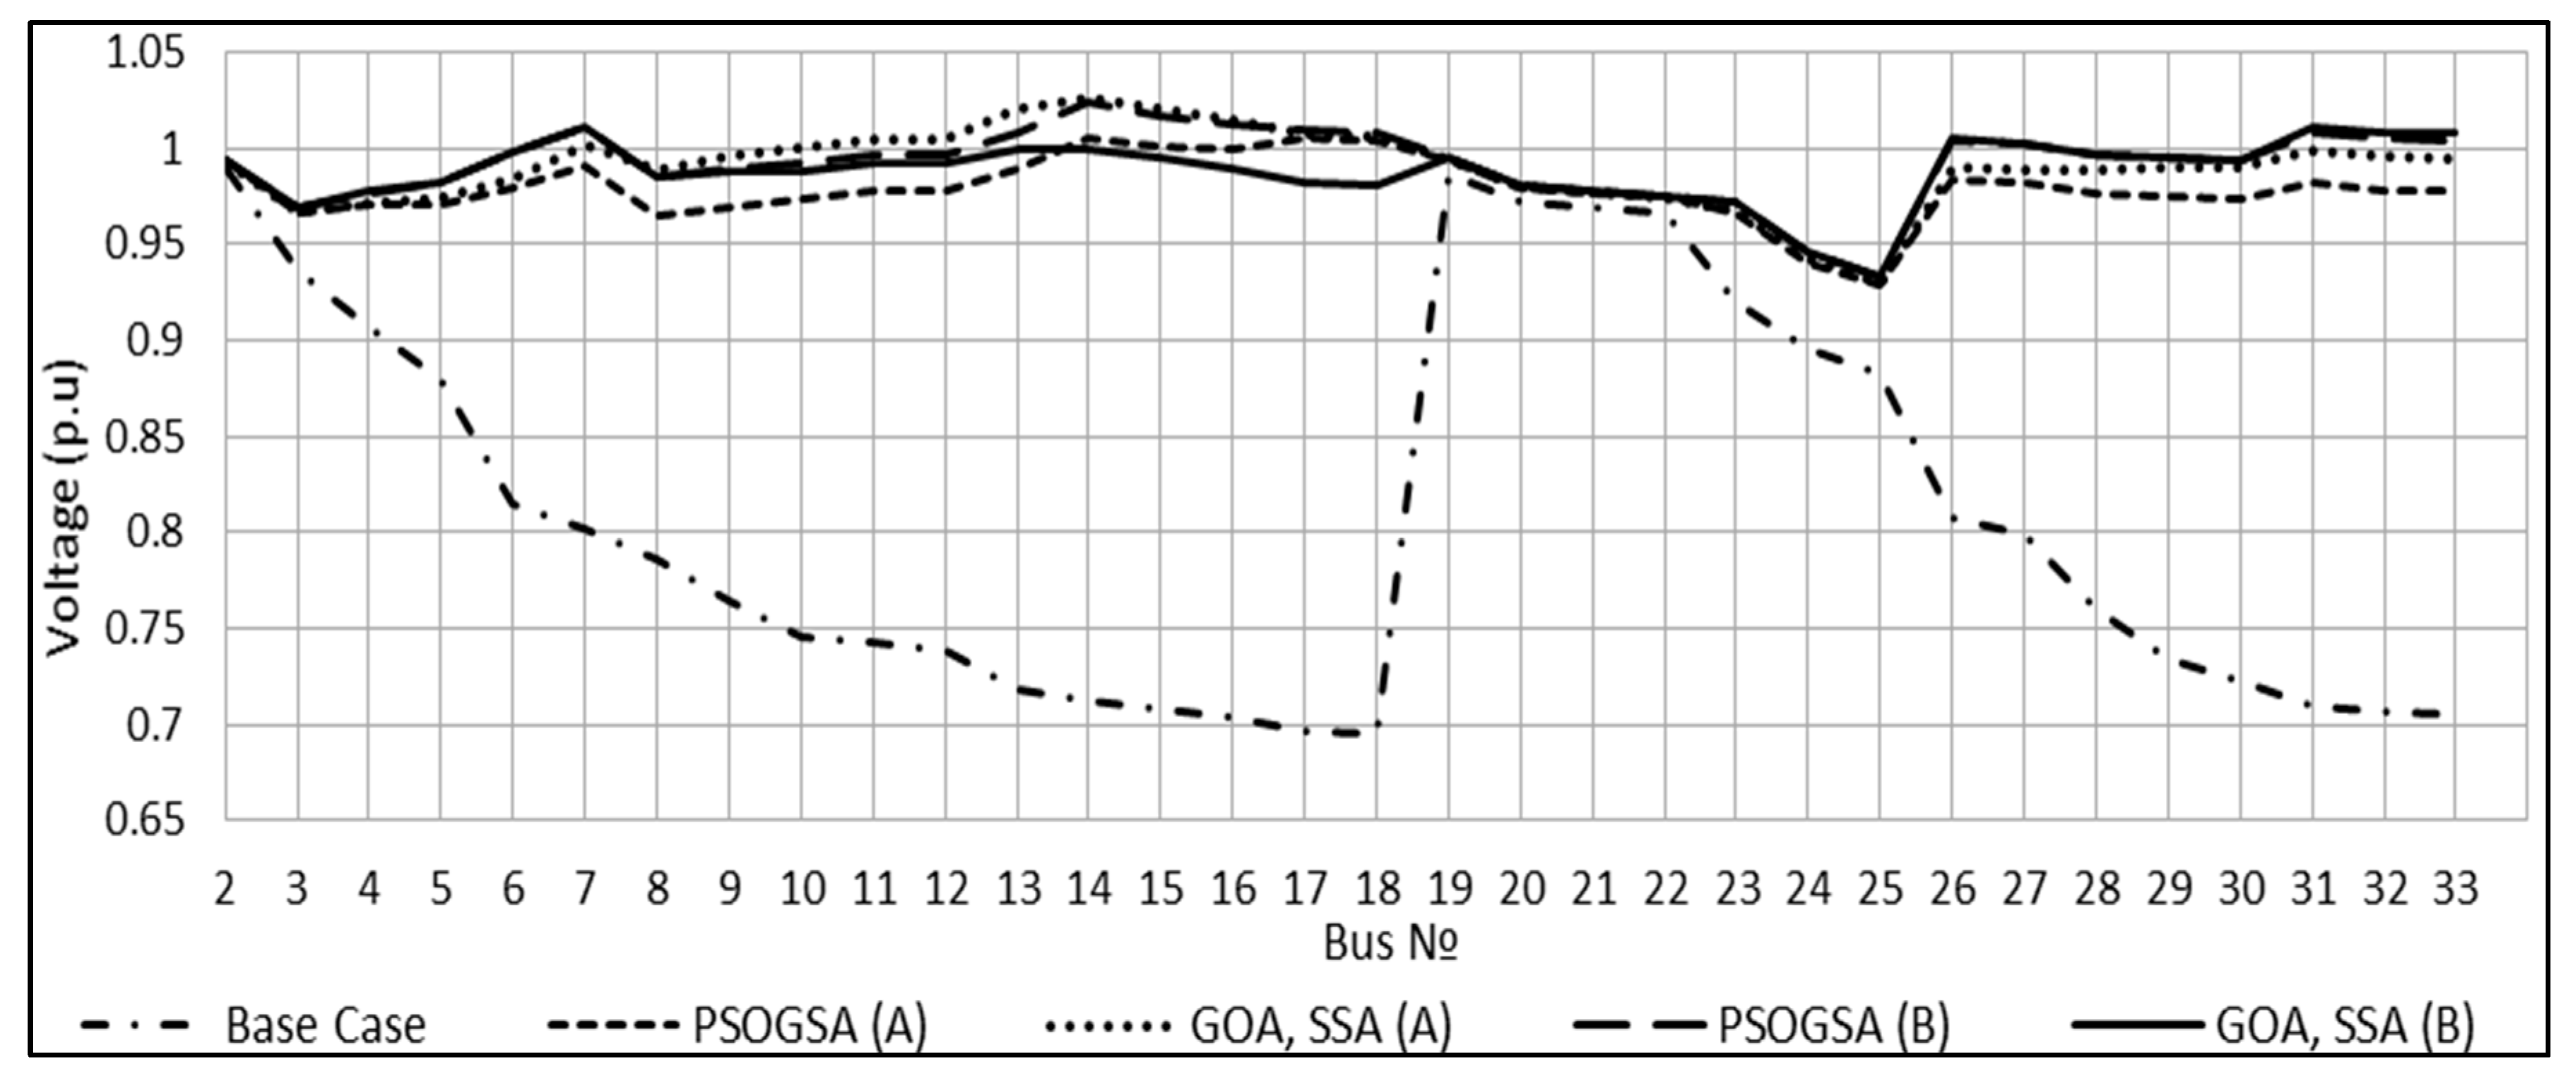
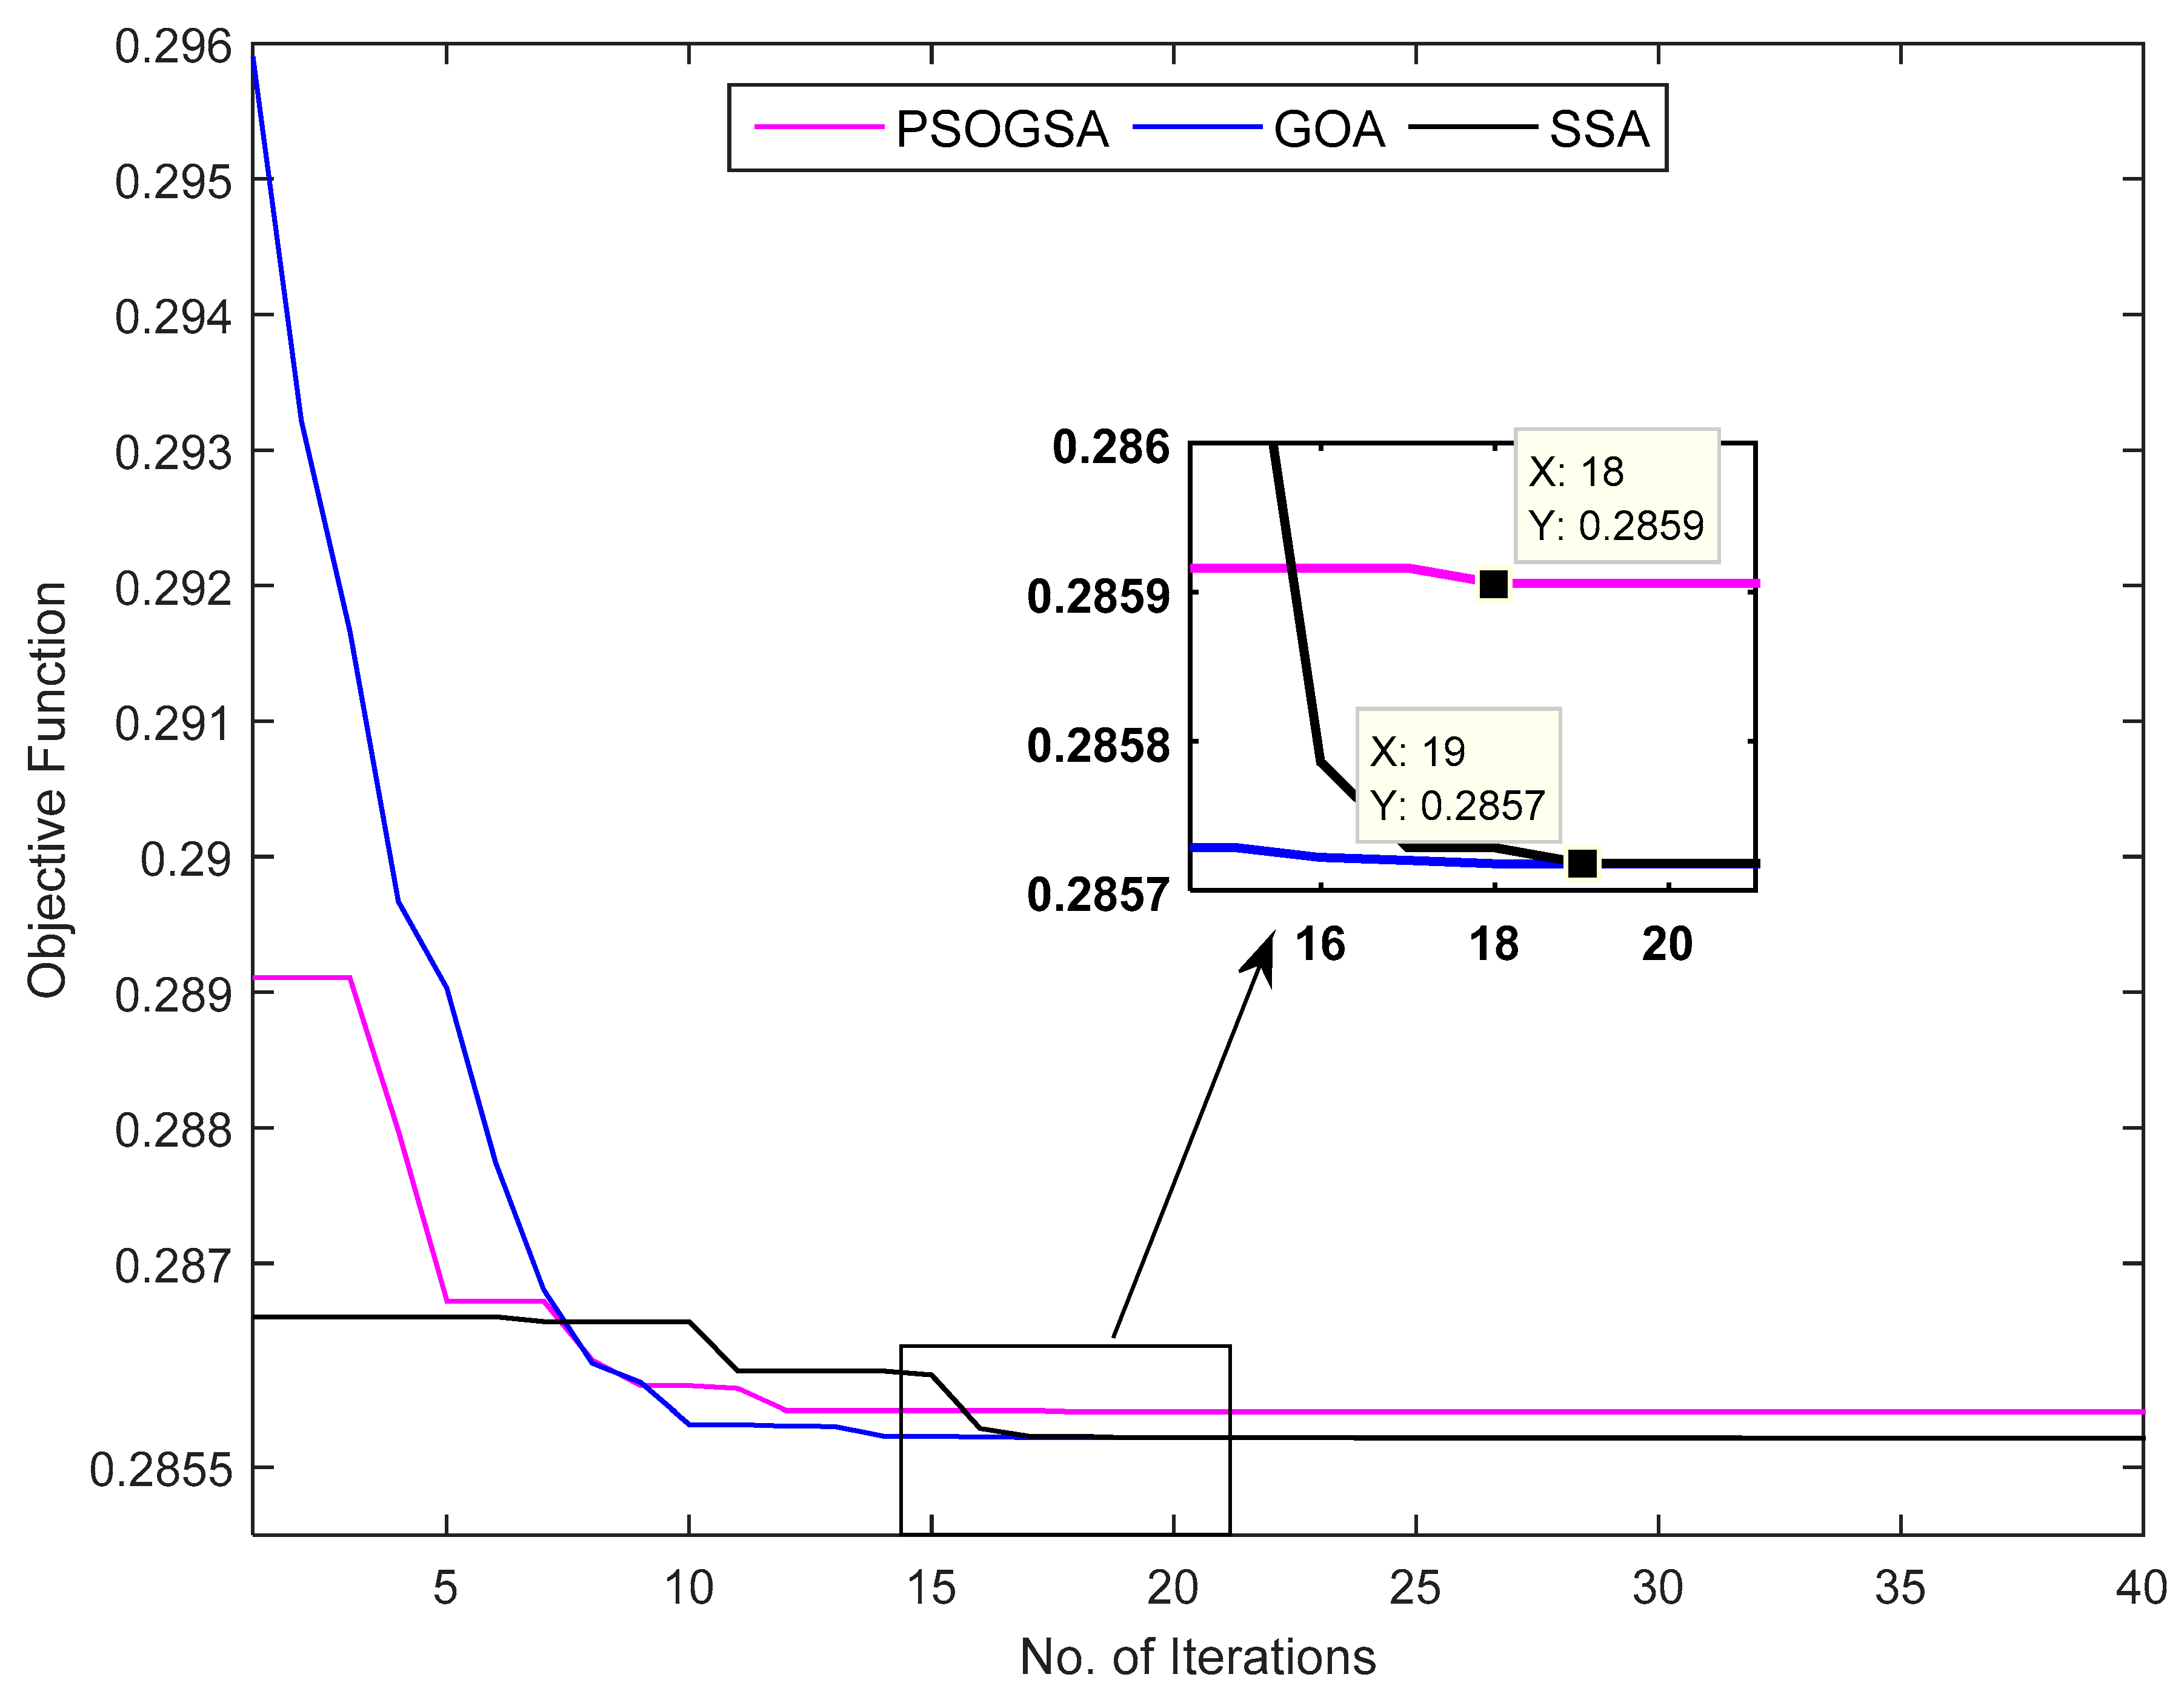
In Scenario A, Table 4 illustrates the influence of locating the multi-combinations of both the RDGs and SCBs on the 33-Bus RDN by several new techniques. Figure 5 shows the MOFI objective function trend with the number of iterations for each optimization algorithm. Moreover, the influence of the compensation units on the voltage levels and the voltage stability index levels based on different optimizers are shown in Figure 6 and Figure 7. In this regards, based on the comprehensive analysis between these optimizers, although the SSA and GOA had the same results, the SSA was the fastest technique and it could find the optimal solutions by 5.30 s with seven iterations. The SSA and GOA had the best results in comparison with PSOGSA.
In Scenario B, according to Table 4 and Figure 8, the SSA was the fastest technique and it could reach the optimal solutions in 10.84 s within 19 iterations. Figure 6 and Figure 7 show the effect of the installation of RDGs and SCBs simultaneously on voltage levels, and the VSI profile of the 33-Bus system. According to the numerical results in Scenario A and Scenario B, the results of Scenario B are better than in Scenario A. Moreover, the SSA and GOA techniques minimized the total system losses of power and energy and the total operating costs sufficiently. Besides, the voltage levels in Scenario B were higher than the levels in Scenario A. The proposed SSA and GOA techniques had the same results, and the trend of the objective function of MOFI was not enough to illustrate the best technique between them.
Therefore, the suitable way for the comprehensive analysis of these new techniques was done based on the statistical performance evaluation of each technique in both scenarios. In this regard, for evaluating the performance of proposed algorithms, five different metrics that are explained in Table 5 were taken into consideration. Table 6 illustrates the performance evaluation of four different optimization algorithms. Considering Table 6, one can see that the statistical evaluation confirmed that the SSA optimizer was a better algorithm compared to the other algorithms. It had a minimum values of root mean square error (RMSE). The SSA technique proved its superiority, accuracy, and high performance to detect the solutions optimally for RDGs and SCBs on distribution grids. Therefore, this superior technique was selected to study the effect of the incorporation of RDGs and SCBs on the distribution grid in different scenarios, and cases are discussed in the following section.

5. The Egyptian System

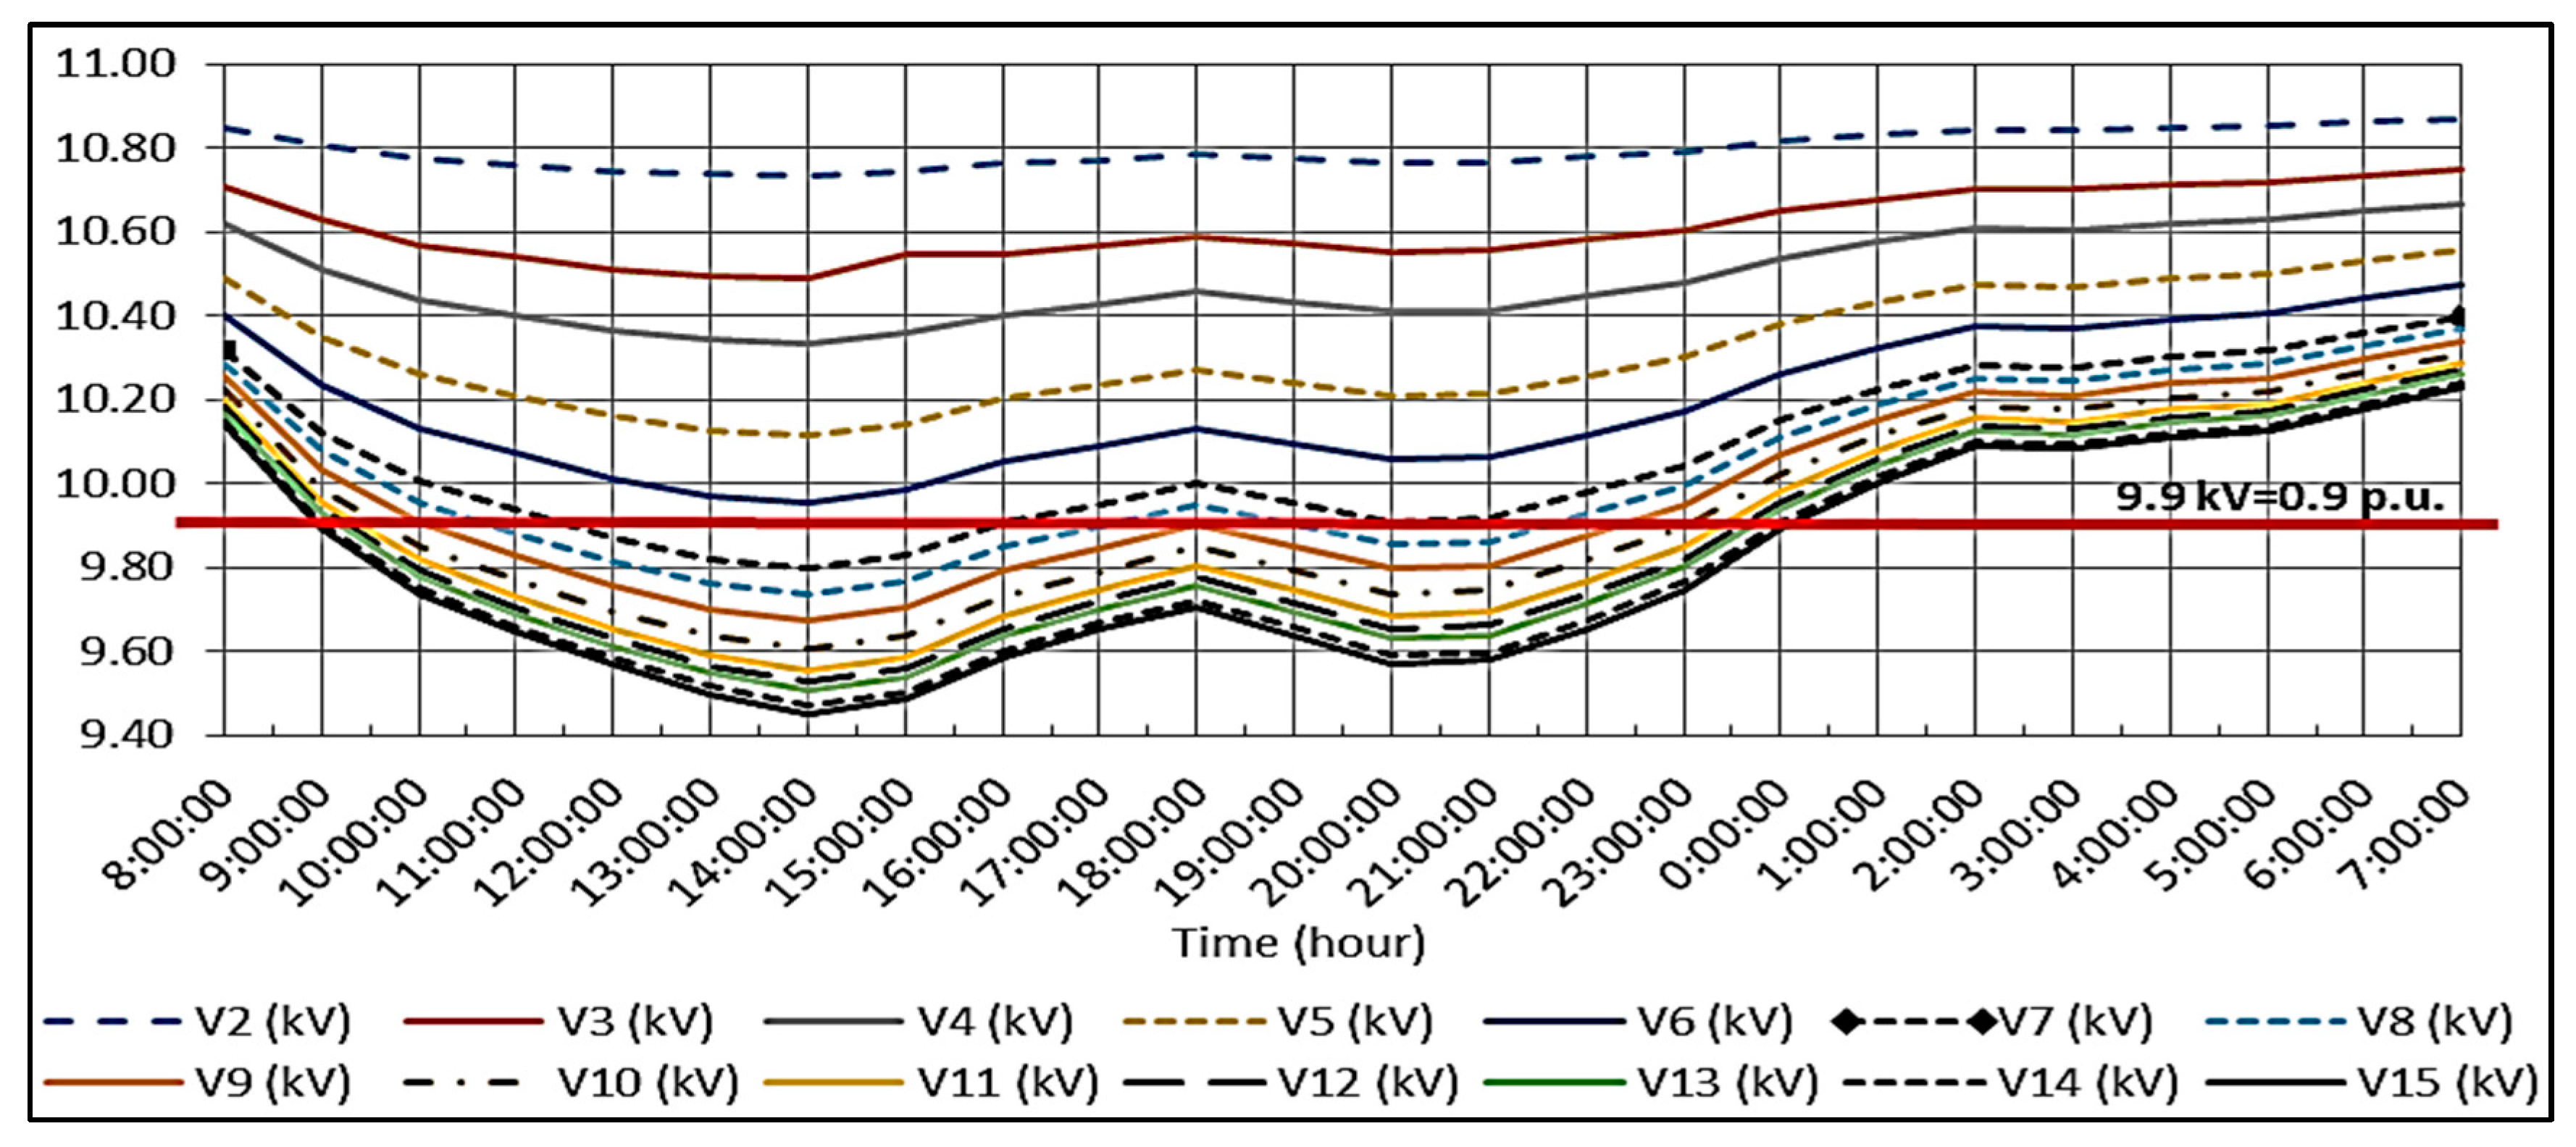
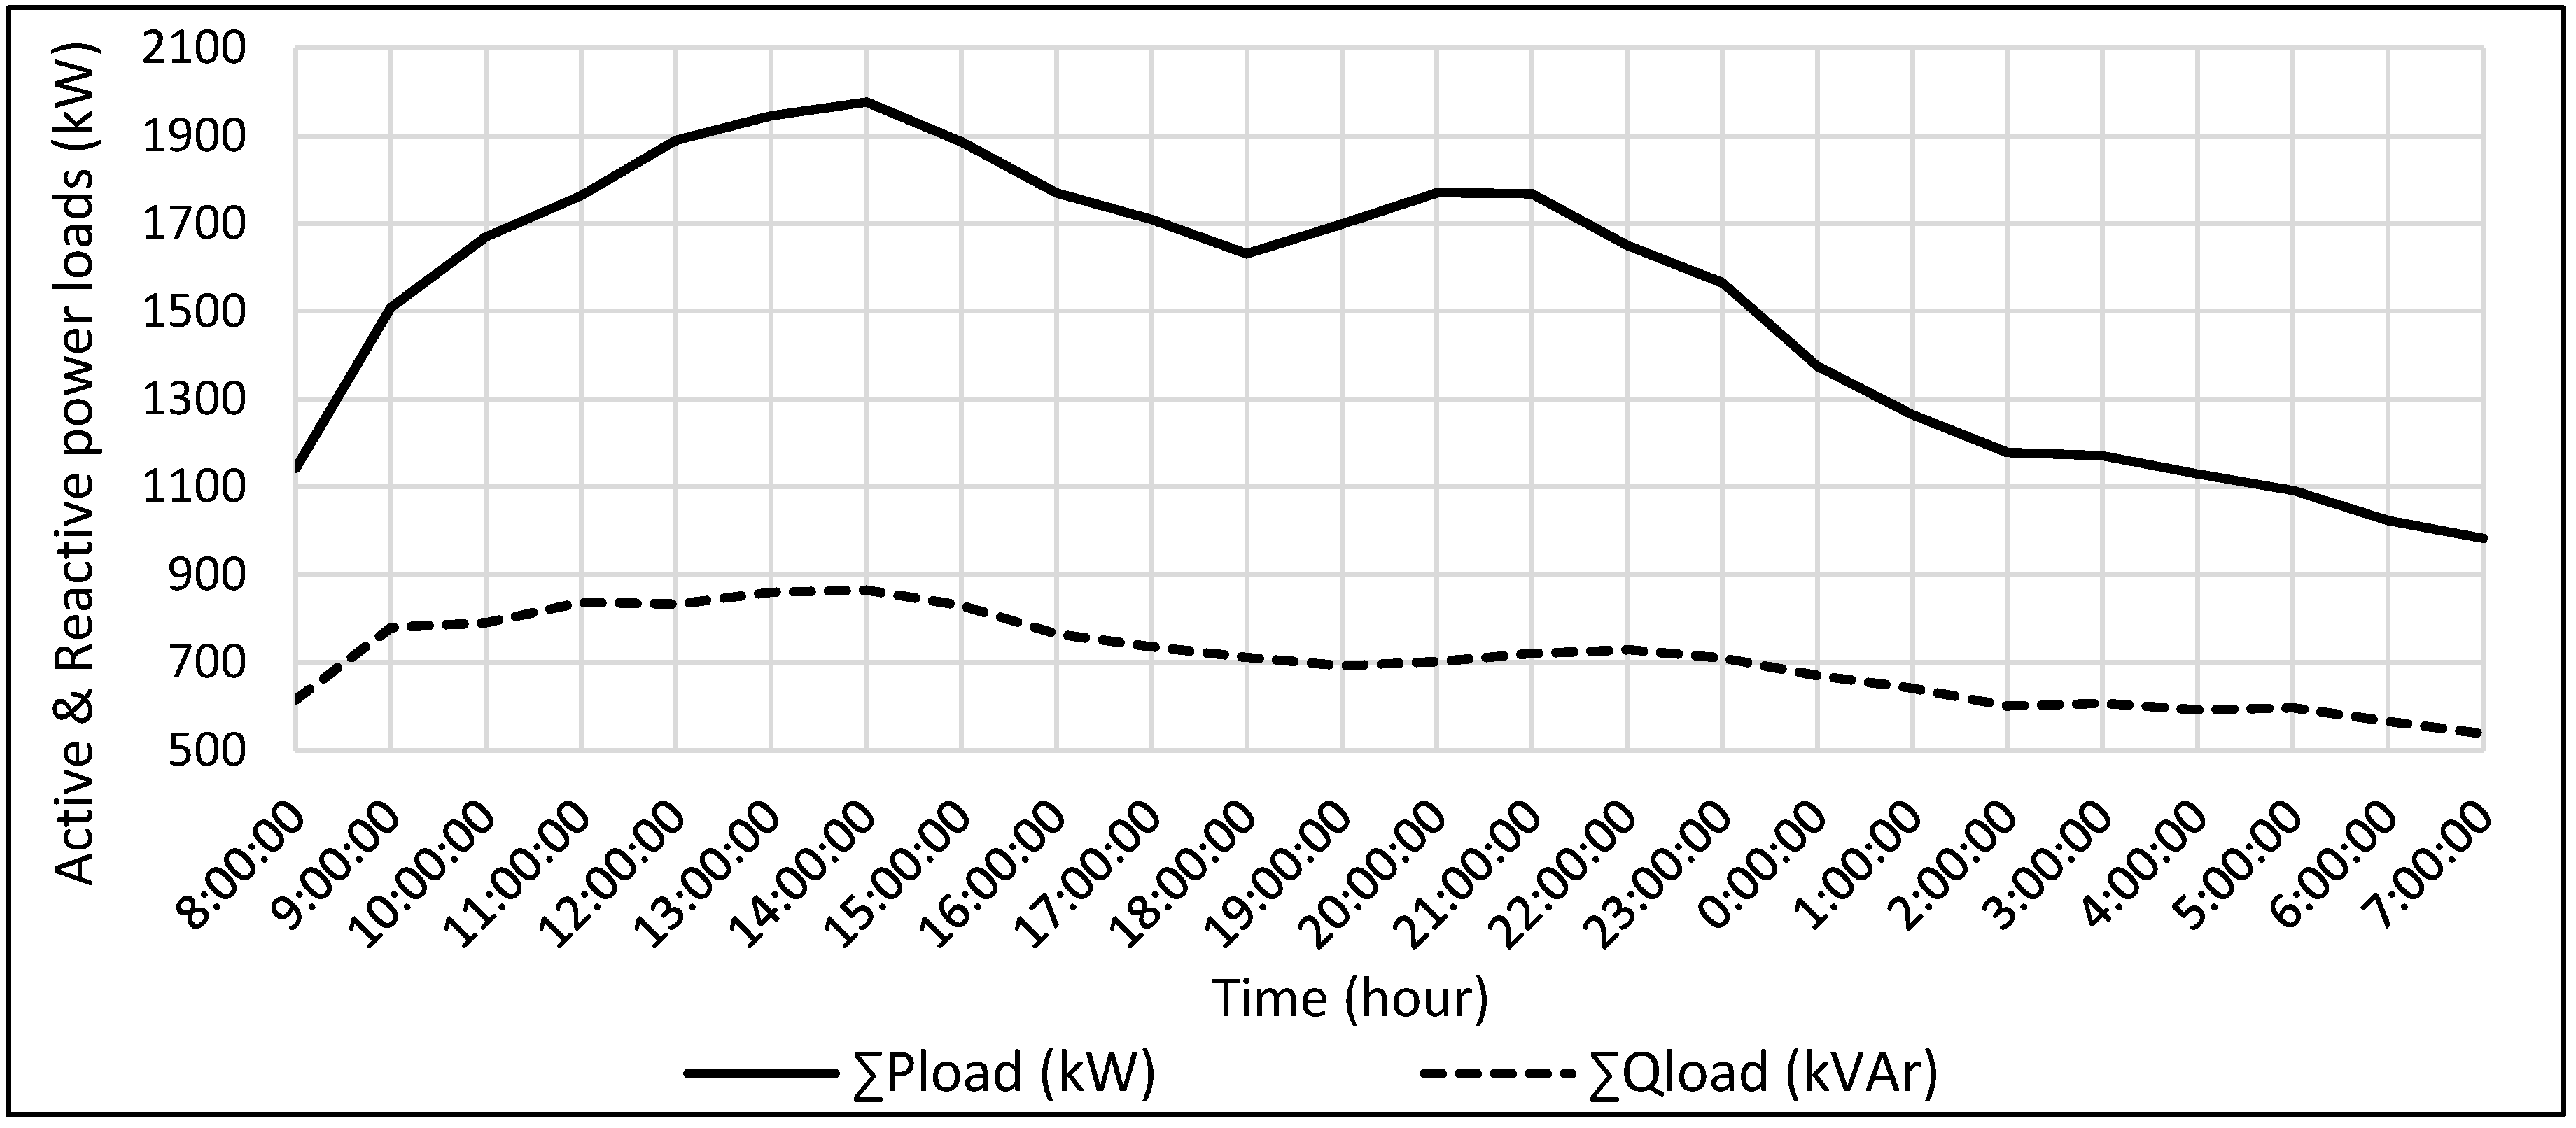
Middle Egypt Distribution Network (MEDN) has been considered as a case study for analyzing and deducing PQ issues. It has serious demands that are suffering from voltage levels deteriorations. These deteriorations are considered as a significant issue in PQ. The practical measurements and analysis study can be found in details in [45]. The 15 bus system that was measured and analyzed, is illustrated in Figure 9 [45]. In Figure 10, the voltage deviations over 24 h for all buses is demonstrated. The power load profile is explained in Figure 11.
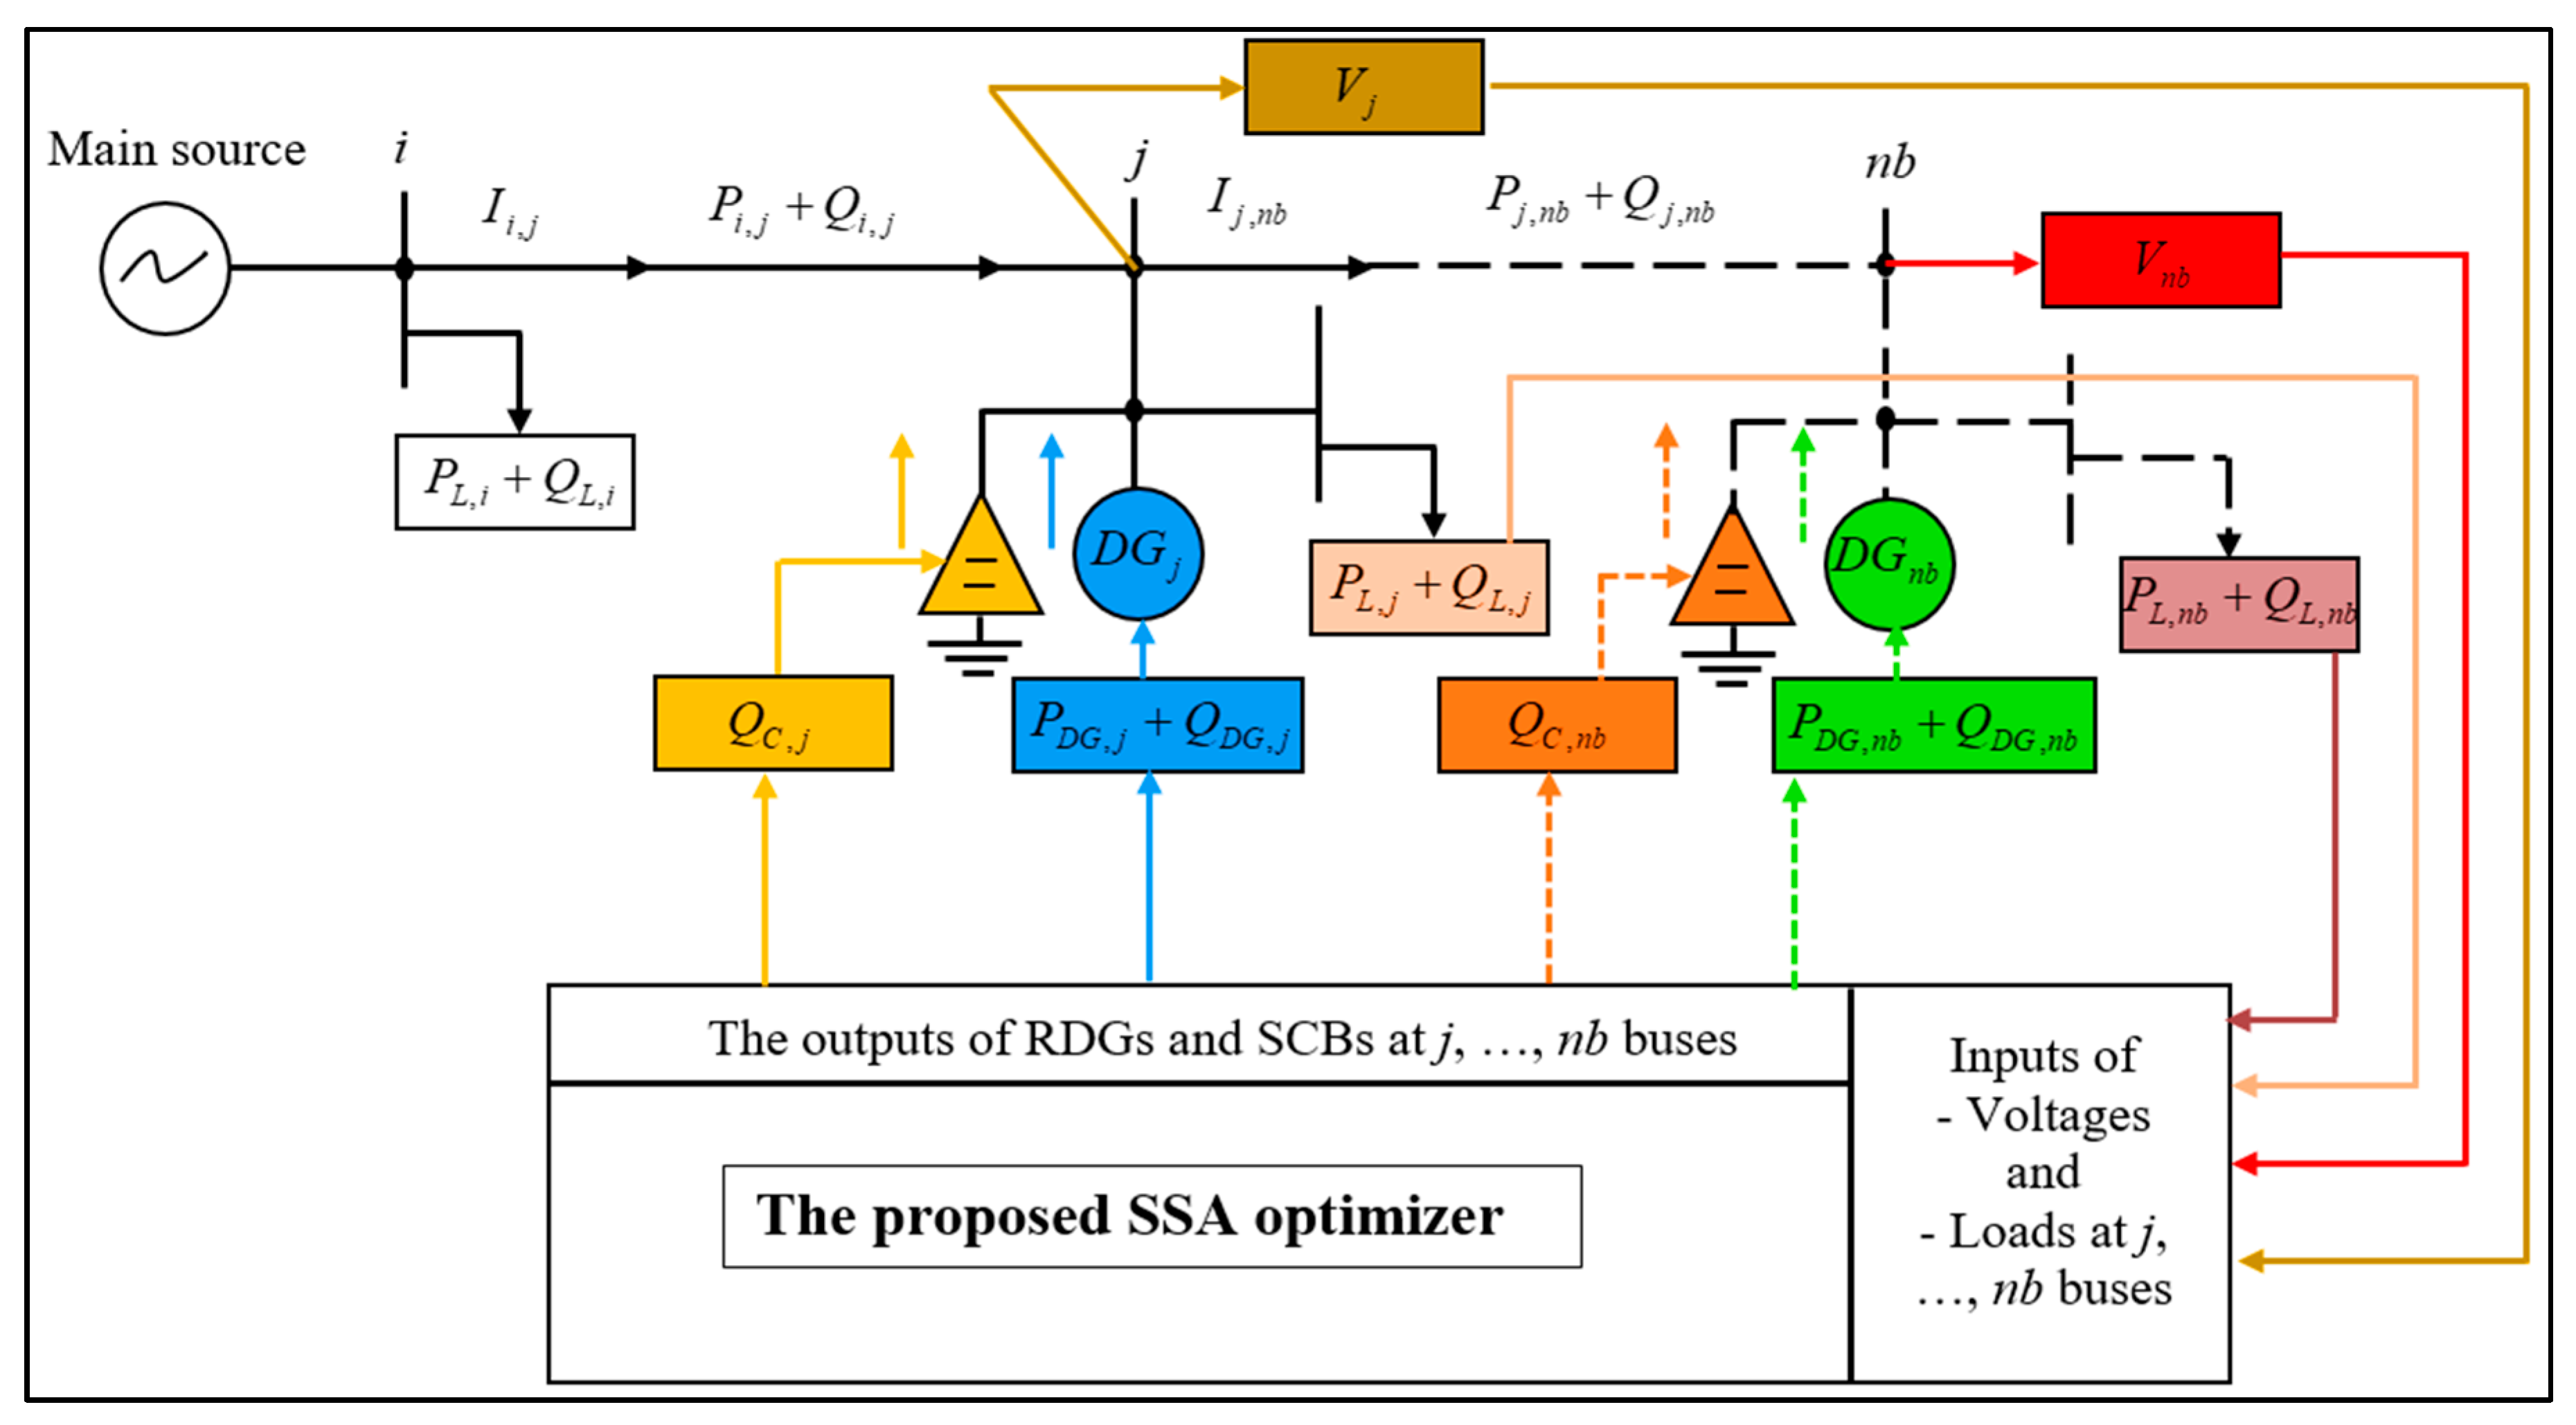
Based on the previous numerical results besides the practical measurement and analysis on the Egyptian grid, the optimal placement and capacity of the RDGs and SCBs in the distribution grids was considered as the best and most appropriate solution to overcome the problems that affected the Egyptian case study of MEDN, such as high power losses and total operating costs, in addition to the degradation in power quality, which was represented in the low voltage profile levels. The minimum voltage at the high side (11 kV) was deduced as 0.8593 p.u., therefore the minimum voltage at the low side (0.4 kV) for the last consumer may reach a smaller value, which is considered a dangerous situation. The SSA optimizer proved its superiority with high performance and accuracy for solving the problems of RDG and SCB locations and capacities simultaneously; thus, the SSA optimizer was used for the Egyptian case study, MEDN. Moreover, the SSA was used as a controller based on switches and selectors to regulate the RDG and SCB systems over 24 h for the proposed case study of MEDN. The operation of the proposed SSA optimizer of the MEDN case study is illustrated in Figure 12. In this figure, the SSA optimizer as a controller collected input data such as voltages (i.e., V j and/or V n b ) and active/reactive power loads (i.e., P L , j + Q L , j and/or P L , n b + Q L , n b ) at critical nodes to locate the RDGs and/or SCBs with optimum size based on sensors, then at each hour, the SSA selected the optimum capacity for the integrated devices (i.e., as outputs from SSA) of the RDGs ( P D G , j + Q D G , j and/or P D G , n b + Q D G , n b ) and/or SCBs ( Q C , j and/or Q C , n b ), based on the binary decision selector (0 or 1) for the switches at the optimum selected location by the same technique according to the hour operation.

5.1. Simulation Characteristics of the PV and WT Systems for MEDN

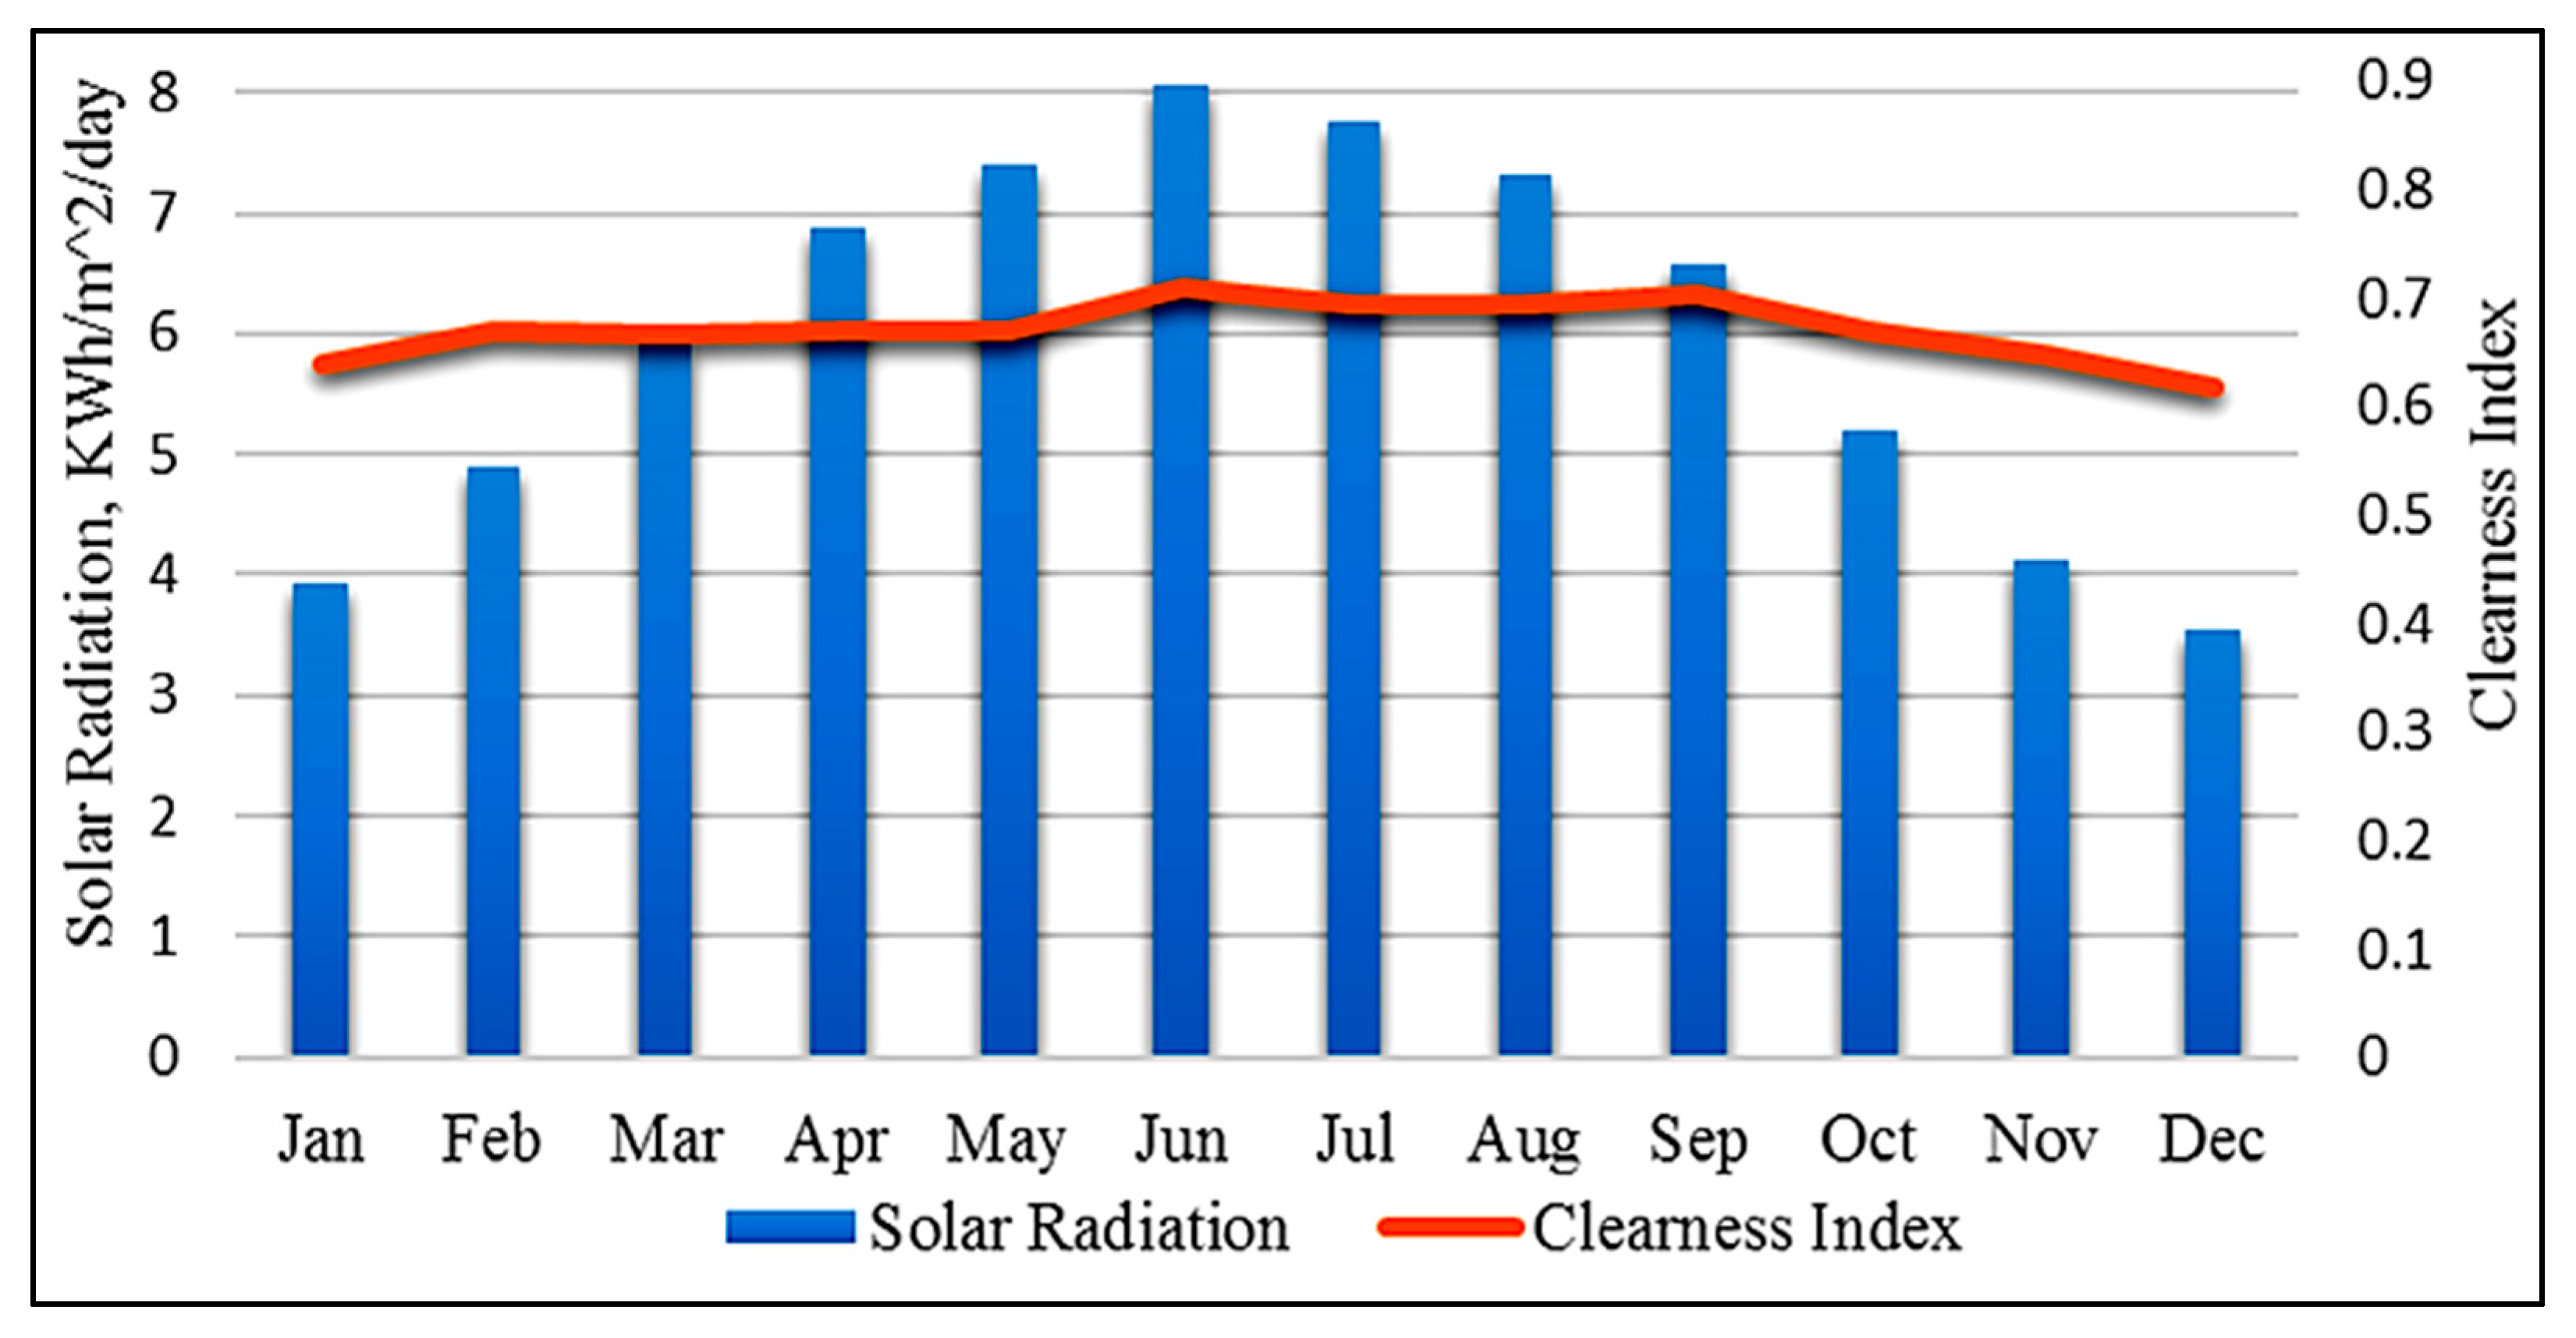
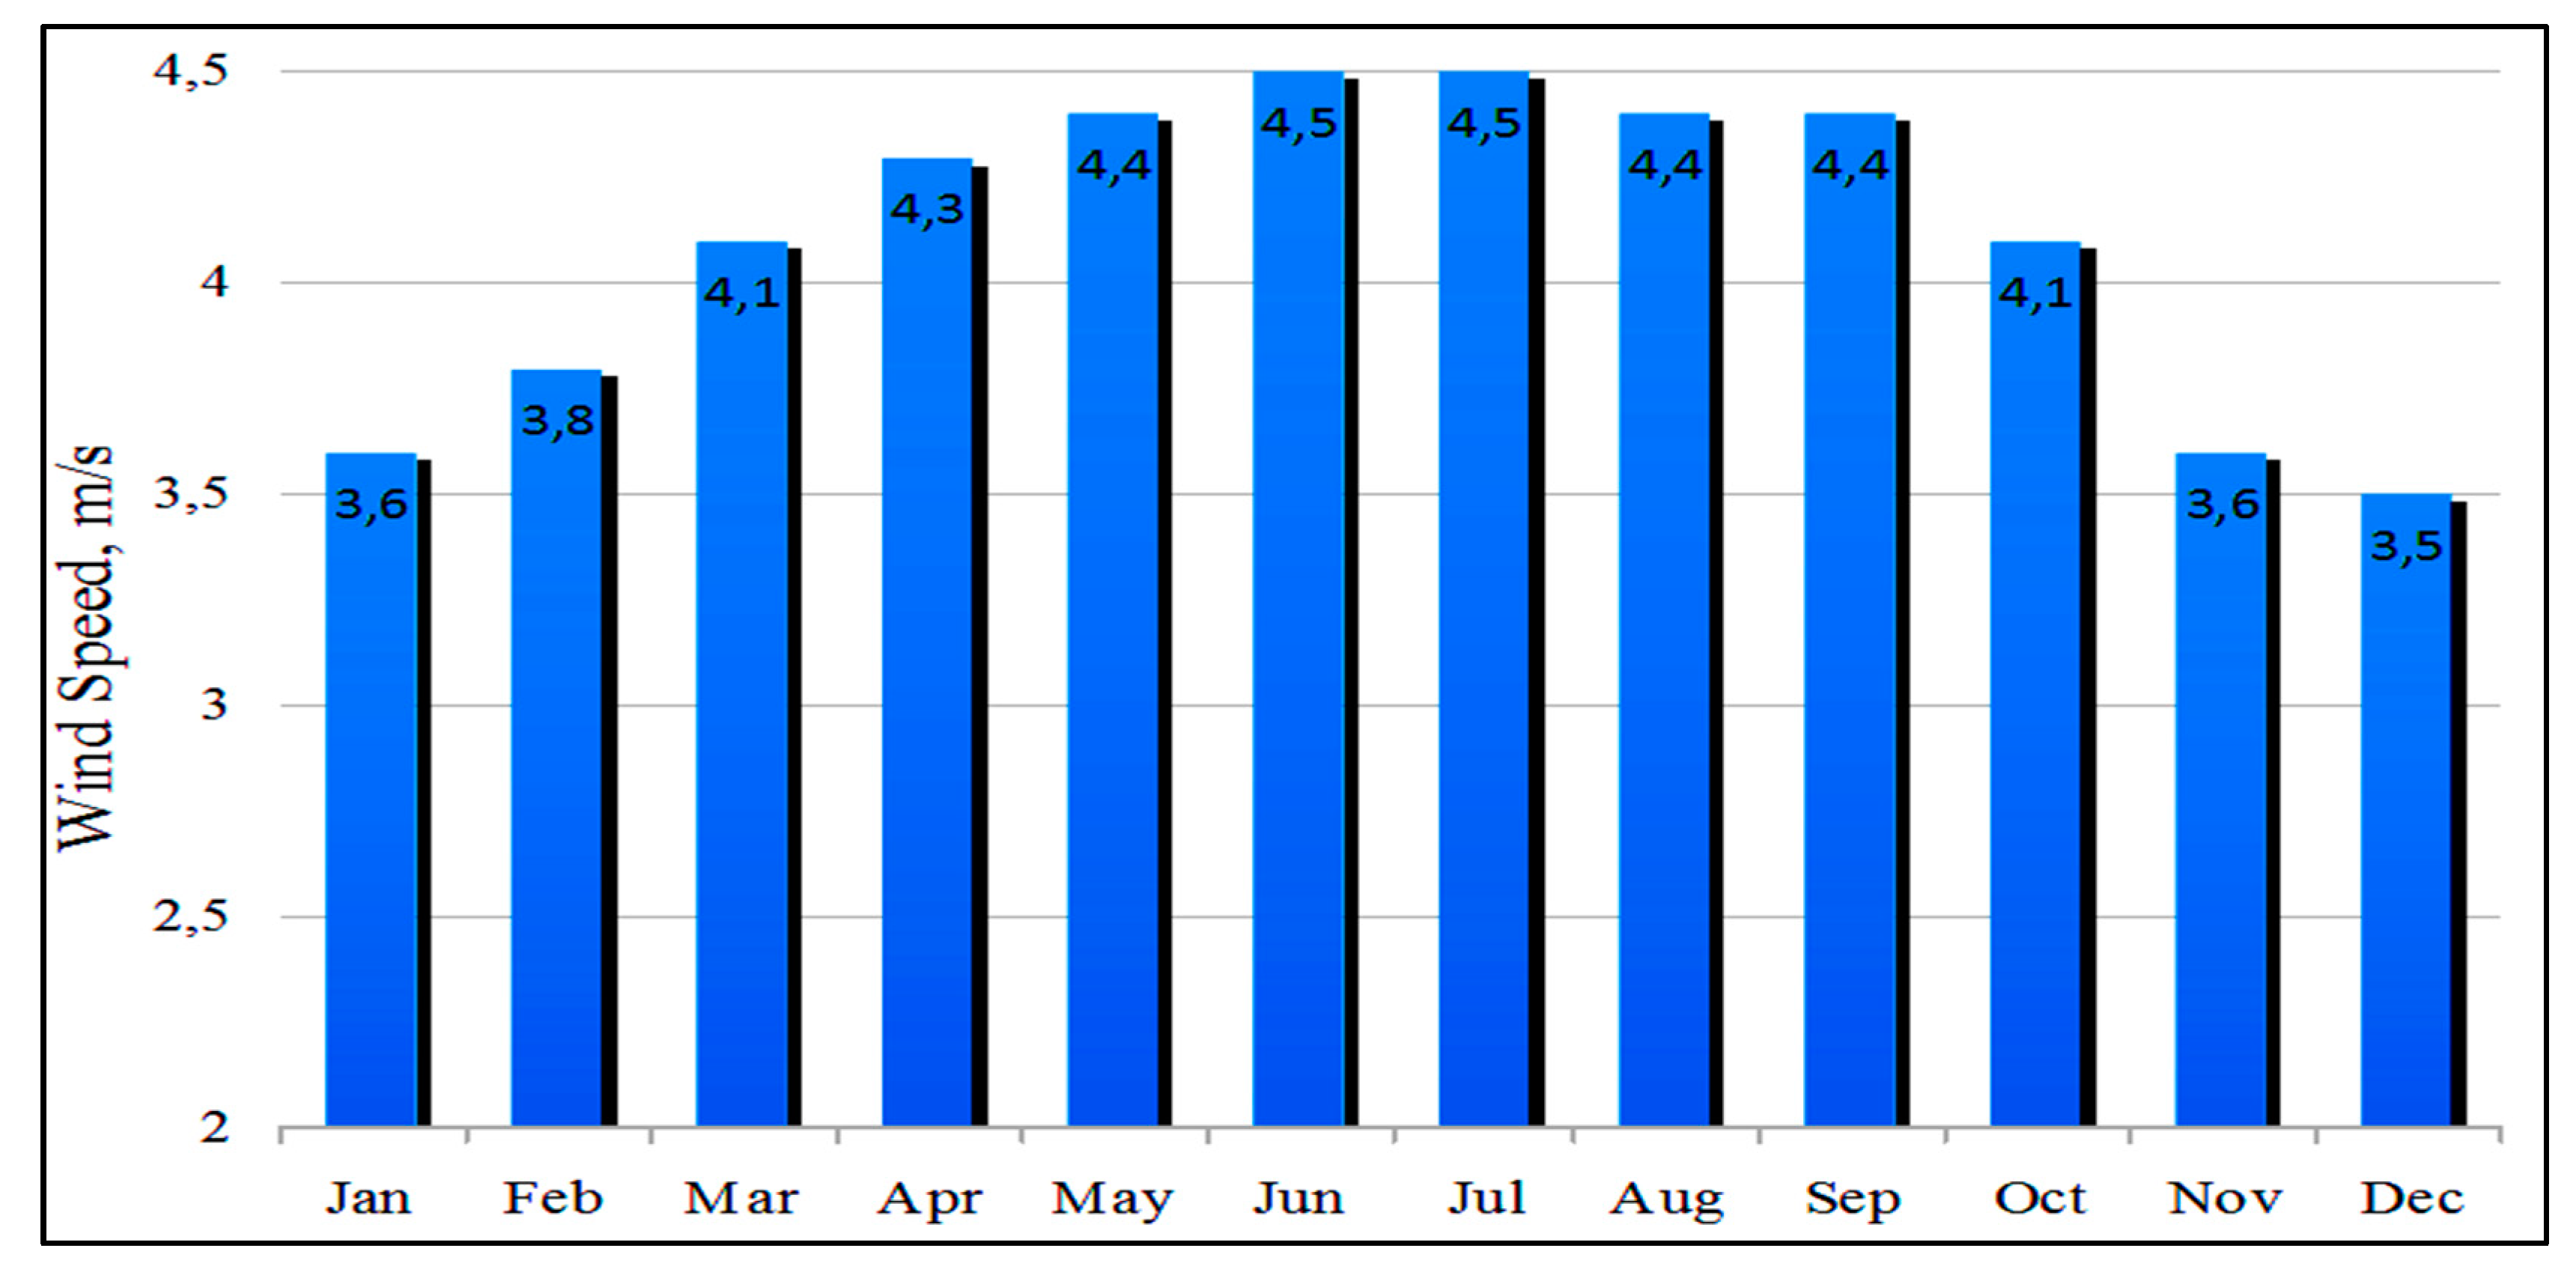
Solar irradiance and wind speed data were obtained from the NASA database website [46] for the Egyptian region, especially in Minia city. Based on HOMER software [47], the characteristics of the PV and WT modules were simulated based on (40) and (41). The irradiance is shown in Figure 13 as daily solar irradiation for the studied system over various months, including the clearance index. Considering Figure 13, one can see that the median radiation was 5.97 kWh/m2/day. Figure 14 illustrates the wind speed for the MEDN at an average of 4.1 m/s.

5.2. The Simulation Results of the MEDN Case Study

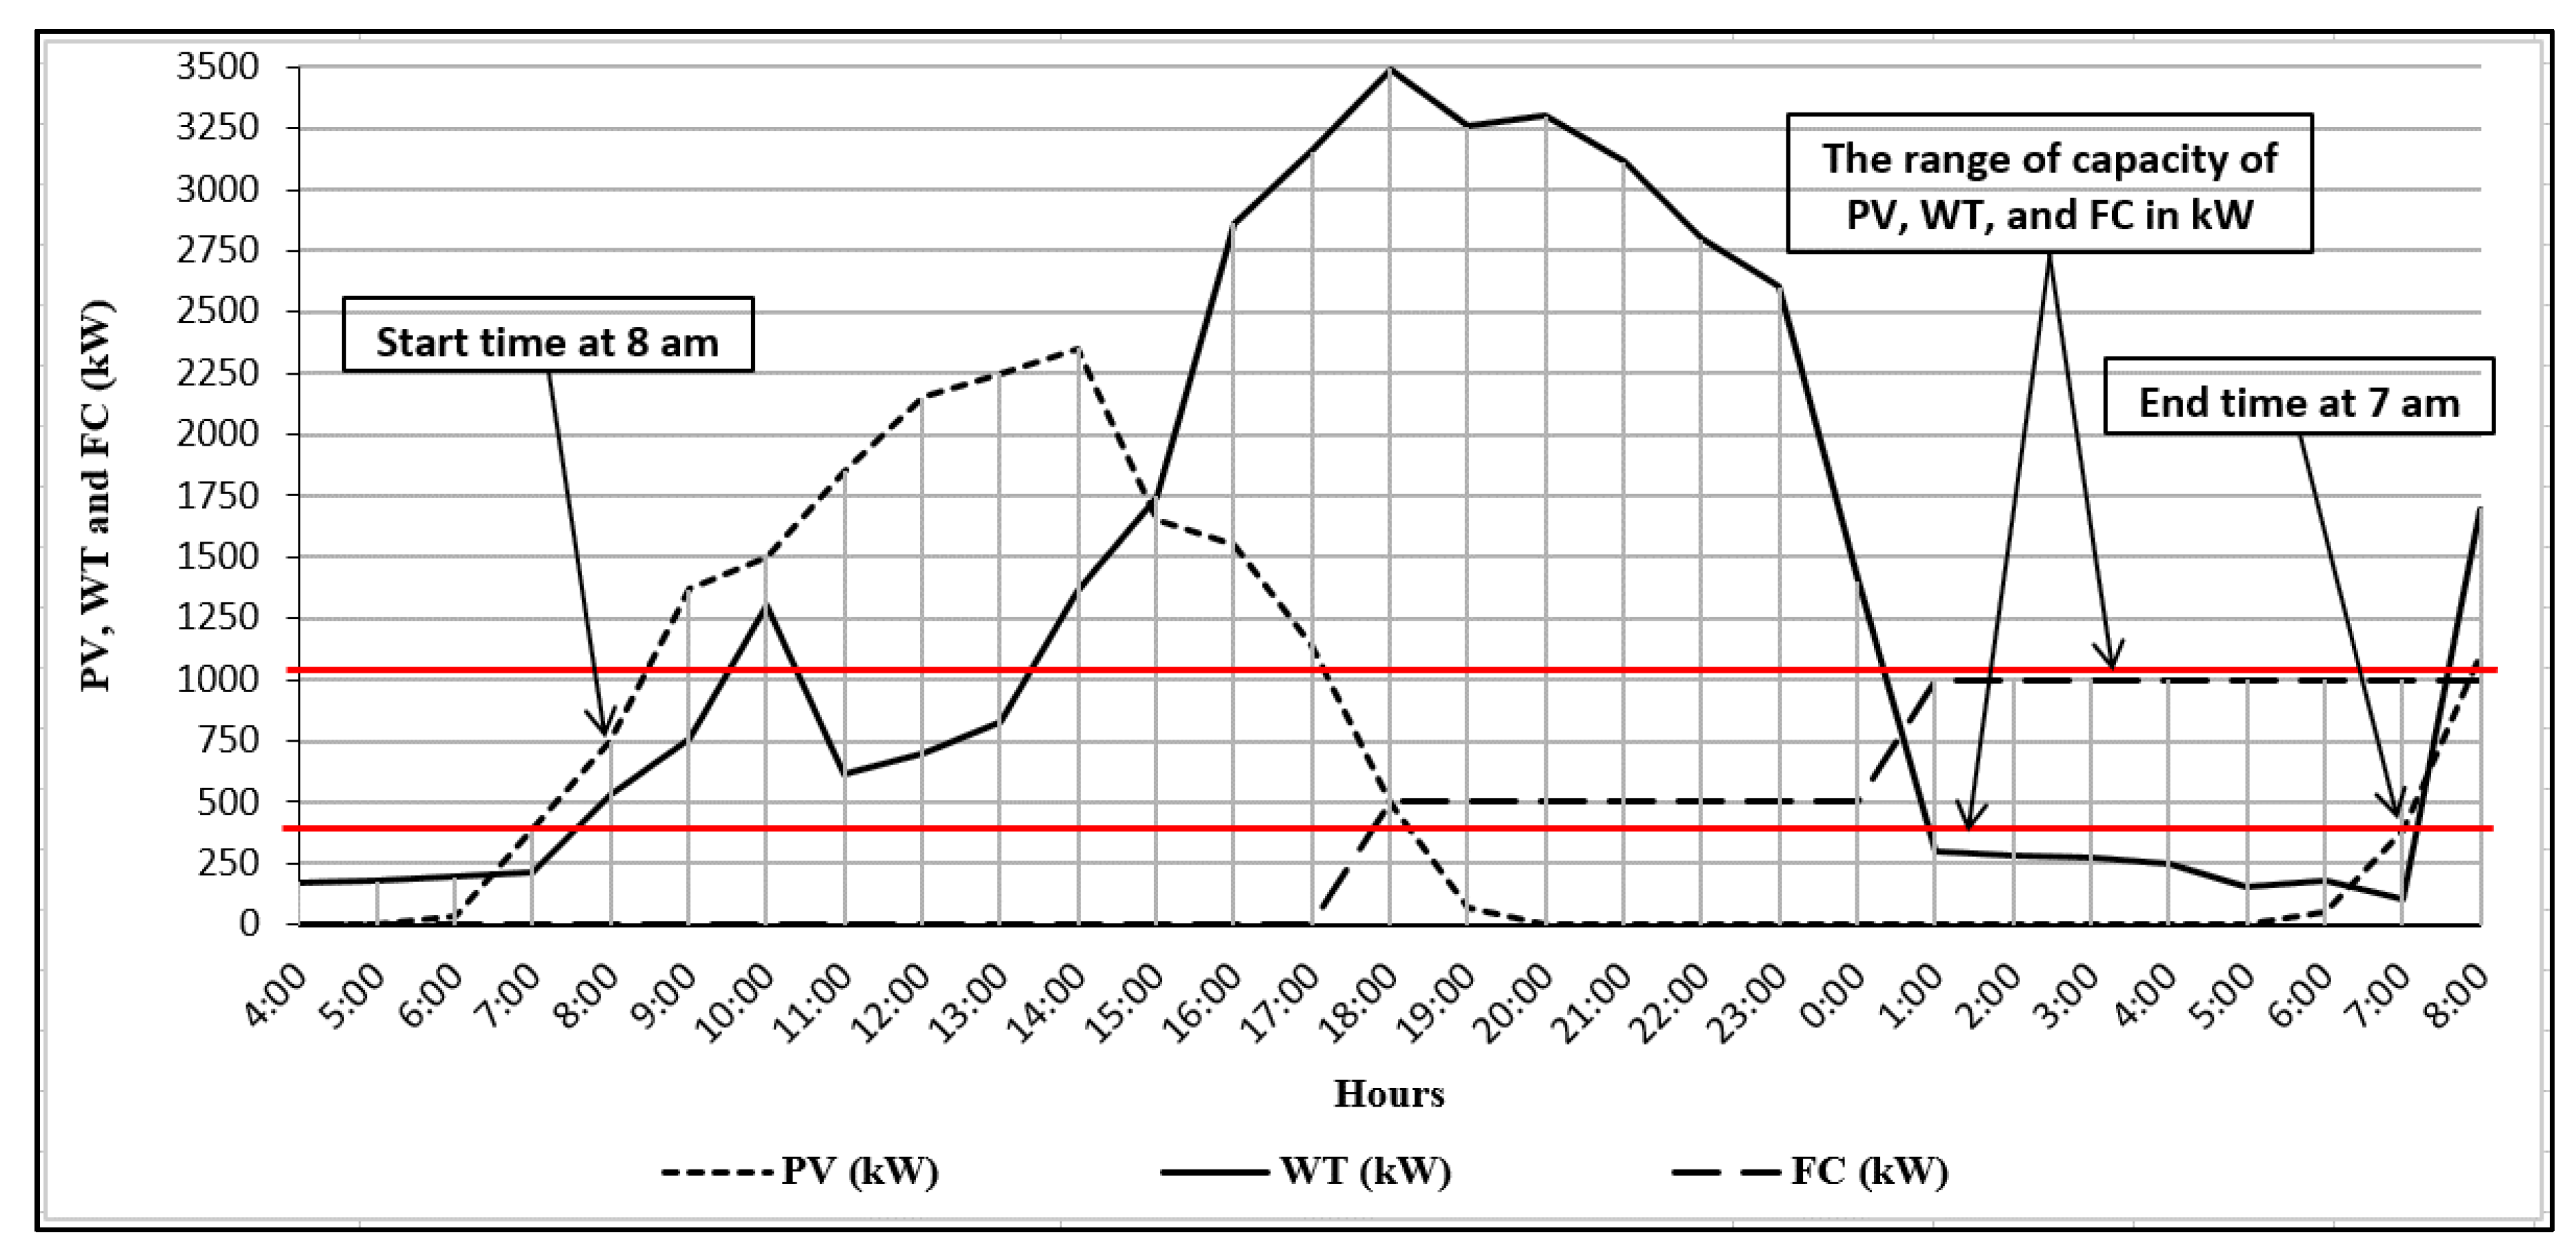
The measurement and analysis of the MEDN case study was implemented in the summer season, especially at the end of the July month, which was considered as the second month, being warmer with higher wind speeds, as in Figure 13 and Figure 14. Based on the HOMER software analysis, Figure 15 shows the characteristics over 24 h of the PV, WT, and FC systems, based on the load characteristics of the MEDN case study. The FC was proposed with a maximum range of 400 from 18:00 to 0.00 h, and to 1000 kW from 1:00 to 8:00 h. The PV and WT systems ranged between 400 to 1000 kW. In the practical case study of MEDN, three scenarios were considered. In the first scenario—I, only the SCB locations over 24 h, including the control operation were considered. Then, in the second scenario—II, the location of the RDGs at variable load levels, including control operation over 24 h, was proposed. In the last scenario—III, simulation of installation of the RDGs and SCBs were installed simultaneously over 24 h.
Due to the nominal loads almost being closed to the light loads in the case of the MEDN case study (Egypt Region), the definition of its parameters are considered as follows. The hourly time T h was considered as each hour per year, including the price of electricity market ( E m p ) at peak loads at 70 $/MWh; at other load levels it was 49 $/MWh; also, the energy cost rate ( K e ) was 65 $/MWh at the peak loads, and at other loads levels, it was 40 $/MWh [28]. The purchase cost of the RDGs ( K D G ) was considered at 150,000 $/MW according to [48] for small-scale distribution grids.
The candidate buses were calculated at each hour for the locations of the RDGs and/or SCBs based on PLSF and QLSF analyses using (38) and (39) respectively. Therefore, the optimum locations by the SSA optimizer for SCBs were selected as 10 and 14 buses, and the SCBs were switched by SSA over 24 h. The optimum locations (buses) by the SSA optimizer for RDGs were selected as 7 and 11 buses, and for SCBs, the selected optimum buses were 10 and 14. In this work, and according to Figure 15, it was simulated that the WT and PV systems worked from 8:00 am till 17:00 at buses 7 and 11, respectively, then the WT and FC systems worked from 18:00 to 0:00 at buses 7 and 11, respectively, and finally, the FCs worked from 1:00 am to 7:00 am at buses 7 and 11, at unity PF.
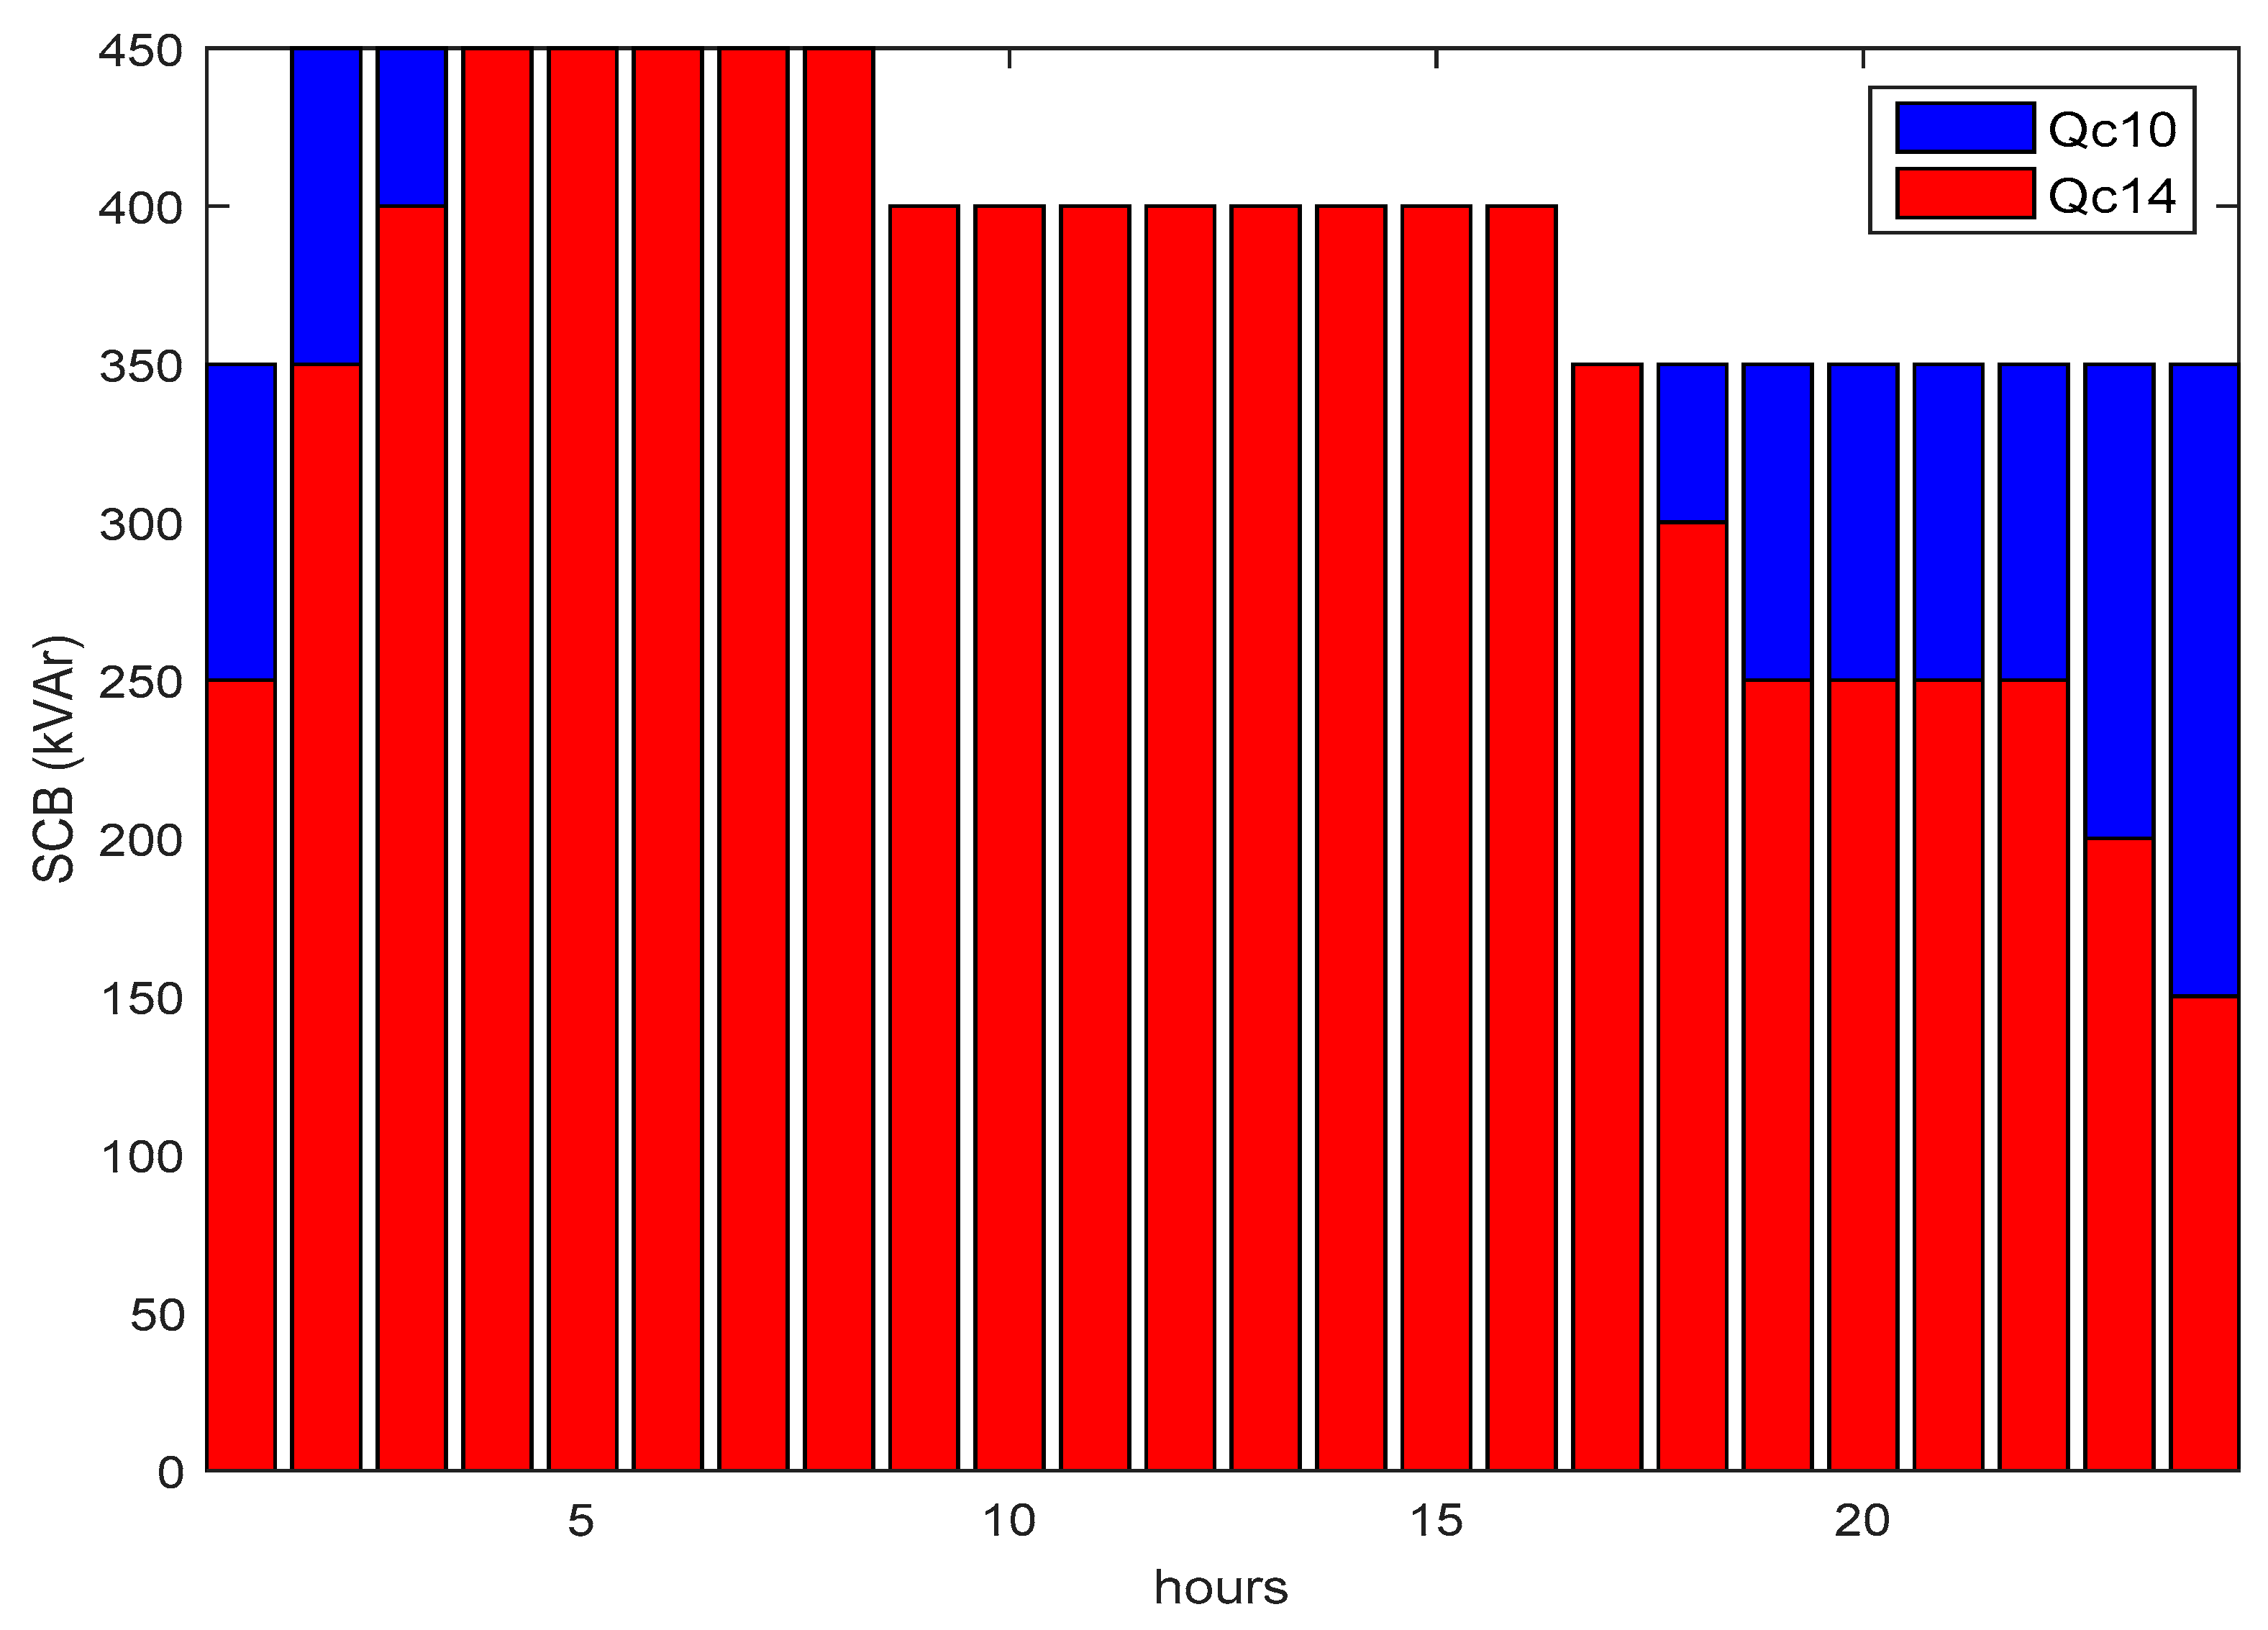
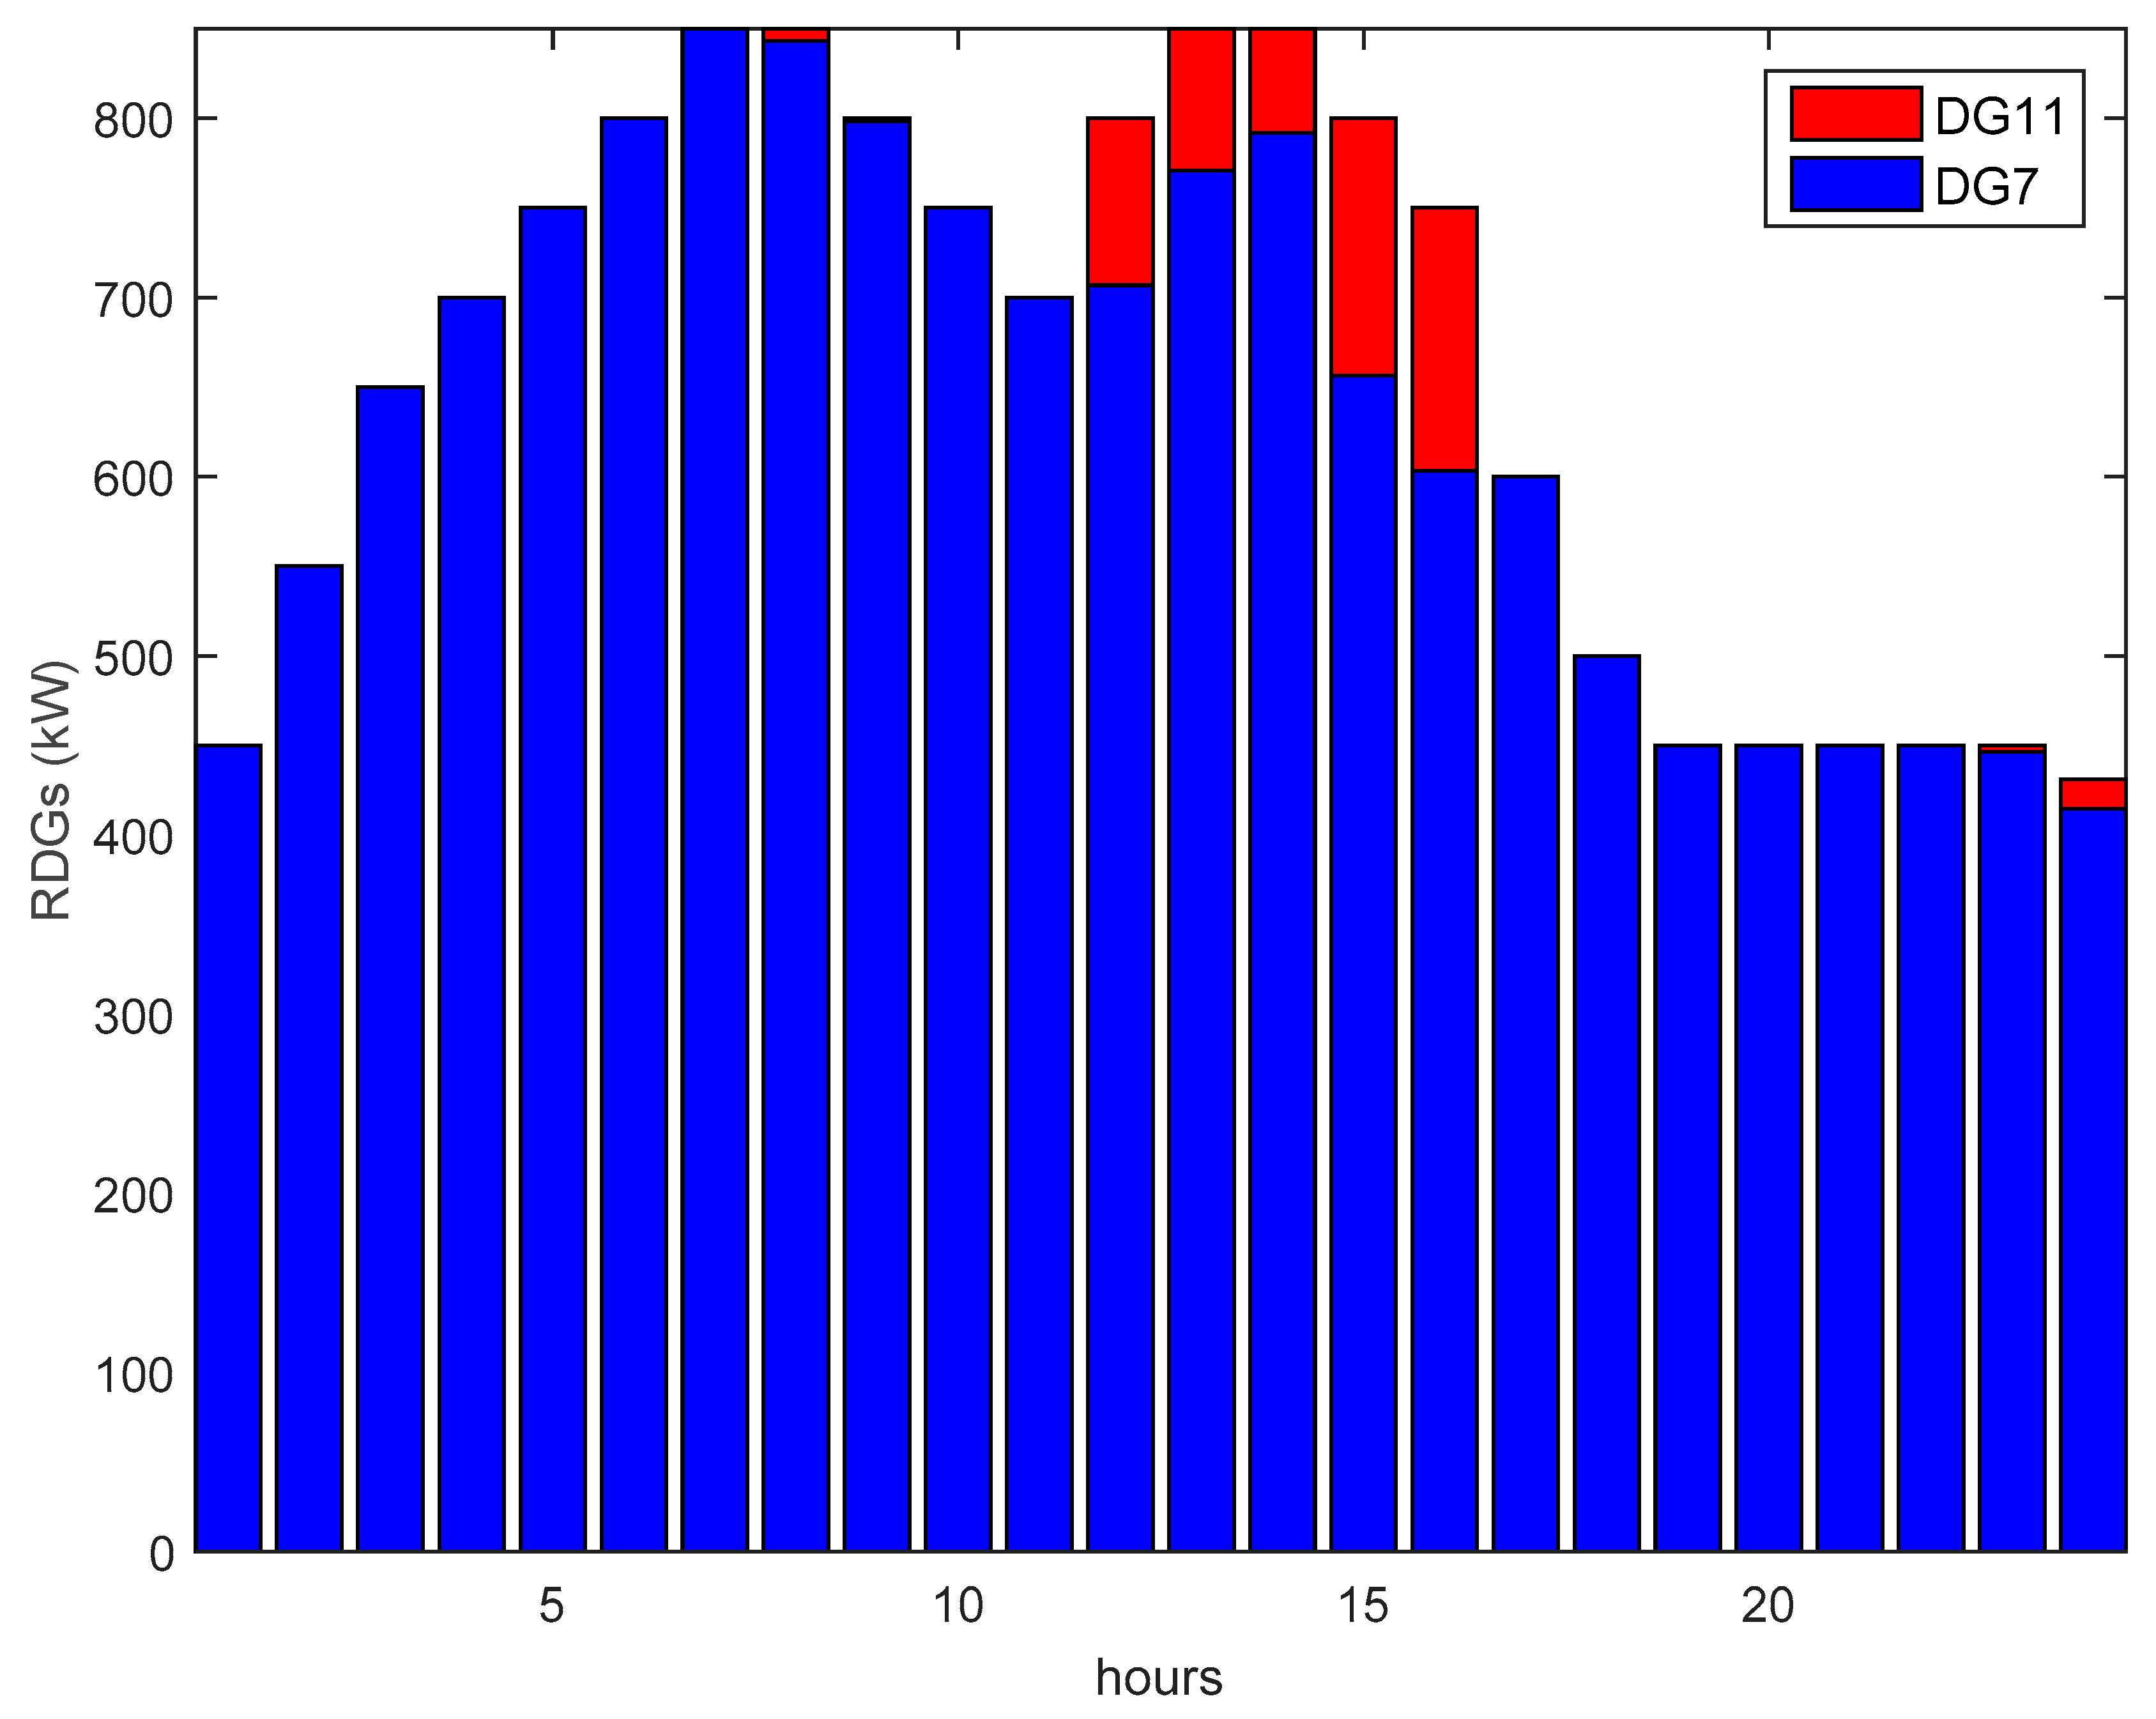
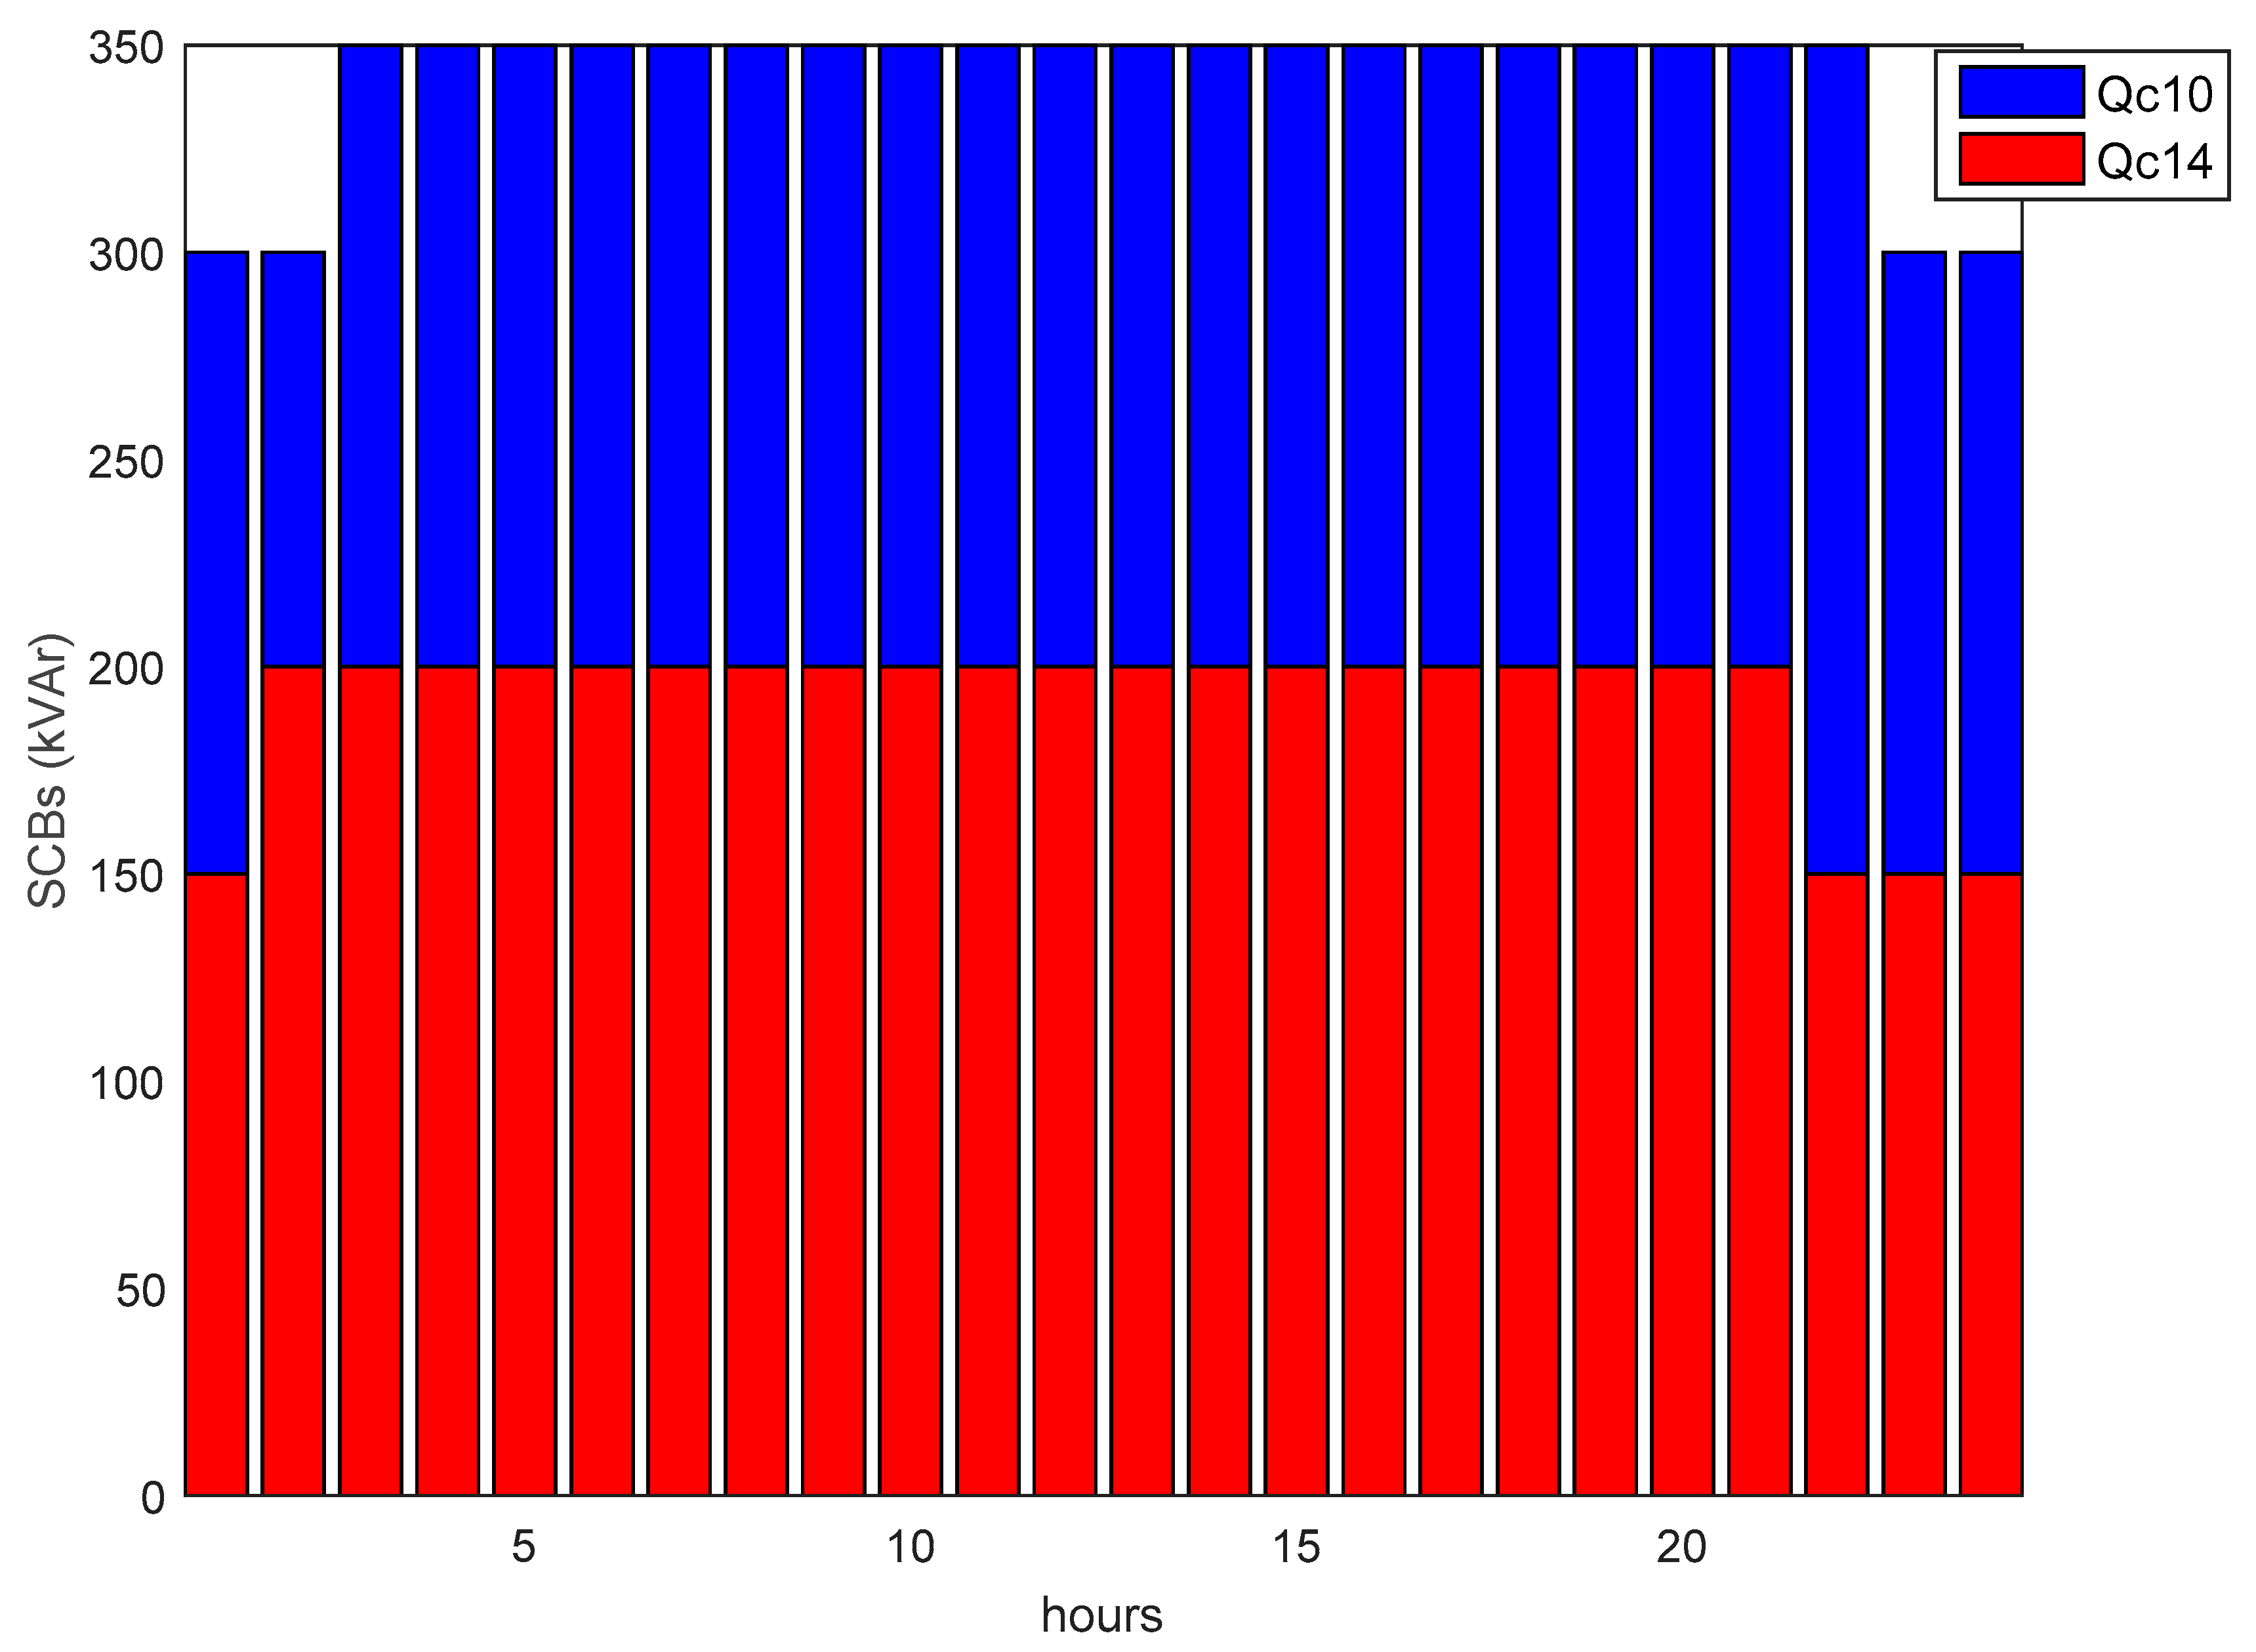
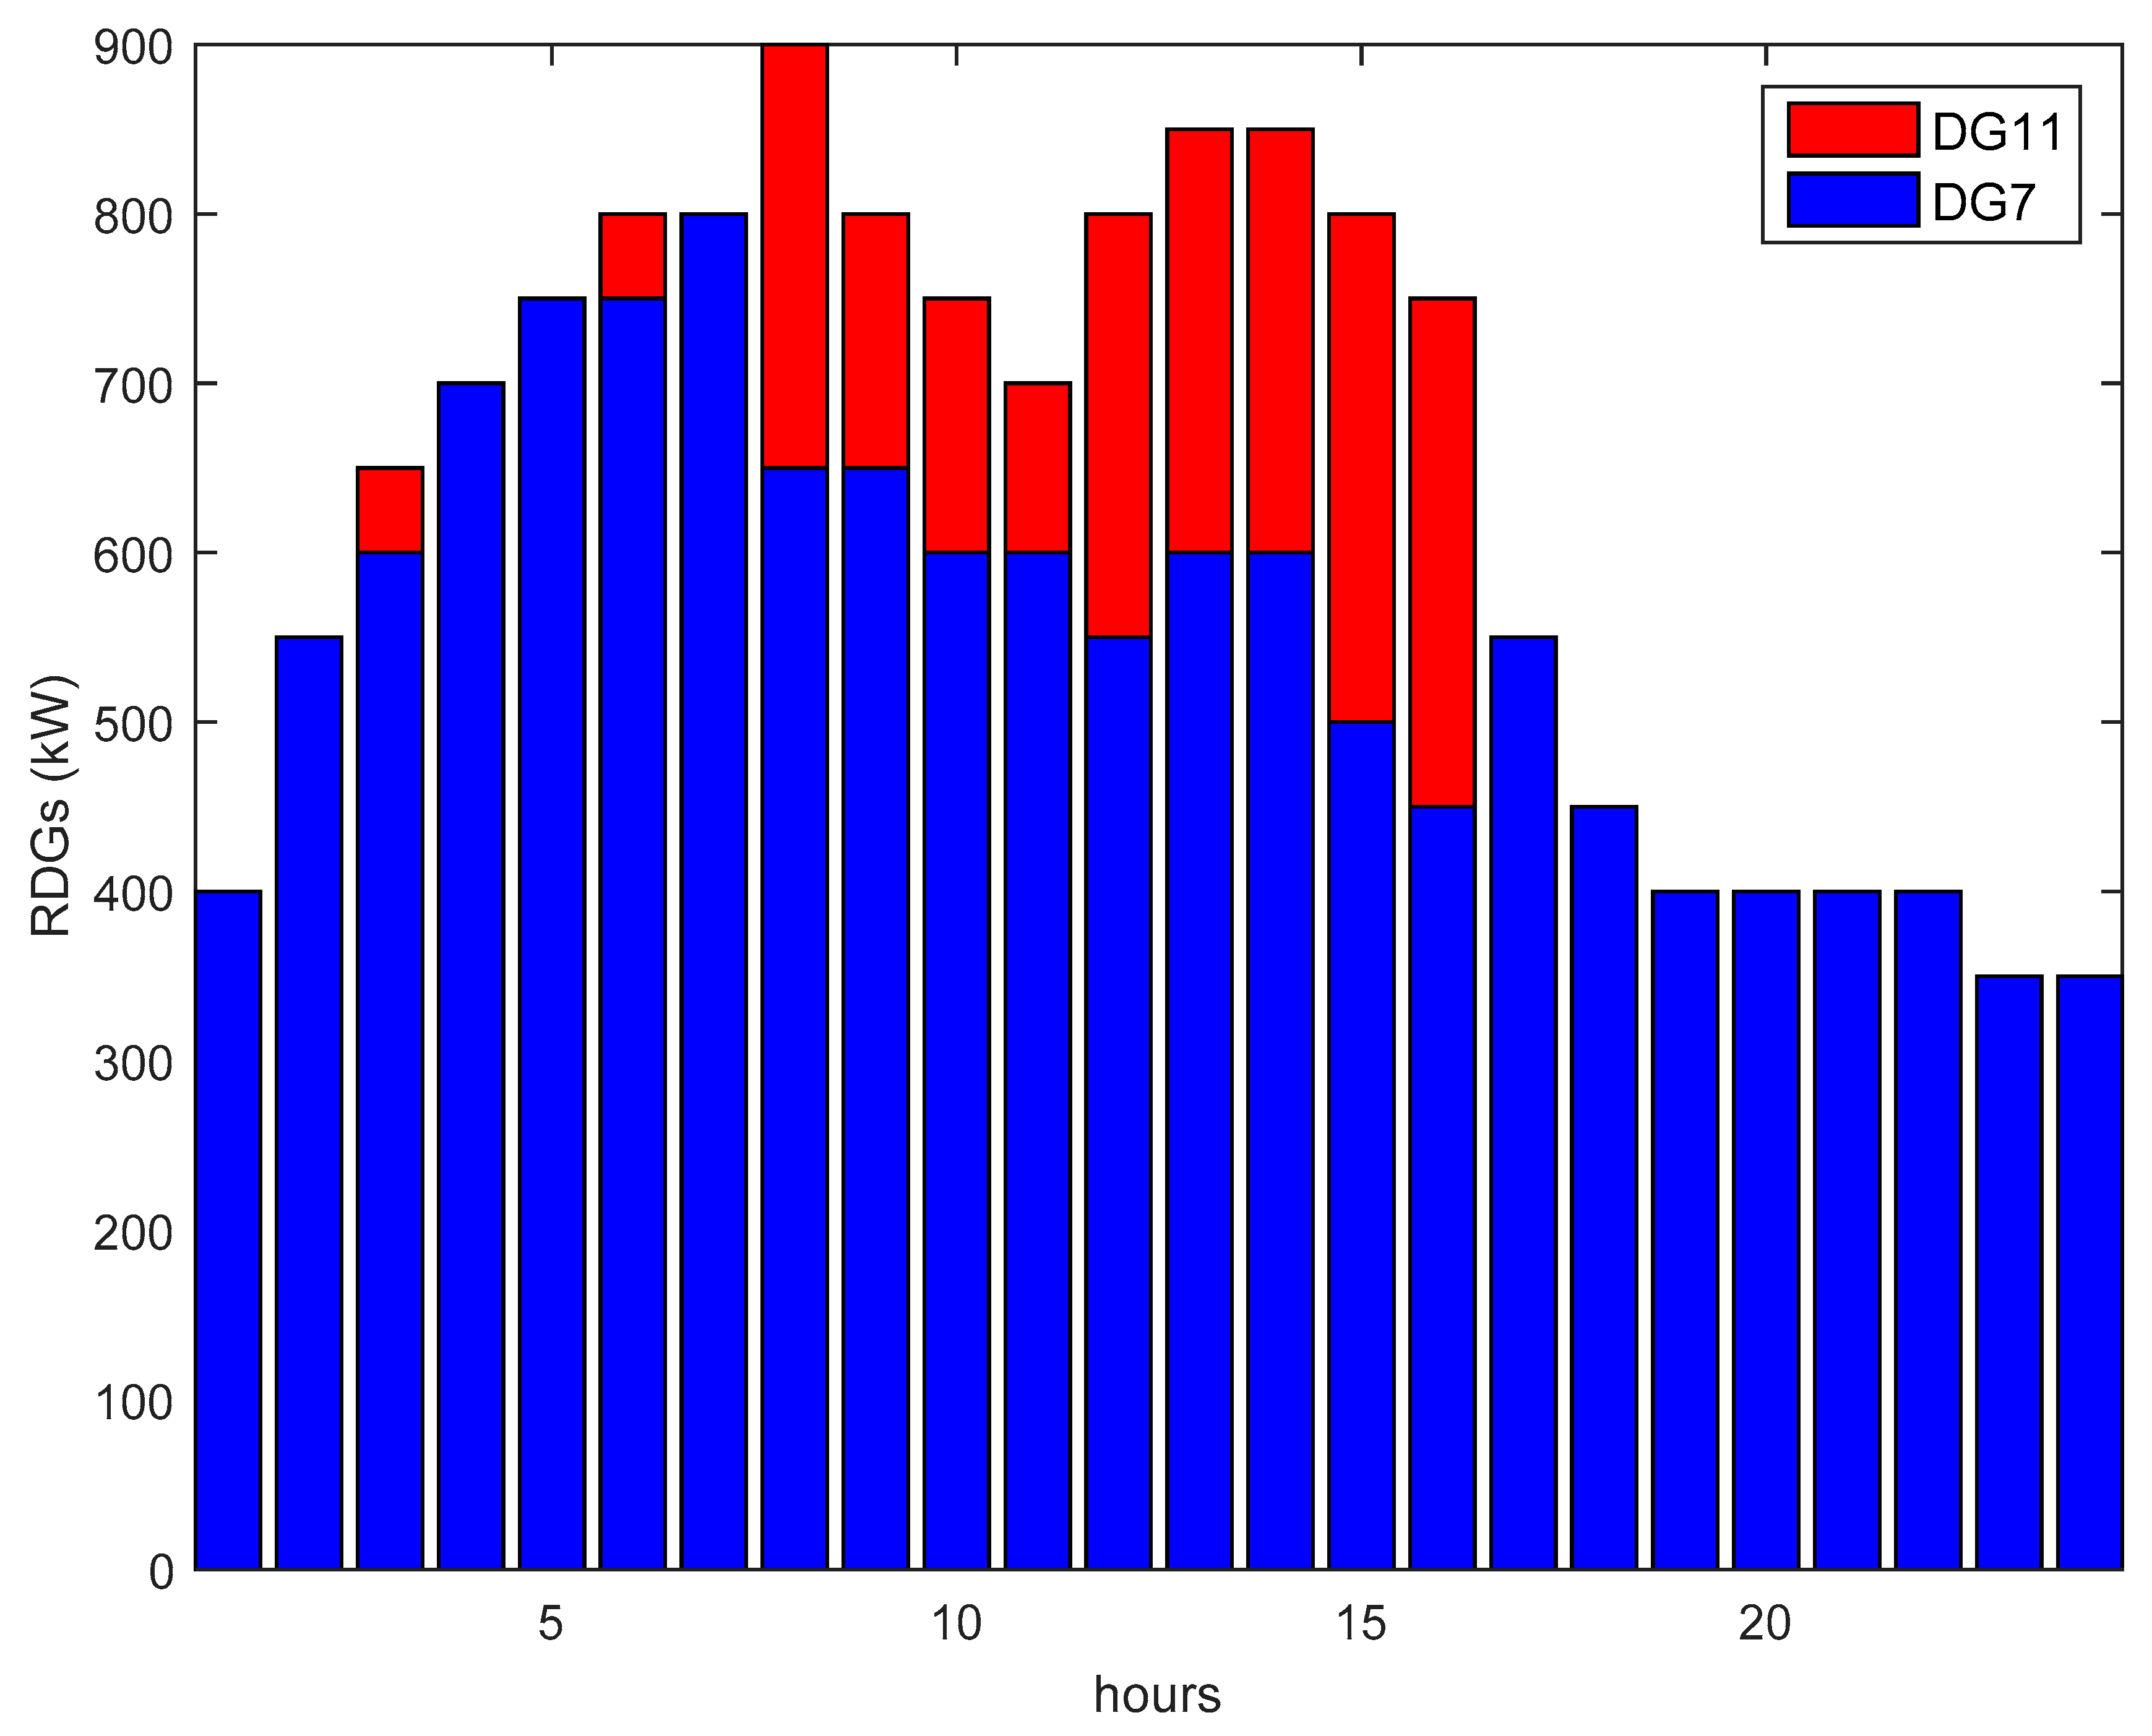
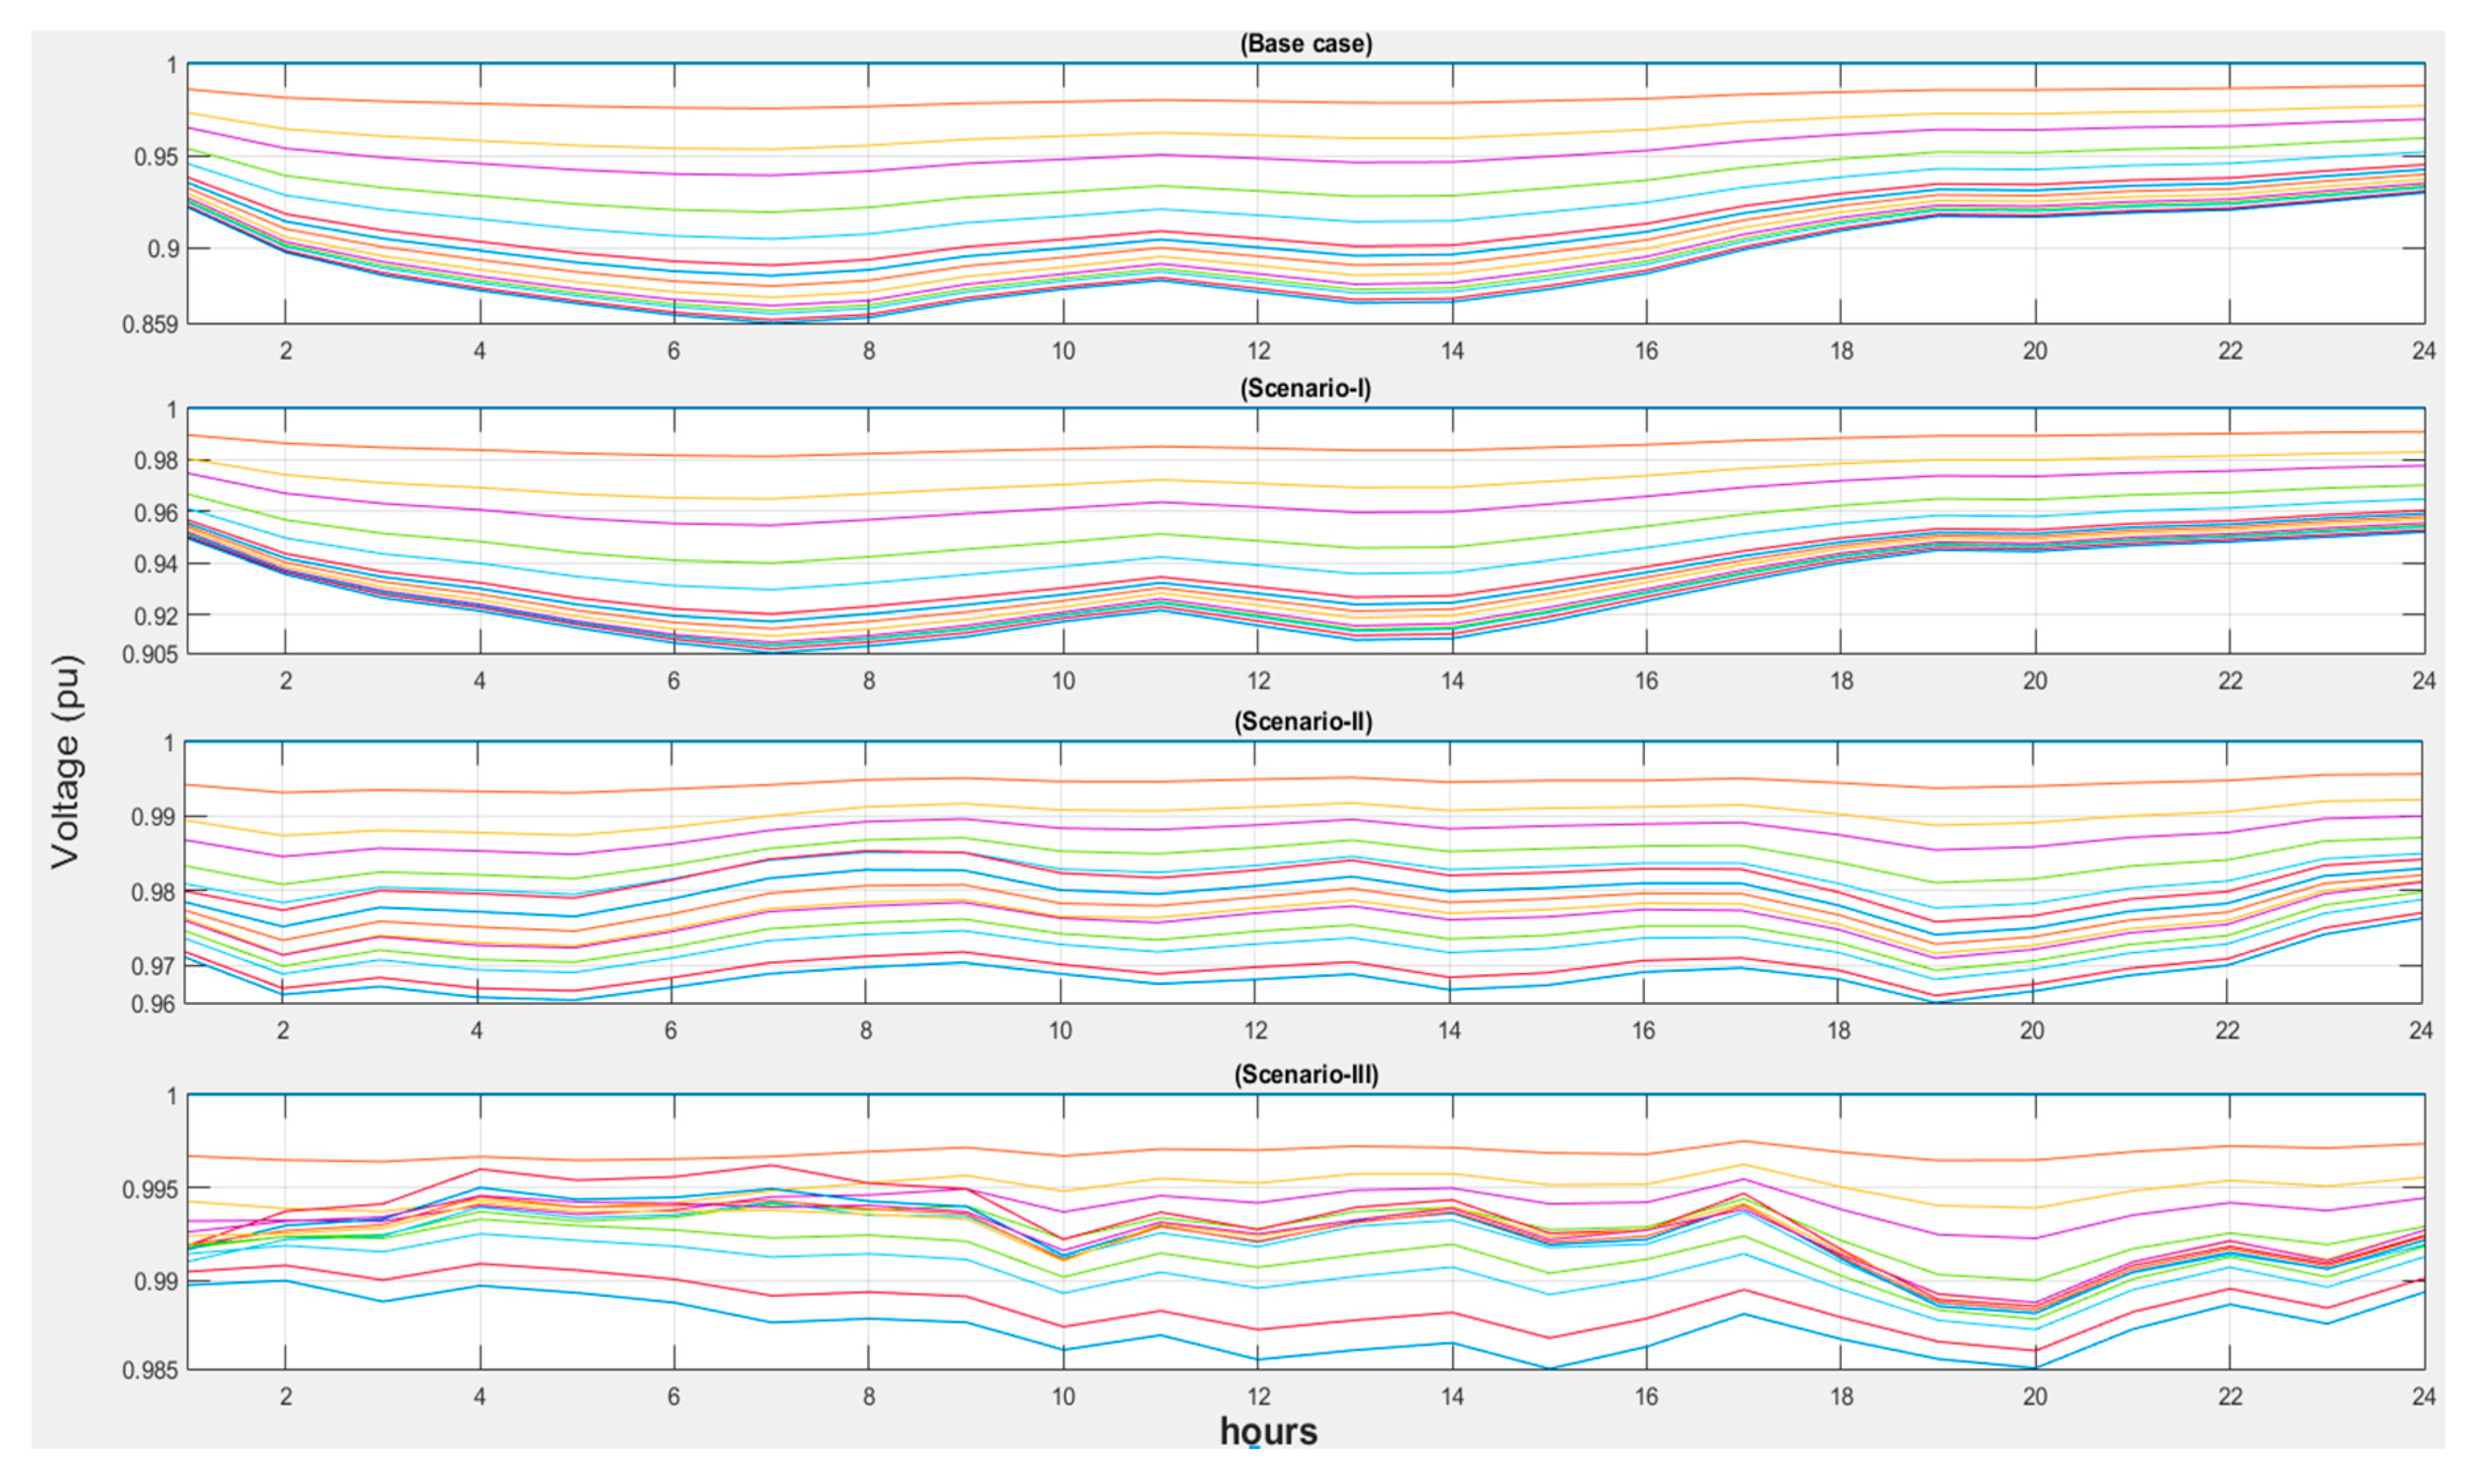
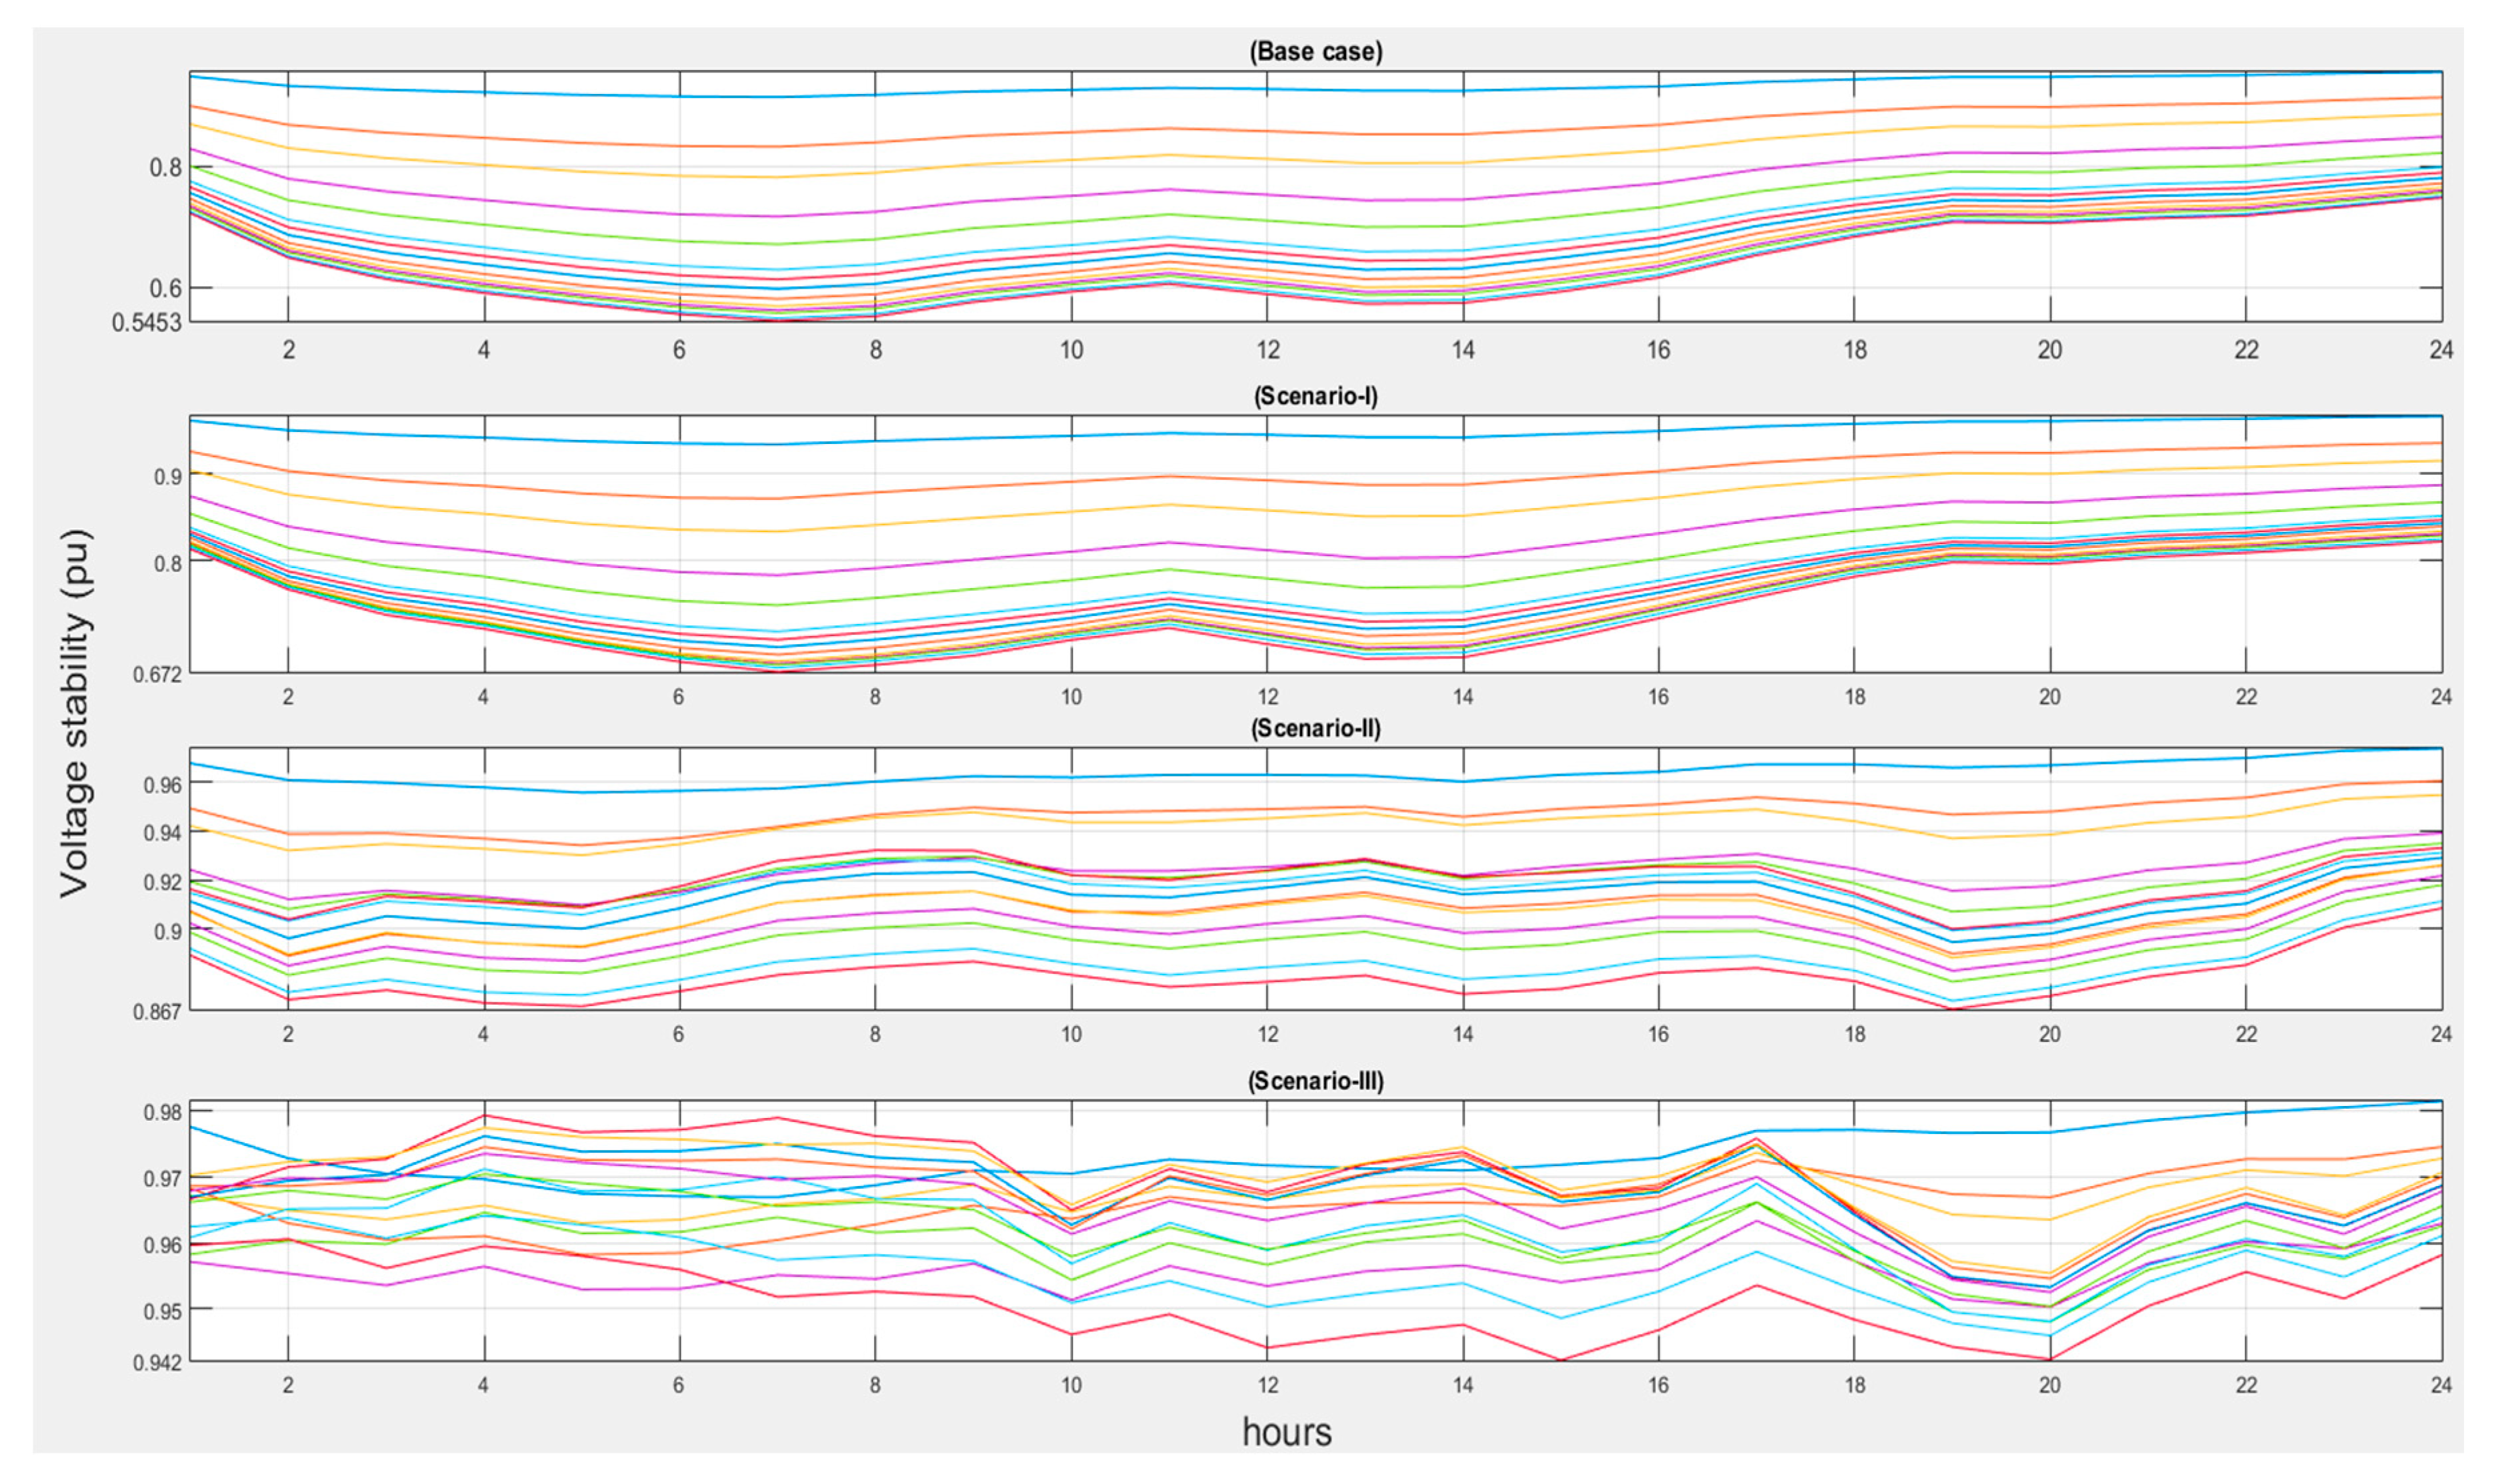
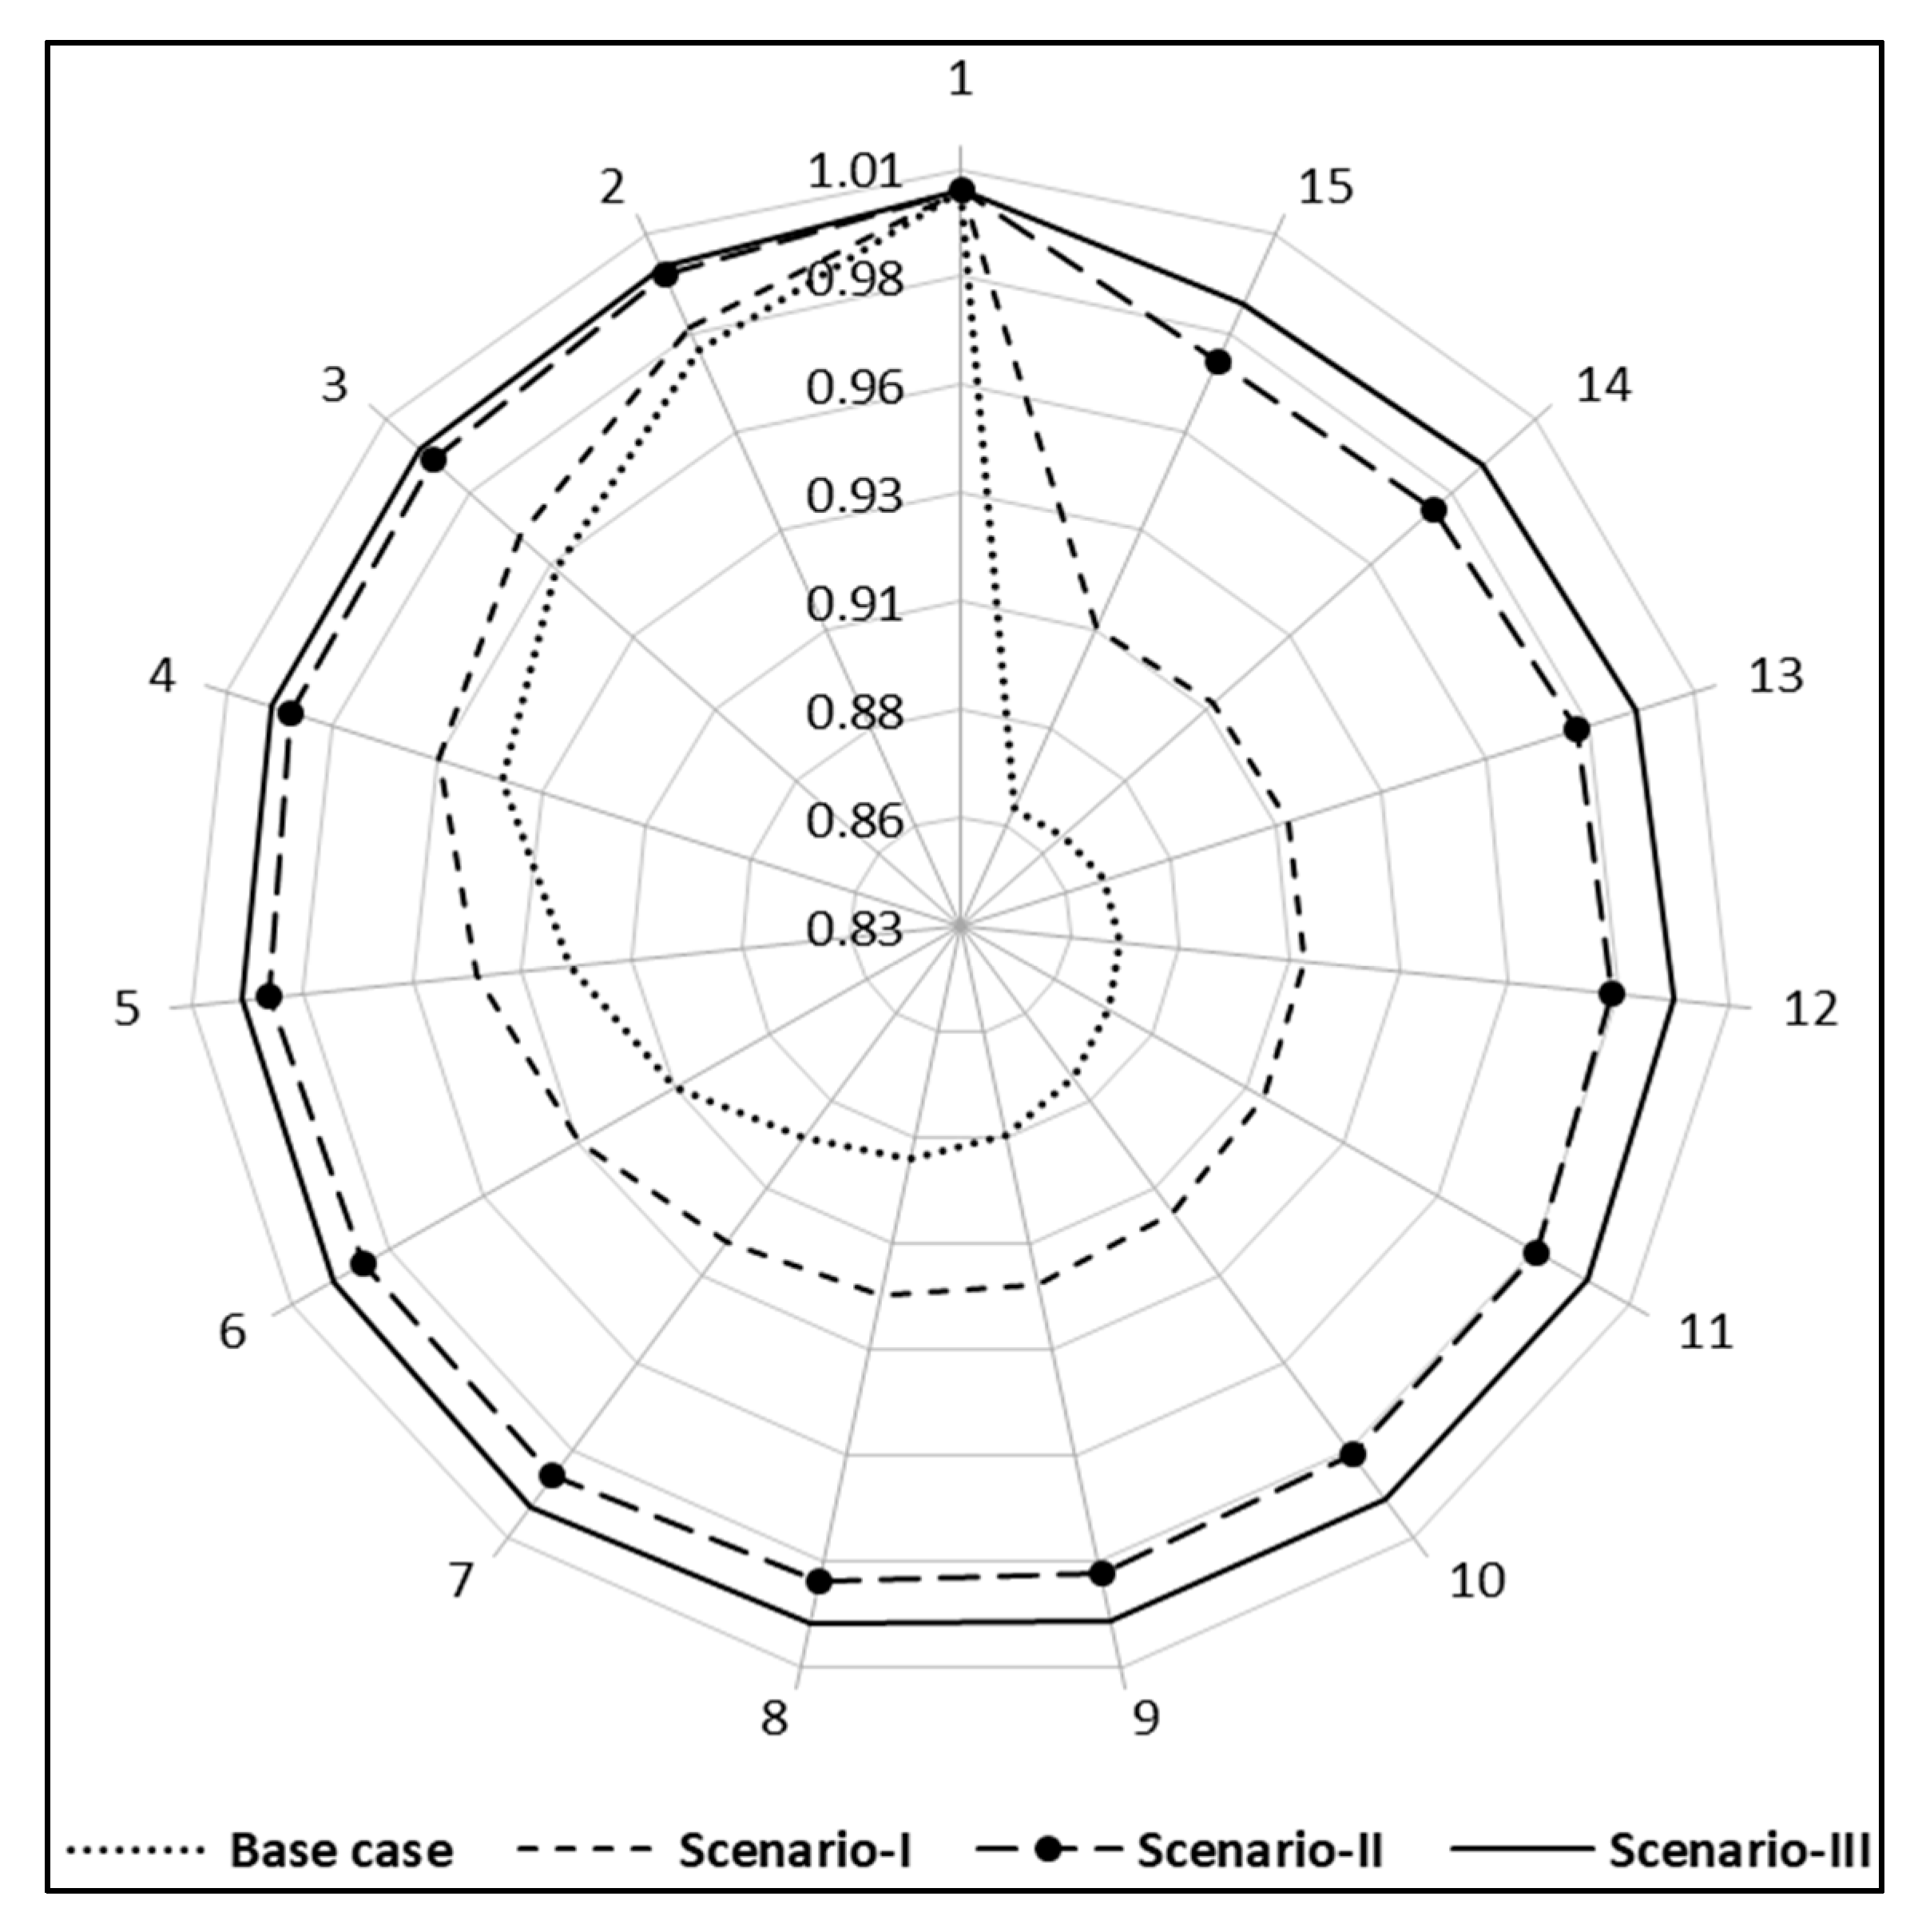
In Scenario I, the switched SCBs within 24 h at buses 10 and 14 were selected and controlled by the SSA optimizer, as illustrated in Figure 16. Qc10 and Qc14 represent the locations of the SCBs at buses 10 and 14 respectively. The different sizes of the installed RDGs in Scenario II are illustrated in Figure 17. DG7 and DG11 are considered as the placements of the RDGs at buses 7 and 11 respectively. In Scenario III, the hourly data of both SCB and RDG locations and capacities are shown in Figure 18 and Figure 19. The effect of the switched compensated devices of the SCBs and the integrated RDGs by SSA on the voltage profile and VSI profile of MEDN within 24 h are shown in Figure 20 and Figure 21. The peak level of the voltage profile in the base case was considered at 14:00 (the seventh hour). In Scenario I, the minimum voltage level was enhanced from 0.8591 p.u. unto 0.9053 p.u. at this peak hour. The minimum voltage stability level was improved from 0.5453 p.u. to 0.672 p.u at the same peak hour. In Scenario II, the voltage profile and voltage stability index profile were improved as compared with Scenario I. The minimum voltage and VSI levels were 0.9650 p.u. and 0.867 p.u at 19:00, respectively. Scenario III was considered as the best case as compared with the other scenarios, which the minimum voltage and voltage stability index levels being 0.9852 p.u. and 0.942 p.u at 15:00 and 20:00, respectively.
.
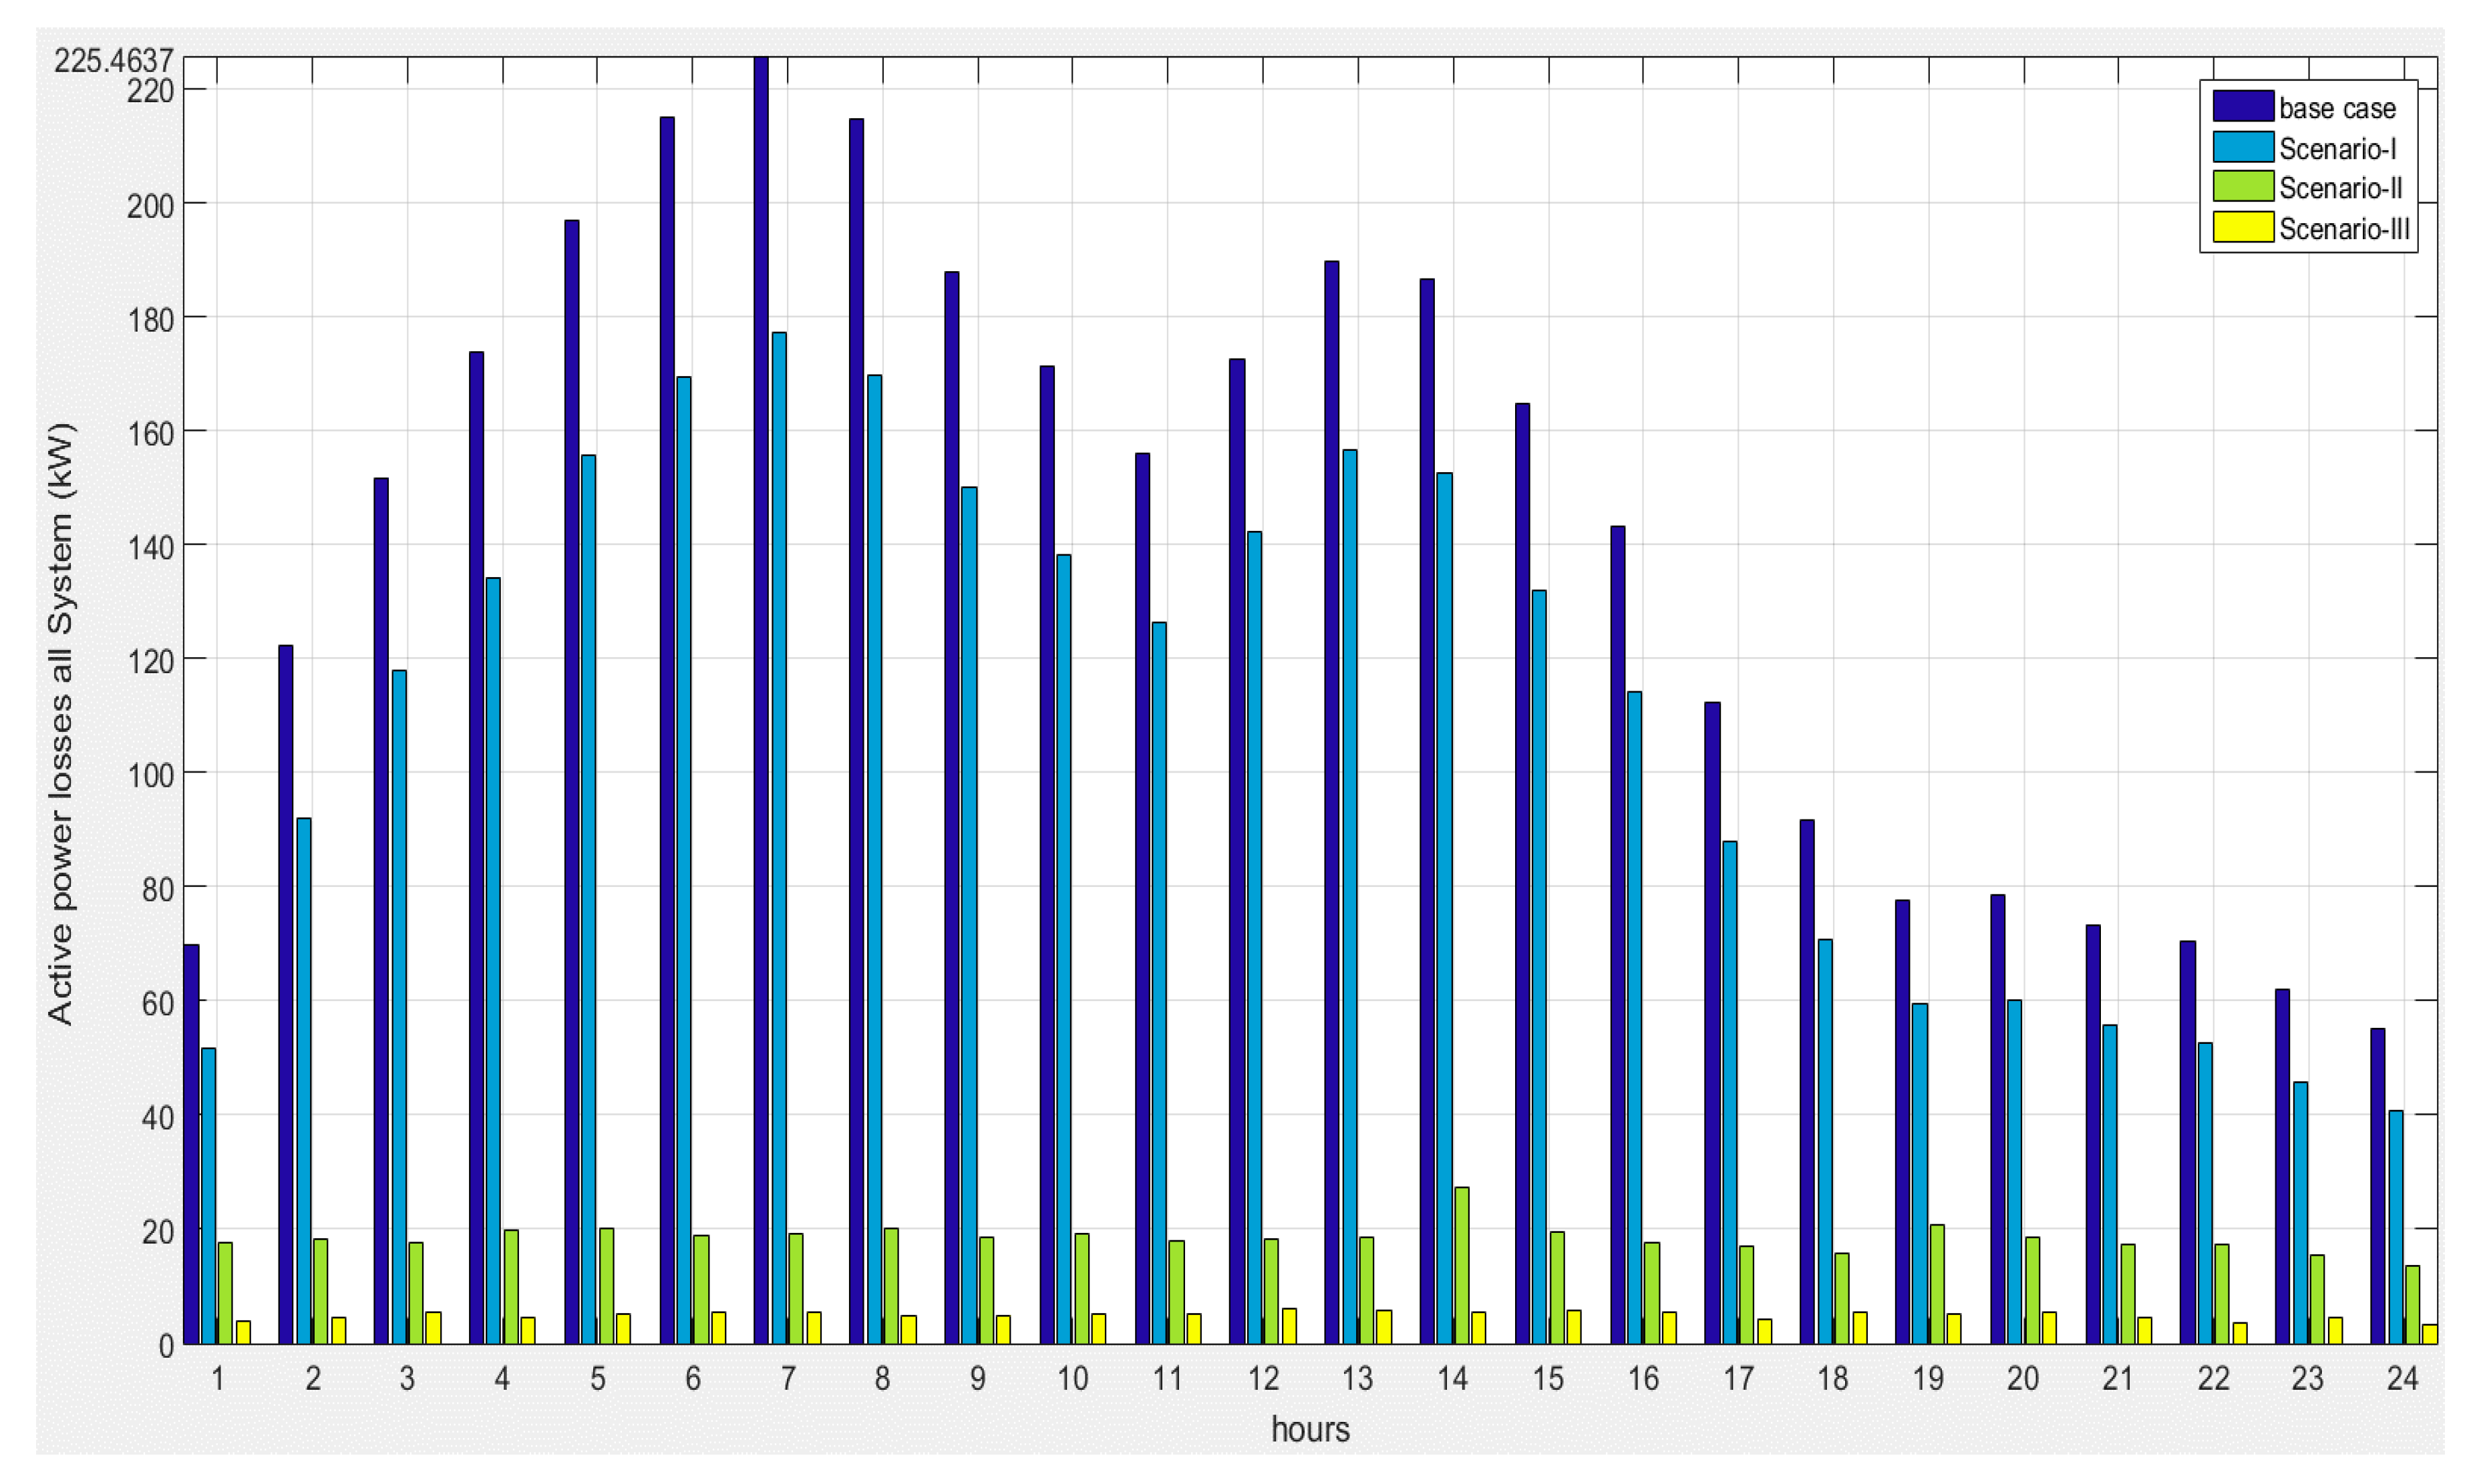
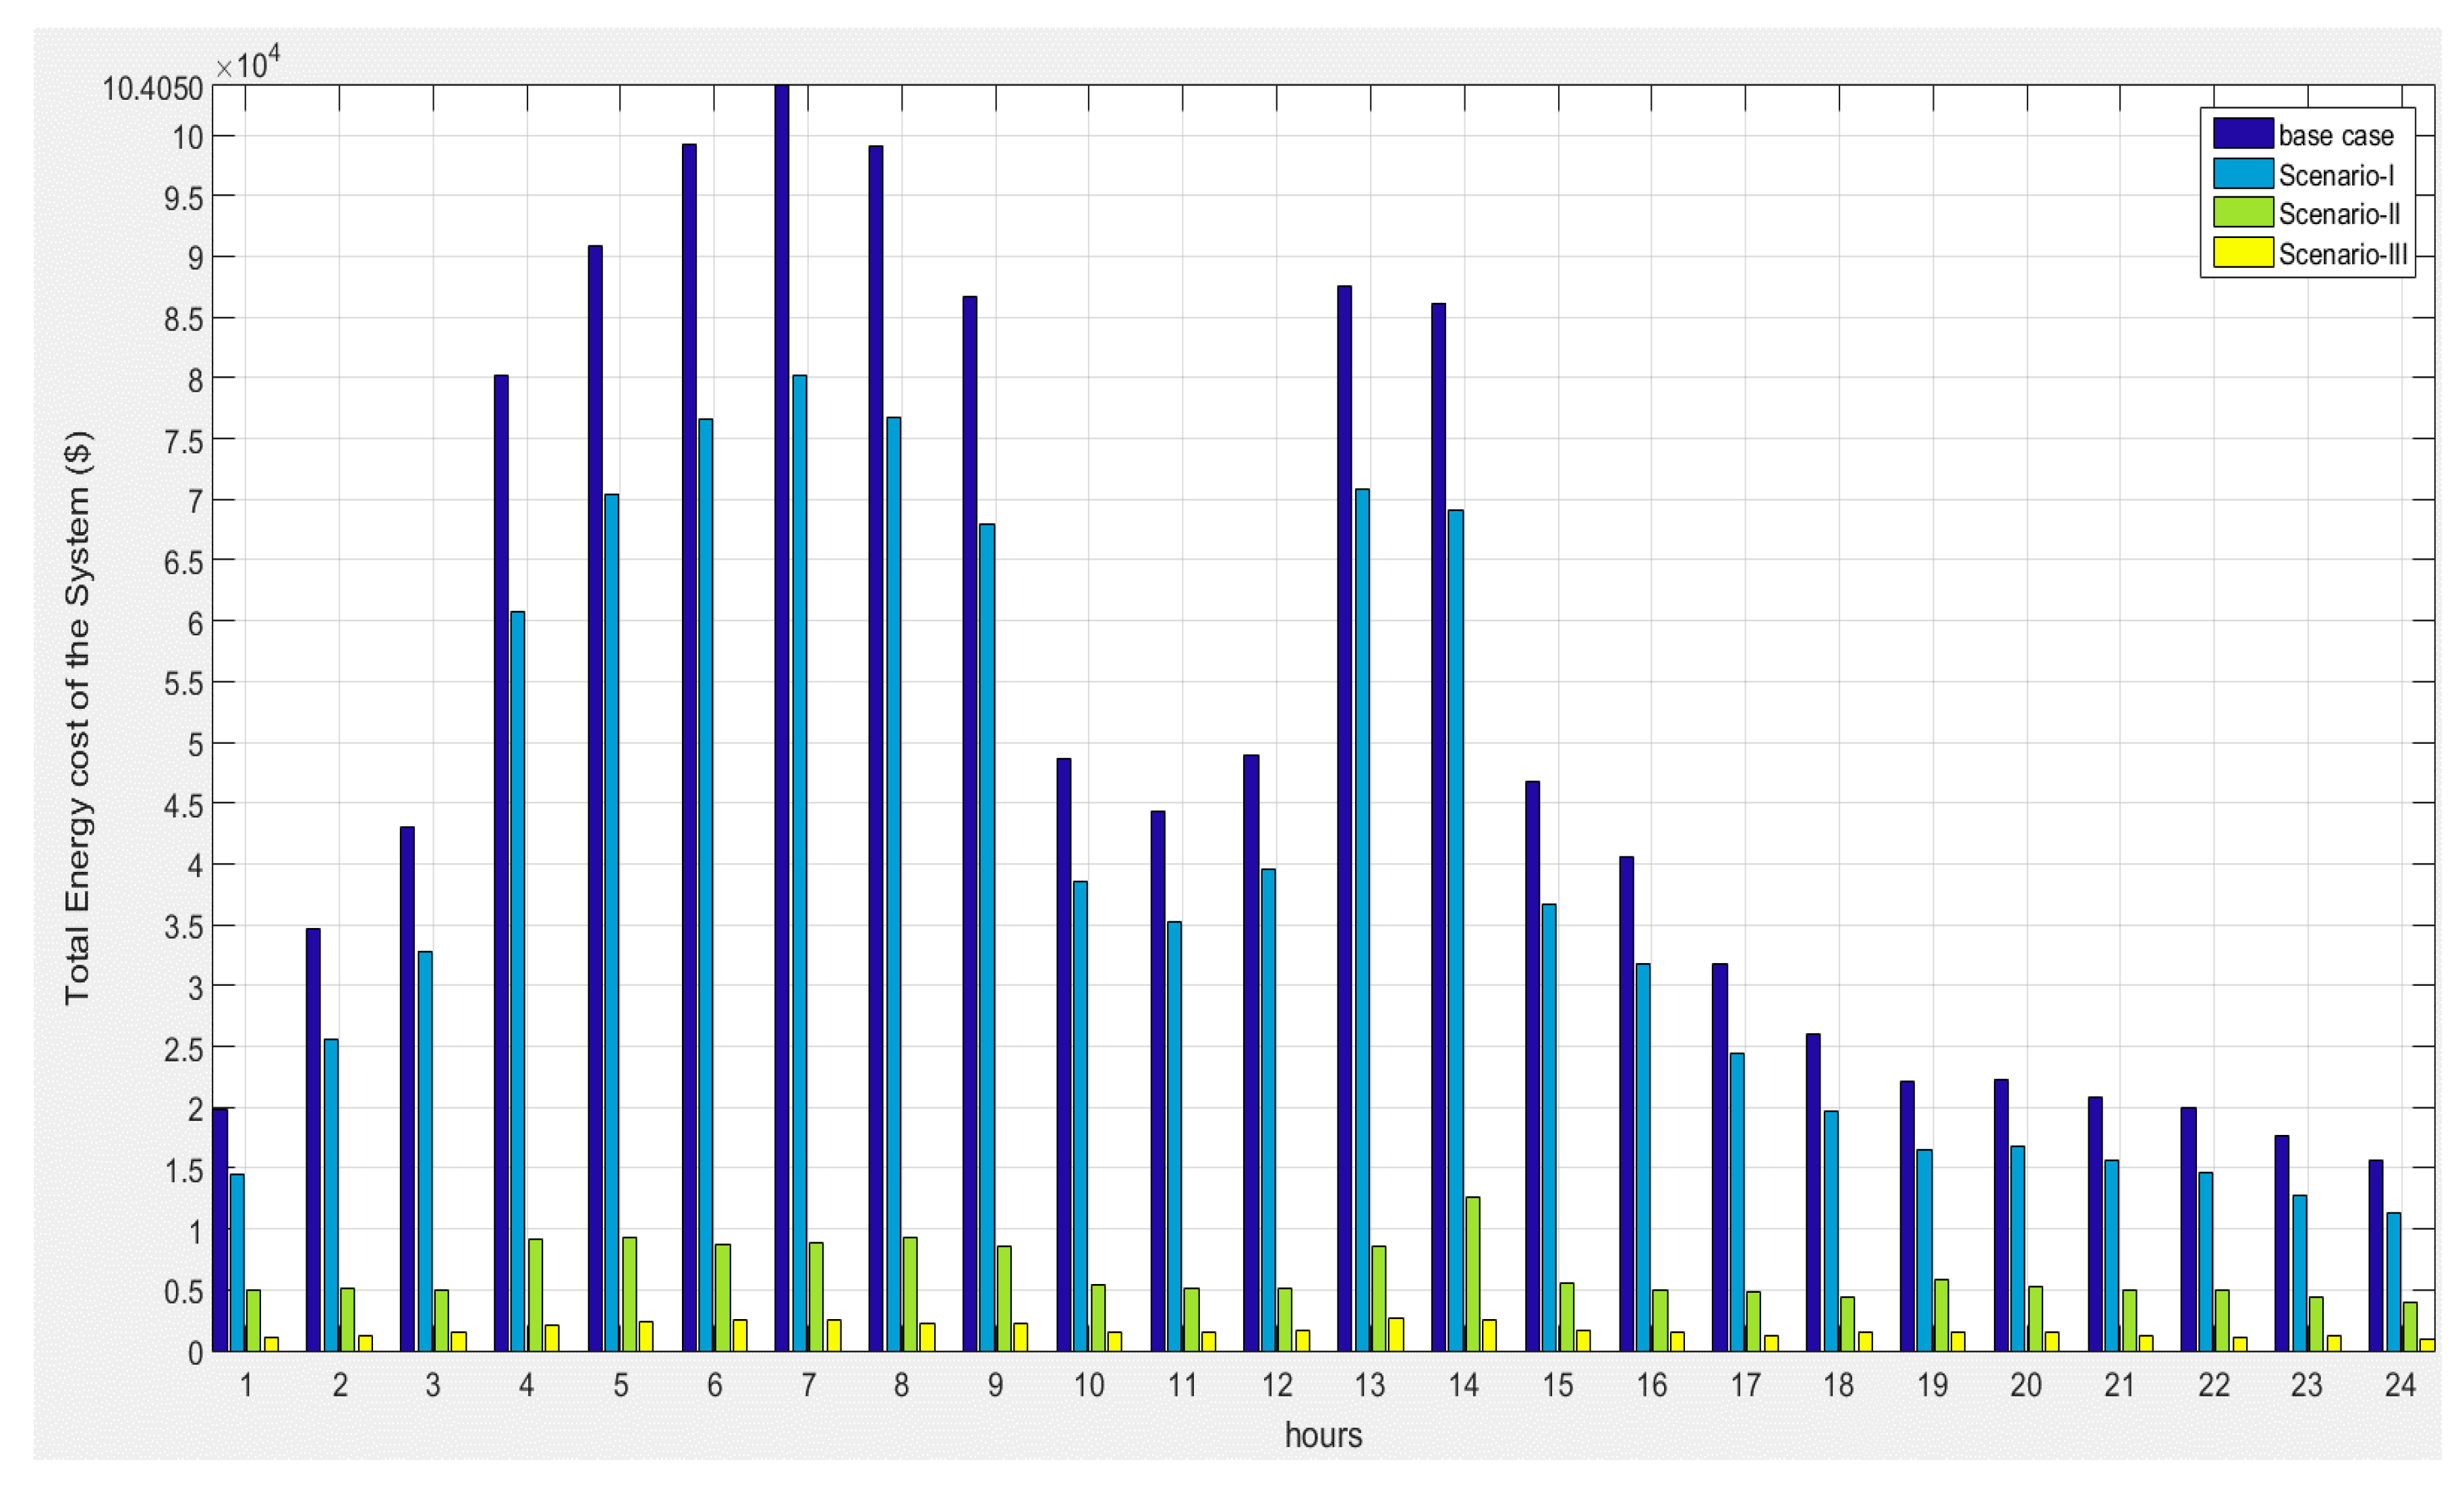
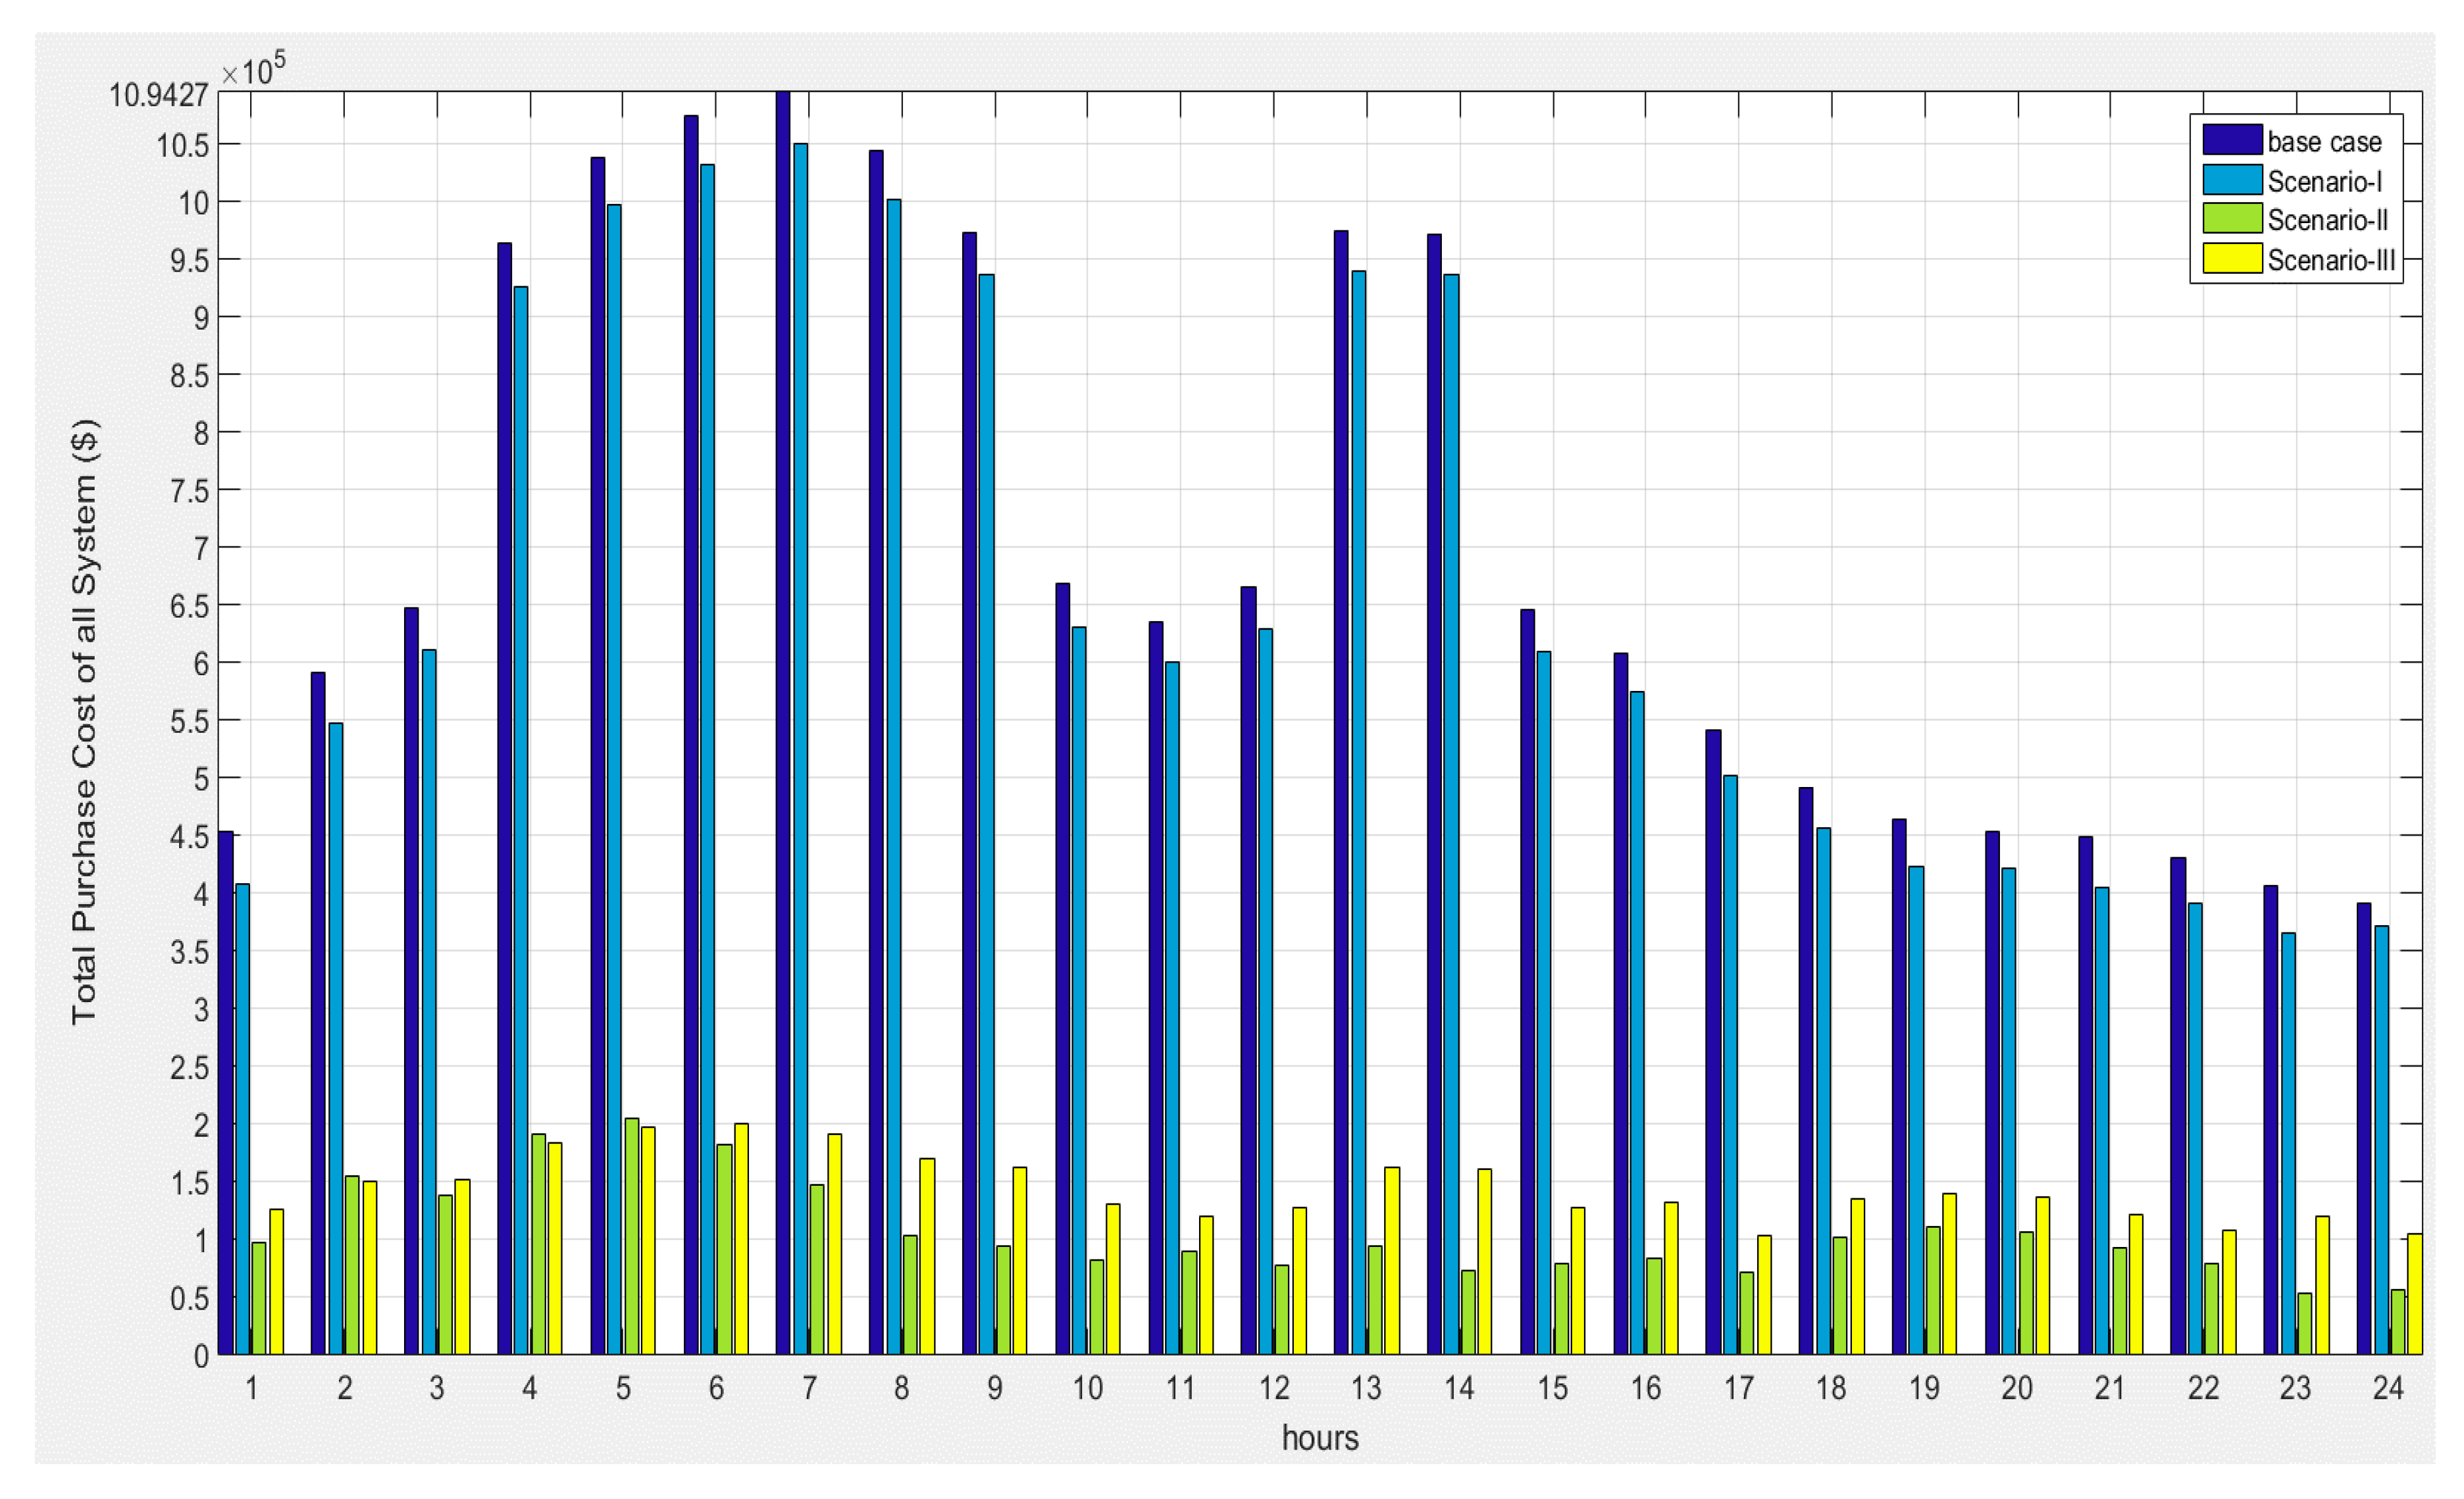
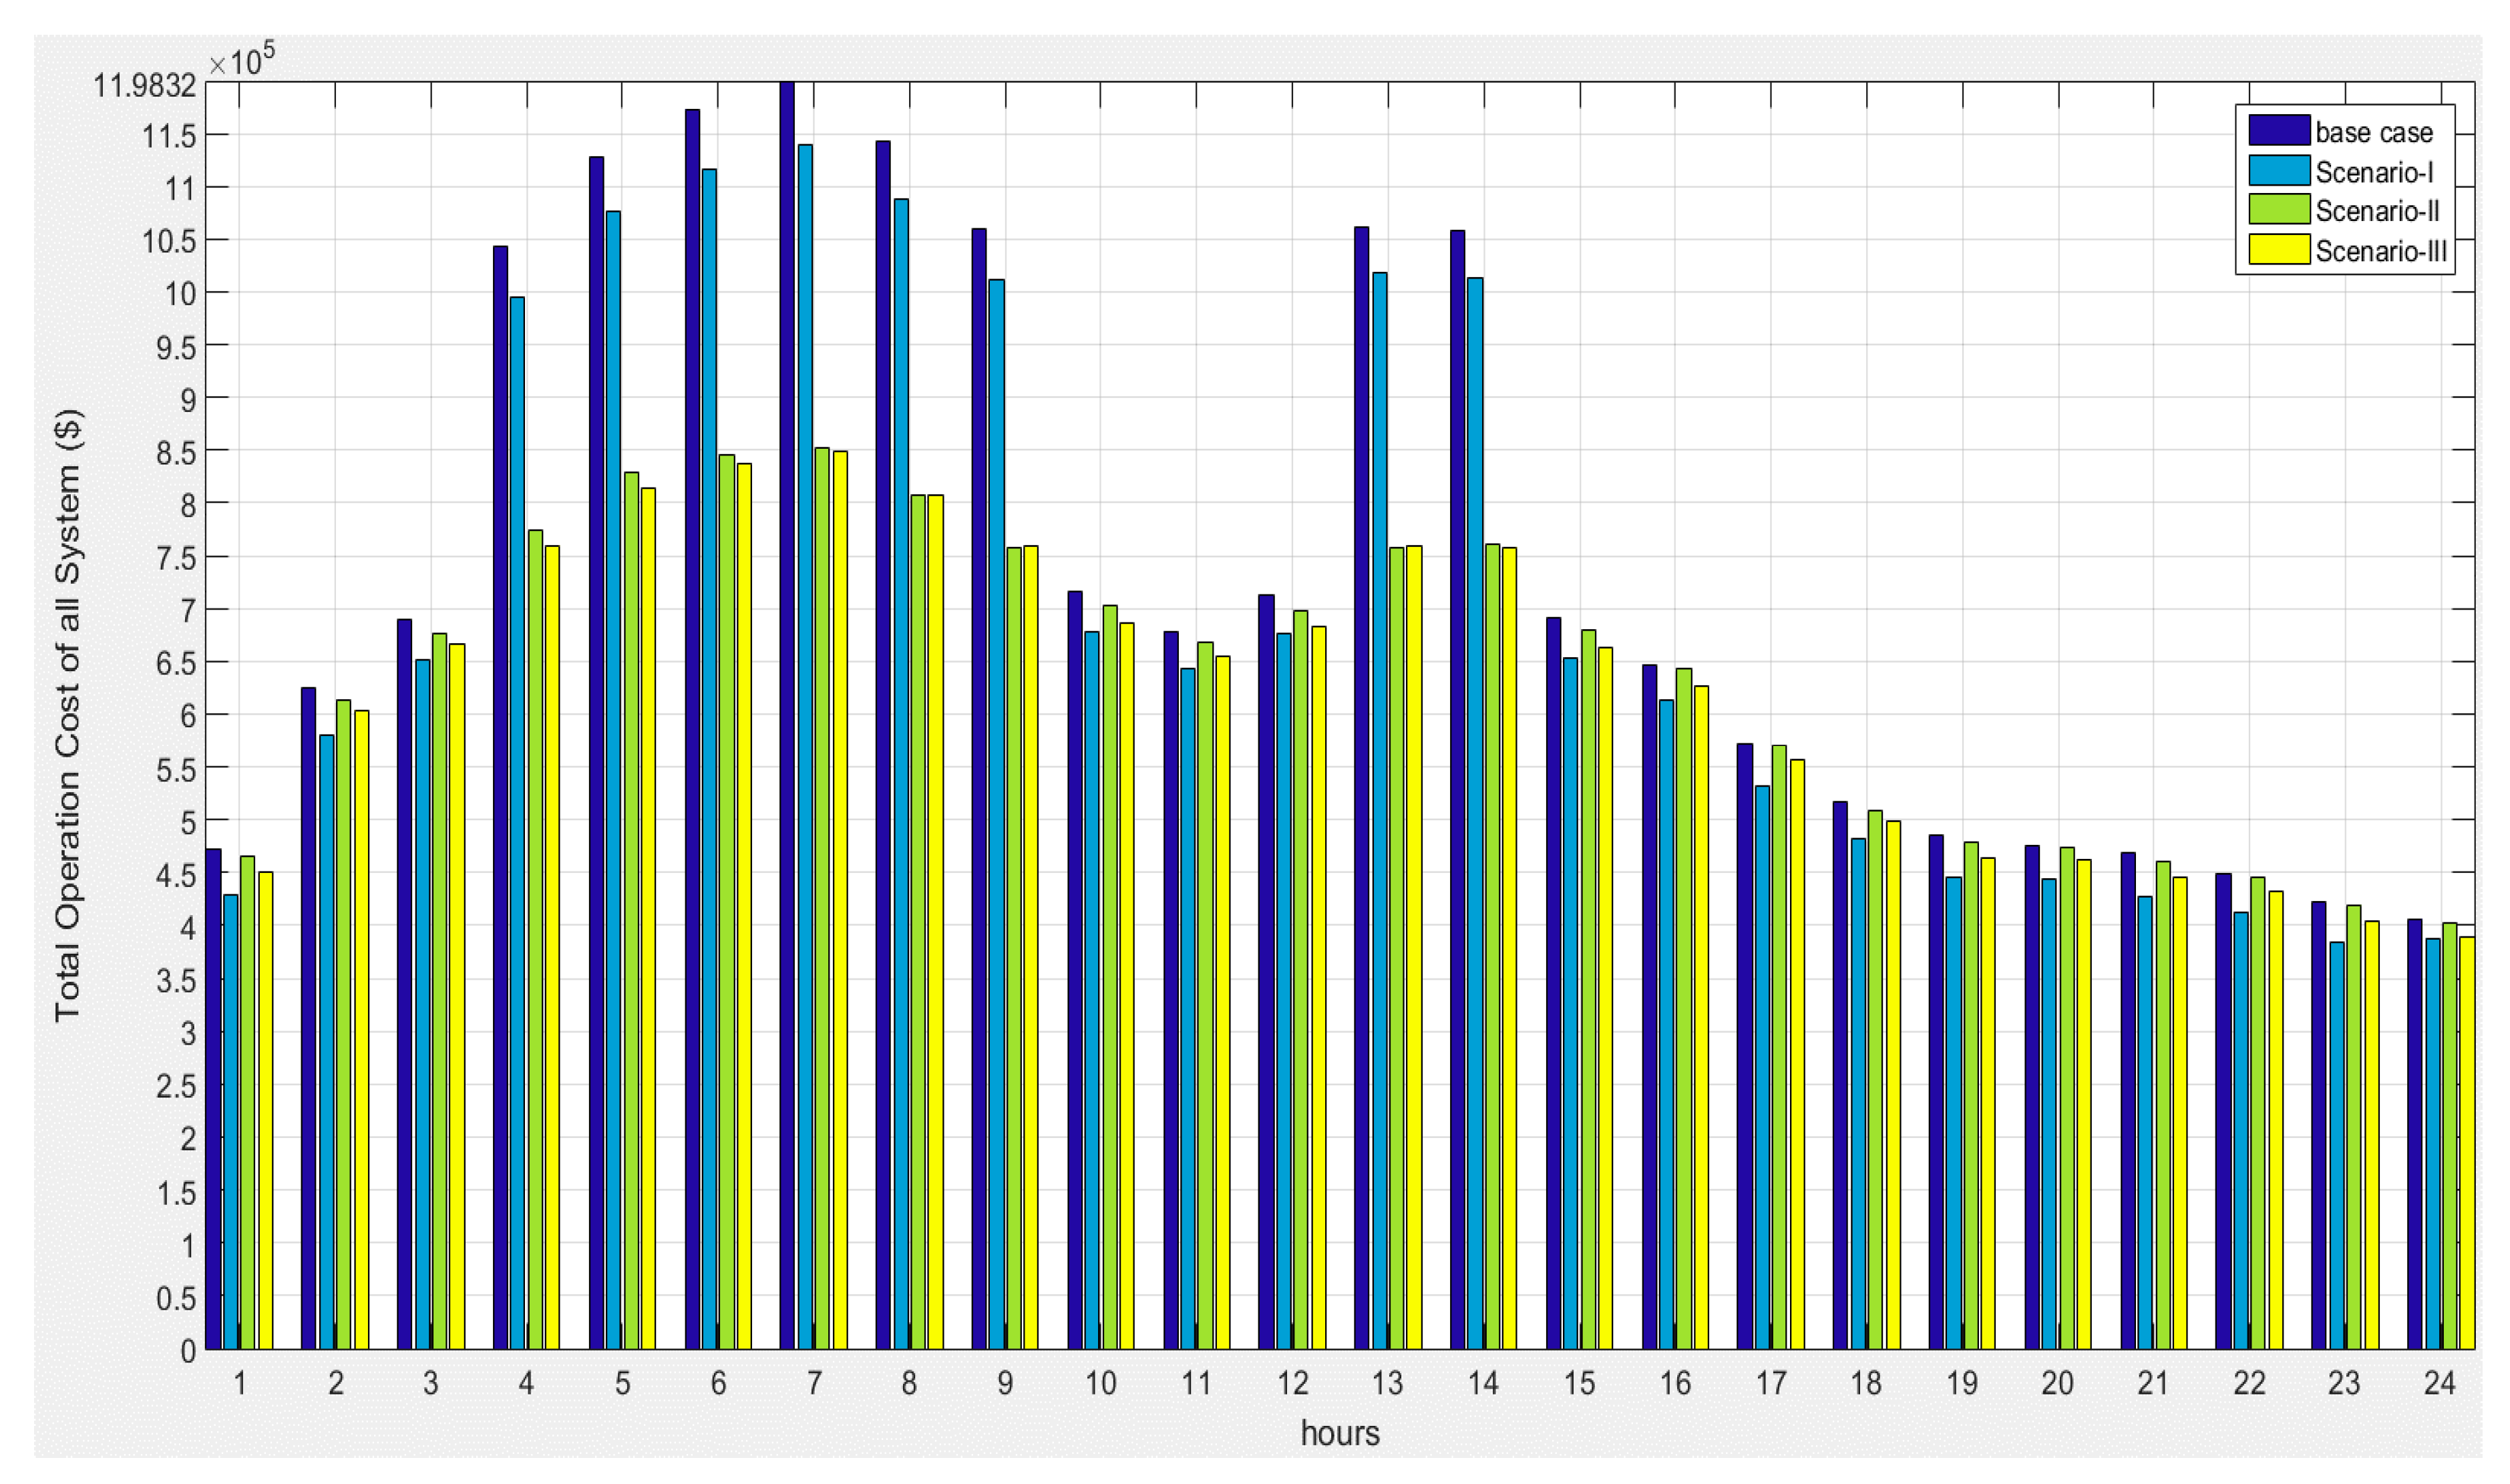
In Figure 22, the minimization of the system active power losses due to the RDGs and SCBs installations at different scenarios within 24 h are shown. The incorporation of both RDGs and SCBs in Scenario III minimized the total system losses effectively as compared to other scenarios. The energy losses cost ($/h) of MEDN are shown in Figure 23. The energy losses cost were minimized, which was clearly based on the installations of the RDGs and SCBs simultaneously in optimal locations and at optimal sizes in Scenario III. Figure 24 and Figure 25 illustrate the total purchasing costs and the total operating costs of the completely proposed system at three scenarios, and Scenario III succeeded in minimizing both costs effectively. In this regard, it was clear that the optimum allocation of the RDGs and SCBs simultaneously in Scenario III based on the SSA optimizer had a great effect in reducing system power losses, energy losses costs, and purchasing and total operating costs of the system, beside boosting the voltage levels and VSI profile of the proposed MEDN scheme.
To explain the difference between the three scenarios clearly, a comprehensive analysis between the scenarios at a peak hour of 14:00 was implemented, which was considered to be the worst case. Table 7 explains a comparison between Scenario I, Scenario II, and Scenario III at the worst peak load at 14:00 (the seventh hour). In this Table, the installation of the RDGs and SCBs in Scenario III had the highest reduction in active power losses of 97.5271%. In this scenario, the saving in energy losses costs was $101477.43, which was considered to be the highest saving amount as compared with the other scenarios. Although the purchase and total operating costs in Scenario III were higher than in Scenario II at the 14:00 case study, the purchase and total operating costs in Scenario III within 24 h were generally lower than Scenario I and Scenario II, as shown in Figure 24 and Figure 25. The voltage level and voltage stability index level of the different scenarios are explained in Figure 26 and Figure 27, respectively. The voltage and VSI levels were clearly improved in Scenario III to 0.9877 p.u. and 0.9518 p.u., respectively. From Table 7 and Figure 26 and Figure 27, the incorporation of locating the RDGs and SCBs had the best value, as compared with installing the SCBs or RDGs separately.

6. Conclusions

This paper introduces the very recent optimization approach Salp Swarm Algorithm (SSA) for the installation of RDGs and/or SCBs optimally on the various RDNs. A multi-objective function Index (MOFI) approach that improves voltage level, minimizing power loss and total operating cost sufficiently, is considered as the main objective function in this work, to boost the robustness, superiority, and performance of the prepared method by discovering the most optimal solutions. The proposed approach is tested on a 33-Bus IEEE radial distribution system under different load levels with different scenarios. Via the 33-Bus IEEE grid, two scenarios were assumed. In Scenario A, three RDG units, PV-type at unity PF, and three SCB devices. Scenario B considered one PV and two WTs at an optimal PF in addition to the three SCB devices. The obtained results are compared with the Grasshopper Optimization Algorithm (GOA) and the hybrid PSO with the Gravitational Search Algorithm (PSOGSA). Scenario B via PV, WT, and SCBs had the best results in comparison with Scenario A; consequently, it was deemed as the most favorable case for operating under different load conditions. The SSA optimizer proved its superiority with a high performance and accuracy for solving the problems of RDG and SCB locations and capacities simultaneously. Accordingly, this algorithm was selected to deal the optimum siting/capacity of the RDGs and SCBs for the Egyptian RDN via three scenarios. According to the numerical results, Scenario III with PV, WT, FC and SCB systems was superior, with sufficient effects compared to Scenario I with SCBs, and Scenario II with RDGs only, for solving the problems in the Egyptian case study. Scenario III sufficiently and clearly minimized system power losses, energy costs, and the whole operational-cost of the proposed scheme, along with a notable improvement in the voltage profile and voltage stability index.

Author Contributions

M.T., H.R. and A.A.Z.D. developed the idea and optimization methods, performed models simulations, analyzed the data and wrote the paper. M.A.-D. contributed by drafting and critical revisions. All authors together organized and refined the manuscript in the present form.

Conflicts of Interest

The authors declare no conflict of interest.

Nomenclature

NNumber of branches
P i , j , Q i , j The active and reactive power that flows through branch ‘N’.
P j , Q j The active and reactive power that are estimated at bus ‘j’.
P L j , Q L j Active and reactive load that are connected at node ‘j’.
ξ D G p The active power parameter that is set to 1 if there is an injected active power source (DG) or set to zero if there is no injected active power.
ξ S C B q Reactive power parameter that is equal to 1 if there is an injected reactive power source (SCB), or equal to zero if there is no injected reactive power.
ξ D G q Reactive power parameter that is equal to 1 if there is an injected reactive power source (DG), or equal to zero if there is no reactive power injection.
nbNumber of buses.
i1: nb (No of buses).
P T L o s s , b Base total active power losses.
T h The time in hours.
KeThe energy cost rate ($/MWh).
ETLoss,bBase total active energy loss cost.
InfRInflation rate (9%).
IntRInterest rate (12.5%)
TppPlanning period time represented as 20 years.
tyNumber of years (1: Tpp)
PDGC(I,j), QDGC(i,j)Active and reactive power with DGs and/or SCBs that flow through a sample branch.
PDGC,Loss(i,j)Active power losses with DGs and/or SCBs.
PDGC,TLossTotal active power losses after locating DGs and/or SCBs.
EDGSCB,TLossTotal active energy loss cost after installing DGs and/or SCBs.
ΔPlDGSCBPower loss index.
ViDGSCBPer-unit voltage at i-bus after installing the DGs and/or SCBs.
Vmax, VminMaximum and minimum voltage limits.
EmpElectricity market price ($/MWh).
Pdem, QdemThe total active and reactive power demand of the network.
PTLoad, QTLoadTotal active and reactive power load of the network (MW).
λ k * λ 1 * , λ 2 * , λ 3 * Parameter considered as the weight factors of the objective function.
KSCBPurchase cost of capacitor (3 $/kVAr).
ΔVIDevVoltage deviation index.
Q j C The value of installed reactive power (kVAr) at the j-location.
KbThe number of the capacitor position
KfThe cost per installation (1000 $/position).
K O M C Coefficient operation and maintenance cost of capacitor (300 $/position/year).
K O M D G Coefficient operation and maintenance cost of DG (36 $/MWh)
KDGPurchase cost of DG (400,000 $/MW).
S j D G DG capacity (MVA).
P j D G The value of the injected active power (MW) at j-location.
ΔOCDGSCBCost index (net operating cost).
PTLossTotal active power losses of the network (MW).
TOCT,DGSCBTotal annual operating cost with DGs and SCBs locations.
VSIVoltage stability index.
V D r max The maximum limit of the voltage drop.
V1Base per unit voltage.
LSFLoss sensitivity factor.
ViDGSCBPer-unit voltage at i-bus after installing the DGs and/or SCBs.
EmpElectricity market price ($/MWh).
Pdem, QdemThe total active and reactive power demand of the network.
PTLoad, QTLoadTotal active and reactive power load of the network (MW).
λ k * λ 1 * , λ 2 * , λ 3 * Parameter considered as the weight factors of the objective function.
KSCBPurchase cost of capacitor (3 $/kVAr).

References

  1. Aman, M.M.; Jasmon, G.B.; Bakar, A.H.A.; Mokhlis, H.; Karimi, M. Optimum shunt capacitor placement in distribution system—A review and comparativestudy. Renew Sustain. Energy Rev. J. 2014, 30, 429–439. [Google Scholar] [CrossRef]
  2. Tolba, M.A.; Zaki, D.A.A.; Tulsky, V.N.; Abdelaziz, A.Y. VLCI approach for optimal capacitors allocation in distribution networks based on hybrid PSOGSA optimization algorithm. Neural Comput. Appl. J. 2018. [Google Scholar] [CrossRef]
  3. Kalambe, S.; Aggnihotri, G. Loss minimization techniques used in distribution network: Bibliographical survey. Renew. Sustain. Energy Rev. J. 2014, 29, 184–200. [Google Scholar] [CrossRef]
  4. Hosseinzadeh, M.; Salmasi, F.R. Power management of an isolated hybrid AC/DC micro-grid with fuzzy control of battery banks. IET Renew. Power Gener. 2015, 9, 484–493. [Google Scholar] [CrossRef]
  5. Li, M.; Zhang, X.; Zhao, W. A Novel Stability Improvement Strategy for a Multi-Inverter System in a Weak Grid Utilizing Dual-Mode Control. Energies 2018, 11, 2144. [Google Scholar] [CrossRef]
  6. El-Fergany, A. Optimal allocation of multi-type distributed generators using backtracking search optimization algorithm. Electr. Power Energy Syst. 2015, 64, 1197–1205. [Google Scholar] [CrossRef]
  7. Sultana, U.; Khairuddin, A.B.; Aman, M.M.; Mokhtar, A.S.; Zareen, N. A review of optimum DG placement based on minimization of power losses and voltage stability enhancement of distribution system. Renew. Sustain. Energy Rev. 2016, 63, 363–378. [Google Scholar] [CrossRef]
  8. Niknam, T. A new approach based on ant colony optimization for daily Volt/Var control in distribution networks considering distributed generators. Energy Convers. Manag. 2008, 49, 3417–3424. [Google Scholar] [CrossRef]
  9. Abdelaziz, A.; Hegazy, Y.; El-Khattam, W.; Othman, M. A multi-objective optimization for sizing and placement of voltage-controlled distributed generation using supervised Big Bang-Big Crunch method. Electr. Power Com. Syst. 2015, 43, 105–117. [Google Scholar] [CrossRef]
  10. Oneto, L.; Laureri, F.; Robba, M.; Delfino, F.; Anguita, D. Data-Driven Photovoltaic Power Production Nowcasting and Forecasting for Polygeneration Microgrids. IEEE Syst. J. 2017, 12, 2842–2853. [Google Scholar] [CrossRef]
  11. Sudabattula, S.K.; Kowsalwa, M. Optimal allocation of wind-based distributed generators in distribution system using Cuckoo Search Algorithm. Procedia Comput. Sci. 2016, 92, 298–304. [Google Scholar] [CrossRef]
  12. Georgilakis, P.S.; Hatziargyriou, N.D. Optimal Distributed Generation Placement in Power Distribution Networks: Models, Methods, and Future Research. IEEE Trans Power Syst. 2013, 28, 3420–3428. [Google Scholar] [CrossRef]
  13. Tulsky, V.N.; Vanin, A.S.; Tolba, M.A.; Sharova, A.; Zaki, D.A.A. Study and analysis of power quality for an electric power distribution system—Case study: Moscow region. In Proceedings of the 2016 IEEE NW Russia Young Researchers in Electrical and Electronic Engineering Conference (EIConRusNW), St. Petersburg, Russia, 2–3 February 2016; pp. 710–716. [Google Scholar]
  14. Tolba, M.A.; Tulsky, V.N.; Vanin, A.S.; Zaki, D.A.A. Comprehensive analysis of optimal allocation of capacitor banks in various distribution networks using different hybrid optimization algorithms. In Proceedings of the 2017 IEEE International Conference on Environment and Electrical Engineering and 2017 IEEE Industrial and Commercial Power Systems Europe (EEEIC/I&CPS Europe), Milan, Italy, 6–9 June 2017. [Google Scholar] [CrossRef]
  15. El-Fergany, A.A.; Abdelaziz, A.Y. Cuckoo search-based algorithm for optimal shunt capacitors allocations in distribution networks. Electr. Power Compon. Syst. 2013, 41, 1567–1581. [Google Scholar] [CrossRef]
  16. Abdelaziz, A.; Hegazy, Y.; El-Khattam, W.; Othman, M. Optimal Planning of Distributed Generators in Distribution Networks Using Modified Firefly Method. Electr. Power Compon. Syst. 2015, 43, 3. [Google Scholar] [CrossRef]
  17. Sudabattula, S.K.; Kowsalwa, M. Optimal allocation of solar based distributed generators in distribution system using bat algorithm. Perspect. Sci. 2016, 8, 270–272. [Google Scholar] [CrossRef]
  18. Hung, D.Q.; Mithulananthan, N.; Lee, K.Y. Optimal placement of dispatchable and nondispatchable renewable DG units in distribution networks for minimizing energy loss. Int. J. Electr. Power Energy Syst. 2014, 55, 179–186. [Google Scholar] [CrossRef]
  19. Kansal, S.; Vishal, K.; Tyagi, B. Composite active and reactive power compensation of distribution networks. In Proceedings of the 2012 IEEE 7th International Conference on Industrial and Information Systems (ICIIS), Chennai, India, 6–9 August 2012. [Google Scholar] [CrossRef]
  20. Reddy, S.C.; Prasad, P.V.N.; Laxmi, A.J. Placement of distributed generator, capacitor and DG and capacitor in distribution system for loss reduction and reliability improvement. J. Electr. Eng. 2013, 1–9, 198. [Google Scholar]
  21. Naik, S.; Khatod, D.; Sharma, M. Optimal allocation of combined DG and capacitor for real power loss minimization in distribution networks. Int. J. Electr. Power Energy Syst. 2013, 53, 967–973. [Google Scholar] [CrossRef]
  22. Aman, M.M.; Jasmon, G.B.; Solangi, K.H.; Bakar, A.H.A.; Mokhlis, H. Optimum Simultaneous DG and Capacitor Placement on the Basis of Minimization of Power Losses. Int. J. Comput. Electr. Eng. 2013. [Google Scholar] [CrossRef]
  23. Kansal, S.; Kumar, V.; Tyagi, B. Optimal Placement of different type of DG sources in distribution network. Int. J. Electr. Power Energy Syst. 2013, 53, 752–760. [Google Scholar] [CrossRef]
  24. Imran, M.A.; Kowsalya, M. Optimal distributed generation and capacitor placement in power distribution networks for power loss minimization. In Proceedings of the 2014 International Conference on Advances in Electrical Engineering (ICAEE), Vellore, India, 9–11 January 2014. [Google Scholar]
  25. Zeinalzadeh, A.; Mohammadi, Y.; Moradi, M.H. Optimal multi objective placement and sizing of multiple DGs and Shunt Capacitor Banks Simultaneously Considering Load Uncertainty via MOPSO approach. Electr. Power Energy Syst. 2015, 67, 336–349. [Google Scholar] [CrossRef]
  26. Muthukumar, K.; Jayalalitha, S. Optimal Placement and Size of Distributed Generators and Shunt Capacitors for Power Loss Minimization in Radial Distribution Networks using Heuristic Search Optimization Technique. Electr. Power Energy Syst. 2016, 78, 299–319. [Google Scholar] [CrossRef]
  27. Khodabakhshian, A.; Andishgar, M.H. Simultaneous Placement and Sizing of DGs and Shunt Capacitors in Distribution Systems by Using IMDE algorithm. Electr. Power Energy Syst. 2016, 82, 599–607. [Google Scholar] [CrossRef]
  28. Dixit, M.; Kundu, P.; Jariwala, H.R. Incorporation of Distributed Generation and Shunt Capacitor in Radial Distribution System for Techno-Economic Benefits. Eng. Sci. Tech. Int. J. 2017, 20, 482–493. [Google Scholar] [CrossRef]
  29. El-Fergany, A.A.; Abdelaziz, A.Y. Efficient heuristic-based approach for multi-objective capacitor allocation in radial distribution networks. IET Gener. Transm. Distrib. 2014, 8, 79–80. [Google Scholar] [CrossRef]
  30. Moradi, M.N.; Abedini, M. A combination of genetic algorithm and particle swarm optimization for optimal DG location and sizing in distribution systems. Electr. Power Energy Syst. 2012, 34, 66–74. [Google Scholar] [CrossRef]
  31. Devabalaji, K.R.; Yuvaraj, T.; Ravi, K. An efficient method for solving the optimal sitting and sizing problem of capacitor banks based on cuckoo search algorithm. Ain Shams Eng. J. 2016. [Google Scholar] [CrossRef]
  32. Ali, E.S.; Abd Elazim, S.M.; Abdelaziz, A.Y. Ant Lion Optimization Algorithm for optimal location and sizing of renewable distributed generations. Renew. Energy J. 2017, 101, 1311–1324. [Google Scholar] [CrossRef]
  33. Rezk, H.; Tyukhov, I.; Raupov, A. Experimental implementation of meteorological data and photovoltaic solar radiation monitoring system. Int. Trans. Electr. Energy Syst. 2015, 25, 3573–3585. [Google Scholar] [CrossRef]
  34. Rezk, H.; Tyukhov, I.; Al-Dhaifallah, M.; Tikhonov, A. Performance of data acquisition system for monitoring PV system parameters. Measurement 2017, 104, 204–211. [Google Scholar] [CrossRef]
  35. Shiroudi, A.; Taklimi, S.; Mousavifar, S.; Taghipour, P. Stand-alone PV-hydrogen energy system in Taleghan-Iran using HOMER software: Optimization and technoeconomic analysis. Environ. Dev. Sustain. J. 2013, 15, 1389–1402. [Google Scholar] [CrossRef]
  36. Benyahia, N.; Denoun, H.; Badji, A.; Zaouia, M.; Rekioua, T.; Benamrouche, N.; Rekioua, D. MPPT controller for an interleaved boost dc-dc converter used in fuel cell electric vehicles. Int. J. Hydrogen Energy 2014, 39, 15196–15205. [Google Scholar] [CrossRef]
  37. Maher, A.R.; Al-Baghdadi, S. Modelling of proton exchange membrane fuel cell performance based on semi-empirical equations. Renew. Energy 2005, 30, 1587–1599. [Google Scholar]
  38. Lee, J.H.; Lalk, T.R.; Appleby, A.J. Modeling electrochemical performance in large scale proton exchange membrane fuel cell stacks. J. Power Sources 1998, 70, 258–268. [Google Scholar] [CrossRef]
  39. Mirjalili, S.; Gandomi, A.; Mirjalili, S.Z.; Saremi, S.; Faris, H.; Mirjalili, S.M. Salp Swarm Algorithm: A bio-inspired optimizer for engineering design problems. Adv. Eng. Softw. J. 2017, 114, 163–191. [Google Scholar] [CrossRef]
  40. Madin, L. Aspects of jet propulsion in salps. Can. J. Zool. 1990, 68, 765–777. [Google Scholar] [CrossRef]
  41. Anderson, P.A.; Bone, Q. Communication between individuals in salp chains II. physiology. Proc. R Soc. B. 1980. [Google Scholar] [CrossRef]
  42. Wolpert, D.H.; Macready, W.G. No free lunch theorems for optimization. IEEE Trans. Evol. Comput. 1997, 1, 67–82. [Google Scholar] [CrossRef] [Green Version]
  43. Mohamed, M.A.; Diab, A.A.Z.; Rezk, H. Partial Shading Mitigation of PV Systems via Different Meta-Heuristic Techniques. Renew. Energy 2018, 130, 1159–1175. [Google Scholar] [CrossRef]
  44. Sajjadi, S.M.; Haghifam, M.R.; Salehi, J. Simultaneous placement of distributed generation and capacitors in distribution networks considering voltage stability index. Power Energy Syst. 2013, 46, 366–375. [Google Scholar] [CrossRef]
  45. Tolba, M.A.; Rezk, H.; Tulsky, V.; Diab, A.A.Z.; Abdelaziz, A.Y.; Vanin, A. Impact of Optimum Allocation of Renewable Distributed Generations on Distribution Networks Based on Different Optimization Algorithms. Energies 2018, 11, 245. [Google Scholar] [CrossRef]
  46. NASA database. Available online: https://eosweb.larc.nasa.gov/sse/ (accessed on 15 October 2017).
  47. Homer software. Available online: https://www.homerenergy.com/homer-pro.html (accessed on 12 January 2018).
  48. Hadidian-Moghaddam, M.J.; Arabi-Nowdeh, S.; Bigdeli, M.; Azizian, D. A multi-objective optimal sizing and siting of distributed generation using ant lion optimization technique. Ain Shams Eng. J. 2017. [Google Scholar] [CrossRef]
Figure 1. Distribution network diagram.
Energies 11 02556 g001
Figure 2. The main steps of the Salp Swarm Algorithm (SSA).
Energies 11 02556 g002
Figure 3. The line diagram of the IEEE 33-bus radial distribution network.
Energies 11 02556 g003
Figure 4. The values of PLSF and QLSF of 33-Bus RDN.
Energies 11 02556 g004
Figure 5. Scenario A: Objective function variation in the case of PSOGSA (7 iterations), GOA (8 iterations), and SSA (7 iterations).
Energies 11 02556 g005
Figure 6. Impact of compensated devices upon the voltage profile in scenarios A and B by different optimizers.
Energies 11 02556 g006
Figure 7. Effect of the integrated units on the voltage stability index level in scenarios A and B by different optimizers.
Energies 11 02556 g007
Figure 8. Scenario B: Variation of objective function value.
Energies 11 02556 g008
Figure 9. A 15-bus system of the Middle Egyptian Distribution Network (MEDN).
Energies 11 02556 g009
Figure 10. Voltage profile curves over 24 h.
Energies 11 02556 g010
Figure 11. Real and reactive power curves at every node at 11 kV over 24 h.
Energies 11 02556 g011
Figure 12. The operation of the SSA optimizer.
Energies 11 02556 g012
Figure 13. Daily solar irradiance for the studied case in in each month.
Energies 11 02556 g013
Figure 14. Average wind speed for each month.
Energies 11 02556 g014
Figure 15. Hourly data characteristics of the PV, WT, and FC systems for the site under study (kW/h).
Energies 11 02556 g015
Figure 16. Scenario I: Hourly data of switched SCBs at buses 10 and 14 (kVAr/h).
Energies 11 02556 g016
Figure 17. Scenario II: Hourly data of the integrated RDGs at buses 7 and 11 (kW/h).
Energies 11 02556 g017
Figure 18. Scenario III: Hourly data of the switched SCBs at buses 10 and 14 (kVAr/h).
Energies 11 02556 g018
Figure 19. Scenario III: Hourly data of the integrated RDGs at buses 7 and 11 (kW/h).
Energies 11 02556 g019
Figure 20. Hourly data of the voltage profiles in different scenarios.
Energies 11 02556 g020
Figure 21. Hourly data of the voltage stability index profiles in different scenarios.
Energies 11 02556 g021
Figure 22. Hourly data of system active power losses (kW/h) based on different scenarios.
Energies 11 02556 g022
Figure 23. Hourly data of energy loss costs ($/h) in different scenarios.
Energies 11 02556 g023
Figure 24. Hourly data of the total purchase cost of all systems ($/h) in different scenarios.
Energies 11 02556 g024
Figure 25. Hourly data of the TOCT,DGSCB (Total operating cost) ($/h) in different scenarios.
Energies 11 02556 g025
Figure 26. Voltage profile (p.u) in three scenarios at the highest peak load.
Energies 11 02556 g026
Figure 27. Voltage stability index profile (p.u) in different scenarios at the highest peak load.
Energies 11 02556 g027
Table 1. The information of network condition based load levels via electricity price and energy cost for the 33-Bus IEEE radial distribution network (RDN).
LevelGrid StateTime Th (h/Year)Emp Electricity Price ($/MWh)Ke Energy Price ($/MWh)
50%light29203525
100%nominal43804940
150%peak14607065
Table 2. The values of the optimization coefficients and parameters.
OptimizerParameter Definition
PSOGSAc1 = 0.5, c2 = 1.5, max. iterations = 20, no. of agents = 20, α = 23, GO = 1
Gravitational Search Algorithm (GOA)cmax = 1, cmin = 0.00004, f = 0.5, li = 1.5, max. iterations = 20, search agents = 20
SSAMax. iterations = 20, search agents = 20
Table 3. The definition of the parameters used.
Iteration No. λ 1 * λ 2 * λ 3 * DG-6DG-14DG-31Losses = P + j QVminTOCT,DGSCBΔVIDevΔPlDGSCBΔOCDGSCBMOFI
111178078078022.4315 + j 17.21010.981710,716,599.740.37950.10630.87171.3575
20.40.50.1780748.0878022.2448 + j 17.04820.981610,729,763.430.37990.10540.87270.3194
30.30.60.178078078022.4315 + j 17.21010.981710,716,599.740.37950.10630.87170.3468
40.20.70.178078078022.4315 + j 17.21010.981710,716,599.740.37950.10630.87170.3741
50.10.80.178078078022.4315 + j 17.21010.981710,716,599.740.37950.10630.87170.4014
60.50.40.1780748.0878022.2448 + j 17.04820.981610,729,763.430.37990.10540.87270.2919
70.50.30.2780748.0878022.2448 + j 17.04820.981610,729,763.430.37990.10540.87270.3412
80.50.20.3780748.0878022.2448 + j 17.04820.981610,729,763.430.37990.10540.87270.3905
90.50.10.478078078022.4315 + j 17.21010.981710,716,599.740.37950.10630.87170.4398
100.60.10.3780748.0878022.2448 + j 17.04820.981610,729,763.430.37990.10540.87270.3631
110.60.20.2780748.0878022.2448 + j 17.04820.981610,729,763.430.37990.10540.87270.3138
120.70.20.178078078022.4315 + j 17.21010.981710,716,599.740.37950.10630.87170.2374
130.80.10.178078078022.4315 + j 17.21010.981710,716,599.740.37950.10630.87170.2102
140.40.10.578078078022.4315 + j 17.21010.981710,716,599.740.37950.10630.87170.5163
150.30.10.678078078022.4315 + j 17.21010.981710,716,599.740.37950.10630.87170.5928
160.20.10.778078078022.4315 + j 17.21010.981710,716,599.740.37950.10630.87170.6694
170.10.10.878078078022.4315 + j 17.21010.981710,716,599.740.37950.10630.87170.7459
The bold row are the parameters chosen for the values of the waiting factors.
Table 4. Scenario A and Scenario B results of 33-Bus RDN by different proposed techniques.
ItemsBase CaseScenario AScenario B
PSOGSAGOA, SSAPSOGSAGOA, SSA
Total losses (kW)210.9822.7422.244820.088220.0207
Loss reduction (%)-89.2189.45690.4790.51
Energy cost ($)539,318.3858,150.5556,866.7651,353.5651,180.61
Saving of energy cost ($)-481,167.83482,451.62487,964.82488,137.77
Vmin (p.u)0.90370.98160.98190.98290.9829
VSImin (p.u)0.66720.92850.92950.93340.9334
Optimum RDGs siting/capacity (kVA)/optimum PF-6/800/16/780/16/1274.75/0.90216/1193.6/1
13/700/114/748.08/113/700/114/701.94/0.9040
31/800/131/780/131/860.232/0.813731/810.83/0.8320
∑ kVA of DG (kVA)-23002308.082834.982706.37
Optimal capacitor location/size (kVAr)-8/3006/5008/1006/550
14/45017/30014/20017/100
30/90030/70030/30030/400
∑ kVAr of capacitor (kVAr)-165015006001050
Capacitor installation cost ($)-7950750048006150
O&M capacitor cost ($)-13,132.213,132.213,132.213,132.2
DG installation cost ($)-920,000923,235.481,126,163.4261,082,198.26
O&M DG cost ($)-5,291,751.585,310,361.755,866,941.975,757,847.87
Purchased real power cost covering losses ($)12,294,529.754,502,437.274,475,534.133,711,212.933,859,490.25
Total annual operating cost (TOCT,DGSCB) ($)12,833,848.1310,793,421.6110,786,630.3110,773,604.0910,769,999.21
Net saving ($)-2,040,426.522,047,217.822,060,244.042,063,848.92
Saving (%)-15.898815.951716.053216.0813
VDI0.427540.16240.16190.16150.1615
ΔVIDev-0.37990.37860.37770.3777
ΔPlDGSCB-0.10780.10540.09520.0949
ΔOCDGSC-0.87320.87270.87210.8718
Total objective function (MOFI)-0.29270.29190.28590.2857
CPU (time speed) s/No. Iter.0.5395.75/(7)GOA: 6.84/(8), SSA: 5.30/(7)12.16/(18)GOA: 13.14/(19), SSA: 10.84/(19)
The bold columns are the best results.
Table 5. Different metrics used to evaluate the performance of each optimizer.
ItemAcronymEquation
Relative errorRE i = 1 n r ( M O F I i M O F I min ) M O F I min * 100 %
Mean absolute errorMAE i = 1 n r ( M O F I i M O F I min ) n r
Root mean square errorRMSE i = 1 n r ( M O F I i M O F I min ) 2 n r
Standard deviationSD i = 1 n r ( M O F I i M O F I ¯ ) 2 n r
EfficiencyEff M O F I min M O F I i * 100 %
Table 6. Attitude estimation of PSOGSA, GOA, and SSA techniques under two scenarios, A and B. The number of runs is 30.
ScenarioTechniqueBest Minimum Value of Objective Function MOFIbestWorst Value of Objective Function MOFIWorstMedianSDAverage RE %MAE (Mean Absolute Error)RMSE (Root Mean Square Error)Efficiency %
Scenario AGOA0.29190.29190.29191.6951 × 10−85.2109 × 10−95.0709 × 10−111.7420 × 10−10100.0000
SSA0.29190.29190.29192.3554 × 10−104.4890 × 10−114.3684 × 10−132.3567 × 10−12100.0000
PSOGSA0.29190.29380.29270.02780.08818.5692 × 10−48.9957 × 10−499.7074
Scenario BGOA0.28570.28570.28571.4748 × 10−66.3049 × 10−76.0047 × 10−91.0785 × 10−599.9974
SSA0.28570.28590.28575.5412 × 10−41.3120 × 10−41.2495 × 10−65.5895 × 10−699.9996
PSOGSA0.28570.28610.28600.00880.03072.9250 × 10−43.0501 × 10−499.8977
Bold items show the best results by SSA.
Table 7. The results of Scenario I, Scenario II, and Scenario III for the MEDN system at 14:00 (seventh hour) based on SSA.
ItemsBase CaseScenario IScenario IIScenario III
Total Losses (kW)225.4637177.171715.07685.5753
Loss Reduction (%)-21.417793.3197.5271
Energy Cost ($)104,050.4281,763.896957.872572.98
Saving of Energy Cost ($)-22286.5397,092.55101,477.43
Vmin (p.u)/Bus (15)0.85930.90530.97270.9877
VSImin (p.u)/Bus (15)0.54530.67180.89510.9518
Power Factor (PF)0.89500.99920.52190.9987
Optimal DG Siting/Capacity (kVA)/Optimum PF--(7)/894.42/0.8944
(11)/900/1
(7)/854.40/0.9363
(11)/800/1
∑ kVA of DG (kVA)--1794.421654.40
Optimal Capacitor Location/Size (kVAr)-(10) 450
(14) 450
-
-
(10) 350
(14) 200
∑ kVAr of capacitor (kVAr)-900-550
Capacitor Installation and O&M Cost ($)-14100-11,426.9
DG installation and O&M cost ($)--689,515.56648,955.82
Purchased Active Power Cost including Losses ($)1,094,265.371,070,264.49144,812.78189,790.09
Total Operating Cost (TOCT,DGSCB) ($)1,198,315.791,157,214.68841,286.22852,745.80
Net Saving ($)-41,101.10357,029.57345,569.98
Saving (%)-3.429929.7928.8380
VDI0.37000.23830.16070.1672
ΔVIDev-0.64400.43420.4518
ΔPlDGSCB-0.78580.06690.0247
ΔOCDGSCB-0.96570.70210.7116
Total Objective Function (MOFI)-0.74710.27730.2636