1. Introduction
Nowadays, energy consumption is continuously growing on a global scale, this progressive demand increase needs to be satisfied [
1,
2,
3]; however, the quality and reliability of the system have to be maintained.
Traditional energy generation using conventional sources, such as oil, gas, and coal, increases the local pollution and affects global warming. To solve this inconvenient the promotion of renewable energies is a reality, being wind power generation the technology that has experienced the most growth over the last decade [
4,
5]. In order to maintain this growth over the next thirty years, renewable facilities need to be made more lucrative to investors, as photovoltaic (PV) power plants are doing by reducing the panel costs. In the case of wind power operational expenditures (OPEX) can be highly reduced. The use of condition monitoring systems (CMS) [
6,
7,
8] has clearly improved energy production efficiency and reduced the operational costs of wind plants by: (i) reducing lost energy; (ii) reducing the impact of failures and its associated costs; and, (iii) increasing the total life cycle of the assets [
1].
It is possible to identify failure patterns in wind turbines, and thus anticipate possible failure modes using mathematical models and artificial intelligence techniques in maintenance. Condition based maintenance (CBM) assumes that by detecting no normal behavior and the failure mode that the equipment presents, it is possible to estimate when the failure or breakdown will happen with a certain probability, and then preventive (or condition based) maintenance can be scheduled before the failure occurs [
9].
The purpose of this paper is to present a novel methodology to detect malfunctioning using models of normal behavior of several components over the life cycle of the wind turbine as a complementary methodology presented in other papers where multi-layer perceptron (MLP) neural networks were used [
6,
10,
11]. This complementary aspect of the method proposed is based on the identification of patterns of behavior that were discovered directly from values of variables that can alert about the recognition of an anomaly, instead of modelling the relationships between output and input observed as usual in MLP neural networks and physical models. The method proposed is within the family of unsupervised modelling, where previous knowledge is not required concerning the output for a set of inputs introduced in a model. This advantage usually is parallel to an easier preparation of a training set to discover the patterns, and furthermore, from the point of view of the user, thorough knowledge is not required in order to obtain them.
This paper is organized as follows.
Section 2 describes the methodology to obtain indicators of anomaly behavior based on reference patterns.
Section 3 describes the training set that was used in the paper to demonstrate the methodology proposed in components of a wind turbine. The process of the creation of reference patterns based on the normal expected behavior is presented in
Section 4, and following in
Section 5, the method of anomaly detection with real cases is provided.
Section 6 proposes the definition of anomaly indicators for monitoring the components of a wind turbine. Finally,
Section 7 presents the conclusions obtained from the previous sections.
2. Process of Creation and Use of the Behavior Anomaly Indicators Based on Reference Patterns
This section describes the main steps of the process to follow in order to build the new anomaly indicators proposed in this paper that are able to detect abnormal behavior in components of a wind turbine. These indicators are based on patterns that were previously obtained observing the typical normal behavior of the components monitored [
12,
13,
14].
The estimation of the indicators mentioned requires the development of the following sequential steps:
Selection of a data training set for learning the typical normal behavior of the component. This includes data selection and filtering, removing of outliers, and treatment of missing measurements.
Study of a failure mode and effects analysis in a wind turbine, previously developed by the authors and inspired from references [
15,
16]. This allows for paying attention to those failure modes that could be detected according to the values of variables available collected by the SCADA system of the wind turbine. These variables will be used for the characterization of normal behavior patterns that are developed in the next step.
Building of normal behavior patterns of a component described through variables collected in real-time from the wind turbine. The case studied in this paper is based on data samples that were collected every ten minutes. The patterns are built using self-organizing map techniques [
17]. This technique is unsupervised. This means that no previous knowledge is strictly required to obtain patterns of behavior such as those which are required for anomaly detection based on MLP neural networks. However, some knowledge about possible variables that can explain when an anomaly is present, is convenient. Even when this method can be used in isolated manner with good results, such as that which is presented in the paper, a hybrid model based on supervised and unsupervised neural network methods can benefit from the advantages of both approaches being more accurate the detection of abnormal behavior.
Definition of the probability distributions that the reference patterns represent. The model of probability distribution used is the Gaussian function because it is expected that the most part of the samples are closely surrounding the pattern discovered, and much less samples are away from it. The consideration of the probability distributions represented by the reference patterns is a new feature added to the method proposed in order to know the membership degree of the data observed, as represented by each normal behavior pattern discovered.
Estimation of the anomaly indicator. Once the previous steps are completed, the indicator of anomalies can be estimated. Its objective is to warn about data collected that do not correspond to the expected behavior by the reference patterns and the probability distributions of them. The evolution of the values of the behavior anomaly indicators over time will suggest whether or not it is necessary to pay attention to the components monitored from the point of view of scheduled maintenance and operation.
The next sections will describe details about each of the previous steps.
3. Training Set
The training set used in this paper is based on measurements that were taken every ten minutes from a wind turbine with a rated power of 2 MW. There are 32 variables which are available for a period of almost six years (2008–2014), including 9.321.984 samples in total that correspond to operational and environmental conditions of the wind turbine and to different components of it. For this study, no digital signal, such as alarms or operational state transitions, were considered [
18].
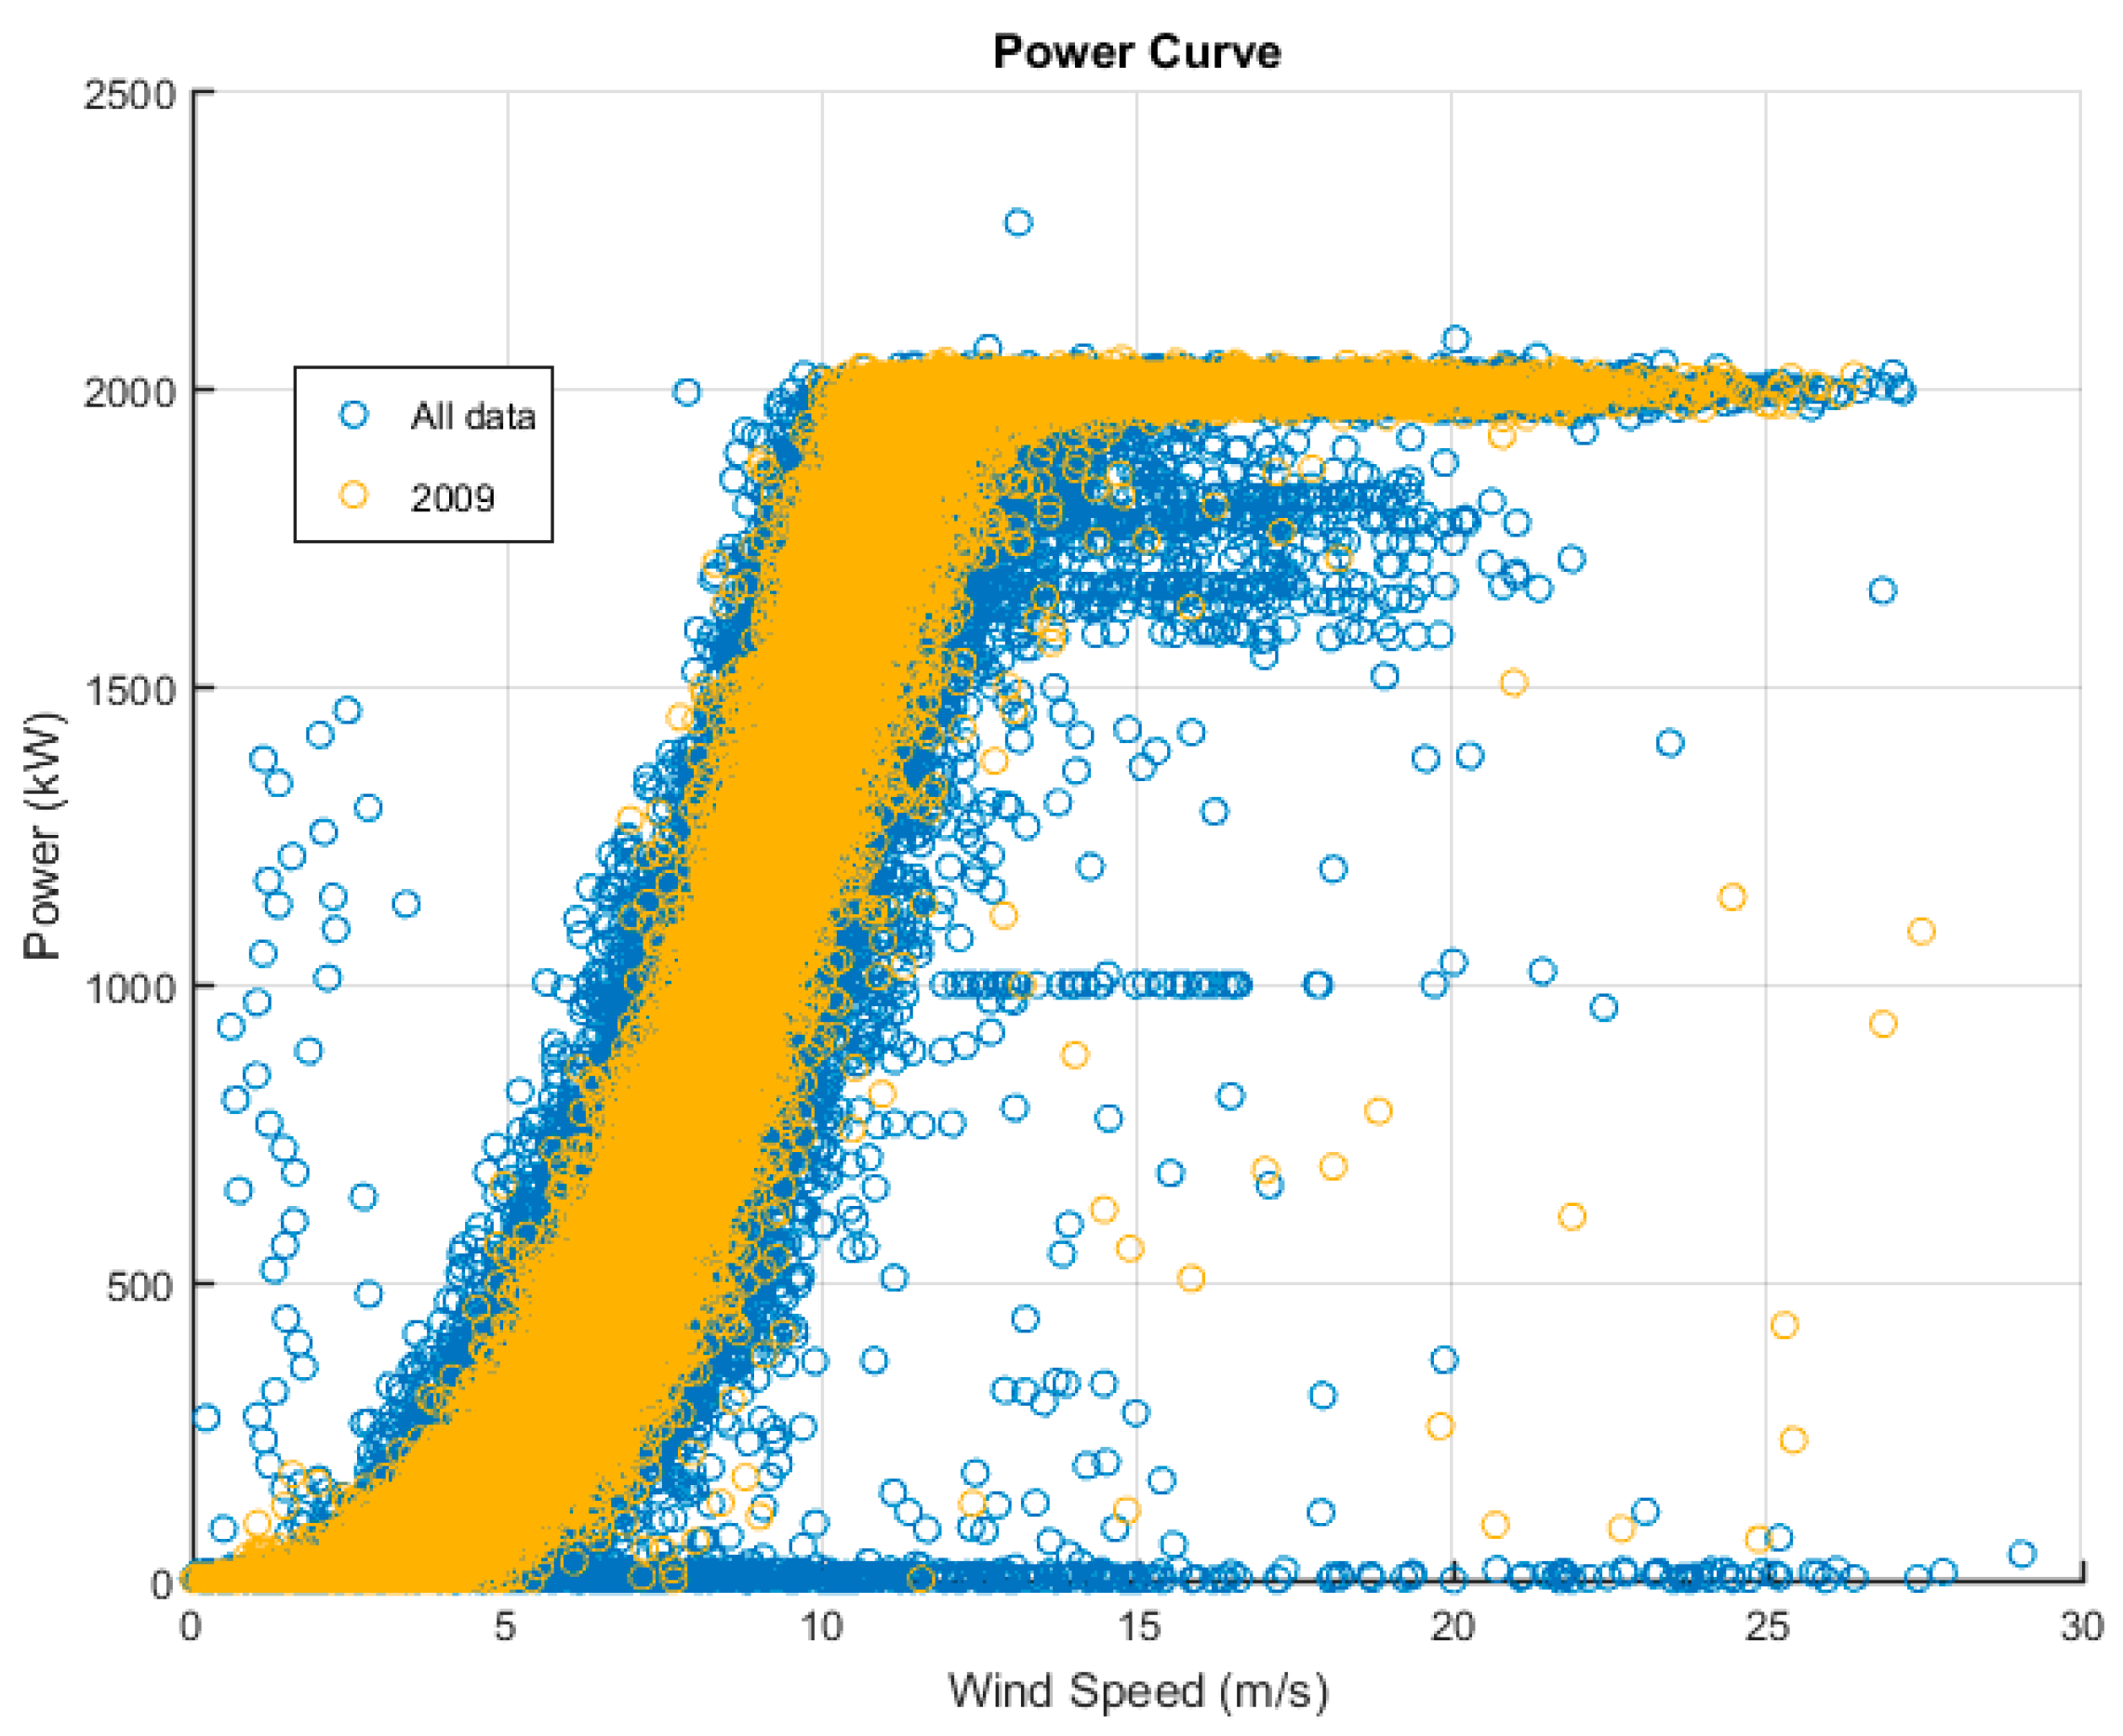
The data set was screened removing outliers, values out of range and reconstructing missing data whenever possible. Finally, the screened data corresponding to 2009 were selected as a training set for obtaining the reference patterns of behavior that will be the basis for detection of anomalies. This decision was based on the selection of all the operation conditions of the wind turbine inside a time window covering the four seasons of a year and in the inner possible real power curve observed in the wind turbine.
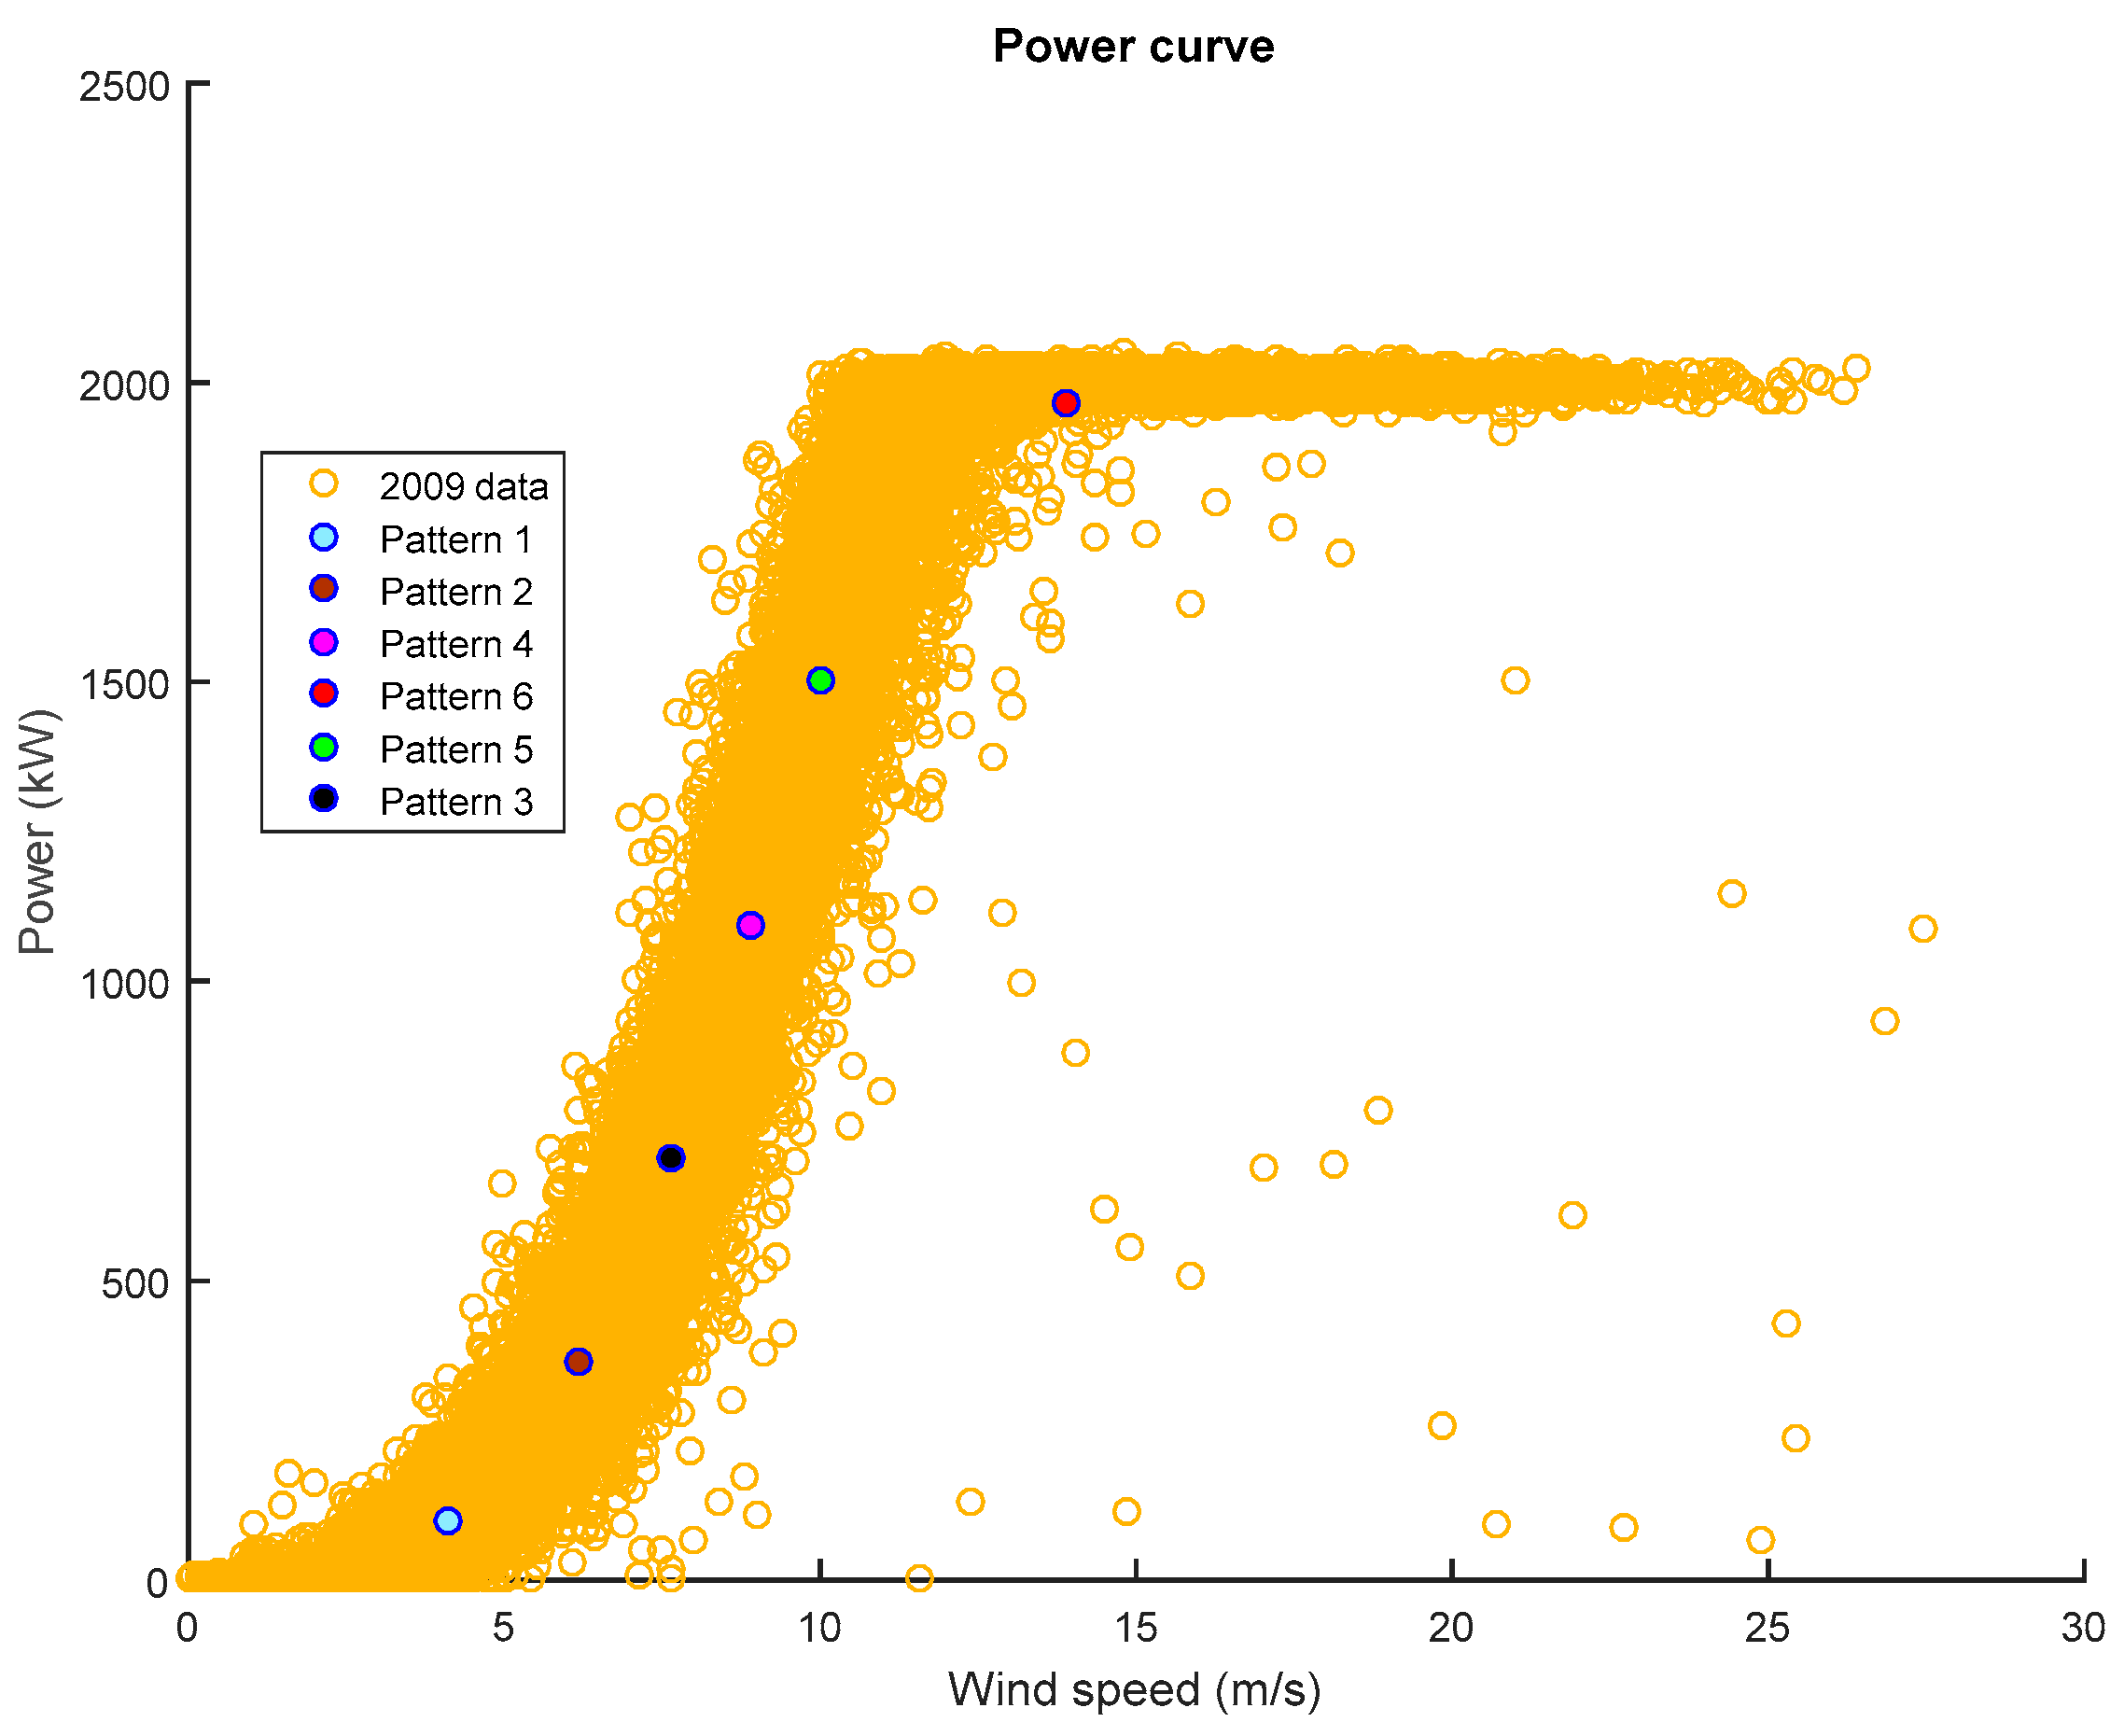
Figure 1 presents in yellow the final training set that was selected, corresponding to the power curve of the wind turbine in 2009. Furthermore, the rest of the variables with the same timestamp of those that were presented in
Figure 1 were selected. The wind speed used in the power curve corresponds to the hub height wind speed with neglected aerodynamic interaction. In theory, the power curve has to be a thin line, but, as observed in
Figure 1 and
Figure 2, in practice, this line is thick due to different effects that cause some deviations, such as the inertia of positioning controllers, turbulences, and others. The most important aspect is that it is necessary to assure that the width of the power curve does not increase, because if this does occur then some anomaly or degradation is taking place.
4. Reference Patterns of Normal Behavior
The reference patterns of normal behavior for the wind turbine were built being focused on the characterization of the power curve of the wind turbine as an essential index of its behavior, the characterization of the gearbox, and the characterization of the electrical generator, all of which will be described in the next sub-sections. The applications of the method proposed in the paper to the gearbox and the electrical generator are only illustrative examples of use based on the importance of both components in the operation of a wind turbine and on the impact of their failure modes.
4.1. Brief Introduction to Self-Organizing Maps (SOM)
As is known, the Kohonen self-organizing maps (SOM) [
17,
19] are neural network models that map multi-dimensional input data into a low-dimensional space represented by the number of neurons. The SOM is defined by a set of nodes or neurons that cover the input space of examples in such a way that its information is clustered through the nodes of which the weights represent a pattern of the examples that are observed after training. The values of the node weights are adjusted during the network training phase using an unsupervised learning algorithm. More in detail, at the iteration
t of the training algorithm, the input vector
xt is assigned to the winner neuron
Cj, to which it has a minimum Euclidean distance and where
j is given by Equation (1):
Then, the SOM updates the weight values of the winner neuron, and also the nodes that are inside the neighborhood region of the winner neuron
Cj, as follows in Equation (2):
where
γ(
t) is a monotonically decreasing function of time with values between 0 and 1. The neighborhood region
Nj(
t) of a neuron
Cj is defined as the region of the map where nodes have an Euclidean distance smaller than or equal to a specified radius from
Cj. It is clear that the training algorithm requires the definition of a distance measure
d between cases and node weights. It is a general fact that given the probability distribution
p(
x) of the input data, the Kohonen algorithm minimizes an expected average quantization error function E, as given by Equation (3).
where
Cj is the node associated to the input vector
x.
The result is that input data that show similar characteristics among them are clustered together and a representative pattern is assigned to each cluster through the neuron weights. Thus, data are represented by a finite set of nodes, of which the weights are the centers of the clusters that are found in the examples by the training algorithm. Furthermore, it is a general fact that the SOM training algorithm adjusts the node weights in such a way that neurons will be more concentrated in those areas of the input space with higher density. Each neuron contains all the input data that are clustered around its weights, according to their similarity. Each cluster represents a pattern of information. Neurons that are neighbors in the map typically show close patterns of examples.
4.2. Reference Patterns of Normal Behavior of the Wind Turbine Based on Its Power Curve
These reference patterns define the most general behavior of the wind turbine based on its power curve. The patterns are based on a self-organized map (SOM) [
16] whose inputs were the wind speed and the power generated. A self-organized map is a type of artificial neural network able to be trained under unsupervised learning to produce a discretized representation of the input space of the training samples as patterns that are representing them. A self-organized map is based on competitive learning as opposed to error-correction learning methods used in supervised neural networks. This type of learning uses a neighborhood function to preserve the topological properties of the input space, defined by the training set configuring an ordered map of patterns.
In order to have an easy association of the different zones of the power curve with the patterns of pairs wind speed and power generated, the structure that is proposed for the self-organized map was a unidimensional vector of neurons. Different tests were carried out using different numbers of neurons and finally the structure of six neurons in a unique row was chosen. This selection was based on the criteria that the neurons conveniently represent all the areas of the power curve and that the cases represented by each neuron are sufficient and balanced. Other alternatives with more or less than six neurons were discarded because giving similar results in classification, the criteria wished were not fulfilled in the same way. The patterns obtained are presented as the six blue points in
Figure 2. They represent the usual behavior of the wind turbine.
Table 1 presents the number of samples of the training set represented by each pattern discovered and the mean and standard deviation values for power and wind speed represented by the patterns.
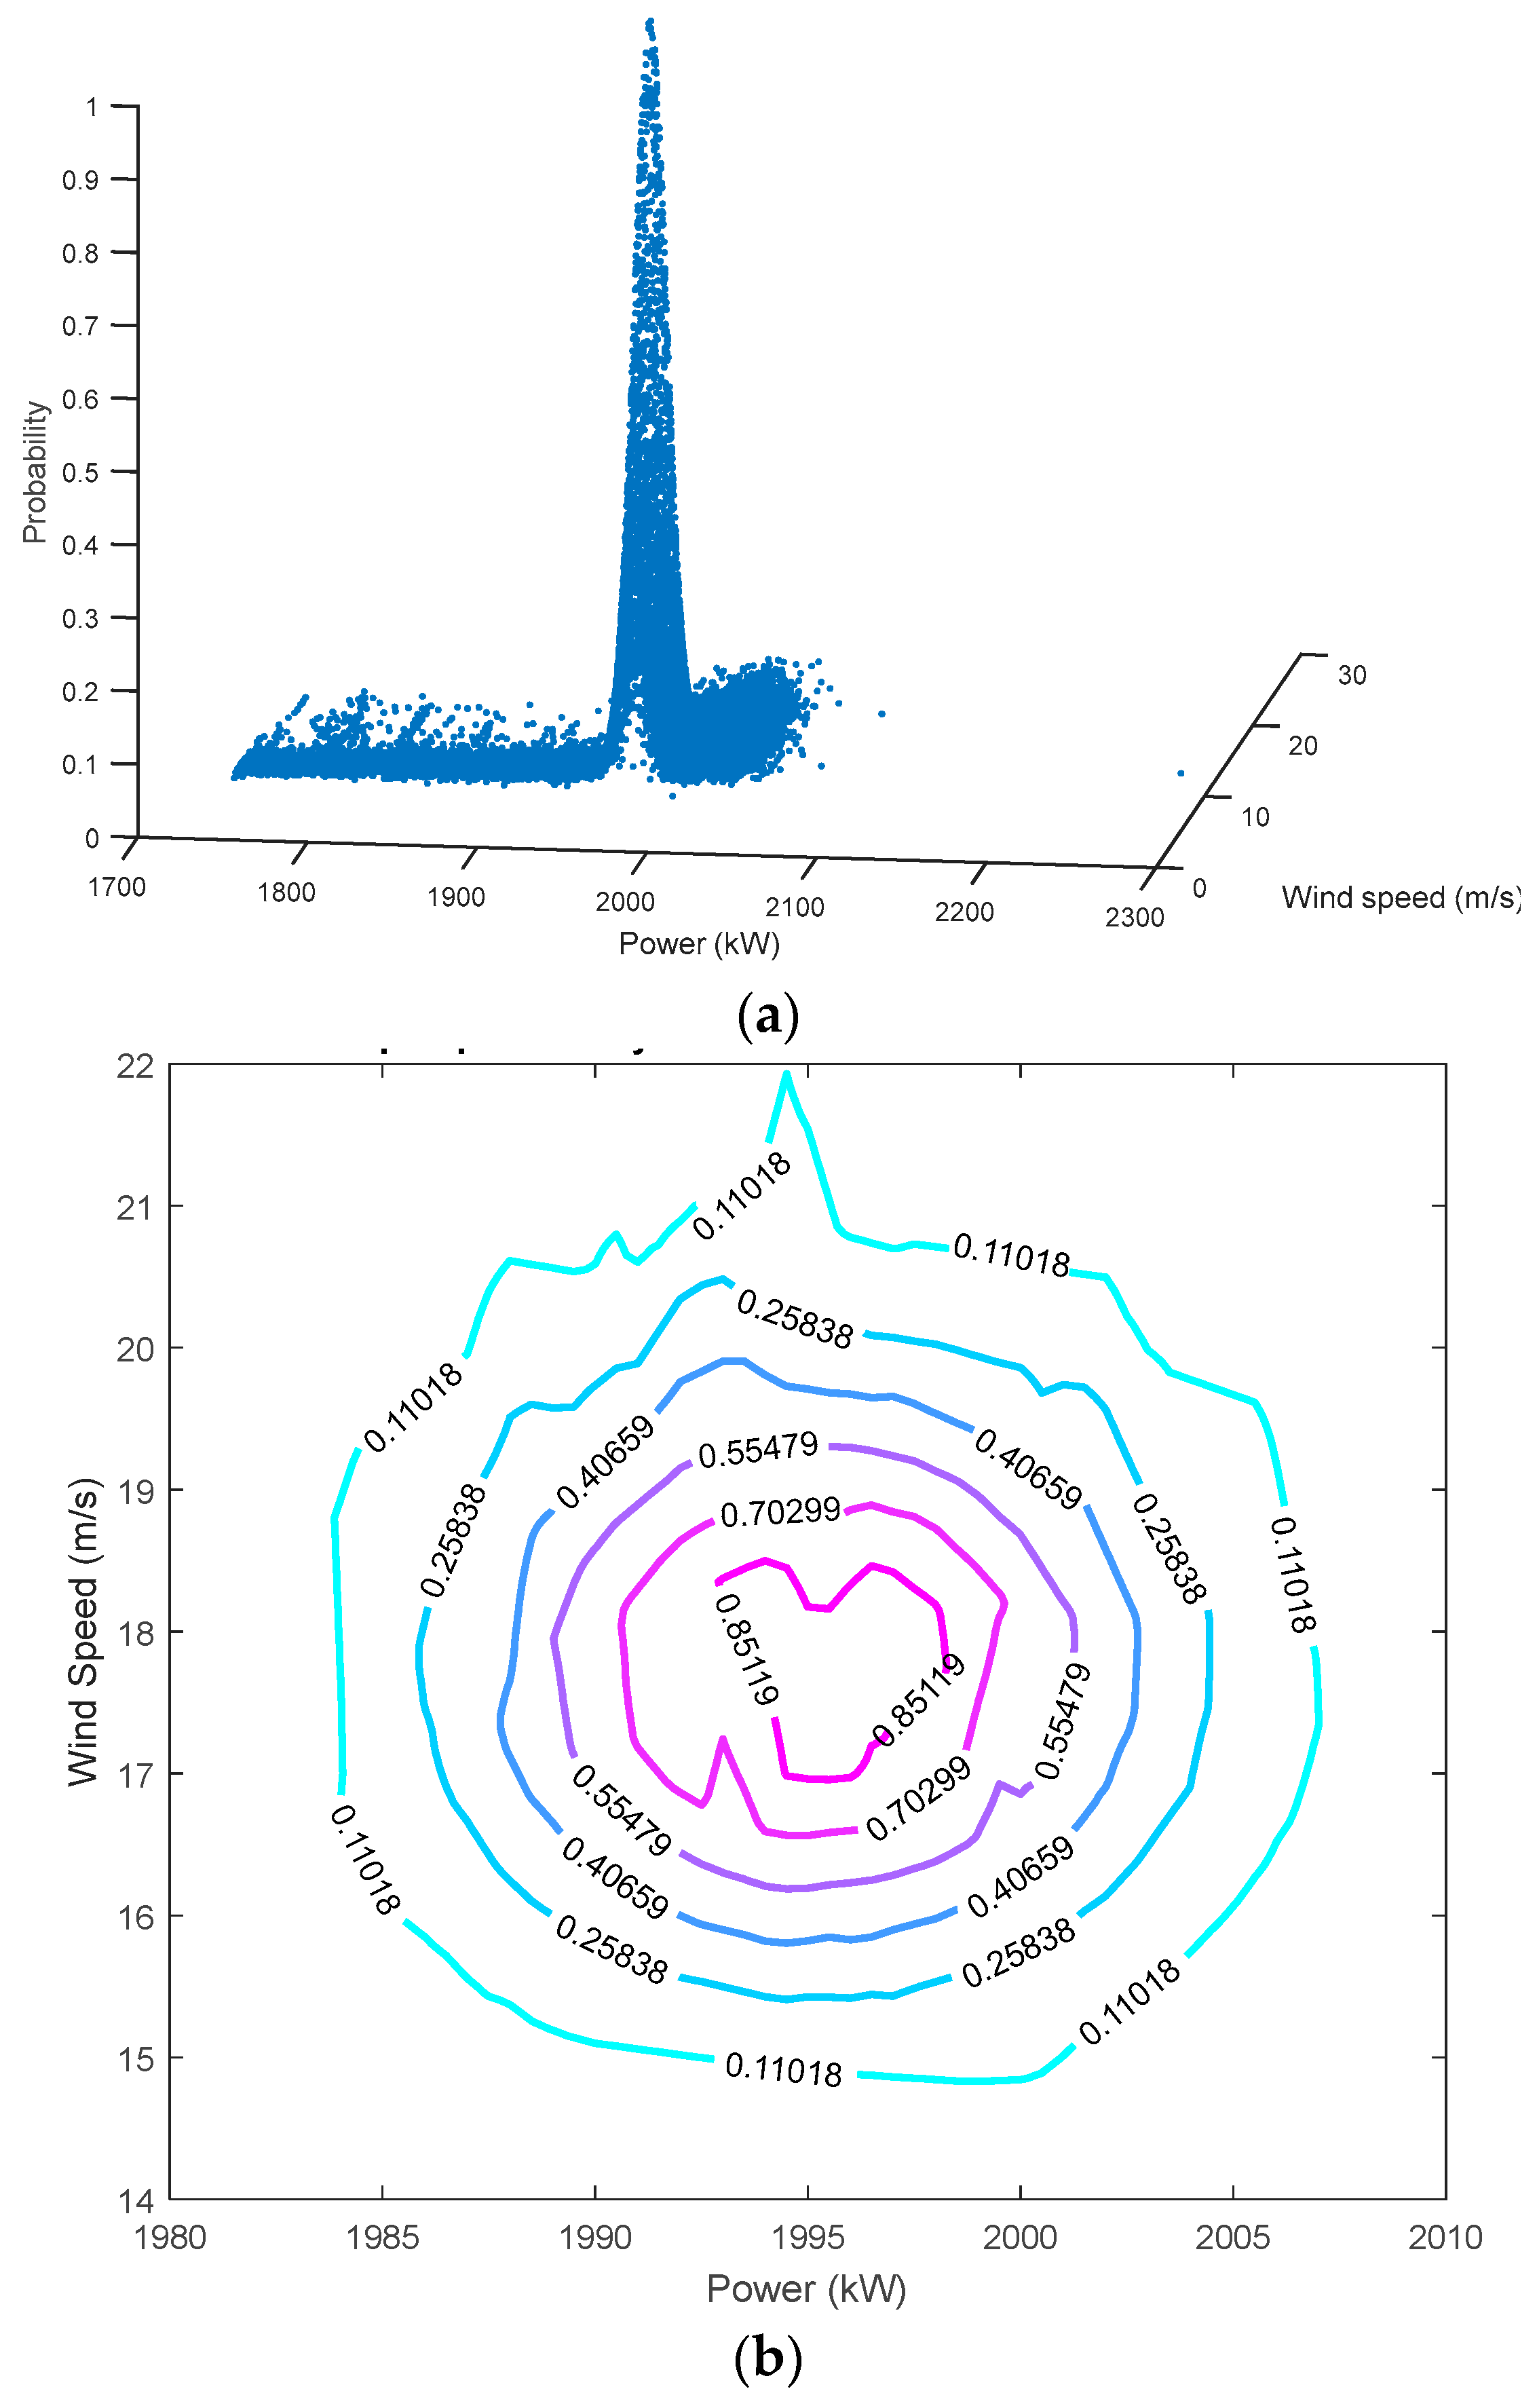
The probability distributions of the data represented by each pattern were estimated as Gaussian distributions. An example of the probability distribution obtained for a neuron is presented in
Figure 3a,b. It corresponds to the samples under the pattern representing the zone of higher production of electricity, pattern 6.
Once the reference patterns were discovered, and also, the probability distributions of data under them, they can be used to monitor future performance of the wind turbine, and to know if it is known or not. This is important not only for monitoring its general performance, but also to be taken into account by the reference patterns of behavior to be developed in the components on the gearbox and electrical generator.
4.3. Reference Patterns of Normal Behavior of the Wind Turbine Gearbox
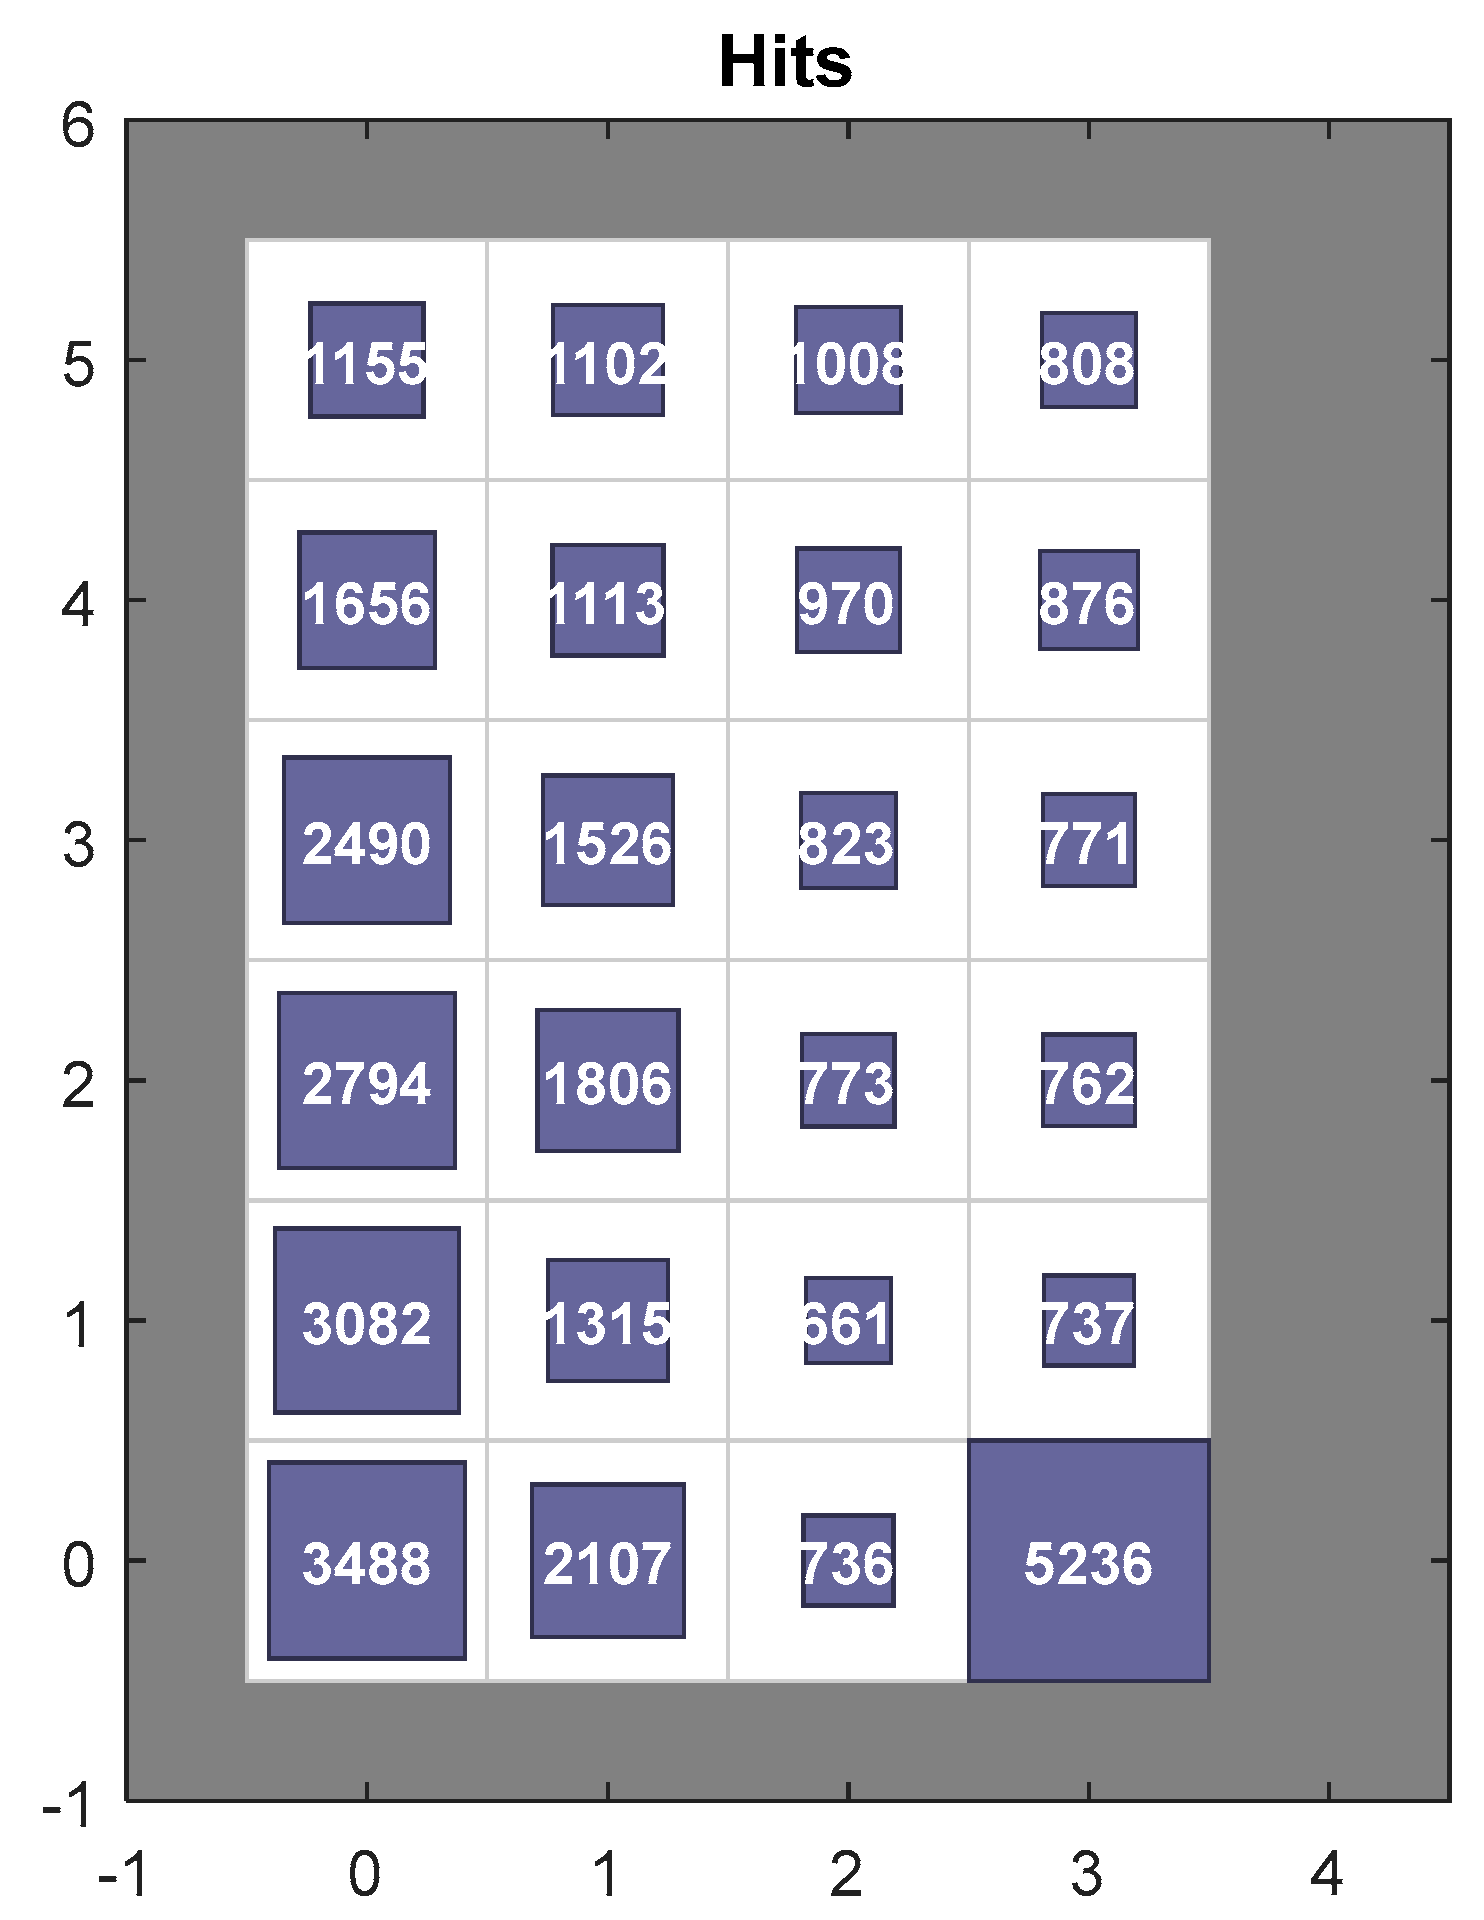
The objective of these patterns is to define the temperatures typically observed in the wind turbine under different working conditions. They were obtained using a self-organized map whose four inputs were: power generated by the wind turbine, wind speed, temperature of the gearbox oil, and temperature in the high speed bearings of the wind turbine. These patterns are able to associate working conditions of the wind turbine with the most important temperatures of the gearbox. After several trials, a structure of a self-organized map based on 24 neurons (6 × 4) was selected, and therefore, 24 patterns were obtained characterizing the four input variables used.
In this case, the same training set used in 4.1 was used again to discover these reference patterns, plus the two temperatures mentioned.
Figure 4 shows the number of cases of the training set that each neuron represents.
Table 2 represents the values of the 24 patterns that were discovered (four values for each one in this order: power generated in kW, wind speed in m/s, temperature of the gearbox oil in °C, and temperature in the high speed bearings of the wind turbine in °C). The patterns are ordered by rows and columns, as shown in
Figure 4, where four columns and six rows can be observed representing each squared form as a pattern and the number inside is the number of samples represented by each pattern. It is easy to observe in this figure that the upper right corner corresponds to cases that were observed for the maximum electricity generation. The column of neurons on the right side corresponds to generation at higher wind speeds and the column of neurons on the left side corresponds to generation at lower wind speeds. Also, the typical values of temperatures in the gearbox observed for the working conditions of the wind turbine are easily followed in the table shown in
Table 2.
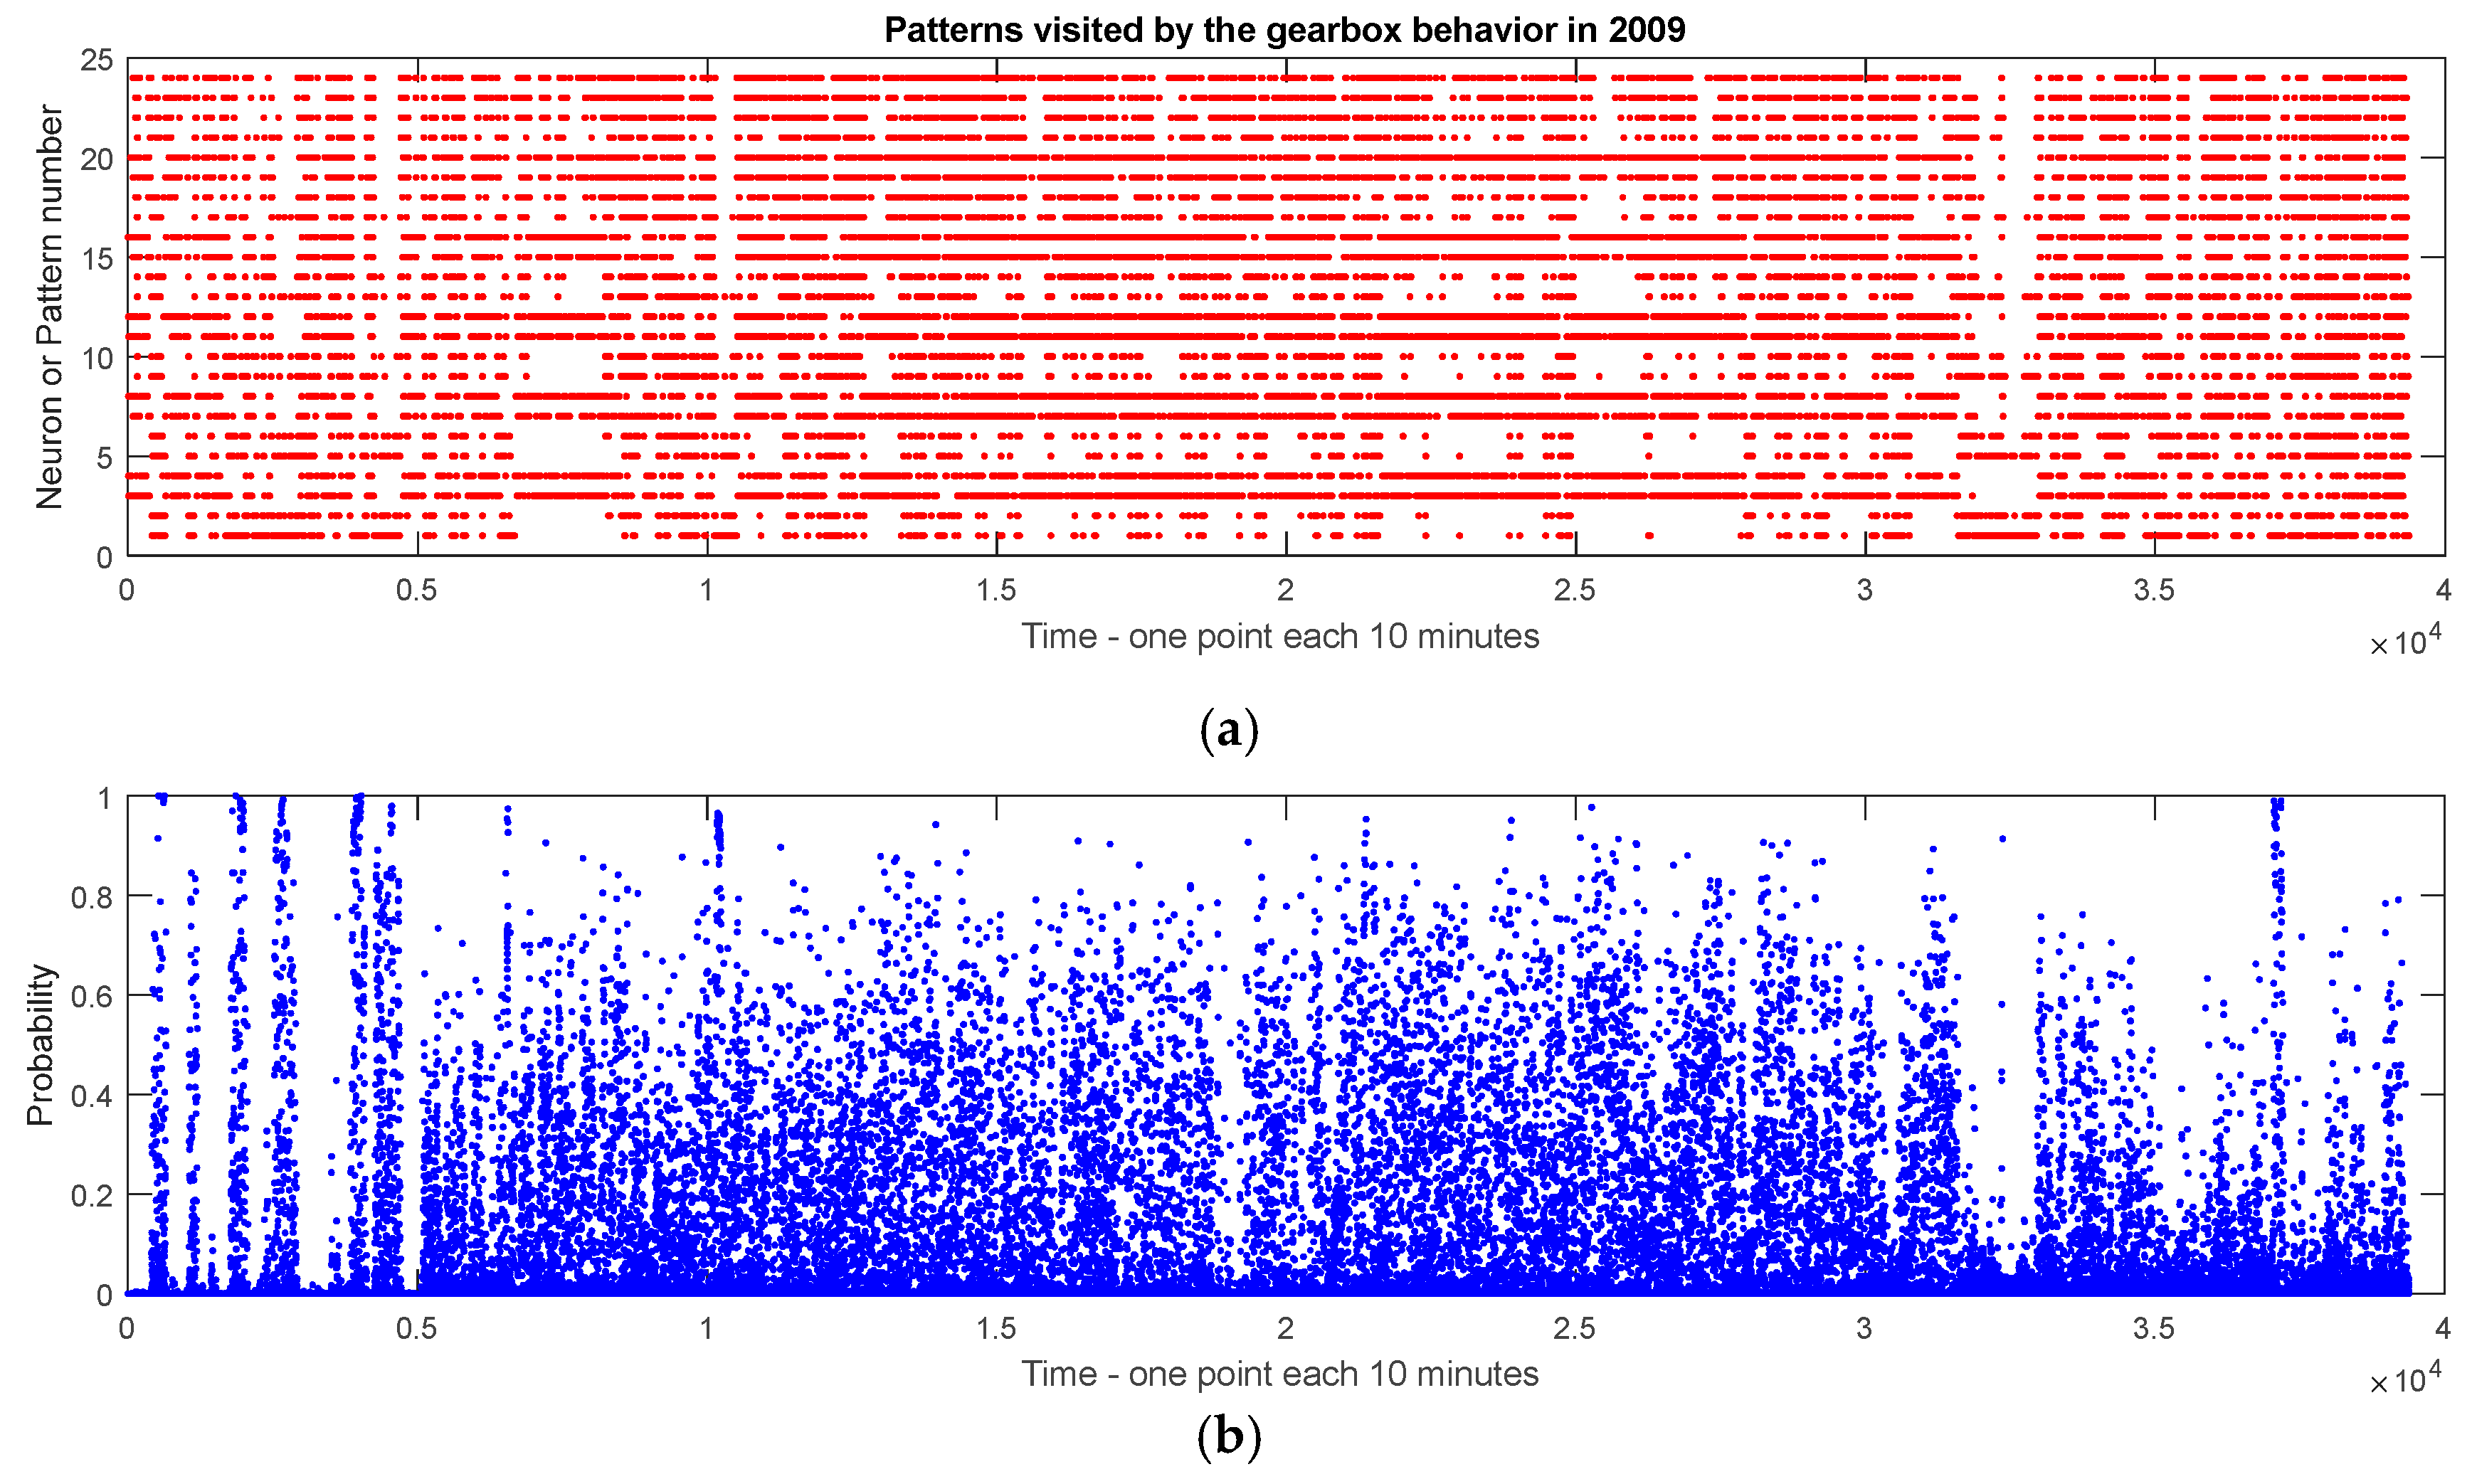
The data set used for training corresponding to 2009 was passed through the patterns that were discovered in order to verify their representation. Each sample was passed through the self-organized map previously fitted and the neuron or pattern representing it was noted (1 to 24). At the same time, the probability of the sample belonging to the associated neuron was estimated. This is useful in order to observe if the sample is well-represented by the corresponding pattern or neuron.
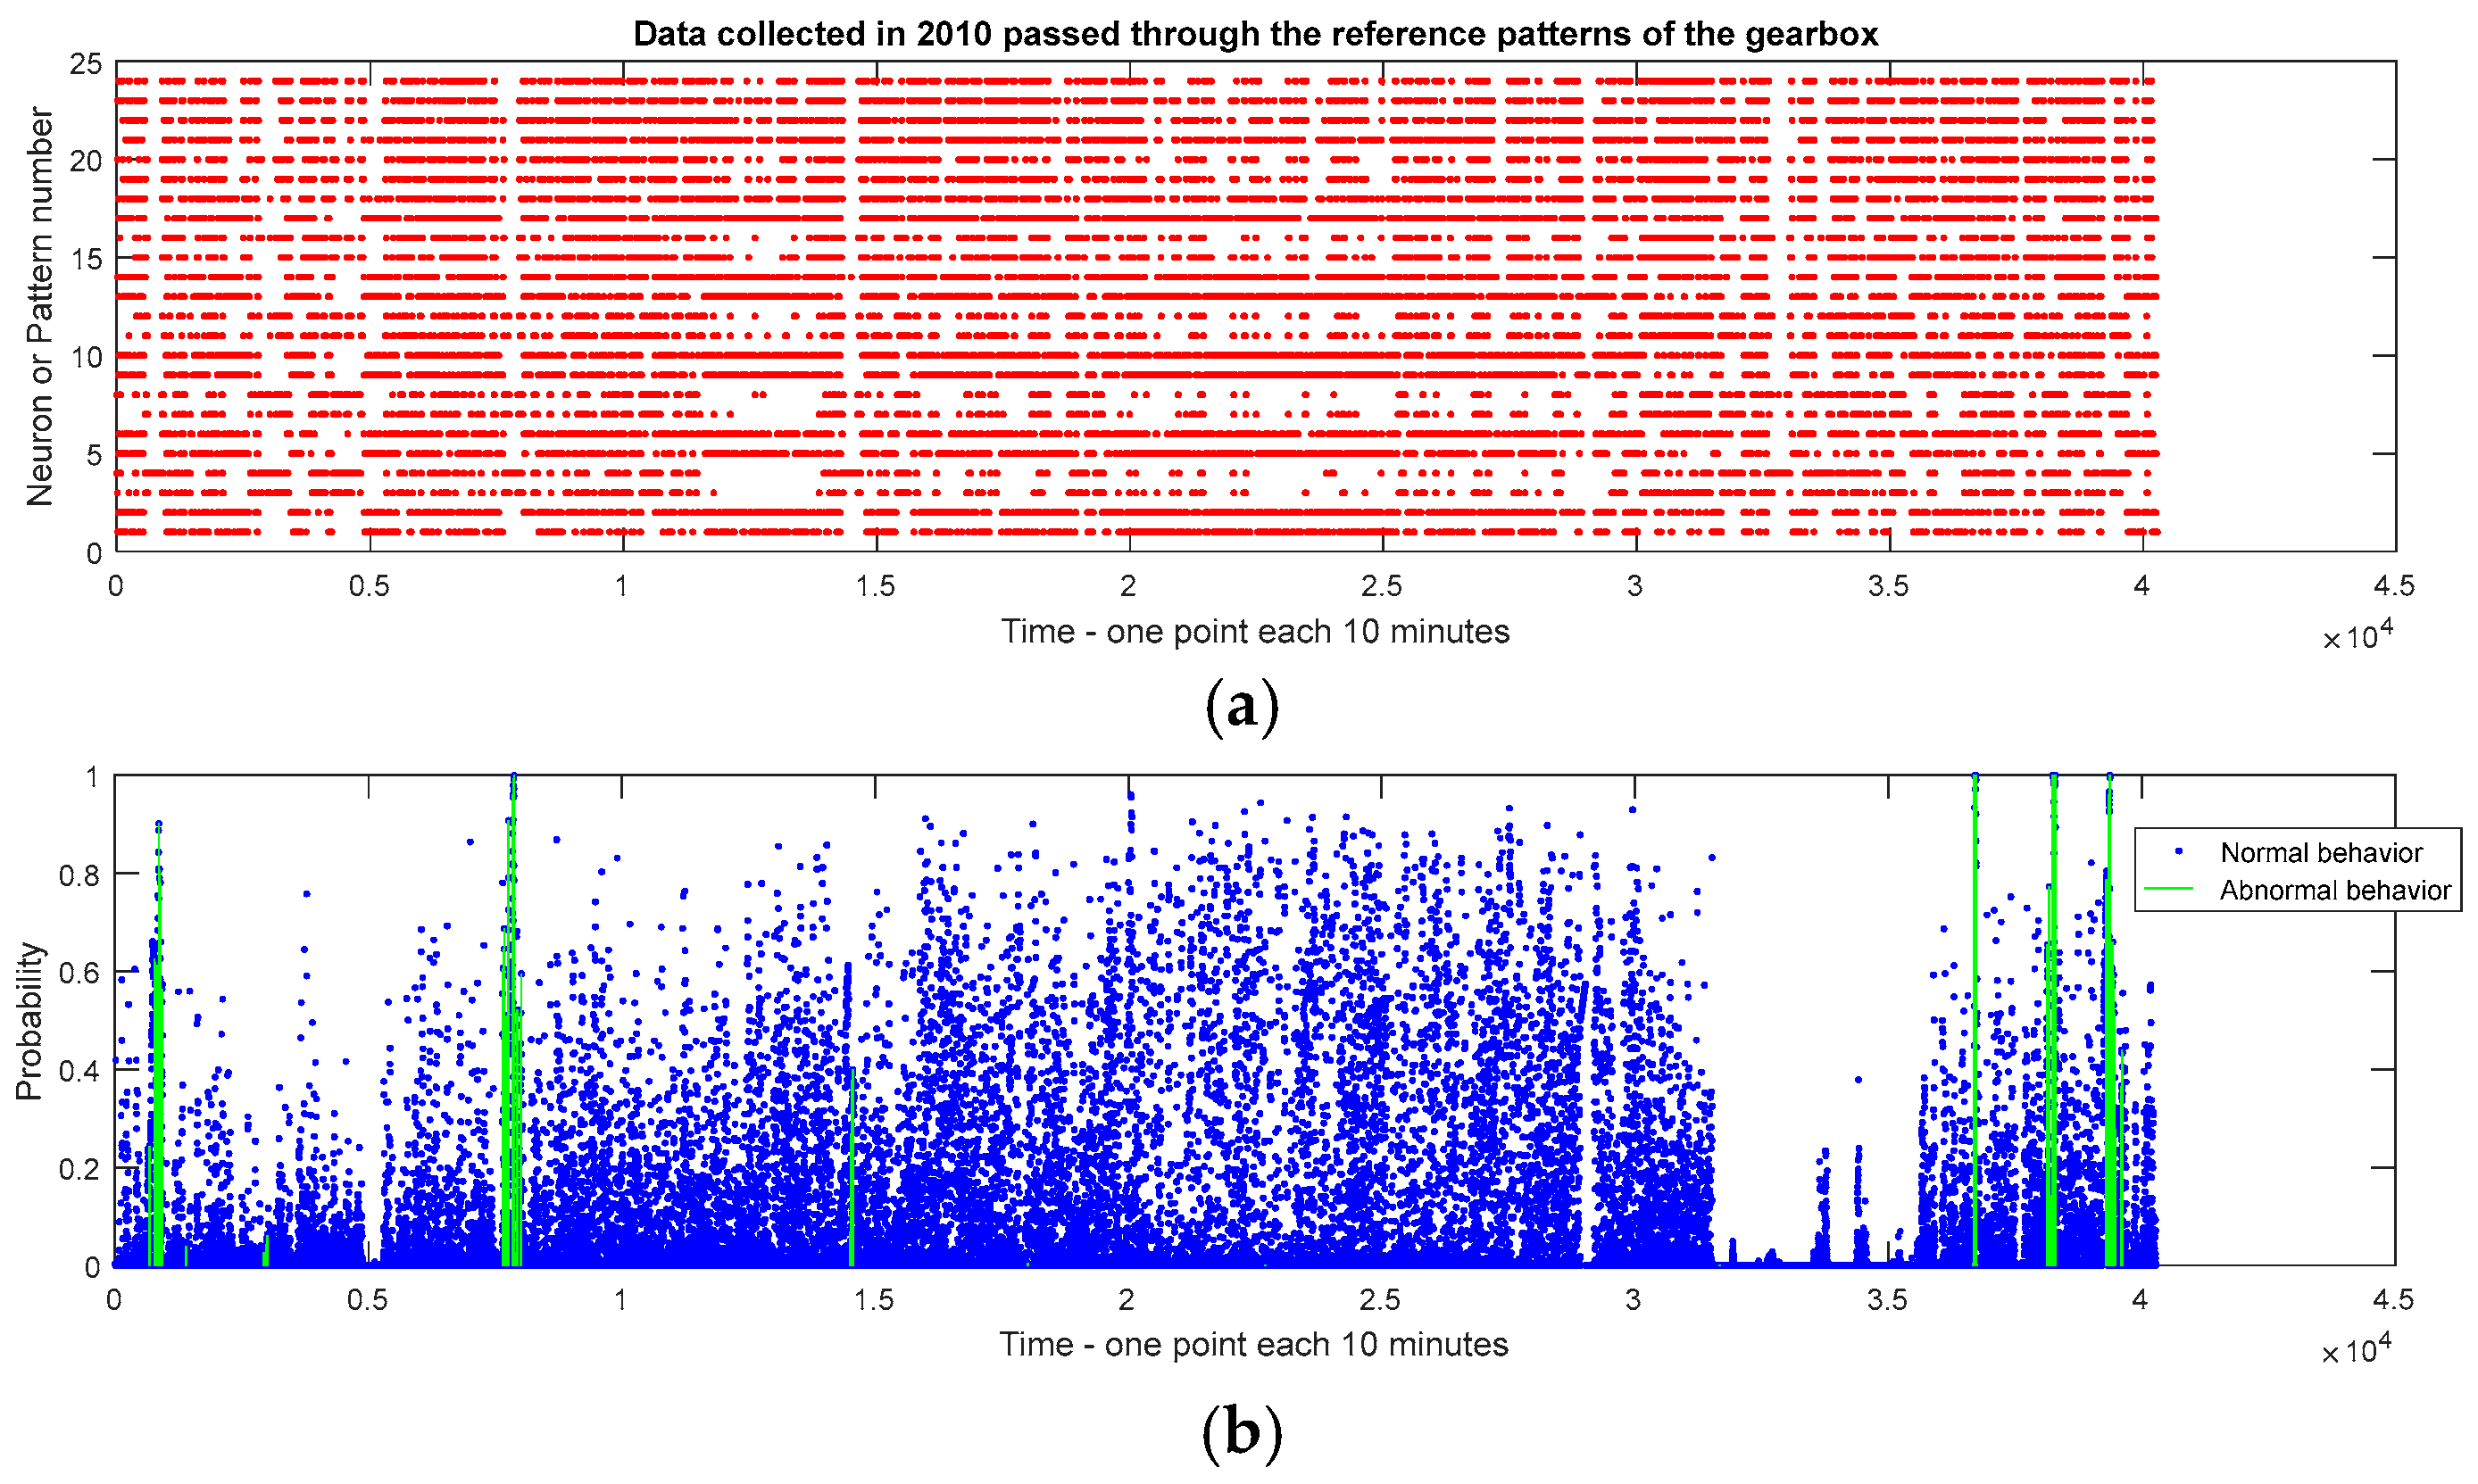
Figure 5 shows the results of passing each data sample of the training set through the map. The upper graph corresponds to the number of the neuron or pattern where each sample is better represented. Due to the SOM property of self-organization, the transition of a normal behavior to another one has to be observed as the change the belonging to a neuron, to belonging to another one, but in the neighboring area. An abnormal behavior is observed when a change occurs to an area of neurons that is not expected. In
Figure 5a, the most part of the time the behavior corresponds to patterns that are expected. This can be observed in the horizontal alignments in red dots that are predominant. These alignments correspond to the typical normal behavior and its typical transitions through neighbor neurons. When some gaps in these alignments appear, they could be symptoms of anomalies that have to be confirmed with probabilities of the neuron belonging to the neuron where observation falls. The
Figure 5b corresponds to the probability of the sample to be represented by the neuron. Each sample has a neuron that is associated representing it, and a probability of belonging of such neuron. Each sample is represented in
Figure 5 by its occurrence on the time axis (year 2009) in both graphs.
Figure 5 shows some cases that are not well represented by the associated pattern, but in general, the association of samples observed with neurons of the most part of the training set data is correct, also with an acceptable value to belong to the Gaussian distribution region of 60% or better.
4.4. Reference Patterns of Normal Behavior of the Wind Turbine Electrical Generator
The objective of these patterns is to define the temperatures that are typically observed in the electrical generator under different working conditions. They were obtained using a self-organized map, whose five inputs were: power generated by the wind turbine, wind speed, temperature of the bearing at one end of the electrical generator axis, the temperature of the bearing at the opposite end of the electrical generator axis, and the temperature of the electrical generator slip rings. The patterns are able to associate the working conditions of the wind turbine with the most important temperatures of the electrical generator. The study carried out for discovering the patterns was similar to that described for the gearbox patterns. Again, a structure of a self-organized maps based on 24 neurons (6 × 4) was used for easy comparison with the gearbox patterns of reference, and therefore, 24 patterns of behavior of the electrical generator were obtained, characterizing the five input variables in this case.
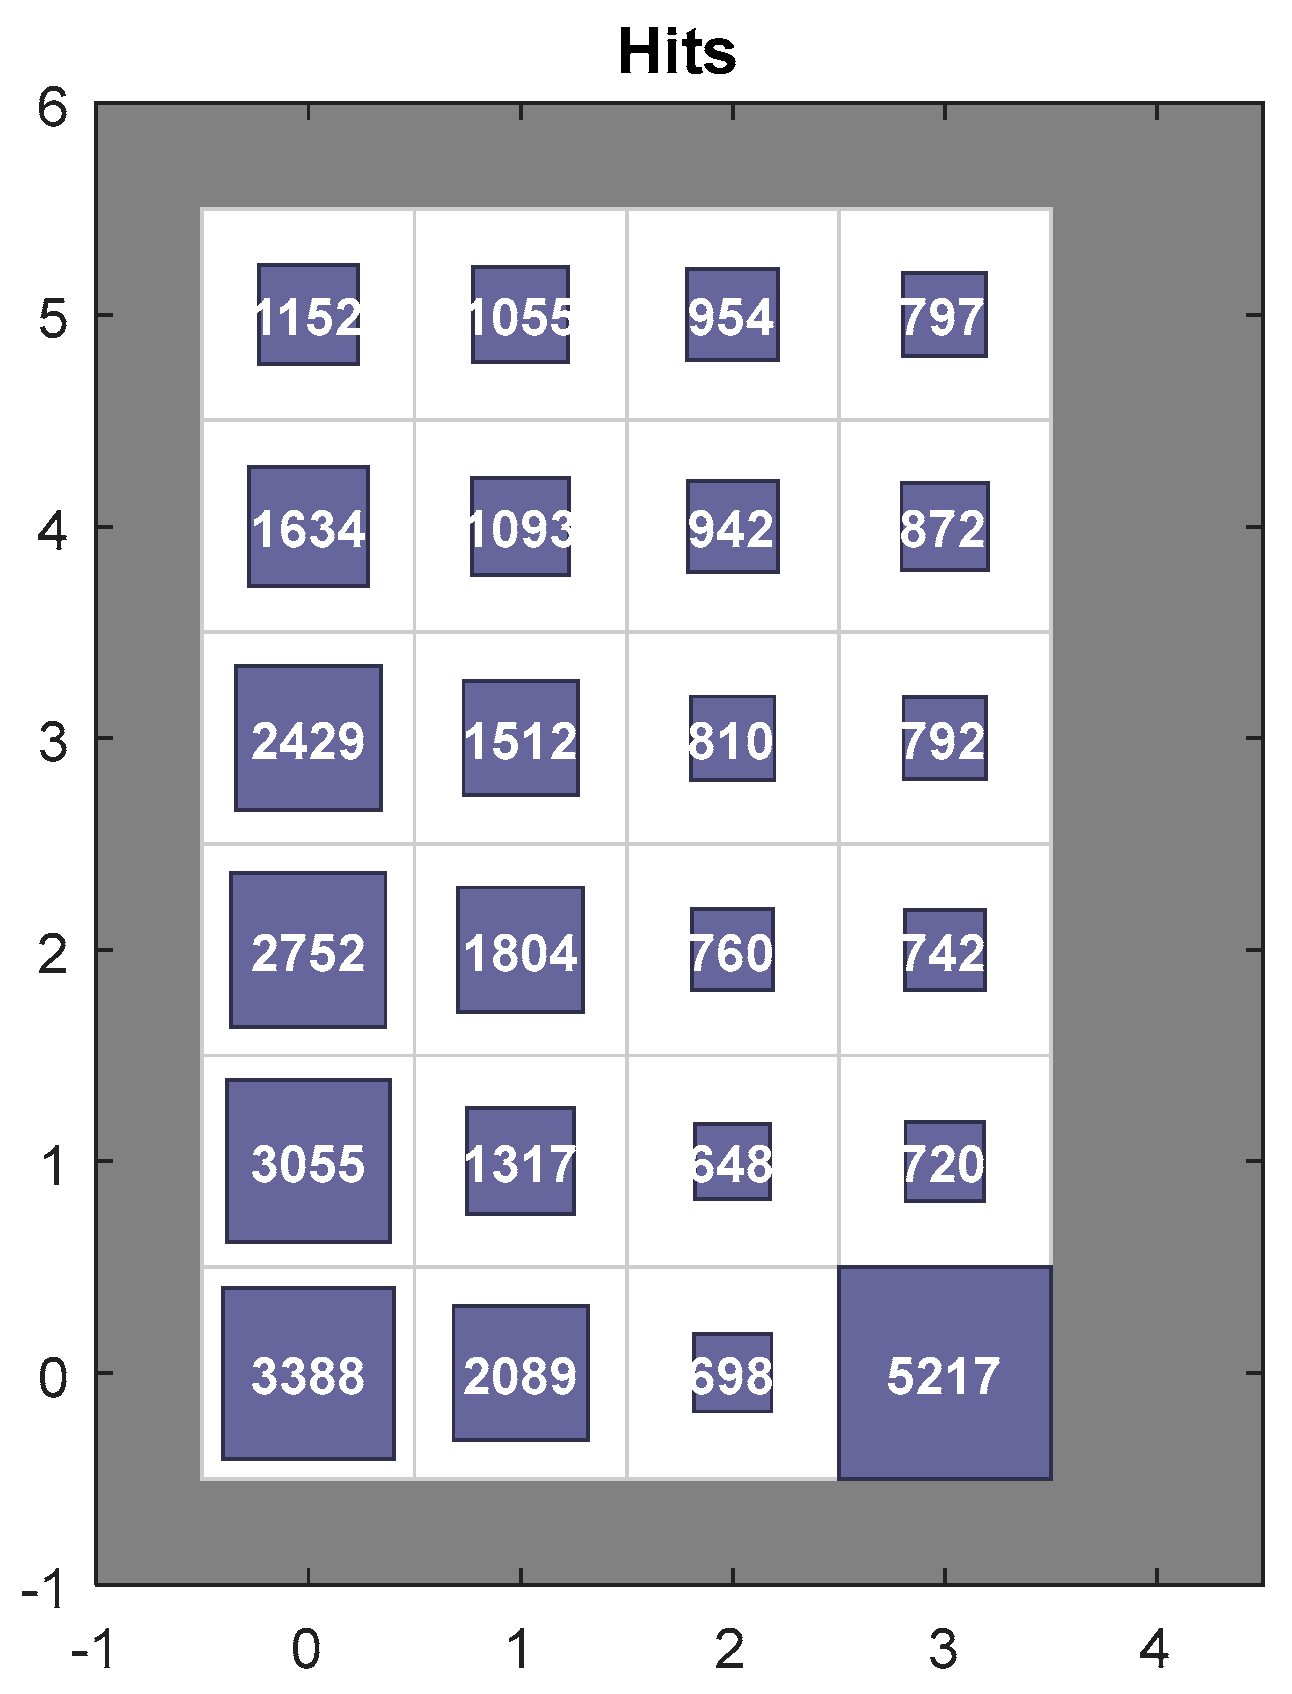
Figure 6 shows the number of cases of the training set that each neuron represents.
Table 3 represents the values of the 24 patterns that were discovered (five values for each one in this order: power generated by the wind turbine in kW, wind speed in m/s, temperature of the bearing at one end of the electrical generator axis in °C, the temperature of the bearing at the opposite axis end in °C and the temperature of the electrical generator slip rings in °C). These patterns are ordered by rows and columns, as shown in
Figure 6, where four columns and six rows can be observed representing each squared form as a pattern and the number inside is the number of samples represented by each pattern. It is easy to observe in this figure that the upper right corner corresponds to cases observed for the maximum electricity generation. The column of neurons on the right side corresponds to generation at higher wind speeds, while the column of neurons on the left side corresponds to generation at lower wind speeds. This organization is similar to the weights that were obtained for the reference patterns in the case of the gearbox, therefore, both can be compared. Also, the typical values of temperatures observed in the electrical generator for the working conditions of the wind turbine are easily followed in the table shown in
Table 3.
The data set used for training corresponding to 2009 was passed through the patterns discovered in order to verify their representation, as in the previous case presented for the gearbox. In the most part of the cases, the association sample-pattern was correct with an acceptable value to belong to the Gaussian distribution region of 50% or better.
5. Detecting Anomalies Using the Reference Patterns of Normal Behavior
Once the different sets of reference patterns are found for the gearbox and the electrical generator of a wind turbine, they can be used to verify if new data not included in the training set corresponds or not to the normal behavior expected. In the case that the observed behavior does not correspond to the expected, an anomaly is detected, and this will be taken into account for diagnosis and maintenance re-scheduling. The detection of an anomaly in behavior must fulfill the following two properties:
The sample observed is outside the range of 95% probability of the neuron belonging to the closest assigned reference pattern.
The previous case is present in five consecutive samples. In terms of time, this corresponds to 50 min observing unexpected data. This will reduce the possibility of a false anomaly detection.
The next sub-sections will describe the application of the reference patterns discovered in
Section 4 for detecting abnormal behavior, according to the criteria mentioned.
5.1. Detecting Anomalies Using the Reference Patterns of the Gearbox Normal Behavior of the Wind Turbine
The reference patterns obtained for the wind turbine gearbox and the criteria mentioned before were applied to a new data set different from the training set. This was applied over consecutive years from 2010 to 2014. The results obtained were the following:
- -
214 cases of abnormal behavior were detected in 2010,
- -
92 cases of abnormal behavior were detected in 2011,
- -
90 cases of abnormal behavior were detected in 2012,
- -
129 cases of abnormal behavior were detected in 2013, and
- -
46 cases of abnormal behavior were detected in 2014.
As an example,
Figure 7 shows the results obtained when the data collected in 2010 were passed through the self-organized map and its patterns obtained for the year 2009. The information and interpretation of this figure is the same as that for
Figure 5. Additionally, the anomalies detected are represented by green points. Higher points in green indicate a higher probability that the case observed is an abnormal behaviour.
In the upper graph of
Figure 7 some gaps are observed, which usually correspond with abnormal behavior observed.
5.2. Detecting Anomalies Using the Reference Patterns of the Electrical Generator of the Wind Turbine
The reference patterns obtained for the wind turbine electrical generator were applied as such in the case described for the gearbox patterns obtaining the following results:
- -
239 cases of abnormal behavior were detected in 2010,
- -
326 cases of abnormal behavior were detected in 2011,
- -
366 cases of abnormal behavior were detected in 2012,
- -
335 cases of abnormal behavior were detected in 2013, and
- -
105 cases of abnormal behavior were detected in 2014.
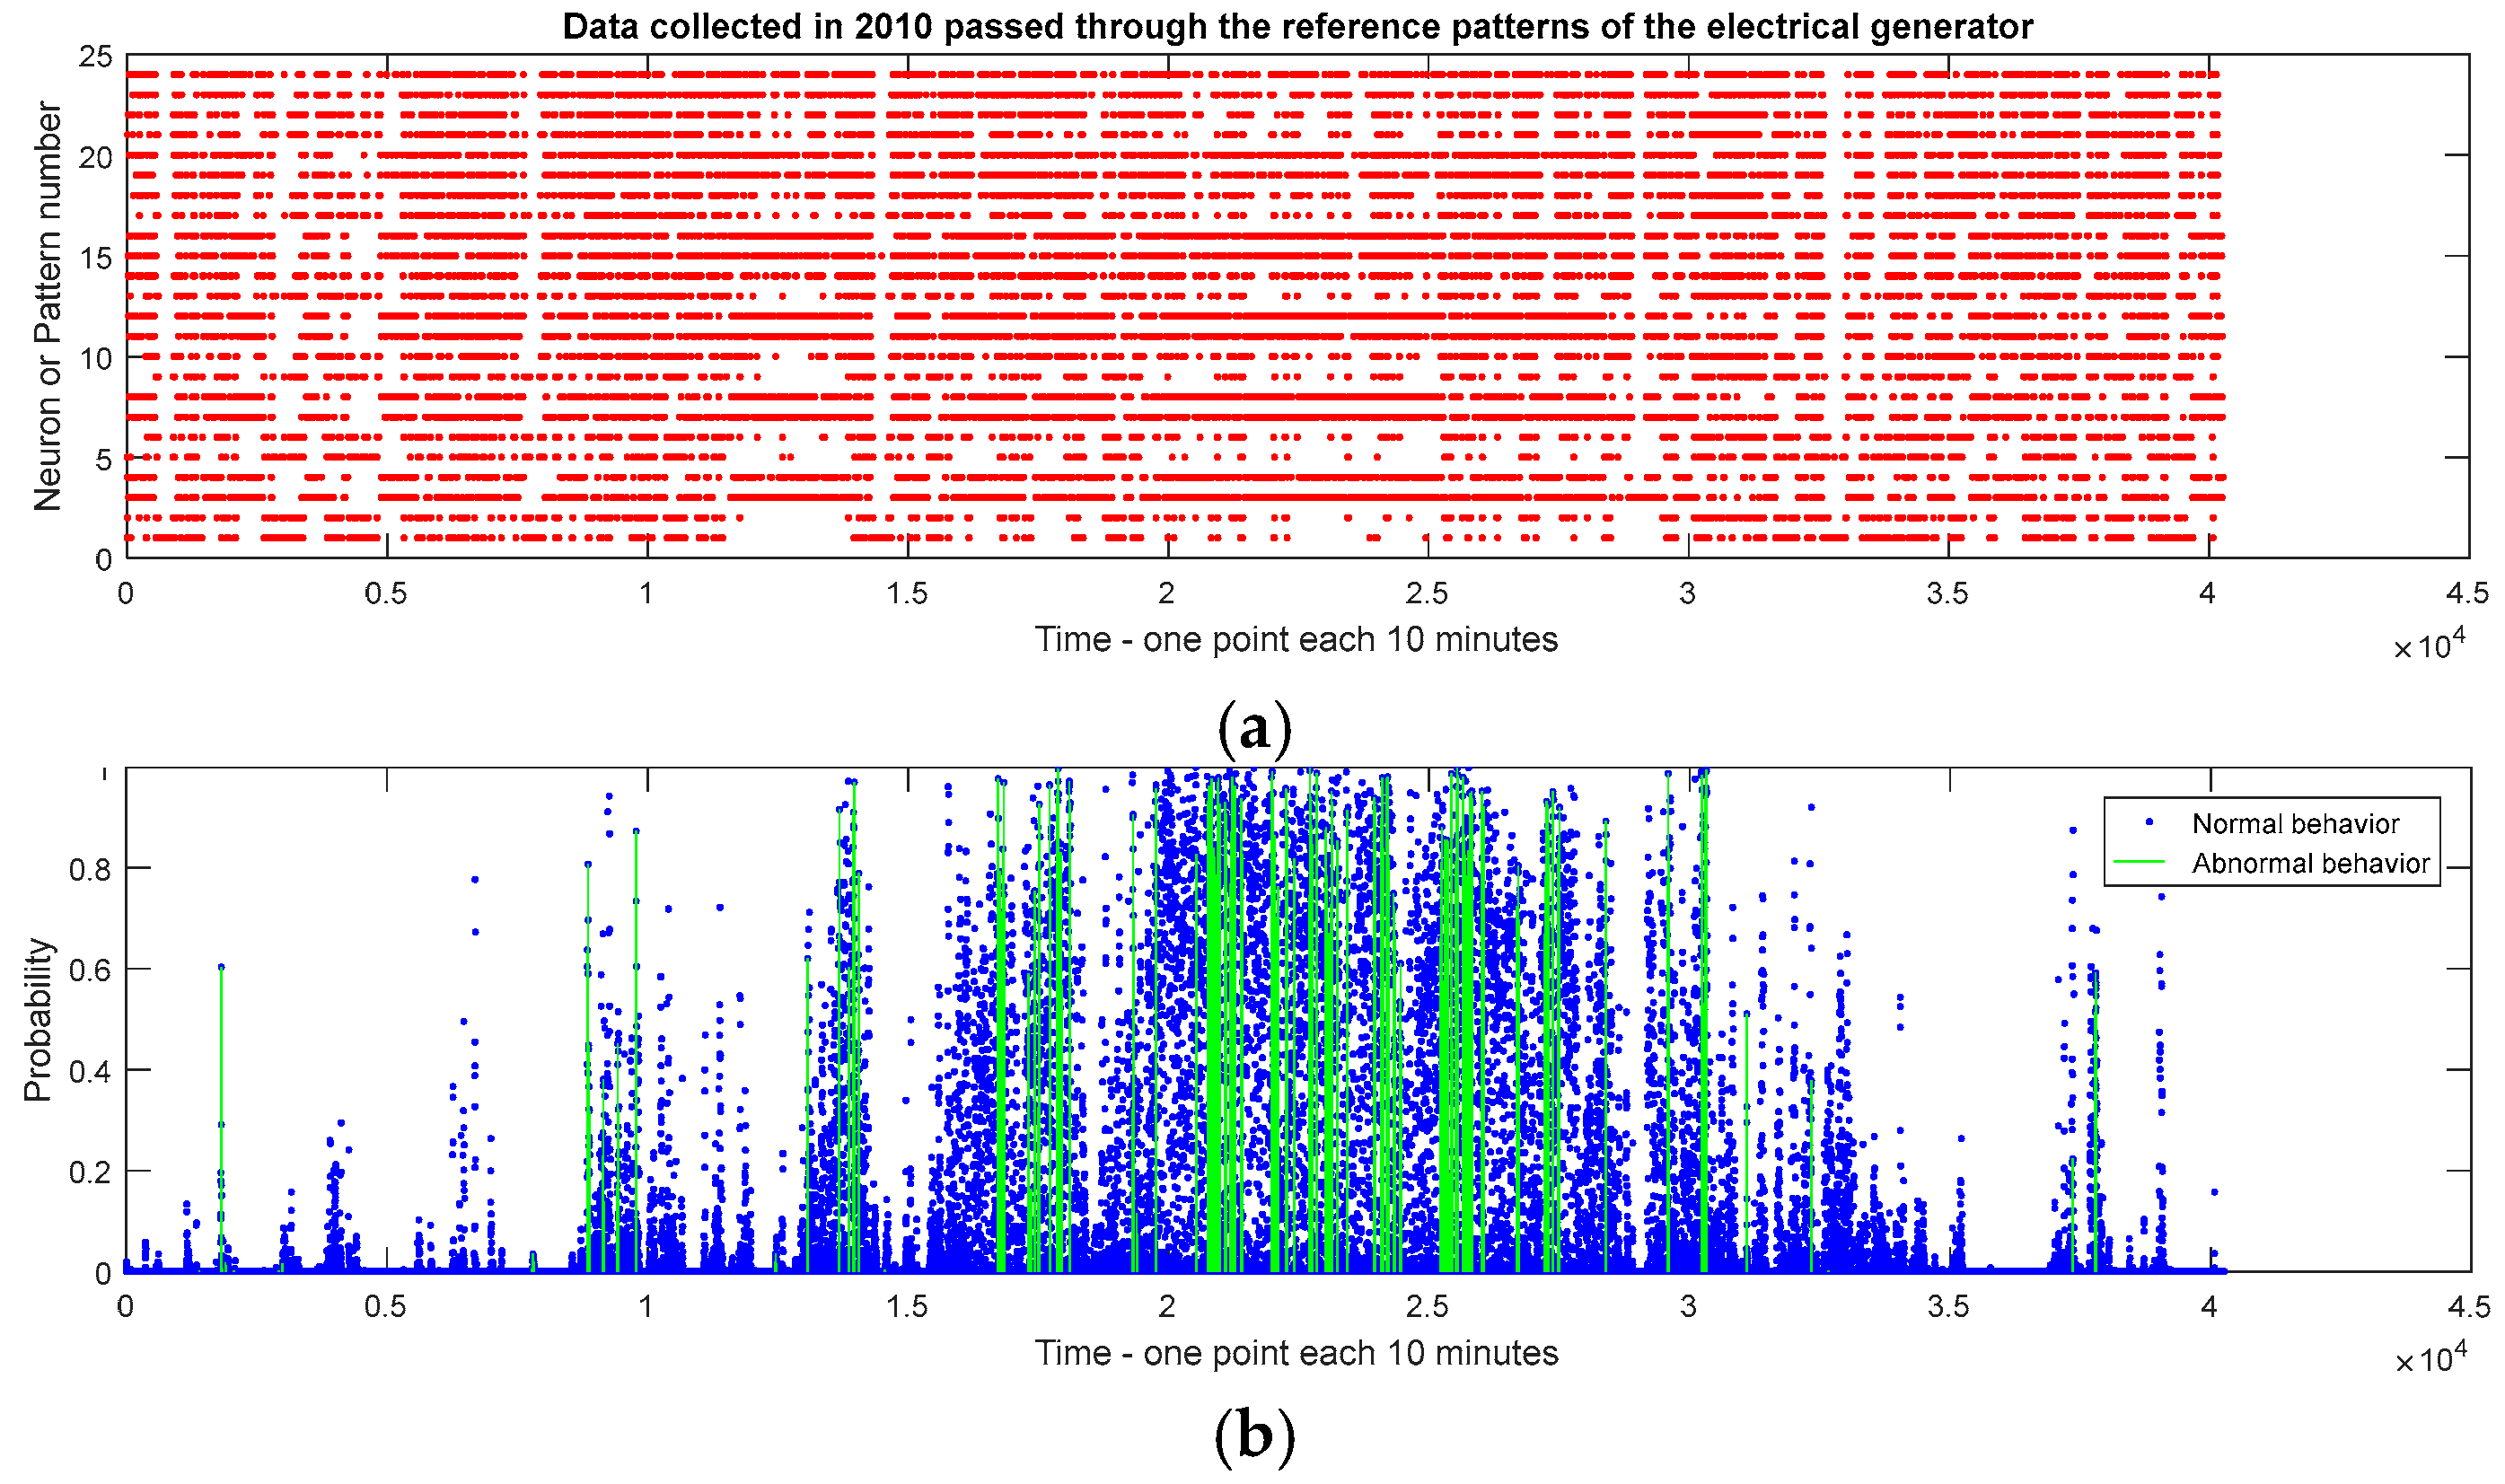
As an example,
Figure 8 shows the results obtained when the data collected in 2010 were passed through the self-organized map along with its patterns obtained for the year 2009. The information and interpretation of this figure is the same as that for
Figure 7.
6. Anomaly Indicator Used for Monitoring the Components of the Wind Turbine
The information obtained in the anomaly detection process is very important in the short-term in order to evaluate the condition of the components in the wind turbine and to re-schedule its maintenance, whenever. This could contribute to the prevention of the progression of an anomaly, particularly when its consequences could produce a catastrophic fault. However, the information supplied in the anomaly detection is also interesting from a medium-term time evaluation of failure risk. The idea behind this is that in an important number of cases, the anomalies that are detected with respect to the normal expected behavior do not have any apparent consequences. The anomaly is detected and after some time it can disappear, even without taking any special action. Such cases correspond to times where the operation conditions are not the typical ones, but without apparent effects. However, when the component is working under non-common expected conditions, perhaps they are planting the seeds, for example, through unexpected high values of temperatures, which could instigate the occurrence of failure modes.
The information about the history of anomalies detected is used to propose an indicator of the behavior of the wind turbine components. Such an indicator is defined as described in the next lines, but some alternative formulations are also possible.
This indicator is called the “non-expected behavior per unit of time” (NEB). The unit of time selected in this paper was a week (1008 data in the cases analyzed), however other time windows could be used. The indicator NEB is defined as the number of data corresponding to non-expected behavior (anomalies) with respect to the number of data collected in the time window selected. Its range is (0, 1). It gives an idea about how often an abnormal behavior was detected with respect to both its value and its change over time. These aspects can help to decide if a closer monitoring of a component is needed, according to the information coming from the indicator NEB.
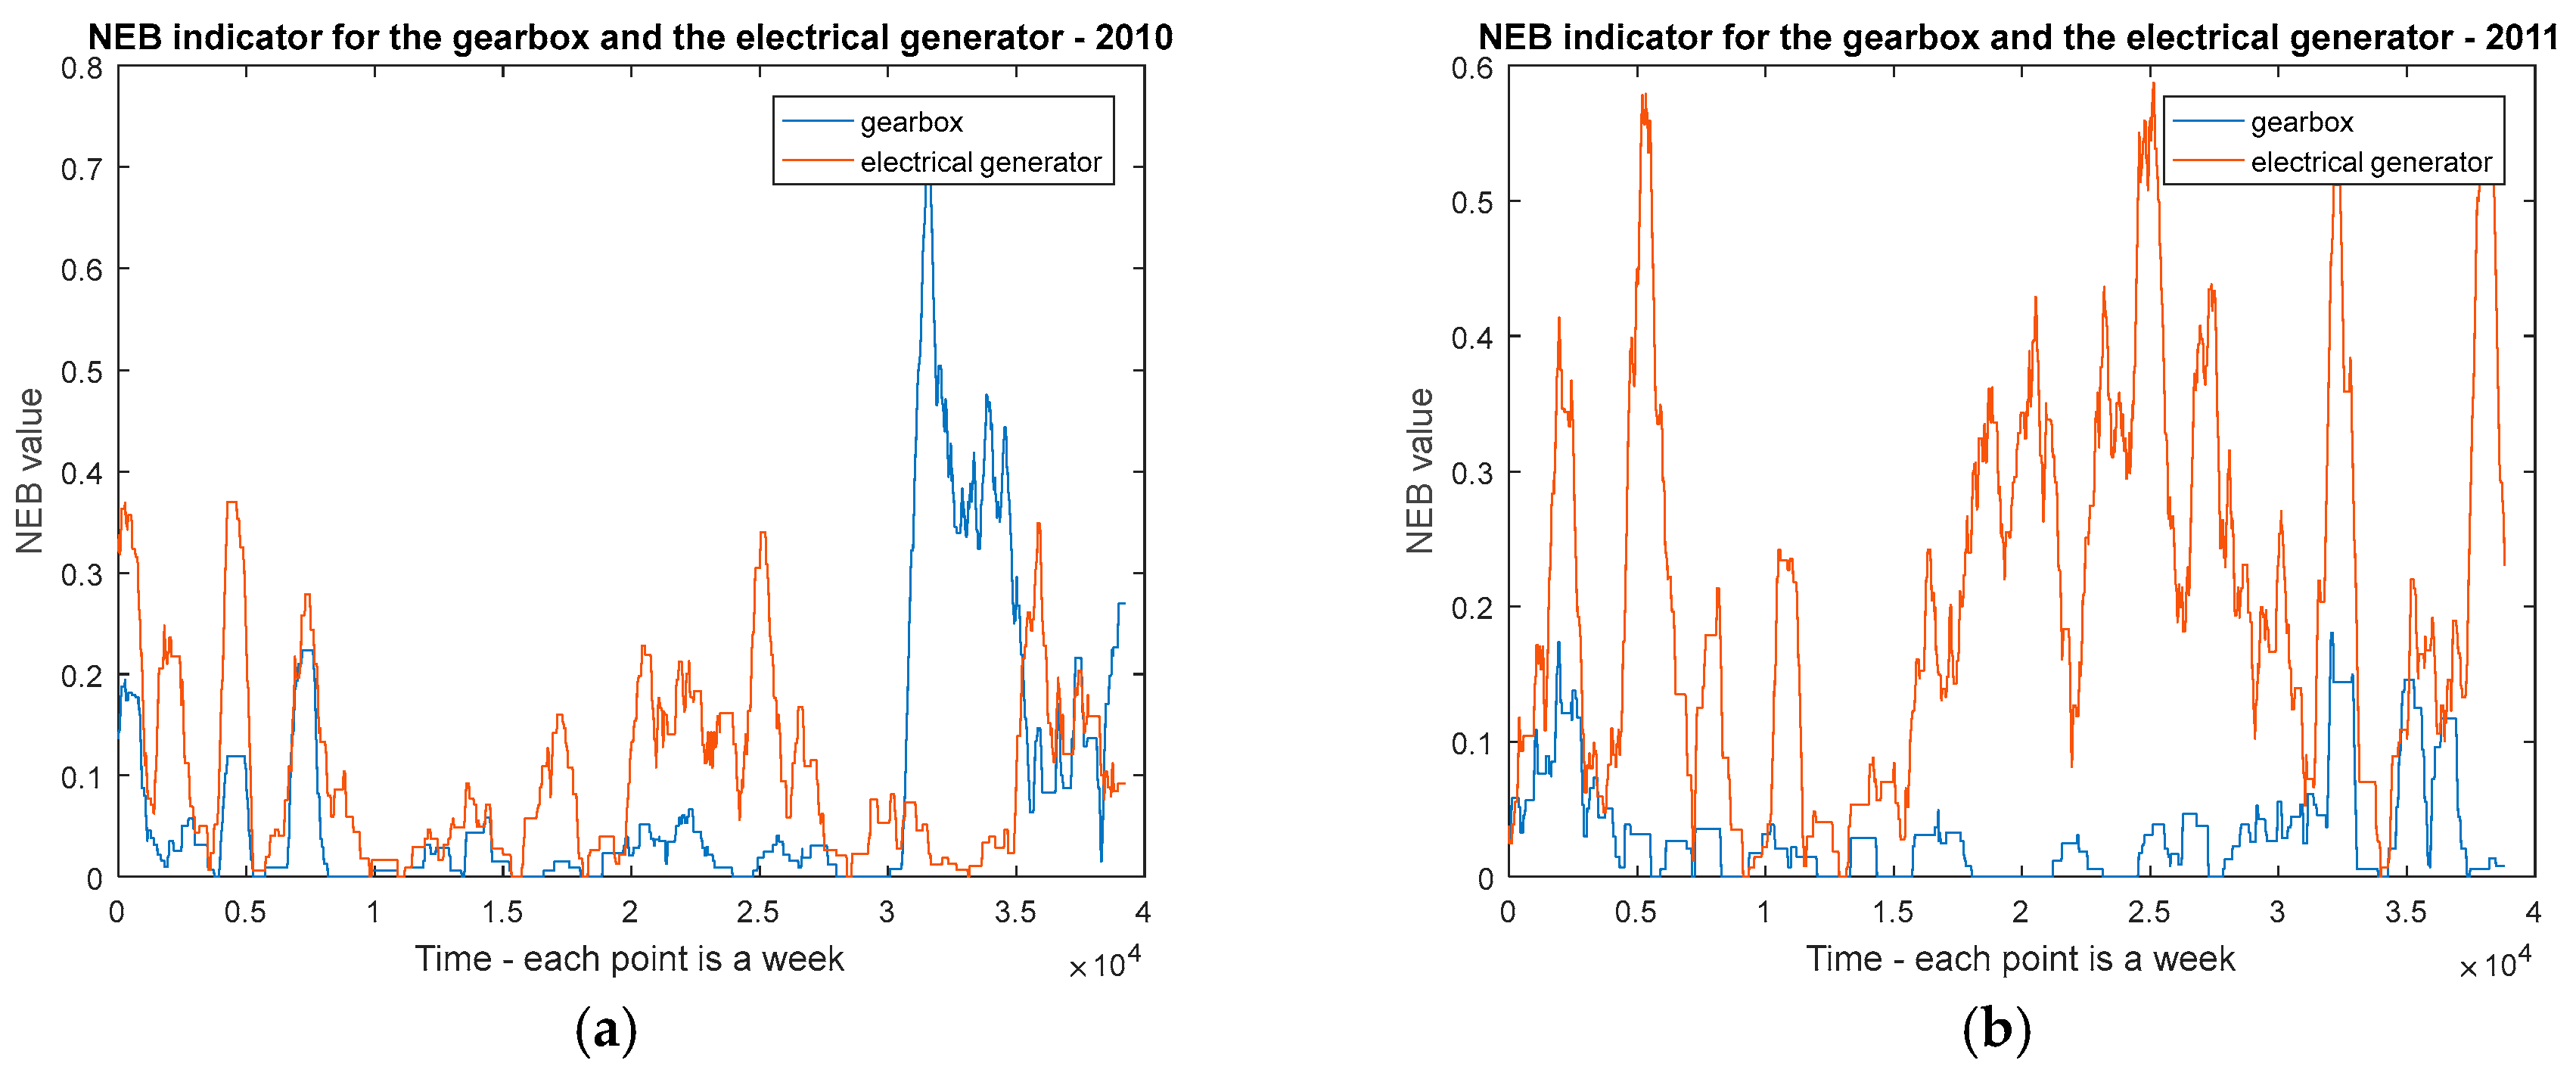
Figure 9 shows examples of NEB indicators for the components gearbox and electrical generator of a wind turbine during the years 2010 and 2011. During 2010, the gearbox shows an important deviation with respect to the normal behavior that is expected at the end of the period analyzed, where values near to 0.7 were reached. However, the electrical generator shows some periods of non-expected behavior, but the NEB indicator never overpassed the value of 0.4. During 2011, the gearbox was working as expected the most part of the year, but the values of the NEB indicator for the electrical generator increased with respect to the year 2010.
According to the profiles and values of the NEB indicators, valuable knowledge is available about the condition of the components and their possible risk of failure that can be used from the point of view of maintenance and asset management.
Some complementary information that is also useful is to observe the evolution of the NEB values that accumulated over the period of analysis. In particular, in this case, it is interesting to observe the slope and its changes for the NEB accumulated. This will give an idea about the acceleration of possible risk conditions of the components.
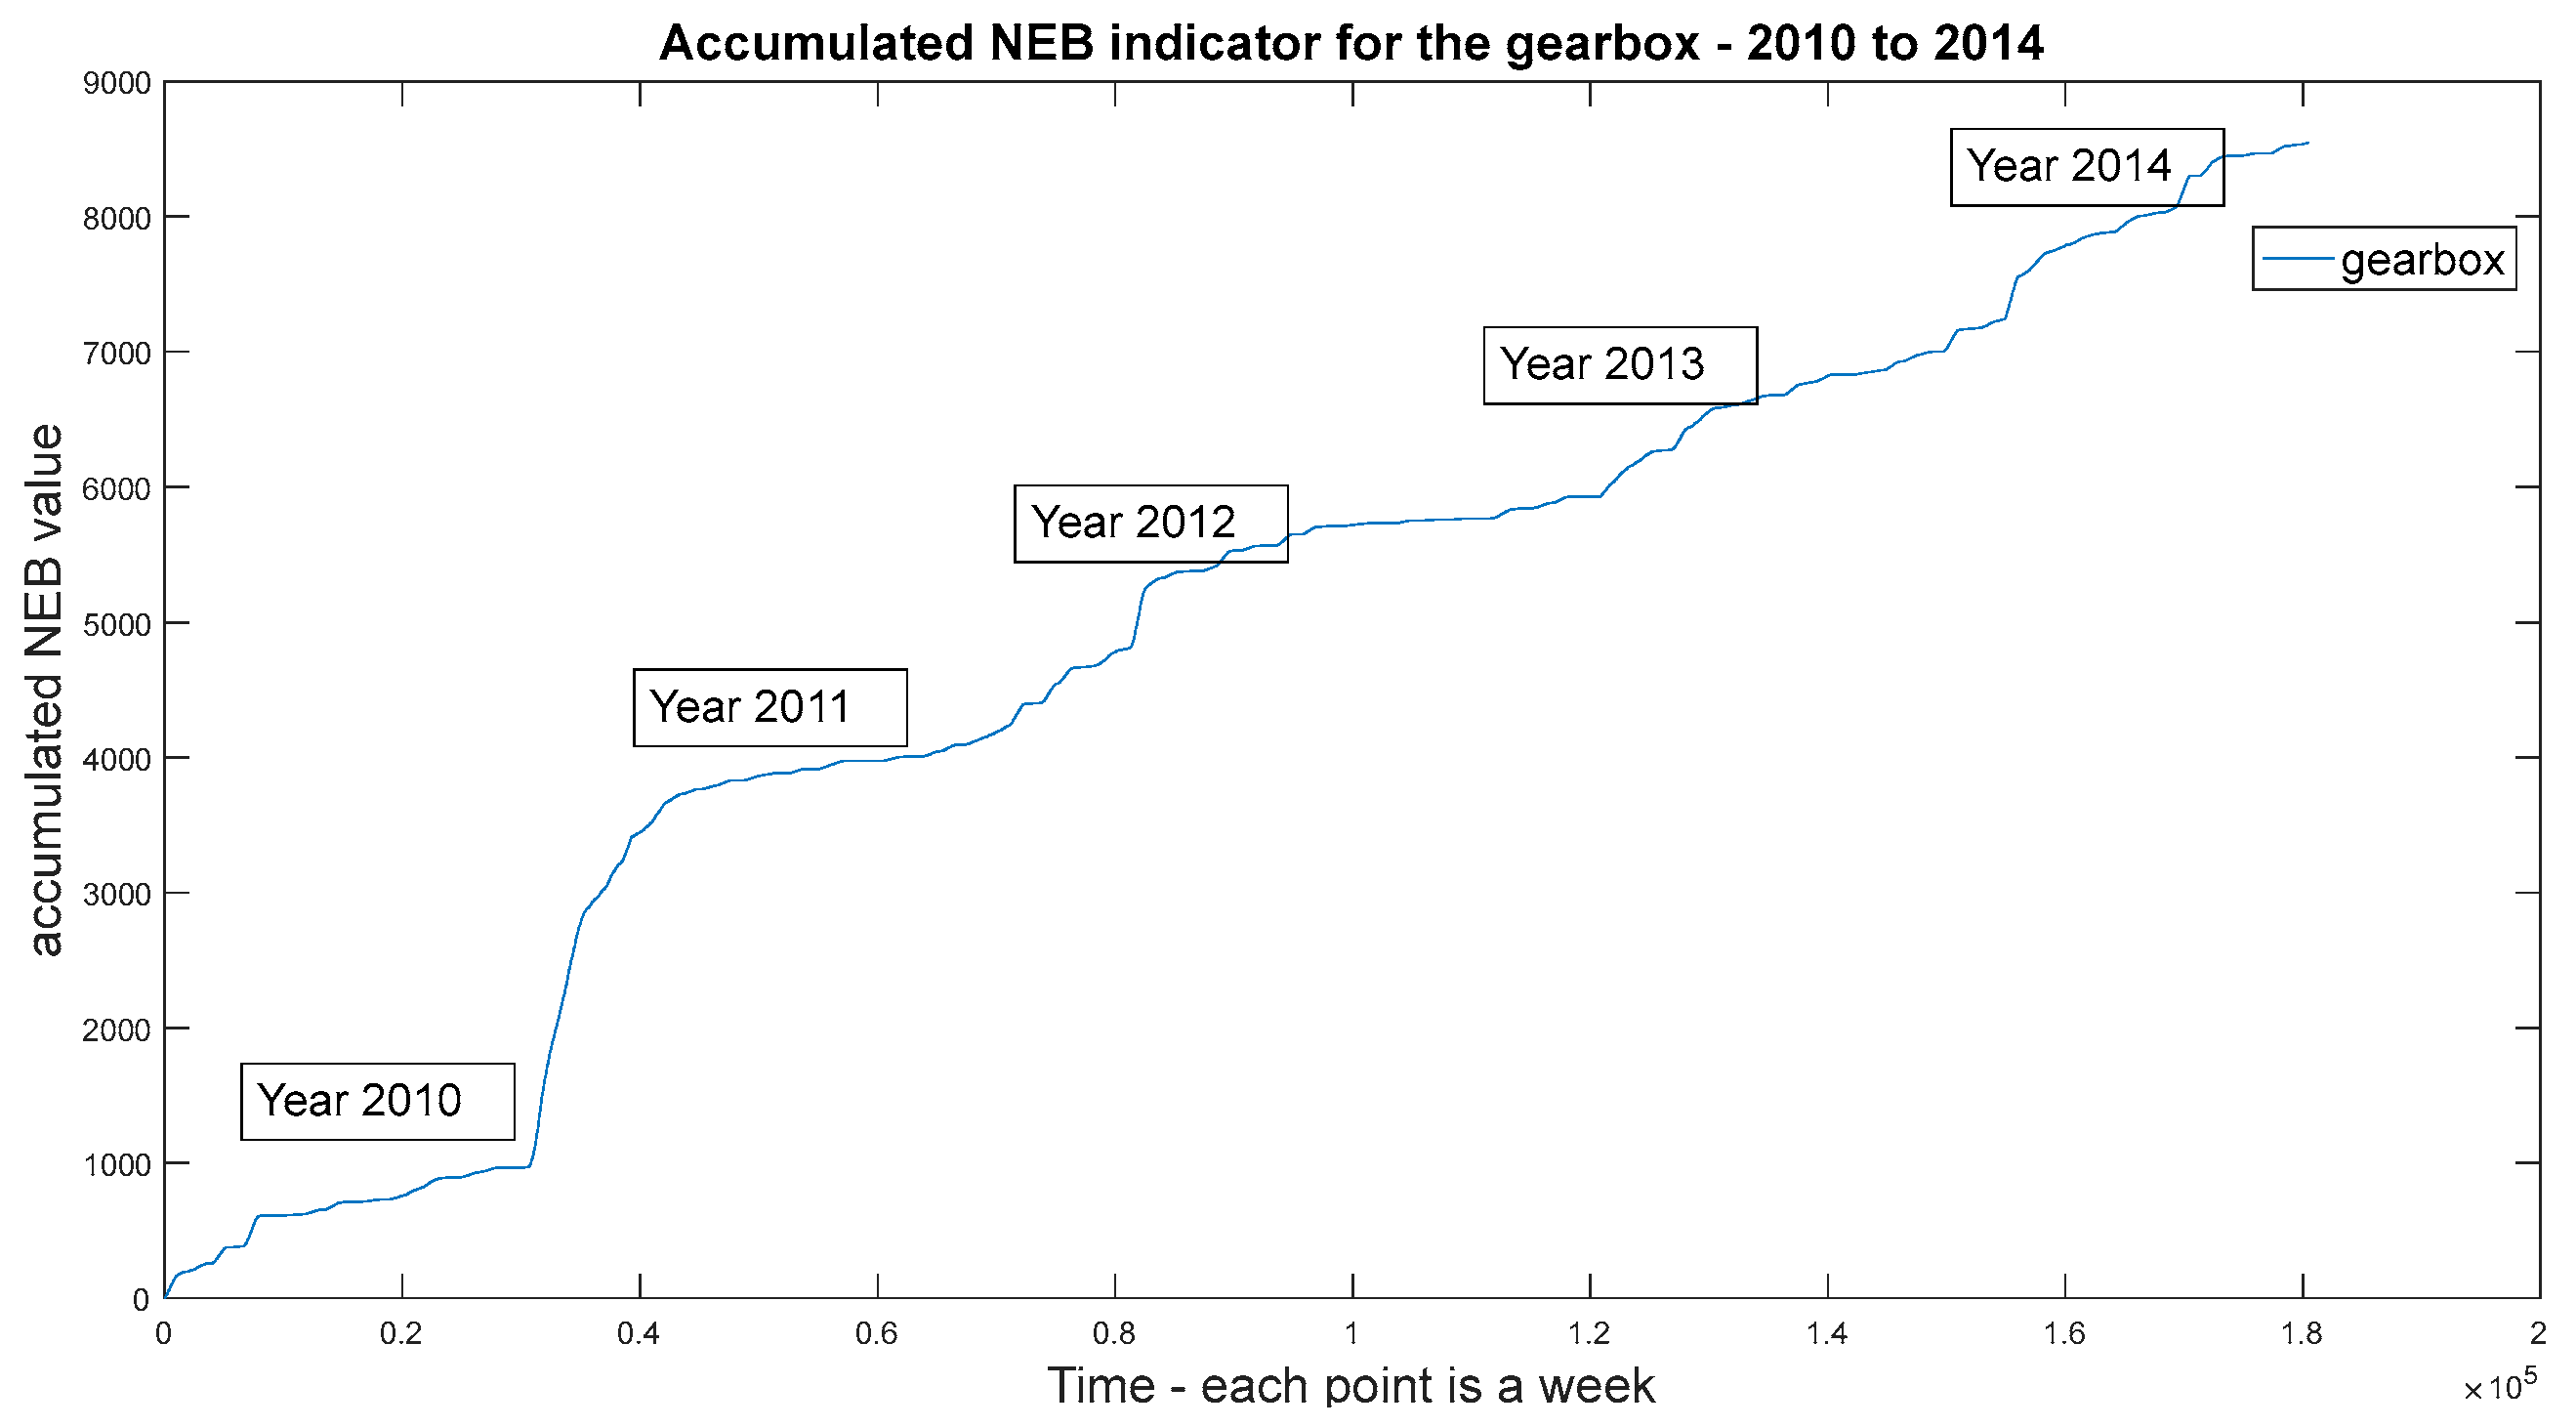
Figure 10 presents the accumulated NEB values between 2010 and 2014. Here, it is possible to observe an important slope change between 2010 and 2011, meaning an increase of non-expected working conditions. The change of the slope is slight over the rest of the years, except in 2014, where once again an increase occurs.
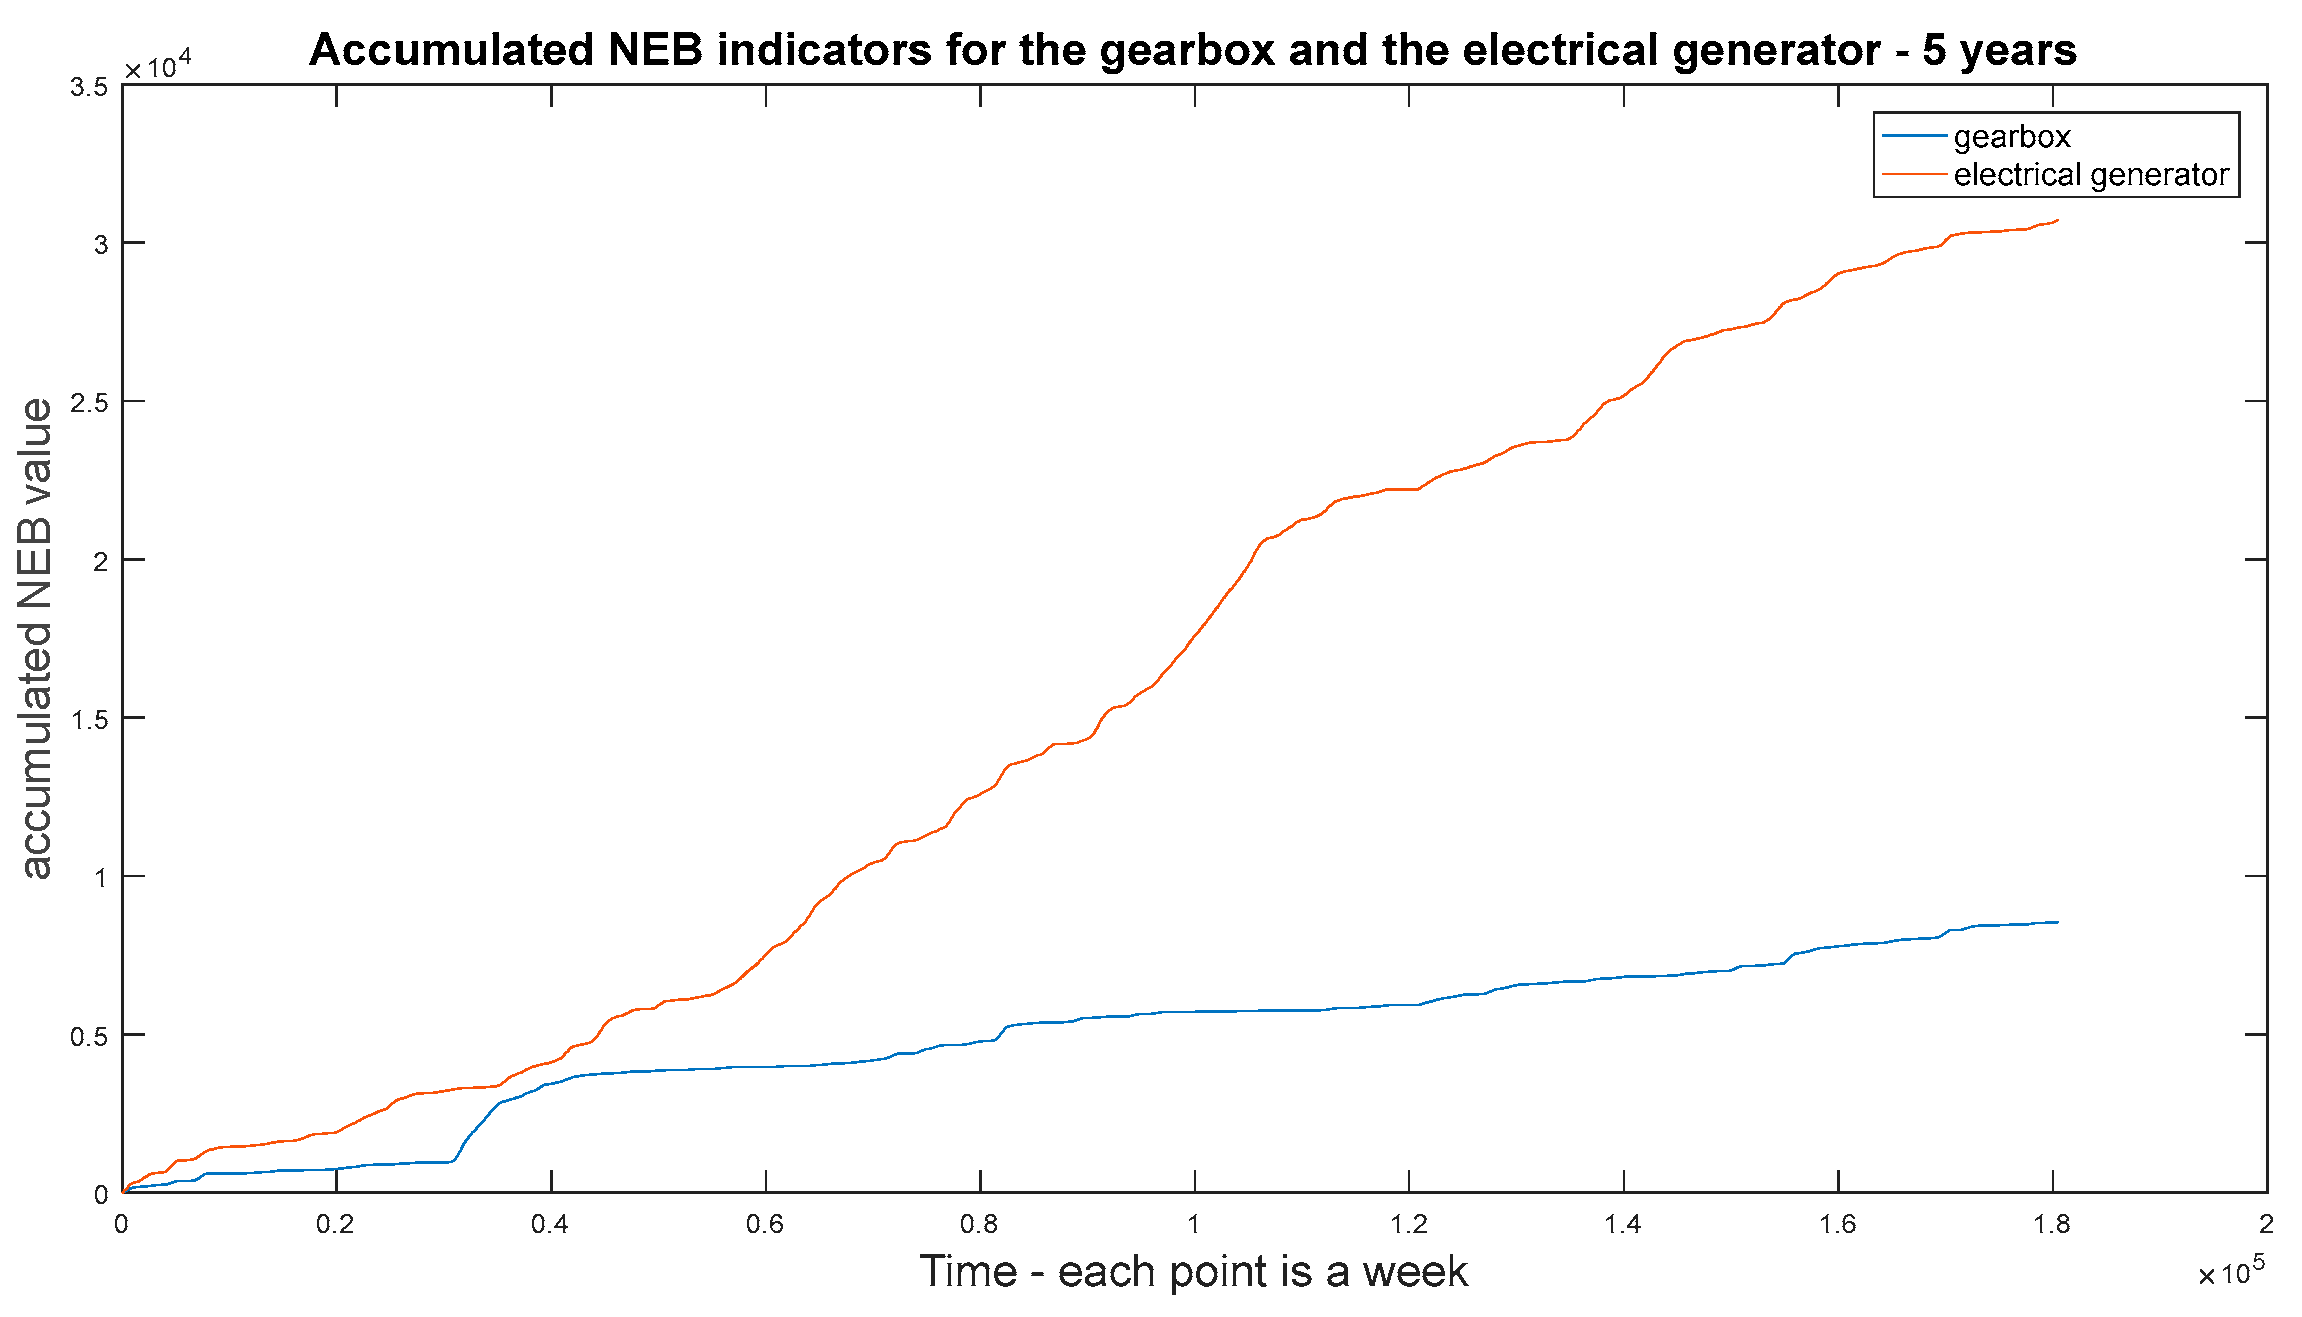
The
Figure 11 presents the accumulated NEB values for both the gearbox and the electrical generator between 2010 and 2014. As the main conclusion drawn from this figure, the behaviour of the electrical generator is degrading in the period of analysis and its behavior is increasingly different each year. At this point, it is convenient to point out that the reference patterns of the electrical generator are based on the bearings temperatures and the slip rings, meaning that the map of typical temperatures is changing to higher values, thus producing an increasing fault condition risk, which is important to monitor very closely. These facts that are presented in
Figure 11 through the NEB indicators were verified after a detailed analysis of the history of all these temperatures that are involved in the gearbox and the electrical generator. A particularly important increase in the temperature was detected in the electrical generator slip rings during the period of data available where for similar environmental conditions observed in the past and similar generation of power, the temperature was lower.
7. Conclusions
This paper has described a method to evaluate the health condition of components of a wind turbine based on the continuous monitoring of its behavior through some indicators of anomaly detection. These indicators are based on reference patterns previously obtained from behaviors observed, were able to characterize the typical relationships between a set of variables that can alert about the possible occurrence of a failure mode in a wind turbine component.
A set of self-organizing maps were used to build reference patterns of behavior for working conditions that are considered as normal for the gearbox and the electrical generator of a particular wind turbine. Once the reference patterns were obtained, the probability functions of data that they represent were also defined. Both instruments, reference patterns, and their probability density functions of data that they represent, were used for checking new data coming from the gearbox and the electrical generator in order to determine if they correspond or not to the normal behavior expected. This method is used for anomaly detection and for the estimation of indicators called “non-expected behavior per unit of time” (NEB), developed for the gearbox and the electrical generator of a wind turbine as examples of their application. These indicators are very useful to support or not a re-scheduling of the maintenance planned, and as another important input in the whole process of taking decisions in the asset management of a wind farm. This was confirmed, for example, in the case of the NEB indicator applied to the electrical generator, because after reviewing the historical evolution of the temperature slip rings, a slow increase was observed within the analyzed years without any particular changes in the working conditions of the other components. In any case, as previously mentioned in the paper, the ideal scenario is to combine the NEB indicators with similar ones that were obtained through other methods. In general, the hybridization and integration of several methods of anomaly detection always make the detection of anomalies in industrial components more robust and reliable. Future work will extend the results obtained to a better and a more thorough knowledge of the relationships between the evolution of the NEB indicators and fault and survival analyses.


