Well Test Analysis for Fractured and Vuggy Carbonate Reservoirs of Well Drilling in Large Scale Cave

Abstract
:1. Introduction
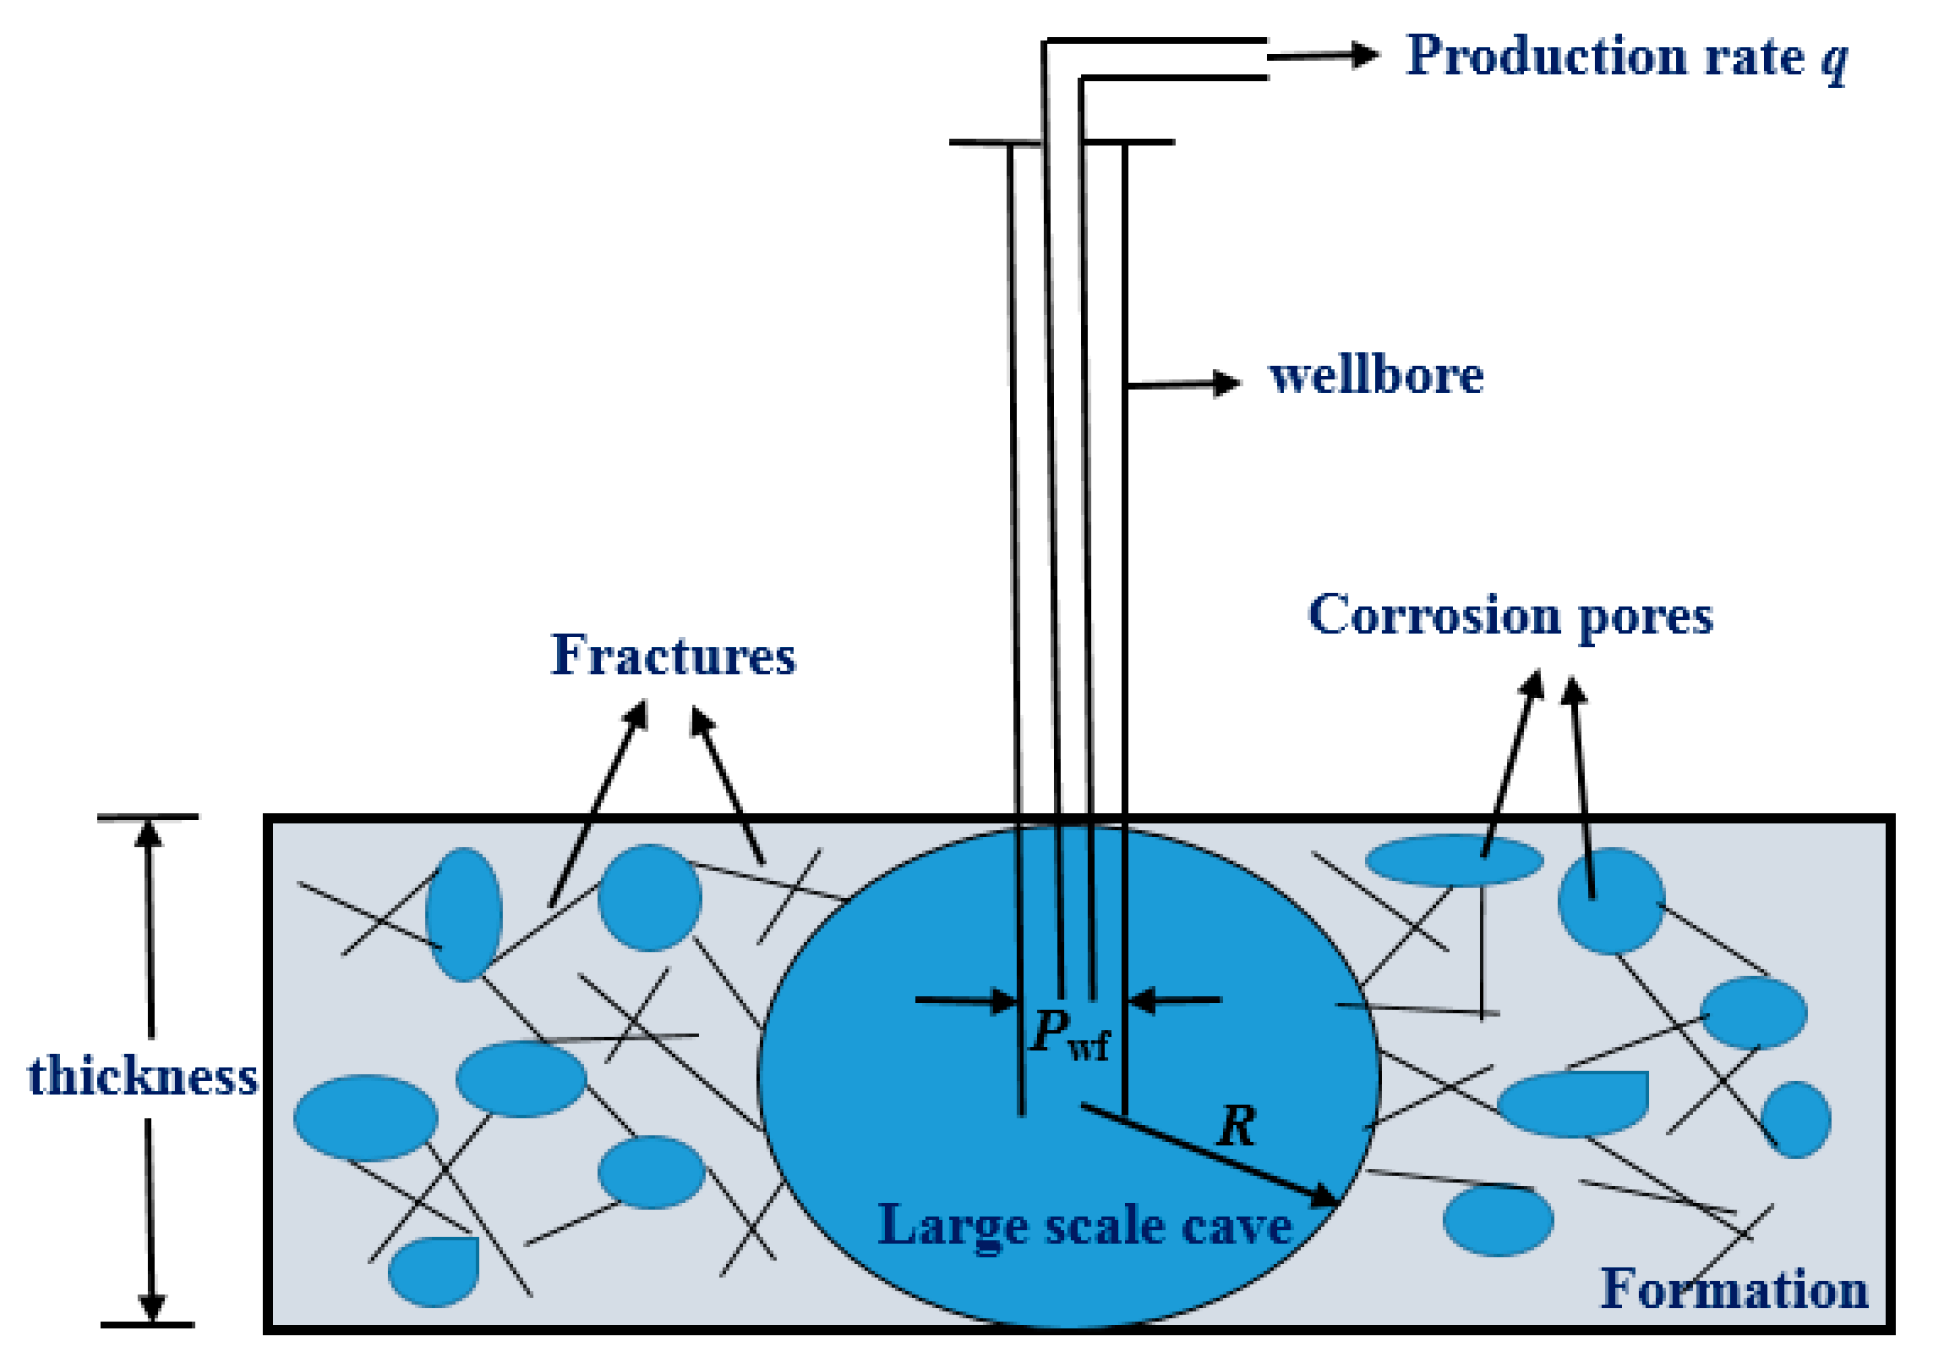
2. Physical Model
- (1)
- fluid is single-phase and micro compressible;
- (2)
- formation is circular, isotropy, horizontal, equal thickness, and the cave is surrounded by dual porosity media;
- (3)
- effects of gravity and capillary force are ignored, but the effects of wellbore storage and skin effect are considered;
- (4)
- large scale cave is regard as equipotential body. In the dual-porosity medium, the flow of fluid is Darcy flow, and the flow process is isothermal, without any special physical and chemical phenomena;
- (5)
- well is produced at a fixed volume;
- (6)
- oil reservoir is mined, and the pressure at any location in the reservoir is the initial formation pressure;
- (7)
- large scale cave is in the center of circular formation, and the cave radius is R, with well drilling cave. Fractures are the main flow channel, the fluid flow into the cave through the fractures, and then through the oil well, the fluid of in large scale cave can be produced.
3. Mathematical Model
3.1. Establishment of Mathematical Model
3.2. Solution of Mathematical Model
4. Analysis on Well Test Curves
4.1. Characteristics Analysis of the Well Test Typical Curves
4.2. Sensitiveness Studies
- (1)
- The influence of skin factor on well test typical curves
- (2)
- The influence of cave radius on well test typical curves
- (3)
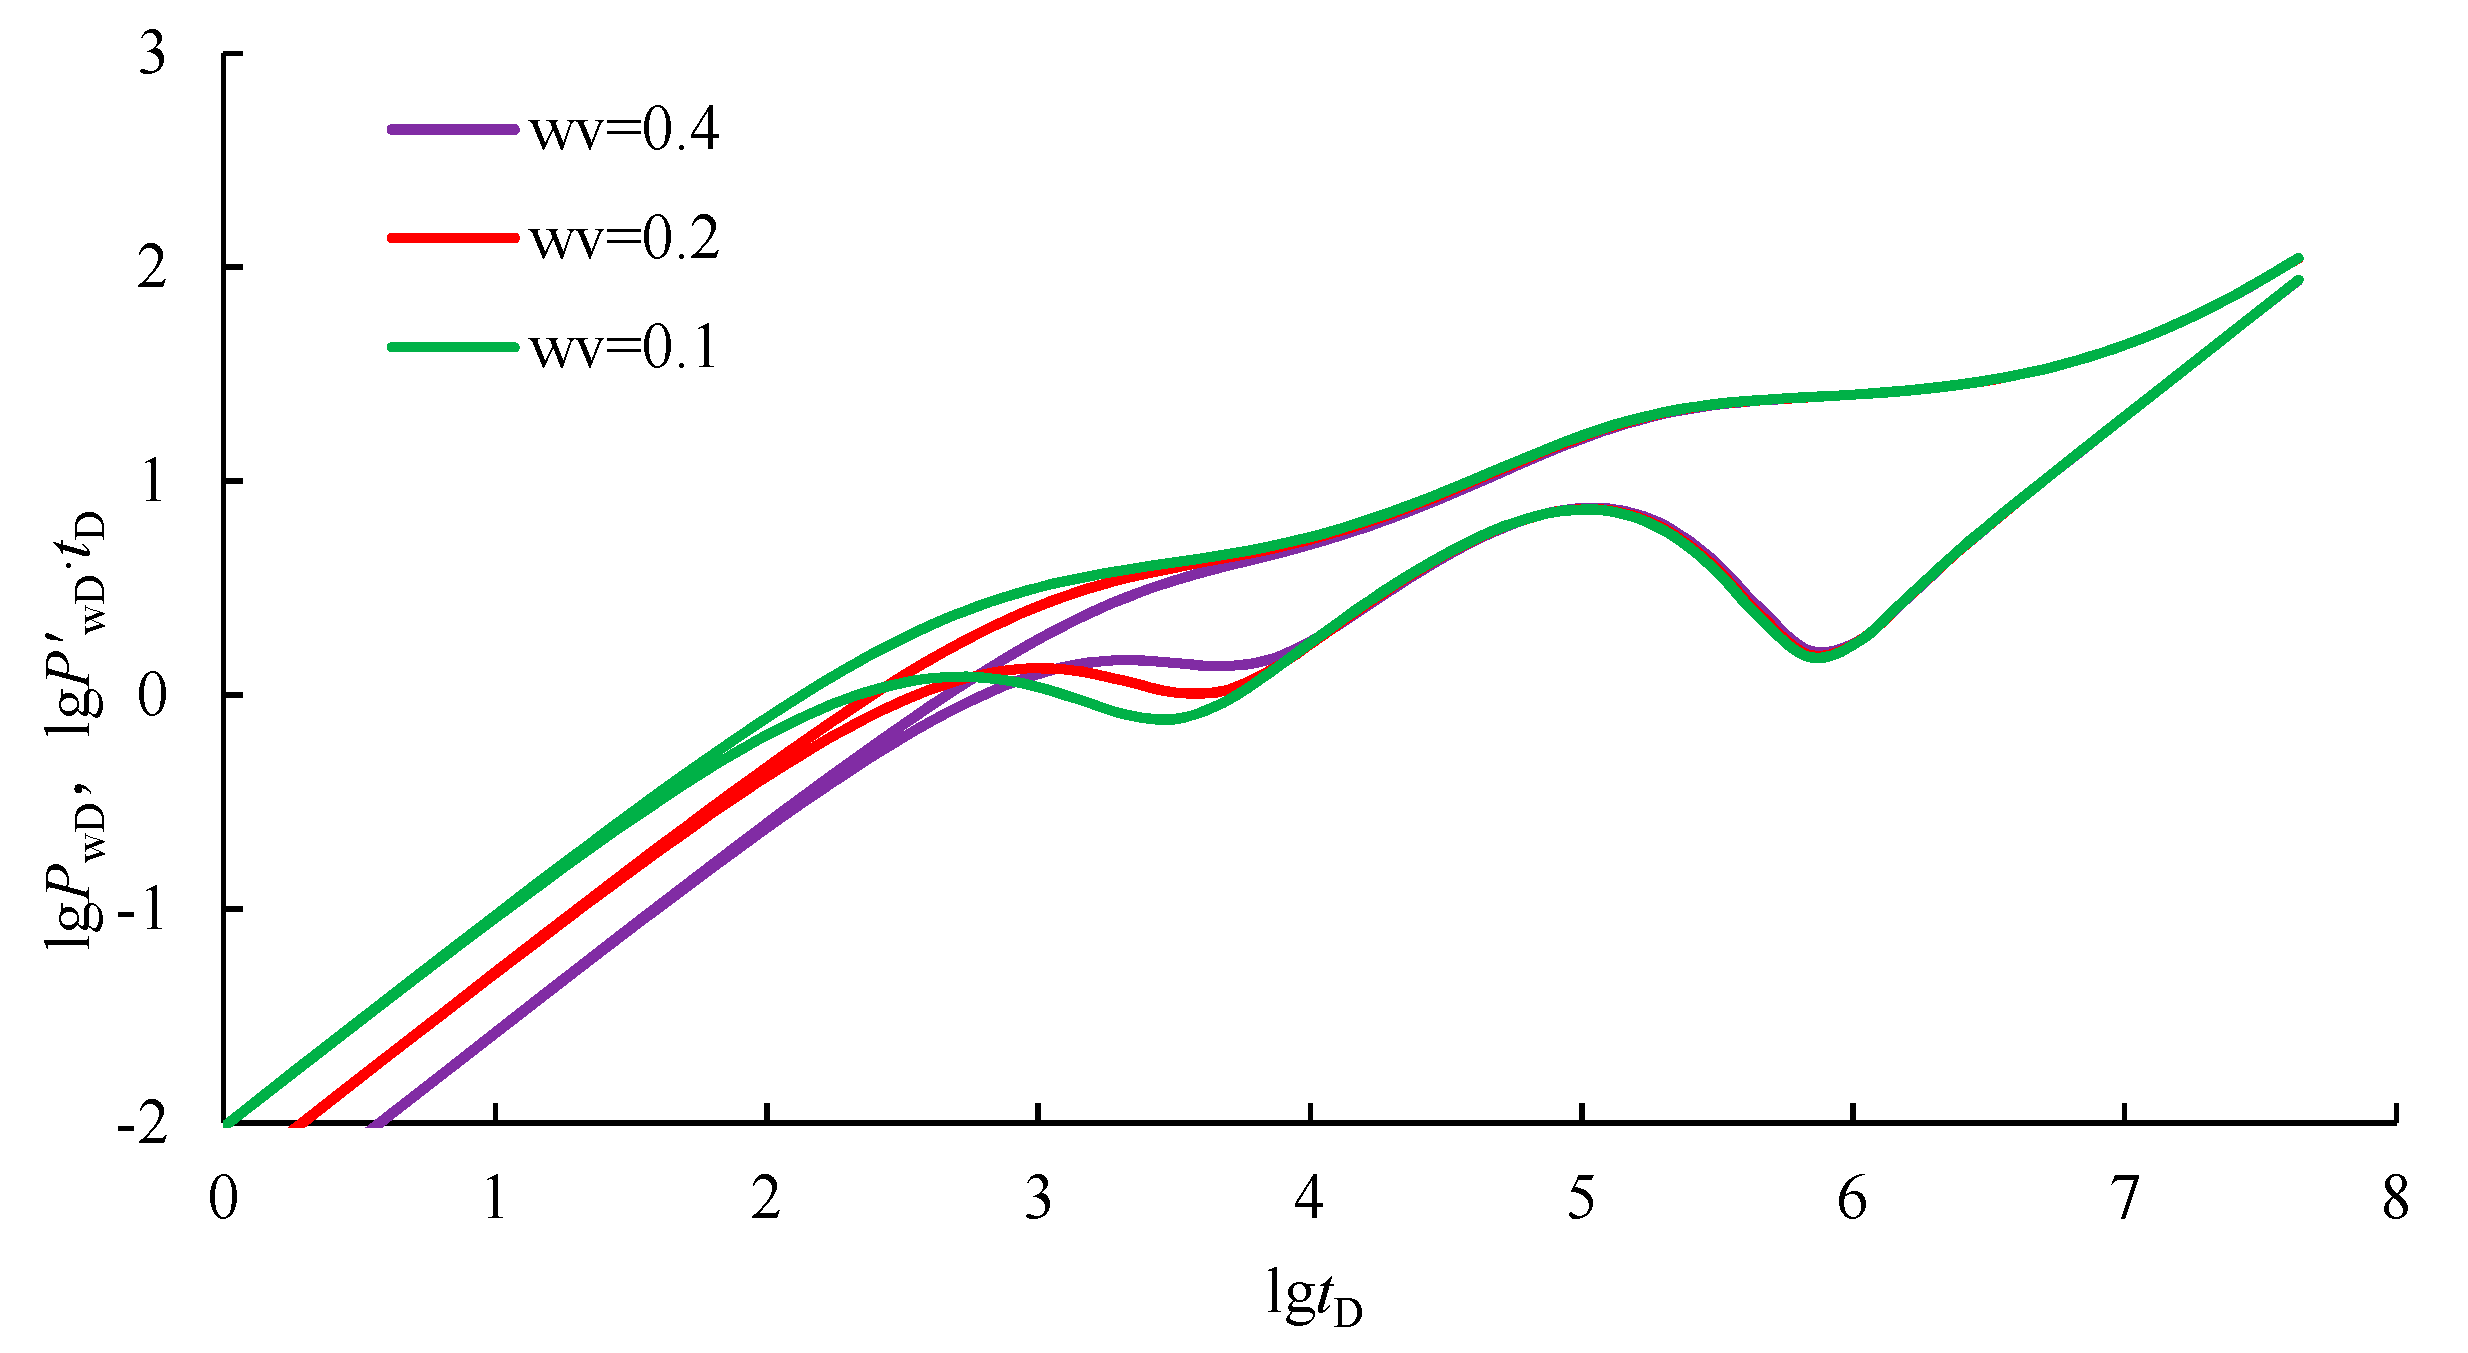
- The influence of storage ratio on well test typical curves
- (4)
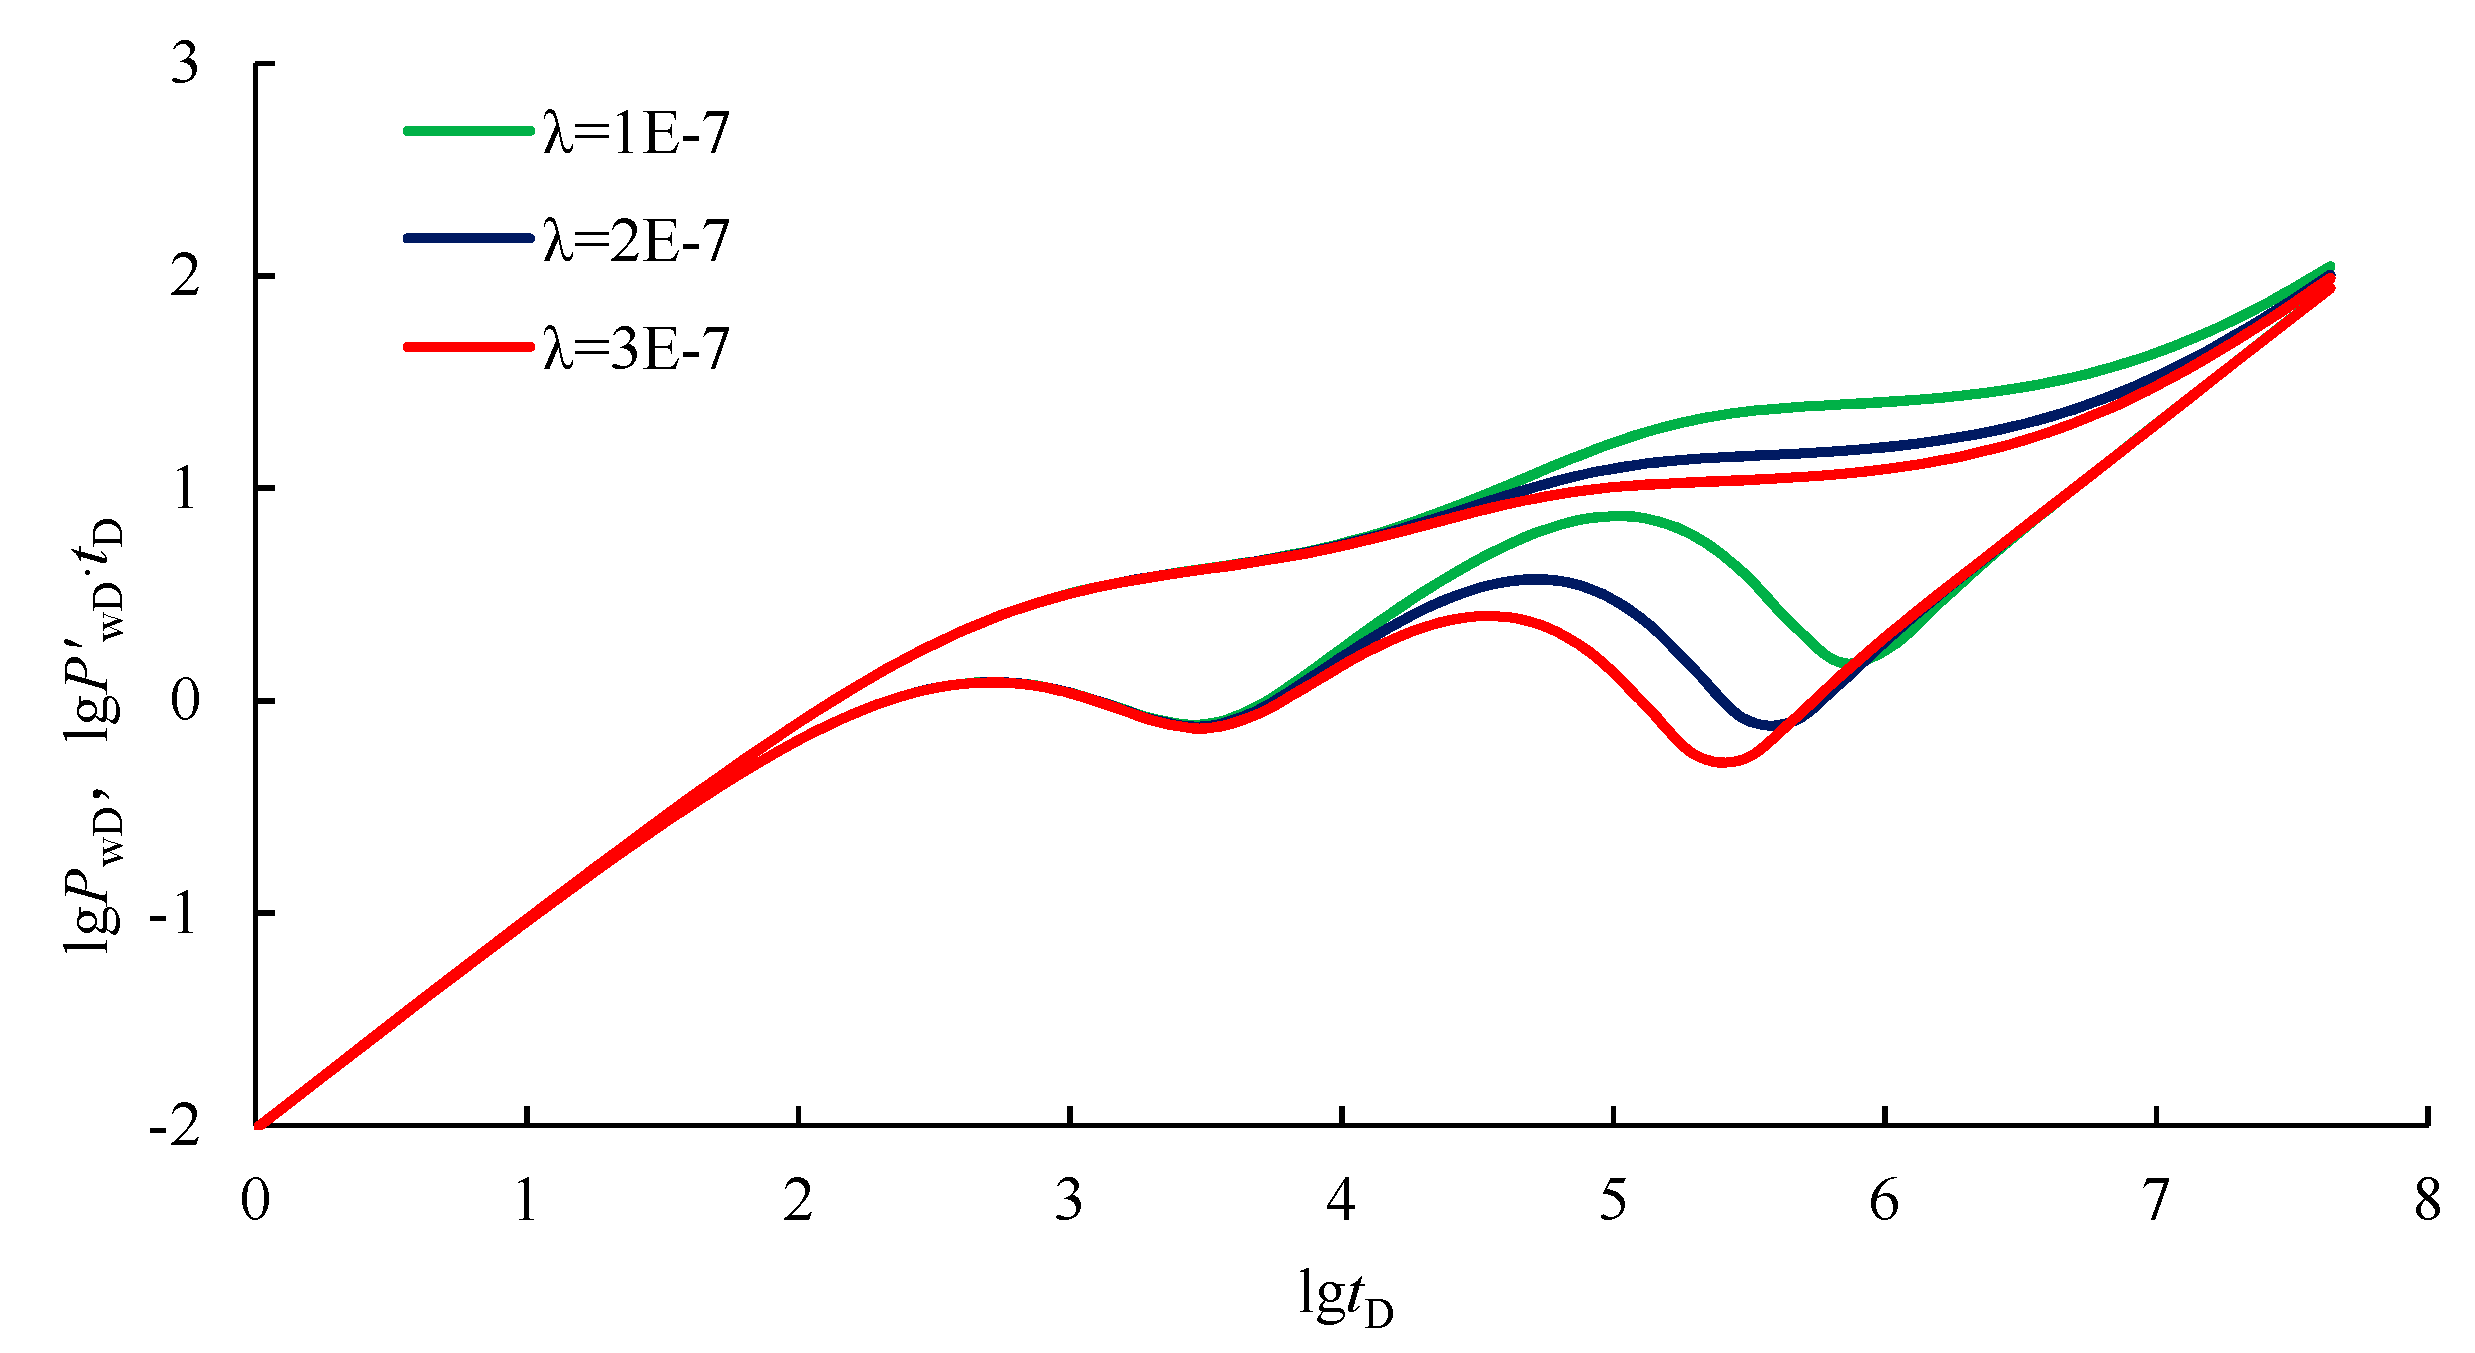
- The influence of cross flow coefficient on well test typical curves
- (5)
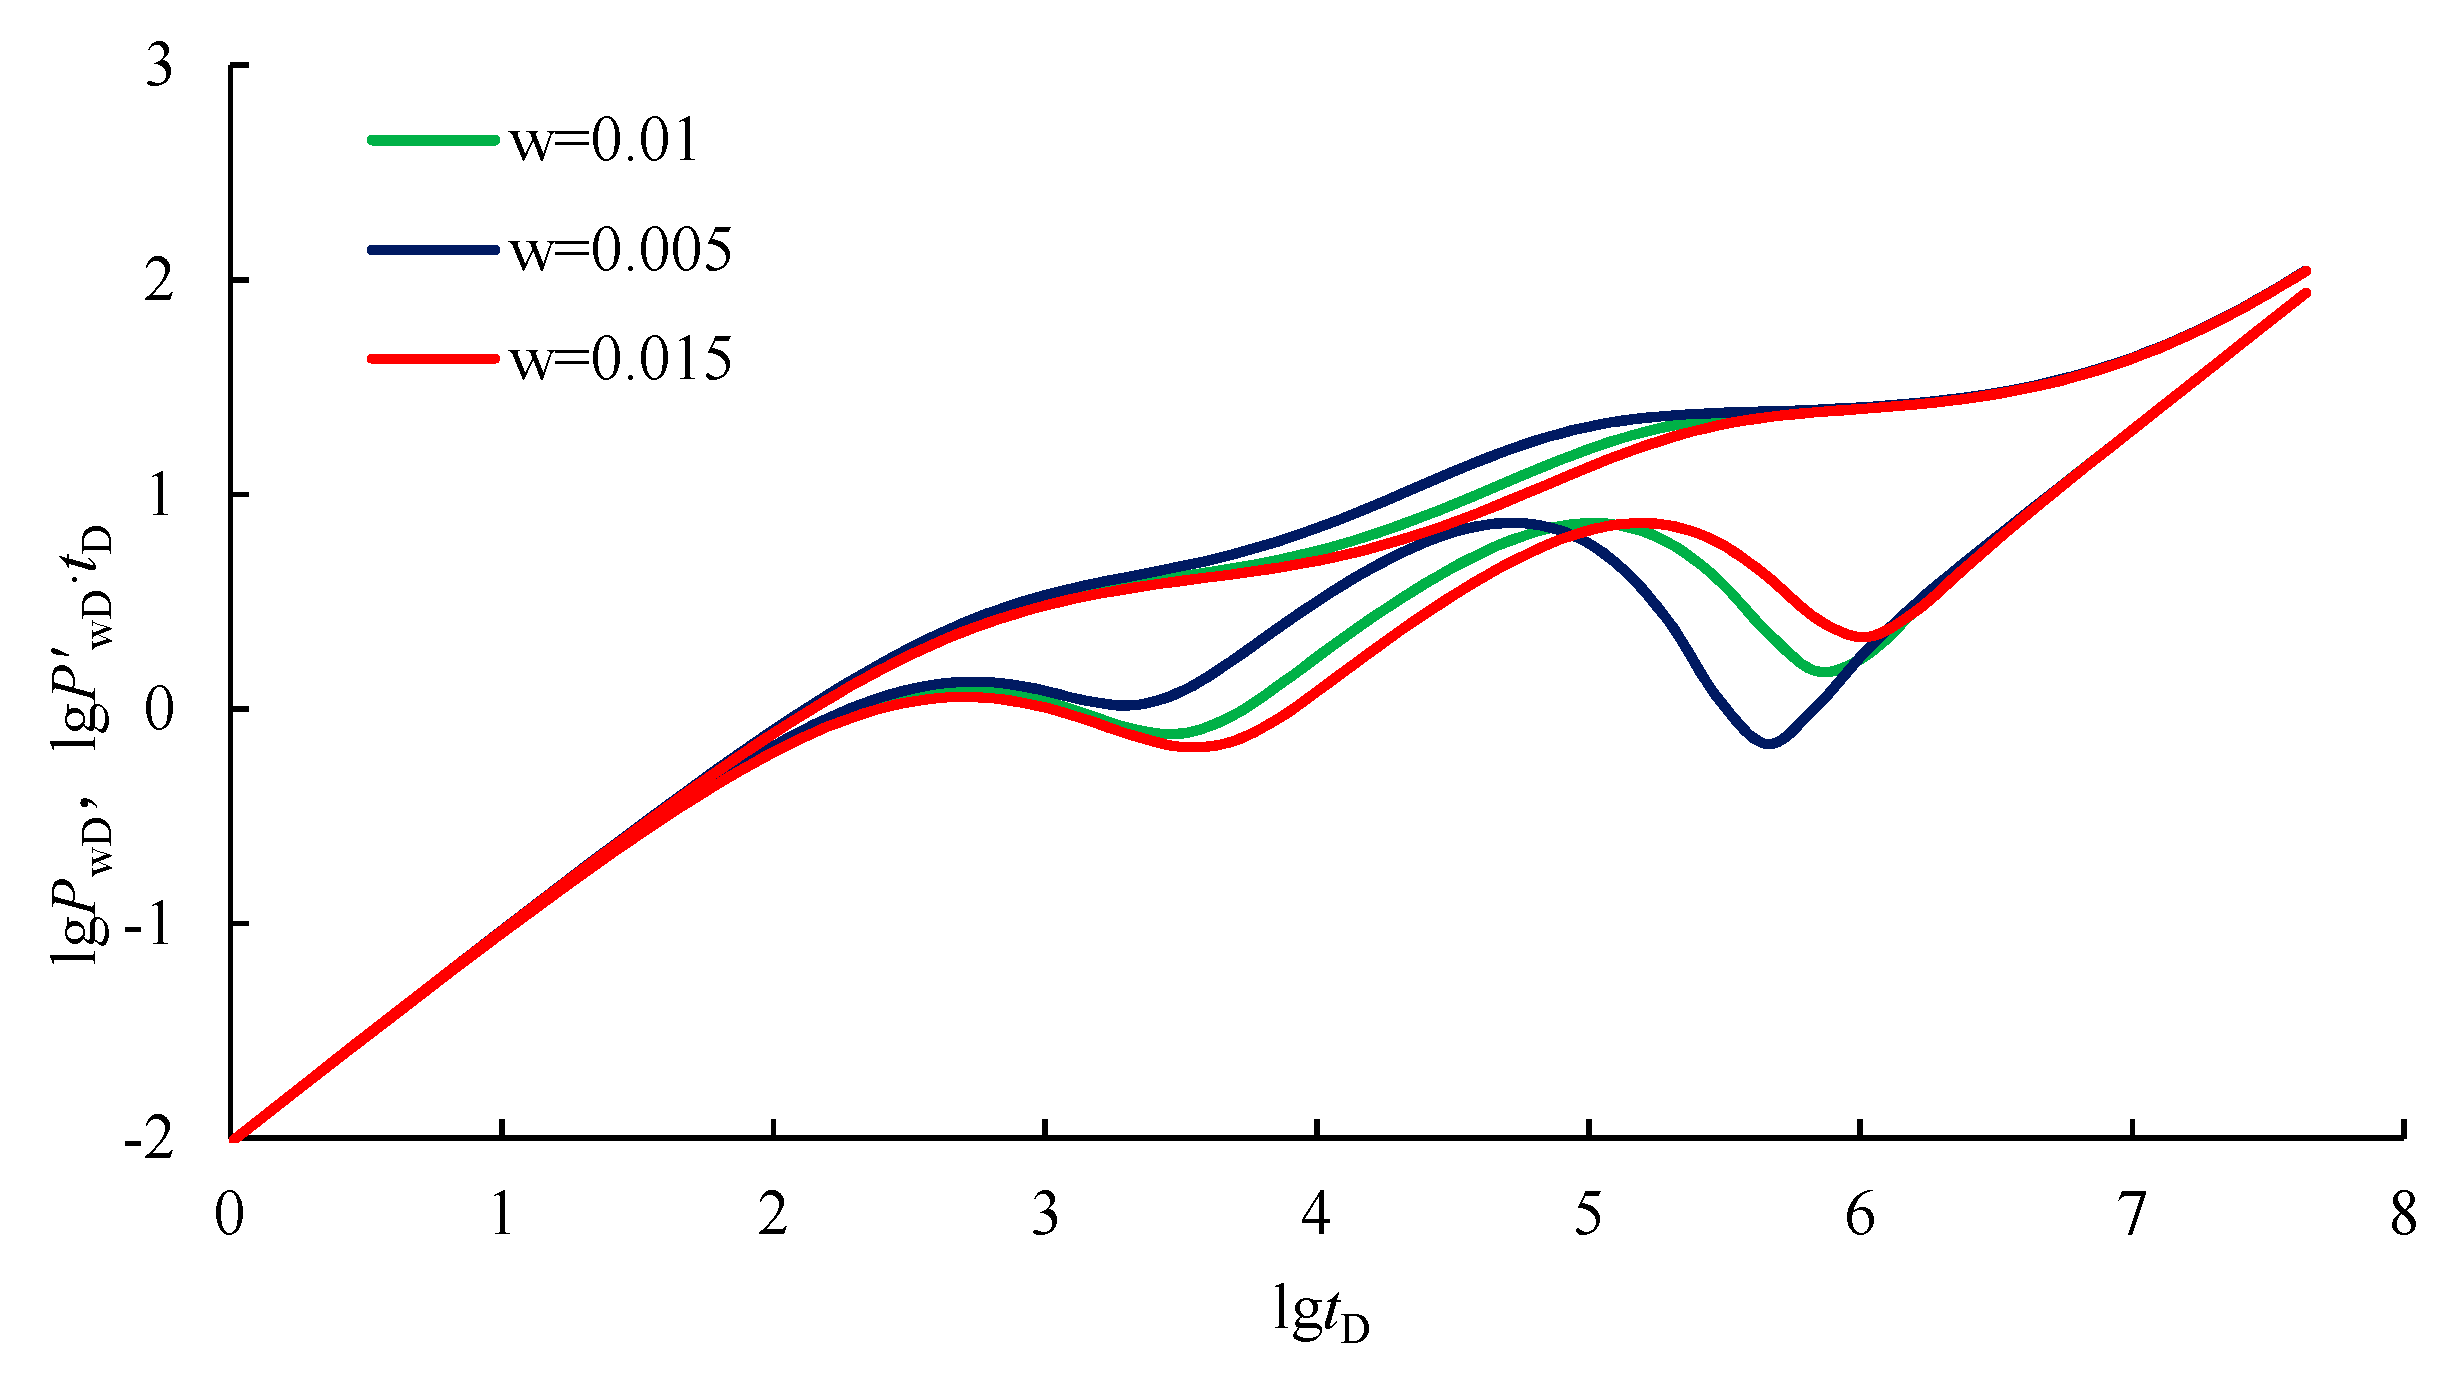
- The influence of dimensionless storage ratio of fractures on well test typical curves
- (6)
- The influence of dimensionless wellbore storage on well test typical curves
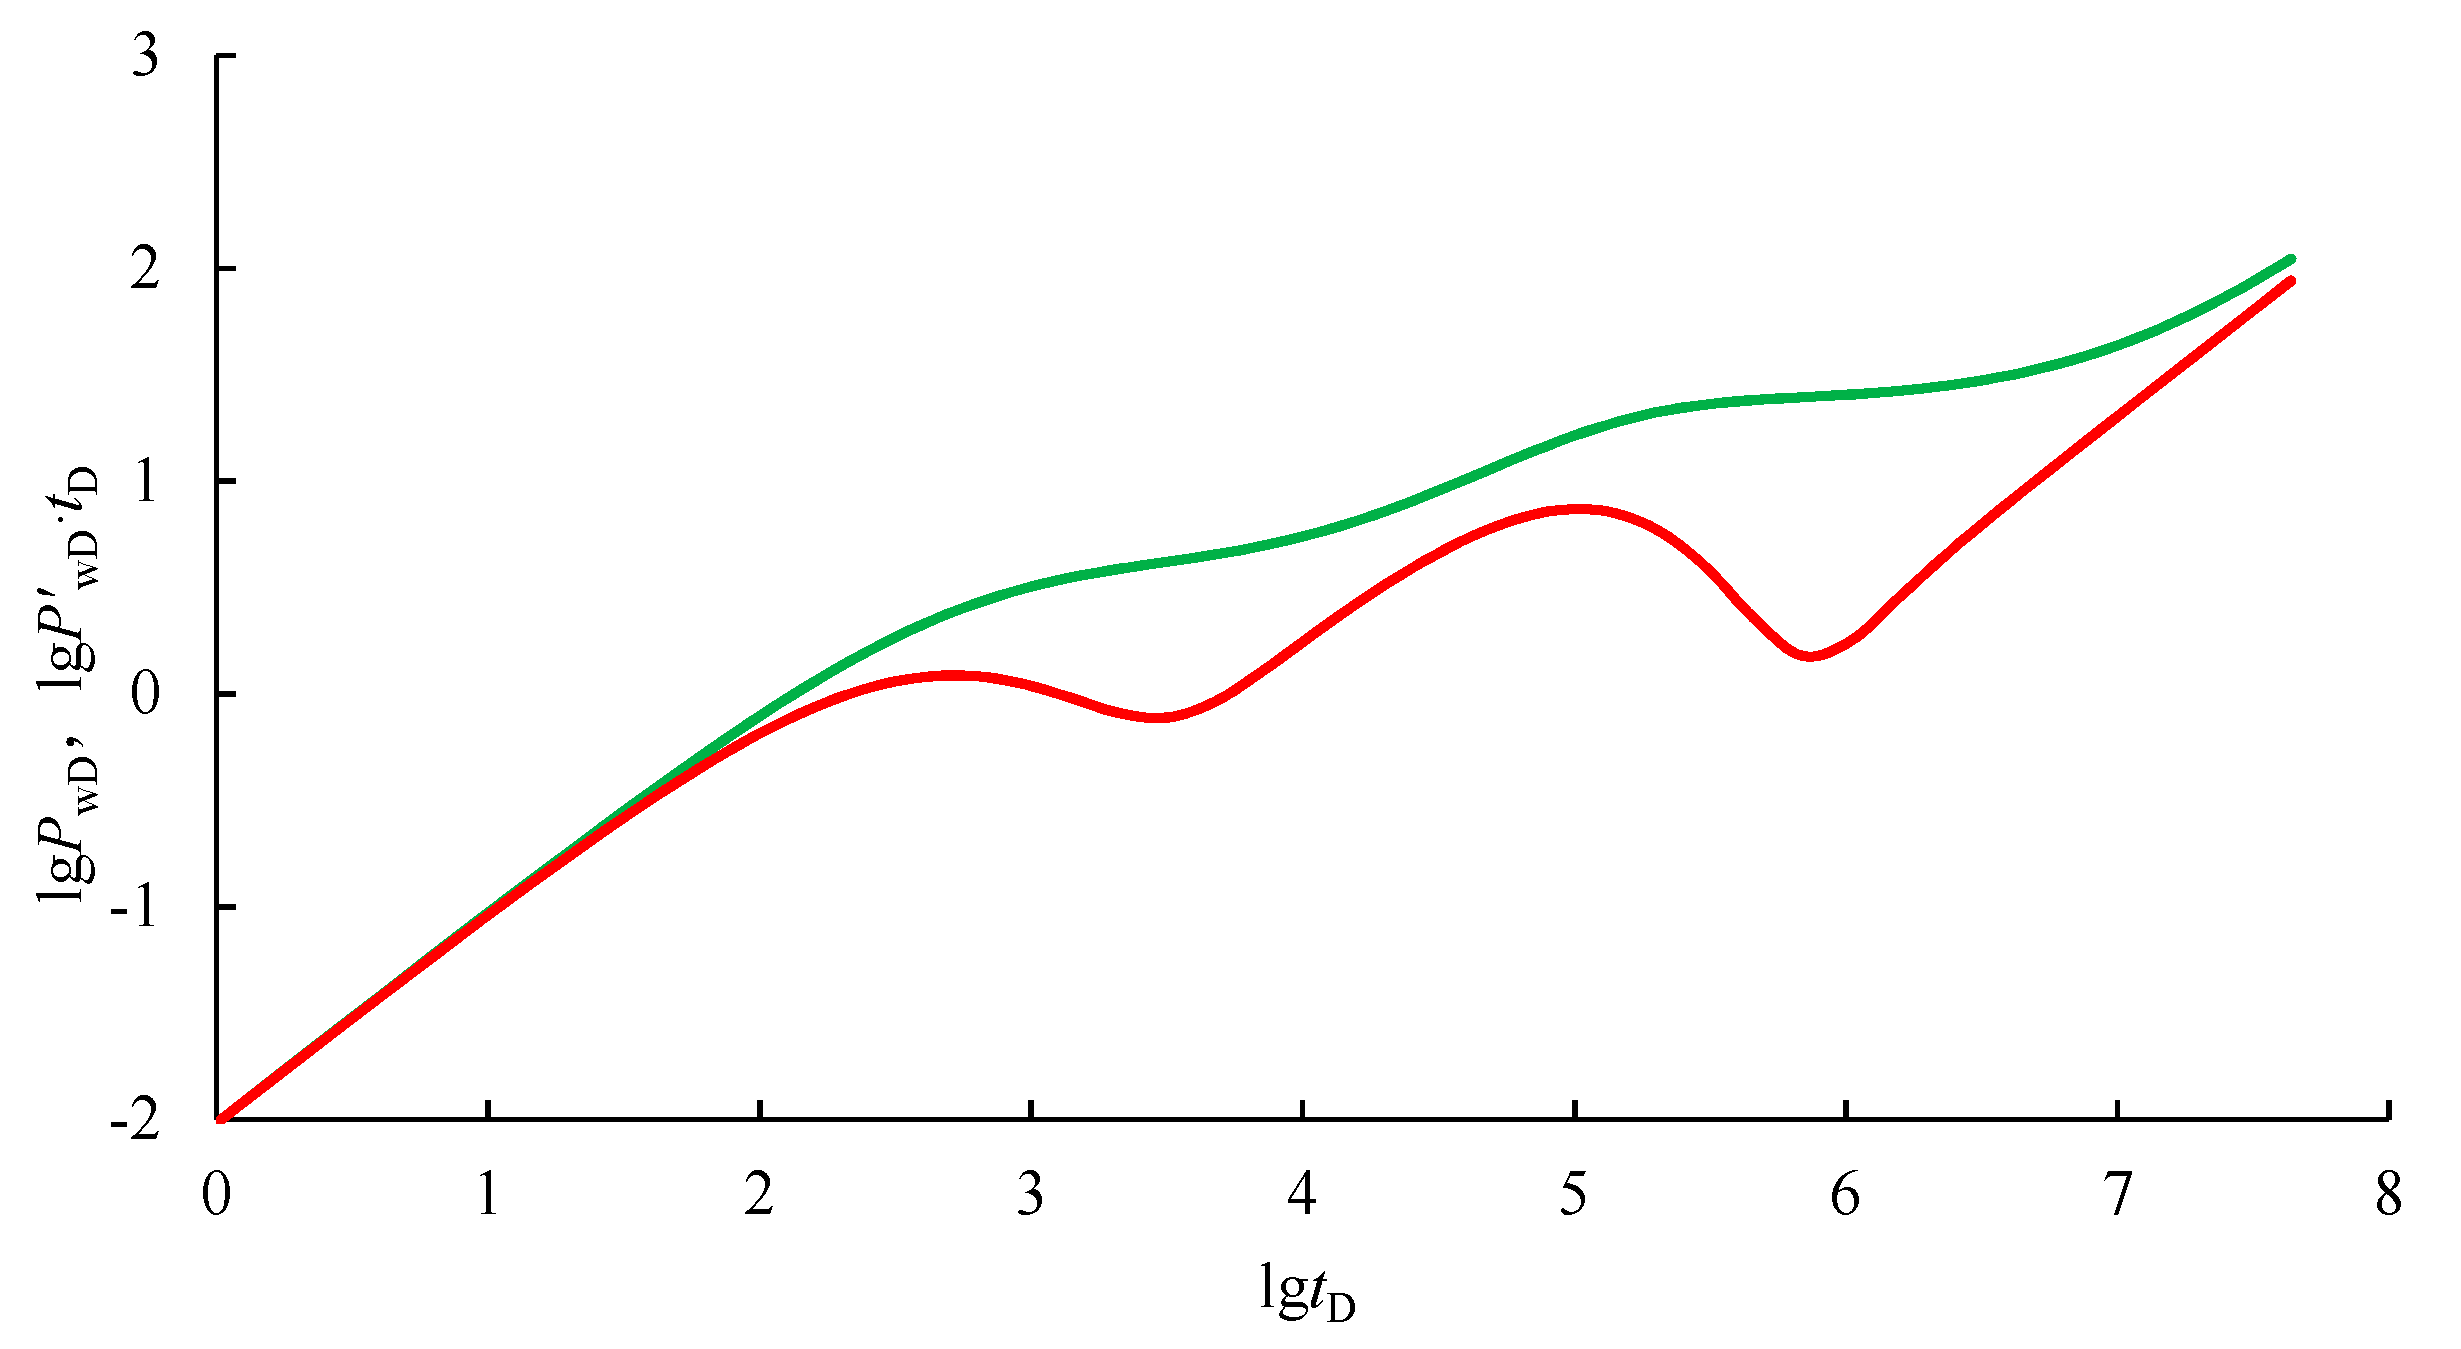
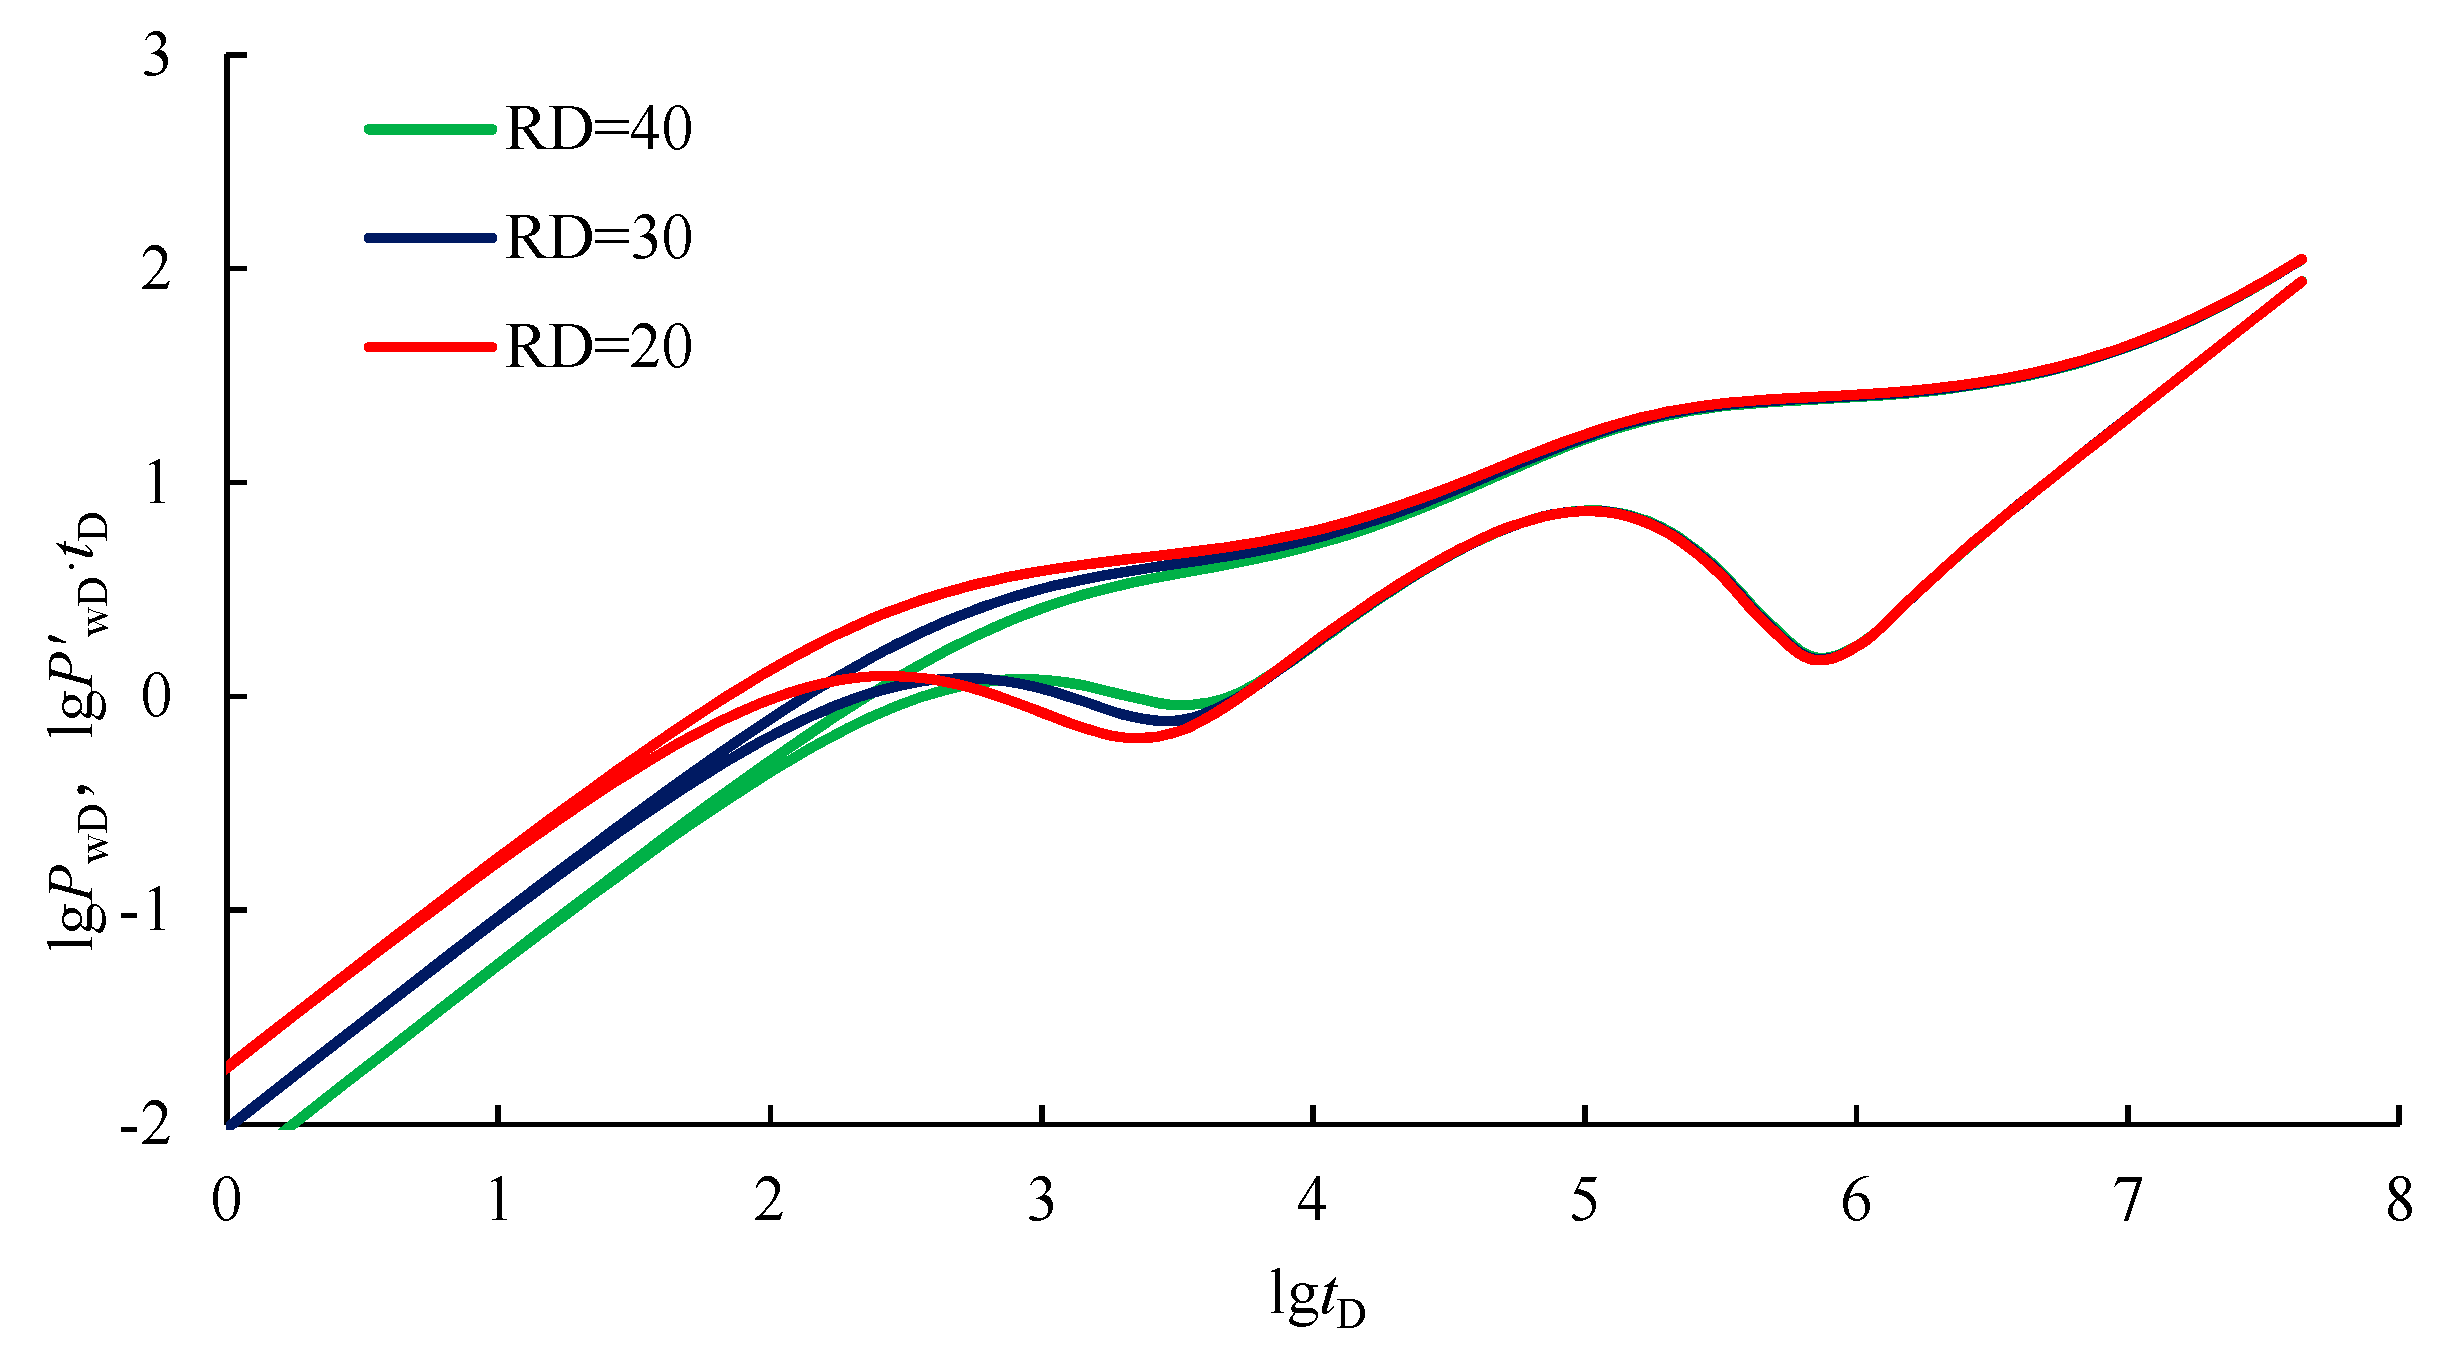
- (7)
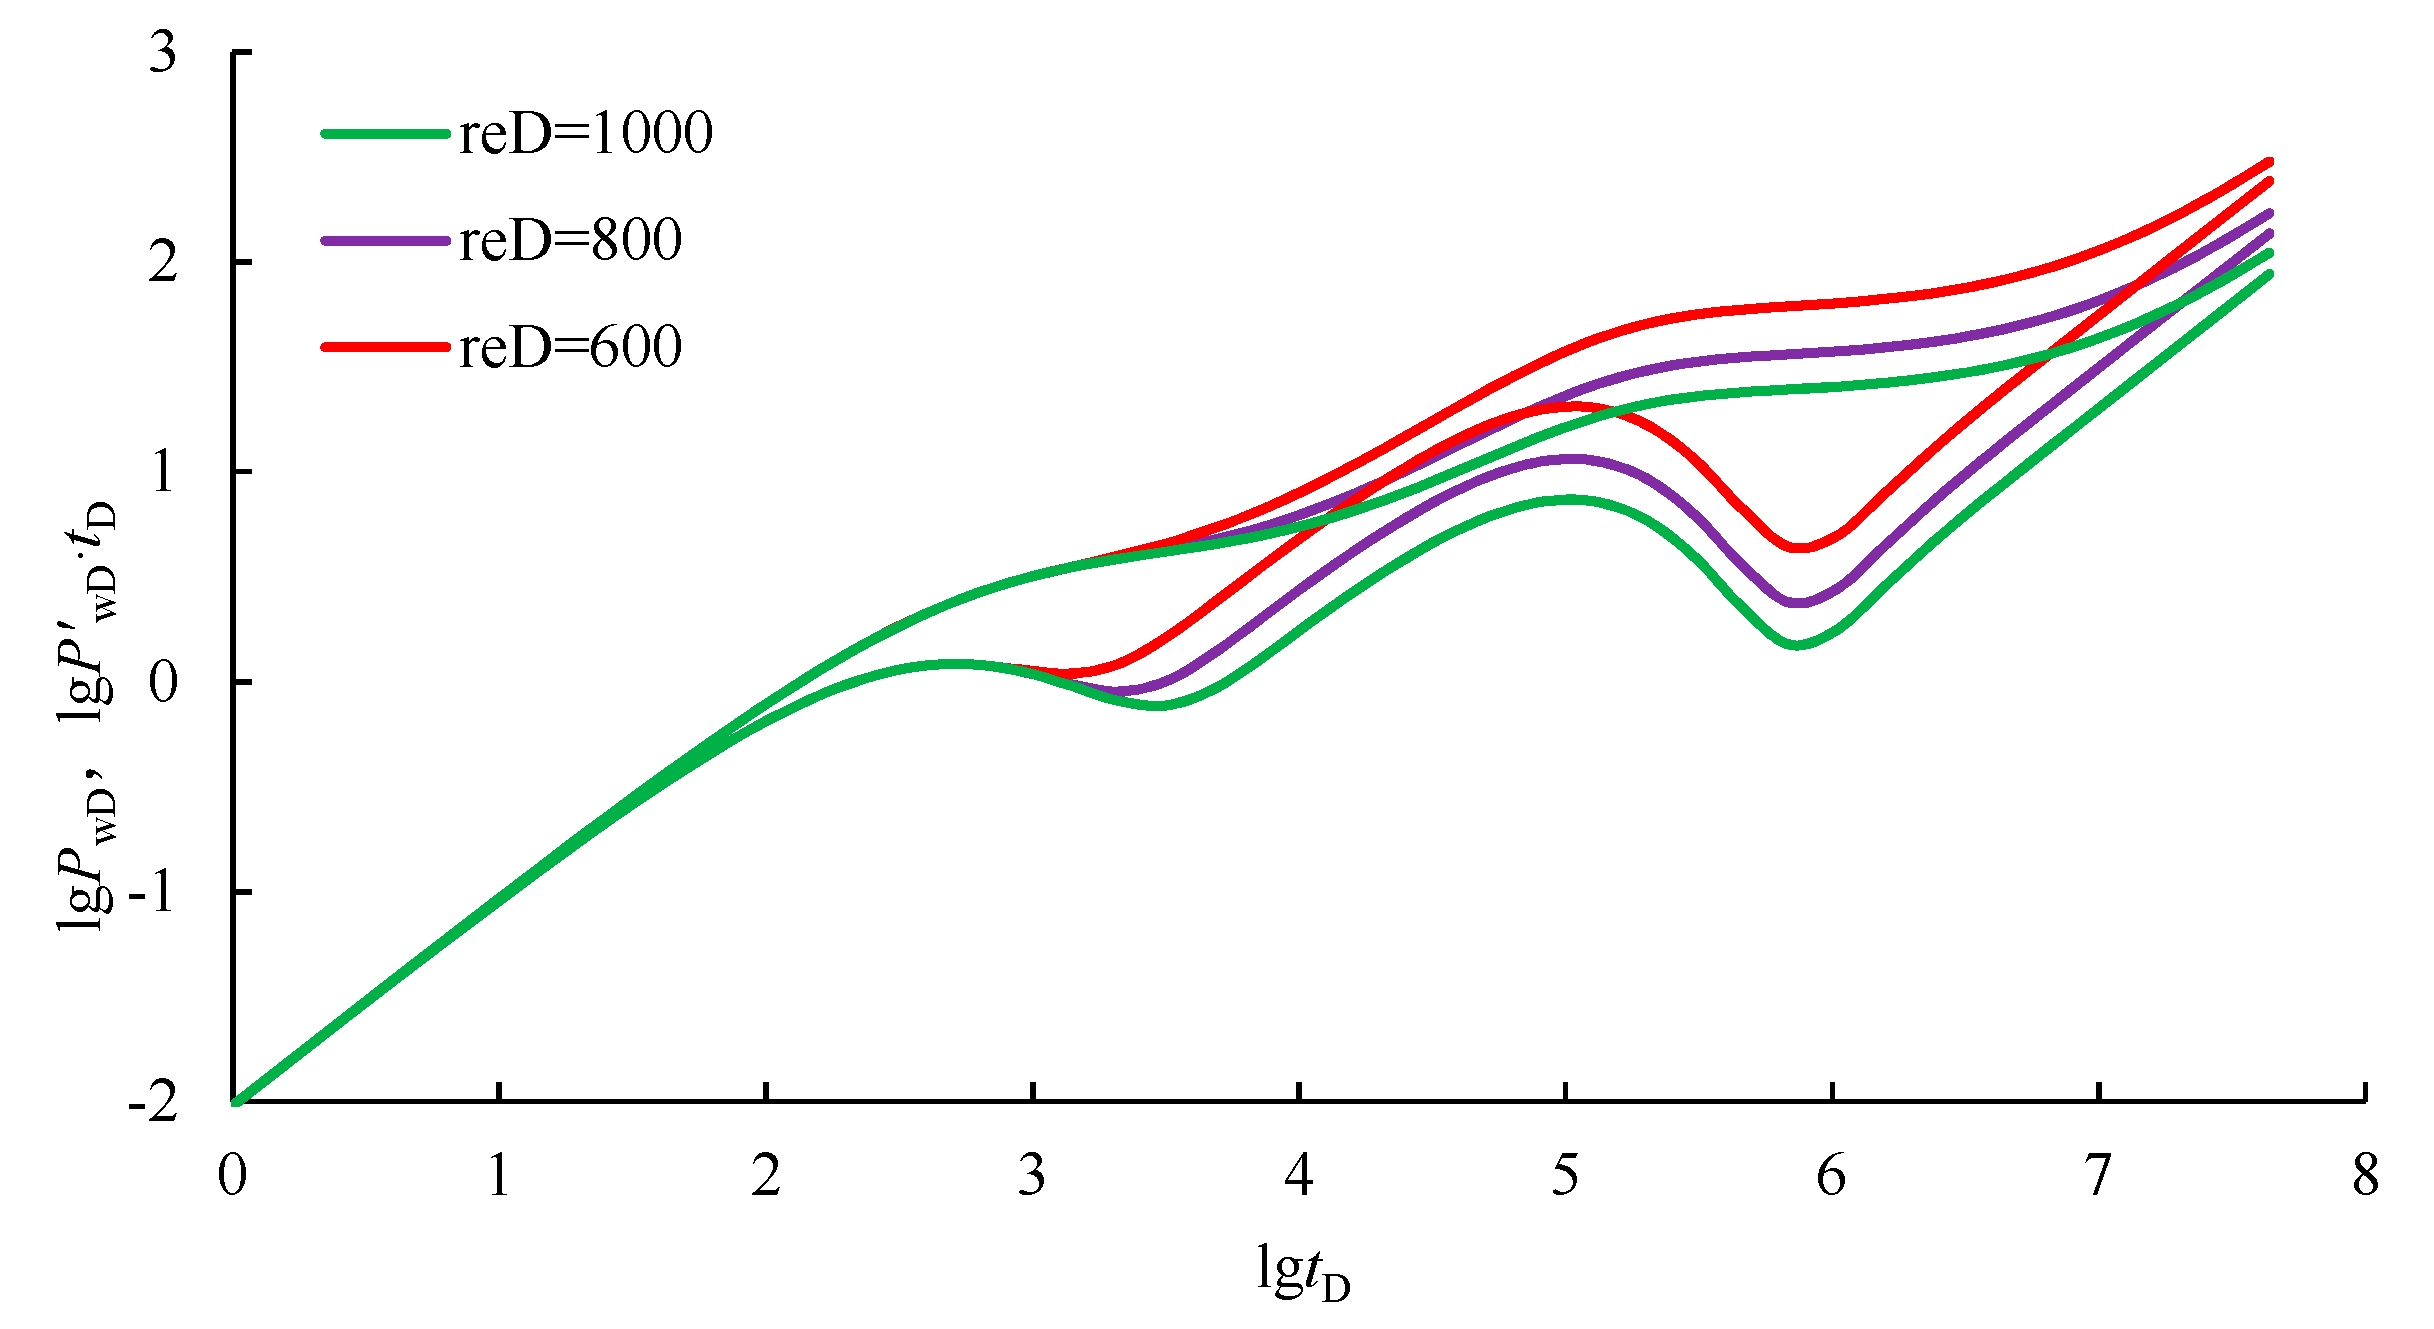
- The influence of dimensionless reservoir radius on well test typical curves
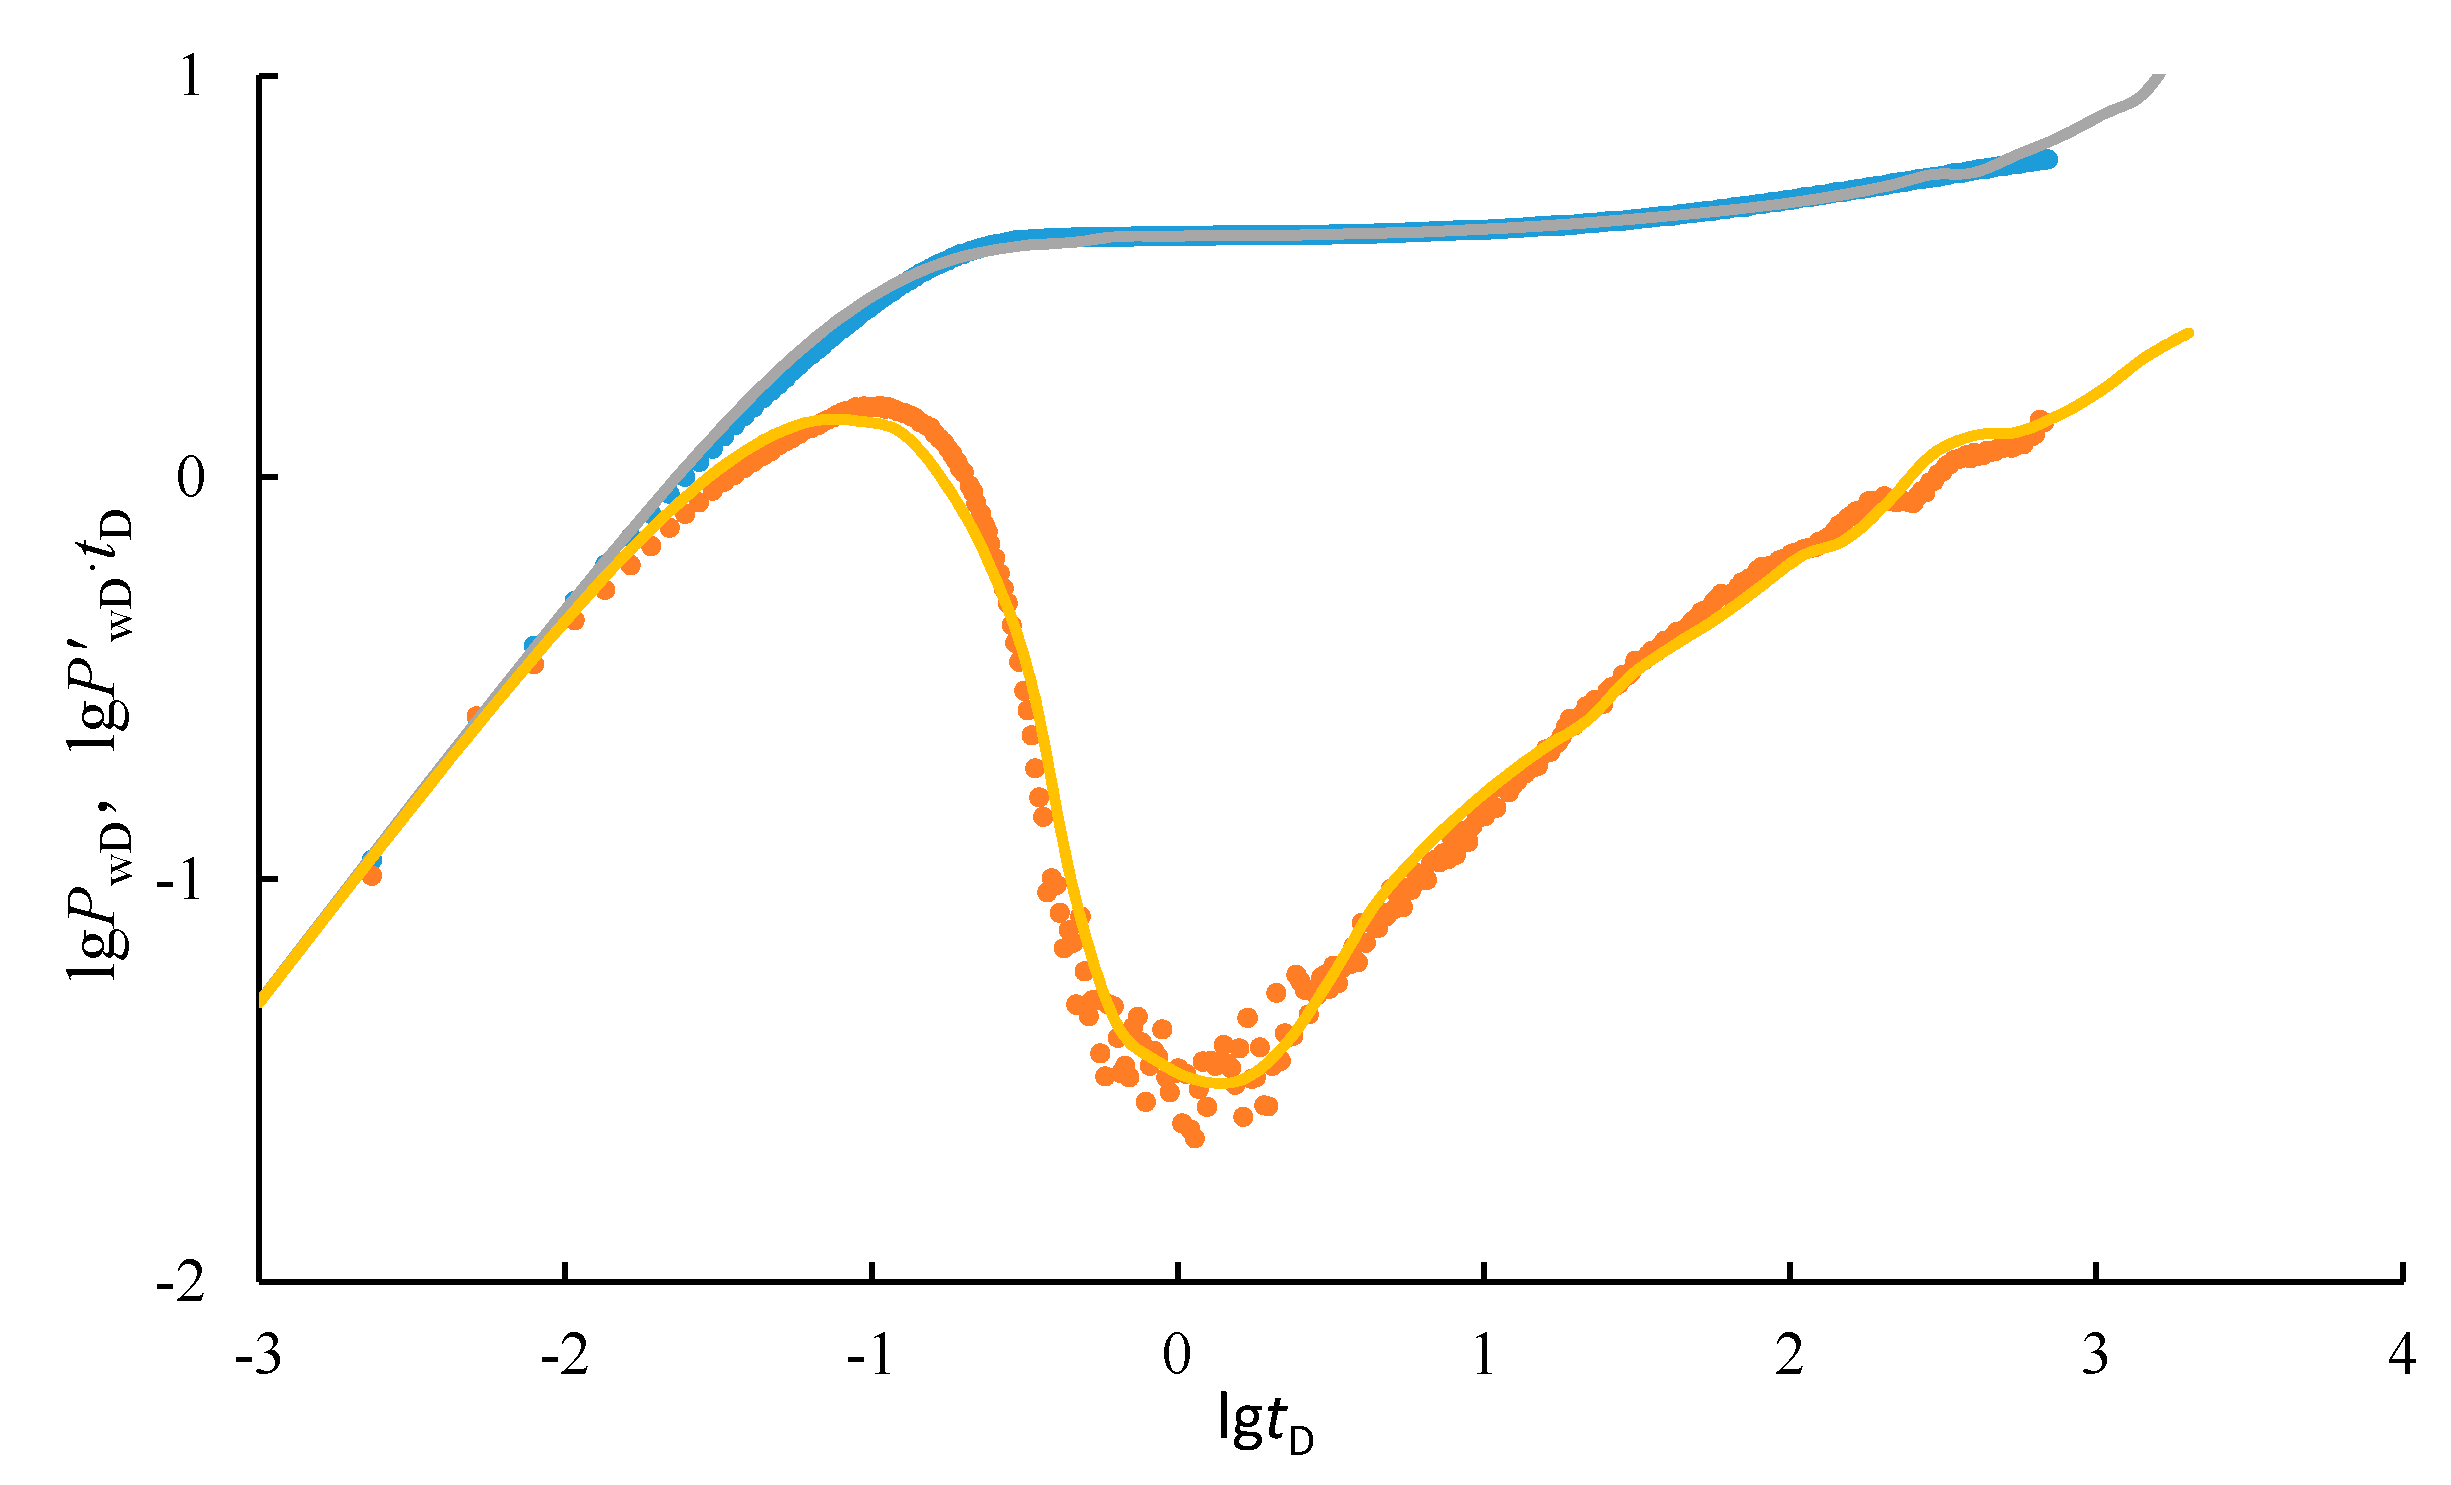
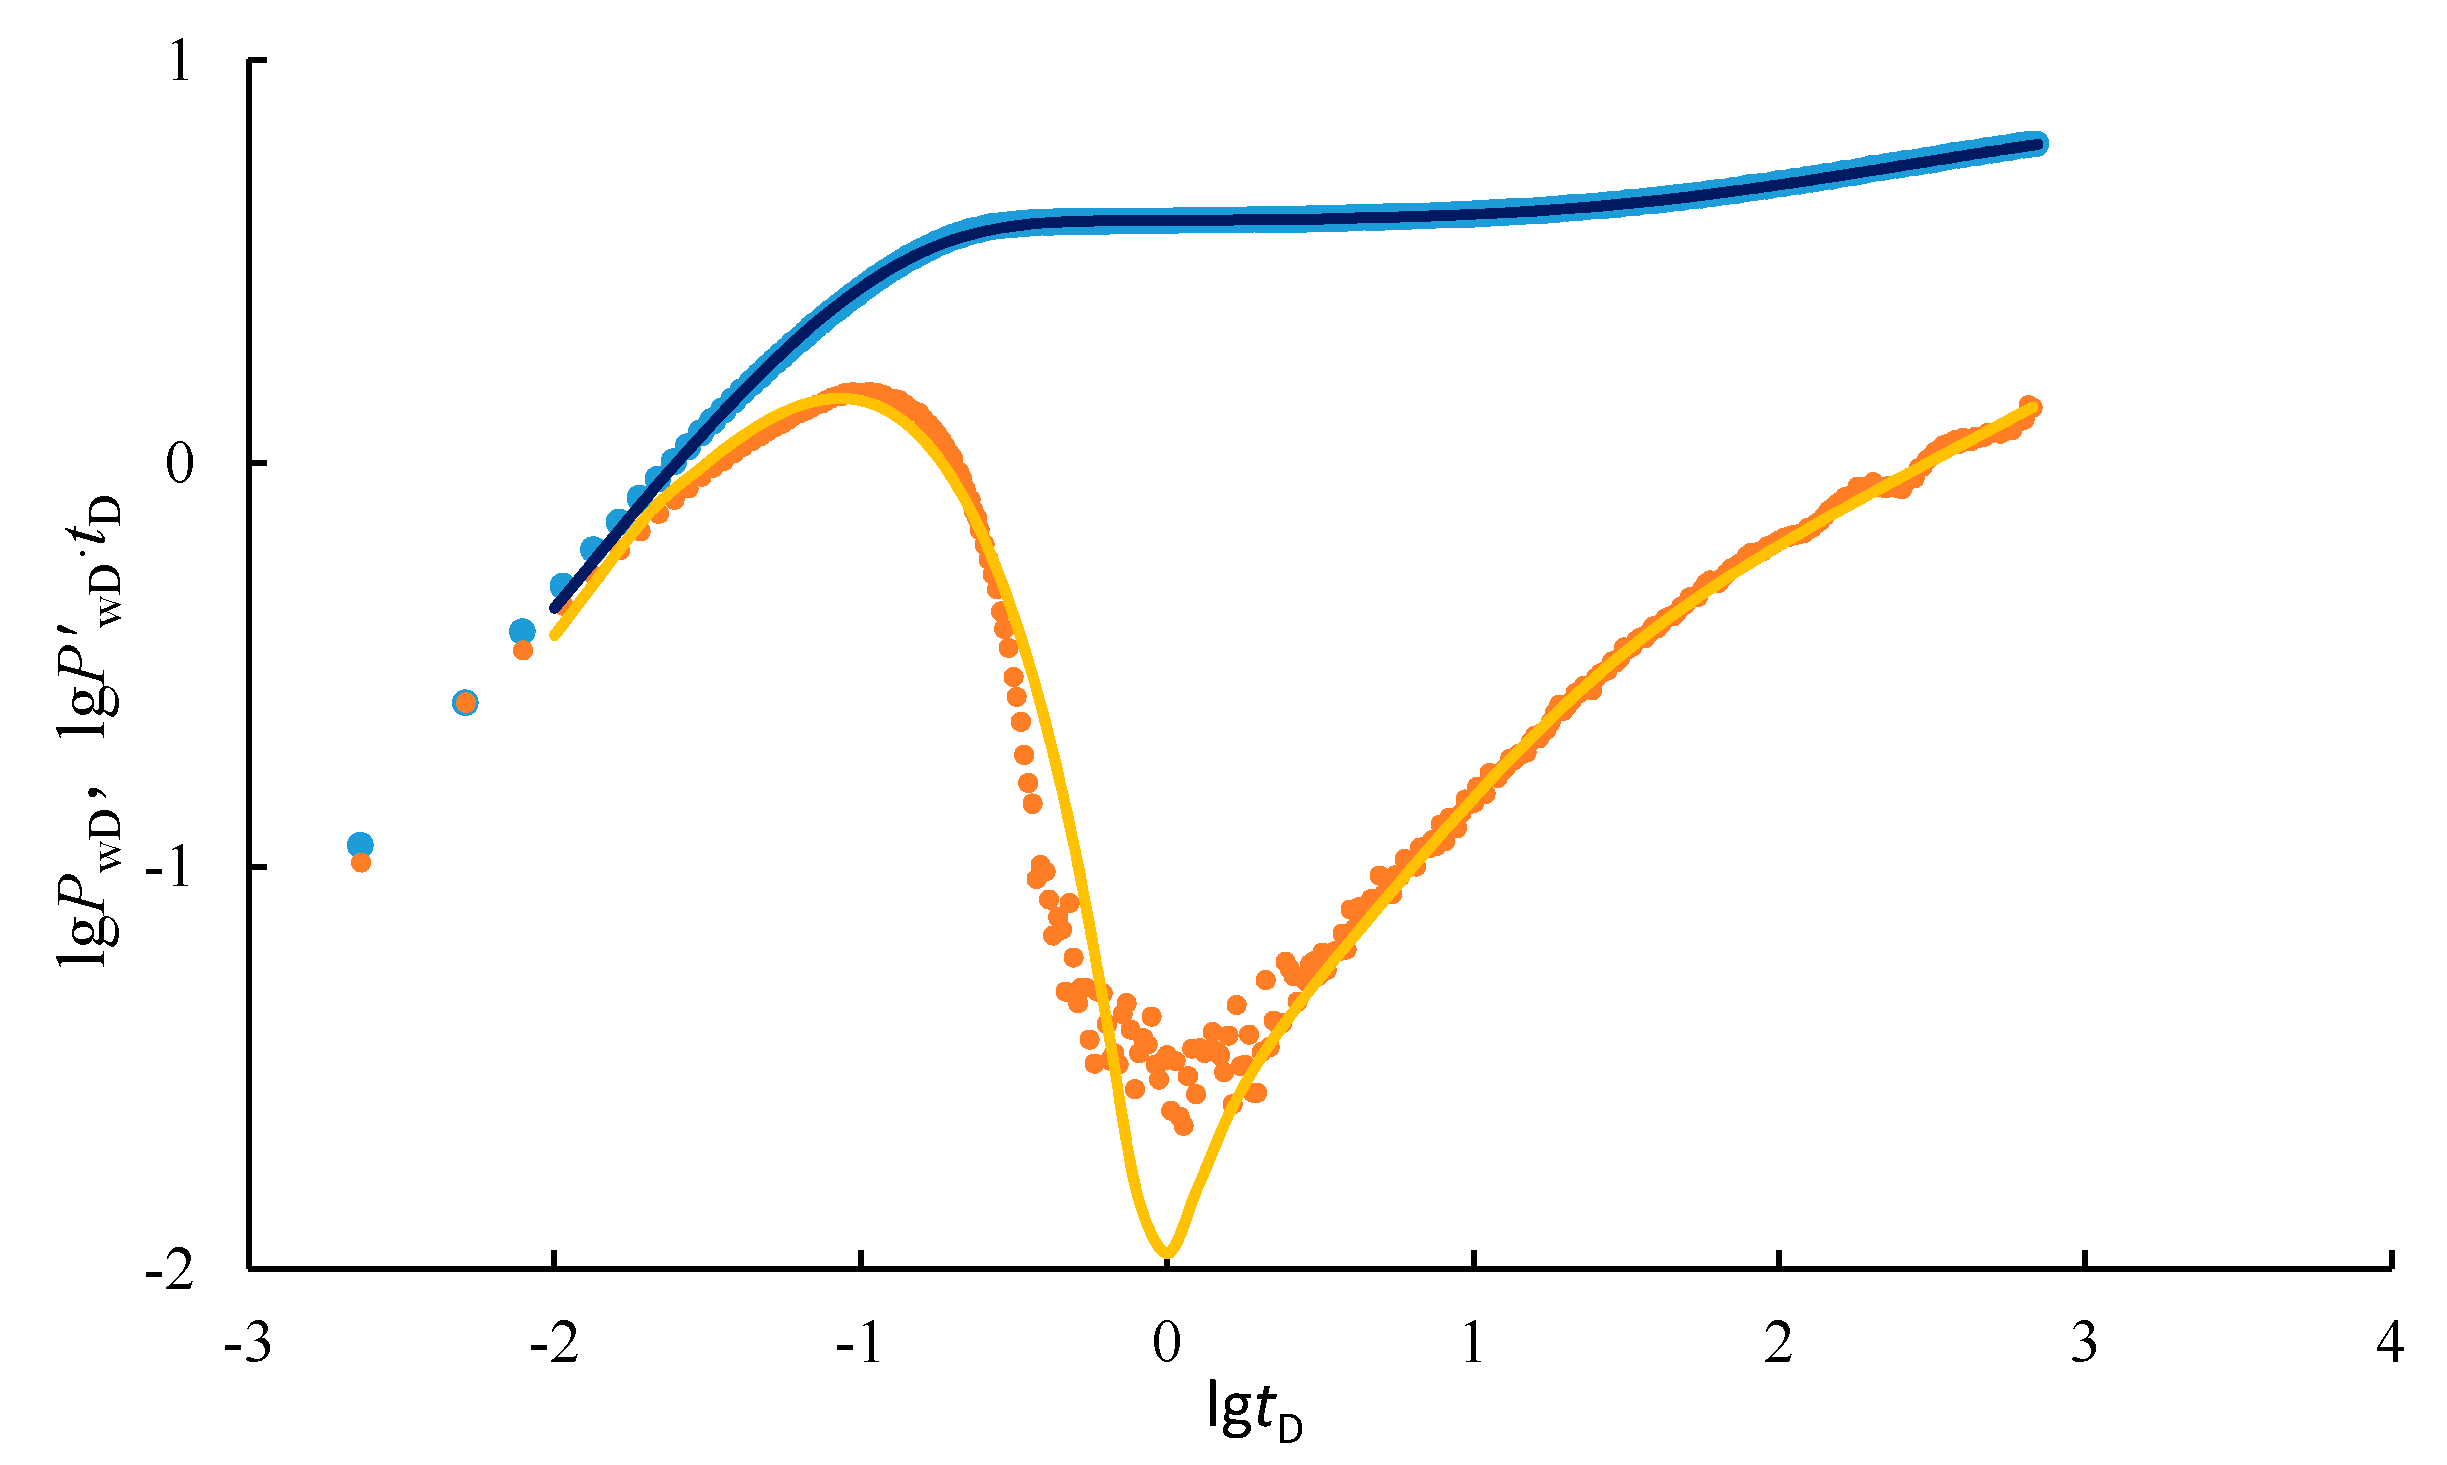
5. Field Example
6. Models Comparison
7. Conclusions
- (1)
- The skin factor shows the magnitude of the fluid flow resistance, and the larger the skin coefficient, the steeper the hump.
- (2)
- The size of the cave for well drilling and the size of the wellbore storage have the same effect on the typical curves of the well test. The larger the radius of the cave is, the bigger the well storage is, and the longer the wellbore storage stage is.
- (3)
- The storage ratio influences the depth and width of the concave in the pressure derivative curves. The smaller the storage ratio is, the wider and deeper the concave is.
- (4)
- The cross flow coefficient mainly affects the position of the concave occurrence in the pressure derivative curves. The smaller of cross flow coefficient is, and it indicates that the cross flow function is smaller. The position of concave in the dimensionless pressure derivative curves is on the right.
- (5)
- The dimensionless reservoir radius mainly affects the middle and late stages of pressure curves in the log-log plot. For the sealed boundary reservoirs, the later well test curves will be upturned.
Acknowledgments
Author Contributions
Conflicts of Interest
References
- Popov, P.; Qin, G.; Bi, L.; Efendiev, Y.; Ewing, R.E.; Kang, Z.; Li, J. Multi scale methods for modeling fluid flow through naturally fractured carbonate karsts reservoirs. In Proceedings of the SPE Annual Technical Conference and Exhibition, Anaheim, CA, USA, 11–14 November 2007. SPE 110778. [Google Scholar]
- Xiu, N.-L.; Xiong, W.; Gao, S.-S.; Hu, Z.-M.; Ban, F.-S.; Xue, H. Darcy-stokes mathematical model for fractured-cavity carbonate reservoir. Drill. Prod. Technol. 2008, 31, 63–65. [Google Scholar]
- Kamath, J.; Lee, S.; Jensen, C.; Narr, W.; Wu, H. Modeling fluid flow in complex naturally fractured reservoir. In Proceedings of the SPE Oil and Gas Conference and Exhibition, New Delhi, India, 17–19 February 1998. SPE 39547-MS. [Google Scholar]
- Xue, C.-J.; Dai, W.-H.; Zhang, J.-S. Well test interpretation method for triple media oil reservoir in which fracture communicated with wellbore. Pet. Geol. Recovery Effic. 2003, 10, 39–41. [Google Scholar]
- Wan, Y.-Z.; Liu, Y.-W. Three dimensional discrete fracture cavity numerical well test model for fractured cavity reservoir. Chin. J. Theor. Appl. Mech. 2015, 47, 1000–1008. [Google Scholar]
- Li, C.-Y.; Liu, Q.-G.; Zhang, R.; Yang, K.; Sun, L.-X. The research of well test of horizontal well in triple medium reservoir. J. Southwest Pet. Inst. 2006, 28, 32–35. [Google Scholar]
- Sun, H.-D.; Shi, Y.; Tang, H.-L.; Ying, S.; Miao, C.-S. Studied development of well testing analysis for triple medium oil and gas reservoir. Well Test. 2008, 17, 71–74. [Google Scholar]
- Li, H.-K.; Kang, Z.-J. Differential modeling of dissolved vugs in carbonate fracture and vug reservoirs. Spec. Oil Gas Reserv. 2015, 22, 50–54. [Google Scholar]
- Kang, Z.-J.; Wu, Y.-S.; Li, J.-L.; Wu, Y.-C.; Zhang, J.; Wang, G.-F. Modeling multiphase flow in naturally fractured vuggy petroleum reservoirs. In Proceedings of the SPE Annual Technical Conference and Exhibition, San Antonio, TX, USA, 24–27 September 2006; SPE 102356. pp. 24–27. [Google Scholar]
- Yin, H.-J.; Liu, Y.; Fu, C.-Q. Productivity analysis for fractured well in low permeability reservoir. Xinjiang Pet. Geol. 2005, 12, 285–287. [Google Scholar]
- Sureshjani, M.H. An analytical model for analyzing and forecasting production from multifractured horizontal wells with complex branched-fracture geometry. SPE Reserv. Eval. Eng. 2015, 18. [Google Scholar] [CrossRef]
- Fnu, S.; Chris, U.; George, W.; Med, K. Design and interpretation of an interference test for determination of formation compressibility in a deep water reservoir. In Proceedings of the SPE Western Regional Meeting, Bakersfield, CA, USA, 23–27 April 2017. SPE 185683. [Google Scholar]
- Kubota, L. The simplified pressure test of onshore mature field in Sergipe-Alagoas basin-mathematical model and interpretation procedure. In Proceedings of the SPE Latin America and Caribbean Mature Fields Symposium, Salvador, Brazil, 15–16 March 2017. SPE 184930. [Google Scholar]
- Arbogast, T.; Lehr, H.L. Homogenization of a Darcy-Stokes system modeling vuggy porous media. Comput. Geosci. 2006, 10, 291–302. [Google Scholar] [CrossRef]
- Long, W.; Wan, X.-Y.; Li, D.-M.; Tao, B.-E.; Zhang, Y. Study on the interpretation method for discrete numerical well test of fracture cave type reservoir. Well Test. 2013, 22, 1–3. [Google Scholar]
- Cuiec, L.E.; Bourbiaux, B.; Kalaydjian, F. Oil recovery by imbibition in low-permeability chalk. Soc. Pet. Eng. 1994, 9, 200–208. [Google Scholar] [CrossRef]
- Yao, J.; Huang, C.-Q.; Li, Y.-J.; Wang, C.-C.; Lv, X.-R. Discrete fracture-vug network model for modeling fluid flow in fractured vuggy porous media. In Proceedings of the International Oil and Gas Conference and Exhibition in China, Beijing, China, 8–10 June 2010. SPE 130287. [Google Scholar]
- Zhu, G.-L.; Liu, Z.-C.; Kang, Z.-J. The new method of large scale well test in fractured vuggy carbonate reservoir. Sci. Technol. Eng. 2014, 14, 172–175. [Google Scholar]
- Kang, Z.-J.; Li, J.-L.; Zhang, D.-L.; Wu, Y.-C.; Zhang, J. Percolation characteristics of fractured vuggy carbonate reservoir in Tahe oilfield. Oil Gas Geol. 2005, 26, 634–673. [Google Scholar]
- Spence, S. Keeping the promises-A management framework for delivering ESIA commitments during pipeline construction. In Proceedings of the SPE International Conference on Health, Safety and Environment in Oil and Gas Exploration and Production, Calgary, AB, Canada, 29–31 March 2004. SPE 86732. [Google Scholar]
- Cayeux, E.; Skadsem, H.J.; Daireaux, B.; Holand, R. Challenges and solutions to the correct interpretation of drilling friction tests. In Proceedings of the SPE/IADC Drilling Conference and Exhibition, Hugue, The Netherlands, 14–16 March 2017. SPE 184657. [Google Scholar]
- Ma, L.-P.; Li, Y. Calculation method of material equilibrium equation for fracture cave type reservoirs. J. Southwest Pet. Univ. 2007, 29, 66–68. [Google Scholar]
- Peng, X.-L.; Du, Z.-M.; Liu, X.-L.; Chen, Z.-H. Threshold pressure gradient of fluid flow through multi-porous media in low and extra-low permeability reservoirs. Sci. China Earth Sci. 2008, 19, 74–77. [Google Scholar]
- Wang, X.-H.; Zhang, D.-L.; Li, J.-L. A numerical well testing model for a fractured and vuggy reservoirs containing big fractures and vugs. J. Oil Gas Technol. 2009, 5, 129–135. [Google Scholar]
- Liu, H.; Wang, X.-H.; Ren, L.; Hu, Z.-H. Pseudo threshold pressure gradient to flow for low permeability reservoirs. Pet. Explor. Dev. 2012, 19, 79–81. [Google Scholar]
- Wang, Z.-S.; Yao, J.; Dai, W.-H. Application of the well test interpretation method for fracture vug reservoir in Tahe Oilfield. J. Xi’an Shiyou Univ. 2007, 22, 72–74. [Google Scholar]
- Shen, R.; Zhao, F.; Gao, S.-S.; Hu, Z.-M.; Duan, B.-J. Experimental study on rule of waterflooding sweep in low permeability vertical heterogeneous formations. Pet. Geol. Recovery Effic. 2013, 20, 91–93. [Google Scholar]


© 2018 by the authors. Licensee MDPI, Basel, Switzerland. This article is an open access article distributed under the terms and conditions of the Creative Commons Attribution (CC BY) license (http://creativecommons.org/licenses/by/4.0/).
Share and Cite
Xing, C.; Yin, H.; Liu, K.; Li, X.; Fu, J. Well Test Analysis for Fractured and Vuggy Carbonate Reservoirs of Well Drilling in Large Scale Cave. Energies 2018, 11, 80. https://doi.org/10.3390/en11010080
Xing C, Yin H, Liu K, Li X, Fu J. Well Test Analysis for Fractured and Vuggy Carbonate Reservoirs of Well Drilling in Large Scale Cave. Energies. 2018; 11(1):80. https://doi.org/10.3390/en11010080
Chicago/Turabian StyleXing, Cuiqiao, Hongjun Yin, Kexin Liu, Xingke Li, and Jing Fu. 2018. "Well Test Analysis for Fractured and Vuggy Carbonate Reservoirs of Well Drilling in Large Scale Cave" Energies 11, no. 1: 80. https://doi.org/10.3390/en11010080
APA StyleXing, C., Yin, H., Liu, K., Li, X., & Fu, J. (2018). Well Test Analysis for Fractured and Vuggy Carbonate Reservoirs of Well Drilling in Large Scale Cave. Energies, 11(1), 80. https://doi.org/10.3390/en11010080