Article

Maximum Permissible Integration Capacity of Renewable DG Units Based on System Loads

by
Kadir Doğanşahin
1,*,
Bedri Kekezoğlu
1,
Recep Yumurtacı
1,
Ozan Erdinç
1,2 and
João P. S. Catalão
2,3,4,*
1
Department of Electrical Engineering, Yildiz Technical University, Istanbul 34220, Turkey
2
Instituto de Engenharia de Sistemas e Computadores, Investigação e Desenvolvimento (INESC-ID), Instituto Superior Técnico, University of Lisbon, 1049-001 Lisbon, Portugal
3
Instituto de Engenharia de Sistemas e Computadores, Tecnologia e Ciência (INESC-TEC) and the Faculty of Engineering, University of Porto, 4200-465 Porto, Portugal
4
Centre for Mechanical and Aerospace Science and Technologies (C-MAST), University of Beira Interior, 6201-001 Covilha, Portugal
*
Authors to whom correspondence should be addressed.
Energies 2018, 11(1), 255; https://doi.org/10.3390/en11010255
Submission received: 25 November 2017 / Revised: 12 January 2018 / Accepted: 16 January 2018 / Published: 21 January 2018
(This article belongs to the Special Issue Distributed Renewable Generation 2018)

Abstract

:
Increasing demand for electricity, as well as rising environmental and economic concerns have resulted in renewable energy sources being a center of attraction. Integration of these renewable energy resources into power systems is usually achieved through distributed generation (DG) techniques, and the number of such applications increases daily. As conventional power systems do not have an infrastructure that is compatible with these energy sources and generation systems, such integration applications may cause various problems in power systems. Therefore, planning is an essential part of DG integration, especially for power systems with intermittent renewable energy sources with the objective of minimizing problems and maximizing benefits. In this study, a mathematical model is proposed to calculate the maximum permissible DG integration capacity without causing overvoltage problems in the power systems. In the proposed mathematical model, both the minimum loading condition and maximum generation condition are taken into consideration. In order to prove the effectiveness and the consistency of the proposed mathematical model, it is applied to a test system with different case studies, and the results are compared with the results obtained from other models in the literature.

1. Introduction

1.1. Motivation and Background

Increasing electricity demand along with rising economic and environmental concerns has increased the popularity of renewable energy sources and has broadened the penetration of renewable-based generation units in power systems [1]. Distributed generation (DG), one of the most referenced concepts in the integration of renewable resources into power systems, has become a trend in power systems with the widespread use of these resources [2]. DG can be defined as generating electrical energy by connecting DG units to the distribution or sub-transmission levels of power systems [3]. DGs offer a variety of benefits for both systems and customers [4,5,6]. The losses that occur during the transmission of the energy generated by large central power plants to the consumption areas can be reduced by generation at the distribution level where the consumption mainly takes place [7]. Besides, in the face of rising energy demands, the capacity of transmission and/or distribution systems might become inadequate. In this case, it is expected to increase the capacities of the facilities in the system or to install new facilities in addition to existing ones in order to ensure that the supply meets the demand. Another option is to reduce the loading of the facilities by sharing demand with DG. Thus, the costs required to make such upgrades can be delayed or removed completely. From this point of view, it can be stated that DG systems have an effect that increases system efficiency and the economic life of facilities. Moreover, new energy fields and energy sources can be integrated into systems by means of DG technologies. In particular, DG technologies enable the use of the potential of renewable energy sources in the consumption areas.
Capacities of DG systems may range from a few kVA to MVA [3]. By means of these systems, consumers may establish their own generation facilities and supply their own energy needs. They may even earn money by selling surplus energy to the network. Small or large-scale businesses established for this purpose can liberalize the market and prevent excessive increases in electricity prices [4]. Thus, the penetration of DG technologies into power systems has been increasing steadily.
Conventional power systems have a centralized generation infrastructure and therefore have a design based on unidirectional power flow from large power plants to distribution areas through transmission systems. In the case of increasing DG penetration into the power systems, the central generation infrastructure may be decentralized. This may lead to bidirectional power flows in the systems [8,9]. There are subsystems within the structure of power systems and they perform important activities such as voltage regulation, fault detection, etc. Due to their unidirectional designs, they may lose their functions in the case of bidirectional power flow [10]. At this point, it is essential to minimize these problems and maximize the benefits. Thus, planning is an essential part of DG integration studies in the systems, especially for DG units based on intermittent renewable sources such as wind or solar [11,12].

1.2. Literature Review

In the literature, numerous studies can be found on DG planning [13,14,15,16]. These studies differ from each other in terms of their scope, the approach adopted and the methodology used in DG planning. The most extensive literature belongs to the studies that aim to plan the size and location of the DG, and a recent review of these studies is given in [17]. In addition, the studies that involve planning of DG sizing [18] or planning of DG siting [19,20] are examples of studies that have been carried out by different DG planning scopes.
DG planning studies can be categorized into different titles according to the approaches adopted. The hosting capacity approach, which is a DG sizing issue, is one of these categories. The goal of the hosting capacity approach is to define the maximum generation that can be connected to the system without endangering system reliability or power quality [6].
As a consequence, determining the maximum capacity has been attempted by considering the reliability and the quality related criteria of the system. Voltage stability and loadability are examples of the most important criteria that limit the capacity of a DG unit to be integrated into a power system from a particular point. For this reason, studies that adopt the hosting capacity approach generally examine these two criteria together [21,22]. In addition to these, other system criteria that are taken into consideration vary according to different studies.
Another approach adopted in DG planning studies is searching for optimum values. In this approach, in addition to the system criteria, economical and/or performance-related criteria are considered in DG planning. In the optimum value approach, the most appropriate sizing and/or siting is determined according to the criteria considered in the study. The most important optimization studies can be given as grouped according to their objectives on which they are based; minimization of power losses [20,23,24,25,26], minimization of energy losses [27], increasing system reliability based on various reliability indices [28,29] and minimization of costs [29,30]. There are also approaches to define the maximum permissible capacity value based on a single system criterion other than the hosting capacity and optimum values approaches [31,32,33,34,35,36,37].
Furthermore, DG planning studies differ from each other according to the solution methodology used. A comprehensive taxonomy has been given in [13]. Studies on the hosting capacity approach have been mostly performed by using different methodologies, such as analytical, artificial intelligence computational or optimization methodologies. Studies on the optimum values approach have been realized by using various optimization algorithms. Studies on the maximum permissible capacity approach use methodologies based on a single mathematical model designed for determination of the maximum permissible DG sizing over a single system criterion [31,32,33,34,35,36,37]. In some studies, the maximum permissible approach has been referred as the hosting capacity approach. However, the hosting capacity approach is a more detailed and comprehensive evaluation as mentioned before. The maximum permissible capacity approach may only be an analytical step in the hosting capacity approach [6,21].
In a power system, DG integration increases voltages at and around the connection point. Furthermore, this deviation is directly related to the size of the connected DG and the system parameters. Voltage limit values are specified so that the system components and the consumers connected to the system are protected against the voltage deviations that may occur in the system [38]. A properly functioning power system is not expected to experience low voltage problems after DG connection; on the other hand, overvoltage may still be an issue [6]. Maximum permissible capacity may only be achieved when the voltage of the integration point is at the highest permissible value. For this reason, the upper voltage limit of the system is the main criterion for studies that adopt the maximum permissible capacity approach [31,32,33,34,35,36,37].
In the process of mathematical model development, the system is considered to be operating under a specific scenario so that other system criteria that have an impact on DG sizing are ignored. In practice, distribution system operators use the worst-case scenario to evaluate whether system components and customers connected to the system will be adversely affected by voltage variations. The definitions used in the worst-case scenario are given in detail in [38]. Since overvoltage is an issue with DG integrations, a minimum load–maximum generation case of the system is the most feasible scenario for DG planning studies.
In the derivation of mathematical models given in [31,32,33,34,35,36,37], the system is analyzed with no load condition, corresponding to minimum load criterion, so that the effect of load currents on the voltage deviation due to the DG connection is removed. Besides, the mathematical models are only feasible for systems with no previously integrated DG units. It is an unrealistic approach but adopted to have a conservative evaluation. Such an approach reduces the reliability and applicability of the proposed mathematical model. Instead of taking the no load condition of the system as the basis for calculations, a DG sizing performed with a minimum load–maximum generation case may provide a more realistic and reliable approach.

1.3. Content and Contribution

In this study, a mathematical model is proposed for calculating of the maximum permissible DG capacity by taking the loads and generators connected to the system into account. System loads and generators are reduced to the DG integration point by using the network reduction methods. Their equivalent at this point is used in the proposed mathematical model for improving the calculation of the maximum permissible capacity for unloaded case of the system. Thus, as a contribution to the existing literature, a mathematical model is obtained in a wider applicability and that is capable of providing a more realistic maximum connection capacity for a system point. The capacities obtained after calculations performed with the proposed mathematical model are highly reliable values in terms of system voltages. Studies that adopt hosting capacity or optimum value approaches may be more accurate and reliable by using the proposed mathematical model rather than the models proposed in the literature. In addition, the proposed mathematical model may widen the applicability of these studies to different scenarios of the system.

1.4. Organization of the Paper

In the next section, the system modelling approach used in the study and the methodology are explained. At the beginning of this section, the mathematical models proposed in the literature are given, then a new mathematical model is developed through a preliminary analysis of a basic system. In Section 3, the proposed mathematical model is applied to a 34-bus radial distribution test system under different scenarios. Obtained results are compared with the results obtained using the mathematical models reported in the literature. In Section 4, the effectiveness of the proposed mathematical model is discussed in light of the findings obtained from the case study. In the conclusion, important remarks are highlighted, and future work regarding the study is shared.

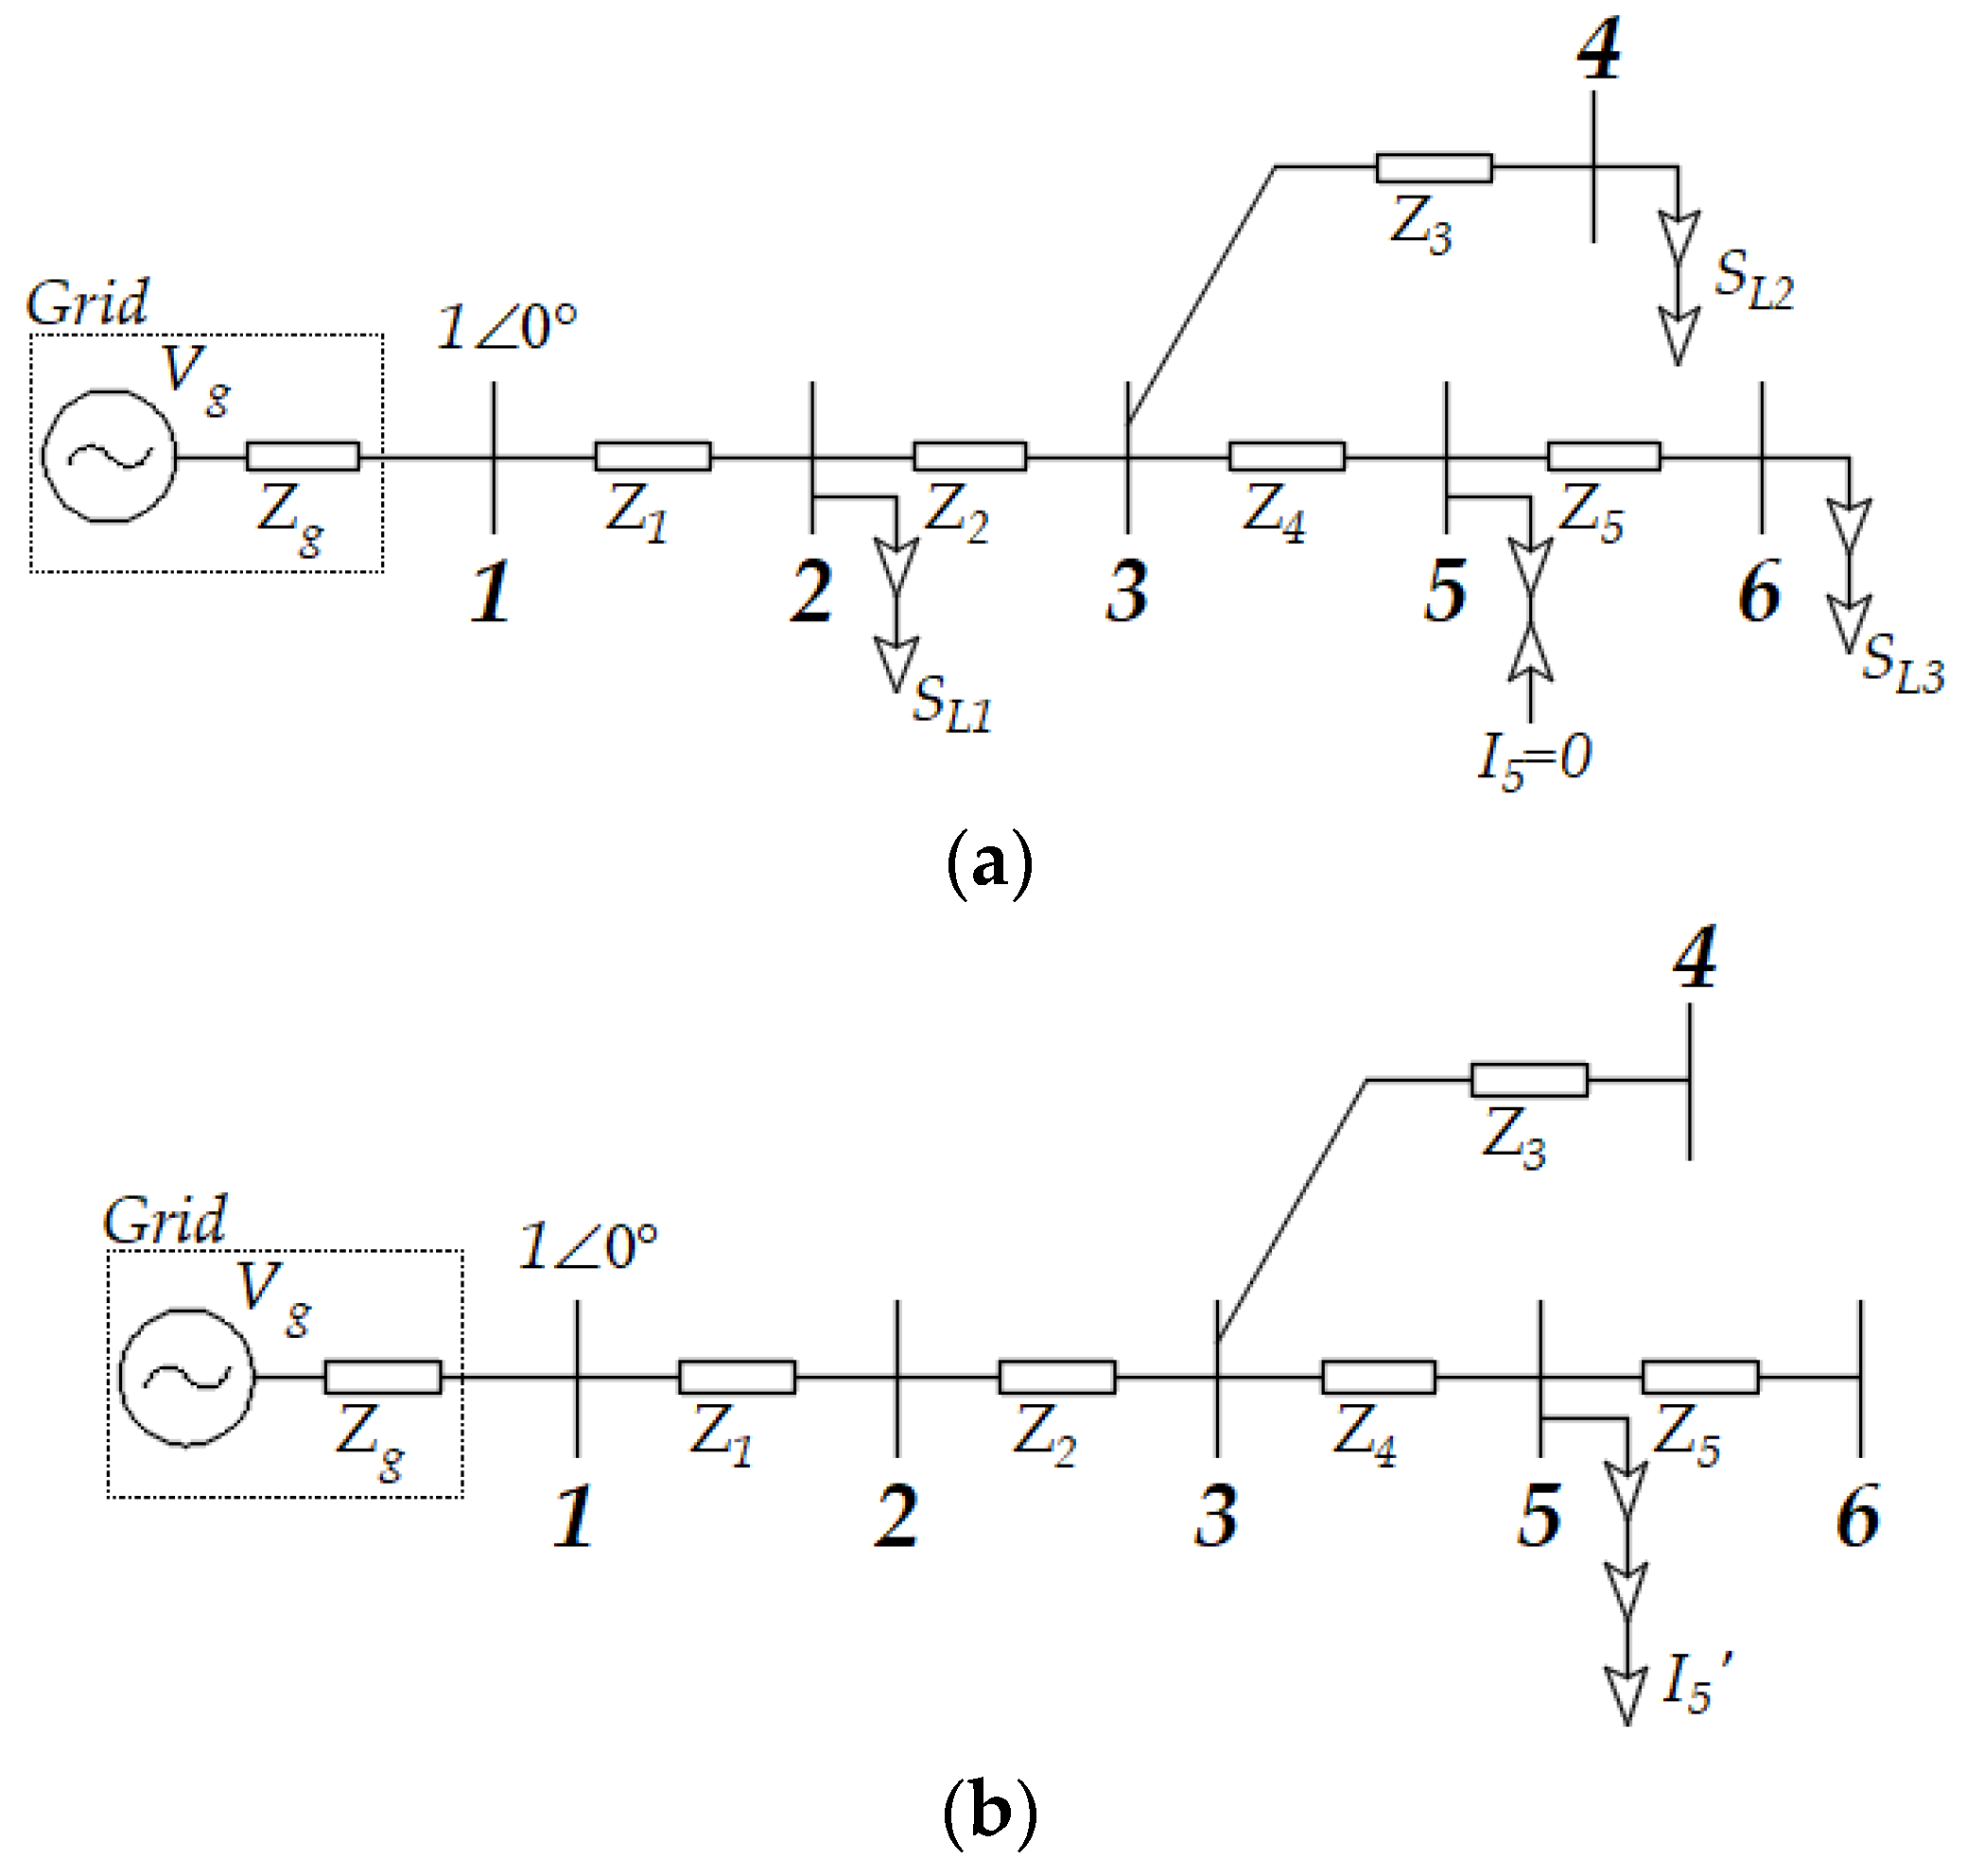
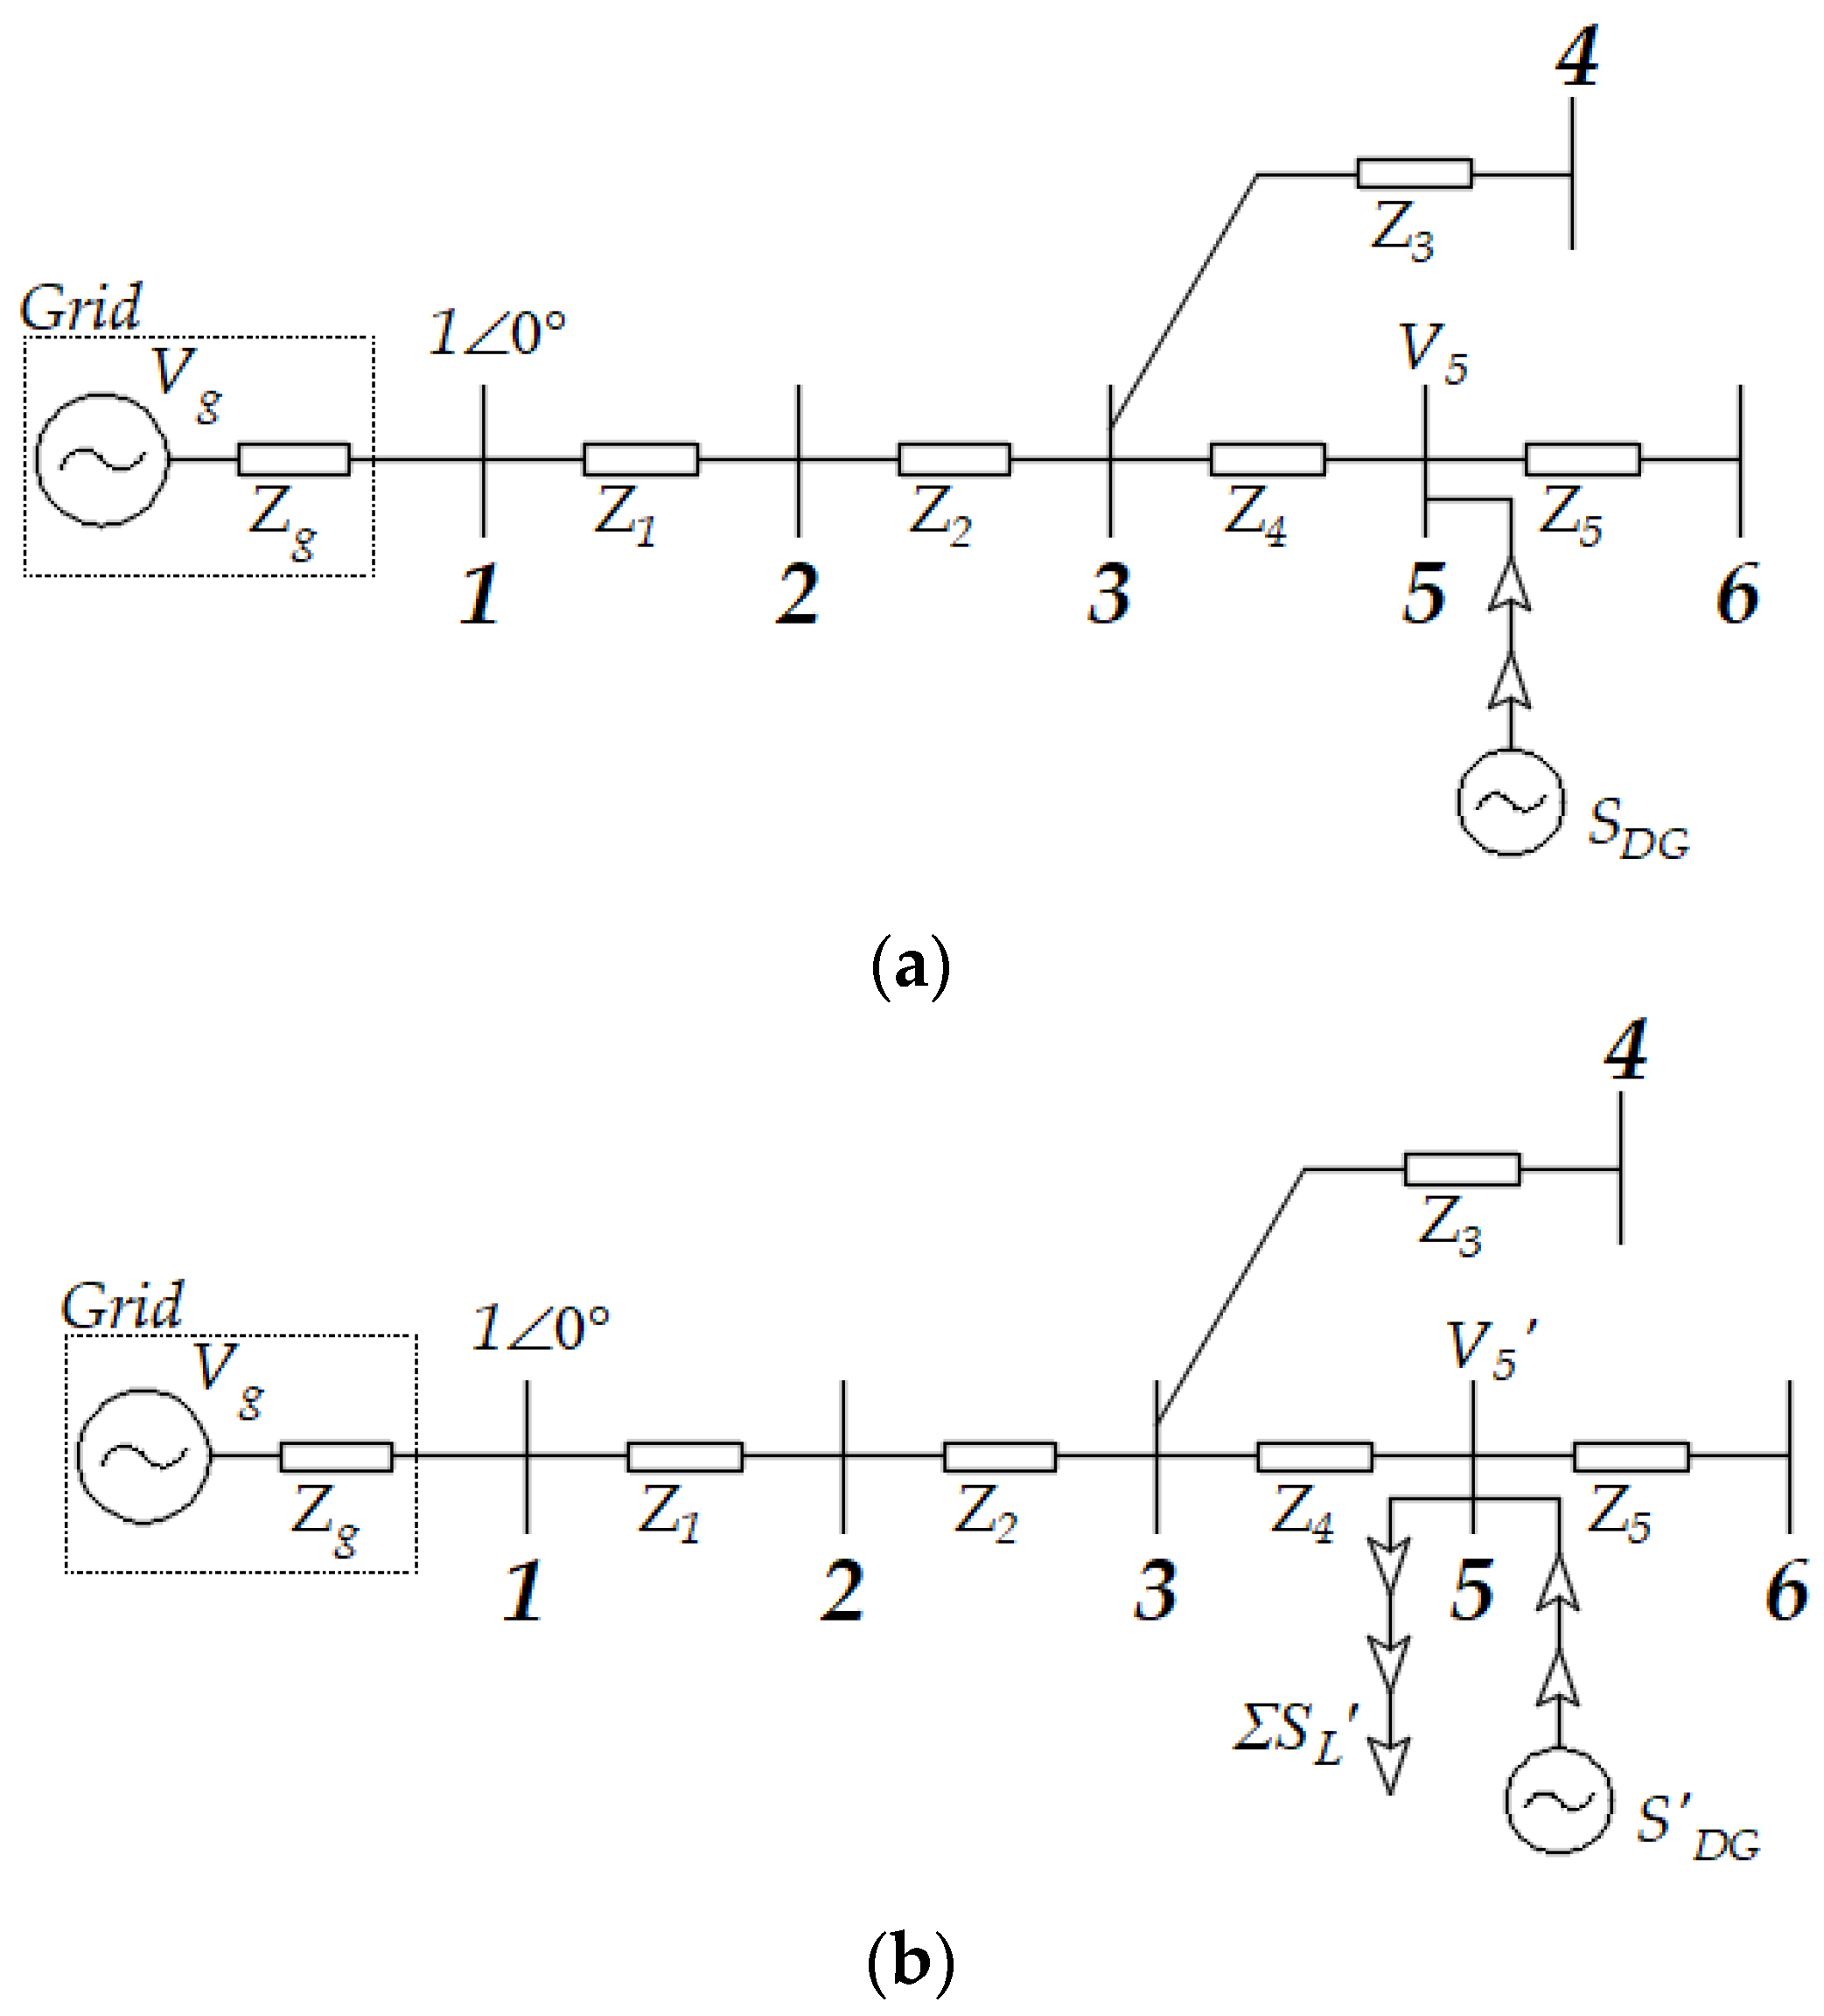
2. System Modelling and Methodology
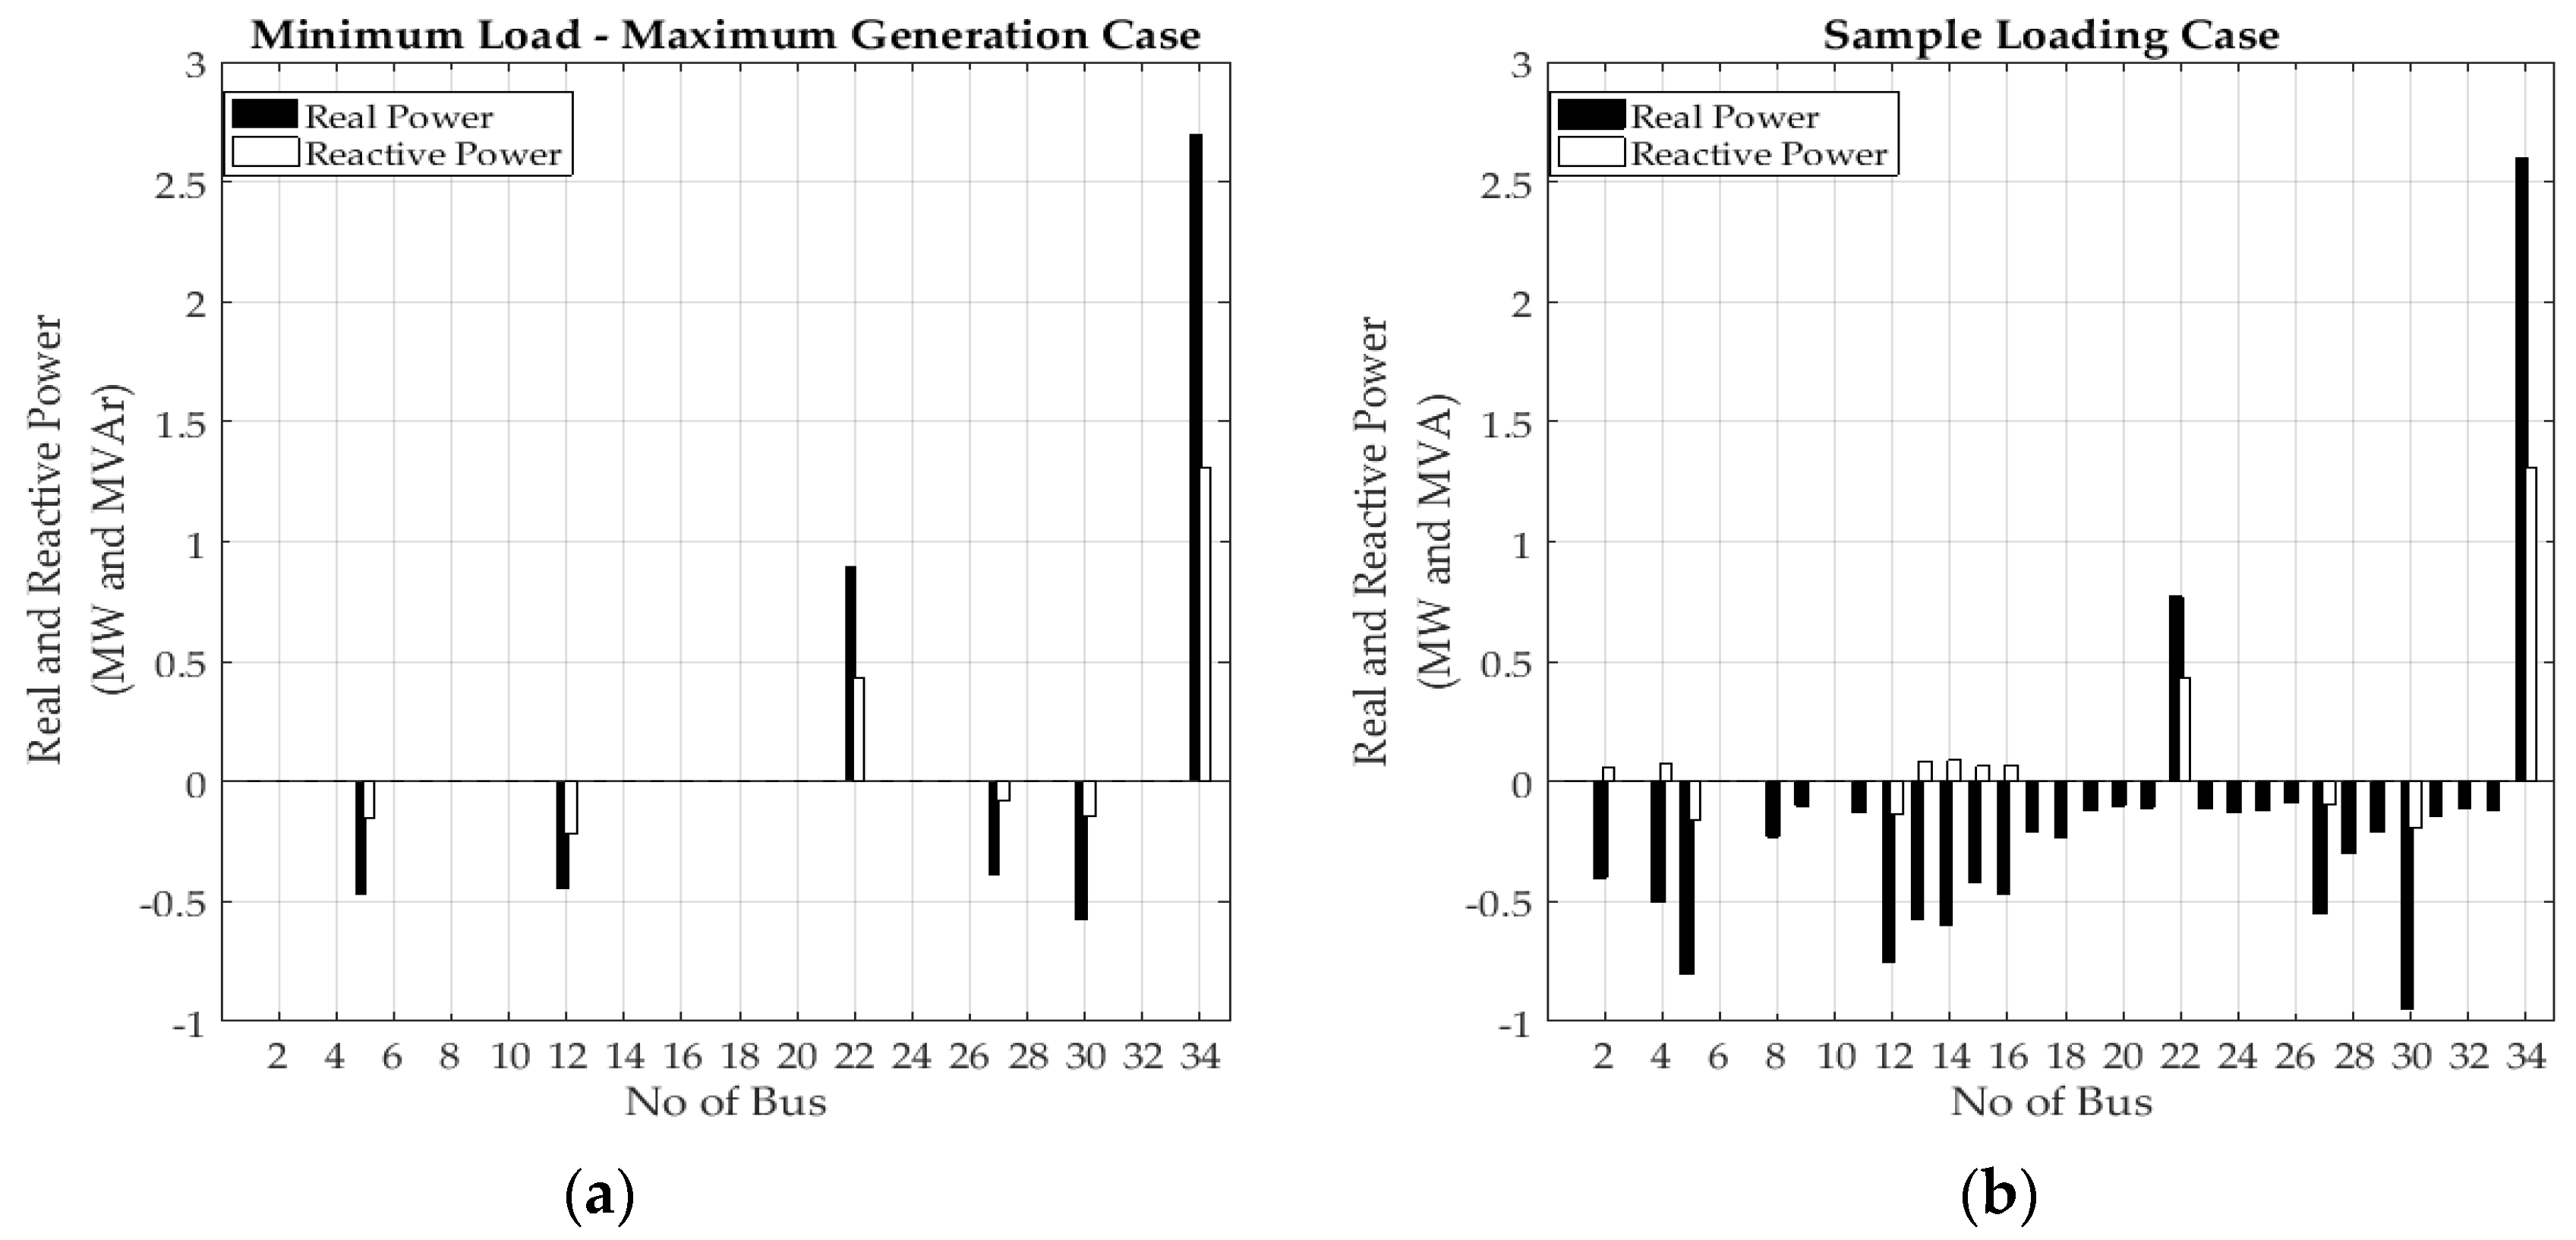
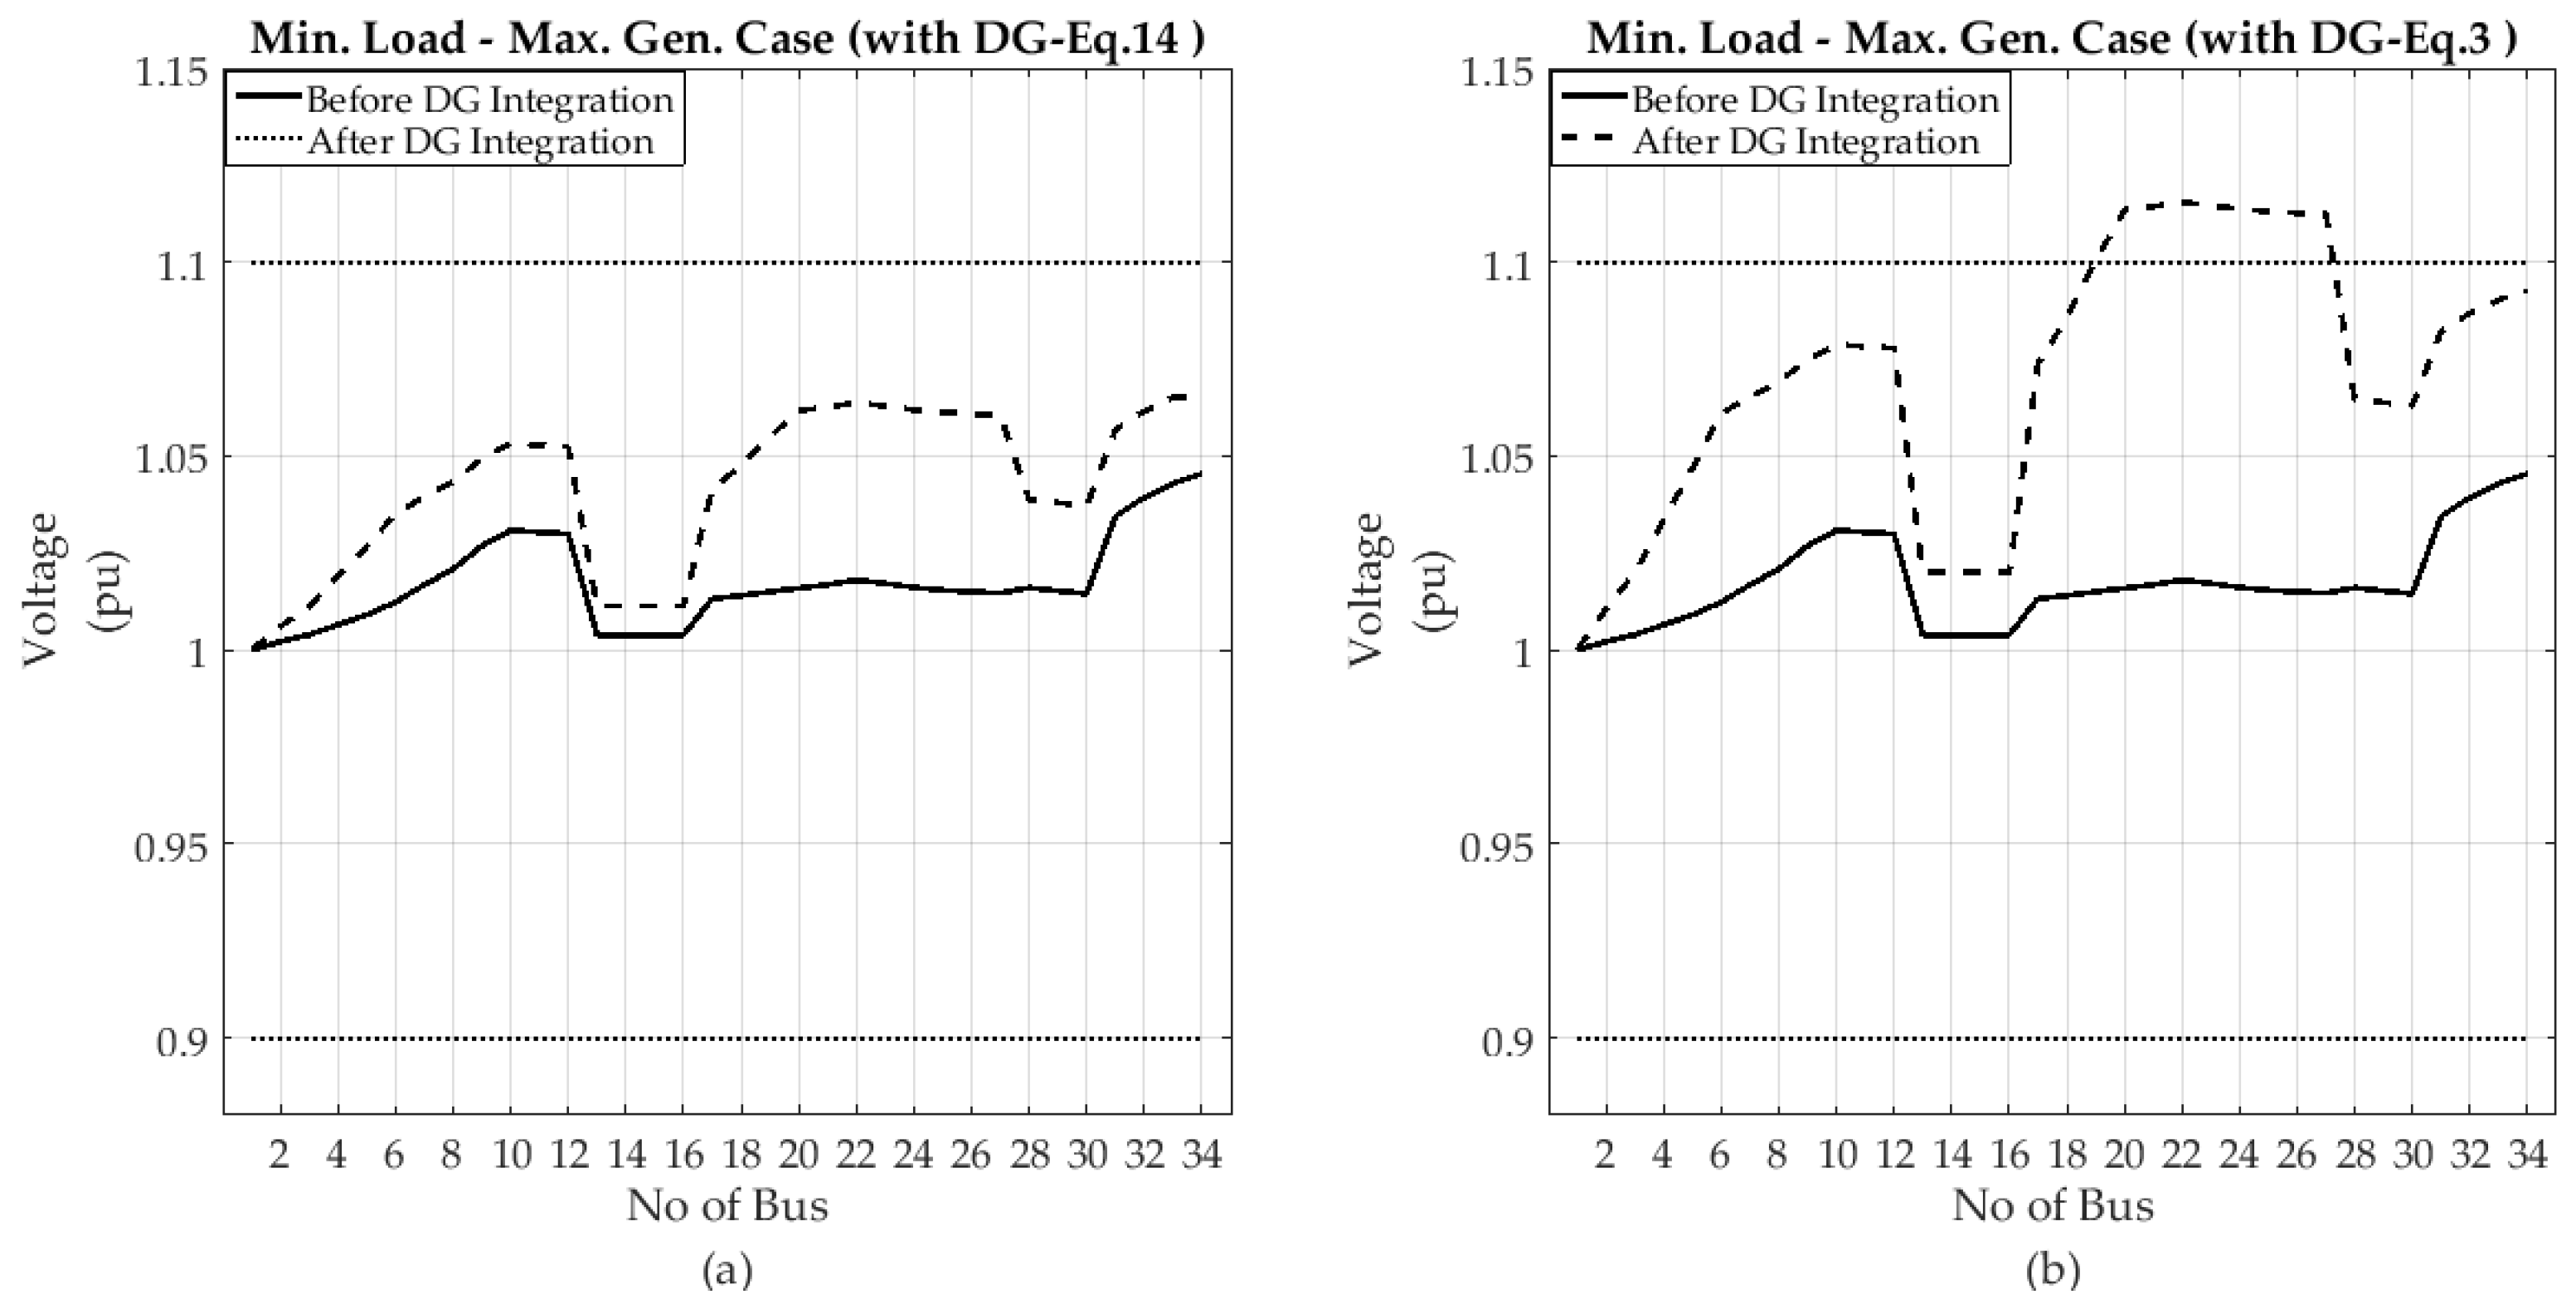
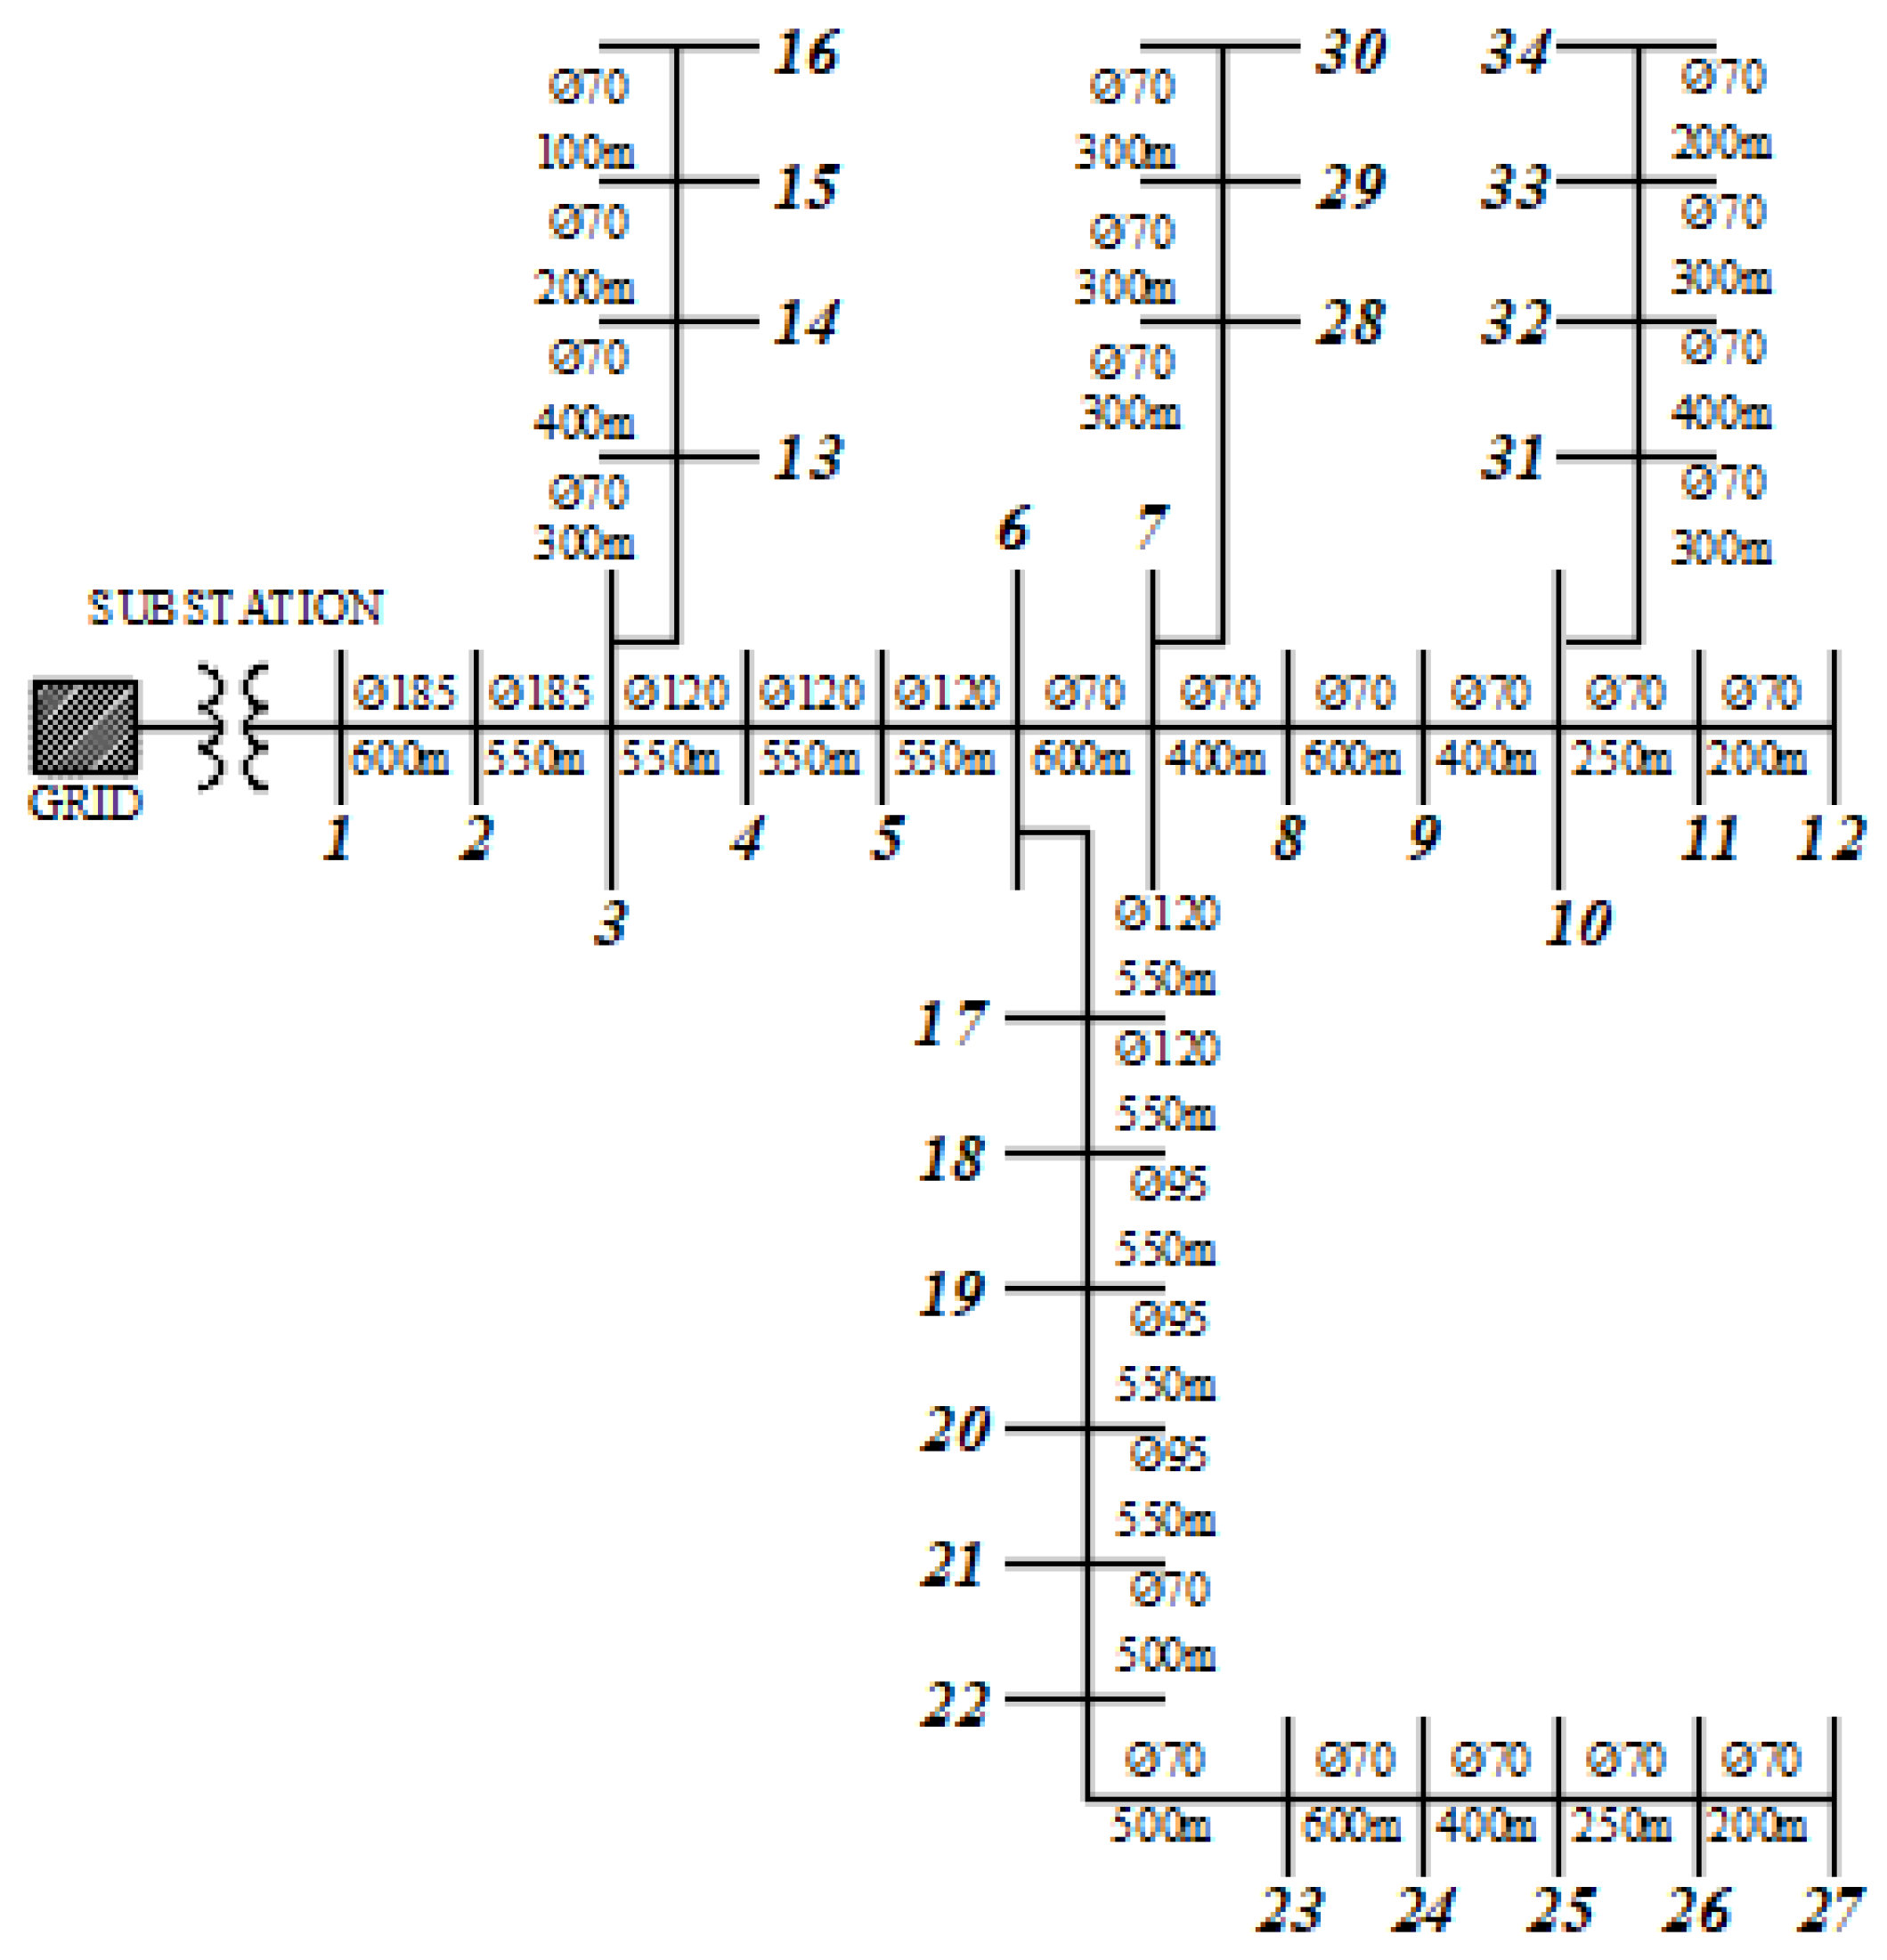
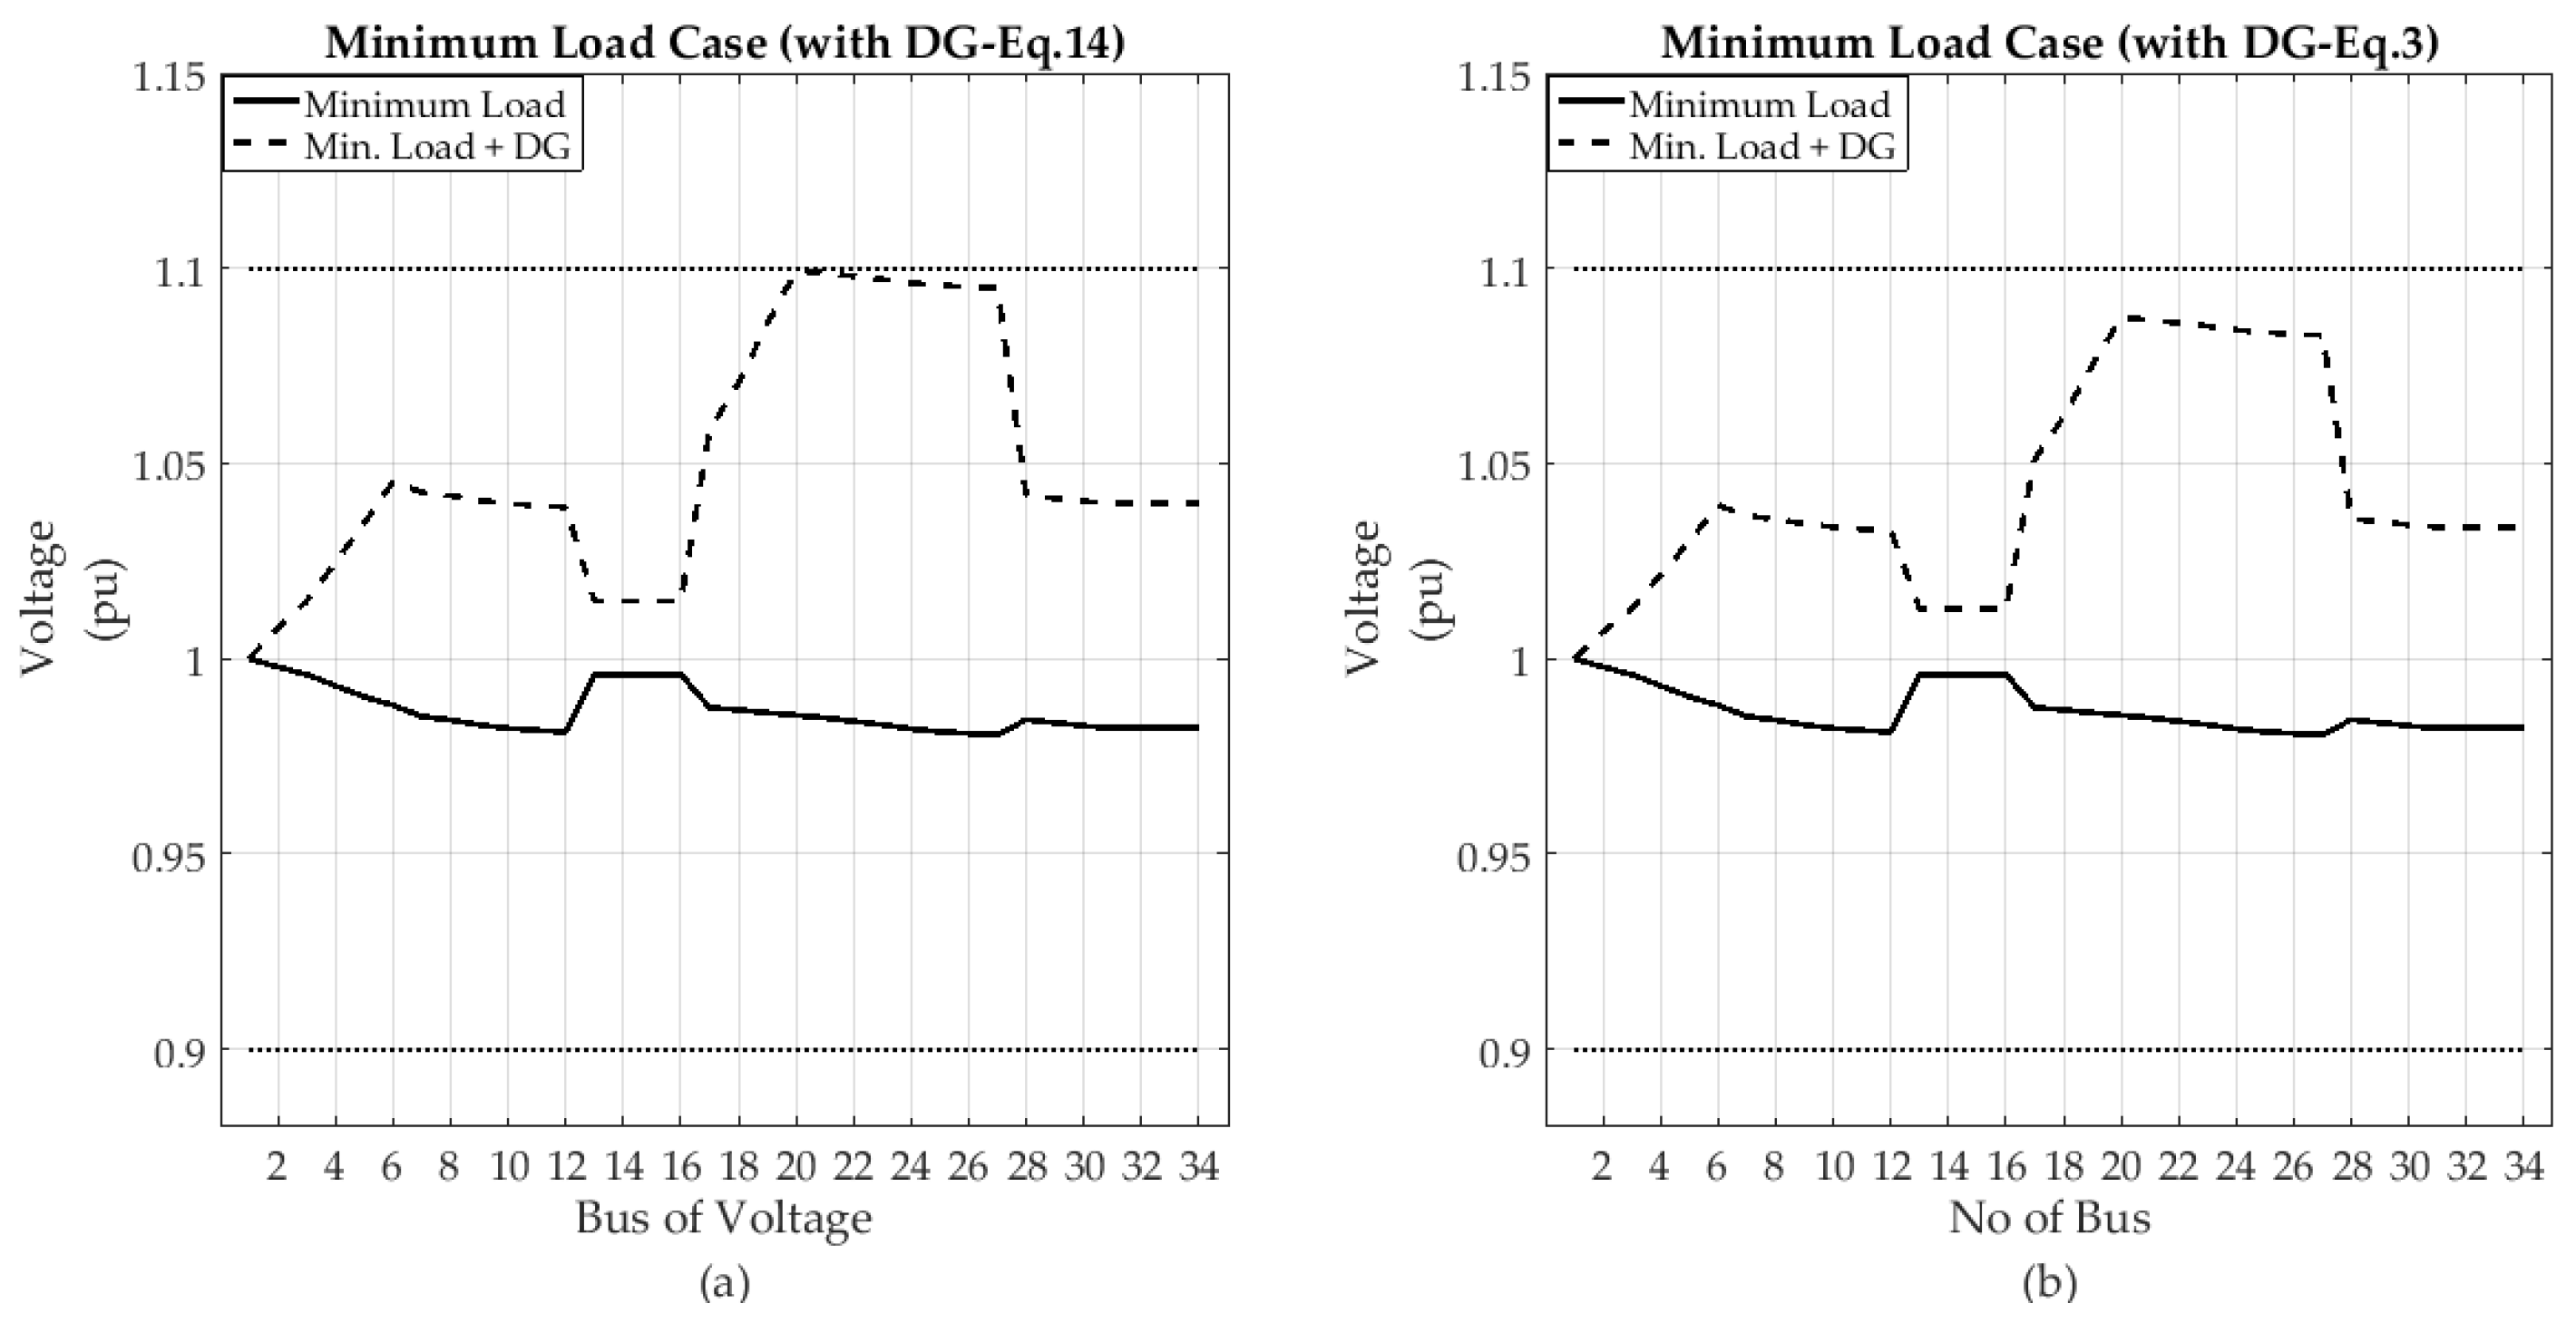
As already mentioned, there are several mathematical models proposed for the calculation of the maximum permissible capacity for a given point of a system on the basis of different approaches. They have all been derived from the power flow equations by different interpretations as follows. One of these mathematical models is proposed in [31] and given by Equation (1). This mathematical model has the simplest expression assuming that the power factor of the DG unit is always 1. Thus, it may only be used in DG integrations that are planned to be realized with a unit power factor. Equation (2) is the most common mathematical model and has been adopted as the basis for some regulations and technical guides on DG planning [32,33,34,35,36]. The power factor of the DG unit is regarded as a parameter in the expression of that mathematical model. The last one of the addressed mathematical models in the study is the expression that takes the power system losses into account and it has been proposed in [37].
| S D G | = | Δ V | | V D G | | S S C D G | cos ( θ )
| S D G | = | S S C D G | | Δ V | | V g | cos ( θ + φ )
| S D G | = | V D G | | S S C D G | | Δ V | cos ( θ + φ )
In these models, the only criterion taken into consideration is the upper voltage limit of the system, and the goal is to achieve the maximum capacity that does not cause overvoltage after the integration of a DG unit with the calculated capacity. In all these mathematical models, the maximum permissible DG capacity is calculated on the basis of an unloaded system condition and no previously integrated DG units. An unloaded case of a system, which is called the worst-case scenario in the given studies, is the most likely case for overvoltage problems after DG integration.
However, it is a quite conservative approach for a power system. Instead, a more realistic worst-case scenario may be established, by considering the minimum load, which is defined through the continuous base loads, and maximum generation, which is defined through the power ratings of the generators in the system [38]. The minimum loads connected to different points within the system can be reduced to the DG integration point by means of network reduction techniques. Thus, the loads can be added to the calculations by their equivalents on the DG integration point. The maximum permissible capacity calculated for the unloaded case of the system may be improved by adding the equivalent capacities of the system loads. The most suitable reduction technique that can be used for this approach is the Ward reduction, which is based on the Gauss elimination method [39].
In order to analyze the situation related to the subject and obtain a generalized mathematical expression, a simple power system, which is depicted in Figure 1a, has been taken as the reference model to be used in the preliminary analysis in the study. The proposed mathematical model should be able to present a solution to the user without requiring heavy and time-consuming computational processes, similar to the existing mathematical models in the literature. For this purpose, computational steps to be performed may be simplified by using appropriate load models and various assumptions. As given in Figure 2a, the case for the integration of a DG unit into the system from a selected bus is the first evaluation. Subsequently, the loads and the generators in the system are reduced to the integration point, taking into account the effects on the maximum permissible capacity value, as it is given in Figure 2b.
The DG unit is planned to be integrated into the system from Bus-5. As can be seen from Figure 1a, three different base loads located at different positions with respect to the integration point are connected to the system. Thus, it is intended to obtain an expression which is useful for all possible load placements. One of these loads is upstream of the integration point, the other is downstream of that point and the last one has been connected to the system from a point on a different branch other than the branch where the integration point is located.
The nodal equations for the system are given as in Equation (4).
[ I 1 I 2 I 3 I 4 I 5 I 6 ] = [ Y g + Y 1 Y 1 0 0 0 0 Y 1 Y 1 + Y 2 Y 2 0 0 0 0 Y 2 Y 2 + Y 3 + Y 4 Y 3 Y 4 0 0 0 Y 3 Y 3 0 0 0 0 Y 4 0 Y 4 + Y 5 Y 5 0 0 0 0 Y 5 Y 5 ] [ V 1 V 2 V 3 V 4 V 5 V 6 ]
Bus-1 is the infinite bus with voltage 1 0 ° pu, and Bus-5 is the integration bus. The load equivalent at the DG integration point can be reached by eliminating all the rows, except the rows that belong to Bus-1 and Bus-5.
[ I 1 I 2 I 4 I 5 I 6 ] = [ Y g + Y 1 Y 1 0 0 0 Y 1 Y 1 + Y 2 ( Y 3 + Y 4 ) Y 2 + Y 3 + Y 4 Y 2 Y 3 Y 2 + Y 3 + Y 4 Y 2 Y 4 Y 2 + Y 3 + Y 4 0 0 Y 2 Y 3 Y 2 + Y 3 + Y 4 Y 3 ( Y 2 + Y 4 ) Y 2 + Y 3 + Y 4 Y 3 Y 4 Y 2 + Y 3 + Y 4 0 0 Y 2 Y 4 Y 2 + Y 3 + Y 4 Y 3 Y 4 Y 2 + Y 3 + Y 4 Y 5 + Y 4 ( Y 2 + Y 3 ) Y 2 + Y 3 + Y 4 Y 5 0 0 0 Y 5 Y 5 ] [ V 1 V 2 V 4 V 5 V 6 ]
[ I 1 I 2 I 4 I 5 + I 6 ] = [ Y g + Y 1 Y 1 0 0 Y 1 Y 1 + Y 2 ( Y 3 + Y 4 ) Y 2 + Y 3 + Y 4 Y 2 Y 3 Y 2 + Y 3 + Y 4 Y 2 Y 4 Y 2 + Y 3 + Y 4 0 Y 2 Y 3 Y 2 + Y 3 + Y 4 Y 2 ( Y 3 + Y 4 ) Y 2 + Y 3 + Y 4 Y 3 Y 4 Y 2 + Y 3 + Y 4 0 Y 2 ( Y 3 + Y 4 ) Y 2 + Y 3 + Y 4 Y 2 ( Y 3 + Y 4 ) Y 2 + Y 3 + Y 4 Y 4 ( Y 2 + Y 3 ) Y 2 + Y 3 + Y 4 ] [ V 1 V 2 V 4 V 5 ]
[ I 1 I 2 + Y 2 Y 2 + Y 4 I 4 I 5 + Y 4 Y 2 + Y 4 I 4 + I 6 ] = [ Y g + Y 1 Y 1 0 Y 1 Y 1 + Y 2 Y 4 Y 2 + Y 4 Y 2 Y 4 Y 2 + Y 4 0 Y 2 Y 4 Y 2 + Y 4 Y 2 Y 4 Y 2 + Y 4 ] [ V 1 V 2 V 5 ]
[ I 1 + Y 1 Y 1 + ( Y 2 Y 4 Y 2 + Y 4 ) I 2 I 5 + Y 2 Y 4 Y 2 + Y 4 Y 1 + ( Y 2 Y 4 Y 2 + Y 4 ) I 2 + Y 4 Y 4 + ( Y 1 Y 2 Y 1 + Y 2 ) I 4 + I 6 ] = [ Y g + Y 1 ( Y 2 Y 4 Y 2 + Y 4 ) Y 1 + ( Y 2 Y 4 Y 2 + Y 4 ) Y 1 ( Y 2 Y 4 Y 2 + Y 4 ) Y 1 + ( Y 2 Y 4 Y 2 + Y 4 ) Y 1 ( Y 2 Y 4 Y 2 + Y 4 ) Y 1 + ( Y 2 Y 4 Y 2 + Y 4 ) Y 1 ( Y 2 Y 4 Y 2 + Y 4 ) Y 1 + ( Y 2 Y 4 Y 2 + Y 4 ) ] [ V 1 V 5 ]
The current of Bus-5 ( I 5 ) includes the equivalent currents of the removed busses. All the values in the equation are per-unit. When Equation (8) is examined, it can be seen that the multipliers in front of each load current are the ratio of the short-circuit powers at the integration point and at the point where the load and DG unit has common coupling. The common coupling points for the loads S L 1 , S L 2 and S L 3 . are Bus-2, Bus-3 and Bus-5, respectively. The equation can be rewritten as:
I 5 = I 5 + S s c D G S s c P C C 2 I 2 + S s c D G S s c P C C 4 I 4 + S s c D G S s c P C C 6 I 6
I 5 = I 5 + 1 n S s c D G S s c P C C n I n
In case of a DG integration to Bus-5, the current ( I 5 ) that belongs to that bus may be expressed by the help of the capacity of that DG unit and the voltage of that bus. If all currents in Equation (10) are expressed in the same way, the equation can be reorganized as:
( S D G V 5 ) = ( S D G V 5 ) + 1 n S s c D G S s c P C C n · ( S L n V n )
S D G = S D G V 5 V 5 + 1 n ( S s c D G S s c P C C n ) · V 5 V n · S L n
where the notations given with apostrophe (′) represent the values after DG integration and the notations given with the asterisk (*) denote to conjugates of the phasors. The voltage V n , is the voltage of the bus where the nth load is connected before the reduction. The power S D G is the maximum permissible DG capacity calculated by the existing mathematical models in the literature, for the unloaded case of the system. The mathematical model given by Equation (3) is more preferable than the others since it considers the power factor of the DG unit and the system losses in the calculations. Equivalents of the loads are added to the capacity calculated for the unloaded case of the system. ( S D G ). After the DG connection at the obtained capacity, the voltage of Bus-5 must not exceed the upper voltage limit of the system. In order to obtain maximum permissible DG connection capacity, the voltage of the DG integration point is taken as equal to the upper voltage limit of the system. For this reason, V 5 is taken as equal to the upper voltage limit value. The voltages in the first term on the right side of the Equation (12) have equal amplitudes but different phase angles. The difference between the phase angles of these two voltages can be neglected, because the effect of that difference is not large, so the ratio of these voltages can be taken as 1.
Since Bus-1 is an infinite bus and its voltage is 1 0 ° pu, the voltage of all buses in the system will be equal to the value between 1 0 ° pu and the upper voltage limit for the minimum load case. Thus, the ratio of the voltages in the second term on the right side of the Equation (12) is always greater than one. This value can only be known precisely after power flow analysis. Instead of increasing the computational process by doing such an analysis, an approximate value for this ratio can be determined with an appropriate approach. It is clear from the equation that as this ratio increases, the equivalent capacities of the loads on the DG connection point increase and thus the maximum permissible DG capacity increases. As a conservative approach, this ratio may be taken as equal to 1 in order to have a capacity that may not cause overvoltage issues in the system. Equation (13) can be rewritten in light of the above-mentioned assumptions.
S D G = S D G + 1 n ( S s c D G S s c P C C n ) · S L n
The mathematical model in Equation (13) gives the maximum permissible DG capacity based on the minimum load case of the system. The loads reduce the voltage in their current flow direction. This effect of the loads is simulated on the integration point by means of the reduction method. The voltages of the load buses are not important because it is expected that these voltages of these busses are always between the lower voltage limit of the system and the integration point voltage.
In a system that is functioning correctly, there is no expectation of low voltage problems after DG integration. If there are other DG units in the system rather than the DG unit that is to be integrated, their maximum generation must be taken into calculation with an appropriate approach.
Unlike the voltages of the load buses, the bus with DG units may have higher voltages than the voltage of the integration point. For this reason, the generation of the DG unit is included in the calculations by taking the connection point of each DG unit into account. Obviously, obtained equivalent capacities for the existing DG units are subtracted from the total capacity. The proposed mathematical model is given in Equation (14). The active and reactive power expressions are given in Equations (15) and (16), respectively.
S D G = S D G + 1 n ( S s c D G S s c P C C n ) · S L n 1 k ( S s c D G S s c D G k ) · S D G k
P D G = P D G + | S s c D G | { 1 n | S L n | | S s c P C C n | · cos ( θ P C C θ D G + φ n ) 1 k | S D G k | | S s c D G k | · cos ( θ D G n θ D G + φ D G k ) }
Q D G = Q D G + | S s c D G | { 1 n | S L n | | S s c P C C n | · sin ( θ P C C θ D G + φ n ) 1 k | S D G k | | S s c D G k | · sin ( θ D G n θ D G + φ D G k ) }

3. Case Study

In this study, an application of the proposed mathematical model is demonstrated on a 34-bus test system [40]. The single line diagram of the test system is given in Figure 3. All the lines in the system are overhead lines, and their cross-sections along with the lengths are given in the single line diagram. The system is a radial distribution system, and the nominal system voltage is 11 kV. The system is modelled in the Electrical Transient and Analysis Program (ETAP), which is software developed for power system analysis.
Minimum load and maximum generation case for the test system has been established by four base loads and two DG units. Ratings for the base loads and the DG units in the system are given in Table 1. One of the chosen points is Bus-3, which is close to the main bus (Bus-1) and the other one is Bus-20, which is relatively farther from the main bus and near to the loads and DG units determined in the minimum load–maximum generation scenario.
First, the calculation of the maximum permissible DG capacity for the unloaded case of the system ( S D G ) is calculated. Equation (3), which has the most accurate approach among the addressed mathematical models in the study, is used in this calculation. Then, the obtained capacity is improved by including the minimum loads and the maximum generations in the calculations by using the proposed mathematical model. In order to test the effectiveness of the proposed model, a DG unit at the obtained capacities is integrated into the system and a power flow analysis is performed. Each obtained capacity is analyzed for two different loading scenarios: the minimum load–maximum generation case and a sample operation case. Thus, the consistency of the proposed mathematical model is tested. Both scenarios are given in Figure 4.
The maximum permissible DG capacity for Bus-20 is calculated by using the proposed mathematical model and the result is 3.9 MVA with a 0.95 lagging power factor. A DG unit at the obtained capacity is integrated into the system from Bus-20. The bus voltages before and after the DG integration are given in Figure 5a.
All the steps are repeated with the capacity obtained by using Equation (3) and the system voltages are given in Figure 5b. If the unloaded case of the system is taken as the basis in the calculation of the maximum permissible DG capacity, it may lead to misleading results. DG unit integrations performed with the capacities obtained by adopting such an approach may lead to overvoltage problems, especially in the systems with generation units. As can be seen from Figure 5b, the results obtained are a good example of this. In contrast, the capacity obtained by using the proposed mathematical model is far from being at risk of overvoltage.
As can be seen from Figure 5a, none of the bus voltages has reached the upper voltage limit after the DG integration at the capacity calculated by the proposed mathematical model. This means that further generation can be integrated to the system. As mentioned in the previous section, in the derivation of the proposed mathematical model, approximate values are assigned with cautious approaches to the parameters that may not be known precisely without performing detailed analysis. These assigned approximate values cause the results that are lower than the absolute maximum value but safer than the values obtained by other mathematical models.
In the second case study for the DG unit integration from Bus-20, the maximum permissible capacity is calculated by taking into consideration the case in which only the loads are present in the system. A DG unit is integrated to the system at the capacity obtained by each mathematical model, and the system is analyzed. The results are given in Figure 6a,b. As can be seen from Figure 6a, after the DG integration with the capacity obtained by the proposed mathematical model, the voltage of the integration point is close to the upper voltage limit of the system but not beyond that. The maximum permissible capacity calculated by the proposed mathematical model is 10 MVA, and the capacity calculated by the Equation (3) is 8.88 MVA. As seen, the proposed mathematical model does not always give a value below the capacities obtained from other mathematical models. The main criterion here is to be able to calculate the maximum permissible DG capacity value without the need for any data other than the available data.
The capacities calculated for the minimum load–maximum generation case are analyzed in a case study of the system given in Figure 4b. The obtained bus voltages after DG integrations have been given in Figure 7. No overvoltage is observed in the system for either capacity. For the DG integration with the capacity calculated by using the proposed mathematical model, the system voltages are closer to the nominal system voltages.
Bus-3 is the second bus chosen for performing further examination on the effectiveness of the proposed mathematical model. It is closer to the infinite bus; therefore, it is stronger than Bus-20. The same analyses are performed for Bus-3 without any change in the system scenarios. For the unloaded case of the system, the maximum permissible capacity for Bus-3 has been calculated as 54.3 MVA with a 0.95 lagging power factor. When the loads and the generators in the system are taken into account with the proposed mathematical model, the capacity has been obtained as 24 MVA with a 0.97 lagging power factor. The obtained bus voltages after the DG unit integration at that calculated capacities are given in Figure 8. The results for the proposed mathematical model are given in Figure 8a, and the results with Equation (3) are given in Figure 8b. Almost all bus voltages are above the upper voltage limit after the integration at the capacity obtained by Equation (3). On the other hand, integration at the capacity obtained by the proposed mathematical model does not cause any overvoltage problem in the system, as in the previous case.
For the minimum load case, the capacity obtained with the proposed mathematical model is 56.25 MVA and the power factor is a lag of 0.95. The capacity calculated with the Equation (3) is 54.26 MVA. The voltages in the system after DG integrations in the calculated capacities are given in Figure 9. As can be seen from the figures, the results obtained in the second case analysis are quite similar to those obtained in the previous case analysis.
Finally, the obtained capacities for Bus-3 are examined for the sample case. The obtained bus voltages are given in Figure 10.
In order to present the effectiveness of the proposed mathematical model even better, a comparison between the proposed mathematical model and the mathematical models in the literature is given in Table 2. Since the mathematical model given in Equation (1) can only be applied to the integration of DG units with the unit power factor, the comparison is based on this assumption. For each mathematical model, a DG unit at the calculated capacity is integrated into the system, and power flow analyses are performed for the minimum load maximum generation case of the system. The resulting system voltages are examined, and the highest voltage value is presented in Table 2. The results prove that the proposed mathematical model successfully calculates the maximum permissible capacity by taking into account the loads and the generators in the system.

4. Discussion

The results proved that the maximum permissible DG capacity calculated by the proposed mathematical model is highly reliable in terms of preventing overvoltage of the system busses. In the derivation of the proposed mathematical model, the worst-case scenario is based on the minimum load–maximum generation case. After DG integration at the capacity obtained by the proposed mathematical model, the voltages are always below the upper voltage limit of the system. The fact that no overvoltage occurs for the minimum load - maximum generation case of the system proves the accuracy of the obtained capacities. Since the generation in the system cannot exceed their maximum ratings, voltages cannot be increased further. The increase on the loads may cause the only voltage drop in the system.
The capacities obtained by the proposed mathematical model may not always be equal to the actual maximum permissible capacity for the point chosen in the system. During the derivation of the mathematical model, various assumptions were made for the unknown parameters such as the voltages of the loads or DG unit connection points after DG integration. These assumptions are made with the consideration of the most risky situations in terms of overvoltage. Thus, the obtained capacity is expected to be an approximate value that is smaller than or equal to the actual maximum permissible capacity. Laborious and time-consuming mathematical operations are required to precisely calculate this capacity with available data presented. Taking all of these into consideration, it can be stated that the proposed mathematical model is successful, reliable and widely applicable.

5. Conclusions

In this study, a mathematical model is proposed for the calculation of the maximum permissible capacity of a DG unit that is planned to be integrated into a system from a certain point. There are mathematical models for a similar purpose in the literature. The aim of the study was to obtain a more successful mathematical model by taking into consideration both the loads and the generators in the system before the DG unit is integrated into the system. For this purpose, the Ward reduction method is used to reduce the loads and generators with respect to the integration point. Then, a general mathematical model is obtained using the equations with the Ward reduction technique.
The proposed mathematical model is applied to a 34-bus test system. The maximum permissible DG capacity for two points of the system (Bus-3 and Bus-20) is calculated by using the proposed mathematical model. In order to test the consistency of the results and the effectiveness of the proposed mathematical model, the maximum capacity is calculated for the same points using one of the other mathematical models proposed in the literature. At this step, the mathematical model given in Equation (3) is chosen for the comparison. This mathematical model is more successful than the other alternatives since it considers the power factor of the DG unit and the system losses. The calculations done by the mathematical model (Equation (3)) are based on the unloaded case of the system. The proposed mathematical model improves the capacity obtained from that equation by taking the loads and the generators in the system into account in an appropriate manner.
With both mathematical models, the maximum permissible DG capacity calculations for the chosen points are performed in the case study. Consistencies of the results are analyzed by power flow analysis of the system after the DG unit integration with the obtained capacities. The analysis is repeated for different loading conditions of the system. The findings obtained from the case studies proved the success of the proposed mathematical model.
The proposed mathematical model presents a new approach to DG planning studies. A new hosting capacity approach can also be offered with this mathematical model within an optimization algorithm by evaluating the expressions for different system criteria. Furthermore, the work carried out can be repeated according to more specific production technology. In this case, a more realistic approach can be made by comparing the generation profile of the distributed generator with the production and consumption profiles in the system.

Acknowledgments

This work was supported by FEDER funds through COMPETE 2020 and by Portuguese funds through FCT, under Projects SAICT-PAC/0004/2015—POCI-01-0145-FEDER-016434, POCI-01-0145-FEDER-006961, UID/EEA/50014/2013, UID/CEC/50021/2013, UID/EMS/00151/2013 and SFRH/BPD/103744/2014. Also, the research is partially funded by the EU Seventh Framework Programmer FP7/2007-2013 under grant agreement No. 309048.

Author Contributions

All authors have worked on this manuscript together, and all authors have read and approved the final manuscript.

Conflicts of Interest

The authors declare no conflict of interest.

Nomenclature

S D G Apparent power of DG unit
S D G Improved apparent power of DG unit by considering loads and generations
S L n Apparent power of the nth load
S S C D G Short circuit power at DG integration point
S S C P C C Short circuit power at the point of common coupling
V D G Voltage of DG unit
V g Nominal voltage of the grid
V n Voltage of the bus where the nth load is connected
Δ V Voltage deviation between the DG integration point and infinite bus for the unloaded case of the system
I a The current injected or absorbed from the ath bus
Y Notation for admittance
Z Notation for impedance
θ Impedance phase angle
θ P C C Phase angle of the short circuit power at the point of common coupling
θ D G Phase angle of the short circuit power of DG integration point
φ Phase angle of power
φ n Phase angle of the power for the nth load
φ D G k Phase angle of the power for the kth DG unit

References

  1. Caramia, P.; Di Mambro, E.; Varilone, P.; Verde, P. Impact of distributed generation on the voltage sag performance of transmission systems. Energies 2017, 10, 959. [Google Scholar] [CrossRef]
  2. Norshahrani, M.; Mokhlis, H.; Abu Bakar, A.H.; Jamian, J.J.; Sukumar, S. Progress on Protection Strategies to Mitigate the Impact of Renewable Distributed Generation on Distribution Systems. Energies 2017, 10, 1864. [Google Scholar] [CrossRef]
  3. Ackermann, T.; Andersson, G.; Söder, L. Distributed generation: A definition. Electr. Power Syst. Res. 2001, 57, 195–204. [Google Scholar] [CrossRef]
  4. Dugan, R.C.; McDermott, T.E. Distributed Generation. IEEE Ind. Appl. Mag. 2002, 8, 19–25. [Google Scholar] [CrossRef]
  5. Pepermans, G.; Driesen, J.; Haeseldonckx, D.; Belmans, R.; D’haeseleer, W. Distributed generation: Definition, benefits and issues. Energy Policy 2005, 33, 787–798. [Google Scholar] [CrossRef]
  6. Bollen, M.; Hassan, F. Integration of Distributed Generation in the Power System, 1st ed.; John Wiley & Sons, Inc.: Hoboken, NJ, USA, 2011; ISBN 978-0-470-64337-2. [Google Scholar]
  7. Kashem, M.A.; Le, A.D.T.; Negnevitsky, M.; Ledwich, G. Distributed generation for minimization of power losses in distribution systems. In Proceedings of the IEEE Power Engineering Society General Meeting, Montreal, QC, Canada, 18–22 June 2006. [Google Scholar]
  8. Walling, R.A.; Saint, R.; Dugan, R.C.; Burke, J.; Kojovic, L.A. Summary of distributed resources impact on power delivery systems. IEEE Trans. Power Deliv. 2008, 23, 1636–1644. [Google Scholar] [CrossRef]
  9. Vita, V.; Alimardan, T.; Ekonomou, L. The Impact of Distributed Generation in the Distribution Networks’ Voltage Profile and Energy Losses. In Proceedings of the European Modelling Symposium, Madrid, Spain, 6–8 October 2015; pp. 260–265. [Google Scholar]
  10. Gonen, T. Electrical Power Distribution Engineering, 3rd ed.; CRC Press: Boca Raton, FL, USA, 2014; ISBN 978-1-4822-0700-2. [Google Scholar]
  11. Dugan, R.C.; McDermott, T.E.; Ball, G.J. Planning for distributed generation. IEEE Ind. Appl. Mag. 2001, 7, 80–88. [Google Scholar] [CrossRef]
  12. Lazarou, S.; Vita, V.; Karampelas, P.; Ekonomou, L. A power system simulation platform for planning and evaluating distributed generation systems based on GIS. Energy Syst. 2013, 4, 379–391. [Google Scholar] [CrossRef]
  13. Singh, B.; Sharma, J. A review on distributed generation planning. Renew. Sustain. Energy Rev. 2017, 76, 529–544. [Google Scholar] [CrossRef]
  14. Theo, W.L.; Lim, J.S.; Ho, W.S.; Hashim, H.; Lee, C.T. Review of distributed generation (DG) system planning and optimisation techniques: Comparison of numerical and mathematical modelling methods. Renew. Sustain. Energy Rev. 2017, 67, 531–573. [Google Scholar] [CrossRef]
  15. Viral, R.; Khatod, D.K. Optimal planning of distributed generation systems in distribution system: A review. Renew. Sustain. Energy Rev. 2012, 16, 5146–5165. [Google Scholar] [CrossRef]
  16. Ehsan, A.; Yang, Q. Optimal integration and planning of renewable distributed generation in the power distribution networks: A review of analytical techniques. Appl. Energy 2018, 210, 44–59. [Google Scholar] [CrossRef]
  17. Prakash, P.; Khatod, D.K. Optimal sizing and siting techniques for distributed generation in distribution systems: A review. Renew. Sustain. Energy Rev. 2016, 57, 111–130. [Google Scholar] [CrossRef]
  18. Luna-Rubio, R.; Trejo-Perea, M.; Vargas-Vazquez, D.; Rios-Moreno, G.J. Optimal sizing of renewable hybrids energy systems: A review of methodologies. Sol. Energy 2012, 86, 1077–1088. [Google Scholar] [CrossRef]
  19. Georgilakis, P.S.; Member, S.; Hatziargyriou, N.D. Optimal Distributed Generation Placement in Power Distribution Networks: Models, Methods, and Future Research. IEEE Trans. Power Syst. 2013, 28, 3420–3428. [Google Scholar] [CrossRef]
  20. Sultana, U.; Khairuddin, A.B.; Aman, M.M.; Mokhtar, A.S.; Zareen, N. A review of optimum DG placement based on minimization of power losses and voltage stability enhancement of distribution system. Renew. Sustain. Energy Rev. 2016, 63, 363–378. [Google Scholar] [CrossRef]
  21. Bollen, M.H.J.; Rönnberg, K.S. Hosting Capacity of the Power Grid for Renewable Electricity Production and New Large Consumption Equipment. Energies 2017, 10, 1325. [Google Scholar] [CrossRef]
  22. Alturki, M.; Khodaei, A.; Paaso, A.; Bahramirad, S. Optimization-based distribution grid hosting capacity calculations. Appl. Energy 2017, in press. [Google Scholar] [CrossRef]
  23. Esmaili, M.; Firozjaee, E.C.; Shayanfar, H.A. Optimal placement of distributed generations considering voltage stability and power losses with observing voltage-related constraints. Appl. Energy 2014, 113, 1252–1260. [Google Scholar] [CrossRef]
  24. Aman, M.M.; Jasmon, G.B.; Bakar, A.H.A.; Mokhlis, H. A new approach for optimum DG placement and sizing based on voltage stability maximization and minimization of power losses. Energy Convers. Manag. 2013, 70, 202–210. [Google Scholar] [CrossRef]
  25. Shahzad, M.; Ahmad, I.; Gawlik, W.; Palensky, P. Load concentration factor based analytical method for optimal placement of multiple distribution generators for loss minimization and voltage profile improvement. Energies 2016, 9, 287. [Google Scholar] [CrossRef]
  26. Vita, V. Development of a Decision-Making Algorithm for the Optimum Size and Placement of Distributed Generation Units in Distribution Networks. Energies 2017, 10, 1433. [Google Scholar] [CrossRef]
  27. Hung, D.Q.; Mithulananthan, N.; Bansal, R.C. Analytical strategies for renewable distributed generation integration considering energy loss minimization. Appl. Energy 2013, 105, 75–85. [Google Scholar] [CrossRef]
  28. Borges, C.L.T.; Falcão, D.M. Optimal distributed generation allocation for reliability, losses, and voltage improvement. Int. J. Electr. Power Energy Syst. 2006, 28, 413–420. [Google Scholar] [CrossRef]
  29. Novoa, C.; Jin, T. Reliability centered planning for distributed generation considering wind power volatility. Electr. Power Syst. Res. 2011, 81, 1654–1661. [Google Scholar] [CrossRef]
  30. Mena, A.J.G.; Martin Garcia, J.A. An efficient approach for the siting and sizing problem of distributed generation. Int. J. Electr. Power Energy Syst. 2015, 69, 167–172. [Google Scholar] [CrossRef]
  31. Altin, M.; Oguz, E.U.; Bizkevelci, E.; Simsek, B. Distributed generation hosting capacity calculation of MV distribution feeders in Turkey. In Proceedings of the IEEE PES Innovative Smart Grid Technologies, Europe, Istanbul, Turkey, 12–15 October 2014; pp. 1–7. [Google Scholar]
  32. Wind Turbine Grid Connection and Interaction. Dtsch. Wind GmbH Tech-Wise A/S. 2001. Available online: https://ec.europa.eu/energy/sites/ener/files/documents/2001_fp5_brochure_energy_env.pdf (accessed on 16 December 2017).
  33. Yang, N.; Chen, T. A review on evaluation of maximun permissible capacity of distributed generations connected to a smart grid. In Proceedings of the 2012 International Conference on Machine Learning and Cybernetics, Xi’an, China, 15–17 July 2012; pp. 15–17. [Google Scholar]
  34. Ackermann, T. Wind Power in Power Systems, 2nd ed.; John Wiley & Sons Ltd.: West Sussex, UK, 2005; ISBN 978-0-470-97416-2. [Google Scholar]
  35. Papathanassiou, S.A.; Hatziargyriou, N.D. Technical Requirements for the Connection of Dispersed Generation to the Grid. In Proceedings of the IEEE Power Engineering Society Summer Meeting, Vancouver, BC, Canada, 15–19 July 2001; pp. 749–754. [Google Scholar]
  36. Papathanassiou, S.A. A technical evaluation framework for the connection of DG to the distribution network. Electr. Power Syst. Res. 2007, 77, 24–34. [Google Scholar] [CrossRef]
  37. Jothibasu, S.; Santoso, S. Sensitivity analysis of photovoltaic hosting capacity of distribution circuits. In Proceedings of the IEEE Power and Energy Society General Meeting (PESGM), Boston, MA, USA, 17–21 July 2016; pp. 1–5. [Google Scholar]
  38. Mahmud, M.A.; Hossain, M.J.; Pota, H.R. Worst case scenario for large distribution networks with distributed generation. In Proceedings of the IEEE Power and Energy Society General Meeting, Detroit, MI, USA, 24–29 July 2011; pp. 1–7. [Google Scholar]
  39. Ward, J.B. Equivalent Circuits for Power-Flow Studies. AIEE Trans. 1949, 68, 373–382. [Google Scholar] [CrossRef]
  40. Salama, M.M.A.; Chikhani, A.Y. A simplified network approach to the var control problem for radial distribution systems. IEEE Trans. Power Deliv. 1993, 8, 1529–1535. [Google Scholar] [CrossRef]
Figure 1. Single line diagram of the sample power system, (a) placements of the loads before network reduction; (b) the system after all loads are reduced to the integration point.
Energies 11 00255 g001
Figure 2. Single line diagram of the sample power system, (a) DG integration at zero load condition; (b) DG integration after the loads are reduced to the integration point.
Energies 11 00255 g002
Figure 3. 34-Bus test system.
Energies 11 00255 g003
Figure 4. Loading scenarios for the test system (a) minimum load–maximum generation case; (b) a sample loading case for the system.
Energies 11 00255 g004
Figure 5. Voltages at the system buses for the minimum load–maximum generation case with and without DG integration from Bus-20 (a) for the DG capacity obtained by the proposed mathematical model (b) for the DG capacity obtained by Equation (3).
Energies 11 00255 g005
Figure 6. Voltages at the system buses for the minimum load case with and without DG integration from Bus-20 (a) for the DG capacity obtained by the proposed mathematical model (b) for the DG capacity obtained by Equation (3).
Energies 11 00255 g006
Figure 7. Voltages at the system buses for the sample case with and without DG integration from Bus-20 (a) for the DG capacity obtained by the proposed mathematical model (b) for the DG capacity obtained by Equation (3).
Energies 11 00255 g007
Figure 8. Voltages at the system buses for the minimum load–maximum generation case with and without DG integration from Bus-3 (a) for the DG capacity obtained by the proposed mathematical model (b) for the DG capacity obtained by Equation (3).
Energies 11 00255 g008
Figure 9. Voltages at the system buses for the minimum load case with and without DG integration from Bus-3 (a) for the DG capacity obtained by the proposed mathematical model (b) for the DG capacity obtained by Equation (3).
Energies 11 00255 g009
Figure 10. Voltages at the system buses for the sample case with and without DG integration from Bus-3 (a) for the DG capacity obtained by the proposed mathematical model (b) for the DG capacity obtained by Equation (3).
Energies 11 00255 g010
Table 1. The values of base loads and DG units in the system.
LoadCapacityPower FactorConnected Bus
S L 1 0.5 MVA0.95 (lag.)Bus-5
S L 2 0.5 MVA0.9 (lag.)Bus-12
S L 3 0.4 MVA0.98 (lag.)Bus-27
S L 4 0.6 MVA0.97 (lag.)Bus-30
S D G 1 1 MVA0.9 (lag.)Bus-22
S D G 2 3 MVA0.9 (lag.)Bus-34
S D G *8.88 MVA0.9 (lag.)Bus-20
* Maximum permissible DG capacity obtained by Equation (3) for the DG unit planned to be integrated to the power system from Bus-20.
Table 2. Comparison of the proposed mathematical model with the existing mathematical models.
Mathematical ModelsBus-3Bus-20
MPC *Highest VoltageMPC *Highest Voltage
Proposed Mathematical Model30.951.089 pu4.961.062 pu
Equation (1)48.951.123 pu8.411.108 pu
Equation (2)53.951.130 pu8.301.107 pu
Equation (3)59.351.138 pu9.131.115 pu
* MPC: Maximum Permissible Capacity for the given point in MVA.

