Abstract
The Energy System Transition in Aviation research project of the Aeronautics Research Center Niedersachsen (NFL) searches for potentially game-changing technologies to reduce the carbon footprint of aviation by promoting and enabling new propulsion and drag reduction technologies. The greatest potential for aerodynamic drag reduction is seen in laminar flow control by boundary layer suction. While most of the research so far has been on partial laminarization by application of Natural Laminar Flow (NLF) and Hybrid Laminar Flow Control (HLFC) to wings, complete laminarization of wings, tails and fuselages promises much higher gains. The potential drag reduction and suction requirements, including the necessary compressor power, are calculated on component level using a flow solver with viscid/inviscid coupling and a 3D Reynolds-Averaged Navier-Stokes (RANS) solver. The effect on total aircraft drag is estimated for a state-of-the-art mid-range aircraft configuration using preliminary aircraft design methods, showing that total cruise drag can be halved compared to today’s turbulent aircraft.
1. Introduction and Aim of the Work
Since the beginning of aviation, reduction of drag is one of the prime objectives for every aircraft designer. An aircraft with lower drag is not only more economical in every aspect, but also less harmful to the environment, which has become increasingly important in the last decades and will be even more important in the future. In addition to noise, NOX and other pollutants, the primary focus is on the emission of greenhouse gases into the atmosphere, which is directly linked to the combustion of carbon-based fossil fuels. While jet engine technology has provided much of the efficiency improvement in the past, physical and technical limits are reached now which mean that future improvements will be smaller and come at higher costs in terms of weight, size and investment. Understanding in aerodynamics has improved only in small steps since the beginning of the jet age, in part because the subsonic turbulent aircraft was aerodynamically much more mature than the then-new jet engines [1]. Swept wings and supercritical wing profiles have expanded the speed envelope into the transonic region, which again improved engine fidelity and of course travel times, rather than directly reducing drag. However, there is room for substantial drag improvement by laminar flow control. The boundary layer flow on today’s large aircraft is turbulent on almost the entire wetted surface. This results in viscous drag five to ten times larger than that of laminar boundary layers.
The first part of this paper, in Section 2, provides a review of the research on laminar flow control and transition prediction, with special focus on activities at DLR (Deutsches Zentrum für Luft-und Raumfahrt, German Aerospace Research Center) Braunschweig for partial laminarization of wings. In the second part, beginning in Section 3, simple methods are used to assess the potential drag reduction by extending the application of laminar flow control by boundary layer suction to all wetted surfaces of the aircraft. Laminar Flow Control (LFC) is applied to existing airfoils and a generic fuselage geometry, with no shape adaptation taken into account. The combined optimization of shape and suction is outside the scope of this paper, but promises even greater drag reductions than those presented here. The authors’ aim is to make the case for an in-depth investigation of the subject in future research programs, using the sophisticated methods described in the first part of the paper.
2. Review of Recent Research on Laminar Flow Technology in Europe
The relevant transition mechanisms that can be found on transonic swept wings of modern transport aircraft are Tollmien-Schlichting Instability (TSI), Attachment Line Transition (ALT), and Crossflow Instability (CFI). Basic research conducted throughout the last century (e.g., [2,3,4,5,6,7,8,9,10]) has led to a good knowledge about the physics of these phenomena and provided principle ideas how to control them. By continuous research work, the German Aerospace Center (DLR) has built up the capabilities for transition prediction as well as for design and testing of wings and empennages following the NLF (Natural Laminar Flow) and HLFC (Hybrid Laminar Flow Control) concepts.
2.1. Transition Prediction
A prerequisite for the design of a laminar flow wing is a reliable transition prediction method. At DLR and Airbus, the semi-empirical eN method, established by van Ingen [11,12], is used, which is based on linear stability theory. Velocity profiles of the laminar boundary layer are analyzed with respect to their stability against harmonic oscillations, which are superimposed as small disturbances to an otherwise steady basic flow. If unstable, the downstream amplitude growth of a disturbance can be expressed by the so called N-factor, defined as the natural logarithm of the ratio of disturbance amplitude at a point downstream to its initial value at the so-called neutral point. It is assumed that transition occurs where the N-factor of the most amplified disturbance reaches a limiting value Ncrit.
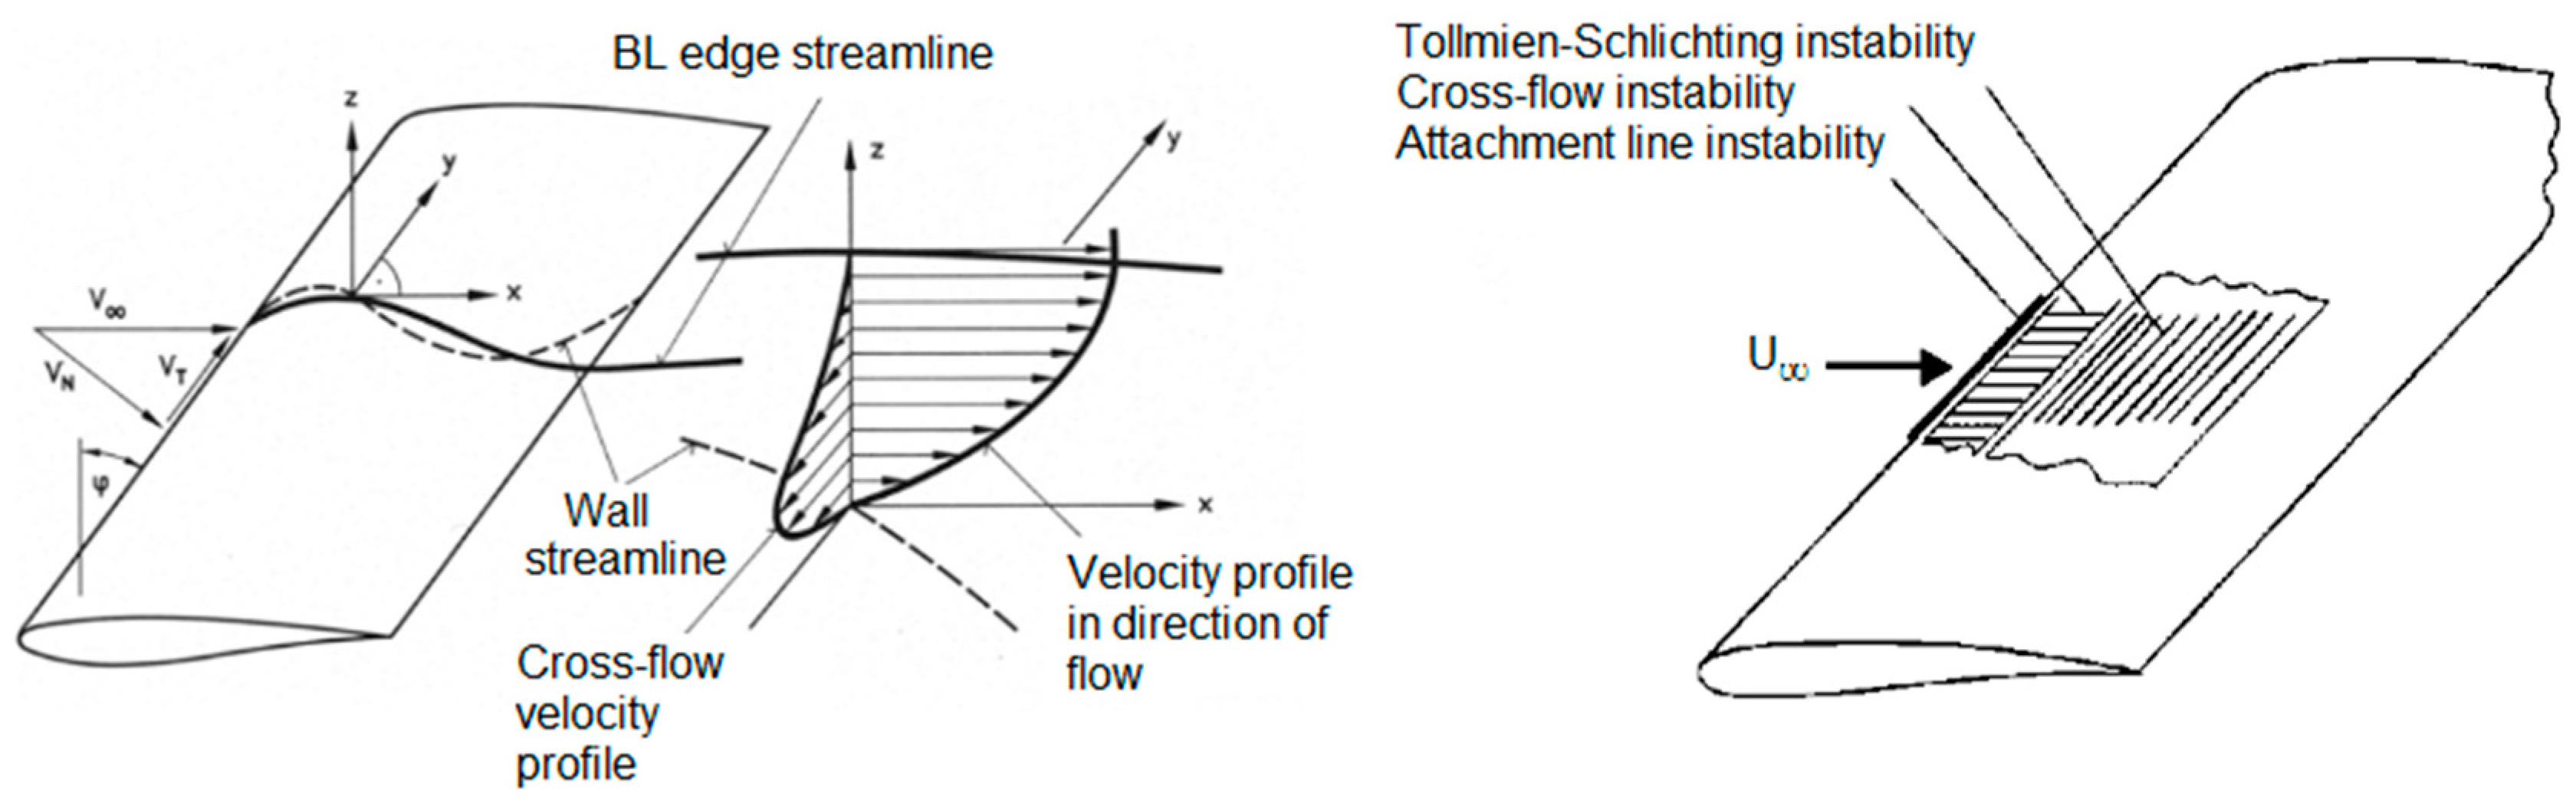
Boundary layer velocity profiles on a swept wing are three-dimensionally warped in regions where a pressure gradient is present. When projected into the direction of the external flow, the velocity profiles are similar to those of two-dimensional boundary layers, while in direction perpendicular to the outer flow, the so-called crossflow profile is present, as illustrated in Figure 1. Analogous to 2D flow cases, the profiles parallel to the external flow can become unstable against small travelling disturbances, i.e., Tollmien-Schlichting waves, while the crossflow profiles exhibit at least one inflectional point, making them inherently unstable against disturbances with a wave vector approximately pointing in crossflow direction. Consequently, in the approach followed at DLR [13,14] for transition prediction, chordwise N-factor distributions for two classes of disturbances are calculated:
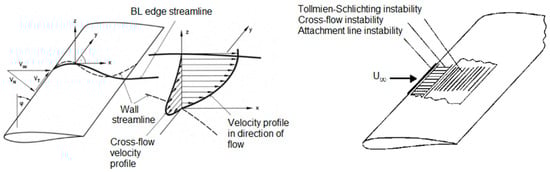
Figure 1.
3D Boundary Layer on a Swept Wing and related Transition Mechanisms.
- Tollmien Schlichting Instabilities are treated as travelling waves with constant frequency and propagation direction parallel to the flow at the boundary layer edge.
- Crossflow Instabilities are treated as stationary (zero frequency) waves with constant wave length.
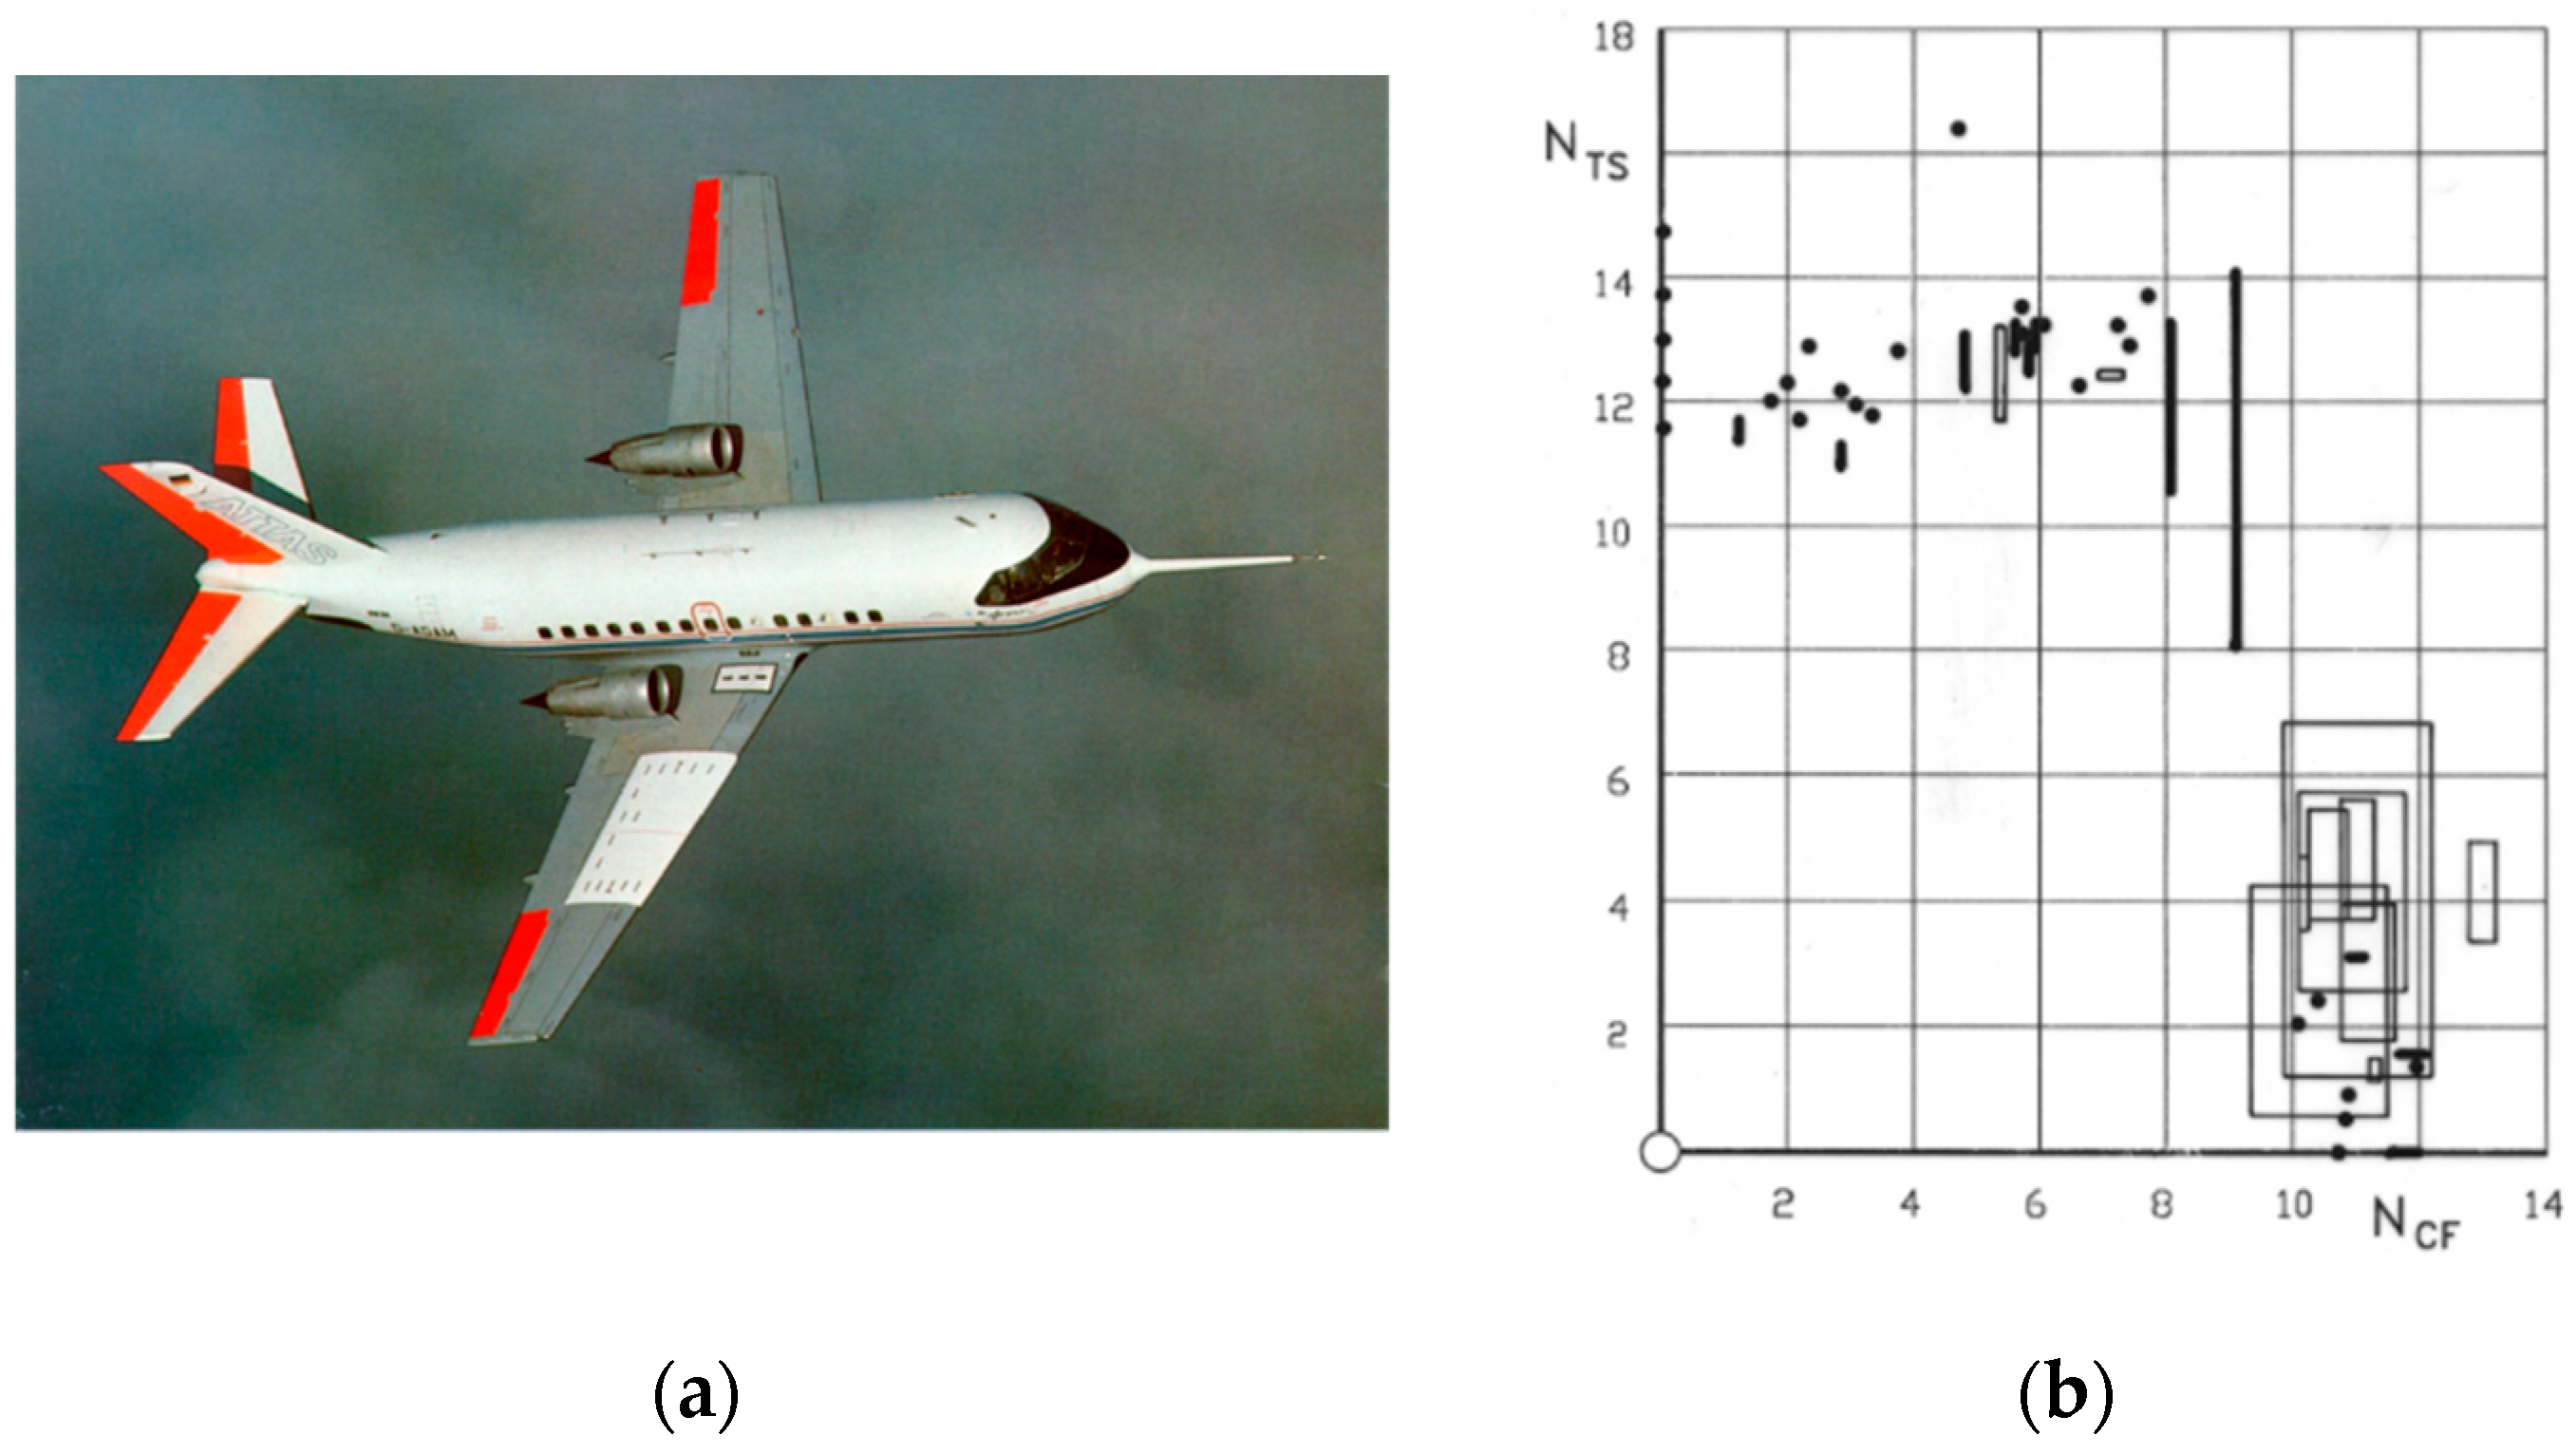
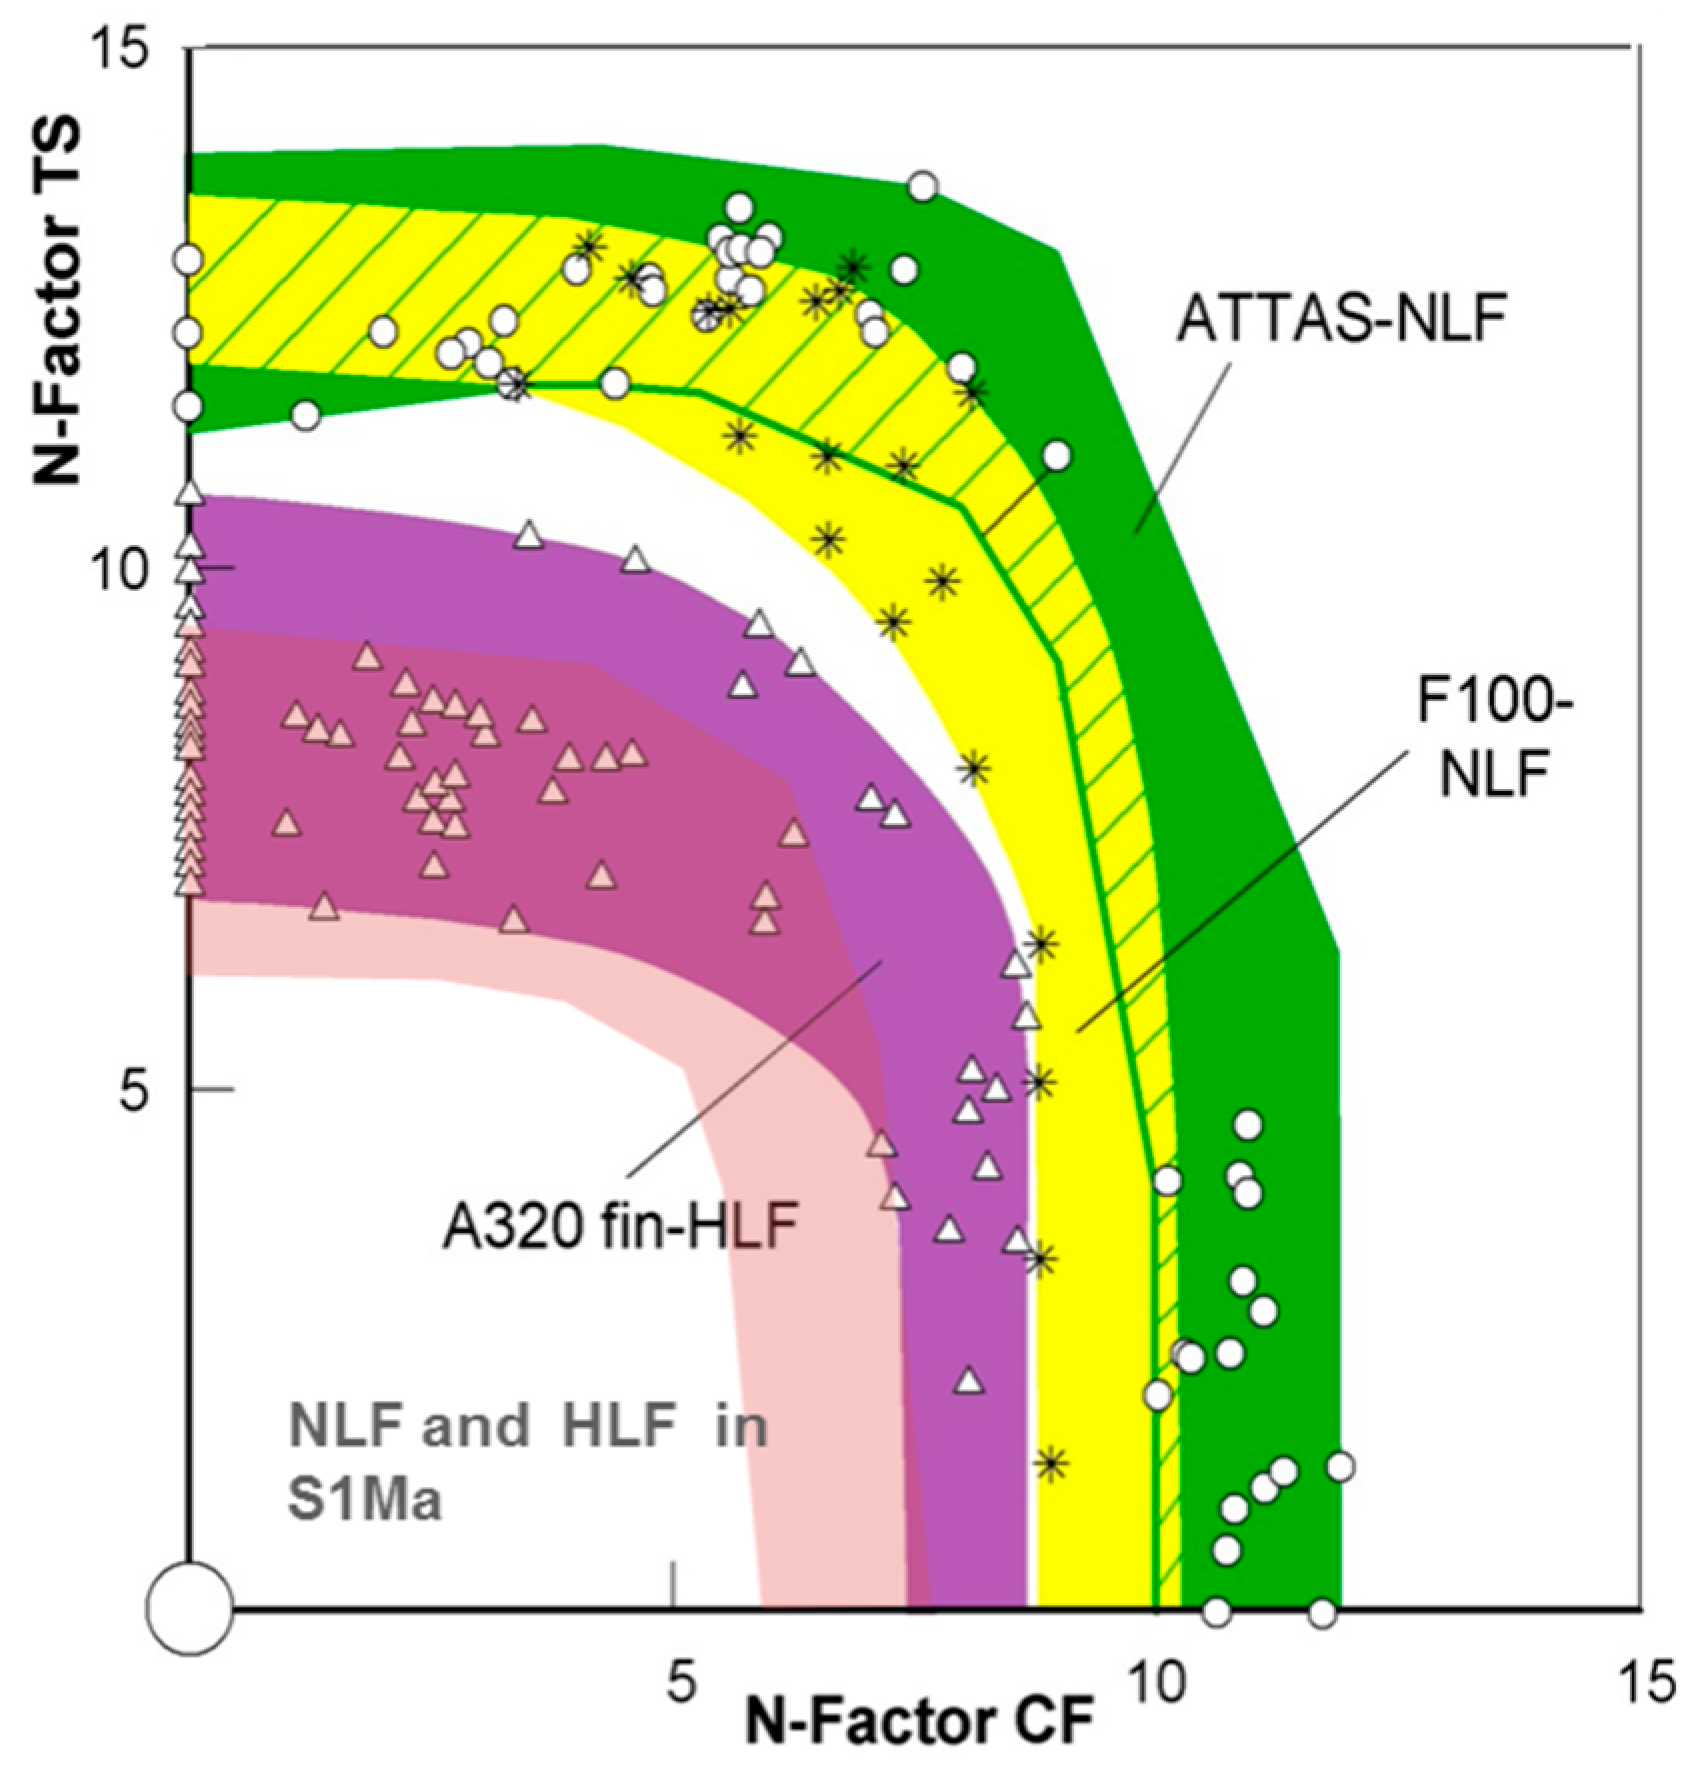
In order to obtain values of Ncrit for TSI and CFI, in-flight experiments were performed in 1987 [15] with the DLR flying testbed ATTAS (Advanced Technologies Testing Aircraft System) shown in Figure 2a. A wing glove with modified sections was designed especially for the purpose of a clear N-factor identification. Linear stability analysis delivered amplification rates for both classes of disturbances, and the envelopes of NTS and NCF distributions were correlated with the measured transition locations from the same experiment, shown in Figure 2b. During the ATTAS flight tests, the criterion for Attachment Line Transition (ALT), first proposed by Pfenninger [5], was also confirmed. The validity of the criteria found has been successfully proven during design and flight testing of a NLF glove on a Fokker 100 in 1991 within the frame of the project ELFIN (European Laminar Flow Investigation) [16], funded by the European Union. It was assumed that the ATTAS criterion, although evaluated from a NLF experiment, is also valid for HLFC applications with boundary layer suction. However, the evaluation of the A320 hybrid laminar fin flight experiment conducted in 1998 [17], where boundary layer suction was applied over the front 20% of chord on an A320 vertical tail plane, showed that critical N-factors for TSI and CFI were reduced compared to the NLF case, as can be seen from the N-factor envelopes in Figure 3. This is caused by the inhomogeneity introduced into the flow by suction through discrete micro holes rather than through an ideal porous surface.

Figure 2.
(a) ATTAS Flight Experiment and (b) Evalation of NTS-NCF Transition Criterion.

Figure 3.
N-Factor Correlations.
2.2. NLF and HLFC Wing Design
Once premature transition due to ALT or CFI has been avoided over the first 5–10% of chord, the transition process is dominated by Tollmien-Schlichting instabilities. It is well known from two-dimensional boundary layers that the growth of TSI can be limited by a favorable pressure gradient. For a given pressure distribution the initial growth of CFI becomes stronger with increasing Reynolds number and sweep, and ALT is also more likely. In conditions where the suppression of ALT and CFI in the front region of a wing section can no longer be achieved solely by tailoring the pressure distribution, boundary layer suction can stabilize the laminar flow. Further downstream, the development of TSI can also be limited by suction. With conventional structural concepts, the installation of a suction system in the area of the wing box incurs a certain penalty in weight. To avoid this, boundary layer suction has so far been limited to the wing nose, which usually ends at about 20% of chord, leading to the HLFC concept. Aft of the nose suction area, contour shaping was used to control TSI, and the rules for NLF target pressure distributions were applied.
2.3. Design Studies and Demonstration Tests
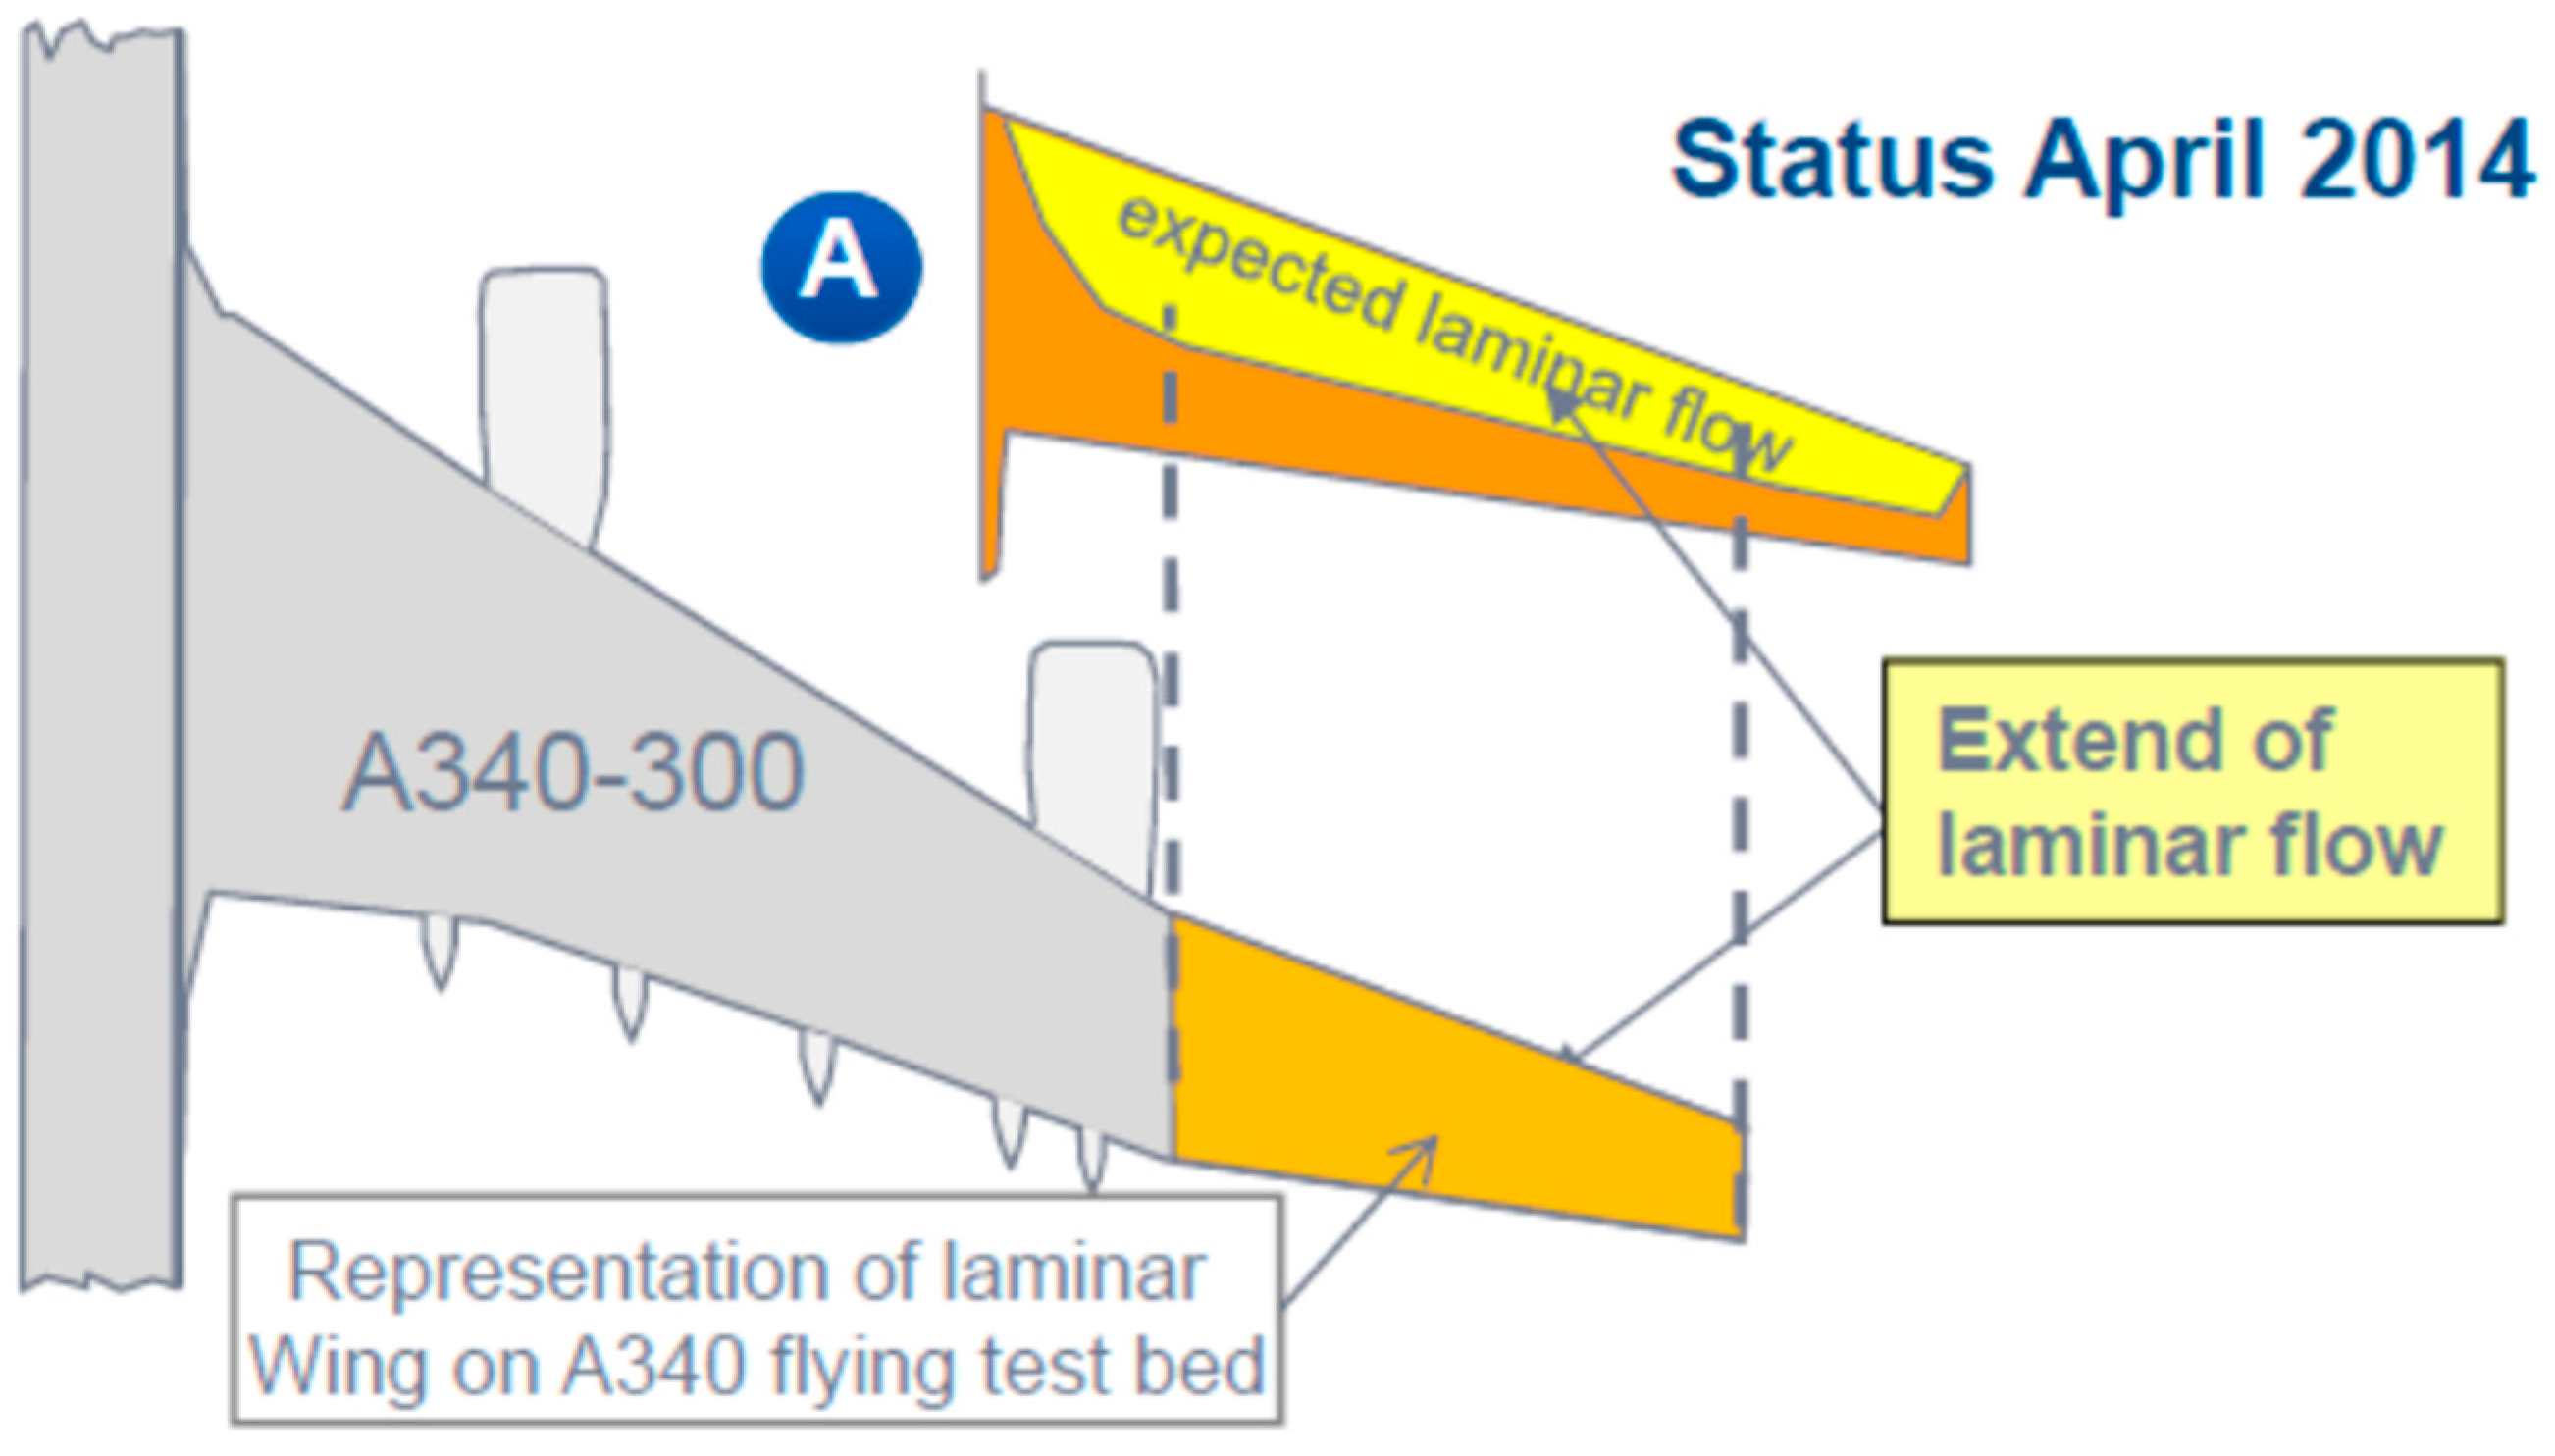
Introduction of laminar technology into series production requires multidisciplinary work on aerodynamics, structural engineering (surface quality in terms of roughness and waviness), production technology (closer tolerances), systems engineering (integration of anti- and de-icing), and even airline operations (maintenance, damage repair etc.). To demonstrate the feasibilty of NLF technology, a more advanced flight test is currently underway within the framework of the EU-funded Clean Sky I projects SFWA (Smart Fixed Wing Aircraft) and BLADE (Breakthrough Laminar Aircraft Demonstrator) [18].
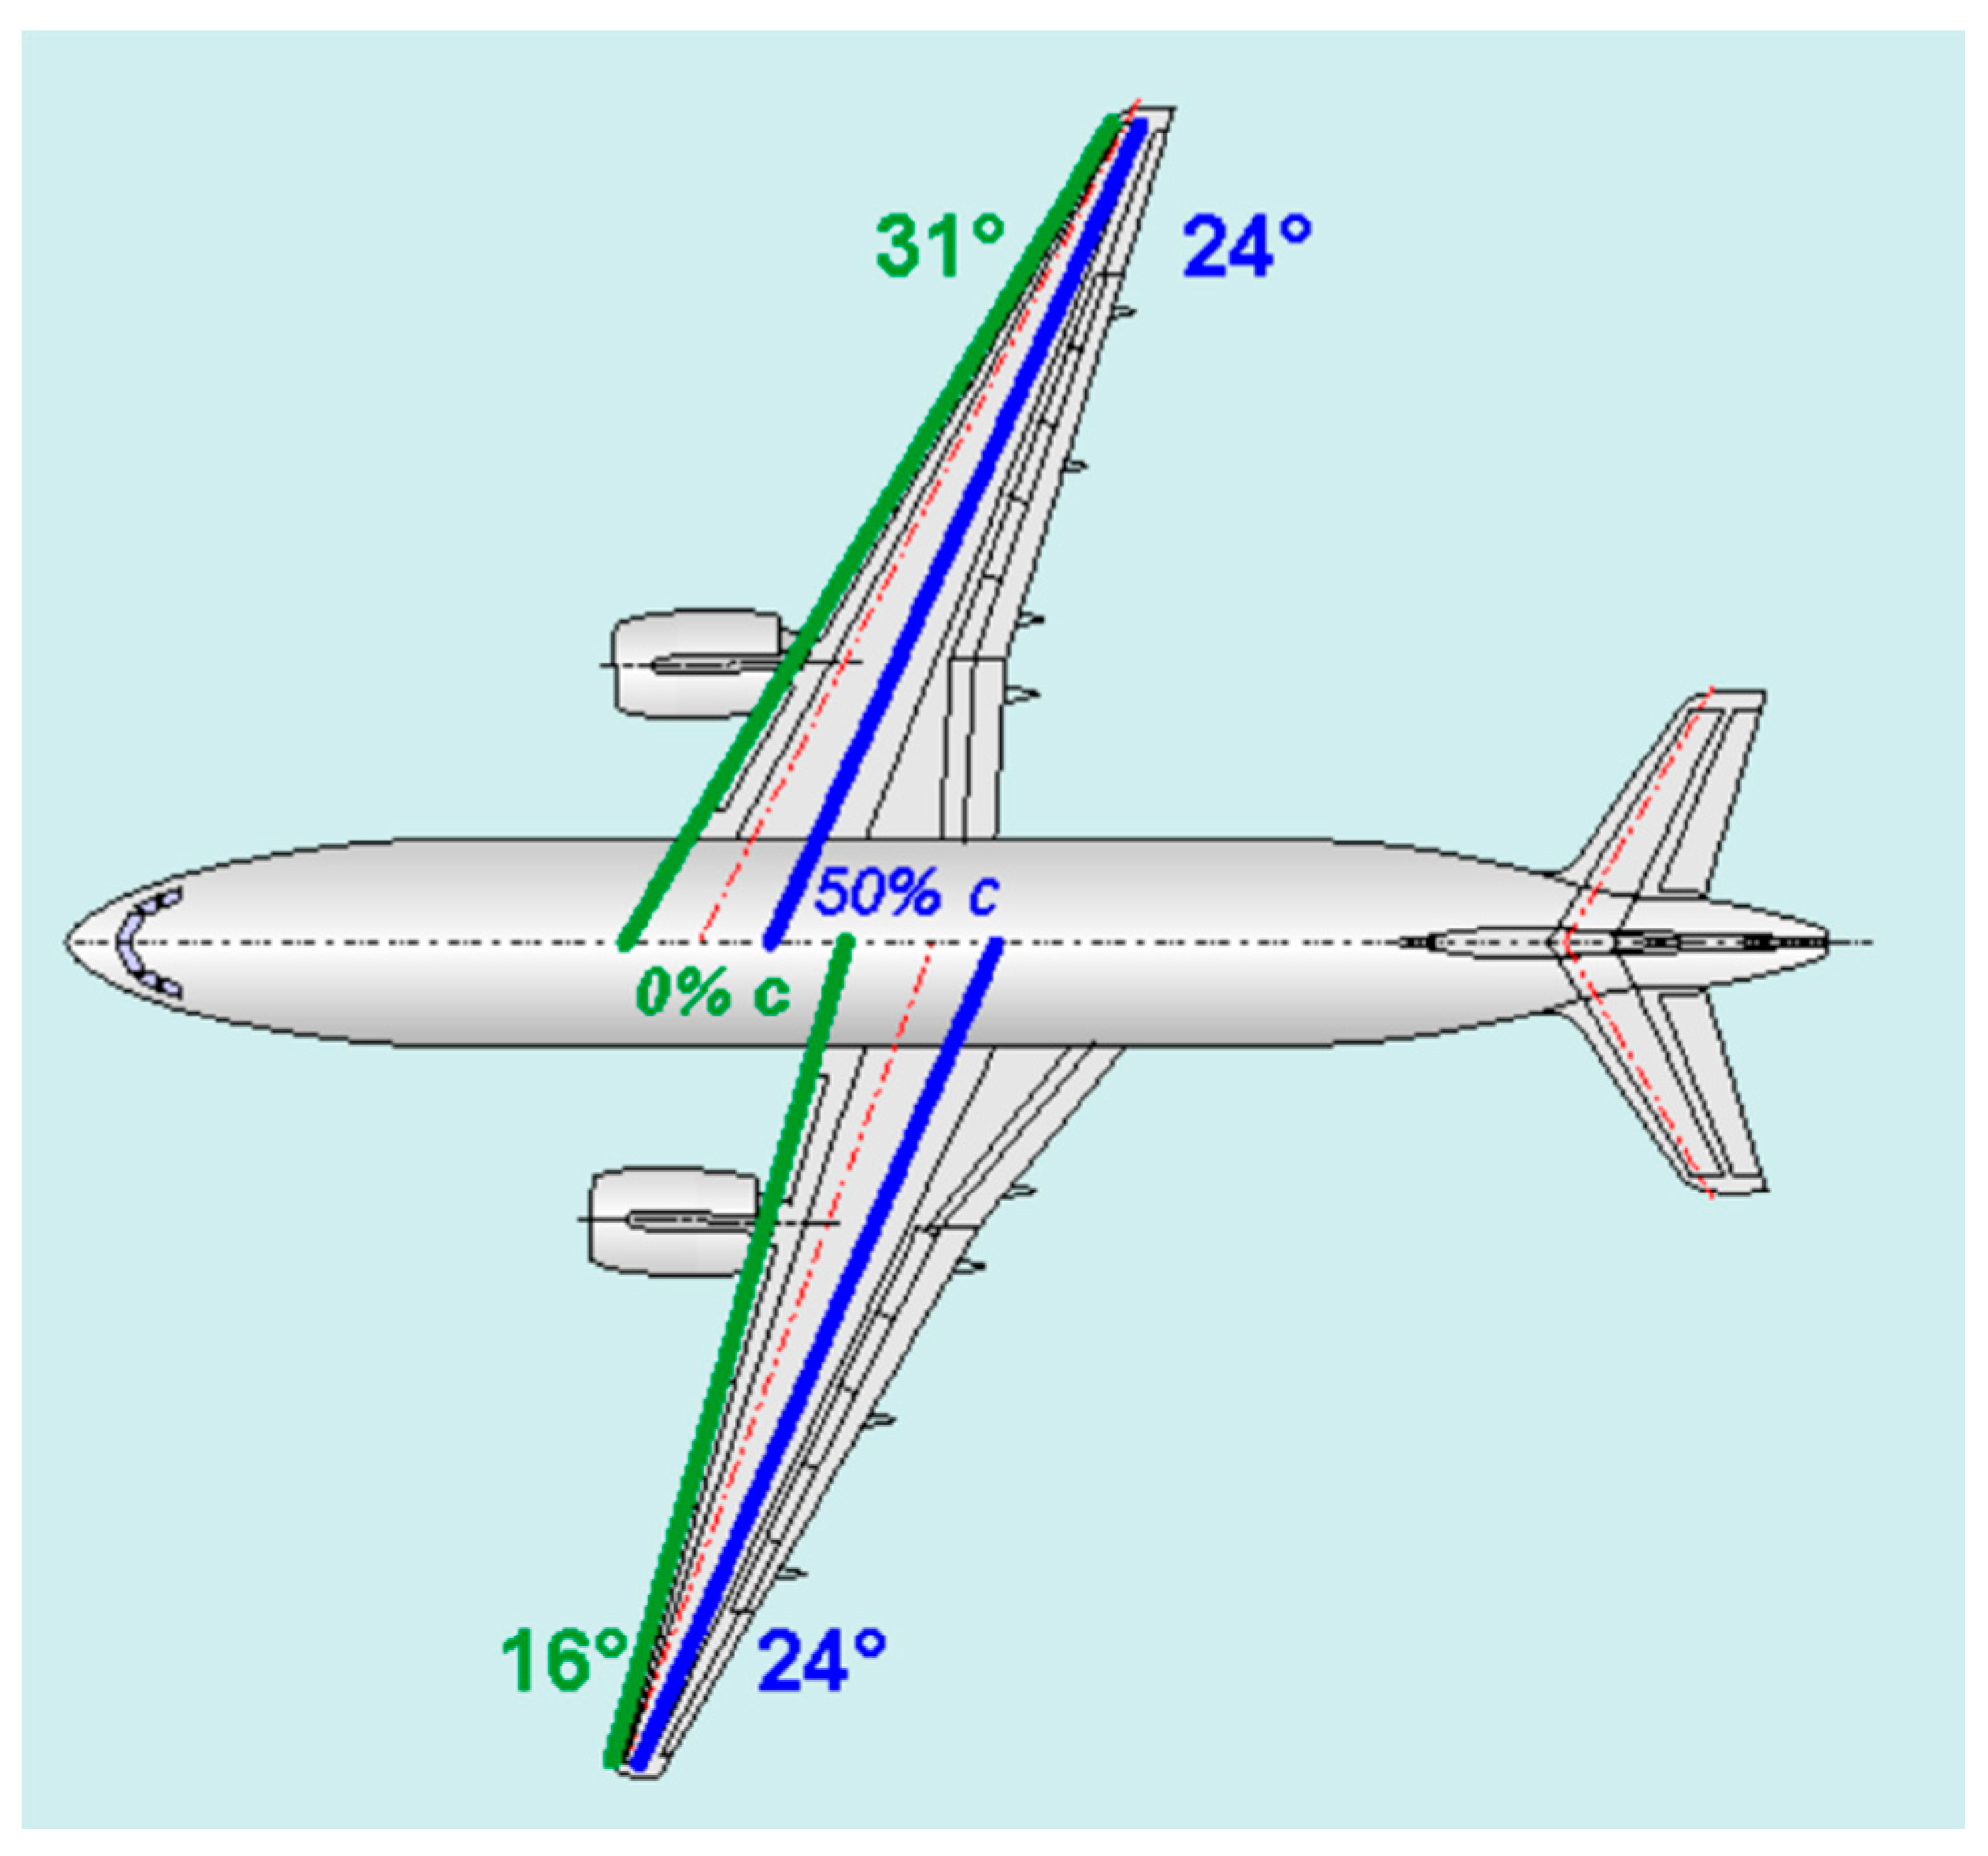
For the BLADE flight tests, the outer wing of an Airbus A340 was exchanged for a new NLF wing with considerably reduced sweep, as shown in Figure 4. In order to control CFI, a leading edge sweep of 20° could not be exceeded. Practically all wings are tapered for the reason of a favorable spanwise loading, and therefore the sweep of constant chord lines and, hence, isobars, in the shock region will even be lower than 20°. As a consequence, with an aft-swept wing, the design Mach number is limited to 0.74 [19] in order to avoid high wave drag. This was the motivation to develop the NLF forward swept wing concept within the DLR project LamAiR [20,21]. The basic idea is that a forward swept wing exhibits an increase of sweep in chordwise direction due to the taper (see Figure 5), thus allowing for cruise Mach numbers ranging from 0.76 to 0.80, like for the Airbus A320. In an aero-structure coupled design, it could be shown that the problem of torsional static divergence that comes along with forward sweep can be resolved by aeroelastic tailoring utilizing the anisotropic characteristics of Carbon Fiber Reinforced Plastics (CFRP).

Figure 4.
BLADE NLF Outer Wing Flight Test [18].
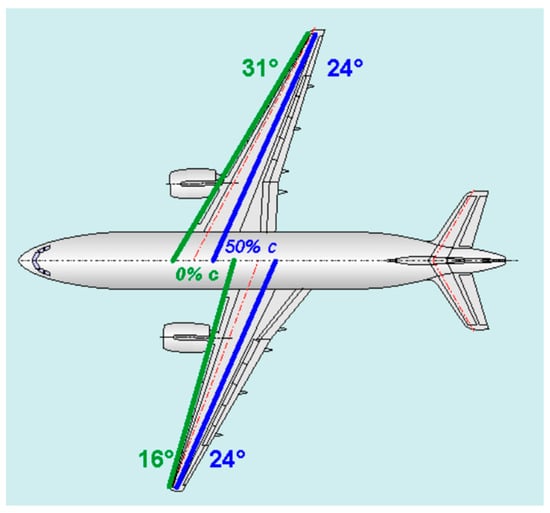
Figure 5.
Effect of Forward Sweep and Taper.
HLFC with active boundary layer suction is based on the NLF concept because the same design rules apply for the required surface pressure distribution. Therefore, the R&D work conducted in Europe since the mid-eighties in this technology path was focused on the suction system. A large scale HLFC demonstration was prepared under leadership of Airbus that resulted in a flight test in 1998 on the vertical tailplane of an Airbus A320 shown in Figure 6. Aerodynamically, the test was a success, because extensive laminar flow was observed, but the system was much too complex for series production. In a subsequent EU funded project, a simplified suction system was elaborated at DLR, called the ALTTA concept [22].
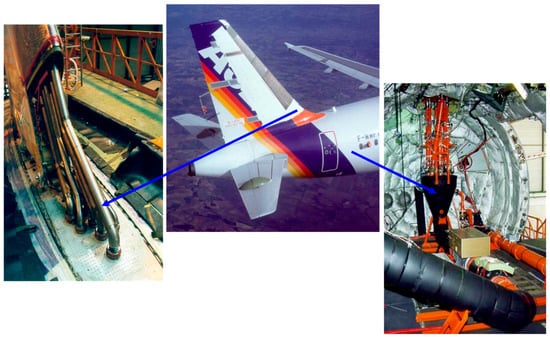
Figure 6.
A320 HLFC Fin Flight Test of 1998.
The ALTTA concept is still state of the art for HLFC system development in Europe. As shown in Figure 7, it consists of:
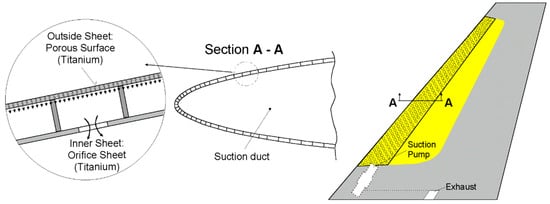
Figure 7.
ALTTA Simplified Suction System.
- A micro-perforated 0.6 to 0.8 mm thick metal sheet, preferable titanium, with standard porosity (i.e., 50 µm hole diameter, equally spaced hole pitch of 500 µm).
- Stringers parallel to constant chord lines that divide the double skin into chambers.
- An inner metal sheet with throttle orifices.
- A plenum with a constant under-pressure.
In each chamber an individual under-pressure is adjusted by the throttle orifices, so that the pressure difference between the outside and the chamber delivers the locally desired amount of mass flow through the surface. It has been shown in experiments that this layout is self-adaptive to a certain range of off-design conditions. Theoretical models have provided first insight into design parameters of the perforated skin, but this knowledge is not yet sufficient to guide possible layout and manufacturing processes. Experience shows that the actual pressure loss characteristics, as a result of a certain laser drilling process, must be determined experimentally [23].
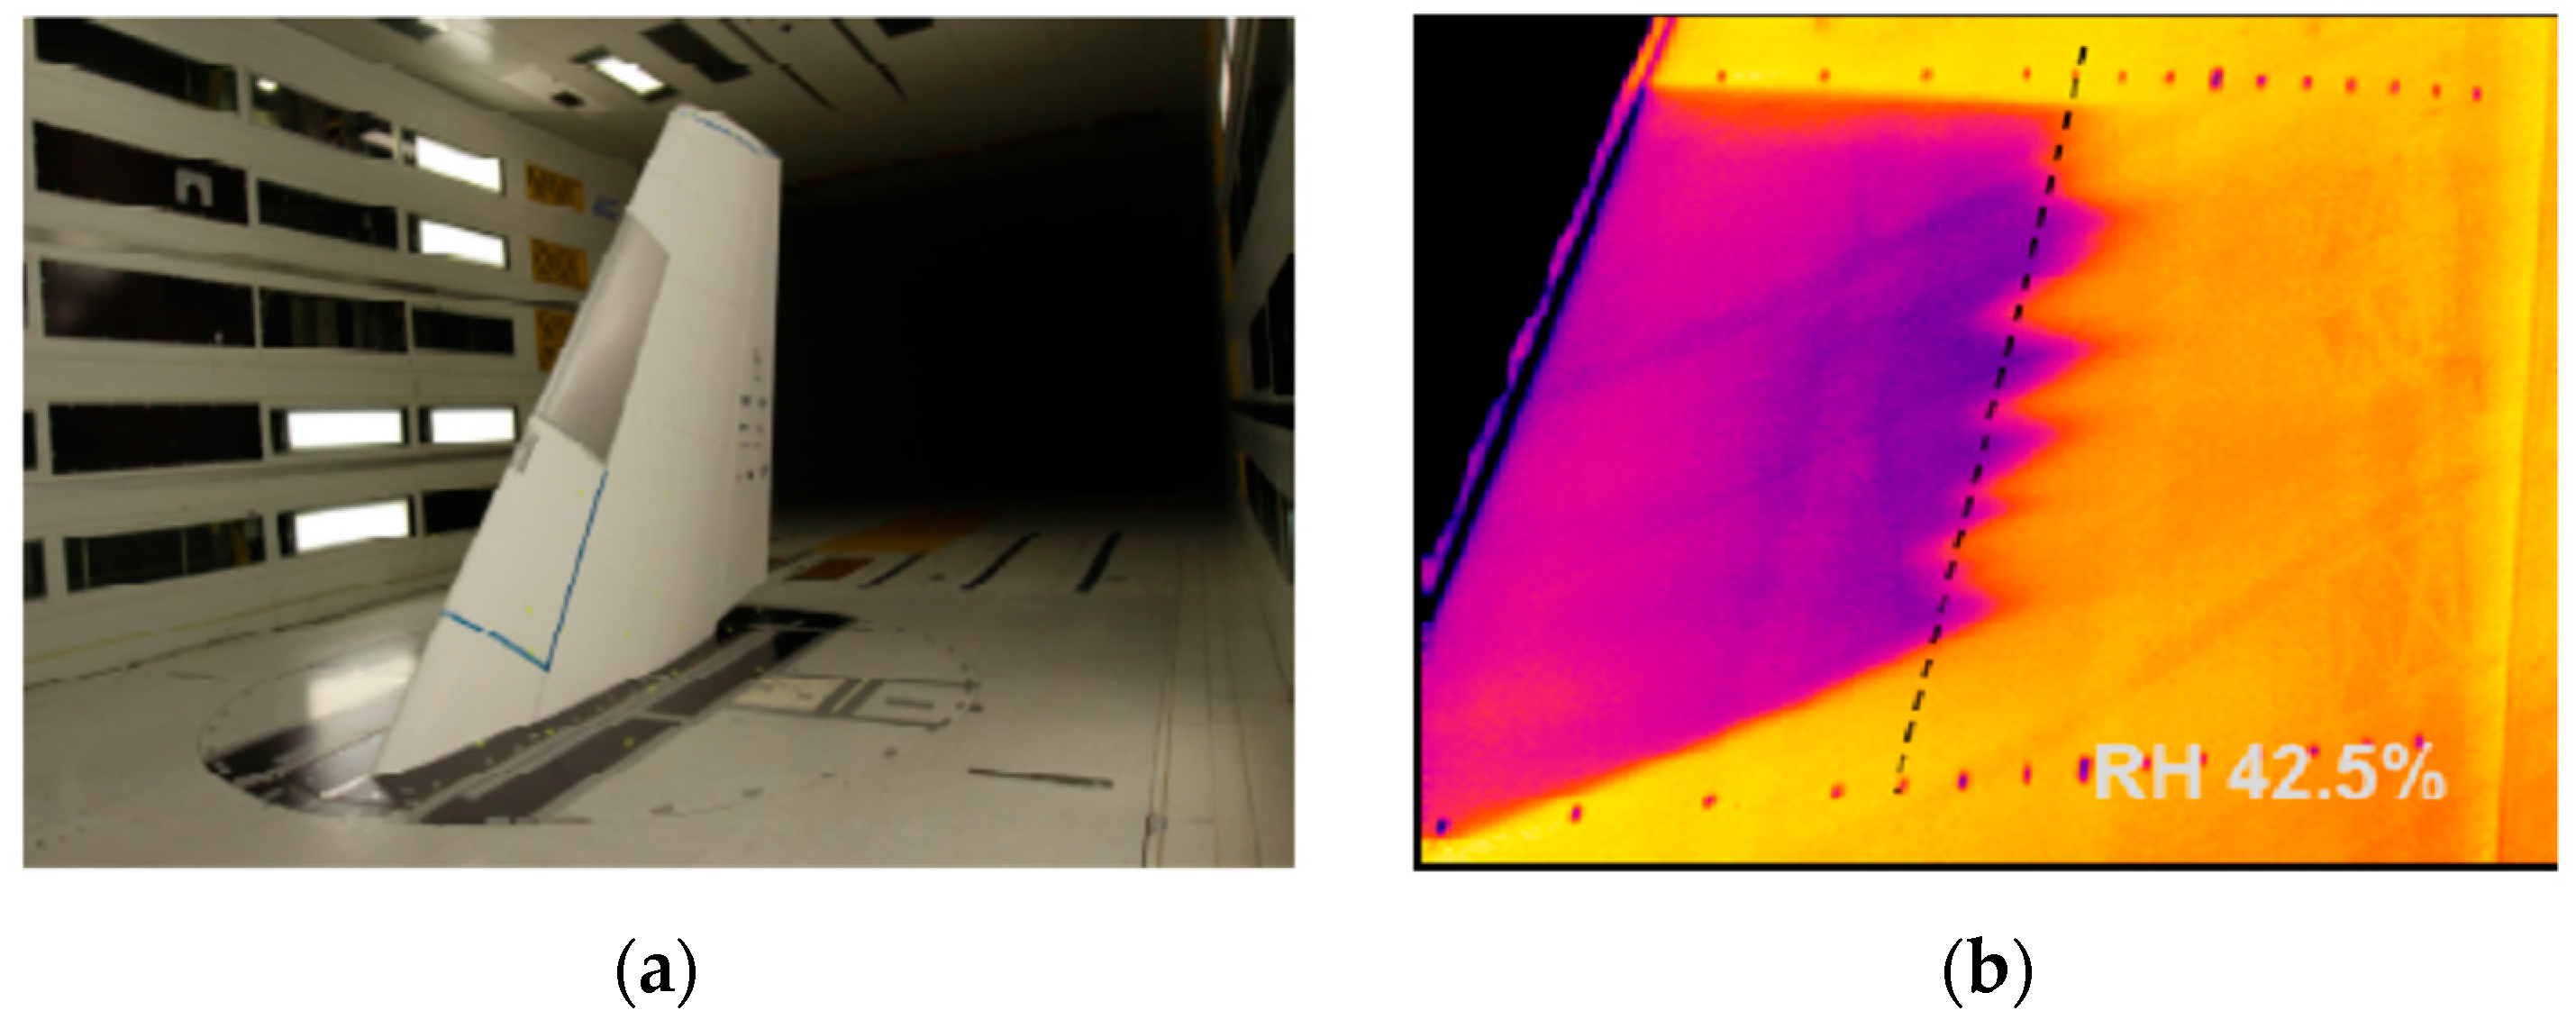
The ALTTA concept was tested in 2014 within the frame of the LuFo IV (Luftfahrt-Forschungsprogramm, German Aeronautical Research Program, part IV) project VER²SUS (Verification of a Simplified Suction System). Again, the target application was the vertical tailplane of the Airbus A320. The test was conducted in the DNW (Deutsch-Niederländische Windkanäle, German-Dutch Windtunnels) Large Low Speed Facility (LLF) in the Netherlands at flight Reynolds numbersIt successfully verified the effectiveness of the concept as well as the design procedures. Figure 8a shows the model mounted in the windtunnel test section. In Figure 8b, the achieved extent of laminar flow, as determined by infrared imaging, is shown in pink. Encouraged by the results of the wind tunnel test, a flight demonstration is currently prepared within the EU project AFloNext.

Figure 8.
Verification of ALTTA concept by Infrared Imaging in Wind Tunnel.
2.4. Outlook and Next Steps
While NLF and HLFC have been examined in great detail, the logical next step is to investigate full chord laminarization by boundary layer suction. In addition, laminarization of the fuselage should be investigated, as the fuselage is also a major contributor to viscous drag. As described above, detailed analysis of the flow on full configurations including transonic effects and the influence of wing sweep induced crossflow on the boundary layer is complex and expensive in terms of scientific work, computational effort and experiments. The large effort for taking this approach to the next level must be justified by a thorough study of potentials, using lower order methods. Assuming that cross flow and attachment line instability can be controlled by passive means as shown in the LamAiR (Laminar Aircraft Research) project, the second part of this paper focusses on controlling 2D Tollmien-Schlichting-instabilites by boundary layer suction on wing sections and the fuselage.
3. Low-Order Methods for 2D Suction Design and Airfoil Analysis
3.1. XFOIL and XFOILSUC
XFOIL is a code for the design and analysis of 2D subsonic airfoils, first released in 1986 by Drela [24]. At the TU Delft Faculty of Aerospace Engineering, several students, in the framework of their master thesis and supervised by Boermans, contributed to the implementation in XFOIL of boundary layer suction for laminarization and van Ingen’s full method for the calculation of transition [12], which is the same method used for the higher-order simulation codes developed by DLR and Airbus.
In 2002, Ferreira implemented boundary layer suction for laminarization as well as van Ingen’s full method for the calculation of transition [25]. The latter implementation was needed because Drela’s envelope method for the calculation of transition was derived for self-similar Falkner-Skan laminar boundary velocity profiles and cannot cope with damping of TS instability. In 2004, R.S.W. Broers extended XFOIL for the design of an initial suction distribution, followed by an iterative fine-tuned suction distribution in order to obtain a boundary layer development with prescribed shape factor [26]. Finally, in 2006, Bongers [27] implemented the improved version of the full method for the calculation of transition, elaborated by van Ingen [28], in XFOIL version 6.93, called from then on XFOILSUC. The improved version offered greater speed and better convergence and calculates damping of the TS waves.
XFOILSUC has been verified by Boermans with the results of detailed boundary layer surveys performed by van Ingen on the upper surface of a NACA 642-A-215 airfoil section in the low speed low turbulence wind tunnel of TU Delft, Faculty of Aerospace Engineering [28]. The program has not yet been released to the scientific community, but was kindly provided by Boermans to TU Braunschweig.
For the studies presented in this paper, the investigated airfoils were discretized with a total of 201 points, resulting in 100 panels on the upper and the bottom side, respectively, which were clustered at the nose to account for the higher gradients of pressure distribution and boundary layer parameters. The improved version of the full method was used for transition prediction for all cases, with and without suction. As there was no need to replicate any wind tunnel test, but rather provide realistic free-flight data, the critical N-factor was set to 13.
3.2. Auxiliary Software
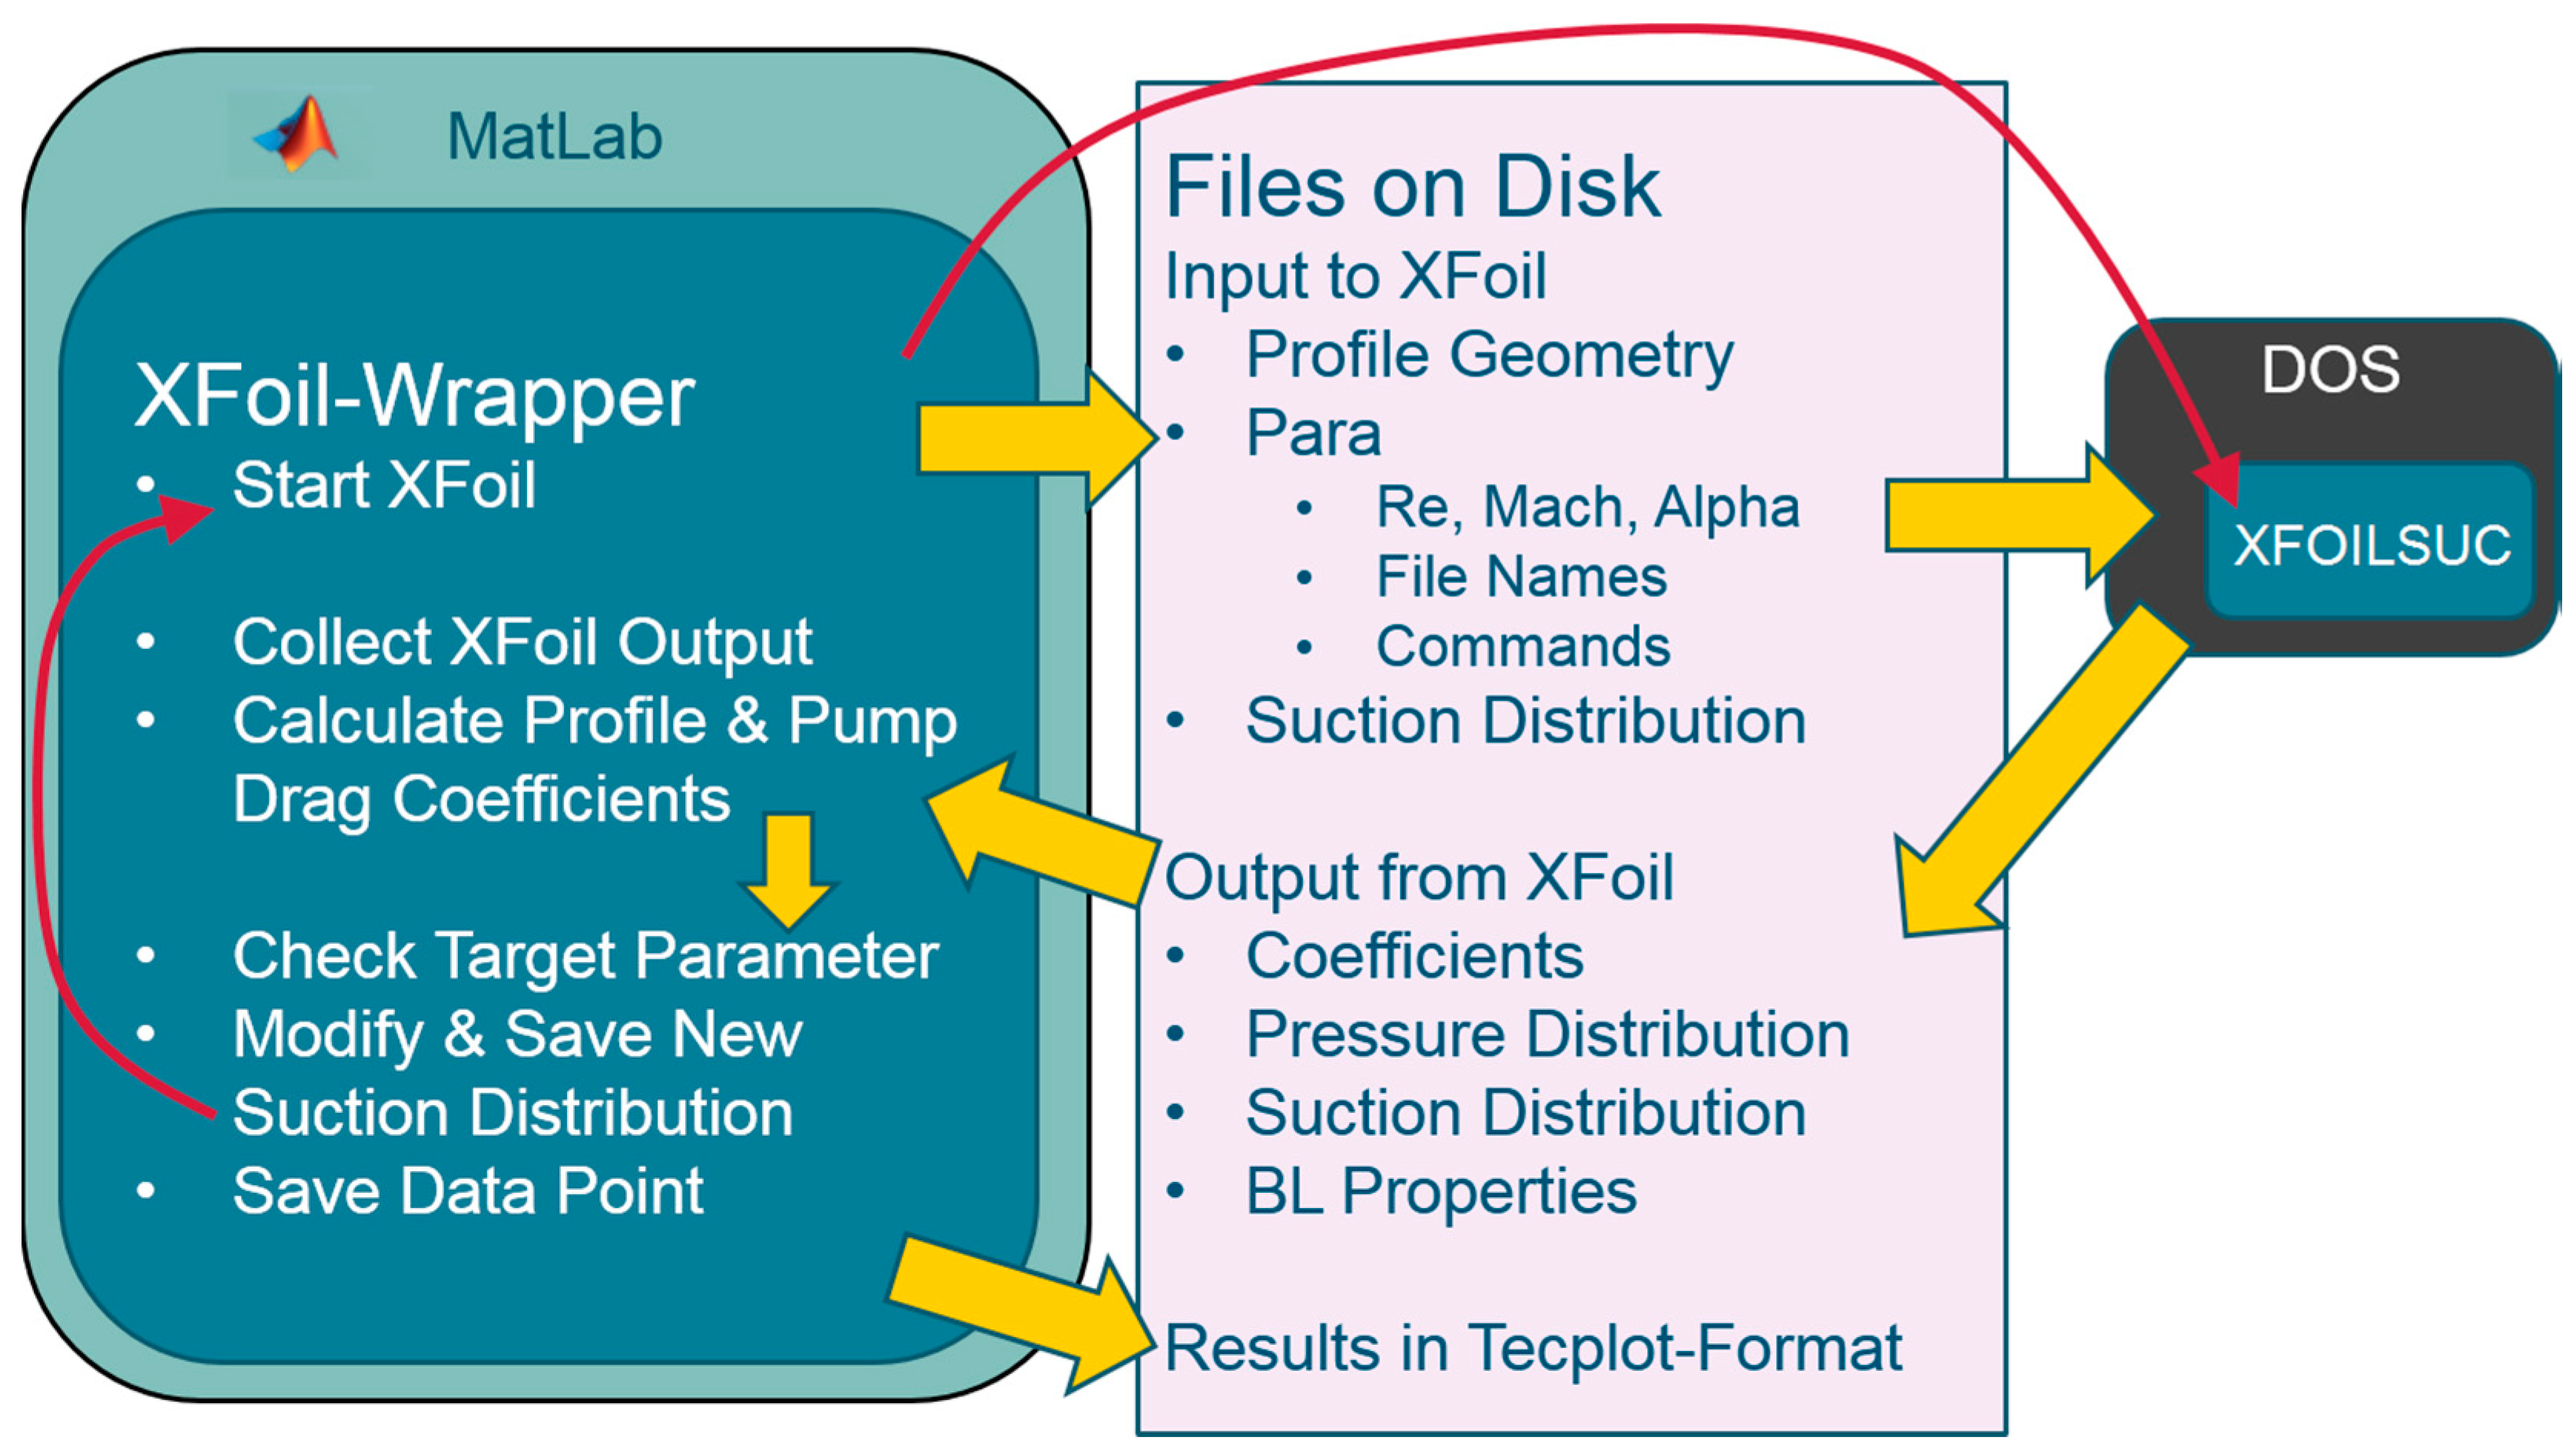
A set of auxiliary programs was written in MatLab at Technical University (TU) Braunschweig for semi-automatic or manual suction design, data handling and calculation of properties, that are not part of the XFOIL dataset, such as the permeability and pressure loss of the suction skin, the pressure of the internal plenums, the data related to the suction pump, and the calculation of total drag as described in Section 4.3. Figure 9 gives an overview of the program structure and the data flow for automatic suction design. Input and output data is saved on disk for every iteration of the suction distribution, allowing an easy re-start if XFOILSUC gets hung up. It also allows to retrieve a case from the data archive to use as a starting point for further design steps.

Figure 9.
XFOILSUC and auxiliary software.
4. Components and Parameters of the LFC System
4.1. General Layout and Components
The main components of a suction system are shown in Figure 10. Air is sucked through the porous skin into a plenum. The plenum pressure has to be lower than the external pressure given by the pressure distribution to overcome the flow resistance of the skin. From the plenum, air is sucked via a system of ducts to a pump, which increases the total pressure of the suction air, before it is expelled from a nozzle at the velocity . To improve efficiency, a suction system may have several segments with different plenum pressures. The system shown here has two plenums, one each for the upper and lower side.
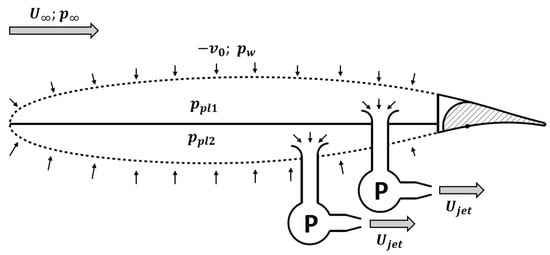
Figure 10.
Components of Suction System.
The key component of the suction system is the porous wing skin. From a purely aerodynamic point of view, the optimum skin would have a continuous and homogenous porosity. Lachmann [29] has used sintered metal and resin-impregnated glass fibre fleece as surface material in wind tunnel experiments, which showed good performance. However, such skin materials cannot carry any structural loads and tend to get clogged with atmospheric dust. The other type of suction skin that has been researched is sheet metal with a large number discrete small holes or slots. Most experimenters in the past have used skins with a uniform grid of suction holes of constant diameter, which results in a constant permeability of the suction skin. The actual suction rate is then a function of the pressure difference across the skin, which in turn depends on the outer pressure distribution and the pressure inside the wing. In order to provide chordwise tailoring of the suction distribution, systems with multiple plenums have been suggested, as well as internal structures with throttling properties [22]. However, with todays’ CNC machining possibilities, including laser beam, electron beam or mechanical drilling, it might even be possible to produce a skin with a chordwise and spanwise variation of hole spacing and hole diameter, so that the suction rate can be optimized locally with just a single or very few plenum chambers with a constant inside pressure. Of course, changes in angle of attack change the outer pressure distribution, so the system must provide a certain level of robustness and versatility (this is looked at in more detail in Section 5).
4.2. Suction & Skin Parameters
Within XFOILSUC, the suction design for a single operating point defined by lift coefficient, Re and Mach number involves only the non-dimensional suction velocity as the design parameter and requires no consideration of the suction skin properties or any internal pressures. However, these are relevant for the assessment of the suction compressor system, it’s power consumption, and the thrust produced by the discharged suction air. In addition, the permeability of the skin is a mechanical feature that does not change, which means that instead the suction distribution changes with the pressure distribution, when or are varied. To calculate such off-design cases, it is also necessary to include the skin properties in the design chain.
The porosity is the fraction of flow-through area, i.e., the cross-sectional area of holes or slits per unit of skin area. If is the mean flow velocity inside the suction holes, then the nominal suction velocity becomes , which is identical to the volume flow per unit skin area. The direction of is defined positive in direction of the surface normal vector and consequently, is negative when suction is applied. The nondimensional volumetric suction coefficient is the total volume flow through the skin, , divided by reference area and free stream velocity. It can also be obtained by integrating the nondimensional suction velocity along the 2D profile contour (Equation (1). The contour coordinate runs from the trailing edge along the upper side of the airfoil to the nose and then back to the rear end along the bottom side (Figure 11):
Figure 11.
Airfoil Contour Cordinate System.
Figure 12 gives an overview of the most important pressure definitions. is the wall pressure distribution created by the external flow, nondimensionalized by the free stream dynamic pressure:
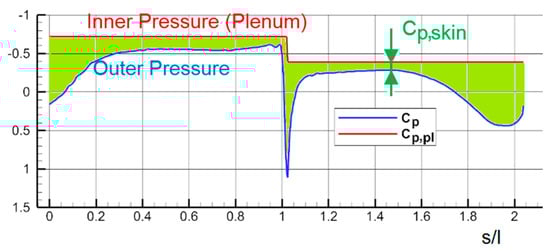
Figure 12.
cp, cp,pl & cp,skin.
To obtain the skin pressure coefficient , the pressure drop across the suction skin is also made dimensionless with free stream dynamic pressure:
The plenum pressure coefficient is defined similarly to the wall pressure coefficient, except that the pressure inside the suction plenum is used. The pressure coefficient can be positive or negative, depending on the pressure distribution on the profile. When suction is applied, is always less than the minimum , and in consequence, , though not constant, is always negative:
The plenum pressure coefficient for each plenum segment is found by inserting the maximum (the least negative) and the minimum for that segment into Equation (4). The minimum is taken from the pressure distribution, while the maximum must be defined by setting the minimum absolute skin pressure loss. Several researchers have attempted to derive the flow resistance of a suction skin as a function of geometrical and flow parameters, either from first principles or experimental data, but invariably without success [23]. While the main driver is known to be the porosity, too many other parameters were found to be of relevance, some of which can not be properly measured or reproduced during manufacturing. For the purpose of this paper, a simple relationship typical for problems of internal flow is assumed, in which the pressure drop is proportional to the dynamic pressure of the suction velocity, , and a pressure loss coefficient :
By defining the skin permeability as the inverse of the pressure loss coefficient, we can express the suction velocity as function of the skin pressure drop, the wall density, and the permeability:
The pressure differential is expressed by the skin pressure coefficient and free stream dynamic pressure:
Combining Equations (5) and (6) and some rearrangement results in the nondimensional suction velocity and eliminates from the right hand side of the equation:
The wall density ratio is equal to the pressure ratio multiplied by the inverse of the temperature ratio, which can both be expressed as functions of Mach number and wall pressure coefficient using basic gas dynamic relationships for boundary layers [3,30]:
Inserting the densitiy ratio given by Equation (7) leads to an expression for the nondimensional suction velocity containing only quantities known from XFOIL output, and the skin permeability distribution:
By solving Equation (8) for , we can extract the permeability distribution of the skin from a given case, which in turn allows us to compute the suction velocity distribution for other operating points.
4.3. Drag and Thrust Bookkeeping
The 2D profile drag is the sum of all forces parallel to free stream velocity caused by external pressure and wall shear stress. It can be determined by integrating pressure and shear stress over the profile contour. Another classical approach to profile drag identification is to integrate the momentum deficit in the wake of the profile. The underlying assumption is that any portion of air influenced by the airfoil also passes through the wake plane, which is not true if the boundary layer is partially sucked into the wing. For airfoils with suction, the remaining wake drag is only a small portion of the total drag. It can be shown by momentum analysis that the profile drag is equal to the sum of the wake drag and the momentum intake of the suction system [26], which in turn can be shown to be exactly twice the suction coefficient :
As can be seen from this equation, the amount of suction should be kept as low as possible, just enough to ensure laminar flow. Any additional suction will not reduce drag further, but leads to increased profile drag. The drag that has to be overcome by engine thrust is the profile drag minus the thrust produced by the jet thrust of the expelled suction air. In terms of total energy, the aircraft power system also has to deliver the power to drive the suction compressor. We therefore define a total drag coefficient , on which calculations of drag savings in this paper will be based:
The pressure difference that must be overcome by the suction pump has four components:
- Difference of local static pressure on outer contour to ;
- Flow resistance through porous skin;
- Flow resistance through ducting;
- Dynamic pressure of discharge velocity.
Components #2 and #3 can be small for a well-designed suction system, component #1 depends on the body geometry and the angle of attack. If the suction air is simply spilled overboard at a negligible discharge velocity, the #4 component is zero. The pressure components can be made dimensionless by introducing pressure coefficients. The first component is simply the wall pressure coefficient defined in Equation (2), the second is the skin pressure coefficient defined in Equation (3), and their sum is the plenum pressure coefficient defined in Equation (4). This simplifies the calculation of pump power, as is constant per segment of the suction system. The flow resistance of the ducting from the plenum to the pump is expressed by the duct pressure loss coefficient , which depends on the design of the ducting and the mass flow. As the internal design of the LFC system is beyond the scope of this paper, is also assumed to be a constant. The pressure at the pump inlet then becomes:
The temperature at the pump inlet is identical to the outer skin temperature, as the skin and the duct can be considered adiabatic throttling devices. Two outlet properties, the static pressure and the jet velocity , are given. For the dynamic pressure component, the density must be determined from static pressure and the pump outlet temperature, which is a function of the pressure ratio and the pump efficiency. The correct values are determined by iterative calculations, and the final compressor power is equal to the change in specific enthalpy of the suction air multiplied by the mass flow. In incompressible flow, the mass flow could be calculated from and free stream quantities. However, for compressible flows, is not proportional to volumetric , and we need to define a mass flow dependent suction coefficient. Using the previously defined wall densitiy ratio, , this can also be calculated from non-dimensional 2D quantities, analogous to Equation (1):
Dividing pump power by flight speed results in the equivalent compressor drag , which can be converted to a nondimensional compressor drag coefficient:
Finally, the jet of expelled suction air produces thrust, which is expressed by the thrust coefficient:
Obviously, compressor power and jet thrust both increase with jet velocity. If the design goal is to minimize pump power, the jet velocity should be kept as low as possible, while the optimum from a total energy point of view is found by minimizing . It can be shown that the optimum discharge velocity is equal to flight velocity for = 1 and decreases with compressor efficiency. The jet thrust is generated with very high propulsive efficiencies (, because the inlet momentum or sink drag is already contained in the profile drag. Correct matching of the jet velocity to the compressor efficiency is important for the overall system efficiency. For the calculation of pump drag and suction air jet thrust, a compressor efficiency of was assumed and the jet velocity set to . These rather conservative values are similar to those reported for the Northrop X-21, the only large jet plane with full chord LFC flown [31]. The minimum skin pressure loss coeffcient and the duct pressure loss coefficient were both set to a value of 0.1.
4.4. Strategies for Suction Design
For very simple cases such as the flat plate at zero incidence, theoretical solutions exist for suction velocities and shape factors that will ensure laminar flow in incompressible flow. For real world cases with varying pressure gradients, high Reynolds numbers and compressability effects, suction designs must be made by iteratively running the boundary layer solver, checking the solution and adaptation of the suction where certain target values are not met. As the primary objective is the transition location, one could start out with a small constant suction and simply scale it up until the target transition location is achieved. However, this would lead to oversucking on much of the wing surface, which results in unwanted additional skin friction and can even cause early transition rather than delaying it. As the local shape factor H12, which is the ratio of the displacement thickness to the momentum thickness, has been shown to be a good design parameter for suction design, the method used for automatic suction design was to increase or decrease suction locally, depending on wether the shape factor was under or over target. Because the boundary layer flow at a given location is a result of the flow “history”, rather than just the suction at that point, back stepping of the suction adaptation is necessary. Applying moving average smoothing to both the shape factor and the adapted suction distribution provided sufficient chordwise propagation and also proved helpful in damping out numerical oscillations. For flat plates in incompressible natural laminar flow, H12 is known to be 2.6, and this has been successfully used as the target value for the suction design of sailplane wing sections, which operate at low speeds. H12 must be kept below 2.6 for higher Reynolds numbers in incompressible flow, while higher Mach numbers provide damping of the TS waves, which permits running higher shape factors, in excess of 3, without unwanted transition. For cases with both, high Reynolds and Mach numbers, a varying target shape factor was used for some cases, decreasing linearly from LE to TE. It was also tried to use the N-factor calculated by XFOILSUCs transition prediction module as target parameter, the idea being that a steady increase towards the TE might lead to a good suction design. However, the N-factor turned out to be too sensitive to small changes in suction for use in an automated design routine. For some cases, where no good solution could be found by automatic design, the suction was adapted manually. It must be pointed out that neither the perfect target criterion nor its optimum value have been reliably identified and that further research on this subject is necessary.
5. Results for a Supercritical Airfoil
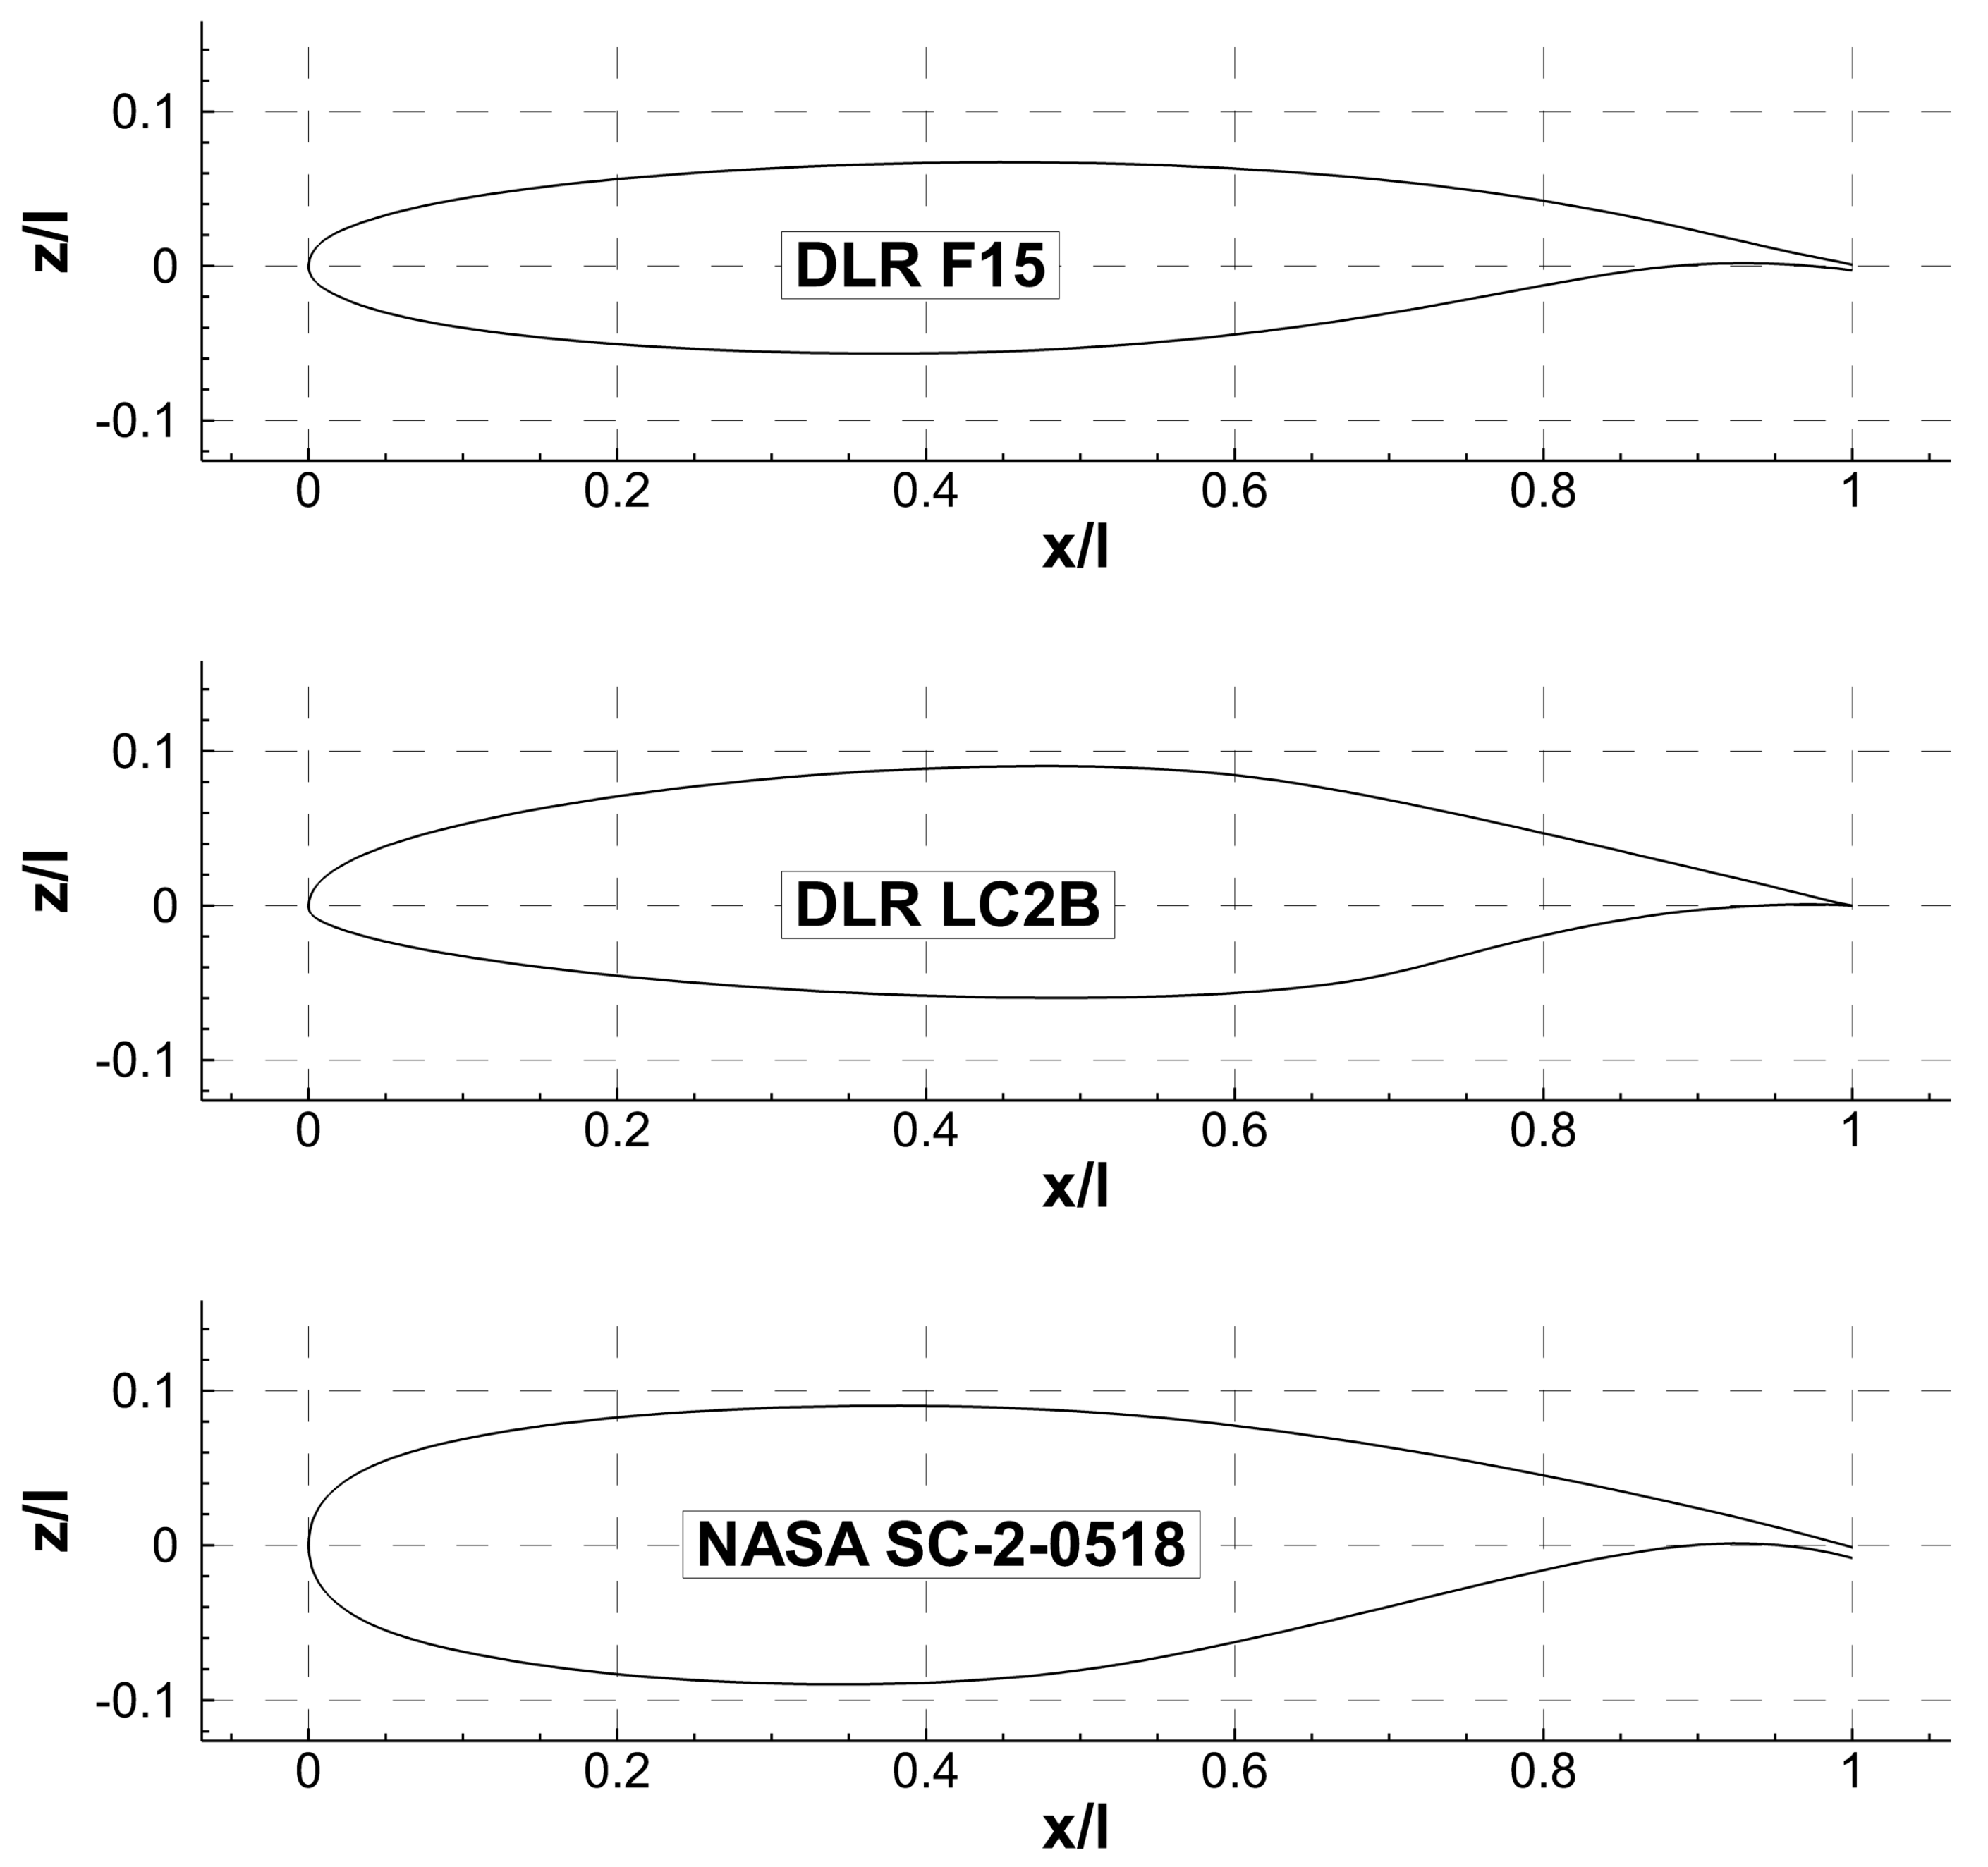
The effect of boundary layer suction shall be demonstrated for the example of the DLR F15 (see Figure 13), which is a generic supercritical airfoil developed during the FNG project [32]. Although this airfoil was not designed for laminar flow, and no modifications to the shape were made, it shows a certain extent of natural laminar flow in 2D calculations, as can be seen from the jump in the skin friction coefficient shown in Figure 14. At Mach 0.7, a Reynolds number of 30 million and , natural transition (NT) occurs around 5% chord length on the upper side, while the lower surface stays laminar almost up to 50%. With suction (LFC) up to 80% of chord length, the transition is delayed to 85% on both sides. Also shown in Figure 14 are the amplification factor, , and the shape factor, , together with the applied non-dimensional suction velocity, , and the necessary permeability, , for the same operating point, which is typical of cruise conditions for a midrange jet aircraft or regional turboprop.
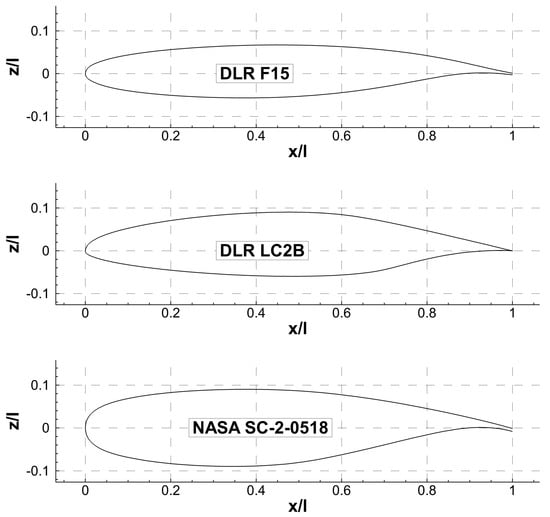
Figure 13.
Investigated Airfoils.
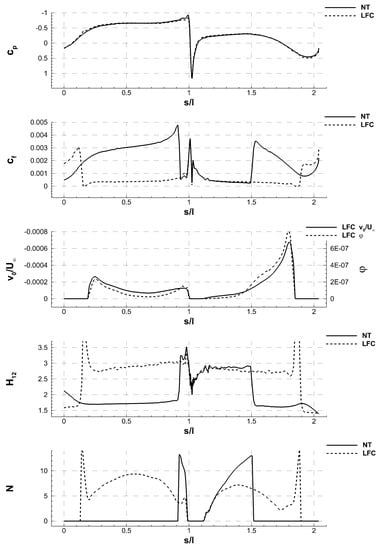
Figure 14.
Boundary Layer and Suction Parameters; DLR-F15; .
For off-design operating points, the performance and boundary layer data must be computed in three steps. First, the skin permeability, given implicitly by the suction and pressure distribution, is extracted from the initial design case. The pressure distribution is obtained by running the new case with the old suction velocity distribution through XFOILSUC. The upper and lower plenum pressures are adjusted to comply with the maximum —condition, and the new suction velocities are determined using Equation (8), before the case is re-run in XFOIL to get the final solution. When this is done for an angle-of-attack-sequence, a -polar can be plotted.Two examples are shown in Figure 15, for permeabilites designed at = 0.4 and 0.6. The polars have the typical shape of NLF profiles at lower Reynolds numbers, with a pronounced laminar bucket covering a certain span of lift coefficients around the design point. The laminar bucket can be extended by lowering the plenum pressure and thus increasing the suction, as can be seen in the dashed curve, for which the minimum skin pressure loss was increased from to . It can also be seen that for lift coefficients above the laminar bucket, drag increases quickly and even surpasses that of the unsucked base airfoil, which is due to the increased skin friction induced by the now obsolete suction. The data for the natural transition reference are represented by the dash-dotted line, while the solid black line is the minimum drag envelope obtained by adjusting the permeability for each individual operating point.
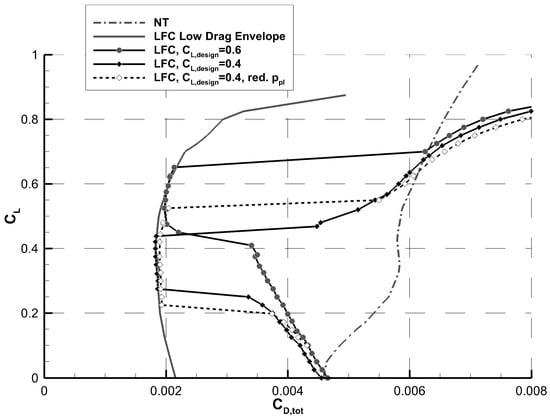
Figure 15.
Polars with fixed and adjusted permeability; DLR-F15; .
One of the questions that arise when designing suction systems is what portion of the wing chord should be sucked. Extension of the suction area will of course increase the technical complexity and the weight and power consumption of the suction system, which have to be compensated by the drag saved.
In Figure 16, a variation of the suction length for the DLR F15 and the resulting drag components are shown. As can be seen in Figure 16a, both the profile and the total drag decrease over the entire interval, which means the increase in pump drag is more than compensated by the decrease in profile drag up to the maximum suction length. In Figure 16b, the relative drag reduction is shown, along with the ratio of drag reduction and resulting pump drag. In conclusion, the suction length is only limited by technical feasibility of the suction system integration. As provision must be made for trailing edge movables for lateral control and high lift, it was decided to limit suction to 80% of chord length for the investigations in this paper, which results in transition at approximately 85% on both sides.
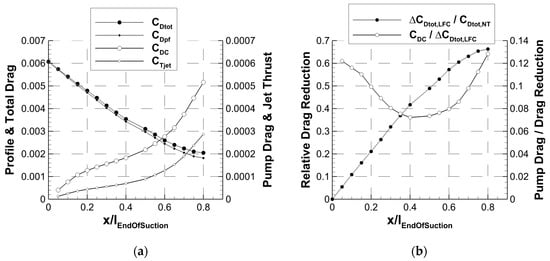
Figure 16.
Variation of suction length; DLR-F15; .
Profile drag in general depends on Reynolds and Mach number, which remains true for airfoils with laminar flow control, where also the necessary suction to prevent transition changes. As can be seen in the left graph in Figure 17, in the interval between Re = 10–40 million, the profile drag of the unsucked supercritical airfoil stays almost constant. The reason for this is the mutual compensation of two effects: Skin friction for either laminar or turbulent boundary layer decreases, while at the same time, the transition location on the lower side moves forward, increasing the portion of the airfoil that has a turbulent boundary layer. For the LFC cases, the transition position does not move, and hence, the profile drag decreases with Re. The amount of suction air, as well as the pump power, decrease as well. The right hand graph in Figure 17 shows the influence of Mach number for . The profile drag stays nearly constant up to a Mach number of 0.6, beyond which a significant drag rise can be observed, both with and without suction. The suction requirements and the pump drag also increase with Mach numbers above 0.6.

Figure 17.
DLR F15, Sensitivity to (a) Reynolds and (b) Mach number.
6. Results for NLF- and BWB-Airfoils
In the previous section, total drag reduction by a factor of three was shown on a supercritical airfoil which normally is mostly turbulent. Airfoils designed for natural laminar flow employ extended areas with negative pressure gradients in the front part to keep the flow laminar on both sides without suction, followed by a short and strong pressure rise on the rear part, which causes immediate transition. The low drag characteristics are only achieved for a limited window around the design lift coefficient. Below or above the so-called laminar bucket, transition moves forward on at least one side of the airfoil, causing drag coefficients similar to those of fully turbulent wing section.
The DLR-LC2B also shown in Figure 13 is a NLF airfoil originally developed for use on commuter planes. To investigate the potential for further drag reduction, suction was applied to the region behind the pressure minimum. The laminar flow length could be extended almost to the trailing edge, inducing a relative drag reduction on the order of 40%. Compared to the supercritical airfoil with suction, the resulting total drag is lower by 16%. The lowest values observed were for the total drag coefficient. Outside the laminar bucket, a sharp suction peak builds up at the leading edge, causing instant transition that requires additional suction at the nose to suppress, which explains the jump in near the upper and lower limits of the laminar region, as shown in Figure 18.
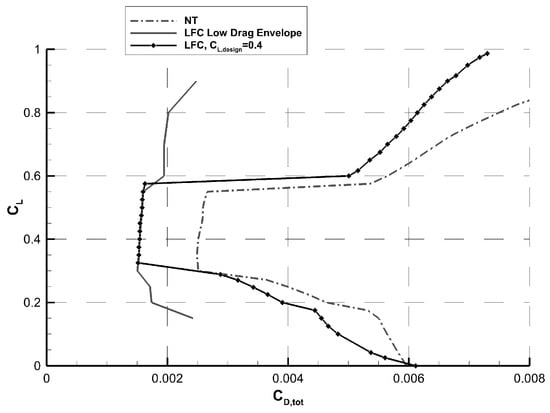
Figure 18.
Effect of additional suction on a NLF airfoil; DLR LC2B; .
While the minimum thickness of wing sections is limited by strength and weight consideration, blended wing body (BWB) configurations require airfoils also optimized for internal volume. One example is the NASA SC(2)-0518, also shown in Figure 13, that was used by Lyu and Martins [33] for the center section in their study of a BWB configuration. It features a very blunt nose and a high thickness-to-cord ratio of 18%, resulting in a fairly high profile drag coefficient between 0.007 and 0.008 for Re = 30 million and Ma = 0.7, shown by the dash-dotted curve in Figure 19. Application of suction can reduce the total drag coefficient to just above 0.003, which is larger than the minimum drag coefficient found for the much thinner supercritical and NLF airfoils, but represents a reduction of 60% compared to the turbulent base airfoil. These numbers must be treated with some care, as most BWB configurations presented today have strong leading edge sweep and higher Reynolds numbers than those examined here. Nevertheless, the application of BL suction to very thick profiles promises significant drag reductions and is surely worth a closer look, using more sophisticated simulation tools.
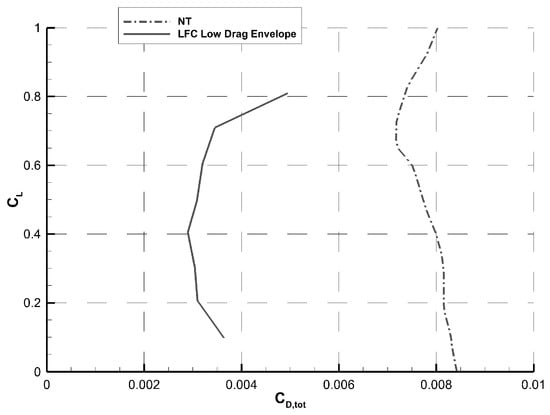
Figure 19.
Effect of Suction on a high-thickness BWB airfoil; NASA SC(2)-0518; .
7. Application of Suction to Fuselages
7.1. Design of Fuselage Suction
Natural laminar flow on the front 30% of a business jet fuselage has been investigated by Holmes et al. [34], and potential AC level drag savings of 7% were reported. However, the much larger Reynolds numbers of passenger planes make significant NLF impossible. Active fuselage laminarization has been suggested by Lachmann [29], including re-laminarization behind a turbulent cockpit section by complete boundary layer removal, as early as 1962, and later by Pfenninger [35] in 1987. Of course, suction on a fuselage skin poses a number of technical challenges. While windows can in theory be replaced by artificial vision using cameras and monitors, some doors and hatches will always be required. However, these problems may be overcome by minimizing gaps and steps and installation of suction skin on door panels. As the aim of this paper is an all-out effort to reduce drag by laminar flow control, the potential of fuselage suction is investigated on an isolated simplified fuselage body. The geometry was derived from the LamAiR [20] configuration mentioned in Section 2.3, which is very similar to the fuselage shape of the Airbus A320. The waist line was projected onto the XY-Plane, and an axisymmetric body of revolution was generated from the resulting 2D-curve, shown in Figure 20.
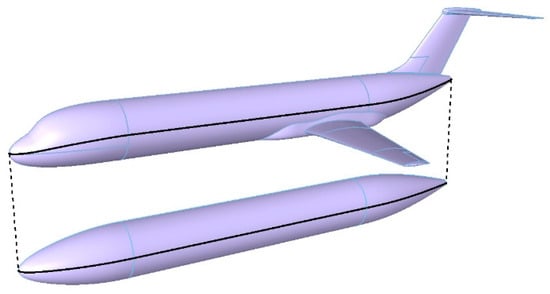
Figure 20.
LamAiR Fuselage Geometry.
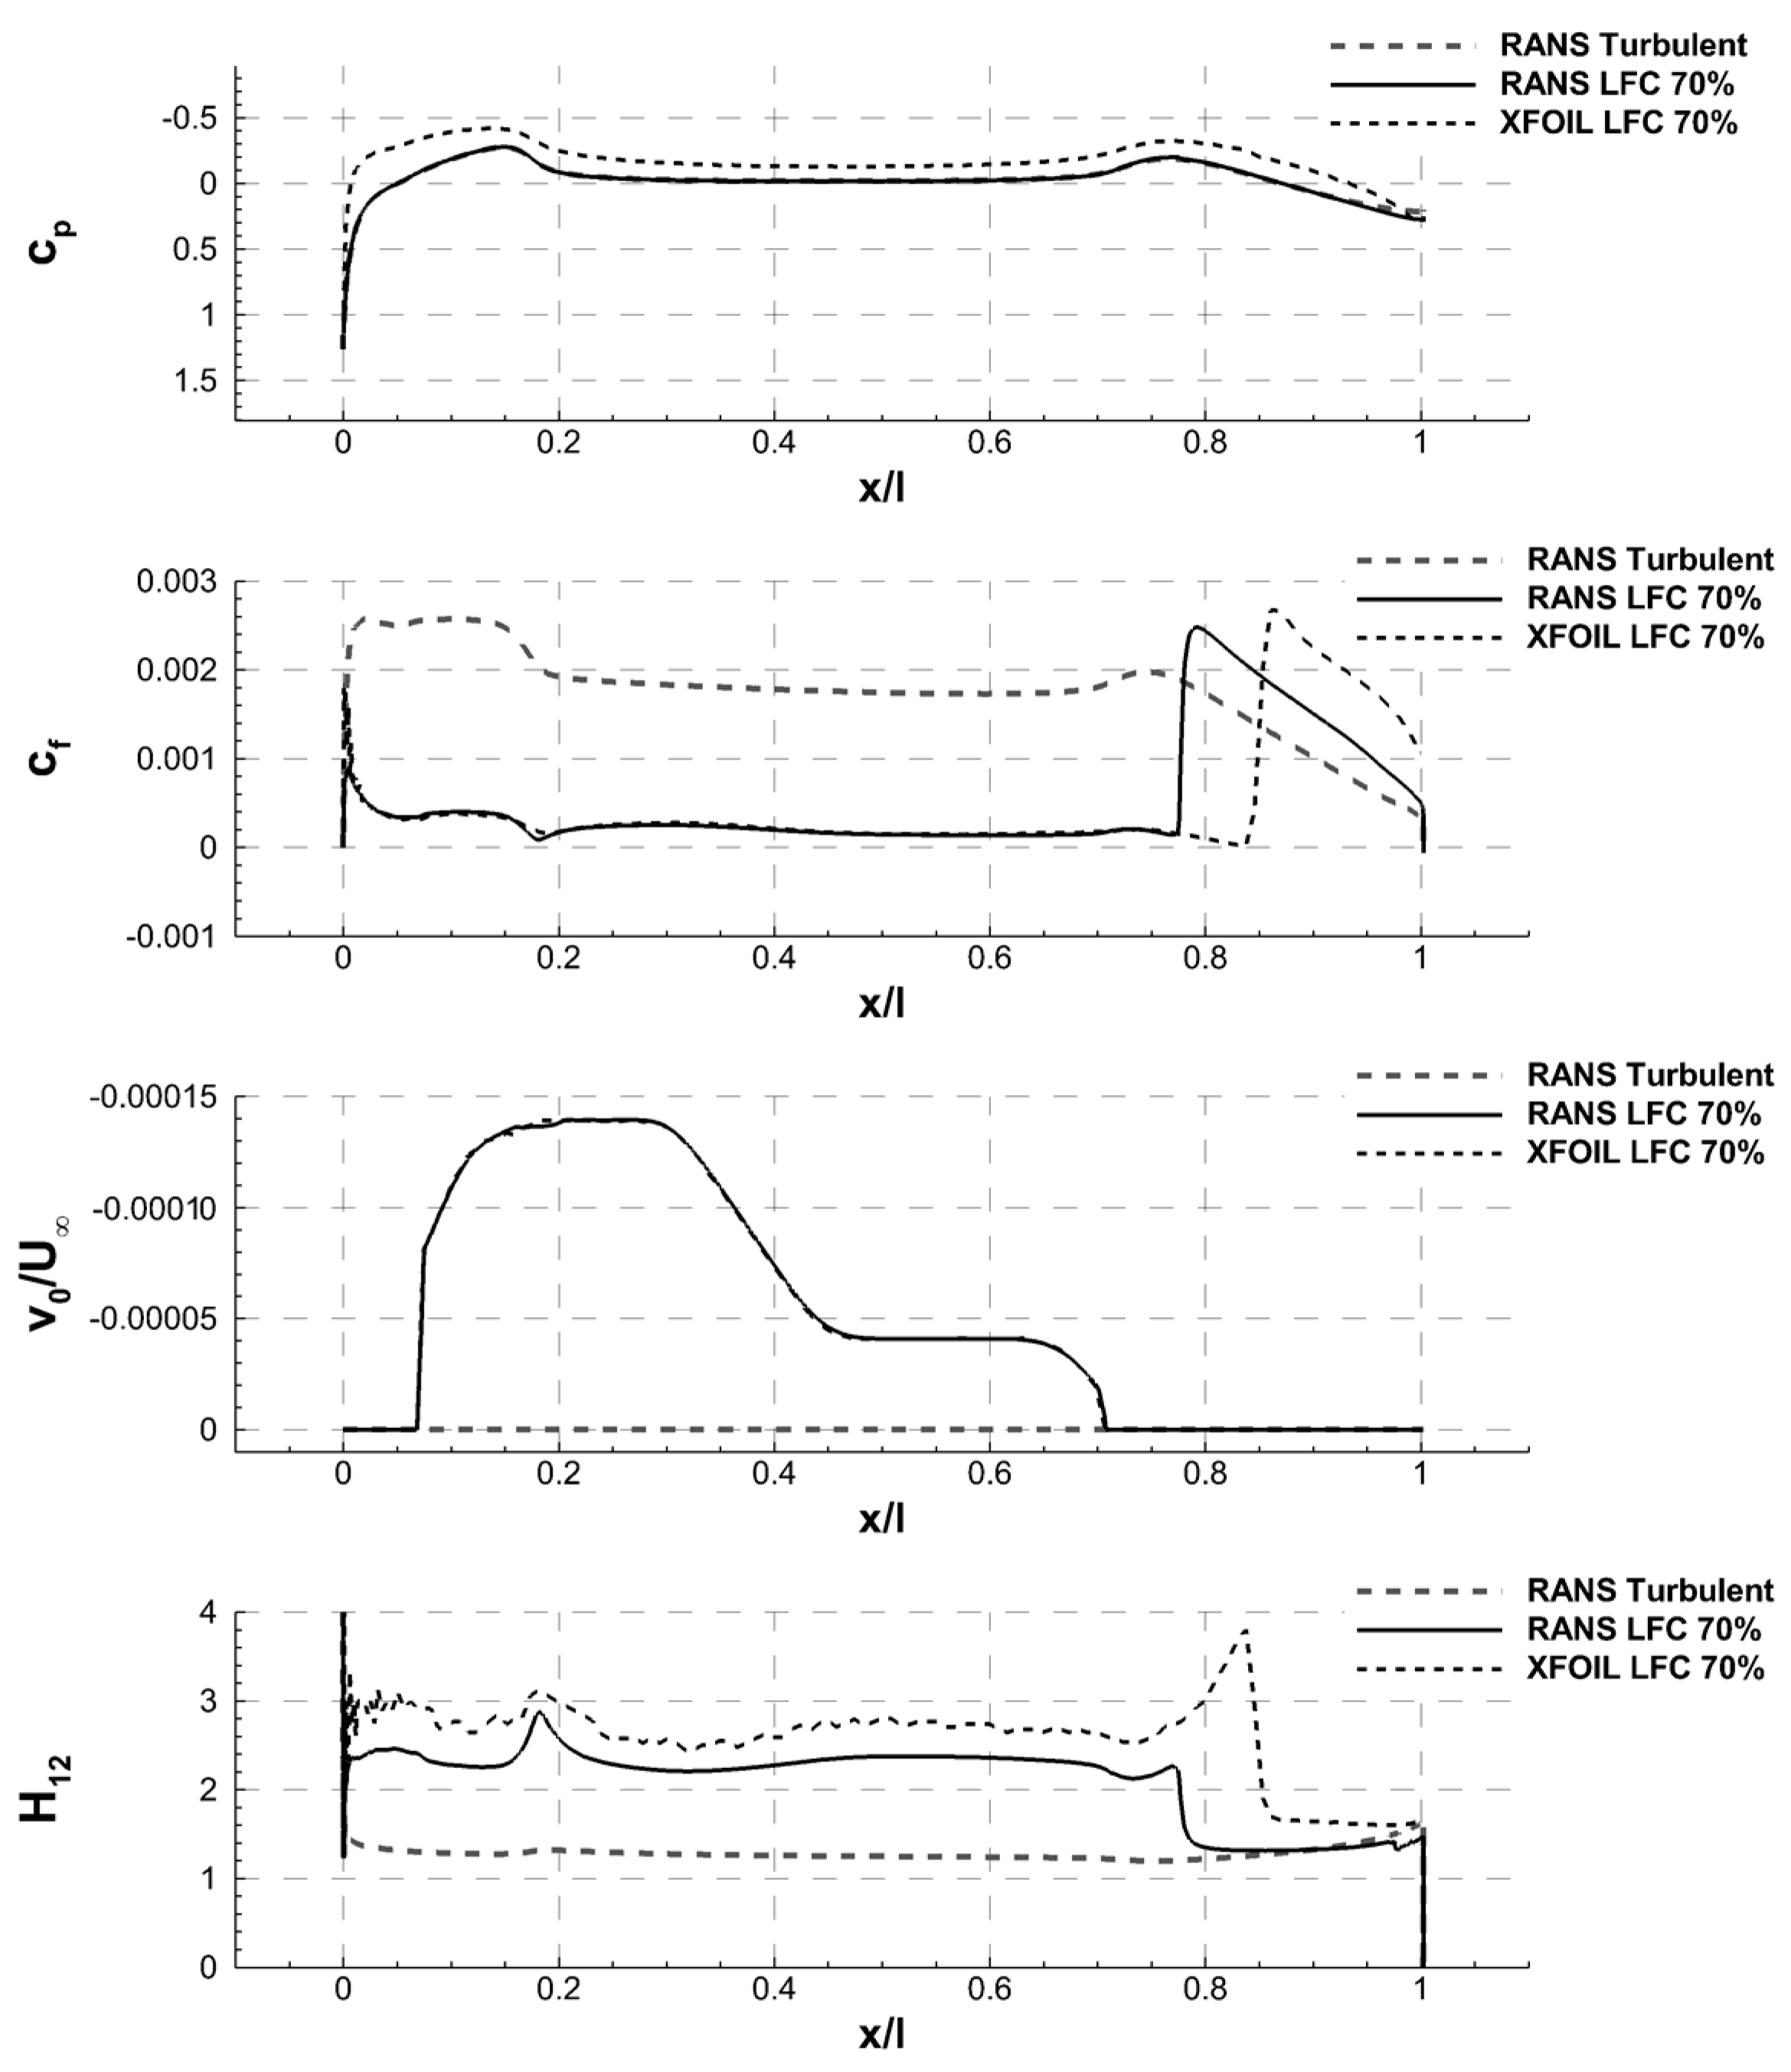
For the design of the fuselage suction distribution, a slice through the fuselage geometry was imported in XFOILSUC. The thickness was scaled down to obtain a pressure distribution with similar gradients to those obtained from 3D RANS computations. Mach and Reynolds number were set to cruise conditions for an A320 class aircraft, which resulted in a Reynolds number based on fuselage length of 166 million and a Mach number of 0.8. Without suction, natural transition was predicted by XFOILSUC at 10% relative length. Suction was applied from 7% to 70% fuselage length, up to the end of the cylindrical part, and adjusted manually until the transition location was significantly aft of the end of the suction region, beyond 80%.
7.2. Numerical Setup
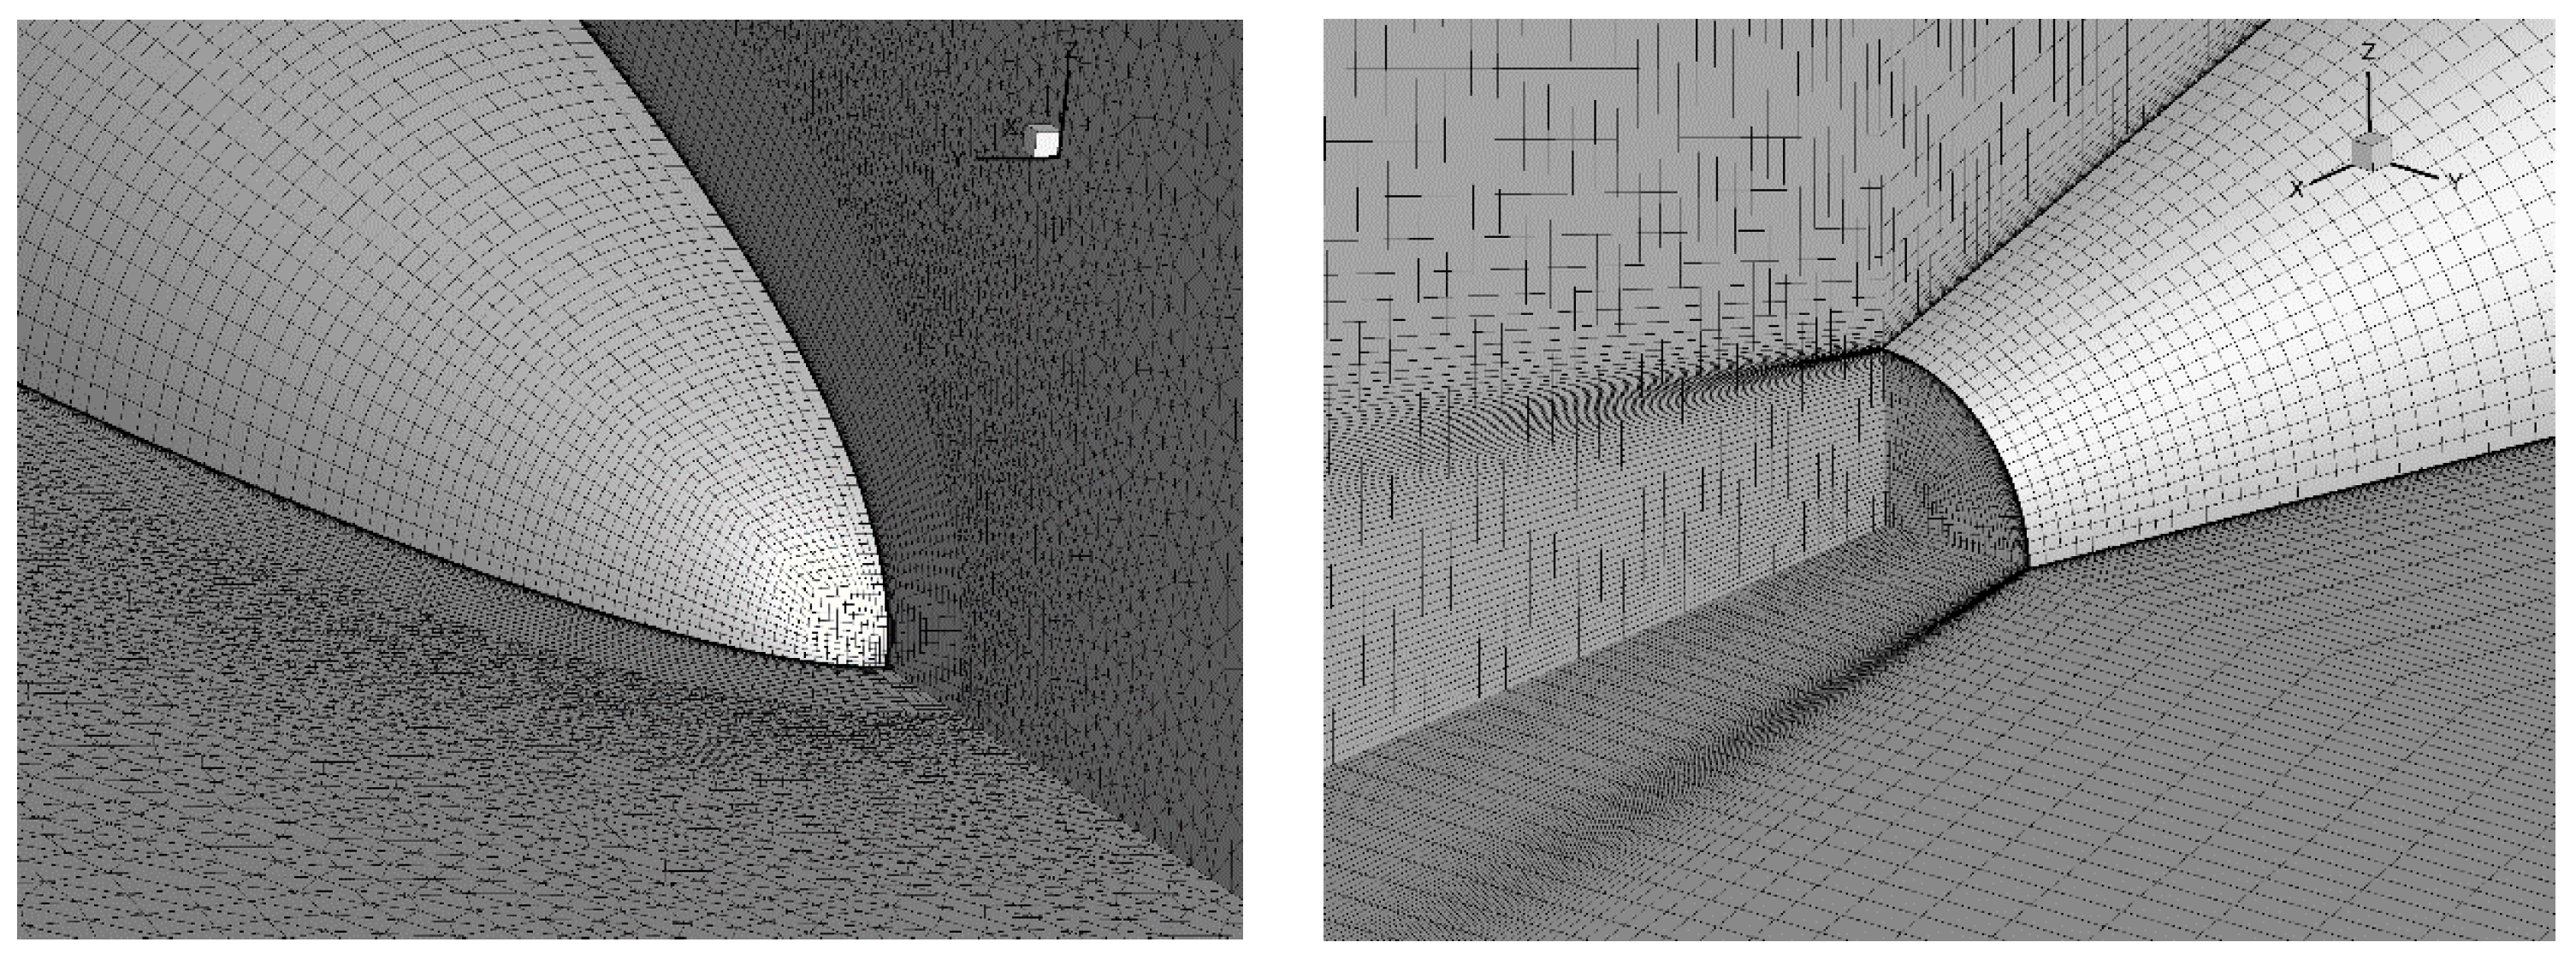
To analyze the influence of suction on the drag coefficient of a fuselage, three-dimensional RANS simulations were performed on a quarter section of the fuselage body geometry described above, using the DLR TAU-code [36,37], release 2016.2.0. Two computational grids of different fineness were created, both with symmetry planes at 0° and 90° in circumferential direction. The boundary layer and the wake downstream of the fuselage were resolved with structured hexahedral cells, while the farfield grid was made up from unstructured prism and tetrahedral cells. Within the structured part, the fine grid has 1005 points in streamwise direction, 45 points in circumferential direction and 81 points in wall normal direction. The y+-values are below 1 along the nose and the cylindrical part of the fuselage. Only at the conical part at the end, y+-values slightly larger than 1 occur. The boundary layer is resolved with more than 30 cells globally. In total, the fine grid consists of 7.75 million grid points. To check the influence of the grid resolution, a coarse grid was derived from the fine grid, with grid point spacing doubled in all three dimensions in the structured part of the grid (500 × 23 × 41 points). The unstructured part was adapted accordingly, resulting in 1.24 million grid points in total. Figure 21 gives an impression of the structure of the computational grids. For a better illustration, the coarse grid is shown.

Figure 21.
Details of the grid structure (coarse grid displayed) at the nose (left) and at the rear end (right).
The TAU-code solves the Reynolds-averaged Navier-Stokes equations. Turbulence was modeled by the Menter-SST eddy viscosity model [38,39], which is widely-used for industrial applications. For time stepping, the implicit lower-upper symmetric Gauss-Seidel (LU-SGS) scheme was used. First, fully turbulent simulations were performed, aimed at the identification of a suitable numerical setup for the simulations including suction and providing the drag coefficient of a turbulent fuselage as a baseline for the evaluation of LFC. Finally, two simulations including suction show the potential of drag reduction due to the delay of transition, preserving the laminar boundary layer. For these simulations, the suction velocity distribution designed in XFOILSUC was projected onto the RANS surface grid. For the simulations presented here, the transition position was set manually slightly downstream of the area where suction was applied, assuming the boundary layer to be laminar from the nose of the fuselage up to the transition position. Table 1 gives an overview of the cases simulated, including the results of the drag calculations. For the drag coefficients, the wetted surface was used as the reference area. Drag is predicted similarly on both computational grids, indicating that the boundary layer development is well resolved on the fine grid. To ensure a sufficient resolution of the suction distribution, the simulations including suction were performed on the fine grid. For the fully turbulent case, a drag estimation as in Subsection 7.4, using handbook methods for preliminary aircraft design, confirmed the drag results for the turbulent case.

Table 1.
RANS Calculations for Fuselage Drag.
7.3. Results
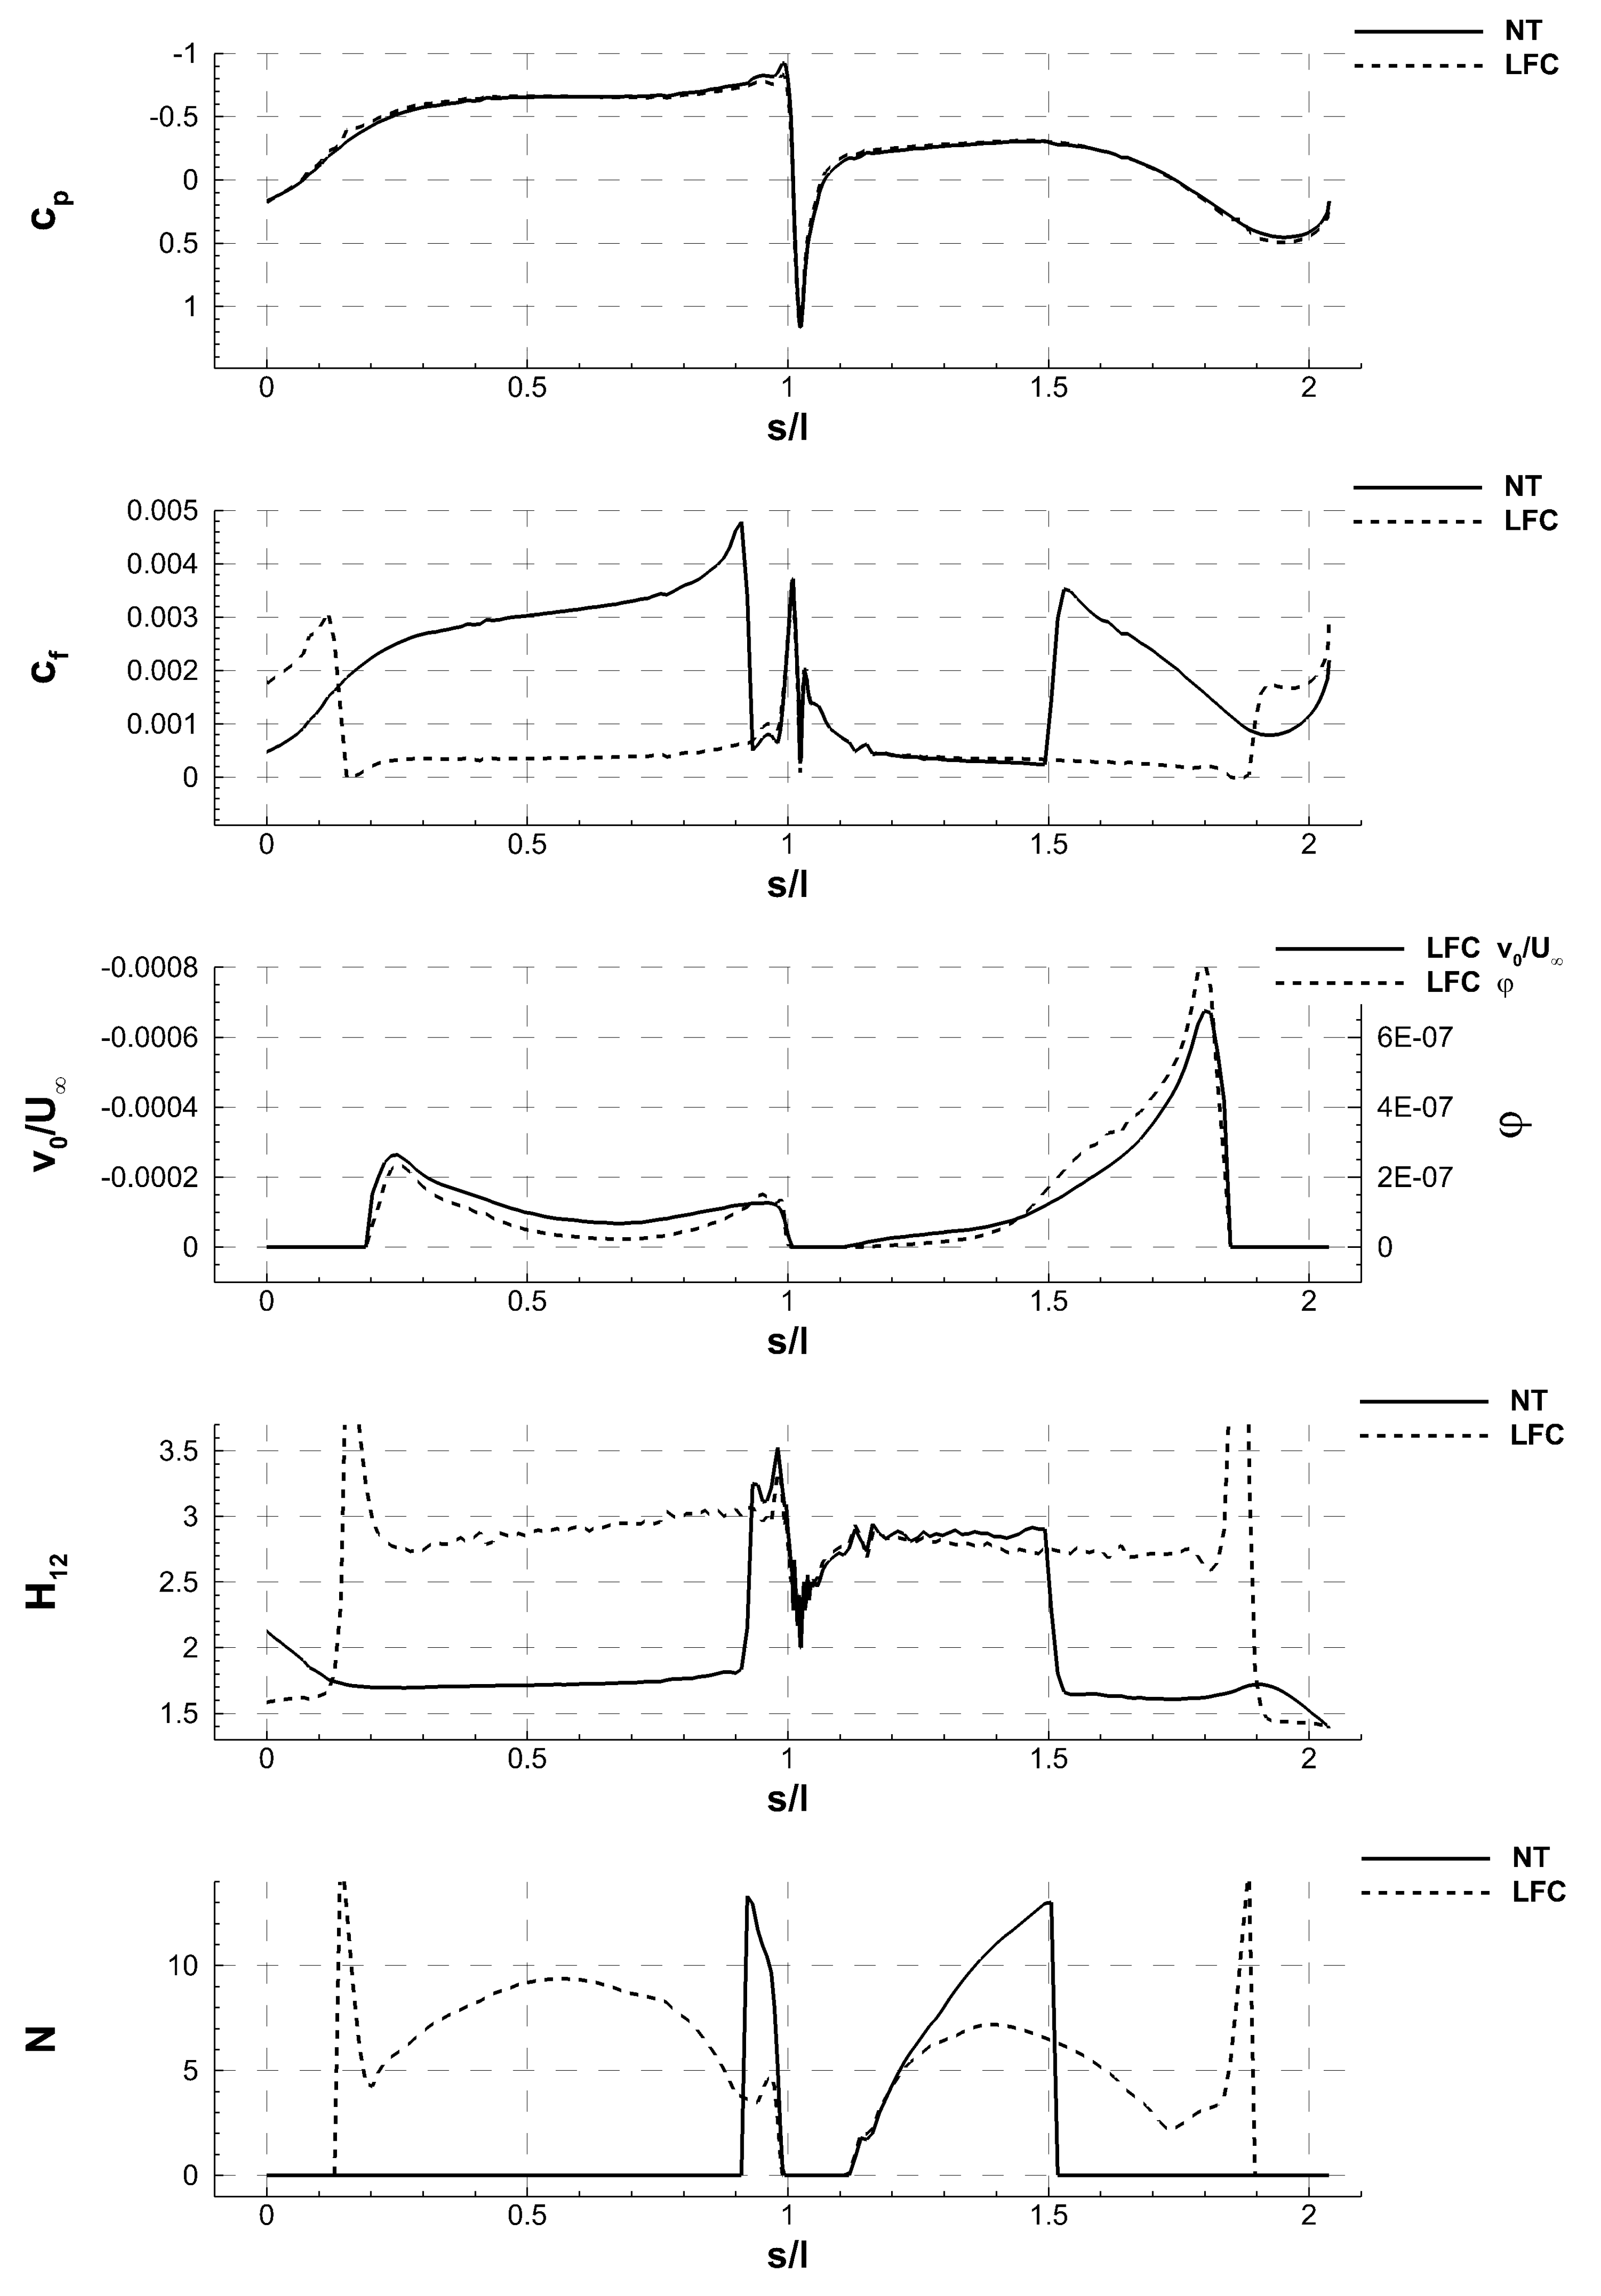
In Figure 22, the boundary layer parameters of the 2D XFOILSUC and 3D TAU simulations are shown in comparison. Note that the skin friction coefficient is identical for the part were suction is applied, which is in accordance with boundary layer theory and proves that the data import from XFOIL to TAU was implemented correctly. Also shown is the development of the shape factor , which is consistently smaller for the 3D case than for the 2D data. At the same time, transition is assumed earlier than predicted by XFOILSUC, which means that the calculated drag reduction can be considered conservative.

Figure 22.
BL and Suction Parameters for Fuselage.
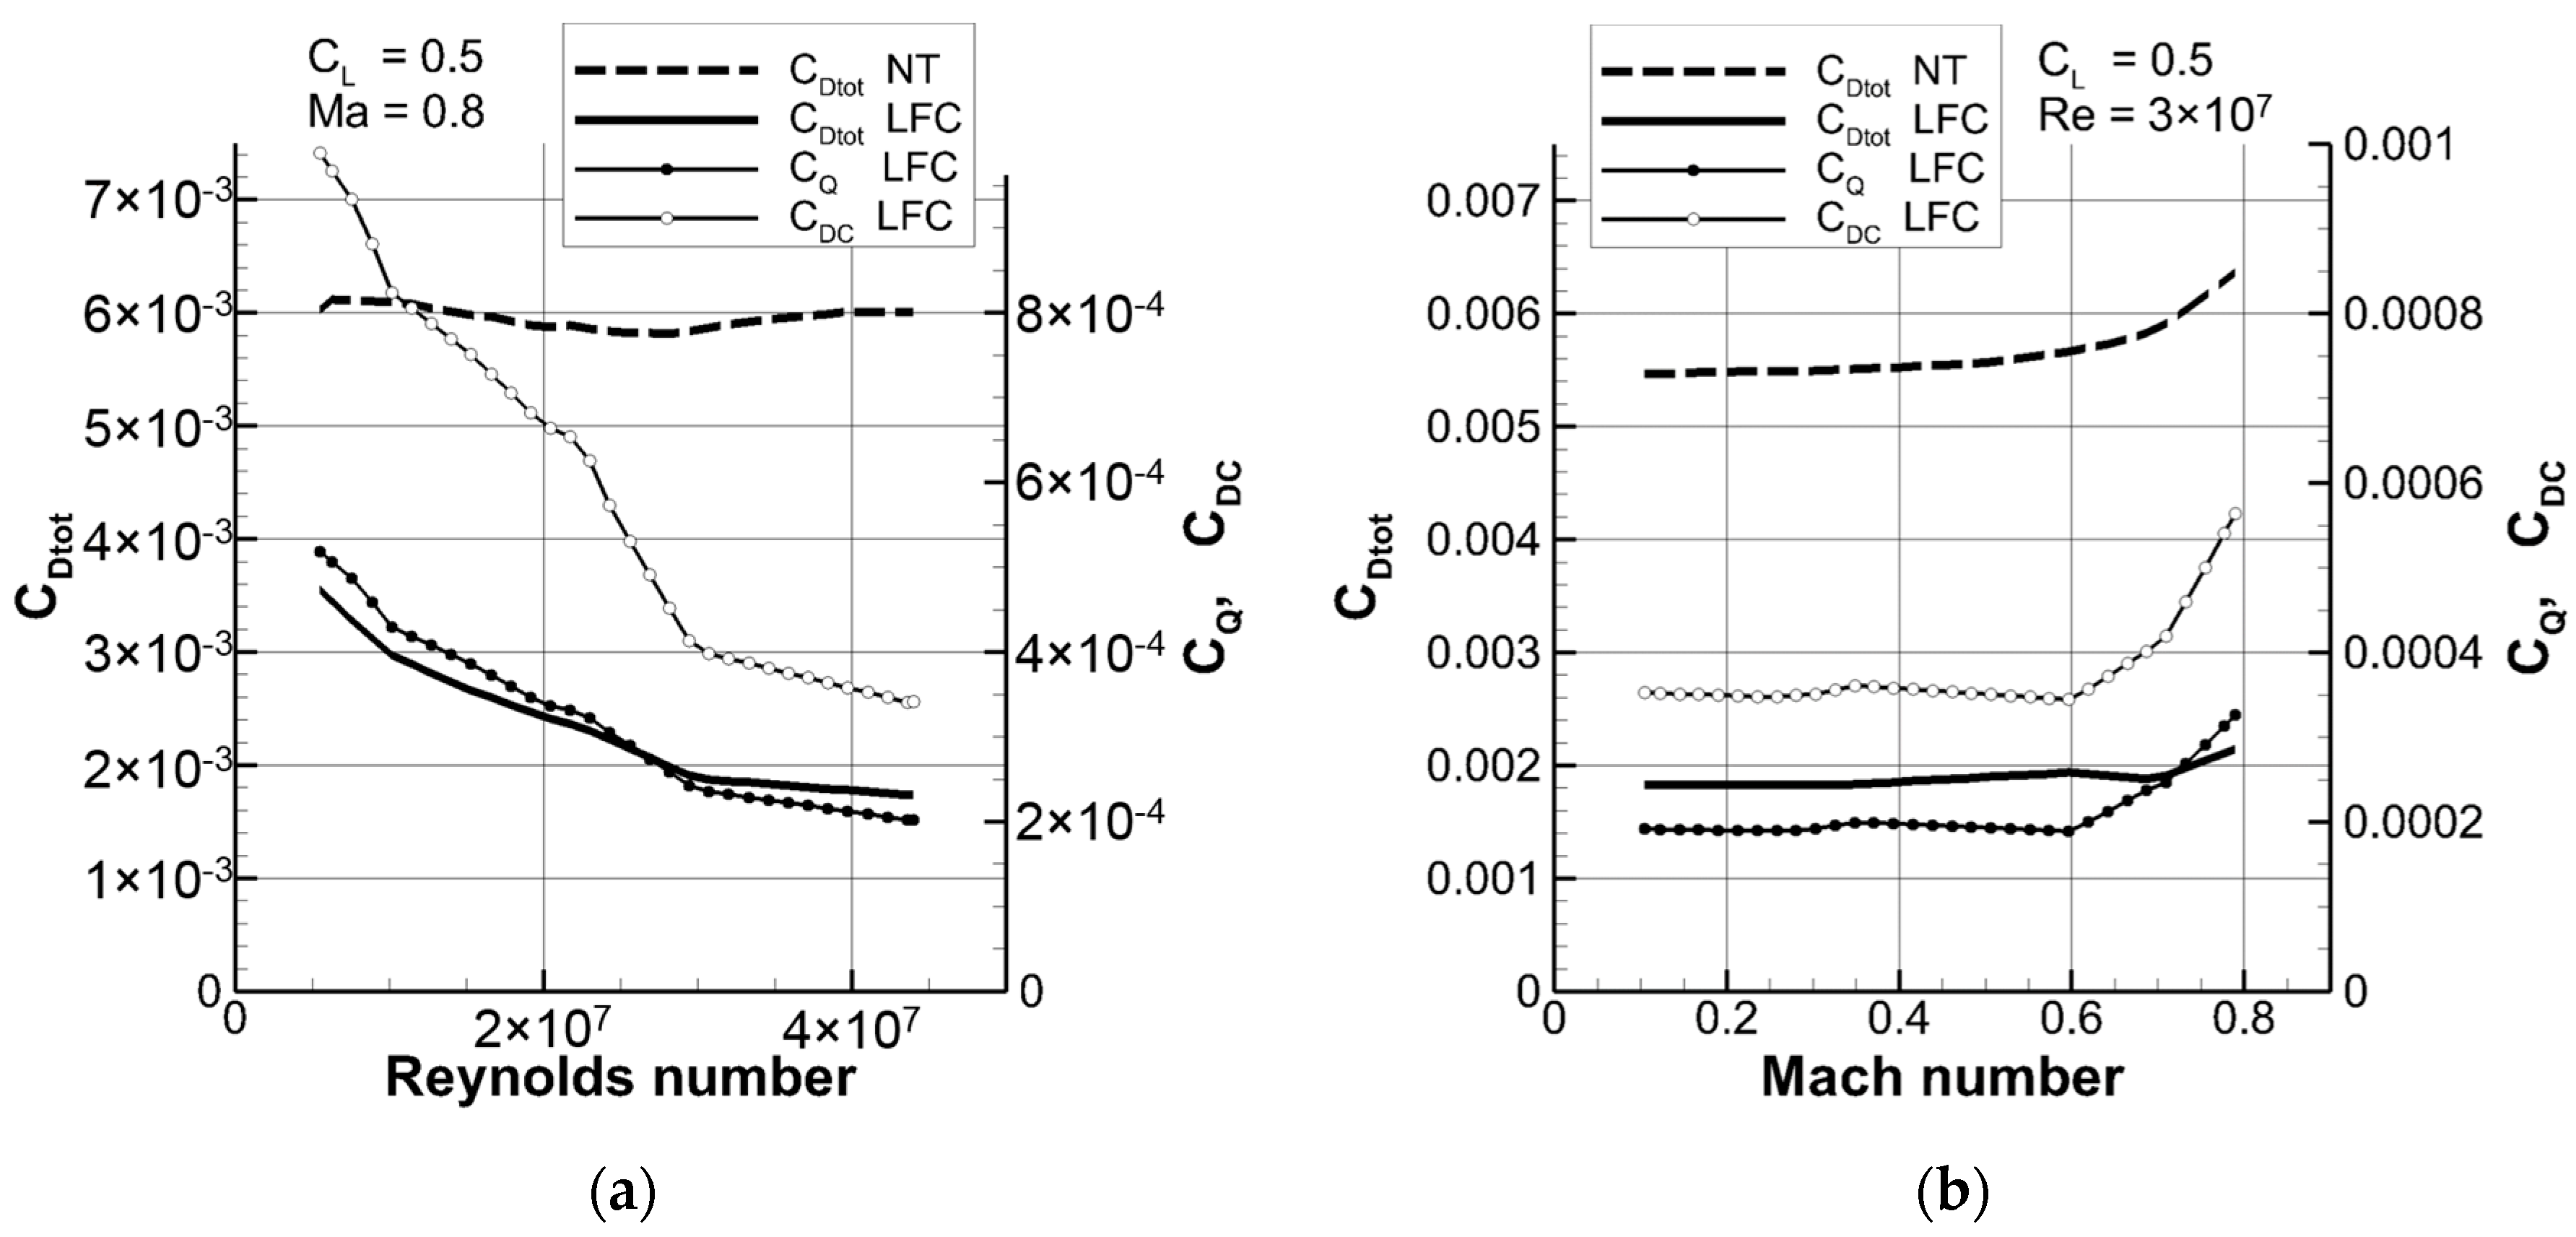
To show the effect of suction length, a case with reduced fuselage suction length was also calculated, with the suction velocity set to zero aft of 53% relative fuselage length. The reduction of total drag for both suction lengths is shown in Figure 23a, while the relative drag reduction and the ratio of pump drag to drag reduction are shown in Figure 23b. Note that the difference between pressure and friction drag () and total drag () is almost neglibile. The fuselage pressure distribution is very flat, and only very little suction mass flow is needed to ensure a laminar boundary layer. In addition, the compressor power for the static pressure increase is also small, and so the pump drag is almost completely compensated by the jet thrust. The total fuselage drag reduces by a factor of four, and the necessary compressor power is only around 7% of the saved drag.
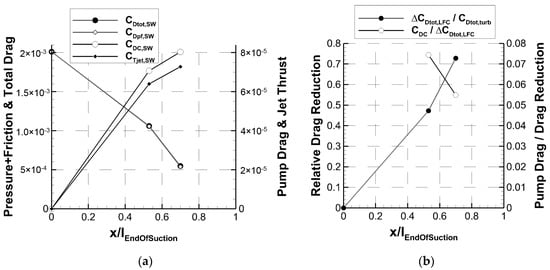
Figure 23.
Results for Fuselage Drag with and without suction; DLR LamAiR; .
7.4. Estimation of Fuselage Drag by Handbook Methods
To validate the RANS results for the turbulent reference case, the drag was was estimated using handbook methods. Gur [40] presents a methodology commonly used for preliminary aircraft design, were the friction and form drag coefficient of each component is the product of the equivalent flat plate skin friction coefficient, a form factor, and the ratio of the components’ wetted surface area to the reference area, which is usually the wing area:
The form factor accounts for the pressure drag due to boundary layer effects. Because the wing area is undefined for an isolated fuselage, we use the wetted surface as reference area. This results in , and consequently:
For the fuselage form factor, an estimate is given by Gur and Raymer [40,41] as a function of the fuselage slenderness:
For the equivalent skin friction coefficent, Raymer [41] recommends a formula taken from DATCOM [42]:
The main parameters and the results of the handbook and numerical calculations are summarized in Table 2. The drag area values estimated by handbook methods and integrated from CFD data differ by less than 0.5%, which indicates that the CFD method is sufficiently accurate to predict the potential drag reduction by laminar flow control.
Table 2.
Comparison of Drag Results from RANS and Handbook Methods.
8. Drag Reduction on AC Level
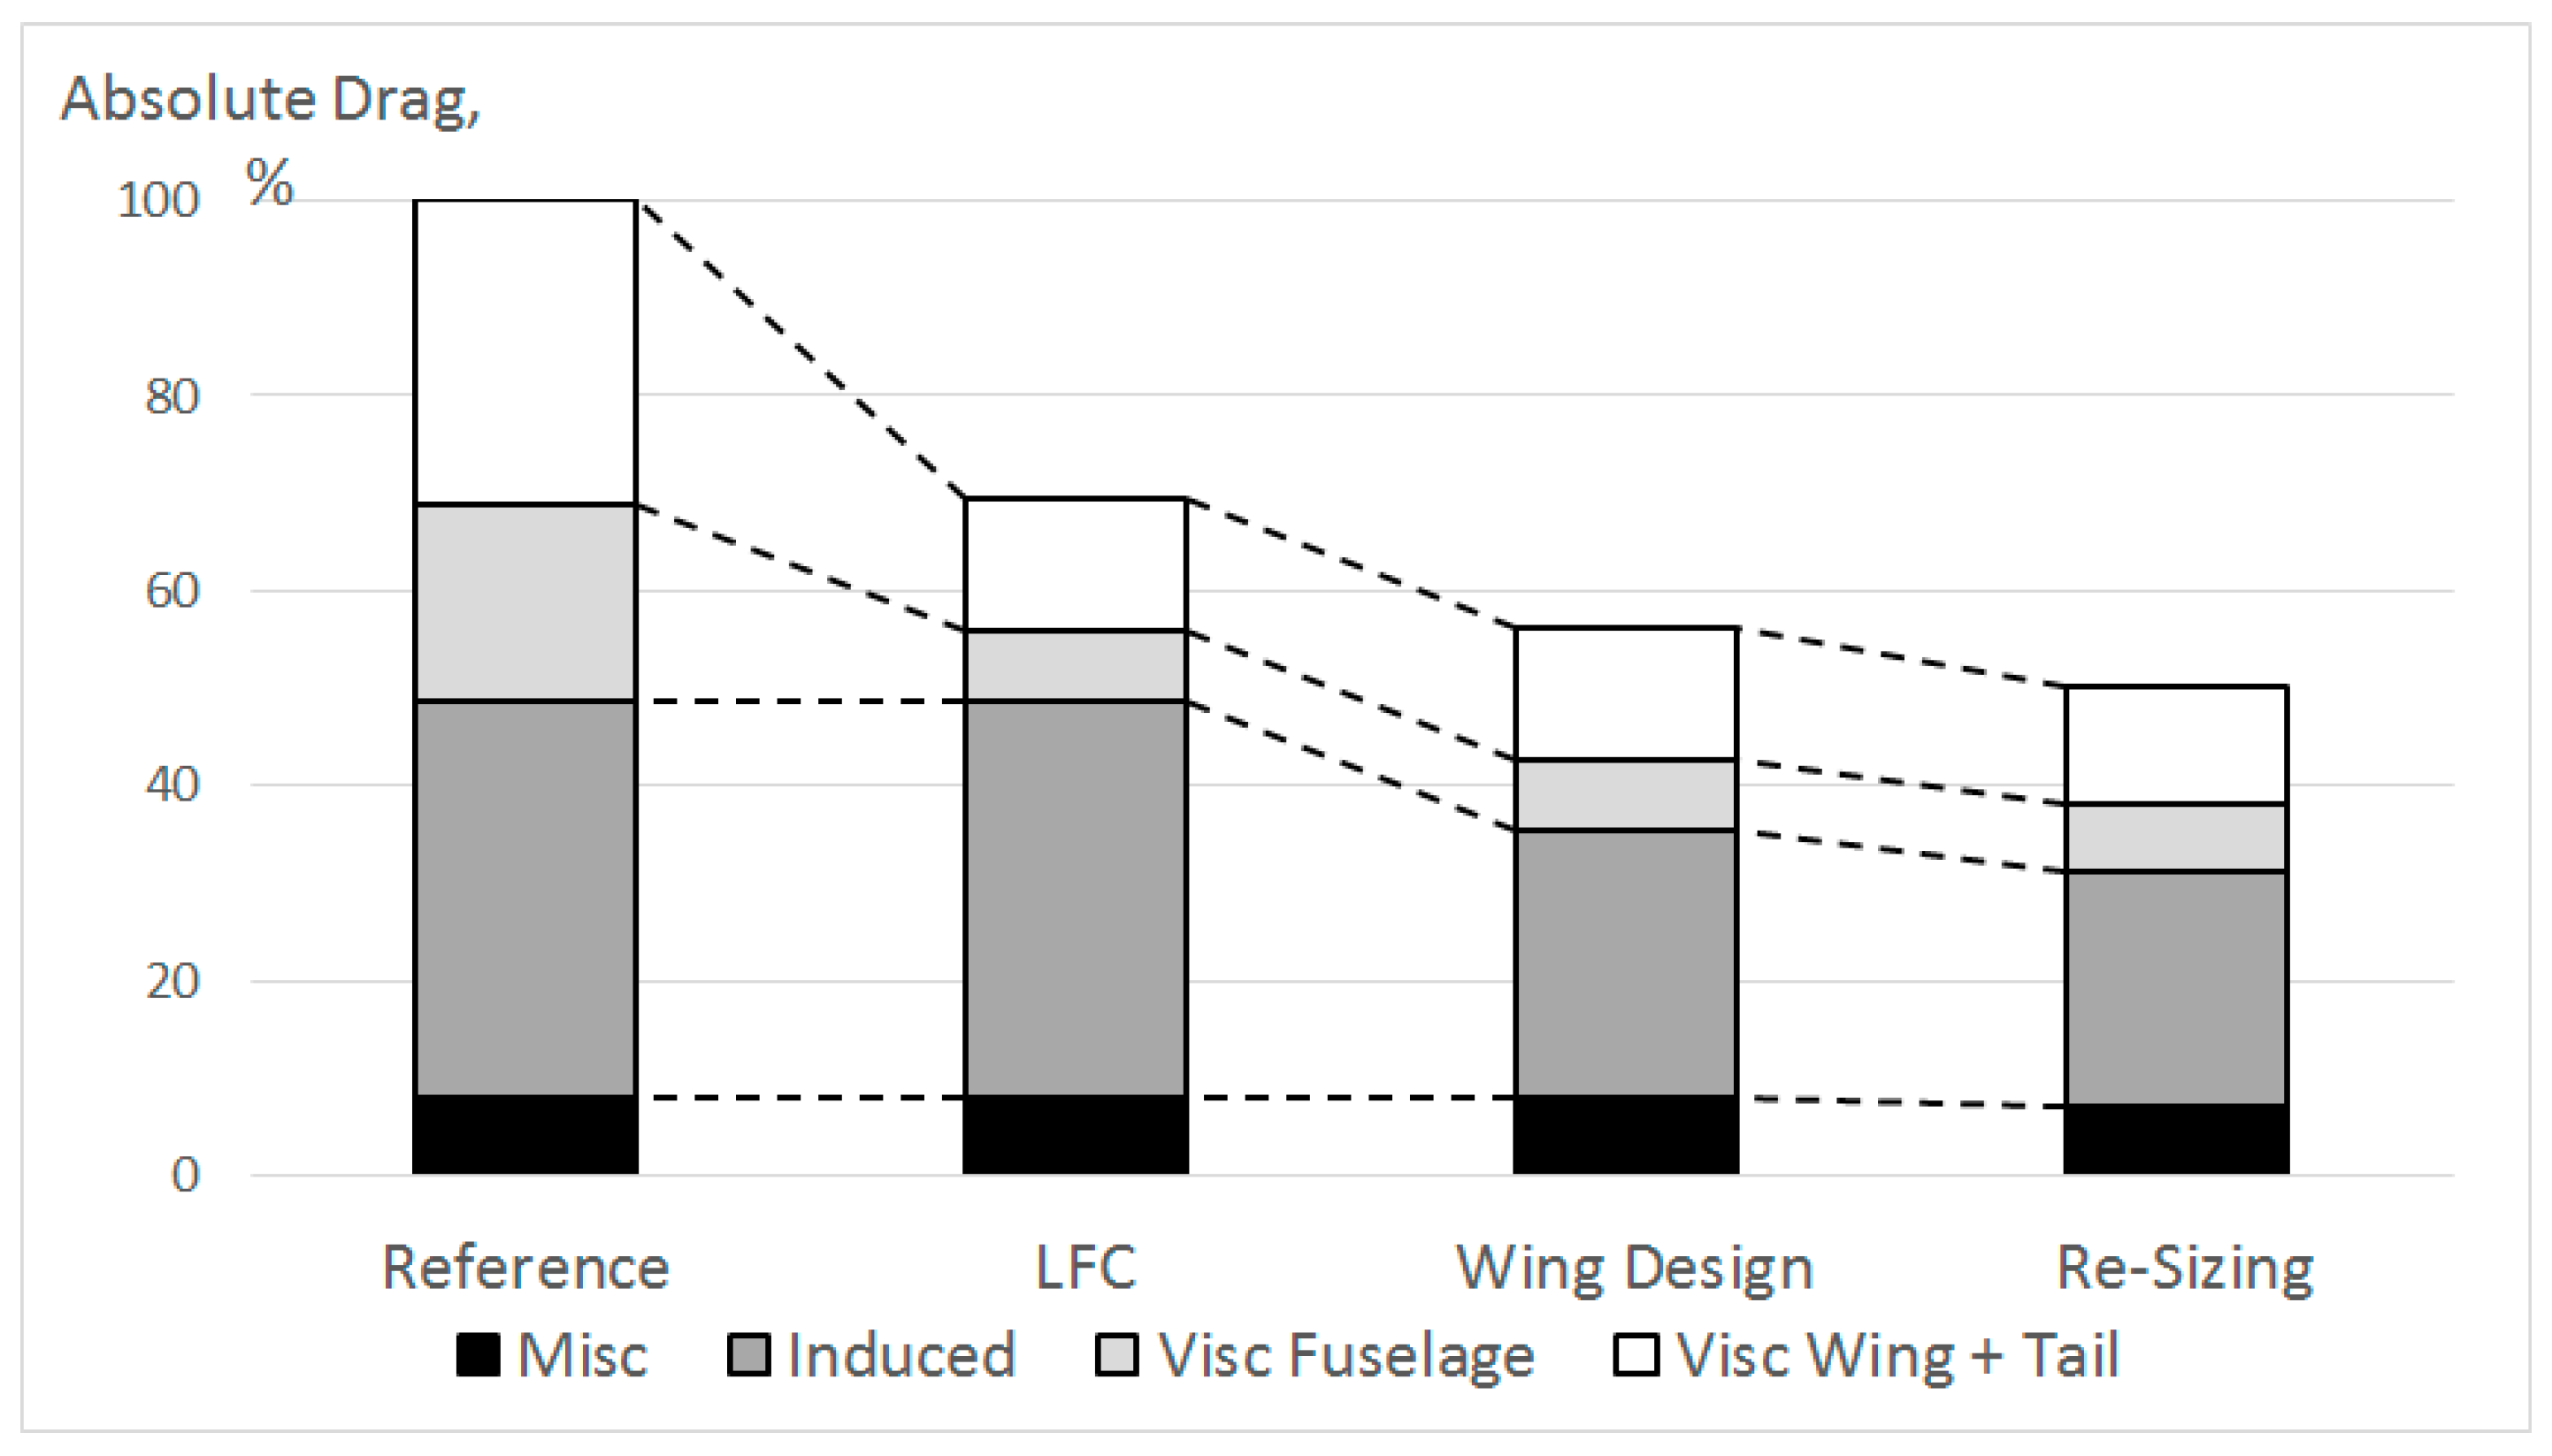
For a medium-range jet with top level aircraft requirements similar to an A320, a reference configuration and an optimized design, taking into account LFC on wings, tails and fuselage, were evaluated using methods for preliminary aircraft design [43]. To simplify the process, the suction system was not modeled in detail. The power of the suction pump and the jet thrust of the expelled suction air were included in the total drag coefficients, as explained in Section 4.3. No weight penalty for the suction system is considered, assuming that for future aircraft, new weight-saving structural technologies will compensate for the additional components. The relative drag reductions for wing sections were determined for 2D profiles at Ma = 0.7, which corresponds to a medium range jet aircraft flying at Ma = 0.8, with a sweep angle in the order of 20° to 30°. In Section 2.3, it was shown that sweep induced transition can be avoided with forward swept wings and moderate sweep angles, and the suction system only has to suppress the amplification of TS instabilities on the rear part of the wing. The relative effect of viscous drag reduction on absolute drag is illustrated in Figure 24. The first column shows the drag breakdown for the reference aircraft. The major contributors are induced drag and viscous drag on wings, tail surfaces and the fuselage. Smaller portions such as nacelle drag, interference and wave drag are summed up in the miscellaneous fraction. For wings and tails, a drag reduction of 56% is applied. The assumptions are a relative reduction of profile drag by 68%, as shown in Section 5, from which a deduction was made to account for junction areas which can not be laminarized. For the fuselage, a reduction of 65% was assumed, based on the 72% reduction for the isolated fuselage shown in Section 7, and again making a deduction for junction areas. The immediate result is a reduction in viscous drag by 60%, and in consequence a reduction of absolute AC drag by 30%. This changes the balance of viscous and induced drag, recommending a re-design of the wing layout, with the optimum aspect ratio increased from 9.5 to 15. The intermediate result is an aircraft of roughly the same size, but with significantly increased range. Resizing for the original mission leads to a reduction in wing area from 124 to 109 m², an according change of tail plane area, plus a reduction in MTOW, from 75 down to 66 tons. This results in further reduction of total drag, even for fractions of the drag not directly affected by laminar flow control or wing design. Due to the reduced mass, the energy required for climb to altitude and take-off acceleration is also reduced. The resulting cruise drag, represented by the right column in Figure 24, is only 50% of the reference value. Mission fuel burn is reduced from 15.9 to 8.3 tons, a remarkable reduction by 47%.
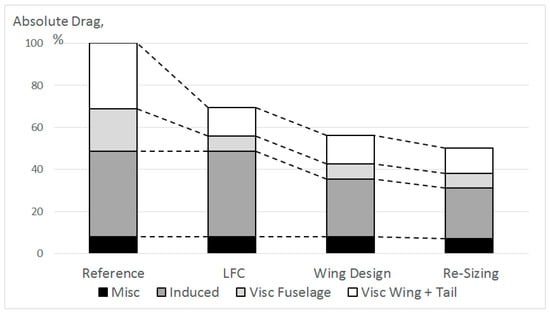
Figure 24.
Viscous Drag Reduction and Effect on Total Aircraft Drag.
9. Conclusions and Outlook
Laminar flow control by boundary layer suction holds potential for great reductions in drag. For wing sections, the lowest drag values were achieved by applying LFC on the rear part of airfoils originally designed for NLF, to further delay the TS-induced transition towards the trailing edge. Compared with today’s turbulent supercritical airfoils, profile drag can be reduced by more than 70%. Application of suction to supercritical airfoils results in slightly higher total drag values, but with better adaptability to changes in lift coefficient. It seems reasonable to assume the same drag reduction potential also for tail surfaces. Wing sections with increased thickness, designed for use on future blended wing body configurations, also showed significant potential for drag reduction with the application of BL suction. In the future, integrated design of airfoil shape and suction distribution may lead to even lower total drag coefficients.
Next to wings and tails, the fuselage is a great contributor to viscous drag. For a simplified generic contour, drag could be reduced to one fourth of the fully turbulent fuselage by applying suction from near the nose to the beginning of the tailcone.
The technical assumptions made in this study are believed to be rather conservative. Chordwise extent of suction on wing sections was limited to 80%, leaving room for full span trailing edge movables. For the fuselage, suction up to 70% of fuselage length was investigated. The efficiency of the suction compressor was set to , based on flight tests performed in the 1960s, and none of the investigated geometries was optimized or modified for the application of suction.
By using the knowledge gained by the DLR during research on NLF and HLFC for the integrated design of wing and fuselage contours and suction systems, and application of state-of-the art suction compressor technology including electric drive systems, fuel burn reductions of 47%, as claimed in Section 8, appear feasible.
Apart from further development of methods and numerical tools for aerodynamic design and analysis, a number of additional issues need to be addressed and solved in order to achieve the necessary technological maturity:
- Structural concepts for porous skins with high surface quality, good mechanical robustness, low weight and long term stability, possibly employing multiple-shell designs with function integration into the sandwich core,
- Integration of BL suction design concepts with design of propulsion integration, high-lift and anti-ice system,
- Treatment of surface imperfections such as door gaps, possibly by gap suction or downstream re-laminarization.
Acknowledgments
We would like to acknowledge the support of the Ministry for Science and Culture of Lower Saxony, Germany (Grant No. VWZN3177) for funding the research project “Energy System Transformation in Aviation” in the initiative “Niedersächsisches Vorab”. We also thank the North-German Supercomputing Alliance (HLRN) for providing computational resources. Finally, the authors are grateful for the many helpful and productive discussions and the cooperation with other members within the Energy System Transition in Aviation project team. Special thanks go to the project leader, Jens Friedrichs, for defining and clarifying the concepts.
Author Contributions
Nils Beck performed the XFOILSUC calculations, coded the auxiliary MatLab software, analyzed the airfoil and fuselage data with respect to suction requirements and total drag, estimated the fuselage drag by handbook methods, and was responsible for the overall editing of the paper. Tim Landa prepared and executed the RANS simulations of the isolated fuselage and wrote the respective part of the paper. Arne Seitz compiled the review of laminar flow research presented in chapter 2. Loek Boermans contributed the XFOILSUC software, gave valuable advice on it's application, and reviewed the chapters on XFOIL, suction design and total drag. Yaolong Liu analyzed the effect of the drag reduction on overall aircraft level presented in chapter 8. Rolf Radespiel initiated and coordinated the work, gave valuable guidance, reviewed the complete paper and contributed to the introductory and outlook chapters.
Conflicts of Interest
The authors declare no conflict of interest.
Nomenclature
| Drag coefficient; total drag coefficient including suction system | |
| CD due to: pressure; friction; profile drag; compressor power; lift induced | |
| Wake drag coefficient, calculated from momentum deficit | |
| Lift coefficient; angle of attack | |
| Pressure coefficient | |
| CP of: plenum pressure; skin pressure loss; duct pressure loss | |
| Mach number | |
| Free stream velocity; pressure; density; temperature; dynamic pressure | |
| Wall pressure; density; temperature | |
| Suction plenum pressure | |
| Jet velocity of suction air exhaust | |
| Reference areas; wetted surface area | |
| Reynolds number based on: airfoil chord length; fuselage length | |
| Absolut; nondimensional suction velocity | |
| Volume flow; mass flow of suction system | |
| Suction coefficient based on volume flow; mass flow | |
| Cartesian airfoil coordinates; airfoil contour coordinate; chord length | |
| Permeability; flow resistance of suction skin | |
| Shape factor; growth factor | |
| NT; NLF | Natural transition; natural laminar flow |
| LFC; HLFC | Laminar flow control; hybrid laminar flow control |
| TS; CF; ATL | Tollmien-Schlichting; cross flow; attachment line |
| TLAR | Top Level Aircraft Requirements |
| DLR | Deutsches Zentrum für Luft- und Raumfahr (German Aerospace Research Center) |
| TU BS | Technische Universität Braunschweig (Technical University Braunschweig) |
| TU Delft | Delft University of Technology |
| MatLab | Programming language for technical and mathematical problems by MathWorks, 3 Apple Hill Drive, Natick, Massachusetts, 01760 USA |
References
- Peeters, P.M.; Middel, J.; Hoolhorst, A. Fuel Efficiency of Commercial Aircraft: An Overview of Historical and Future Trends; NLR-CR-2005-669; Nationaal Lucht- en Ruimtevaartlaboratorium: Amsterdam, The Netherlands, 2005. [Google Scholar]
- Tollmien, W. Über die Entstehung der Turbulenz. In Nachrichten von der Gesellschaft der Wissenschaften zu Göttingen, Mathematisch-Physikalische Klasse; Akademie der Wissenschaften zu Göttingen: Göttingen, Germany, 1929; pp. 21–44. [Google Scholar]
- Schlichting, H. Boundary-Layer Theory, 4th ed.; McGraw-Hill: New York, NY, USA, 1960. [Google Scholar]
- Pfenninger, W. Some Results from the X21 Program: Part I: Flow Phenomena at the Leading Edge of Swept Wings. In Recent Developments in Boundary Layer Research. Part IV. AGARDograph 97; NATO Research and Technology Organization: Neuilly-sur-Seine, France, 1965. [Google Scholar]
- Pfenninger, W. Laminar Flow Control, Laminarization: Special Course on Concepts for Drag Reduction; AGARD Report; NATO Research and Technology Organization: Neuilly-sur-Seine, France, 1977. [Google Scholar]
- Poll, D.I.A. Some Aspects of the Flow Near a Swept Attachment Line with Particular Reference to Boundary Layer Transition; COA Report No. 7805; Cranfield Institute of Technology: Cranfield, UK, 1978.
- Gregory, N.; Stuart, J.T.; Walker, W.S. On the Stability of Three-Dimensional Boundary Layers with Application to the Flow due to a Rotating Disk. Philos. Trans. Roy. Soc. Lond. A 1952. [Google Scholar] [CrossRef]
- Dagenhardt, J.R. Amplified Crossflow Disturbances in the Laminar Boundary Layer on a Swept Wing with Suction; NASA Technical Report No. 1902; NASA Langley Research Center: Hampton, VA, USA, 1982.
- Arnal, D.; Coustols, E.; Juillen, J.C. Experimental and Theoretical Study of Transition Phenomena on an Infinite Swept Wing. Rech. Aerosp. 1984, 39–54. [Google Scholar] [CrossRef]
- Pfenninger, W. Flow problems of Swept Low-Drag Suction Wings of Practical Contruction at High Reynolds number. Ann. N. Y. Acad. Sci. 1968, 154, 672–703. [Google Scholar] [CrossRef]
- Van Ingen, J.L. A Suggested Semi-Empirical Method for the Calculation of the Boundary Layer Transition Region; VTH No. 74; Delft University of Technology: Delft, The Netherlands, 1956. [Google Scholar]
- Van Ingen, J.L. Theoretical and Experimental Investigations of Incompressible Laminar Boundary Layers with and without Suction. VTH No. 124. Ph.D. Thesis, Delft University of Technology, Delft, The Netherlands, 1965. [Google Scholar]
- Redeker, G.; Horstmann, K.H. Die Stabilitätsanalyse als Hilfsmittel beim Entwurf von Laminarprofilen; DGLR-Bericht 86-03; Deutsche Gesellschaft für Luft- und Raumfahrt: Bonn, Germany, 1986. [Google Scholar]
- Horstmann, K. Wing Design for Laminar Flow (Invited). In Proceedings of the 38th AIAA Fluid Dynamics Conference and Exhibit, Seattle, DC, USA, 23–26 June 2008. [Google Scholar]
- Redeker, G.; Horstmann, K.H.; Köster, H.; Thiede, P.; Szodruch, J. Design for a Natural Laminar Flow Glove for a Transport Aircraft. AIAA-90-3043-CP. In Proceedings of the AIAA Flight Simulation Technologies Conference and Exhibit, Dayton, OH, USA, 17–19 September 1990. [Google Scholar]
- Voogt, N. Flight Testing of a Fokker 100 Aircraft with Laminar Flow Glove on a Transport Aircraft. In World Aviation Congress & Exposition; SAE International: Warrendale, PA, USA, 2000; pp. 2–14. [Google Scholar]
- Schrauf, G.H. Evaluation of the A320 Hybrid Laminar Fin Experiment. In European Congress on Computational Methods in Applied Sciences and Engineering; ECCOMAS: Barcelona, Spain, 2000. [Google Scholar]
- Williams, G. Progress and Achievements in CleanSky SFWA. Available online: http://www.forum-ae.eu/system/files/5-cleansky_sfwa_forum-ae.pdf (accessed on 18 January 2018).
- Geyr, J.F.; Hatzbach, F.K.z.; Seitz, A.; Streit, T.; Wichmann, G. Wing Design Based on a Tapered Wing Natural Laminar Flow Airfoil Catalogue. In New Results in Numerical and Experimental Fluid Mechanics IX; Contributions to the 18th STAB/DGLR Symposium, Stuttgart, Germany, 6–7 November 2012; Dillmann, A., Heller, G., Krämer, E., Kreplin, H.P., Nitsche, W., Rist, U., Eds.; Springer: Cham, Switzerland, 2014; pp. 183–191. [Google Scholar]
- Kruse, M.; Wunderlich, T.; Heinrich, L. A Conceptual Study of a Transonic NLF Transport Aircraft with Forward Swept Wings. AIAA 2012-3208. In Proceedings of the 30th AIAA Applied Aerodynamics Conference, New Orlean, LA, USA, 25–28 June 2012. [Google Scholar]
- Seitz, A.; Kruse, M.; Wunderlich, T.; Bold, J.; Heinrich, L. The DLR Project LamAiR: Design of a NLF Forward Swept Wing for Short and Medium Range Transport Application. AIAA 2011-3526. In Proceedings of the 29th AIAA Applied Aerodynamics Conference, American Institute of Aeronautics and Astronautics, Honolulu, HI, USA, 27–30 June 2011. [Google Scholar]
- Schrauf, G.H.; Horstmann, K.H. Simplified Hybrid Laminar Flow Control. In Proceedings of the European Congress on Computational Methods in Applied Sciences and Engineering, ECCOMAS 2004, Jyväskylä, Finland, 24–28 July 2004. [Google Scholar]
- Rohardt, C.H.; Seitz, A.; Geyr, H.F.v.; Streit, T.; Schrauf, G.H.; Stuke, H. Simplified HLFC: Entwurf eines Seitenleitwerks mit Hybrid-Laminarhaltung für den Airbus A320. In Proceedings of the Deutscher Luft- und Raumfahrtkongress 2011, Bremen, Germany, 27–29 September 2011. [Google Scholar]
- Drela, M. XFOIL: An Analysis and Design System for Low Reynolds Number Airfoils. In Low Reynolds Number Aerodynamics, Proceedings of the Conference Notre Dame, Indiana, USA, 5–7 June 1989; Mueller, T.J., Ed.; Springer: Berlin/Heidelberg, Germany, 1989; pp. 1–12. [Google Scholar]
- Ferreira, C. Implementation of Boundary Layer Suction in XFOIL and Application of Suction Powered by Solar Cells at High Performance Sailplanes. Master’s Thesis, Delft University of Technology, Delft, The Netherlands, 2002. [Google Scholar]
- Broers, R.S.W. Extending XFOIL and xSoaring for Suction-Type Boundary Layer Control Calculations. Master’s Thesis, Delft University of Technology, Delft, The Netherlands, 2004. [Google Scholar]
- Bongers, J. Implementation of a New Transition Prediction Method in XFOIL. Master’s Thesis, Delft University of Technology, Delft, The Netherlands, 2006. [Google Scholar]
- Van Ingen, J.L. 50 years e^N. Historical Review 1956–2006 of Work at Delft Aerospace Low Speed Laboratory Including a New Version of the Method: Delft, The Netherlands. 2006. Available online: https://surfdrive.surf.nl/files/index.php/s/JNqoleDxl1ZREMP (accessed on 18 January 2018).
- Lachmann, G.V. Aspects of Design, Engineering and Operational Economy of Low Drag Aircraft. In Boundary Layer and Flow Control; Lachmann, G.V., Ed.; Pergamon Press: Oxford, UK, 1962; pp. 1123–1165. [Google Scholar]
- Risse, K. Preliminary Overall Aircraft Design with Hybrid Laminar Flow Control. Ph.D. Thesis, RWTH, Aachen University, Aachen, Germany, 2016. [Google Scholar]
- Kosin, R.E. Laminar Flow Control by Suction as applied to the X-21 Airplane. J. Aircr. 1965, 2, 384–390. [Google Scholar] [CrossRef]
- Wild, J. Mach and Reynolds Number Dependencies of the Stall Behavior of High-Lift Wing-Sections. J. Aircr. 2013, 50, 1202–1216. [Google Scholar] [CrossRef]
- Lyu, Z.; Martins, J.R.R.A. Aerodynamic Design Optimization Studies of a Blended-Wing-Body Aircraft. J. Aircr. 2014, 51, 1604–1617. [Google Scholar] [CrossRef]
- Holmes, B.J.; Croom, C.C.; Hastings, E.C., Jr.; Obara, C.J.; Vandam, C.P. Flight Research on Natural Laminar Flow. N88-14950; In Langley Symposium on Aerodynamics; NASA Langley Research Center: Hampton, VA, USA, 1986; Volume 1, pp. 461–474. [Google Scholar]
- Pfenninger, W. Long Range LFC Transport. In Research in Natural Laminar Flow and Laminar-Flow Control; Hefner, J.N., Frances, E.S., Eds.; NASA Langley Research Center: Hampton, VA, USA, 1987. [Google Scholar]
- Schwamborn, D.; Gerhold, T.; Heinrich, R. The DLR TAU-Code. Recent Applications in Research and Industry. 2006. Available online: https://repository.tudelft.nl/islandora/object/uuid%3A59162917-d24d-4f11-955f-feaeaa21e2c1/datastream/OBJ/download (accessed on 18 January 2018).
- Schwamborn, D.; Gardner, A.; Geyr, H.F.v.; Krumbein, A.; Lüdeke, H.; Stürmer, A. Development of the TAU-Code for Aerospace Applications. In Proceedings of the 50th NAL International Conference on Aerospace Science and Technology, Bangalore, India, 26–28 June 2008. [Google Scholar]
- Menter, F.R. Zonal Two Equation k-w Turbulence Models for Aerodynamic Flows. In Proceedings of the 23rd AIAA Fluid Dynamics, Plasmadynamics, and Lasers Conference, Orlando, FL, USA, 6–9 July 1993. [Google Scholar]
- Menter, F.R. Two-Equation Eddy-Viscosity Turbulence Models for Engineering Applications. AIAA J. 1994, 32, 1598–1605. [Google Scholar] [CrossRef]
- Gur, O.; Mason, W.H.; Schetz, J.A. Full-Configuration Drag Estimation. J. Aircr. 2010, 47, 1356–1367. [Google Scholar] [CrossRef]
- Raymer, D.P. Aircraft Design. A Conceptual Approach, 2nd ed.; American Institute of Aeronautics and Astronautics: Washington, DC, USA, 1992. [Google Scholar]
- Hoak, D.E. The USAF Stability and Control DATCOM; TR-83-3048; Air Force Wright Aeronautical Laboratories: Dayton, OH, USA, 1978; Available online: https://www.abbottaerospace.com/wpdm-package/afwal-tr-83-3048-usaf-stability-and-control-datcom?wpdmdl=35165&ind=1495549840450 (accessed on 18 January 2018).
- Liu, Y.; Elham, A.; Horst, P.; Hepperle, M. Exploring Vehicle Level Benefits of Revolutionary Technology Progress via Aircraft Design and Optimization. Energies 2018, 11, 166. [Google Scholar] [CrossRef]


© 2018 by the authors. Licensee MDPI, Basel, Switzerland. This article is an open access article distributed under the terms and conditions of the Creative Commons Attribution (CC BY) license (http://creativecommons.org/licenses/by/4.0/).