Linking of Barriers to Energy Efficiency Improvement in Indonesia’s Steel Industry

 , and
, and
Abstract
1. Introduction
2. Methods
3. The Development of Conceptual Framework Regarding Barriers to EEI
4. Theory Development
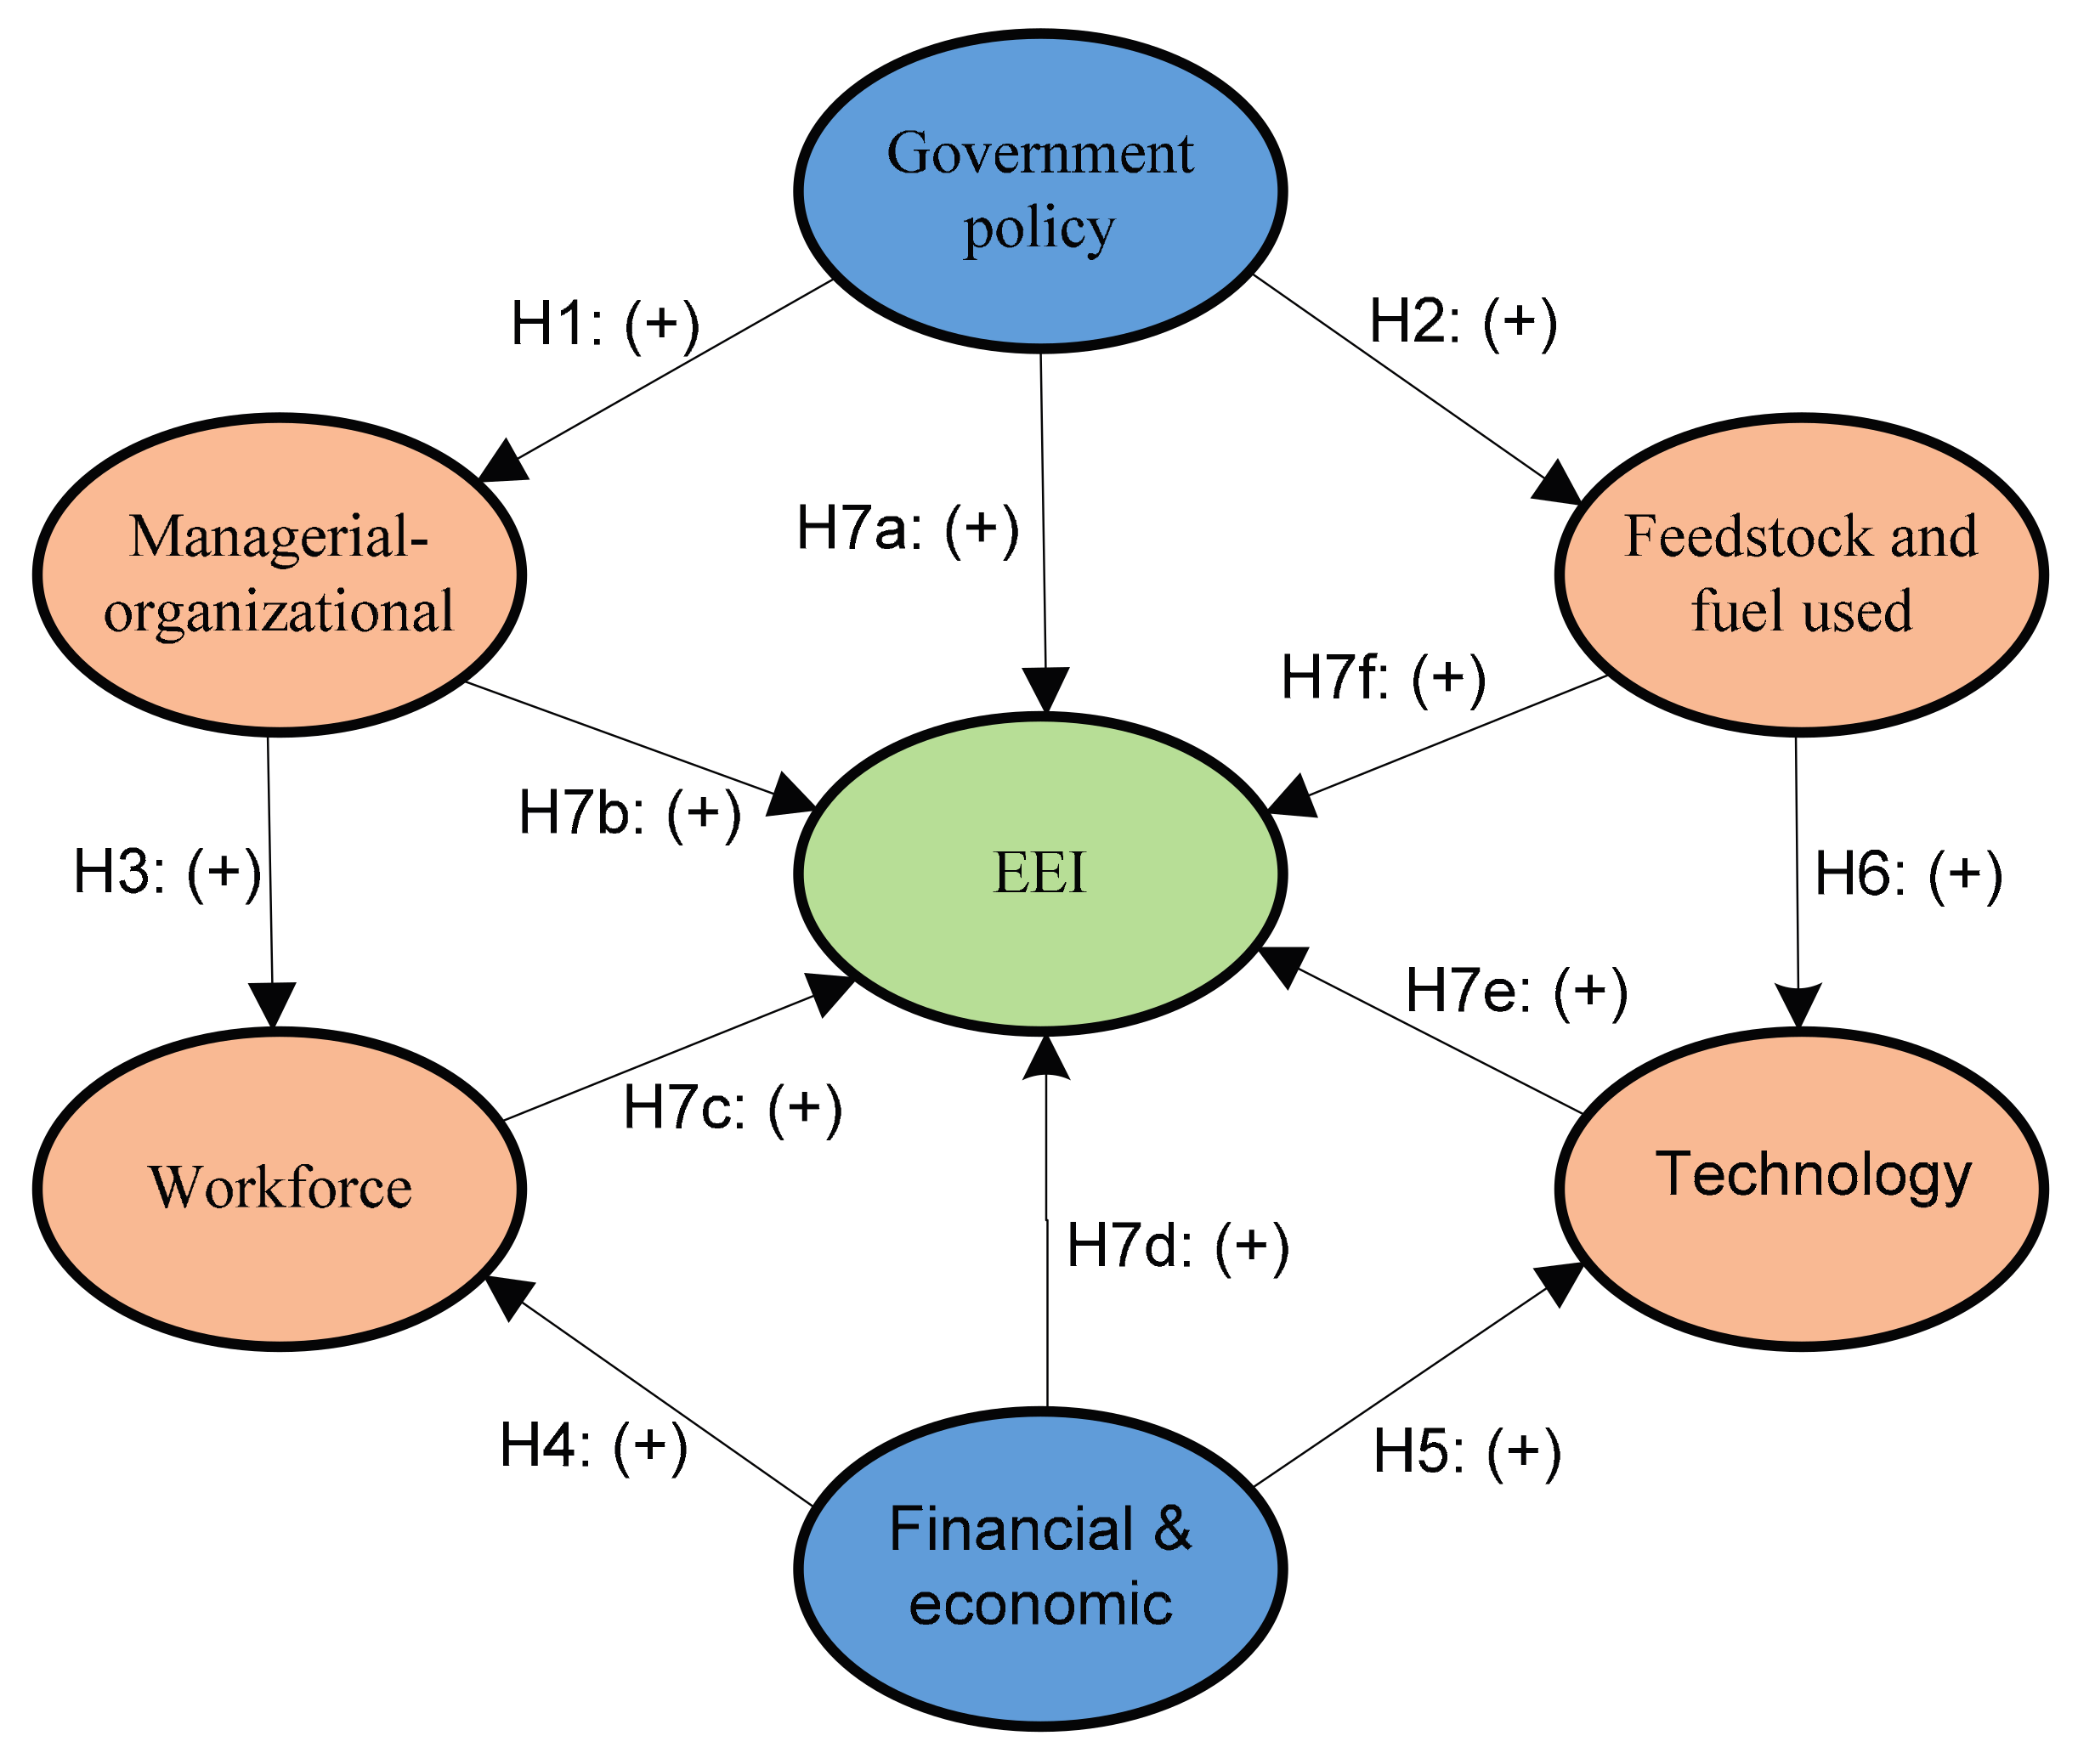
4.1. Proposed Conceptual Framework
4.2. Hypotheses Development
5. Results
5.1. The Measurement Model Evaluation
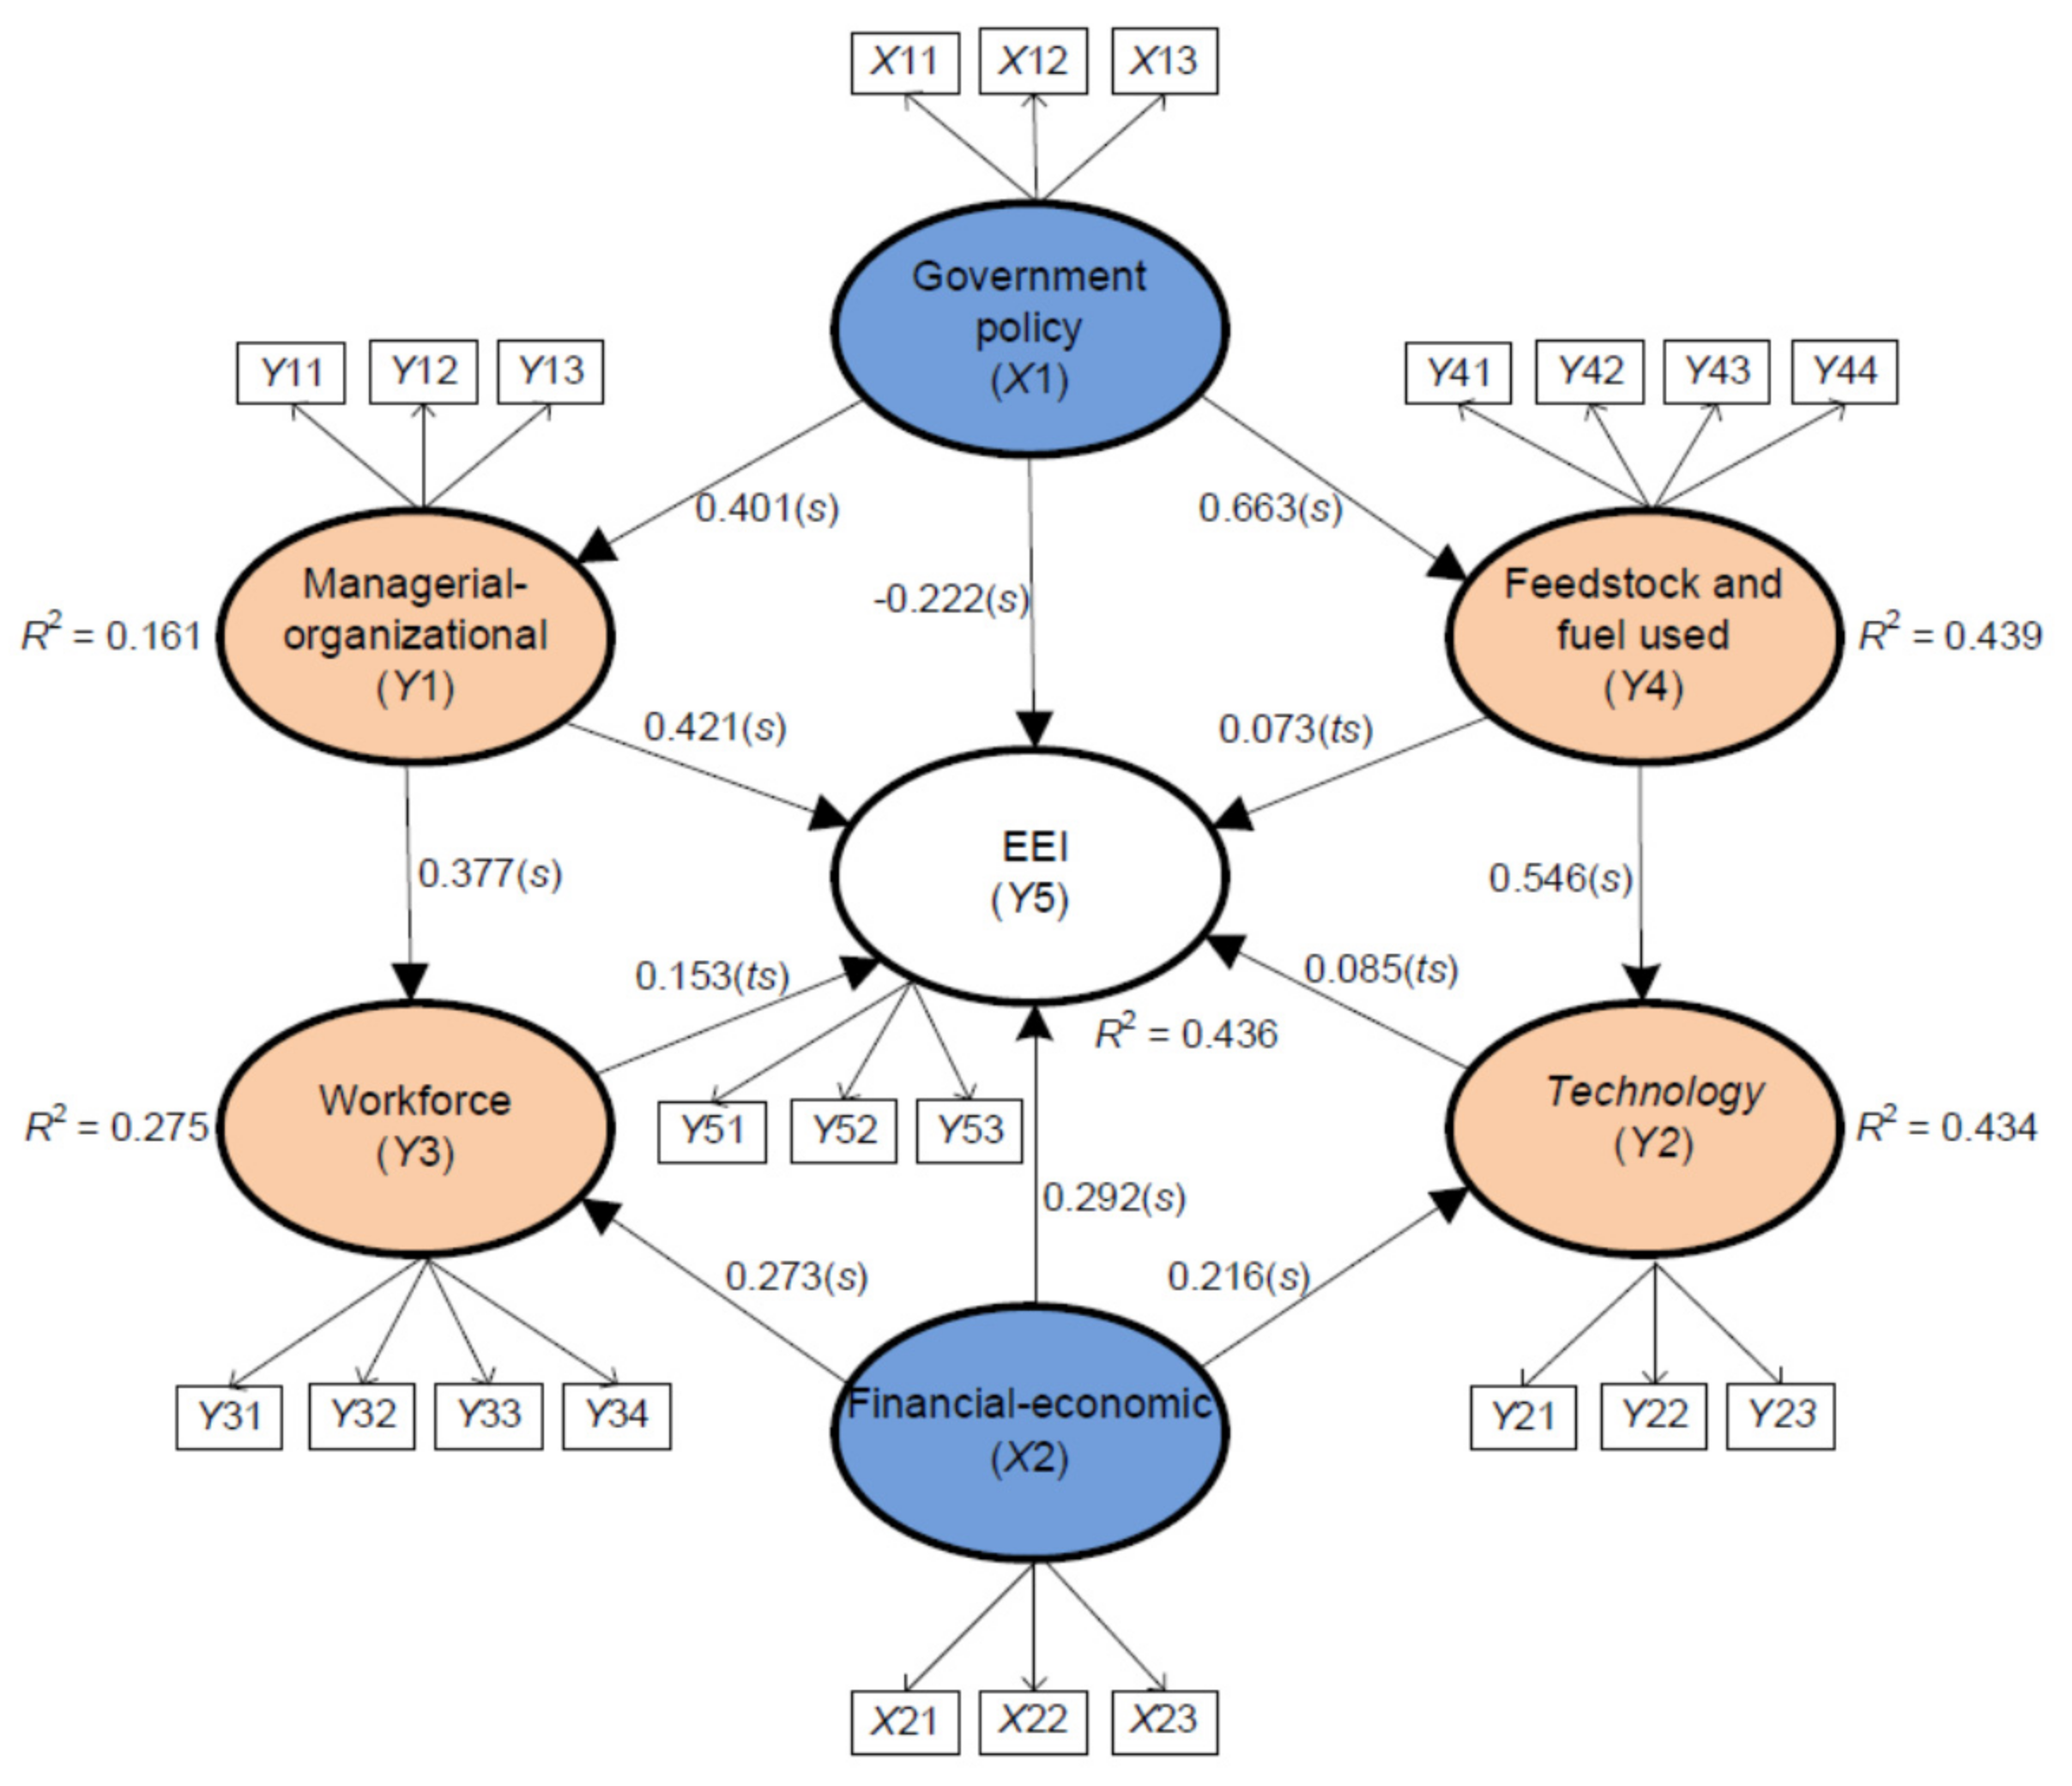
5.2. The Structural Model Evaluation
6. Discussion
7. Conclusions
Acknowledgments
Author Contributions
Conflicts of Interest
Appendix A. Summary of Questionnaire
Appendix A.1. Government Policy
- 1.
- Absence of economic incentiveregulation for industry that implements the EEI.
- 2.
- Lack of incentive amount.
- 3.
- Distortion in energy efficiency policies.
Appendix A.2. Financial and Economic
- 4.
- Slow rate of return on the investment.
- 5.
- High initial capital cost.
- 6.
- Hidden cost of production disruption/inconvenience.
Appendix A.3. Managerial and Organizational
- 7.
- Low priority given to energy management.
- 8.
- Management resistance to change.
- 9.
- Long decision-making process.
Appendix A.4. Technological
- 10.
- Inadequate energy-efficient technologies.
- 11.
- Lack of the integrated technical skill.
- 12.
- Long period for adjustment of energy-efficient technologies.
Appendix A.5. Workforce
- 13.
- Lack of skilled technical personnel.
- 14.
- Lack of staff awareness.
- 15.
- Focus on the daily production problems.
- 16.
- Lack of employee training on energy conservation.
Appendix A.6. Quality and Type of Feedstock and Fuel Used
- 17.
- Quality of raw material or feedstock used.
- 18.
- Quantity of scrap used.
- 19.
- Type of energy or fuel used
- 20.
- Energy prices.
References
- Fleiter, T.; Worrell, E.; Eichhammer, W. Barriers to energy efficiency in industrial bottom-up energy demand models—A review. Renew. Sustain. Energy Rev. 2011, 15, 3099–3111. [Google Scholar] [CrossRef]
- Abeelen, C.; Harmsen, R.; Worrell, E. Implementation of energy efficiency projects by Dutch industry. Energy Policy 2013, 63, 408–418. [Google Scholar] [CrossRef]
- Paramonova, S.; Thollander, P.; Ottosson, M. Quantifying the extended energy efficiency gap-evidence from Swedish electricity-intensive industries. Renew. Sustain. Energy Rev. 2015, 51, 472–483. [Google Scholar] [CrossRef]
- Karbuz, S. Achieving accurate international comparisons of manufacturing energy use data. Energy Policy 1998, 26, 973–979. [Google Scholar] [CrossRef]
- Farla, J.C.; Blok, K. The quality of energy intensity indicators for international comparison in the iron and steel industry. Energy Policy 2001, 29, 523–543. [Google Scholar] [CrossRef]
- International Energy Agency (IEA). Key World Energy Statistics; International Energy Agency (IEA): Paris, France, 2014. [Google Scholar]
- Reddy, A.K. Barriers to improvements in energy efficiency. Energy Policy 1991, 19, 953–961. [Google Scholar] [CrossRef]
- Price, L.; Worrell, E.; Phylipsen, D. Energy Use and Carbon Dioxide Emissions in Energy-Intensive Industries in Key Developing Countries; Lawrence Berkeley National Laboratory: Berkeley, CA, USA, 1999.
- Intergovernmental Panel on Climate Change (IPCC) Working Group 3. Climate Change 2007: Mitigation Contribution of Working Group III to the Fourth Assessment Report of the Intergovernmental Panel on Climate Change: Summary for Policymakers and Technical Summary; Cambridge University Press: Cambridge, UK, 2007. [Google Scholar]
- Worrell, E.; Bernstein, L.; Roy, J.; Price, L.; Harnisch, J. Industrial energy efficiency and climate change mitigation. Energy Effic. 2009, 2, 109–123. [Google Scholar] [CrossRef]
- Soepardi, A.; Pratikto, P.; Santosa, P.B.; Tama, I.P. An updated literature review of agile manufacturing: Classification and trends. Int. J. Ind. Syst. Eng. 2018, in press. [Google Scholar]
- Schleich, J.; Gruber, E. Beyond case studies: Barriers to energy efficiency in commerce and the services sector. Energy Econ. 2008, 30, 449–464. [Google Scholar] [CrossRef]
- Brunke, J.C.; Johansson, M.; Thollander, P. Empirical investigation of barriers and drivers to the adoption of energy conservation measures, energy management practices and energy services in the Swedish iron and steel industry. J. Clean. Prod. 2014, 84, 509–525. [Google Scholar] [CrossRef]
- Hirst, E.; Brown, M. Closing the efficiency gap: Barriers to the efficient use of energy. Resour. Conserv. Recycl. 1990, 3, 267–281. [Google Scholar] [CrossRef]
- Weber, L. Some reflections on barriers to the efficient use of energy. Energy Policy 1997, 25, 833–835. [Google Scholar] [CrossRef]
- Liu, Z.; Liu, J.; Wang, Y. Energy consumption in the iron and steel industry in PR China. Energy Sustain. Dev. 1996, 3, 18–24. [Google Scholar] [CrossRef]
- World Steel Association (WSA). Global Economics Outlook and Steel Demand Trends. Available online: https://www.worldsteel.org/dms/internetDocumentList/downloads/media-centre/Alacero-speech-Oct-2012-FINAL/ (accessed on 12 January 2016).
- Agency for The Assessment and Application of Technology (AAAT). Planning of Energy Efficiency and Elasticity; AAAT: Banten, Indonesia, 2013. [Google Scholar]
- Shi, H.; Peng, S.Z.; Liu, Y.; Zhong, P. Barriers to the implementation of cleaner production in Chinese SMEs: Government, industry and expert stakeholders’ perspectives. J. Clean. Prod. 2008, 16, 842–852. [Google Scholar] [CrossRef]
- Rohdin, P.; Thollander, P. Barriers to and driving forces for energy efficiency in the non-energy intensive manufacturing industry in Sweden. Energy 2006, 31, 1836–1844. [Google Scholar] [CrossRef]
- Schleich, J. Barriers to energy efficiency: A comparison across the German commercial and services sector. Ecol. Econ. 2009, 68, 2150–2159. [Google Scholar] [CrossRef]
- Brown, M.A. Market failures and barriers as a basis for clean energy policies. Energy Policy 2001, 29, 1197–1207. [Google Scholar] [CrossRef]
- Worrell, E.; Angelini, T.; Masanet, E. Managing Your Energy; An Energy Star Guide for Identifying Energy Savings in Manufacturing Plants; Lawrence Berkeley National Laboratory: Berkeley, CA, USA, 2010.
- Chai, K.H.; Yeo, C. Overcoming energy efficiency barriers through systems approach—A conceptual framework. Energy Policy 2012, 46, 460–472. [Google Scholar] [CrossRef]
- Cagno, E.; Worrell, E.; Trianni, A.; Pugliese, G. A novel approach for barriers to industrial energy efficiency. Renew. Sustain. Energy Rev. 2013, 19, 290–308. [Google Scholar] [CrossRef]
- Sorrell, S.; O’Malley, E.; Schleich, J.; Scott, S. The Economics of Energy Efficiency-Barriers to Cost Effective Investment; Edward Elgar Publishing: Cheltenham, UK, 2004. [Google Scholar]
- Yin, R.K. Case Study Research: Design and Methods, 3th ed.; SAGE Publication: Thousand Oaks, CA, USA, 2003. [Google Scholar]
- Chin, W.W.; Newsted, P.R. Structural equation modeling analysis with small samples using partial least squares. In Statistical Strategies for Small Sample Research, 2nd ed.; Hoyle, R.H., Ed.; SAGE Publication: Thousand Oaks, CA, USA, 1999; pp. 307–341. ISBN 9780761908869. [Google Scholar]
- Chong, A.Y.-L.; Chan, F.T.S. Structural equation modeling for multi-stage analysis on Radio Frequency Identification (RFID) diffusion in the health care industry. Expert Syst. Appl. 2012, 39, 8645–8654. [Google Scholar] [CrossRef]
- Kim, K.-J.; Cho, H.-W.; Jeong, I.-J.; Park, J.-C.; Park, Y.-J.; Kim, C.-G.; Kim, T.-H. Service quality analysis and improvement: Development of a systematic framework. Int. J. Ind. Eng. Theory Appl. Pract. 2006, 13, 177–187. [Google Scholar]
- Anderson, J.C.; Gerbing, D.W. Structural equation modeling in practice: A review and recommended two-step approach. Psychol. Bull. 1988, 103, 411. [Google Scholar] [CrossRef]
- Hulland, J. Use of partial least squares (PLS) in strategic management research: A review of four recent studies. Strat. Manag. J. 1999, 20, 195–204. [Google Scholar] [CrossRef]
- Jaffe, A.B.; Stavins, R.N. The energy-efficiency gap. What does it mean? Energy Policy 1994, 22, 804–810. [Google Scholar] [CrossRef]
- Foddy, W. Constructing Questions for Interviews and Questionnaires: Theory and Practice in Social Research; Cambridge University Press: Cambridge, UK, 1994. [Google Scholar]
- Olsthoorn, M.; Schleich, J.; Klobasa, M. Barriers to electricity load shift in companies: A survey-based exploration of the end-user perspective. Energy Policy 2015, 76, 32–42. [Google Scholar] [CrossRef]
- Blumstein, C.; Krieg, B.; Schipper, L.; York, C. Overcoming social and institutional barriers to energy conservation. Energy 1980, 5, 355–371. [Google Scholar] [CrossRef]
- Gruber, E.; Brand, M. Promoting energy conservation in small-and medium-sized companies. Energy Policy 1991, 19, 279–287. [Google Scholar] [CrossRef]
- Painuly, J.P.; Reddy, B.S. Electricity conservation programs: Barriers to their implementation. Energy Sources 1996, 18, 257–267. [Google Scholar] [CrossRef]
- Cooray, N. Cleaner Production Assessment in Small and Medium Industries of Sri Lanka. In Global Competitiveness through Cleaner Production, Proceedings of the Second Asia Pacific Cleaner Production Roundtable, Roundtable, 21–23 April 1999; Brisbane Convention & Exhibition Centre: Brisbane, Australia, 1999. [Google Scholar]
- Sorrell, S.; Schleich, J.; Scott, S.; O’Malley, E.; Trace, F.; Boede, E.; Ostertag, K.; Radgen, P. Reducing Barriers to Energy Efficiency in Public and Private Organizations; Science and Technology Police Research (SPRU): Brighton, UK, 2000. [Google Scholar]
- Harris, J.; Anderson, J.; Shafron, W. Investment in energy efficiency: A survey of Australian firms. Energy Policy 2000, 28, 867–876. [Google Scholar] [CrossRef]
- De Groot, H.L.; Verhoef, E.T.; Nijkamp, P. Energy saving by firms: Decision-making, barriers and policies. Energy Econ. 2001, 23, 717–740. [Google Scholar] [CrossRef]
- Intergovernmental Panel on Climate Change (IPPC). Barriers, Opportunities, and Market Potential of Technologies and Practices (Chapter 5) in Climate Change 2001: Mitigation Contribution of Working Group III to the Third Assessment Report of the Intergovernmental Panel on Climate Change; Cambridge University Press: Cambridge, UK, 2001. [Google Scholar]
- Reddy, B.S. Barriers to the Diffusion of Renewable Energy Technologies—A Case Study of the State of Maharashtra, India; UNEP Collaborating Centre on Energy and Environment Riso National Laboratory: Roskilde, Denmark, 2001; pp. 68–72. ISBN 87-550-3039-4. [Google Scholar]
- De Almeida, A.T.; Fonseca, P.; Bertoldi, P. Energy-efficient motor systems in the industrial and in the services sectors in the European Union: Characterisation, potentials, barriers and policies. Energy 2003, 28, 673–690. [Google Scholar] [CrossRef]
- Thiruchelvam, M.; Kumar, S.; Visvanathan, C. Policy options to promote energy efficient and environmentally sound technologies in small-and medium-scale industries. Energy Policy 2003, 31, 977–987. [Google Scholar] [CrossRef]
- Anderson, S.T.; Newell, R.G. Information programs for technology adoption: The case of energy-efficiency audits. Resour. Energy Econ. 2004, 26, 27–50. [Google Scholar] [CrossRef]
- Reddy, B.S.; Assenza, G. Barriers and Drivers to Energy Efficiency; WP-2007-003; IGIDR Working Paper Series; Indira Gandhi Institute of Development Research: Mumbai, India, 2007. [Google Scholar]
- Sardianou, E. Barriers to industrial energy efficiency investments in Greece. J. Clean. Prod. 2008, 16, 1416–1423. [Google Scholar] [CrossRef]
- Oikonomou, E.K.; Kilias, V.; Goumas, A.; Rigopoulos, A.; Karakatsani, E.; Damasiotis, M.; Papastefanakis, D.; Marini, N. Renewable energy sources (RES) projects and their barriers on a regional scale: The case study of wind parks in the Dodecanese islands, Greece. Energy Policy 2009, 37, 4874–4883. [Google Scholar] [CrossRef]
- Kostka, G.; Moslener, U.; Andreas, J.G. Barriers to Energy Efficiency Improvement: Empirical Evidence from Small- and Medium-Sized Enterprises in China; Working Paper Series, No. 178; Frankfurt School of Finance and Management: Frankfurt, Germany, 2011. [Google Scholar]
- Muthulingam, S.; Corbett, C.J.; Benartzi, S.; Oppenheim, B. Investment in Energy Efficiency by Small- and Medium-Sized Firms: An Empirical Analysis of the Adoption of Process Improvement Recommendations; Anderson Graduate School of Management–Decisions, Operations, and Technology Management; UCLA: Los Angeles, CA, USA, 2011. [Google Scholar]
- Okazaki, T.; Yamaguchi, M. Accelerating the transfer and diffusion of energy saving technologies steel sector experience—Lessons learned. Energy Policy 2011, 39, 1296–1304. [Google Scholar] [CrossRef]
- Cooremans, C. Investment in energy efficiency: Do the characteristics of investments matter? Energy Effic. 2012, 5, 497–518. [Google Scholar] [CrossRef]
- Fleiter, T.; Schleich, J.; Ravivanpong, P. Adoption of energy-efficiency measures in SMEs—An empirical analysis based on energy audit data from Germany. Energy Policy 2012, 51, 863–875. [Google Scholar] [CrossRef]
- Trianni, A.; Cagno, E. Dealing with barriers to energy efficiency and SMEs: Some empirical evidences. Energy 2012, 37, 494–504. [Google Scholar] [CrossRef]
- Walsh, C.; Thornley, P. Barriers to improving energy efficiency within the process industries with a focus on low grade heat utilisation. J. Clean. Prod. 2012, 23, 138–146. [Google Scholar] [CrossRef]
- Karakaya, E.; Sriwannawit, P. Barriers to the adoption of photovoltaic systems: The state of the art. Renew. Sustain. Energy Rev. 2015, 49, 60–66. [Google Scholar] [CrossRef]
- Meath, C.; Linnenluecke, M.; Griffiths, A. Barriers and motivators to the adoption of energy savings measures for small-and medium-sized enterprises (SMEs): The case of the Climate Smart Business Cluster program. J. Clean. Prod. 2016, 112, 3597–3604. [Google Scholar] [CrossRef]
- Nagesha, N.; Balachandra, P. Barriers to energy efficiency in small industry clusters: Multi-criteria-based prioritization using the analytic hierarchy process. Energy 2006, 31, 1969–1983. [Google Scholar] [CrossRef]
- Wang, G.; Wang, Y.; Zhao, T. Analysis of interactions among the barriers to energy saving in China. Energy Policy 2008, 36, 1879–1889. [Google Scholar] [CrossRef]
- Hasanbeigi, A.; Menke, C.; Du Pont, P. Barriers to energy efficiency improvement and decision-making behavior in Thai industry. Energy Effic. 2010, 3, 33–52. [Google Scholar] [CrossRef]
- Siitonen, S.; Tuomaala, M.; Ahtila, P. Variables affecting energy efficiency and CO2 emissions in the steel industry. Energy Policy 2010, 38, 2477–2485. [Google Scholar] [CrossRef]
- Sarzynski, A.; Larrieu, J.; Shrimali, G. The impact of state financial incentives on market deployment of solar technology. Energy Policy 2012, 46, 550–557. [Google Scholar] [CrossRef]
- Flues, F.; Rübbelke, D.; Vögele, S. An analysis of the economic determinants of energy efficiency in the European iron and steel industry. J. Clean. Prod. 2015, 104, 250–263. [Google Scholar] [CrossRef]
- Henriques, I.; Sadorsky, P. The relationship between environmental commitment and managerial perceptions of stakeholder importance. Acad. Manag. J. 1999, 42, 87–99. [Google Scholar] [CrossRef]
- Luiten, E.; Van Lente, H.; Blok, K. Slow technologies and government intervention: Energy efficiency in industrial process technologies. Technovation 2006, 26, 1029–1044. [Google Scholar] [CrossRef]
- Dasgupta, S.; Roy, J. Understanding technological progress and input price as drivers of energy demand in manufacturing industries in India. Energy Policy 2015, 83, 1–13. [Google Scholar] [CrossRef]
- European Commisions (EC). Directive of The European Parliament and of The Council Amending 2012/27/EU on Energy Efficiency; EC: Brussels, Belgium, 2012. [Google Scholar]
- Melo, M.O.; da Silva, L.B.; Campello, S. Industry energy efficiency analysis in Northeast Brazil: Proposal of methodology and case studies. Int. J. Ind. Eng. 2012, 19, 428–443. [Google Scholar]
- Akash, B.A.; Mohsen, M.S. Current situation of energy consumption in the Jordanian industry. Energy Convers. Manag. 2003, 44, 1501–1510. [Google Scholar] [CrossRef]
- Worrell, E.; Price, L. Policy scenarios for energy efficiency improvement in industry. Energy Policy 2001, 29, 1223–1241. [Google Scholar] [CrossRef]
- Caffal, C. Energy Management in Industry; Analysis Series; Centre for the Analysis and Dissemination of Demonstrated Energy Technologies (CADDET): Sittard, The Netherlands, 1995. [Google Scholar]
- Sandberg, P.; Söderström, M. Industrial energy efficiency: The need for investment decision support from a manager perspective. Energy Policy 2003, 31, 1623–1634. [Google Scholar] [CrossRef]
- Backlund, S.; Thollander, P.; Palm, J.; Ottosson, M. Extending the energy efficiency gap. Energy Policy 2012, 51, 392–396. [Google Scholar] [CrossRef]
- Ren, T. Barriers and drivers for process innovation in the petrochemical industry: A case study. J. Eng. Technol. Manag. 2009, 26, 285–304. [Google Scholar] [CrossRef]
- Cagno, E.; Ramirez-Portilla, A.; Trianni, A. Linking energy efficiency and innovation practices: Empirical evidence from the foundry sector. Energy Policy 2015, 83, 240–256. [Google Scholar] [CrossRef]
- Rohdin, P.; Thollander, P.; Solding, P. Barriers to and drivers for energy efficiency in the Swedish foundry industry. Energy Policy 2007, 35, 672–677. [Google Scholar] [CrossRef]
- Thollander, P.; Ottosson, M. An energy efficient Swedish pulp and paper industry–exploring barriers to and driving forces for cost-effective energy efficiency investments. Energy Effic. 2008, 1, 21–34. [Google Scholar] [CrossRef]
- World Energy Council (WEC). Energy Efficiency Improvement Using High Technology, An Assessment of Nergy Use in Industry and Buildings; World Energy Council (WEC): London, UK, 1995. [Google Scholar]
- Worrell, E.; Neelis, M.; Price, L.; Galitsky, C.; Zhou, N. World Best Practice Energy Intensity Values for Selected Industrial Sectors; Lawrence Berkeley National Laboratory: Berkeley, CA, USA, 2008.
- Price, L.; Sinton, J.; Worrell, E.; Phylipsen, D.; Xiulian, H.; Ji, L. Energy use and carbon dioxide emissions from steel production in China. Energy 2002, 27, 429–446. [Google Scholar] [CrossRef]
- Hair, J.F.; Black, W.C.; Babin, B.J.; Anderson, R.E.; Tatham, R.L. Multivariate Data Analysis, 6th ed.; Pearson Education: Cranbury, NJ, USA, 2006. [Google Scholar]
- Bagozzi, R.P.; Yi, Y. On the evaluation of structural equation models. J. Acad. Mark. Sci. 1988, 16, 74–94. [Google Scholar] [CrossRef]
- Hair, J.F.; Ringle, C.M.; Sarstedt, M. Editorial-partial least squares structural equation modeling: Rigorous applications, better results and higher acceptance. Long Range Plan. 2013, 46, 1–12. [Google Scholar] [CrossRef]
- Birkinshaw, J.; Morrison, A.; Hulland, J. Structural and competitive determinants of a global integration strategy. Strat. Manag. J. 1995, 16, 637–655. [Google Scholar] [CrossRef]
- Kock, N.; Lynn, G. Lateral collinearity and misleading results in variance-based SEM: An illustration and recommendations. J. Assoc. Inf. Syst. 2012, 13, 546–580. [Google Scholar]
- Chin, W.W. The partial leat squares approach to structural equation modeling. In Modern Methods for Business Research; Marcoulides, G.A., Ed.; Lawrence Erlbaum Associates: London, UK, 1998. [Google Scholar]
- Trianni, A.; Cagno, E.; Worrell, E. Innovation and adoption of energy efficient technologies: An exploratory analysis of Italian primary metal manufacturing SMEs. Energy Policy 2013, 61, 430–440. [Google Scholar] [CrossRef]
- Indonesia Iron Steel Industry Association (IISIA). Role and Prospect of National Steel Industry; IISIA: Jakarta, Indonesia, 2015. [Google Scholar]
- Apeaning, R.W.; Thollander, P. Barriers to and driving forces for industrial energy efficiency improvements in African industries—A case study of Ghana’s largest industrial area. J. Clean. Prod. 2013, 53, 204–213. [Google Scholar] [CrossRef]
- McKane, A.; Williams, R.; Perry, W.; Li, T. Setting the Standard for Industrial Energy Efficiency; Lawrence Berkeley National Laboratory: Berkeley, CA, USA, 2008.
- Thollander, P.; Palm, J. Improving Energy Efficiency in Industrial Energy Systems: An Interdisciplinary Perspective on Barriers, Energy Audits, Energy Management, Policies, and Programs; Springer Science & Business Media: London, UK, 2012; pp. 85–104. ISBN 978-1-4471-4161-7. [Google Scholar]
- Barclay, D.W.; Higgins, C.; Thompson, R. The partial least least squares approach to causal modeling: Personal computer adoption and use illustration. Technol. Stud. 1995, 2, 285–309. [Google Scholar]
- Eisenhardt, K.M.; Graebner, M.E. Theory building from cases: opportunities and challenges. Acad. Manag. Rev. 2007, 50, 25–32. [Google Scholar] [CrossRef]
- Pratt, M.G. Fitting oval pegs into round holes: Tensions in evaluating and publishing qualitative research in top-tier North American Journals. Organ. Res. Meth. 2008, 11, 481–509. [Google Scholar] [CrossRef]


| Company | Age ofthe Firm (Years) | Firm Size (Number of Employees) | Asset (Million $) | Ownership Pattern (Investment) | Type of Final Product | Number of Respondents 1 |
|---|---|---|---|---|---|---|
| A | 47 | >1000 | 5–10 | Domestic | Billet, semi finished | 4 |
| B | 30 | >1000 | >50 | Foreign | Bloom, semi finished, flat & long product | 3 |
| C | 42 | 100–500 | >50 | Domestic | Crude steel, long product | 3 |
| D | 45 | 100–500 | 5–10 | Domestic | Billet, long product | 3 |
| E 2 | 46 | >1000 | >50 | Domestic | Slab, billet, semi finished | 4 |
| F 3 | 6 | >1000 | >50 | Joint venture | Slab, semi finished | 3 |
| G | 27 | 500–1000 | >50 | Domestic | Billet, long product | 3 |
| H | 11 | 100–500 | >50 | Foreign | Long product | 4 |
| I | 44 | >1000 | >50 | Domestic | Billet, semi finished, long product | 2 |
| J | 43 | 100–500 | >50 | Joint venture | Billet, long product | 4 |
| K | 40 | 100–500 | >50 | Foreign | Billet, semi finished | 3 |
| L | 46 | 100–500 | >50 | Joint venture | Crude steel | 2 |
| Data collection method | : Structured questionnaire sent out to respondents by email |
| Time frame | : February–April 2016 |
| Geographical area | : Indonesia |
| Population under study | : Steel manufacturers with NACE Rev. 2 1 code CH 24.10 which had an electric arc furnace or blast furnace |
| Population census | : 18 firms |
| Sample size | : 12 firms with 38 personnel respondents |
| A valid response rate | : 67% of firms |
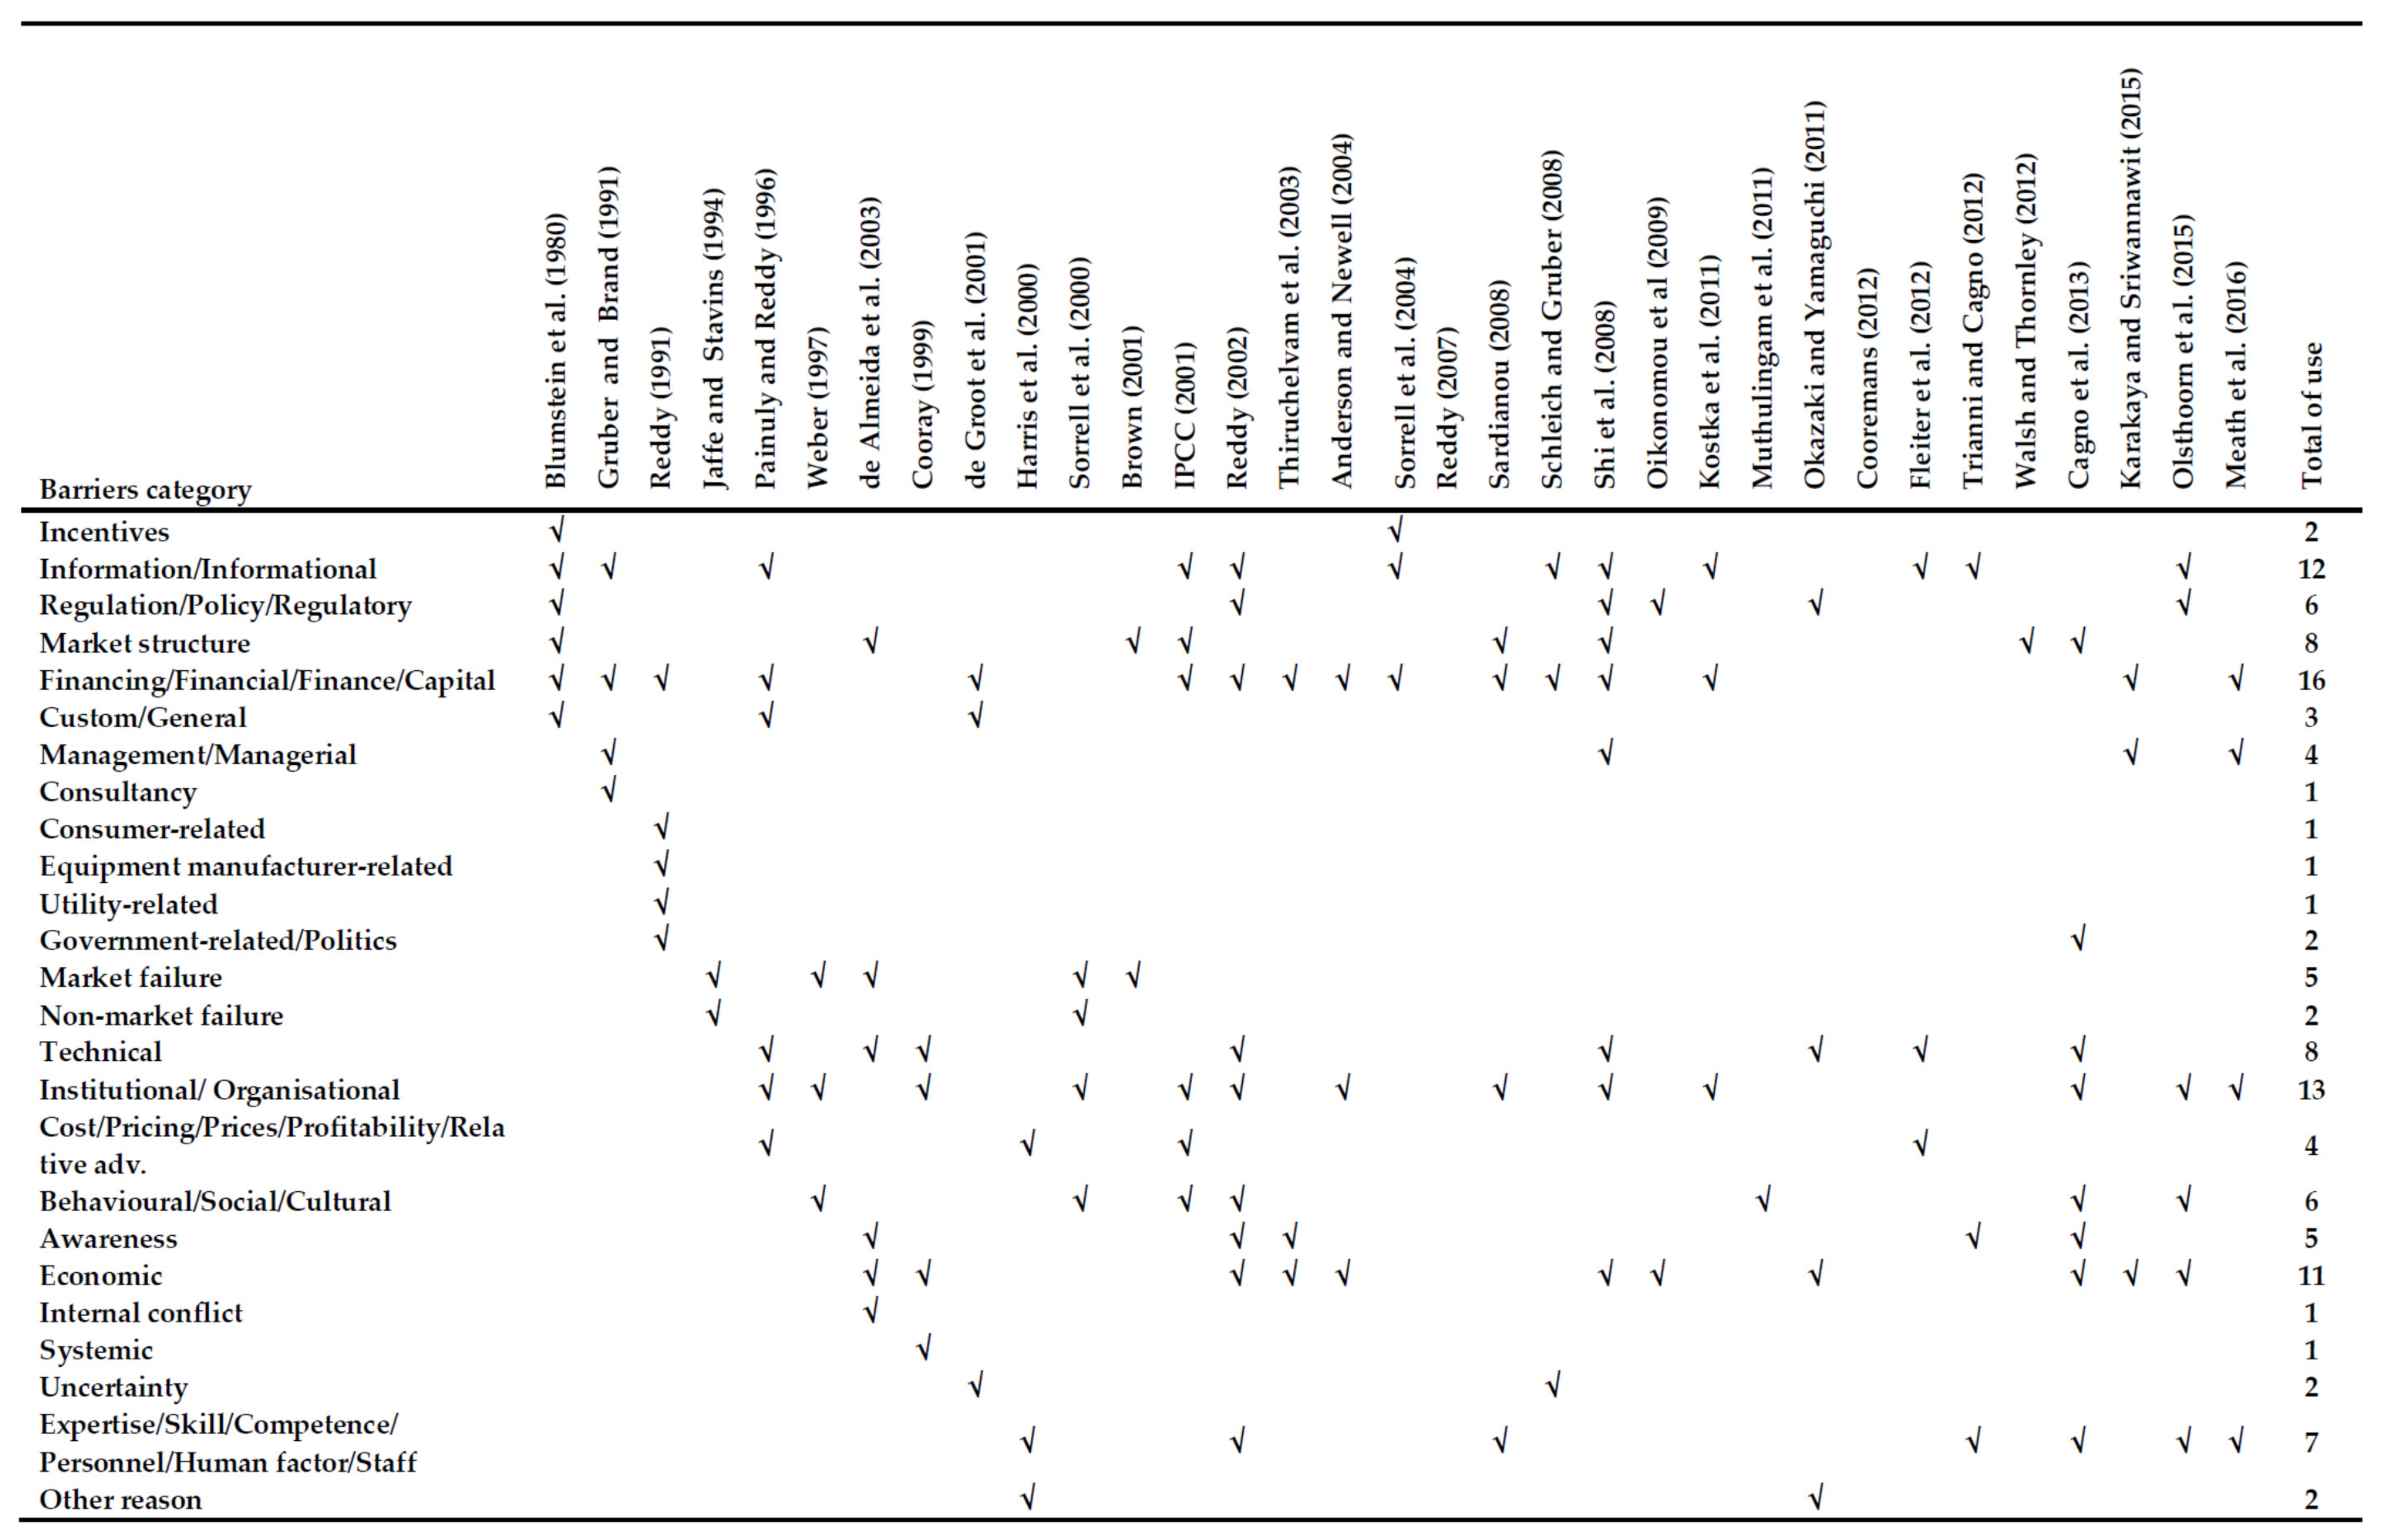
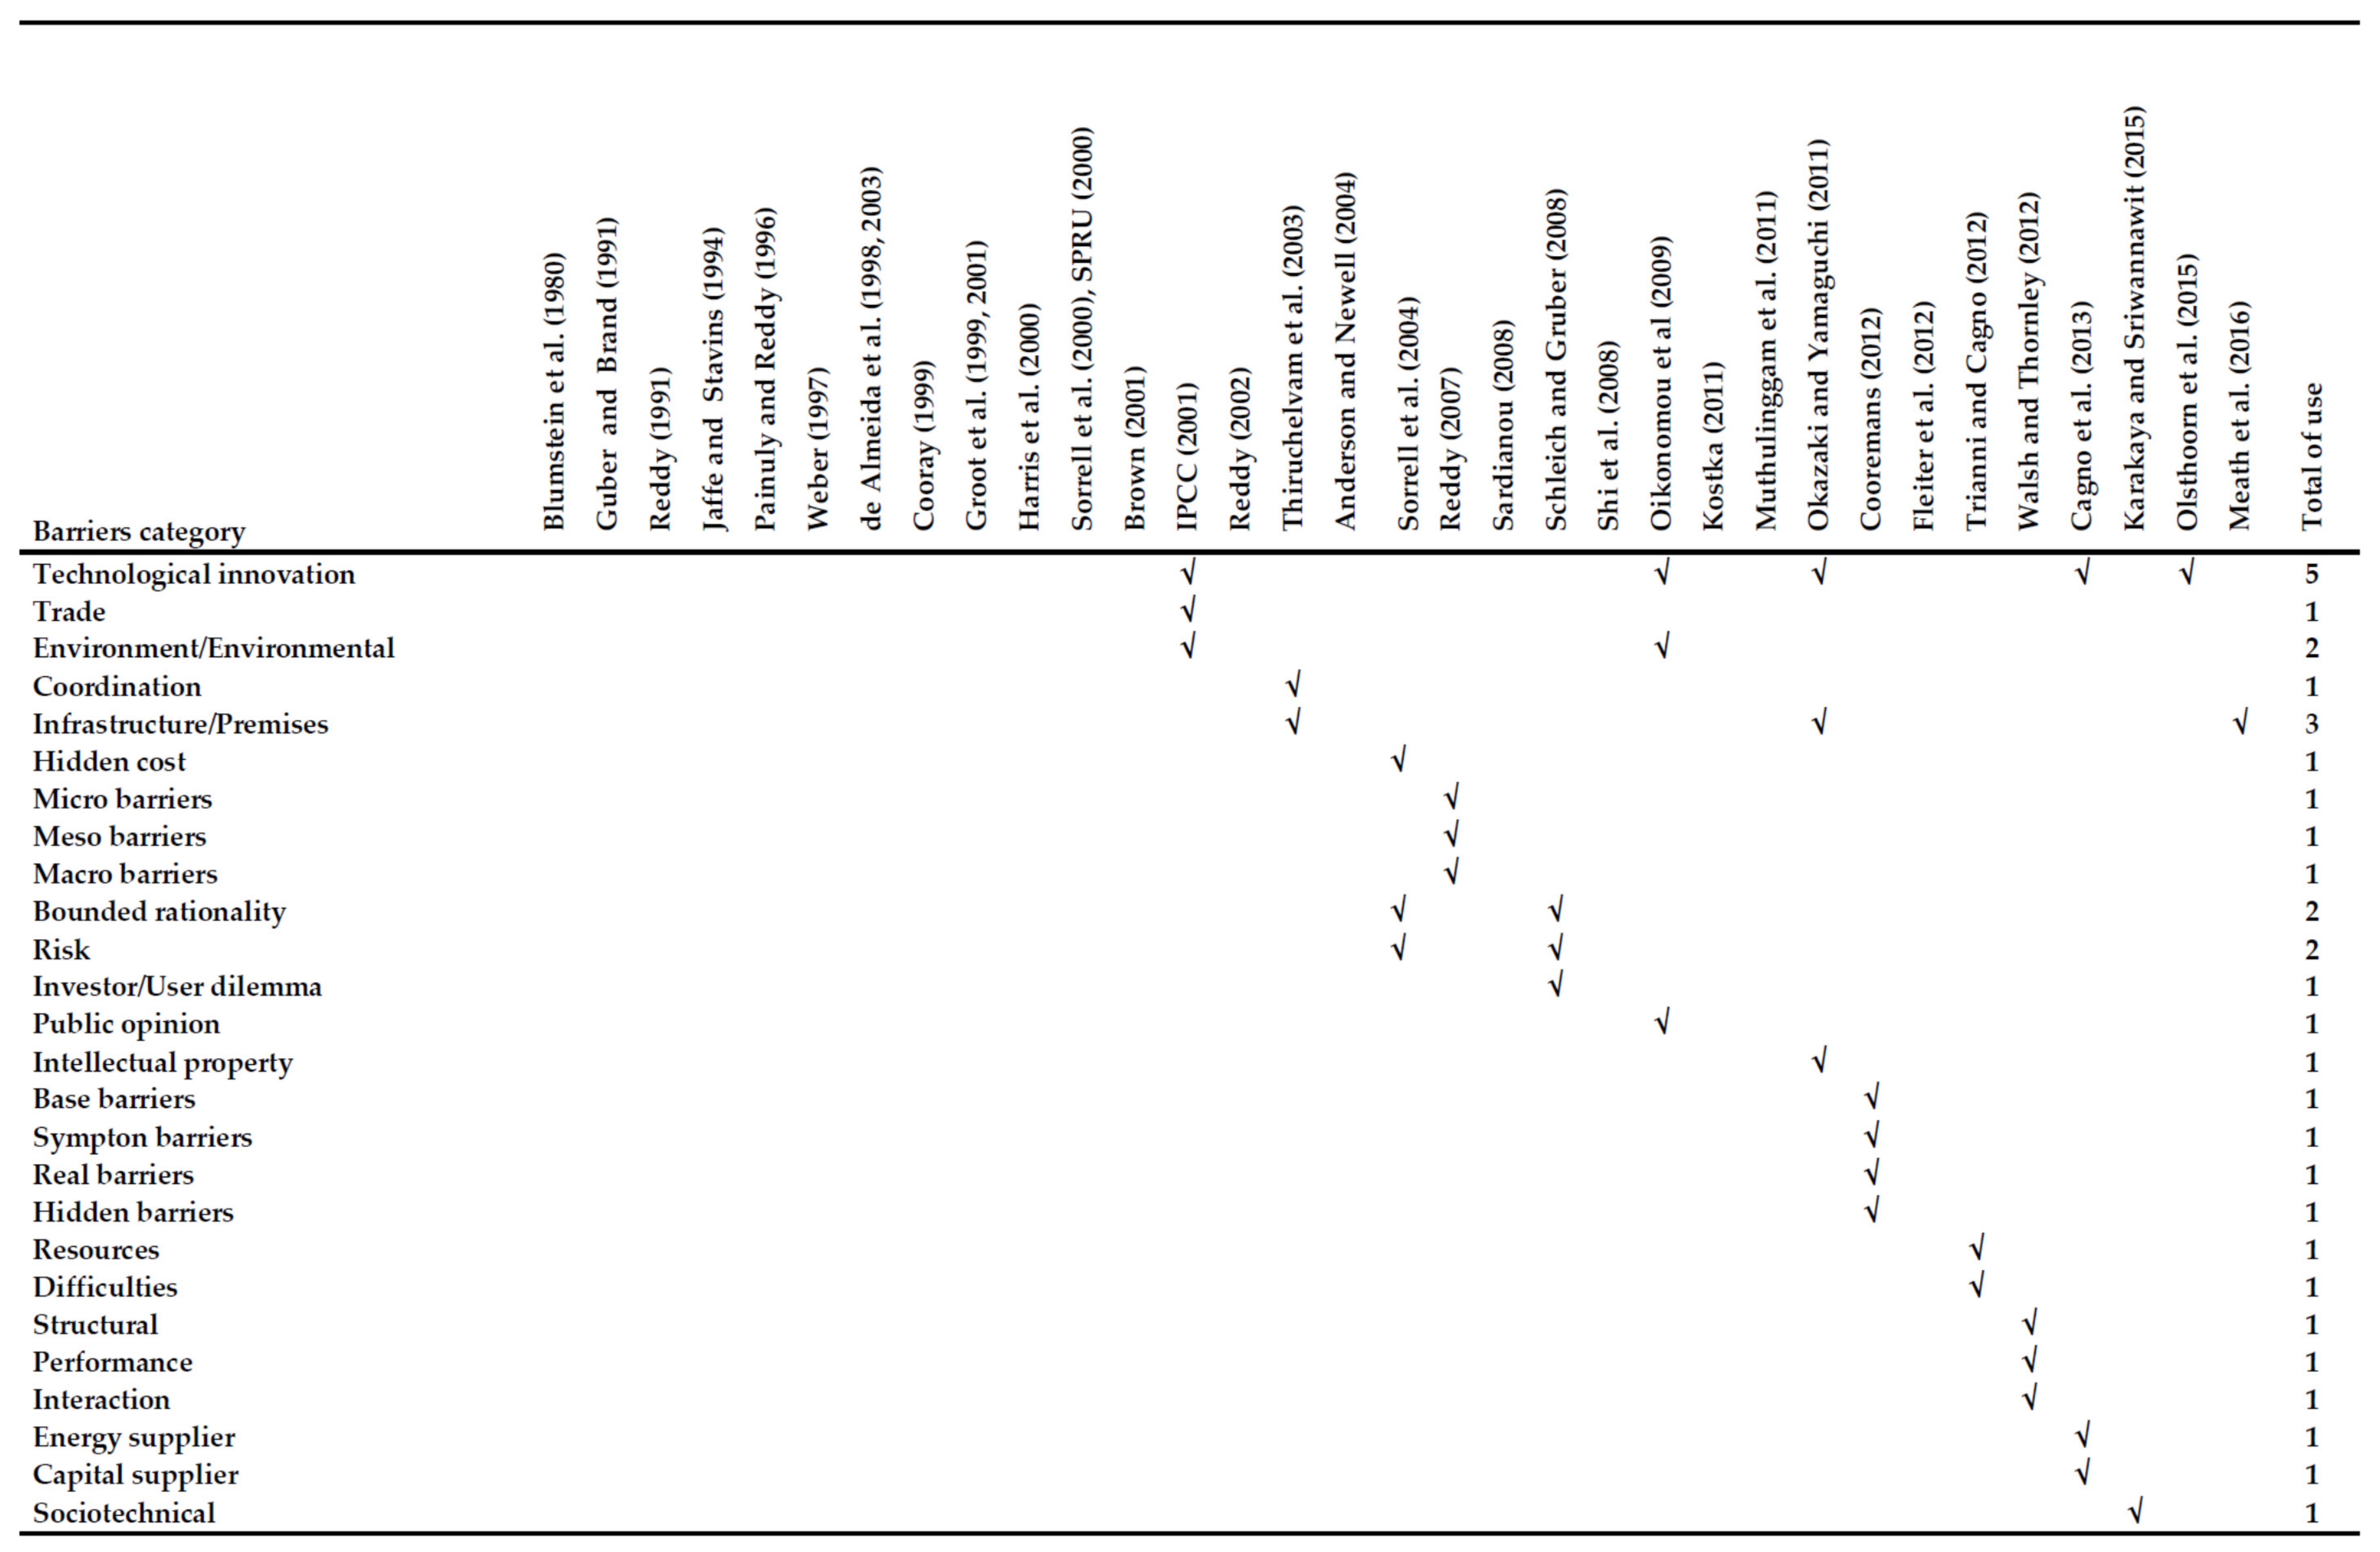
| Rank | Barrier Category | Total of Use |
|---|---|---|
| 1 | Financing/Financial/Finance/Capital | 16 |
| 2 | Institutional/Organizational | 13 |
| 3 | Information/Informational | 12 |
| 4 | Economic | 11 |
| 5 | Market structure | 8 |
| Technical | 8 | |
| 6 | Expertise/Skill/Competence/Personnel/Human factor/Staff | 7 |
| 7 | Regulation/Policy/Regulatory | 6 |
| Behavioral/Social/Cultural | 6 | |
| 8 | Market failure | 5 |
| Awareness | 5 | |
| Technological innovation | 5 | |
| 9 | Management/Managerial | 4 |
| Cost/Pricing/Prices/Profitability/Relative advantage | 4 | |
| 10 | Infrastructure/Premises | 3 |
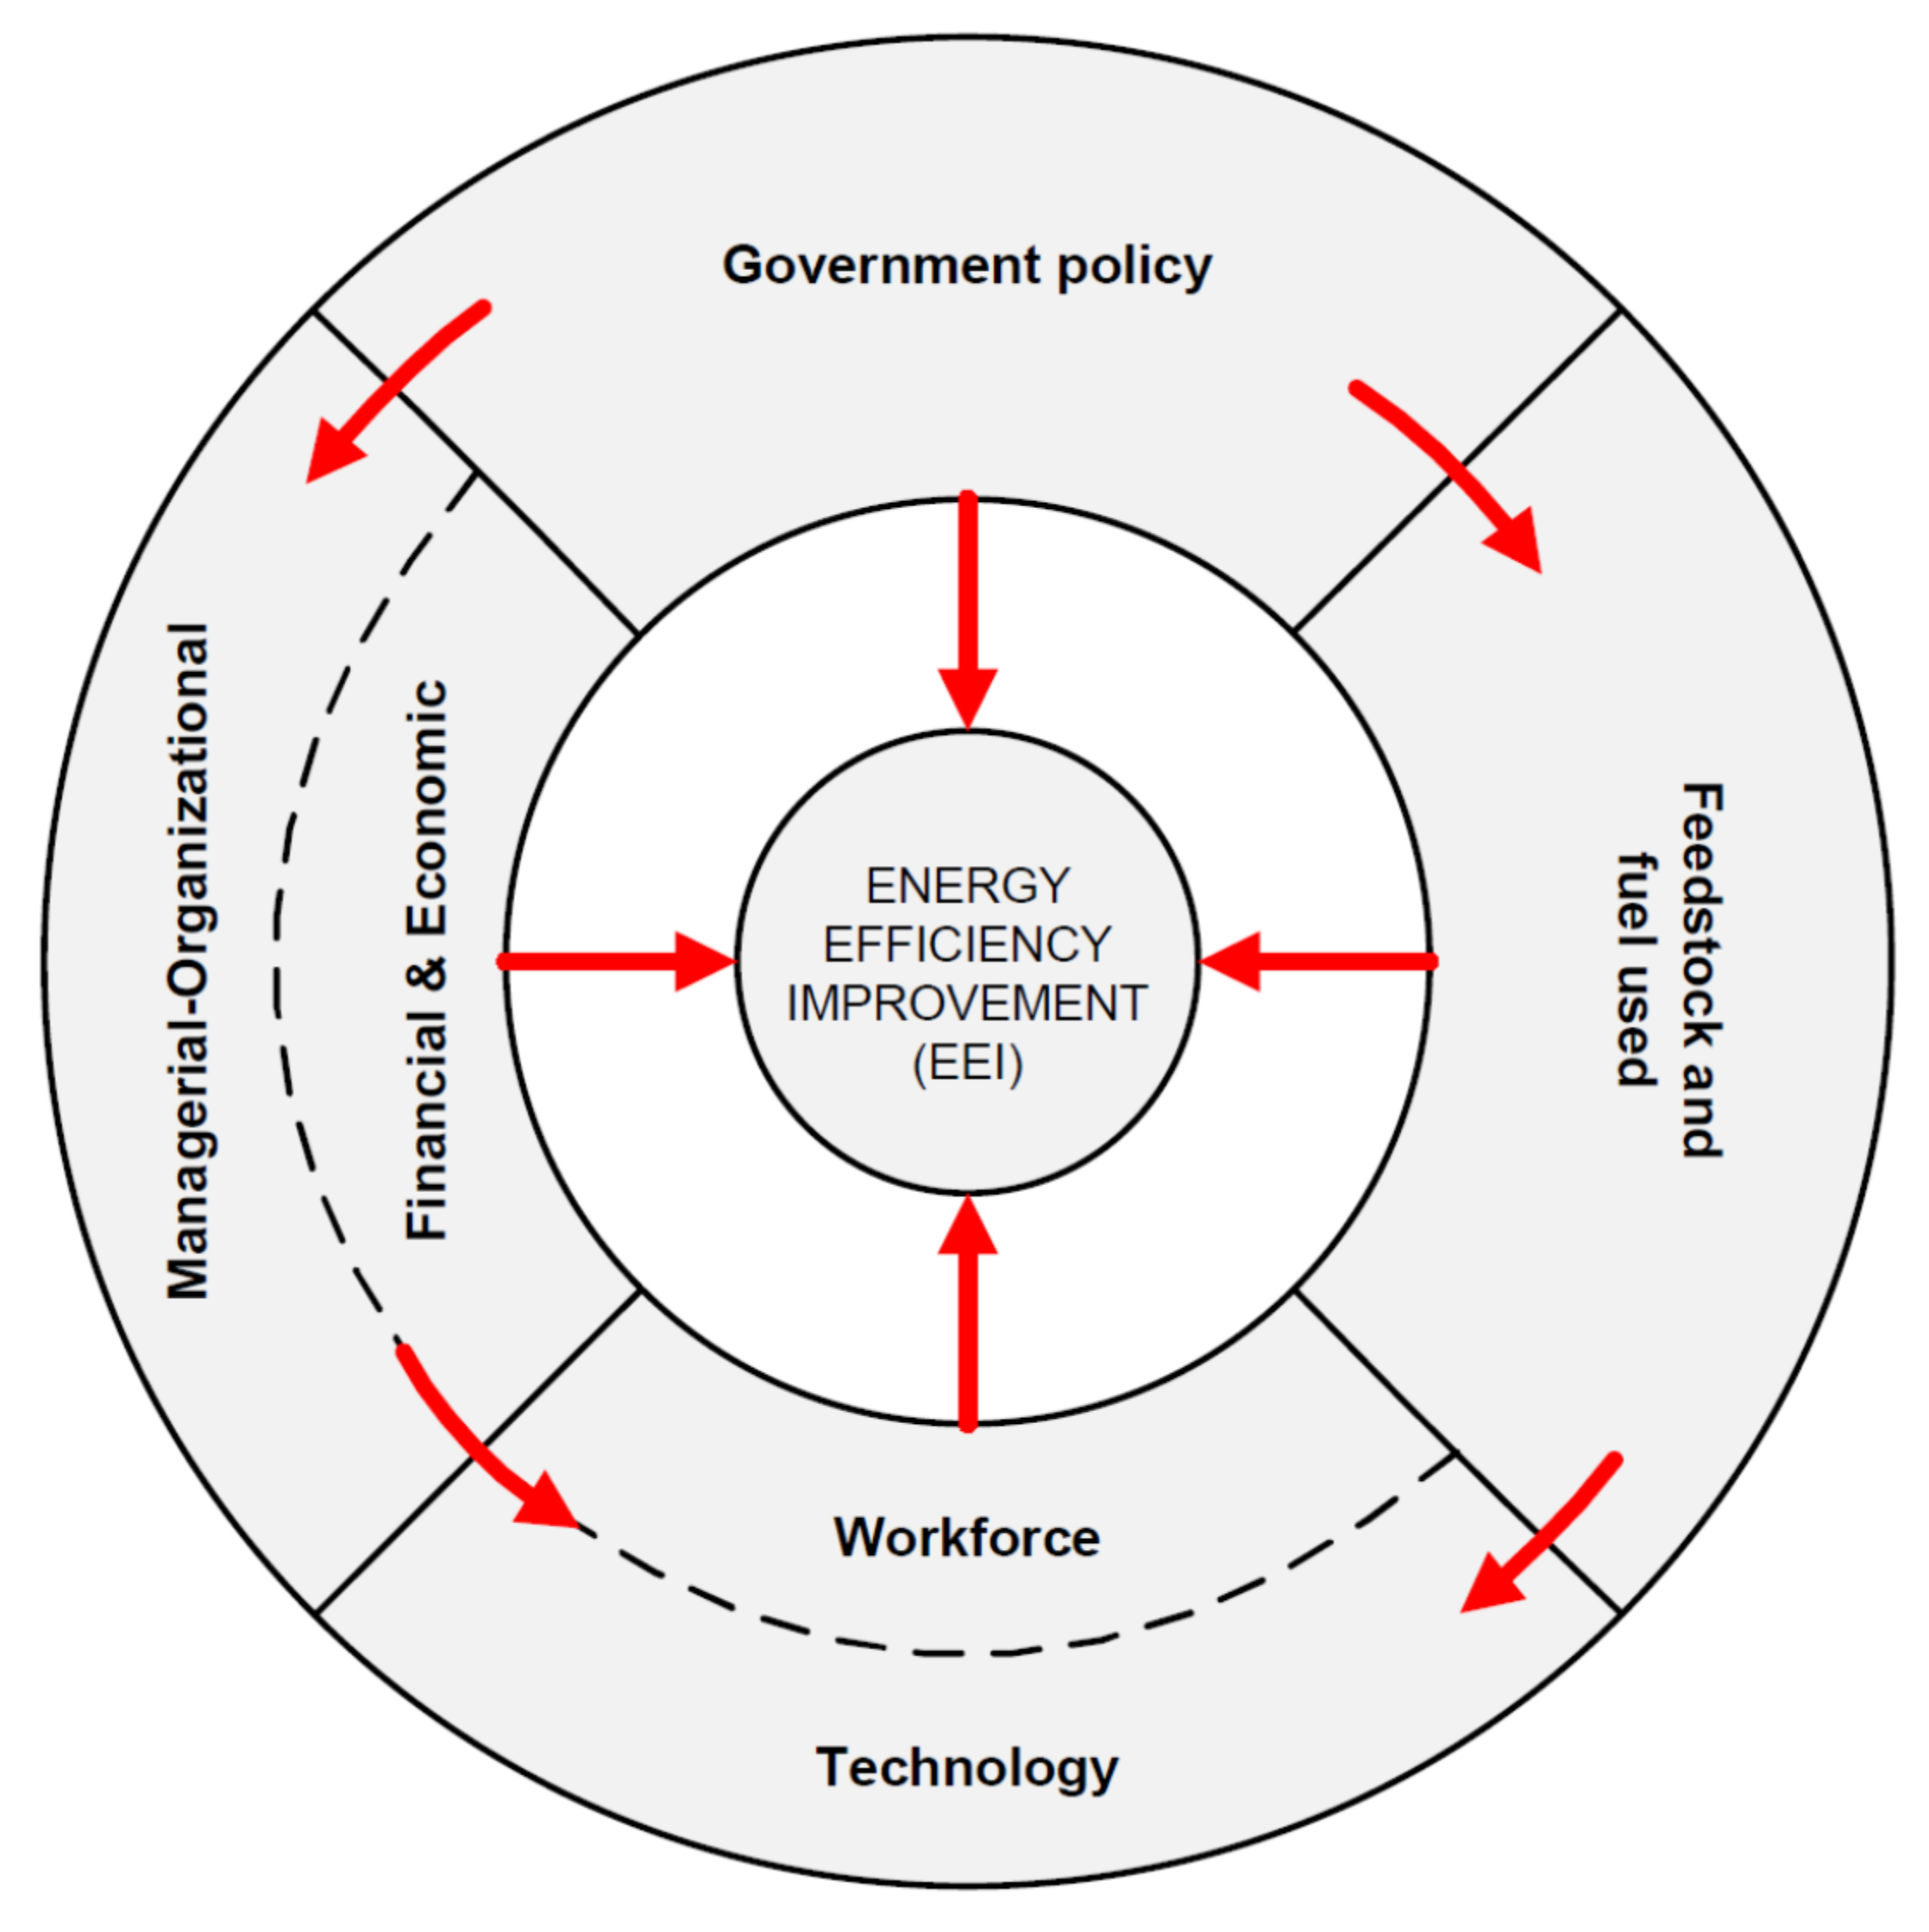
| Category of Barriers | Indicator of Barriers | References |
|---|---|---|
| Government policy |
| [19,35,44,50,53] |
| Financial and economic |
| [12,19,25,41,42,43,46,47,49,50,51,53,58,59] |
| Managerial and Organizational |
| [19,25,35,40,43,47,49,51,58,59] |
| Technological |
| [19,25,35,43,44,50,55] |
| Workforce |
| [35,41,44,49,55,59] |
| Quality and type of feedstock and fuel used 1 |
| [49,55,57,63,64,65] |
| Construct Variable | Composite Reliability | Cronbach Alpha | AVE | Indicator/Observed Variable | Factor Loadings 2 |
|---|---|---|---|---|---|
| Government policy (X1) | 0.861 | 0.751 | 0.678 | Incentive regulation (X11) | 0.944 |
| Incentive amount (X12) | 0.650 | ||||
| Distortion in policy (X13) | 0.848 | ||||
| Financial–economic (X2) | 0.821 | 0.673 | 0.606 | Slow rate of return (X21) | 0.842 |
| High initial capital cost (X22) | 0.731 | ||||
| Hidden costs (X23) | 0.758 | ||||
| Managerial–organizational (Y1) | 0.793 | 0.608 | 0.565 | Low status (Y11) | 0.781 |
| Resistance (Y12) | 0.833 | ||||
| Complex decision chain (Y13) | 0.626 | ||||
| Technological (Y2) | 0.896 | 0.825 | 0.743 | Technologies (Y21) | 0.864 |
| Technical capability (Y22) | 0.926 | ||||
| Long period (Y23) | 0.792 | ||||
| Workforce (Y3) | 0.773 | 0.607 | 0.469 | Skilled technical personnel (Y31) | 0.729 |
| Staff awareness (Y32) | 0.471 | ||||
| Personnel focus (Y33) | 0.821 | ||||
| Employee training (Y34) | 0.670 | ||||
| Used feedstock and fuel (Y4) | 0.892 | 0.833 | 0.679 | Quality of feedstock (Y41) | 0.890 |
| Quantity of scrap (Y42) | 0.911 | ||||
| Type of energy used (Y43) | 0.868 | ||||
| Energy prices (Y44) | 0.583 | ||||
| EEI (Y5) | 0.738 | 0.470 | 0.492 | High priority to EEM 1 (Y51) | 0.524 |
| Management capability in EEM 1 (Y52) | 0.750 | ||||
| Supervision of EEM 1 (Y53) | 0.798 |
| Constructs | X1 | X2 | Y1 | Y2 | Y3 | Y4 | Y5 |
|---|---|---|---|---|---|---|---|
| X1 | 0.823 1 | ||||||
| X2 | 0.123 | 0.779 1 | |||||
| Y1 | 0.327 4 | 0.333 | 0.752 1 | ||||
| Y2 | 0.507 2 | 0.291 4 | 0.274 5 | 0.862 1 | |||
| Y3 | 0.517 2 | 0.211 | 0.413 3 | 0.664 2 | 0.685 1 | ||
| Y4 | 0.474 3 | 0.139 | 0.347 4 | 0.567 2 | 0.498 2 | 0.824 1 | |
| Y5 | 0.194 | 0.469 3 | 0.671 2 | 0.212 | 0.400 3 | 0.262 5 | 0.701 1 |
| Constructs | X1 | X2 | Y1 | Y2 | Y3 | Y4 | Y5 |
|---|---|---|---|---|---|---|---|
| X11 | 0.944 1 | −0.029 | −0.010 | −0.063 | −0.077 | 0.031 | 0.058 |
| X12 | 0.650 1 | 0.631 | −0.107 | 0.425 | −0.100 | −0.141 | −0.372 |
| X13 | 0.848 1 | −0.452 | 0.094 | −0.256 | 0.162 | 0.073 | 0.221 |
| X21 | 0.072 | 0.842 1 | 0.376 | 0.266 | −0.283 | −0.199 | −0.248 |
| X22 | −0.260 | 0.731 1 | 0.160 | −0.738 | 0.498 | 0.250 | −0.440 |
| X23 | 0.170 | 0.758 1 | −0.572 | 0.416 | −0.166 | −0.020 | 0.699 |
| Y11 | −0.044 | −0.378 | 0.781 1 | −0.170 | 0.202 | 0.289 | 0.027 |
| Y12 | 0.085 | 0.011 | 0.833 1 | 0.227 | −0.430 | −0.178 | −0.129 |
| Y13 | −0.058 | 0.457 | 0.626 1 | −0.090 | 0.321 | −0.125 | 0.138 |
| Y21 | 0.076 | −0.013 | 0.164 | 0.864 1 | −0.310 | 0.024 | 0.097 |
| Y22 | −0.057 | 0.065 | 0.044 | 0.926 1 | 0.045 | 0.103 | 0.023 |
| Y23 | −0.016 | −0.062 | 0.128 | 0.792 1 | 0.286 | −0.147 | −0.133 |
| Y31 | 0.002 | 0.078 | 0.215 | −0.155 | 0.729 1 | 0.092 | −0.009 |
| Y32 | −0.223 | −0.649 | 0.441 | −0.017 | 0.471 1 | 0.173 | 0.228 |
| Y33 | 0.118 | 0.098 | −0.168 | 0.154 | 0.821 1 | −0.227 | −0.085 |
| Y34 | 0.010 | 0.251 | −0.338 | −0.008 | 0.670 1 | 0.057 | −0.046 |
| Y41 | −0.211 | 0.017 | 0.064 | −0.190 | 0.298 | 0.890 1 | −0.153 |
| Y42 | −0.051 | −0.011 | 0.059 | 0.279 | −0.008 | 0.911 1 | −0.175 |
| Y43 | 0.358 | 0.065 | −0.151 | 0.076 | −0.219 | 0.868 1 | 0.217 |
| Y44 | −0.132 | −0.104 | 0.034 | −0.259 | −0.115 | 0.583 1 | 0.184 |
| Y51 | −0.221 | 0.418 | 0.060 | −0.119 | 0.283 | 0.019 | 0.524 1 |
| Y52 | 0.288 | −0.080 | −0.244 | 0.376 | −0.579 | −0.152 | 0.750 1 |
| Y53 | −0.126 | −0.200 | 0.189 | −0.275 | 0.358 | 0.131 | 0.798 1 |
| Constructs | R-Squared of Endogenous Variable | Relation Category [88] |
|---|---|---|
| Policy (X1) | Exogenous variable | - |
| Financial–economic (X2) | Exogenous variable | - |
| Managerial–organizational (Y1) | 0.161 | Weak |
| Technological (Y2) | 0.434 | Moderate |
| Workforce (Y3) | 0.270 | Weak |
| Used feedstock-fuel (Y4) | 0.439 | Moderate |
| Energy efficiency improvement (Y5) | 0.436 | Moderate |
| Hypotheses | Path or Structural Coefficient | Remarks | |
|---|---|---|---|
| H1 | : Policy → managerial-organizational | 0.401 2 | Supported |
| H2 | : Policy → used feedstock-fuel | 0.663 1 | Supported |
| H3 | : Financial–economic → technological | 0.273 3 | Supported |
| H4 | : Financial–economic → workforce | 0.216 4 | Supported |
| H5 | : Managerial–organizational → workforce | 0.377 2 | Supported |
| H6 | : Used feedstock-fuel → technology | 0.546 1 | Supported |
| H7a | : Policy → EEI | −0.222 4 | Supported |
| H7b | : Financial–economic → EEI | 0.292 3 | Supported |
| H7c | : Managerial–organizational → EEI | 0.421 3 | Supported |
| H7d | : Technological → EEI | 0.085 | Not supported |
| H7e | : Workforce → EEI | 0.153 | Not supported |
| H7f | : Used feedstock-fuel → EEI | 0.073 | Not supported |
| Causal Relationship | Direct Effect | Indirect Effect | Total Effect 2 | ||||||
|---|---|---|---|---|---|---|---|---|---|
| Policy | → | EEI | −0.222 | 0.271 1,5 | 0.049 | ||||
| Policy | → | Managerial | → | EEI | - | 0.169 | |||
| Policy | → | Feedstock-fuel | → | EEI | - | 0.048 | |||
| Policy | → | Managerial | → | Workforce | → | EEI | - | 0.023 | |
| Policy | → | Feedstock-fuel | → | Technological | → | EEI | - | 0.031 | |
| Financial–economic | → | EEI | 0.292 | 0.060 1 | 0.352 4 | ||||
| Financial–economic | → | Technological | → | EEI | - | 0.018 | |||
| Financial–economic | → | Workforce | → | EEI | - | 0.042 | |||
| Management-organizational | → | EEI | 0.421 | - | 0.479 3 | ||||
| Management-organizational | → | Workforce | → | EEI | - | 0.058 | |||
| Technological | → | EEI | 0.085 | - | 0.085 | ||||
| Workforce | → | EEI | 0.153 | - | 0.153 | ||||
| Used feedstock-fuel | → | EEI | 0.073 | - | 0.119 | ||||
| Used feedstock-fuel | → | Technological | → | EEI | - | 0.046 | |||
© 2018 by the authors. Licensee MDPI, Basel, Switzerland. This article is an open access article distributed under the terms and conditions of the Creative Commons Attribution (CC BY) license (http://creativecommons.org/licenses/by/4.0/).
Share and Cite
Soepardi, A.; Pratikto, P.; Santoso, P.B.; Tama, I.P.; Thollander, P. Linking of Barriers to Energy Efficiency Improvement in Indonesia’s Steel Industry. Energies 2018, 11, 234. https://doi.org/10.3390/en11010234
Soepardi A, Pratikto P, Santoso PB, Tama IP, Thollander P. Linking of Barriers to Energy Efficiency Improvement in Indonesia’s Steel Industry. Energies. 2018; 11(1):234. https://doi.org/10.3390/en11010234
Chicago/Turabian StyleSoepardi, Apriani, Pratikto Pratikto, Purnomo Budi Santoso, Ishardita Pambudi Tama, and Patrik Thollander. 2018. "Linking of Barriers to Energy Efficiency Improvement in Indonesia’s Steel Industry" Energies 11, no. 1: 234. https://doi.org/10.3390/en11010234
APA StyleSoepardi, A., Pratikto, P., Santoso, P. B., Tama, I. P., & Thollander, P. (2018). Linking of Barriers to Energy Efficiency Improvement in Indonesia’s Steel Industry. Energies, 11(1), 234. https://doi.org/10.3390/en11010234